
www.riu.uni-koeln.de
Rhe
nish
Inst
itute
for E
nviro
nmen
tal R
esea
rch
at the University of C
ologne
Daily Forecast of Air Quality over Europe and Daily Forecast of Air Quality over Europe and selected nested regionsselected nested regions
Hermann JakobsHermann Jakobs
Rhenish Institute for Environmental Research (RIU)Rhenish Institute for Environmental Research (RIU)Aachenerstr. 201 Aachenerstr. 201 –– 209, 50931 K209, 50931 Kööln, Germanyln, GermanyTel +49 221 400 2220, Fax +49 221 400 2320Tel +49 221 400 2220, Fax +49 221 400 [email protected]@eurad.uni--koeln.dekoeln.dewww.eurad.uniwww.eurad.uni--koeln.dekoeln.de

www.riu.uni-koeln.de
Rhe
nish
Inst
itute
for E
nviro
nmen
tal R
esea
rch
at the University of C
ologne
OverviewOverview•• IntroductionIntroduction
•• The EURAD ModelThe EURAD Model
•• Emission InventoriesEmission Inventories
•• Operational Chemical Weather ForecastOperational Chemical Weather Forecast
•• ValidationValidation
•• Data AssimilationData Assimilation

www.riu.uni-koeln.de
Rhe
nish
Inst
itute
for E
nviro
nmen
tal R
esea
rch
at the University of C
ologne
Introduction (historical remarks)
•• 1987: European Air Pollution Dispersion Model (EURAD, 1987: European Air Pollution Dispersion Model (EURAD, University of Cologne)University of Cologne)
•• 2000: First test to establish air pollution forecast system 2000: First test to establish air pollution forecast system
•• 2001: 1. November 2001: 1. November -- Begin of operational Air Quality Begin of operational Air Quality forecast at RIUforecast at RIU
•• 2004: Extension of the forecast system with new domains 2004: Extension of the forecast system with new domains (Northern Hemisphere)(Northern Hemisphere)
•• 2007: Daily Forecast including data assimilation2007: Daily Forecast including data assimilation((EURopean Air pollution Dispersion Inverse Model System)
www.riu.uni-koeln.de
Rhe
nish
Inst
itute
for E
nviro
nmen
tal R
esea
rch
at the University of C
ologne
The EURAD ModelThe EURAD Model

www.riu.uni-koeln.de
Rhe
nish
Inst
itute
for E
nviro
nmen
tal R
esea
rch
at the University of C
ologne
The EURAD Model SystemThe EURAD Model System
�winds, temperature, pressure, cloud processes, boundary layer height, ...
�anthropogenic/biogenic emissions, structured in groups and/or single constituents
�advection, diffusion, dry/wet deposition�chemical transformation: �full mechanisms for gas phase(RADM, RACM, RACM-MIM, ...)�modal Aerosol chemistry (NH4+, NO3-, SO42-, H20, BSOA, ASOA, EC, OC, primary emitted organic material)�aqueous phase�nesting option

www.riu.uni-koeln.de
Rhe
nish
Inst
itute
for E
nviro
nmen
tal R
esea
rch
at the University of C
ologne
The DomainsThe Domains
www.riu.uni-koeln.de
Rhe
nish
Inst
itute
for E
nviro
nmen
tal R
esea
rch
at the University of C
ologne
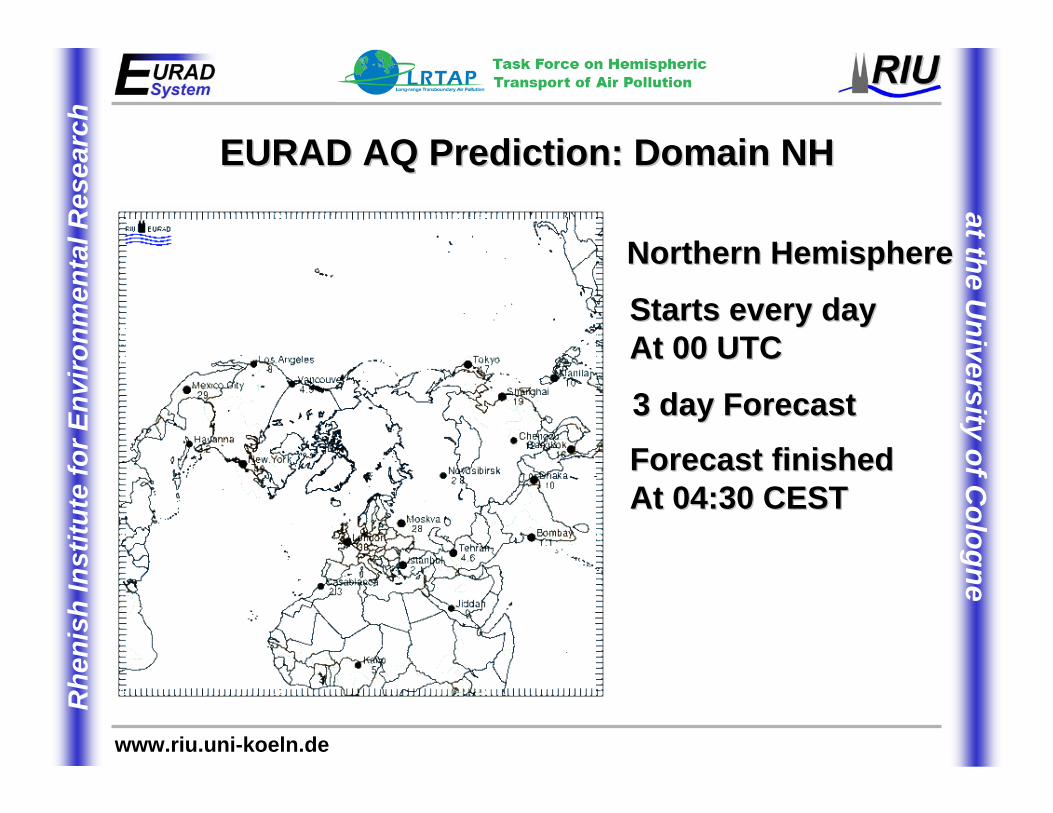
EURAD AQ Prediction: Domain NHEURAD AQ Prediction: Domain NH
Starts every dayStarts every dayAt 00 UTCAt 00 UTC
Northern HemisphereNorthern Hemisphere
Forecast finishedForecast finishedAt 04:30 CESTAt 04:30 CEST
3 day Forecast3 day Forecast

www.riu.uni-koeln.de
Rhe
nish
Inst
itute
for E
nviro
nmen
tal R
esea
rch
at the University of C
ologne
EURAD AQ Prediction: DomainsEURAD AQ Prediction: Domains
Starts every dayStarts every dayAt 00 UTCAt 00 UTC
3 Domains3 Domains
Forecast finishedForecast finishedAt 08:30 CESTAt 08:30 CEST
3 day Forecast3 day Forecast
Additional Additional domainsdomains
Small scale Small scale applications ~ 1 kmapplications ~ 1 km

www.riu.uni-koeln.de
Rhe
nish
Inst
itute
for E
nviro
nmen
tal R
esea
rch
at the University of C
ologne
EmissionsEmissions

www.riu.uni-koeln.de
Rhe
nish
Inst
itute
for E
nviro
nmen
tal R
esea
rch
at the University of C
ologne
•• Basic Emission Data Sources:Basic Emission Data Sources:
•• Global: EDGAR V32Global: EDGAR V32•• Europe: EMEP, TNOEurope: EMEP, TNO•• Local: NorthrhineLocal: Northrhine--Westfalia, LUAWestfalia, LUA--NRWNRW
•• Annual averages with projections till 2020Annual averages with projections till 2020•• (NOx, SO(NOx, SO22, NH, NH33, CO, VOC, PM, CO, VOC, PM1010, PM, PM2.52.5))
•• Spatial transformation to specific domain (grid)Spatial transformation to specific domain (grid)
•• Temporal allocation (daily, weekly, seasonal)Temporal allocation (daily, weekly, seasonal)
•• Chemical split for VOCs (anthropogenic, biogenic)Chemical split for VOCs (anthropogenic, biogenic)
EURAD Model: EmissionsEURAD Model: Emissions

www.riu.uni-koeln.de
Rhe
nish
Inst
itute
for E
nviro
nmen
tal R
esea
rch
at the University of C
ologne
EURAD Model: Emissions (global)EURAD Model: Emissions (global)
NONOxx, annual emissions, annual emissions

www.riu.uni-koeln.de
Rhe
nish
Inst
itute
for E
nviro
nmen
tal R
esea
rch
at the University of C
ologne
EURAD Model: Emissions (global)EURAD Model: Emissions (global)
NHNH33NONOxx
GlobalGlobal
ToTo
North.North.HemiHemi--spheresphere

www.riu.uni-koeln.de
Rhe
nish
Inst
itute
for E
nviro
nmen
tal R
esea
rch
at the University of C
ologne
EURAD Model: Emissions (Europe)EURAD Model: Emissions (Europe)
Spatial transformation
from EMEP EURAD
European scale:
EMEP-TNO
www.emep.int

www.riu.uni-koeln.de
Rhe
nish
Inst
itute
for E
nviro
nmen
tal R
esea
rch
at the University of C
ologne
EURAD Model: Emissions (local)EURAD Model: Emissions (local)
NONOxx VOCVOC

www.riu.uni-koeln.de
Rhe
nish
Inst
itute
for E
nviro
nmen
tal R
esea
rch
at the University of C
ologne
AQ Forecast AQ Forecast ––ProcedureProcedure

www.riu.uni-koeln.de
Rhe
nish
Inst
itute
for E
nviro
nmen
tal R
esea
rch
at the University of C
ologne
OzoneOzoneNO2NO2PM10PM10PM2.5PM2.5SO2SO2COCOBenzeneBenzeneFormaldehydeFormaldehydeetcetc……Air Quality IndexAir Quality Index
EURAD AQ Prediction: ProductsEURAD AQ Prediction: Products
•• daily Maximadaily Maxima
•• maximum 8 hour meanmaximum 8 hour mean
•• maximum 24 hour meanmaximum 24 hour mean
•• AnimationsAnimations
•• Time Series for certain regionsTime Series for certain regions
•• Meteorological fieldsMeteorological fields
Color Color labellabel (according to EU directives):(according to EU directives):

www.riu.uni-koeln.de
Rhe
nish
Inst
itute
for E
nviro
nmen
tal R
esea
rch
at the University of C
ologne
AQ Prediction: Limits (EU)AQ Prediction: Limits (EU)
> 100> 150> 200Very poor
50 - 10075 - 150100 - 200poor
35 - 5050 - 7570 - 100sufficient
20 - 3530 - 5040 - 70satisfactory
10 - 2015 - 3020 - 40good
0 - 100 - 150 - 20Very good
24h Mean8h Mean1h Mean
PM10 (µg/m3)

www.riu.uni-koeln.de
Rhe
nish
Inst
itute
for E
nviro
nmen
tal R
esea
rch
at the University of C
ologne
AirAir QualityQuality IndexIndex

www.riu.uni-koeln.de
Rhe
nish
Inst
itute
for E
nviro
nmen
tal R
esea
rch
at the University of C
ologne
AQ Prediction at www.eurad.uniAQ Prediction at www.eurad.uni--koeln.dekoeln.de

www.riu.uni-koeln.de
Rhe
nish
Inst
itute
for E
nviro
nmen
tal R
esea
rch
at the University of C
ologne
Recent Air Quality ForecastRecent Air Quality ForecastRegular DomainsRegular Domains

www.riu.uni-koeln.de
Rhe
nish
Inst
itute
for E
nviro
nmen
tal R
esea
rch
at the University of C
ologne
EURAD AQ Prediction: regular domains EURAD AQ Prediction: regular domains
AnimationAnimationNear surface Near surface concentrationsconcentrationsPMPM10 10 24h mean 24h mean
Valid:Valid:17 October 200717 October 2007
Forecast fromForecast from17 October 200717 October 2007
EuropeEurope

www.riu.uni-koeln.de
Rhe
nish
Inst
itute
for E
nviro
nmen
tal R
esea
rch
at the University of C
ologne
EURAD AQ Prediction: regular domains EURAD AQ Prediction: regular domains
Near surface Near surface concentrationsconcentrationsPMPM10 10 Max 24h mean Max 24h mean
Valid:Valid:18 October 200718 October 2007
Forecast fromForecast from17 October 200717 October 2007
Central EuropeCentral Europe

www.riu.uni-koeln.de
Rhe
nish
Inst
itute
for E
nviro
nmen
tal R
esea
rch
at the University of C
ologne
EURAD AQ Prediction: regular domains EURAD AQ Prediction: regular domains
Near surface Near surface concentrationsconcentrationsPMPM10 10 Max 24h mean Max 24h mean
Valid:Valid:18 October 200718 October 2007
Forecast fromForecast from17 October 200717 October 2007
NorthrhineNorthrhine--WestfaliaWestfalia

www.riu.uni-koeln.de
Rhe
nish
Inst
itute
for E
nviro
nmen
tal R
esea
rch
at the University of C
ologne
EURAD AQ Prediction: ProductsEURAD AQ Prediction: ProductsTime series for CologneTime series for Cologne 17 17 –– 19 October 200719 October 2007

www.riu.uni-koeln.de
Rhe
nish
Inst
itute
for E
nviro
nmen
tal R
esea
rch
at the University of C
ologne
Recent Air Quality ForecastRecent Air Quality ForecastNorthern HemisphereNorthern Hemisphere
www.riu.uni-koeln.de
Rhe
nish
Inst
itute
for E
nviro
nmen
tal R
esea
rch
at the University of C
ologne
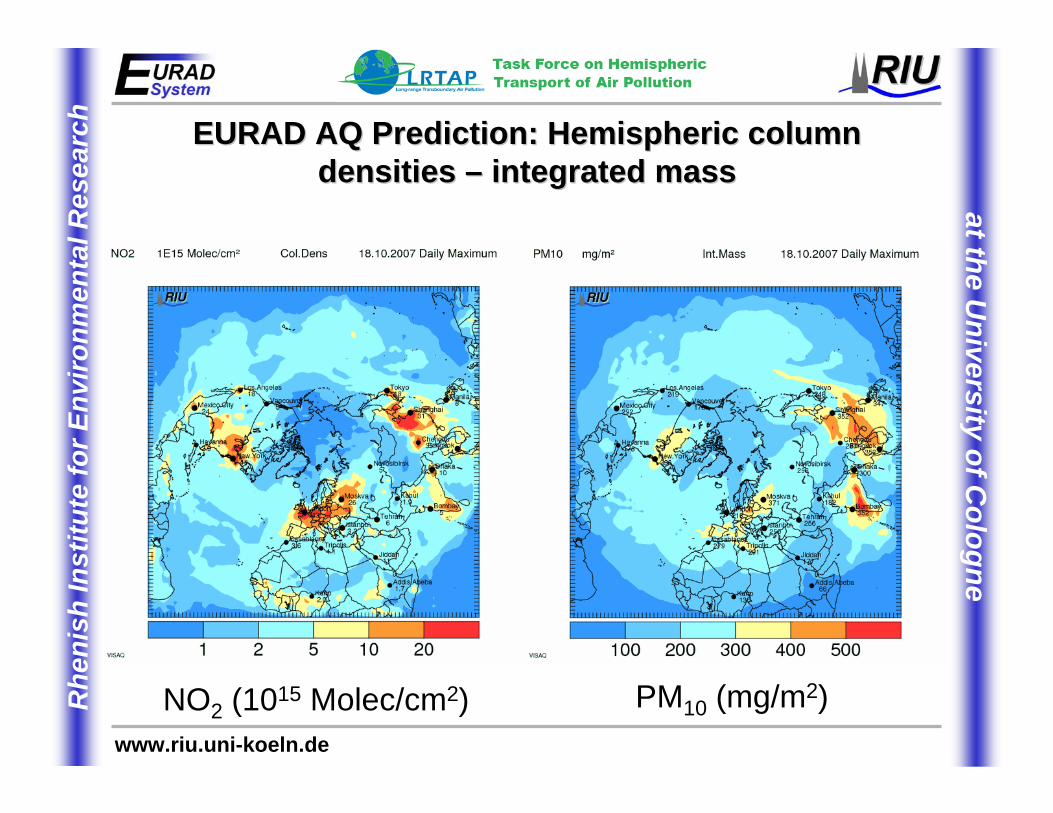
EURAD AQ Prediction: Hemispheric column EURAD AQ Prediction: Hemispheric column densities densities –– integrated massintegrated mass
NO2 (1015 Molec/cm2) PM10 (mg/m2)

www.riu.uni-koeln.de
Rhe
nish
Inst
itute
for E
nviro
nmen
tal R
esea
rch
at the University of C
ologne
EURAD AQ Prediction: Hemispheric transportEURAD AQ Prediction: Hemispheric transport
PMPM1010 (mg/m(mg/m22))23 23 –– 25 25 MarchMarch20072007

www.riu.uni-koeln.de
Rhe
nish
Inst
itute
for E
nviro
nmen
tal R
esea
rch
at the University of C
ologne
Air Quality ForecastAir Quality Forecast--Monitoring Monitoring –– ValidationValidation

www.riu.uni-koeln.de
Rhe
nish
Inst
itute
for E
nviro
nmen
tal R
esea
rch
at the University of C
ologne
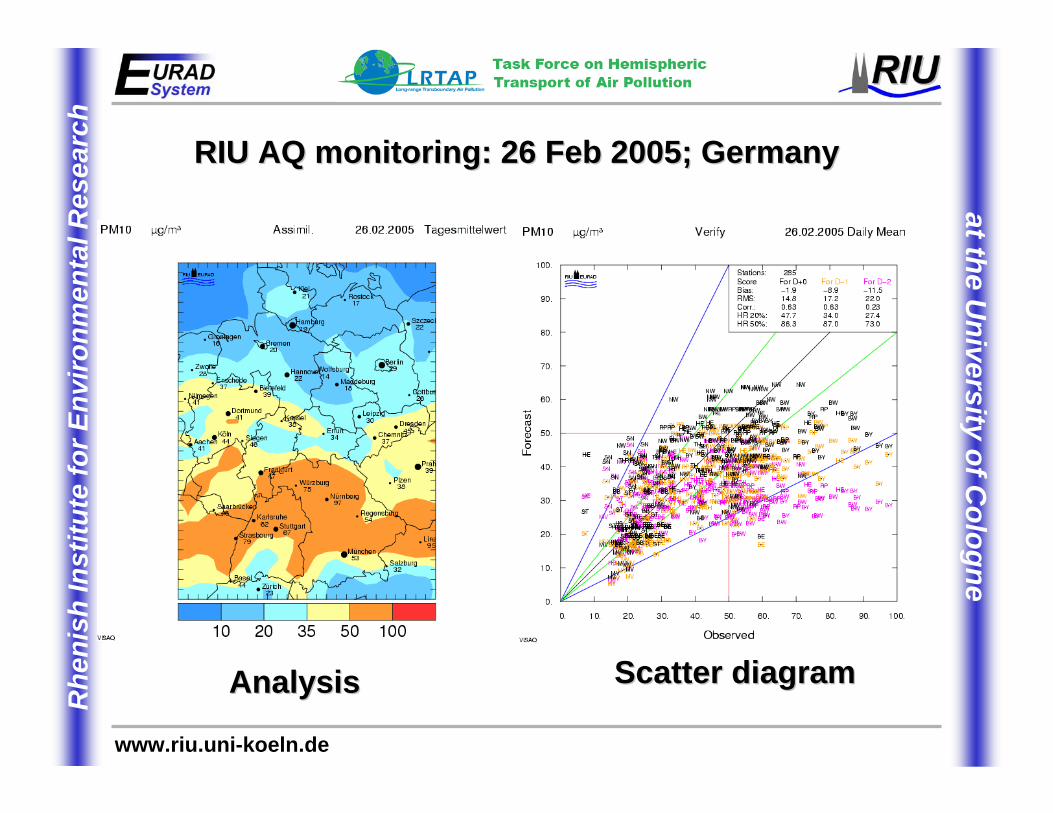
RIU AQ monitoring: 26 Feb 2005; GermanyRIU AQ monitoring: 26 Feb 2005; Germany
ForecastForecast Station ObservationStation Observation
++
www.riu.uni-koeln.de
Rhe
nish
Inst
itute
for E
nviro
nmen
tal R
esea
rch
at the University of C
ologne
RIU AQ monitoring: 26 Feb 2005; GermanyRIU AQ monitoring: 26 Feb 2005; Germany
AnalysisAnalysis Scatter diagramScatter diagram

www.riu.uni-koeln.de
Rhe
nish
Inst
itute
for E
nviro
nmen
tal R
esea
rch
at the University of C
ologne
RIU AQ monitoring: 26 Feb 2005; GermanyRIU AQ monitoring: 26 Feb 2005; Germany
ForecastForecast 2d2d--var assimilationvar assimilation

www.riu.uni-koeln.de
Rhe
nish
Inst
itute
for E
nviro
nmen
tal R
esea
rch
at the University of C
ologne
Air Quality ForecastAir Quality Forecast--Data assimilationData assimilation

www.riu.uni-koeln.de
Rhe
nish
Inst
itute
for E
nviro
nmen
tal R
esea
rch
at the University of C
ologne
Regional/Local Air Quality Service (RLAQS within ESA PROMOTE)
EURADIM
((EURopean Air pollution Dispersion Inverse Model System)

www.riu.uni-koeln.de
Rhe
nish
Inst
itute
for E
nviro
nmen
tal R
esea
rch
at the University of C
ologne
Initial and boundary values
• those that maximise the product (paucity of knowledge impact)
• tropospheric modelling:
Which model parameters should be Which model parameters should be optimised?optimised?
Emission Rates / Deposition Velocities
Grid Resolution
Reaction RatesModel Equations
EURADIM:
• initial values and/or• emission rates

www.riu.uni-koeln.de
Rhe
nish
Inst
itute
for E
nviro
nmen
tal R
esea
rch
at the University of C
ologne
Emission Rate OptimisationEmission Rate Optimisation• time independent scaling factors (for each box and species)• „temporal regularisation“: preserves daily cycle

www.riu.uni-koeln.de
Rhe
nish
Inst
itute
for E
nviro
nmen
tal R
esea
rch
at the University of C
ologne
Why joint optimisation?Why joint optimisation?
observations
background
assimilation window
initial value opt.
emission factor opt.
init.val. + emis.fact. (joint)

www.riu.uni-koeln.de
Rhe
nish
Inst
itute
for E
nviro
nmen
tal R
esea
rch
at the University of C
ologne
Operational 3dOperational 3d--var data assimilation and var data assimilation and forecast systemforecast system
• Regional/Local Air Quality Service (RLAQS within PROMOTE)
• RIU:operational forecast and data assimilation productnested simulations (72h each day) with high spatial resolution for various European sub-domains3d-var data assimilation of near-real-time observations- in-situ data from Germany, Austria, Switzerland, France- tropospheric NO2 columns from OMI (Courtesy of KNMI)

www.riu.uni-koeln.de
Rhe
nish
Inst
itute
for E
nviro
nmen
tal R
esea
rch
at the University of C
ologne
AQ Prediction: Data Assimilation with satellite dataAQ Prediction: Data Assimilation with satellite dataExample: NOExample: NO22 column density BERLIOZ episode 20.7.1998column density BERLIOZ episode 20.7.1998
GO
ME
GO
ME
retie
val
retie
val
Cou
rtes
y: A
. Ric
hter
, IFE
Bre
men
Cou
rtes
y: A
. Ric
hter
, IFE
Bre
men
no a
ssim
ilatio
nw
ith a
ssim
ilatio
n
NOAA 1411:51 UTC

www.riu.uni-koeln.de
Rhe
nish
Inst
itute
for E
nviro
nmen
tal R
esea
rch
at the University of C
ologne
• Europe (N0)dx = 45 km107 x 97 grid cells
• Central Europe (N1)dx = 15 km67 x 76 grid cells
• Northrhine-Westfalia, Austria, Switzerland (N2)dx = 5 km52 x 52, 79 x 49, 121 x 67 grid cells, respectively
RIU RLAQS: domain configurationRIU RLAQS: domain configuration
N0
N2
N1N2
N2
N2
O3 daily mean (September 15, 2007)

www.riu.uni-koeln.de
Rhe
nish
Inst
itute
for E
nviro
nmen
tal R
esea
rch
at the University of C
ologne
RIU RLAQS web pageRIU RLAQS web page

www.riu.uni-koeln.de
Rhe
nish
Inst
itute
for E
nviro
nmen
tal R
esea
rch
at the University of C
ologne
EURAD AQ Prediction: UsersEURAD AQ Prediction: Users
•• LUA NorthrhineLUA Northrhine--WestfaliaWestfalia•• EPA IrelandEPA Ireland•• UBA GermanyUBA Germany•• UBA AustriaUBA Austria•• EMPA SwitzerlandEMPA Switzerland•• TSMS TurkeyTSMS Turkey
•• www.wetteronline.dewww.wetteronline.de (online weather service)(online weather service)•• www.meteomedia.chwww.meteomedia.ch (online weather TV)(online weather TV)

www.riu.uni-koeln.de
Rhe
nish
Inst
itute
for E
nviro
nmen
tal R
esea
rch
at the University of C
ologne
ConclusionsConclusions
•• Operational Daily forecast system of Air Quality Operational Daily forecast system of Air Quality presentedpresented
•• Scales from Hemisphere Scales from Hemisphere local covered (local covered (250 km 250 km 5 5 km km (and even down to 1 km)(and even down to 1 km)))
•• Everyday Validation of the prediction resultsEveryday Validation of the prediction results
•• Incorporation of inIncorporation of in--situ and Satellite observations (3dsitu and Satellite observations (3d--var data assimilation, 4dvar data assimilation, 4d--var is planned) var is planned)

www.riu.uni-koeln.de
Rhe
nish
Inst
itute
for E
nviro
nmen
tal R
esea
rch
at the University of C
ologne
AcknowledgementsAcknowledgements


