
CSE5230 - Data Mining, 2003 Lecture 5.1
Data Mining - CSE5230
Neural Networks 1
Feedforward Neural Networks
CSE5230/DMS/2003/5

CSE5230 - Data Mining, 2003 Lecture 5.2
Lecture Outline
Why study neural networks? What are neural networks and how do they
work? History of artificial neural networks (ANNs) Applications and advantages Choosing and preparing data An illustrative example

CSE5230 - Data Mining, 2003 Lecture 5.3
Why study Neural Networks? - 1
Two basic motivations for ANN research: to model brain function to solve engineering (and business) problems
So far as modeling the brain goes, it is worth remembering:
“… metaphors for the brain are usually based on the most complex device currently available: in the seventeenth century the brain was compared to a hydraulic system, and in the early twentieth century to a telephone switchboard. Now, of course, we compare the brain to a digital computer.”

CSE5230 - Data Mining, 2003 Lecture 5.4
Why study Neural Networks? - 2
Historically, ANN theories were first developed by neurophysiologists. For engineers (and others), the attractions of ANN processing include:
inherent parallelism speed (avoiding the von Neumann bottleneck) distributed “holographic” storage of information robustness generalization learning by example rather than having to understand the
underlying problem (a double-edged sword!)

CSE5230 - Data Mining, 2003 Lecture 5.5
Why study Neural Networks? - 3
It is important to be wary of the black-box characterization of ANNs as “artificial brains”
Beware of the anthropomorphisms common in the field (let alone in popular coverage of ANNs!)
learning memory training forgetting
Remember that every ANN is a mathematical model. There is usually a good statistical explanation of ANN behaviour

CSE5230 - Data Mining, 2003 Lecture 5.6
What is a neuron? - 1
a (biological) neuron is a node that has many inputs and one output
inputs come from other neurons or sensory organs
the inputs are weighted weights can be both positive
and negative inputs are summed at the node
to produce an activation value if the activation is greater than
some threshold, the neuron fires
f

CSE5230 - Data Mining, 2003 Lecture 5.7
What is a neuron? - 2
In order to simulate neurons on a computer, we need a mathematical model of this node
node i has n inputs xj
each connection has an associated weight wij
the net input to node i is the sum of the products of the connection inputs and their weights:
The output of node i is determined by applying a non-linear transfer function f to the net input:
n
jjiji xwnet
1
)( ii netfx
CSE5230 - Data Mining, 2003 Lecture 5.8
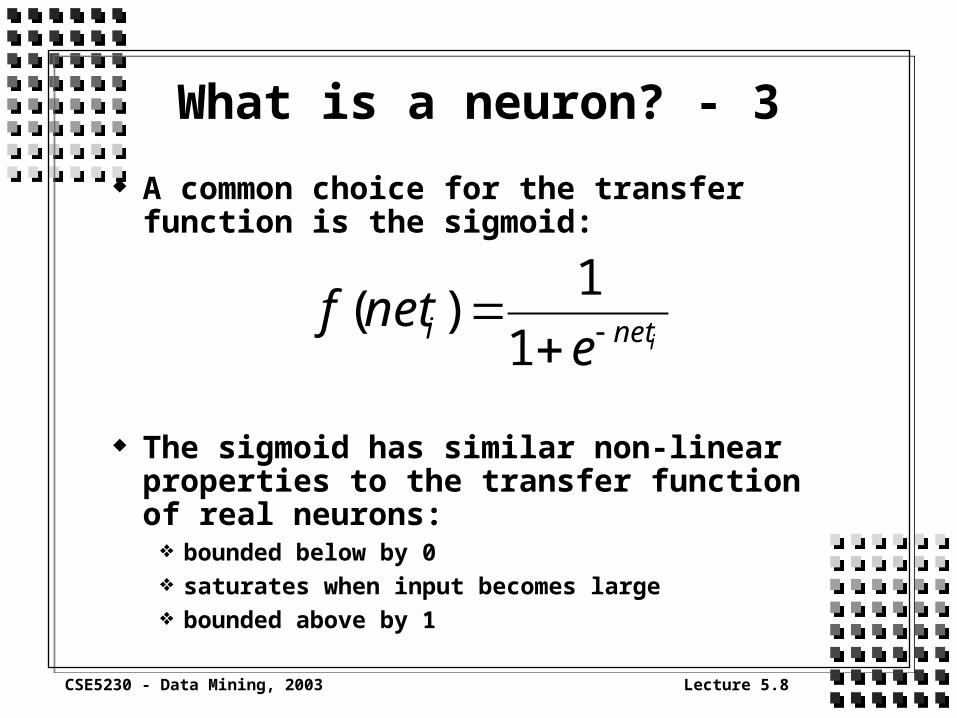
What is a neuron? - 3
A common choice for the transfer function is the sigmoid:
The sigmoid has similar non-linear properties to the transfer function of real neurons:
bounded below by 0 saturates when input becomes large bounded above by 1
ineti enetf
1
1)(

CSE5230 - Data Mining, 2003 Lecture 5.9
What is a neural network? Now that we have a model for an artificial
neuron, we can imagine connecting many of then together to form an Artificial Neural Network:
Input layer
Hidden layer
Output layer

CSE5230 - Data Mining, 2003 Lecture 5.10
History of ANNs - 1
By the 1940s, neurophysiologists knew that the brain consisted of billions of intricately interconnected neurons
The neurons all seemed to be basically identical
The idea emerged that the complex behaviour and power of the brain arose from the connection scheme
This led to the birth of connectionist approach to the explanation of:
memory, intelligence, pattern recognition, ...

CSE5230 - Data Mining, 2003 Lecture 5.11
History of ANNs - 2
Warren S. McCulloch and Walter Pitts, “A logical calculus of the ideas immanent in nervous activity”, Bulletin of Mathematical Biophysics, 5:115-133, 1943.
Historically very significant as an attempt to understand what the nervous system might actually be doing
First to treat the brain as a computational organ
Showed that their nets of “all-or-nothing” nodes could be described by propositional logic

CSE5230 - Data Mining, 2003 Lecture 5.12
History of ANNs - 3
Donald O. Hebb, The Organization of Behavior, John Wiley & Sons, New York, 1949.
Hebb proposed a learning rule for NNs:
“Let us assume then that the persistence of repetition of a reverberatory activity (or trace) tends to induce lasting cellular changes that add to its stability. The assumption can be precisely stated as follows: When an axon of cell A is near enough to excite cell B and repeatedly or persistently takes part in firing it, some growth process or metabolic change takes place on one or both cells so that A's efficiency as one of the cells firing B is increased.”

CSE5230 - Data Mining, 2003 Lecture 5.13
History of ANNs - 4
Frank Rosenblatt, “The Perceptron: A Probabilistic Model for Information Storage and Organization in the Brain”, Psychological Review, 65:386-408, 1958.
used random, weighted connections between layers of nodes
connection weights were updated according a a Hebbian-like rule
was able to discriminate between some classes of patterns

CSE5230 - Data Mining, 2003 Lecture 5.14
History of ANNs - 5
Marvin Minsky and Seymour Papert, Perceptrons, An Introduction to Computational Geometry, MIT Press, Cambridge, MA, 1969.
AI community felt that ANN researchers were overselling the capabilities of their models
highlighted the theoretical limitations of the Perceptron at the time (which had been improved since the original version). Classic example is the inability to solve the XOR problem
Effectively stopped ANN research for many years

CSE5230 - Data Mining, 2003 Lecture 5.15
History of ANNs - 6
Some research continued: Associative memories
» James A. Anderson, “ A Simple Neural Network Generating an Interactive Memory”, Mathematical Biosciences 14:197-220, 1972.
» Teuvo Kohonen, “ Correlation Matrix Memories”, IEEE Transaction on Computers, C-21:353-359, 1972.
Cognitron - the first multilayer NN» K. Fukushima, “Cognitron: A Self-organizing
Multilayered Neural Network”, Biological Cybernetics, 20:121-136, 1975.
Hopfield Networks» J. J. Hopfield, “ Neural Networks and Physical
Systems with Emergent Collective Computational Abilities”, Proceedings of the National Academy of Sciences, 79:2554-2558, 1982.

CSE5230 - Data Mining, 2003 Lecture 5.16
History of ANNs - 7The Multilayered Back-
Propagation Association Networks The limitations pointed out by Minsky and
Papert were due the the fact that the Perceptron had only two layers (and was thus restricted to classifying linearly separable patterns)
Extending successful learning techniques to multilayer networks was the challenge
In 1986, several groups came up with essentially the same algorithm, which became known as back-propagation
This led to the revival of ANN research

CSE5230 - Data Mining, 2003 Lecture 5.17
History of ANNs - 8The Multilayered Back-
Propagation Association Networks
David D. Rumelhart, Geoffrey E. Hinton and Ronald J. Williams, “Learning Representations by Back-Propagating Errors”, Nature 323:533-536, 1986.
The idea of back-propagation is to calculate the error at the output layer, and then to trace the contributions to this error back through the network to the input layer, adjusting weights as one goes so as to reduce this error

CSE5230 - Data Mining, 2003 Lecture 5.18
Mathematically, this is a gradient descent training procedure
In fact, back-propagation is the neural analogue of a gradient descent algorithm discovered earlier
Paul Werbos, “Beyond regression: New Tools for Prediction and Analysis in the Behavioral Sciences”, Doctoral thesis, Harvard University, 1974.
The back-propagation algorithm uses the Chain Rule from calculus to extend more traditional regression to multilayer networks
History of ANNs - 9The Multilayered Back-
Propagation Association Networks

CSE5230 - Data Mining, 2003 Lecture 5.19
Probably the most common type of ANN used to today is a multilayer feedforward network trained using back-propagation (BP)
Often called a Multilayer Perceptron (MLP) Despite the title of Werbos’ thesis, back-prop is now
seen as a form of regression: a training set of input-output pairs is provided, and gradient descent is used to determine the the parameters of a model (the ANN) to fit this training data:
“…ANNs are well suited for problems whose solutions require knowledge that is difficult to specify but for which there are enough data or observations. In this sense they can be treated as one of the multivariate nonlinear nonparametric statistical methods” [ZPH1998]
History of ANNs - 10The Multilayered Back-
Propagation Association Networks

CSE5230 - Data Mining, 2003 Lecture 5.20
History of ANNs - 11
Other ANN models have been developed during the last twenty years:
Adaptive Resonance Theory (ART)» pattern recognition networks where activity flows back and
forth between layers, and “resonances” form» Gail Carpenter and Stephen Grossberg, “A Massively
Parallel Architecture for a Self-Organizing Neural Pattern Recognition Machine”, Computer Vision, Graphics and Image Processing 37:54, 1987.
Self-Organizing Maps (SOMs)» Also biologically inspired: “How should the neurons
organize their connectivity to optimize the spatial distribution of their responses within the layer?”
» Can be used for analysis similar to clustering (more next week)
» Teuvo Kohonen, “Self-organized formation of topologically correct feature maps”, Biological Cybernetics 43:59-69, 1982.

CSE5230 - Data Mining, 2003 Lecture 5.21
ANNs and Statistical Techniques
Several studies have shown that ANNs often do not always perform better than more traditional statistical techniques:
“we found artificial neural networks did as well as (and occasionally better than) statistical models; however, we suspect that there are only certain conditions where this is true.” [HMO1994]
“Overall, there may be a limit on what ANNs can learn from the data and make predictions… It is clear that ANNs as well as traditional linear and nonlinear methods can not do everything equally well.” [ZPH1998]
Message: like any other data mining technique, ANNs are not a panacea: it is necessary to use your understanding of the problem in choosing the technique to apply.
CSE5230 - Data Mining, 2003 Lecture 5.22
Applications of ANNs
Predicting financial time series Diagnosing medical conditions Identifying clusters in customer databases Identifying fraudulent credit card transactions Hand-written character recognition (cheques) Predicting the failure rate of machinery and many more….

CSE5230 - Data Mining, 2003 Lecture 5.23
Using a neural network for prediction - 1
Identify input and outputs Preprocess inputs - often scale to the range
[0,1] Choose an ANN architecture (see next slide) Train the ANN with a representative set of
training examples (usually using BP) Test the ANN with another set of known
examples often the known data set is divided in to training and test
sets. Cross-validation is a more rigorous validation procedure.
Apply the model to unknown input data

CSE5230 - Data Mining, 2003 Lecture 5.24
Using a neural network for prediction - 2
The network designer must decide the network architecture for a given application
It has been proven that one hidden layer is sufficient to handle all situations of practical interest
The number of nodes in the hidden layer will determine the complexity of the ANN model (and thus its capacity to recognize patterns)
BUT, too many hidden nodes will result in the memorization of individual training patterns, rather than generalization
Amount of available training data is an important factor - must be large for a complex model

CSE5230 - Data Mining, 2003 Lecture 5.25
An example
Note that here the network is treated as a “black-box”
Living space
Size of garage
Age of house
Heating type
Other attributes
Neural network
Appraised value

CSE5230 - Data Mining, 2003 Lecture 5.26
Issues in choosing the training data set
The neural network is only as good as the data set with which it is trained upon
When selecting training data, the designer should consider:
Whether all important features are covered What are the important/necessary features The number of inputs The number of outputs Availability of hardware

CSE5230 - Data Mining, 2003 Lecture 5.27
Preparing data
Preprocessing is usually the most complicated and time-consuming issue when working with ANNs (as with any DM tool)
Main types of data encountered: Continuous data with known min/max values
(range/domain known). There problems with skewed distributions: solutions include removing values or using log function to filter
Ordered, discrete values: e.g. low, medium, high Categorical values (no order): e.g. {“Male”, “Female”,
“Unknown”} ( use “1 of N coding” or “1 of N-1 coding”) There will always be other problems where
the analyst’s experience and ingenuity must be used

CSE5230 - Data Mining, 2003 Lecture 5.28
Illustrative Example (1) This example is from [SWB2000]: “An
analysis of customer retention and insurance claim patterns using data mining: a case study”
In the insurance industry, customers can freely choose their insurer. This choice is based on factors such as:
Price, service, personal preference, convenience, etc. Important to understand which customers are
leaving, and why: Build a system to classify customers as either:
» Likely to renew policy» Likely to terminate policy
Predict probability that policy holder will terminate the policy

CSE5230 - Data Mining, 2003 Lecture 5.29
Illustrative Example (2)
Data collection Sample of 20914 motor vehicle policy holders; policies
due for renewal in April 1998
» 7.1% did not renew Assumption is made that this sample is representative of
all policy holders, i.e. the month doesn’t matter. Available data included:
» Demographics: age, postcode, etc.
» Policy details: premium, sum insured, etc.
» Policy holder history: rating, years on rating, claim history
» Differences between premium and sum insured for existing policy and renewal policy

CSE5230 - Data Mining, 2003 Lecture 5.30
Illustrative Example (3)
Domain experts were contacted for opinions on factors likely to cause policy termination. They suggested:
Price, service, sum insured
Preliminary statistical analysis confirmed importance of price and sum insured, but did not support service
Examination of other factors did not reveal a significant effect when treated individually – but could still have an effect when combined:
Use DM tools to learn models relating demographic and policy information to retention probability

CSE5230 - Data Mining, 2003 Lecture 5.31
Illustrative Example (4)
Used SAS Enterprise Miner Data selection and preparation
» Statistical tests were used to select variables (based on Chi-squared statistic)
» Some continuous variables grouped into bins (based on quantiles)
» Some variables log-transformed since their distributions were highly skewed
» Categorical and binned data split into binary data Result: 29 independent variables (input) and one
dependent variable (output)

CSE5230 - Data Mining, 2003 Lecture 5.32
Illustrative Example (5)Variable Data Type Status Transformation
Post code Categorical Used Grouped into 10 bins
New business Binary Used
Vehicle age Continuous Used Grouped into 4 bins
Rating Categorical Used Grouped into 2 bins
Years on rating Continuous Used
Previous company Categorical Rejected
Car category Categorical Rejected
Policy Holder Age Continuous Used Grouped into 5 bins
Gender Binary Used
Premium Continuous Used Log transformation
Premium diff. Continuous Used
Sum insured Continuous Used Log transformation
Sum insured diff. Continuous Used
Claim history Binary Rejected
Years on policy Continuous Used
Terminated Binary Used

CSE5230 - Data Mining, 2003 Lecture 5.33
Illustrative Example (5)
Data was sampled to produce test and training (20% of total data) sets
Built three models: Regression analysis using logistic regression Decision tree using a Chi-squared based splitting
criterion (see forthcoming lecture) Standard 3-layer feedforward ANN with 29 inputs, 25
hidden nodes and 1 output node
» Trained using conjugate gradient technique, rather than standard back-prop.

CSE5230 - Data Mining, 2003 Lecture 5.34
Illustrative Example (6)Results:This is a lift chart, showing the percentage of terminations discovered if a certain percentage of data set is examined – shows lift when data ordered using the model, compared to random ordering (which would give a 45 degree straight line)Here the ANN wins

CSE5230 - Data Mining, 2003 Lecture 5.35
References
[HMO1994] Tim Hill, Leorey Marquez, Marcus O'Connor and William Remus, Artificial neural network models for forecasting and decision making, International Journal of Forecasting, 10, 1, pp. 5-15, June 1994.
[SWB2000] K. A. Smith, R. J. Willis and M. Brooks, An analysis of customer retention and insurance claim patterns using data mining: a case study, Journal of the Operational Research Society, 51, 5, pp. 532-541, May 2000.
[ZPH1998] Guoqiang Zhang, B. Eddy Patuwo and Michael Y. Hu, Forecasting with artificial neural networks: The state of the art, International Journal of Forecasting, 14, 1, pp. 35-62, March 1998.


