Download - Contingency Table Using Chi-Square Test

8/13/2019 Contingency Table Using Chi-Square Test
http://slidepdf.com/reader/full/contingency-table-using-chi-square-test 1/14
Contingency Table Using
Chi-Square test (2 - Test)
Test of Independence
8/13/2019 Contingency Table Using Chi-Square Test
http://slidepdf.com/reader/full/contingency-table-using-chi-square-test 2/14
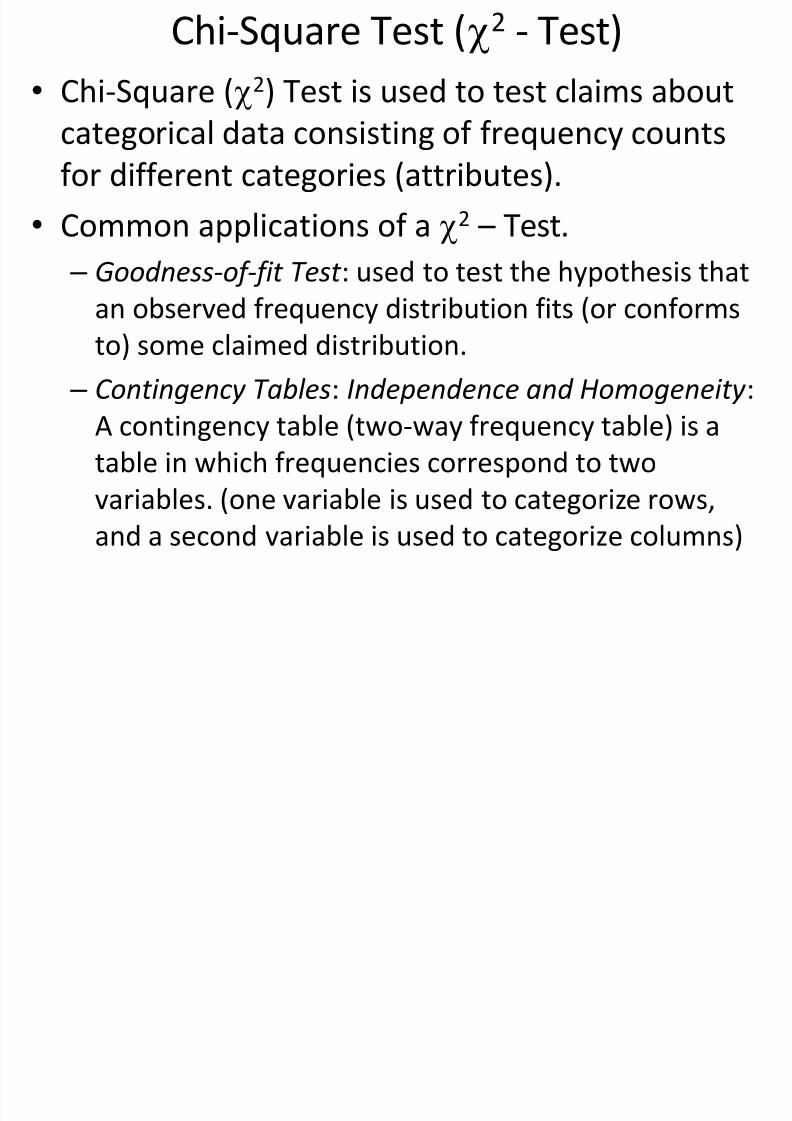
Chi-Square Test (2 - Test)
• Chi-Square (2) Test is used to test claims about
categorical data consisting of frequency countsfor different categories (attributes).
• Common applications of a 2 – Test.
–Goodness-of-fit Test : used to test the hypothesis thatan observed frequency distribution fits (or conforms
to) some claimed distribution.
– Contingency Tables: Independence and Homogeneity :
A contingency table (two-way frequency table) is a
table in which frequencies correspond to two
variables. (one variable is used to categorize rows,
and a second variable is used to categorize columns)

8/13/2019 Contingency Table Using Chi-Square Test
http://slidepdf.com/reader/full/contingency-table-using-chi-square-test 3/14
Contingency Tables
• Test of Independence: Test the null hypothesis thatthe row variable and the column variable in acontingency table are not related (the nullhypothesis is the statement that the row and columnvariables are independent/not related/not
associated).
Null Hypothesis:
Ho: Variable A is independent from variable B
Variable A and variable B are independent
Variable A is not related to variable B
Variable A and variable B are not related

8/13/2019 Contingency Table Using Chi-Square Test
http://slidepdf.com/reader/full/contingency-table-using-chi-square-test 4/14
Contingency Tables
An r c contingency table shows the observed
frequencies for two variables and arranged in r rows and c columns. The intersection of a row and
column is called a cell.
2 x 5 contingency table
Row 1
Row 2
Col 1 Col 2 Col 3 Col 4 Col 5
8/13/2019 Contingency Table Using Chi-Square Test
http://slidepdf.com/reader/full/contingency-table-using-chi-square-test 5/14
Contingency Tables
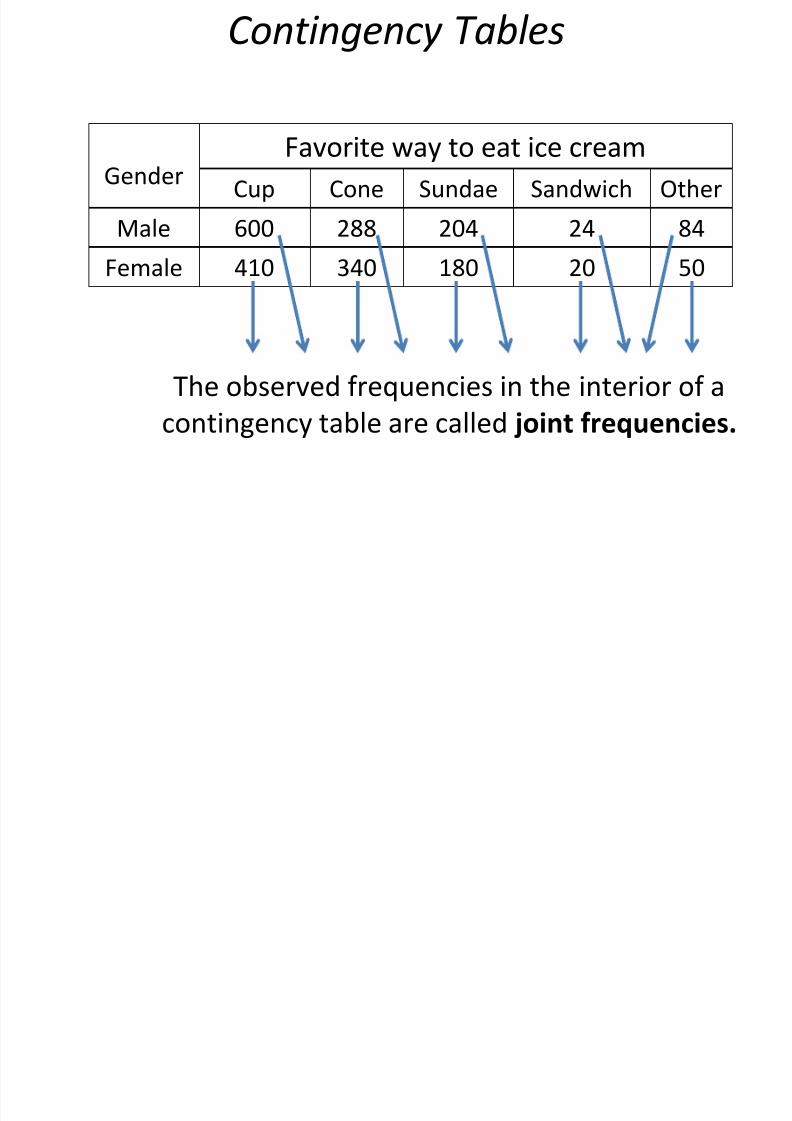
GenderFavorite way to eat ice cream
Cup Cone Sundae Sandwich Other
Male 600 288 204 24 84
Female 410 340 180 20 50
The observed frequencies in the interior of a
contingency table are called joint frequencies.

8/13/2019 Contingency Table Using Chi-Square Test
http://slidepdf.com/reader/full/contingency-table-using-chi-square-test 6/14
Contingency Tables
Gender
Favorite way to eat ice cream
Row TotalCup Cone Sundae Sandwich Other
Male 600 288 204 24 84 1200
Female 410 340 180 20 50 1000
ColumnTotal
1010 628 384 44 134 n = 2200
The sum of each row and column in acontingency table are called marginal frequencies.

8/13/2019 Contingency Table Using Chi-Square Test
http://slidepdf.com/reader/full/contingency-table-using-chi-square-test 7/14
Finding Expected Frequencies (fe)
8/13/2019 Contingency Table Using Chi-Square Test
http://slidepdf.com/reader/full/contingency-table-using-chi-square-test 8/14
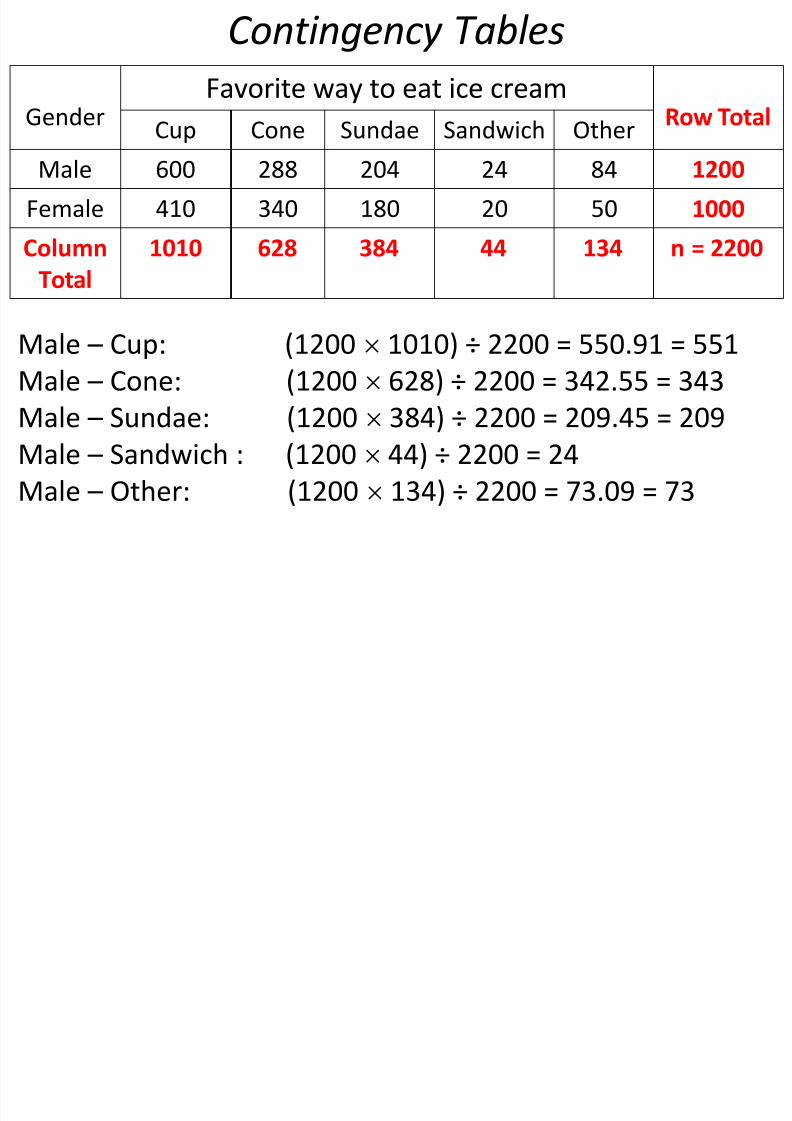
Contingency Tables
GenderFavorite way to eat ice cream
Row Total
Cup Cone Sundae Sandwich OtherMale 600 288 204 24 84 1200
Female 410 340 180 20 50 1000
Column
Total
1010 628 384 44 134 n = 2200
Male – Cup: (1200 1010) ÷ 2200 = 550.91 = 551
Male – Cone: (1200 628) ÷ 2200 = 342.55 = 343
Male –
Sundae: (1200 384) ÷ 2200 = 209.45 = 209Male – Sandwich : (1200 44) ÷ 2200 = 24
Male – Other: (1200 134) ÷ 2200 = 73.09 = 73
8/13/2019 Contingency Table Using Chi-Square Test
http://slidepdf.com/reader/full/contingency-table-using-chi-square-test 9/14
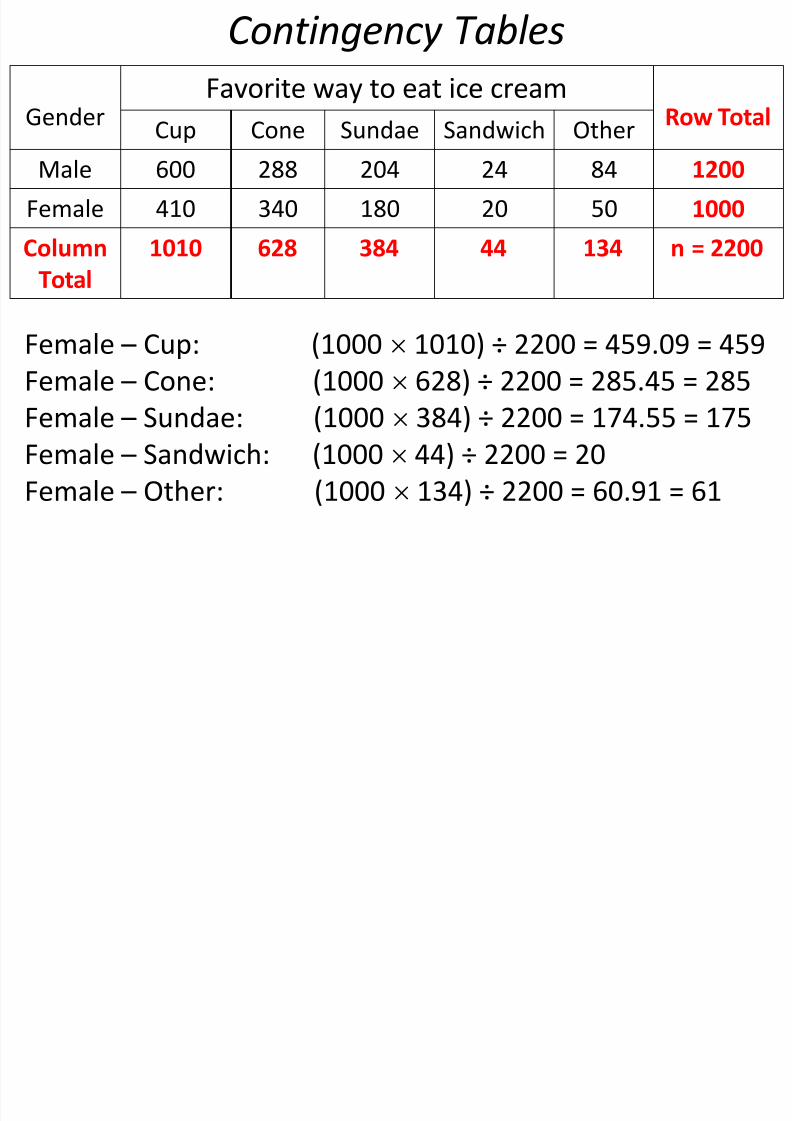
Contingency Tables
GenderFavorite way to eat ice cream
Row Total
Cup Cone Sundae Sandwich OtherMale 600 288 204 24 84 1200
Female 410 340 180 20 50 1000
Column
Total
1010 628 384 44 134 n = 2200
Female – Cup: (1000 1010) ÷ 2200 = 459.09 = 459
Female – Cone: (1000 628) ÷ 2200 = 285.45 = 285
Female –
Sundae: (1000 384) ÷ 2200 = 174.55 = 175Female – Sandwich: (1000 44) ÷ 2200 = 20
Female – Other: (1000 134) ÷ 2200 = 60.91 = 61
8/13/2019 Contingency Table Using Chi-Square Test
http://slidepdf.com/reader/full/contingency-table-using-chi-square-test 10/14
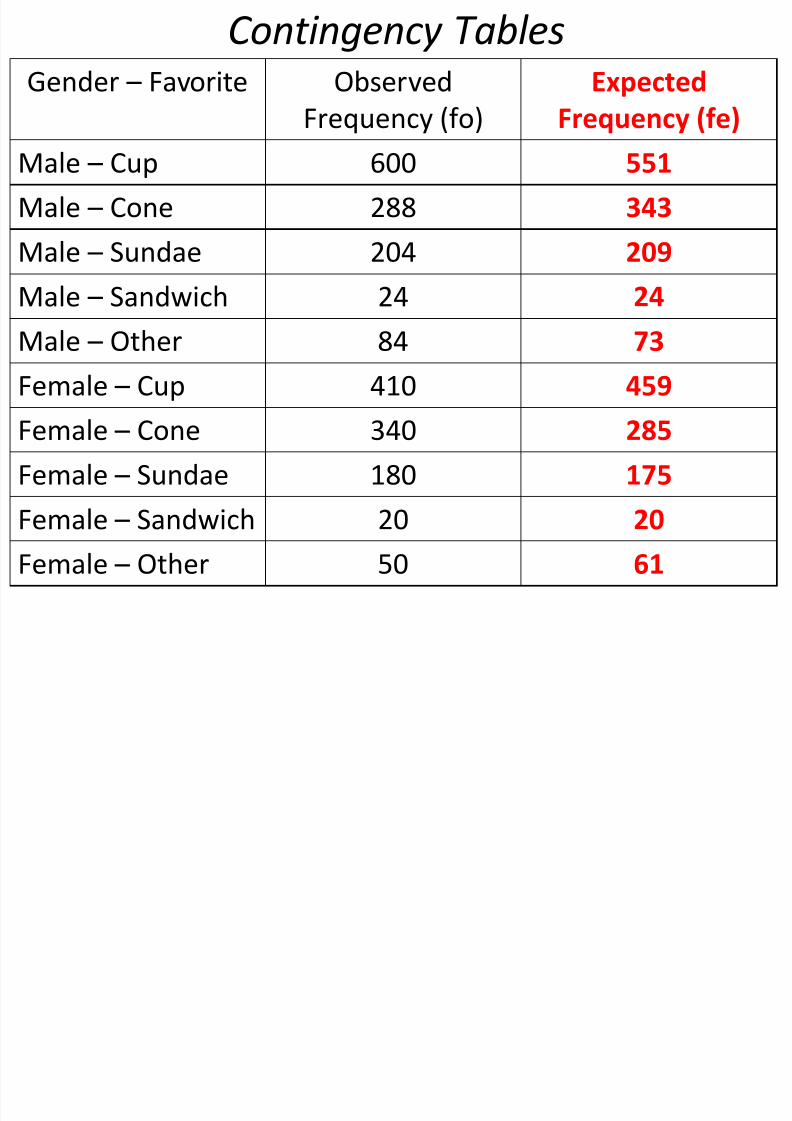
Contingency Tables Gender – Favorite Observed
Frequency (fo)
Expected
Frequency (fe)
Male – Cup 600 551
Male – Cone 288 343
Male – Sundae 204 209
Male – Sandwich 24 24
Male – Other 84 73
Female – Cup 410 459
Female –
Cone 340 285
Female – Sundae 180 175
Female – Sandwich 20 20
Female –
Other 50 61

8/13/2019 Contingency Table Using Chi-Square Test
http://slidepdf.com/reader/full/contingency-table-using-chi-square-test 11/14
Gender – Favorite (fo) (fe) (fo – fe) (fo – fe)2 ÷ fe
Male – Cup 600 551 49 (49)2÷ 551 = 4.2575
Male –
Cone 288 343 –
55 (-55)2
÷ 343 = 8.8192Male – Sundae 204 209 – 5 (-5)2÷ 209 = 0.1196
Male – Sandwich 24 24 0 (0)2÷ 24 = 0.0000
Male – Other
84 73 11 (11)2
÷ 73 = 1.6575Female – Cup 410 459 – 49 (-49)2÷ 459 = 5.2309
Female – Cone 340 285 55 (55)2÷ 285 = 10.6140
Female – Sundae
180 175 5 (5)
2
÷ 175 = 0.1429Female – Sandwich 20 20 0 (0)2÷ 20 = 0.0000
Female – Other 50 61 – 11 (-11)2÷ 61 = 1.9836
2 = 32.8252

8/13/2019 Contingency Table Using Chi-Square Test
http://slidepdf.com/reader/full/contingency-table-using-chi-square-test 12/14
Critical Region = 5% = 0.05
df = (row –
1)(column –
1)df = (2 – 1)(5 – 1) = (1)(4) = 4
8/13/2019 Contingency Table Using Chi-Square Test
http://slidepdf.com/reader/full/contingency-table-using-chi-square-test 13/14
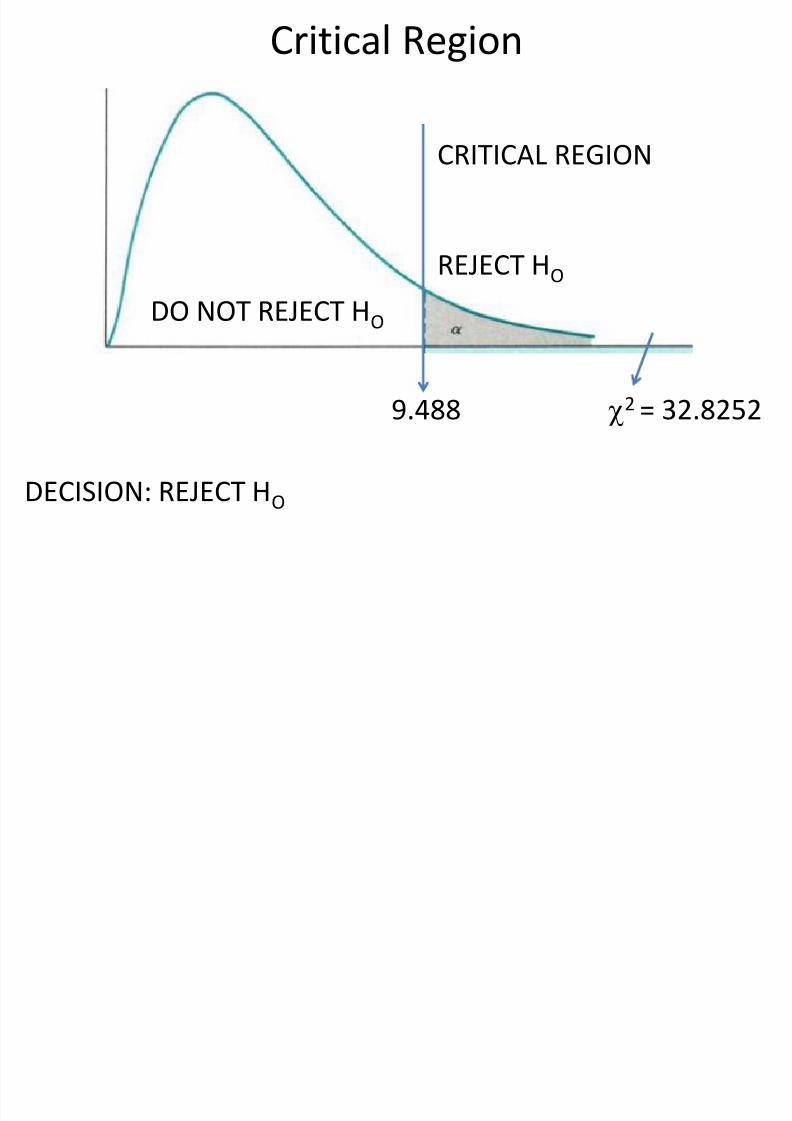
Critical Region
9.488 2
= 32.8252
CRITICAL REGION
REJECT HO
DO NOT REJECT HO
DECISION: REJECT HO

8/13/2019 Contingency Table Using Chi-Square Test
http://slidepdf.com/reader/full/contingency-table-using-chi-square-test 14/14
Ho: Favorite way to eat ice cream and gender,
are independent.
H1: Favorite way to eat ice cream and gender,are dependent.
Conclusion: Favorite way to eat ice cream andgender are dependent.
Interpretation:
This indicates that males prefer cup and other as theirfavorite way to eat ice cream than females as expectedwhile females prefer cone as their favorite way to eatice cream than males as expected.


