Mahoney c08a.tex V1 - 01/18/2013 7:40pm Page 269
C H A P T E R 8CLUSTER ToF-SIMS IMAGINGAND THE CHARACTERIZATIONOF BIOLOGICAL MATERIALS
John Vickerman and Nick Winograd
8.1 INTRODUCTION
It is now clear that the use of metal cluster and polyatomic primary ions cangreatly enhance the capability of time-of-flight secondary ion mass spectrometry(ToF-SIMS) to tackle the analysis of complex chemical systems. Biological mate-rials present the greatest challenge, but also probably the greatest opportunity toapply the full capabilities of SIMS in label-free analysis.1 This chapter will seekto provide a brief overview of the present capabilities and the future possibili-ties of ToF-SIMS using cluster primary ions in the study of biological cells andtissue.
There are basically two types of ToF-SIMS instrumentation available atpresent. By far, the majority of instruments utilize a pulsed primary beam anda reflectron time of flight mass spectrometer. Very recently a new concept ofinstrument has appeared that uses a DC primary beam and a hybrid two-stagemass spectrometer arrangement. First, we summarize the benefits common to bothinstruments and then outline those specific to the new ToF-SIMS platforms. Thechallenges facing ToF-SIMS in biological studies will then be discussed, followedby some illustrative examples of the present status of ToF-SIMS in biologicalanalyses.
Cluster Secondary Ion Mass Spectrometry: Principles and Applications, First Edition.Edited by Christine. M. Mahoney.© 2013 John Wiley & Sons, Inc. Published 2013 by John Wiley & Sons, Inc.
269
Mahoney c08a.tex V1 - 01/18/2013 7:40pm Page 270
270 CHAPTER 8 CLUSTER ToF-SIMS IMAGING AND THE CHARACTERIZATION
8.2 THE CAPABILITIES OF ToF-SIMSFOR BIOLOGICAL ANALYSIS
Analysis without sample pretreatment. As a mass spectrometric-basedmethod, ToF-SIMS enables molecular analysis without the requirementto use tags or labels. Furthermore, in contrast to matrix-assisted laser
Q1
desorption/ionization (MALDI), SIMS is performed without any samplepretreatment, although matrix-assisted SIMS is a variant that is beingexplored to extend its capability. With mass resolution in the region of5000–10,000, and good mass accuracy, ToF-SIMS is, in theory, able toidentify most major components of biological systems of mass belowm/z ∼2000, although other factors to be discussed later influence thiscapability.
Upper layer sensitivity and molecular depth profiling. ToF-SIMS is a surface-sensitive technique, probing information from only the top few monolayersof a sample. However, because of the low levels of chemical damageusually generated when polyatomic cluster primary ions such as SF5
+,C60
+, and large argon clusters are used to sputter molecular systems, thechemistry of subsurface layers may also be exposed (via sputter removal)so that their composition can be distinguished from the surface. Hence,molecular depth profiling and 3D imaging becomes possible.
Excellent spatial resolution. Liquid metal cluster ion beams can be focusedto sub-100 nm beam diameter at the surface. In principle, submicrometerspatial resolution is feasible if the ion yield is sufficient under the staticconditions that are required for these beams. Although argon cluster beamsare more difficult to focus, C60
+ beams can be focused to at least 1 μmso voxel analysis at this level is possible.
Analysis of samples in the frozen state. Appropriately equipped instrumentscan now handle and analyze samples in the frozen hydrated state. Fastfreezing of biological samples ensures that there is as little deviation fromthe natural state as possible. Facilities are now available to fracture cellsand tissue while frozen so that the internal chemical structure can beprobed without the sample having to be warmed up or exposed to theatmosphere.
8.3 NEW HYBRID ToF-SIMS INSTRUMENTS
8.3.1 Introduction
Because polyatomic ion beams generate much less chemical damage in most molec-ular analyte systems, it is now possible to use a DC primary beam. The applicationof a DC beam allows for rapid 3D analysis, with increased sensitivities and higherspatial resolutions than can be offered using the more conventional systems. Inconventional ToF-SIMS instruments, a pulsed primary beam has to be used. Thepulse length determines the mass resolution, but the movement of the beam during

Mahoney c08a.tex V1 - 01/18/2013 7:40pm Page 271
8.3 NEW HYBRID ToF-SIMS INSTRUMENTS 271
the pulsing can limit the attainable spatial resolution. When a DC beam is used, themass spectrometry is separated from the ion formation process, so mass resolutionand spatial resolution can be separated.
Two new types of ToF-SIMS instruments emerged in the early 2000s thatare designed to exploit the capabilities of polyatomic cluster ions with a DC beamconfiguration. The new SIMS instruments are basically variants of the ortho-ToFdesigns used for MALDI and electrospray ionization (ESI) mass spectrometry.A sample of a stream of secondary ions generated by the DC beam are eitherpushed out into a ToFMS by a pusher plate as in the Q-Star qToF instrument,or are collected in a long buncher and accelerated into a ToFMS as in the J105instrument from Ionoptika, Figure 8.1.2,3 While an analysis is carried out, a furthersample of the secondary ion stream is collected. Some loss of the secondary ionstream occurs because of the sampling process, although this can be minimized forsignificant parts of the spectrum. In general, however, the transmission efficiencyof these hybrid instruments is rather lower than the simple pulsed-beam reflectronToF designs.
8.3.2 Benefits of New DC Beam Technologies
The DC-beam systems potentially offer enhancements to the ToF-SIMS capabilityas follows:
Analysis beyond the static limit in 2D and 3D analysis. Unlike conventionalToF-SIMS designs that alternate sputter and analysis cycles, the newdesigns allow for simultaneous collection of ions for analysis while thebeam is sputtering the sample. This means that all sputtered material isused for analysis. Because the polyatomic ions do not generate as muchchemical damage as liquid metal cluster beams, analysis is not restrictedby the static regime to 1% of the sample surface. The potential yield fromany 2D pixel is increased by 100 times; furthermore, analysis is not lim-ited to the surface layer, so multiple layers can be acquired enabling 3Danalysis and imaging without switching beams.
Spatial resolution and mass resolution are independent of one another.A DC beam can be focused to its optimum capability depending onbeam energy and current. The properties of the beam raster can bedefined relative to the pixel size and sputter rates required. The qualityof the mass spectrometry is dependent only on capabilities of the massspectrometer and independent of how the secondary ions are formed. Inprinciple, the best spatial resolution and mass resolution can be obtainedat the same time.
Spectral and image acquisition times are greatly reduced. The primary beamof conventional ToF-SIMS instruments is on for only 10−4 of the time.This greatly extends the time for acquisition of the large data sets involvedin 2D and 3D images that could take many hours or even days. The useof the DC beam arrangement has reduced these times to a few hours oreven minutes. For example, to analyze each of the 108 molecules in a

Mahoney c08a.tex V1 - 01/18/2013 7:40pm Page 272
Bun
cher
Ion
guns
Sam
ple
inse
rtio
nG
love
box
Bun
cher
pla
tes
Bea
mRef
lect
ron
Ref
lect
ron
Acc
eler
atio
nT
ime
focu
s
Det
ecto
r
Det
ecto
r
Qua
drup
ole
regi
on
8 ×
10−3
Tor
r
<1
× 10
−6 T
orr
2 ×
10−5
Tor
r
Q0
Ras
tere
dsa
mpl
e st
age
ToF
reg
ion
20 k
eV C
60+
sour
ce
Q1
Q2
Col
lisio
n ce
ll
Firs
t tim
e fo
cus
v
Fig
ure
8.1
Sche
mat
ics
ofth
eJ1
053D
Che
mic
alIm
ager
(a)
and
the
C60
equi
pped
Q-S
tar
(b)
inst
rum
ents
.B
oth
inst
rum
ents
can
use
cont
inuo
usbe
ams.
The
J105
bunc
hes
the
seco
ndar
yio
nst
ream
toa
focu
sat
the
entr
ance
toth
eTo
Fan
alyz
erw
hile
the
Q-S
tar
orth
ogon
ally
puls
esse
ctio
nsof
the
seco
ndar
yio
nst
ream
into
aTo
Fan
alyz
er.
272
Mahoney c08a.tex V1 - 01/18/2013 7:40pm Page 273
8.4 CHALLENGES IN THE USE OF ToF-SIMS FOR BIOLOGICAL ANALYSIS 273
1 μm × 1 μm × 10 nm voxel using a 10 pA ion beam with a 100 nspulse width and a 10 kHz repetition rate, 10 s of instrumental time isrequired (assuming a sputter yield of 100). Therefore, it would take 182 hto acquire a 256 voxel × 256 voxel image. However, by eliminating thepulsed nature of the ion beam, the same image can be acquired in only11 min or 103 less time.
MS/MS analysis is now possible. Despite the capability for accurate massmeasurement, one of the great drawbacks of ToF-SIMS for the analyses ofbiological samples has been the inability to carry out tandem MS analyseson large ions to determine their chemical structure. These new instrumentsbasically have two mass spectrometers in tandem, so precursor ions canbe selected by the first MS (a quadrupole in the case of the qToF, and thebuncher in the case of the J105) and the fragments formed in a collisioncell can be analyzed by the ToFMS to enable in many cases the precisechemical structure to be determined. This potentially brings ToF-SIMSinto the mainstream of biological mass spectrometry.
Combining this new instrumentation with the high quality accessible withconventional instruments, ToF-SIMS is now potentially in a position to contribute toa very significant degree to understanding the 2D and 3D chemistry of biosystems.However, there are a number of challenging issues that need to be factored intothe design of experiments and in the assessment of data.
8.4 CHALLENGES IN THE USE OF ToF-SIMSFOR BIOLOGICAL ANALYSIS
8.4.1 Sample Handling of Biological Samples for Analysisin Vacuum
Sample preparation is essential when acquiring meaningful SIMS images of singlecells or tissue.4–6 In order to prepare cells for analysis in vacuo, the 3D integrityof the sample must be preserved in the solid state with micrometer precision.Common strategies for cell preservation include freeze-drying, freeze-etching,freeze-fracturing, chemical fixation, and sugar vitrification.7,8 These methods canbe very successful in maintaining the physical state of the biological materials.However, when it is also required that the chemistry is not disturbed, the situationcan be significantly more complicated and there are few objective studies that seekto assess the usefulness of each preparation protocol. There seems to be a greatdeal of dogmatic statement, or hope, expressed that such-and-such-a-process doesnot, or is not “believed,” to affect the chemical and physical localization of thecompounds under study. Chemical fixation clearly has to change the chemistry ofthe samples being studied. It seems to be recognized that a particular fixative doesnot work on all the biological molecules in a cell or tissue.9 When the chemistryof the material under study is complex, adding further to the chemistry of thesystem may not be the best way forward.

Mahoney c08a.tex V1 - 01/18/2013 7:40pm Page 274
274 CHAPTER 8 CLUSTER ToF-SIMS IMAGING AND THE CHARACTERIZATION
It is clear that fast freezing in liquid propane or isopentane is effective inensuring that cell or tissue structure is not damaged by water crystallizing.10 Thisprocess also would seem to have a good chance of maintaining the chemical local-ization. However, it is what the analyst does with the material thereafter that isprobably crucial for the chemical analysis. Frequently, after storage in liquid nitro-gen or at −80 ◦C, the material is freeze-dried, which entails the material warmingup to room temperature. Many biologists seem to be comfortable that the proce-dure does not redistribute the chemistry significantly, but it is difficult to find anydefinitive studies that confirm this conclusion. The problem is that imaging massspectrometry might be one of the only “discovery” techniques that could assessthe validity of this view. A “gold standard” technique to cross-reference againstis difficult to identify. However, such studies are needed if freeze-drying is to berelied upon. Studies have demonstrated conclusively that cholesterol can be lostcompletely from samples being freeze-dried if the process is prolonged.11,12 In con-trast to freeze-drying, maintaining the sample in the frozen hydrated state followedby freeze-fracturing cells or tissue to expose regions of interest would seem to havesome advantages. The fracturing process is best carried out inside the vacuum sys-tem to prevent condensation of water ice on the sample. A number of approacheshave been successful.13 Most recently, the development of a reverse “mousetrap”device has been described.14,15 The frozen material, cells, or tissue are sandwichedbetween two metal plates, and the whole device is cooled. The top plate is springloaded. When everything is in place at the analysis position, the trigger is pushedin to release the top plate that flips backward to fracture the material and to exposetwo surfaces of material. In the case of cells, this procedure may expose the insideof the cell for analysis. Where an overlayer of water ice is formed during thefracturing process it can be removed using polyatomic ion bombardment with nodamage to the underlying molecules.8 Therefore, a good strategy for maintainingthe 3D structure of biological samples while exposing an intact, meaningful sur-face for SIMS imaging involves combining freeze-fracture technology and clusterion beams. Despite freeze-fracturing probably being the best approach, because itis quicker and easier, much sample preparation is carried out using freeze-drying.Sample washing is also frequently involved. Both washing and drying can result inthe movement or loss of molecules from the cells or tissues. One of the exemplarstudies below further investigates the preparation of cells for analysis.
8.4.2 Analysis is Limited to Small to Medium Size Molecules
The SIMS process seems to be able to lift off and ionize molecules of a restrictedsize range, that is, up to m/z of a few thousands. Proteins and large peptides seem tobe inaccessible, although the use of matrix-assisted SIMS does seem to enable somelarge peptides to be accessed.16 The highest yields are obtained for molecules suchas lipids and small metabolites.17 Such measurements, as have been made, suggestthat sputter yields of molecules in the size range between m/z 300 and 1500 aremuch the same at about 200 per C60 impact18; however, it is clear that ionizationprobabilities, although low, vary widely and for many molecules are influencedby their basicity.19 Thus it seems that ToF-SIMS can be used to monitor small

Mahoney c08a.tex V1 - 01/18/2013 7:40pm Page 275
8.4 CHALLENGES IN THE USE OF ToF-SIMS FOR BIOLOGICAL ANALYSIS 275
molecules in bio-systems, but the all-important proteins will need a matrix to beadded in order to be probed by MALDI and possibly matrix-assisted SIMS.
8.4.3 Ion Yields Limit Useful Spatial Resolutionfor Molecular Analysis to not Much Better than 1 μm
Despite the fact that liquid metal ion beams can deliver a probe size at the sampleof less than 100 nm, because of the static SIMS limitation (10−2 molecules foranalysis) and the very small ionization probability (frequently less than 10−4),20,21
even with 50% transmission fewer than five secondary ions could be expected froma 100% component of a 2D 1 μm pixel. If the static limit is relaxed in the case ofpolyatomic primary ions, a 2D pixel would yield 10–100 ions from a 100% com-ponent, such that analysis at the 10% level might become feasible. If the wholeof the 3D 1 μm voxel is used for analysis, 103 –104 ions would become availableeven with 10% instrument transmission. Thus, the ability to use a DC beam andcollect all the ions sputtered might enable analysis of composition down to the 1%level, which is beginning to become useful. However, it is clear that it will be dif-ficult to obtain useful information on molecular distributions below 1 μm 2D pixeldimensions unless the ionization probability of the species studied is significantlyincreased. Small fragment ions and salt cationized ions sometimes fall into thiscategory. Nevertheless, to be able to analyze with submicrometer resolution on aroutine basis will require a significant increase in molecular ionization probability.
8.4.4 Matrix Effects Inhibit Application in Discovery Modeand Greatly Complicate Quantification
The secondary ion formation mechanism of a particular ion is profoundly influ-enced by the chemical and electric environment from which it is sputtered. Thecomplications arising from this phenomenon have been known for almost as longas SIMS has been used as an analytical technique.22 It is the principal reason whyit is frequently inaccurately affirmed that SIMS is not a quantitative technique. Itcertainly can be very difficult, sometimes impossible; however, in many cases itis possible to quantify SIMS data. SIMS is not alone in being influenced by thematrix effect. MALDI in fact exploits the matrix effect to preferentially emit andionize some molecules rather than others. Yields from ESI are greatly influencedby the components in the electrospray jet and salts affect all ion yields in massspectrometry.23–25 The issue for SIMS is that there is now ample data to demon-strate that in any chemical system the other chemicals can enhance the ion yield ofa molecule such as, for example cholesterol, while in a system of differing compo-sition the ion yield might be suppressed.12,26–28 This has the consequence that it isimpossible to conclude that the absence of an ion in a spectrum or image impliesthe absence of the related molecule from a bio-system. Similarly, without muchbackground calibration work, it is not possible to conclude much about relativeamounts of a molecule from the observed ion yield. These issues can also compli-cate our understanding of an ion image. Relative yields of a single component indifferent regions of a sample may be influenced by the differing chemistry in each

Mahoney c08a.tex V1 - 01/18/2013 7:40pm Page 276
276 CHAPTER 8 CLUSTER ToF-SIMS IMAGING AND THE CHARACTERIZATION
region. This can go as far as total suppression of signal or gross enhancement (anexample will be shown later). Some researchers suggest that SIMS and MALDI canbe used in what they term a discovery mode, by which we understand that one canfind out the composition of an unknown sample. The ion yield and matrix effectissues mean that this is entirely impossible and could be a dangerous assumption.
The matrix effect has to be considered in experiment design and in dataassessment. Its mode of operation is not fully understood. A number of studieshave shown that gas phase basicity has a role where protonation is importantto generate [M + H]+ ions.19 Molecules with a high basicity scavenge protonssuppressing [M + H]+ ions of lower basicity components. Experiments have shownthat this suppression can be lifted to some degree by the supply of protons to thesystem.29,30
8.4.5 The Complexity of Biological Systems can Resultin Data Sets that Need Multivariate Analysis (MVA) to Unravel
Biological systems are the most complex that can be imagined. While the composi-tion of synthesized chemical systems are known, the detailed composition of evenwell-studied biological systems are not fully known. Add to this the increased com-plexity introduced by the matrix effect, understanding and interpreting the SIMSspectrum can be a daunting task. Where the task is to try to understand the dif-ference between samples or sets of samples, a “stare and compare” approach isimpossible and it is essential to use computational multivariate analysis (MVA)techniques.31 However, as many of these techniques are based on an assumptionof a linear variance between some chemical difference and the spectra, for theseto give useful results it is important to ensure that some irrelevant effect such asdifferences of sample preparation or analysis procedure does not interfere. In theend it is not too interesting to know that two samples or a series of samples areconfirmed to be different; the whole point of the application of MVA techniques isto provide insights into the chemical reasons for the differences. It is noticeable thatmany studies stop at demonstrating a difference rather than probing the chemistrythat seems to be the principal reason for using mass spectrometry in biologicalresearch.
8.5 EXAMPLES OF BIOLOGICAL STUDIESUSING CLUSTER-ToF-SIMS
When considering the use of ToF-SIMS to research a biological problem, it is obvi-ously important to take into account the capabilities and challenges presented by theequipment available. A crucial question is, “Is it possible to estimate whether themolecules to be studied can be detected at the concentration and spatial resolutiondesired?” Frequently it is suggested that ToF-SIMS using metal cluster primaryions is capable of sub-100 nm spatial resolution. However, we have seen that itis highly unlikely that any useful yield or distribution of molecular ions will bedetected at submicrometer resolution under static conditions. There are just too few

Mahoney c08a.tex V1 - 01/18/2013 7:40pm Page 277
8.5 EXAMPLES OF BIOLOGICAL STUDIES USING CLUSTER-ToF-SIMS 277
molecules in a pixel area below 1 μm taken together with the generally very lowion yields.
The ionization probability is a crucial factor that is little thought about. Itcan vary between 10−2 down to <10−6. This obviously has an enormous influenceon the detectability of molecules. It is essential to know something about theyields of molecules to be studied and if nothing is known, to carry out backgroundexperiments to investigate the issue. As mentioned earlier, lipids appear to be ofa suitable molecular size. In addition, their ion yield is high enough for detectionat physiological concentrations. As a consequence, one of the most successfulapplication areas for ToF-SIMS in biology has been the study of the role of lipids.There is an extensive ToF-SIMS literature reporting their detection in a range oftissues and cells. For example Table 8.1 provides a systematic list of lipid-relatedions identified in various mammalian tissue sections using ToF-SIMS and organizedusing the lipid classification system established by the Lipid MAPS consortium.17 Inmulticomponent biological systems the matrix effect will inevitably be a significantparameter affecting ion yields. It is vital to be aware of its possible influence.Many researchers just close their eyes to the possibility that it might have a role.Although it can be difficult to investigate with complex systems, its influencemust be factored into our interpretation of results, as failure to do this could havecatastrophic consequences, particularly in medically related studies.
If 2D and 3D studies are required by a research study, the relative benefits ofsingle beam polyatomic sputtering with simultaneous analysis, compared to inter-leaving analysis and sputtering using conventional pulsed beam ToF-SIMS needs tobe assessed. In principle, the former should provide more rapid analysis and higheryield with a considerable reduction in the stability of the sample, particularly whenanalysis in the frozen state is required.
8.5.1 Analysis of Tissue
In the characterization of tissue, ToF-SIMS offers dual functionality: for macroscalestudies where the whole tissue is of interest, the beam can be defocused to covera large field of view. For microscale analyses selected regions of interest can beprobed with a highly focused ion beam for a more detailed view and the gen-eration of 2D images. Rat brain sections have become a well-established modelsystem for tissue-based ToF-SIMS studies using both approaches for lipid-basedinvestigations. Sjovall and coworkers were the first to report a number of sulfogly-cosphingolipids (sulfatides) and cholesterol in the white matter of a rat brain as wellas glycerophospholipids molecules, specifically glycerphosphocholines (GPCho)and glycerophosphoinositols (GPIns), in the gray matter of a rat brain sectionusing a Bi3
+ metal cluster source.11,32 More recently, Benabdellah and coworkersin a fascinating study comparing the use of MALDI and ToF-SIMS, confirmedthese findings while imaging a sagittally sliced rat brain section, Figure 8.2.33
In addition to the variety of lipids identified in the sample, their analysis of thismodel system demonstrated the connection between spatial and chemical informa-tion allowing inferences to be made between anatomical features and physiologicalfunctions. For example, the coronal brain sections are distinguished by the large

Mahoney c08a.tex V1 - 01/18/2013 7:40pm Page 278
M: 1
84.1
pho
spho
chol
ine
head
gro
upm
c: 2
43, t
c: 3
.055
e+6
M: 3
85.4
[cho
lest
erol
- H
]+
mc:
15,
tc: 7
.654
e+5
M: 7
96.8
[PC
34:2
+K]+
or [P
E38
:1+N
a]+
mc:
15, t
c: 4
.041
e+4
M: 2
83.2
C18
::0 c
arbo
xyla
te io
nm
c: 4
0, tc
: 3.2
37e+
5M
: 429
.3 [V
itam
in E
-H]−
mc:
51,
tc: 1
.637
e+5
M: 8
88.9
[ST
24:
1-H
]−
mc:
40,
tc: 7
.664
e4R
: C16
:0 c
arbo
xyla
te io
nG
: [vi
tam
in E
-H]− ; B
: [S
T 1
8:0-
H]−
5 m
m(a
)(b
)(c
)
(e)
(f)
(g)
(h)(d)
5 m
m
Fig
ure
8.2
Sagi
ttal
sect
ion
ofra
tbr
ain:
(a–
d)SI
MS
imag
esob
tain
edin
the
posi
tive
mod
e—ph
osph
ocho
line
head
grou
p(m
/z18
4),
chol
este
rol
(m/z
385
and
796.
8)—
and
optic
alim
age
ofth
etis
sue;
(e–
h)SI
MS
imag
esob
tain
edin
the
nega
tive
mod
e—st
eari
c(1
8:
0)fa
ttyac
idfr
agm
ent
(m/z
283)
,vi
tam
inE
(m/z
429.
3),
and
sulf
ogly
cosp
hing
olip
id(s
ulfit
ide,
d18
:1/
24:
1)—
and
the
over
lay
ofth
ese
ions
.[f
atty
acid
(red
),vi
tam
inE
(gre
en),
and
sulfi
tide
(blu
e).]
Rep
rodu
ced
from
Ben
abde
llah
etal
.,33w
ithpe
rmis
sion
from
Spri
nger
Ver
lag.
278

Mahoney c08a.tex V1 - 01/18/2013 7:40pm Page 279
8.5 EXAMPLES OF BIOLOGICAL STUDIES USING CLUSTER-ToF-SIMS 279
region of cholesterol (m/z 369.3 and 385.3) that correlates to the corpus callosum.The negative ion at m/z 429, vitamin E is perfectly colocalized with cholesterol.Cholesterol and vitamin E are well known to be mostly located in the white matter,especially in the corpus callosum, where they also play a role in the axonal myelin-ization. The corpus callosum is a bundle of nerve fibers that bridges the right andleft hemispheres of the brain. To ensure efficient electrical signal conduct acrossthe corpus callosum, the neural fibers are coated with myelin sheath. Overall, thecorpus callosum is easily distinguished from the cerebral cortex and other regionsof the brain in SIMS images based on its distinct chemical composition. Thisaspect of the study does not challenge the spatial resolution of ToF-SIMS understatic SIMS conditions. The images were acquired by scanning a Bi3
2+ beam over87.5 × 87.5 μm2 pixels and moving the stage to deliver 256 × 256 pixel imagesover an area of 22.4 × 22.4 mm2. The molecules detected and displayed are inhigh concentration per pixel. Under these circumstances, the ion beam is oper-ated such that high mass resolution is possible. Nevertheless, the ion at m/z 796.8could have one of three structures: protonated phosphatidylethanolamine C40 : 4,or sodium cationized phosphatidylethanolamine C38 : 1, or potassium cationizedphosphatidylcholine C34 : 2. This illustrates the need for MS–MS facilities todistinguish the structure of these ions effectively. Overall, the study demonstratedthat MALDI generally delivered higher yields than ToF-SIMS at pixel sizes above50 μm. In the main the ion distributions for ions detected by both techniques werewell correlated in the 2D images. However, the ion m/z 796.8 referred to earlierwas perfectly anticorrelated in SIMS and MALDI images! This was attributed tothe matrix effect operating rather differently in the two systems and this illustratesthe importance of understanding how this can influence results.
The effects on ion yield of decreasing the pixel size being interrogated arealso very nicely illustrated (see Figure 8.3). When the pixel size was decreasedby a factor 44 from 87.5 to 2 μm, reducing the number of molecules per pixel by∼1900, the ion fluence could be increased from 8.4 × 10⁸ to 2.5 × 10¹¹ ions/cm2,an increase of ×300 to compensate to some extent while still staying below thestatic limit. The image contrast was maintained, the spatial resolution and detailvisible was much greater and the range of molecules detectable was about the same,although maximum counts per pixel were rarely above 10. Increasing the spatialresolution to 390 nm was only possible by moving to unit mass resolution, the iondose was increased to 2 × 10¹² ions/cm2 which is beyond the static limit for manymolecules.34,35 Even so, molecules above m/z 450 were undetectable. Other thanfragment ions with high ion yield, the maximum count per pixel was less than 2or 3 ions. Cholesterol and vitamin E are detectable and in both ion modes showsimilar localization, complementary to sulfatides, phosphocholine (PC) head group,or fatty acid fragments.
The capability of cluster primary ion ToF-SIMS illustrated here has beenexploited particularly by the group of Touboul et al. in a range of studies oflipid-related diseases, such as Duchenne muscular dystrophy,36,37 Fabry disease,38
nonalcoholic fatty liver disease,39 atherosclerosis,40 and cystic fibrosis,41 as wellas cancers. These diseases stem from dysfunctional metabolic processes and resultin abnormal concentrations of biomolecules. Chemical images across diseased

Mahoney c08a.tex V1 - 01/18/2013 7:40pm Page 280
280 CHAPTER 8 CLUSTER ToF-SIMS IMAGING AND THE CHARACTERIZATION
5 mm 100 μm 20 μm
M: 429.3 [Vitamin E-H]−
mc: 6, tc: 3.456e+4M: 429.3 [Vitamin E-H]−
mc: 51, tc: 1.637e+5M: 430.4 [Vitamin E]+
mc: 21, tc: 1.375e+5
(a) (b) (c)
Figure 8.3 256 × 256 Ion images of a sagittal rat brain section at three different levelsof spatial resolution. From left to right the pixel size decreases from 87.5 μm to 2 μm to390 nm. The ion dose increases from 8.4 × 10⁸ ions/cm2 to 2.5 × 10¹¹ ions/cm2 to 2 ×10¹² ions/cm2. The ion images originate from vitamin E. (a) and (c) are the negative ion atm/z 429.3, while (c) of the positive ion at m/z 430.4. The ion yields counts per pixel areindicated by the color coding, yellow representing the maximum. The range is 0–51 forthe 87.5 μm pixels in (a); 0–21 for the 2 μm pixels in (b), and 0–6 for the 390 nm pixelsin (c). Adapted from Benabdellah et al.,33 with permission from Springer Verlag.
tissue reveal areas of abnormal chemistry; such scarcity or overabundance of aparticular biomarker can link cellular dysfunction with anatomical specificity. LeNaour et al. found a higher concentration of unsaturated diacylglycerides (DAGS)and triacylglycerides (TAGS), as well as increased cholesterol signals in steatoticvesicles taken from an individual with fatty liver disease compared to normaltissue.39 While these studies are very impressive they do emphasize that even withthe benefits of cluster primary beams, ToF-SIMS is almost exclusively sensitiveto lipids and similar smallish molecules that (i) are present in quite significantconcentrations, (ii) can be lifted off the surface efficiently, and (iii) have relativelyhigh ion yields. To overcome these restrictions will require means to increasethe ionization probability. In this regard, the use of matrix-assisted SIMS isbeing explored using MALDI type matrices. As in the case of MALDI, thesematrices are able to extract molecules of interest to the surface and using protondonors, ionization to M + H ions can be encouraged. As already mentioned, thisapproach has enabled large peptides from tryptic digests to be analyzed using C60
+ToF-SIMS enabling the source proteins to be identified.16 Matrix assistance can beseen as a possible way forward for SIMS; however, the fact that a matrix has to beused means that this variant of SIMS cannot be said to be sample pretreatment free.
8.5.2 Drug Location in Tissue
One area within which imaging ToF-SIMS promises exciting new possibilitiesis drug discovery, especially as a replacement or a complementary technique toautoradiography and fluorescence microscopy for mapping the location of drugswithin tissue sections. However, these pharmaceutical compounds will be at a
Mahoney c08a.tex V1 - 01/18/2013 7:40pm Page 281
8.5 EXAMPLES OF BIOLOGICAL STUDIES USING CLUSTER-ToF-SIMS 281
much lower surface abundance than the native compounds that have been imagedin the past with SIMS. It is also likely that the drug will metabolize. It maybe the case that there are too few drug molecules within the upper monolayersto yield a detectable signal from the sample. It is in cases such as this that thelow damage accumulation seen with the polyatomic ion beams will be significantbecause analysis will not be restricted by the static limit, allowing full exploitationof all available molecules in a pixel or voxel.
To illustrate the possibilities and some of the challenges, Figure 8.4 showsthe mapping of the drug raclopride within a section of rat brain containing thestriatum from an animal dosed with the drug in vivo.35 The estimated concentra-tion of the drug in the bulk organ is in the region of 2 ppm as determined byESI-MS. Raclopride is a molecule that specifically binds to dopamine-D2 recep-tors within the brain, and a 11C-containing variant is commonly used in positronemission tomography (PET) to map the location of these receptors. The selectedion images shown in Figure 8.4a–c relate to the shaded area of the optical imagein Figure 8.4d. In order to identify the different domains within the section, thedistribution of the PC head group ion at m/z 184 (Fig. 8.4a) and cholesterol ion,m/z 369 (Fig. 8.4b), are shown. From the accompanying spectrum, peaks relatingto the [M + H]+ of the drug raclopride are clearly visible to the left of a clus-ter of peaks relating to cholesterol fragments within the drug containing sectionand absent from a representative control section spectrum. The distribution of thispeak was then imaged using the C60
+ ion beam and presented in Figure 8.4c.However, the distribution demonstrated by the SIMS analysis does not accuratelycorroborate with the known locations of D2 receptor sites.42 These data, whileencouraging with respect to detection levels, offer two possible explanations forthe result obtained, both of which involve common challenges encountered withSIMS and other mass spectrometry analysis. One possible explanation is that thereis redistribution of the drug within the sample on entering the vacuum. It has beenshown that cholesterol migration at room temperature can yield different resultsfrom the same tissue section depending on the temperature the sample is held atduring analysis,11 although there is much more to be understood of the mechanismsbehind this molecular movement. The other possible cause is the matrix effect. It isto be noted from Figure 8.4c that the [M + H]+ signal from the drug closely resem-bles the distribution of cholesterol (Fig. 8.4b) which is indicative of the myelin-richwhite matter of the brain. It has previously been shown that cholesterol can pro-vide a chemical environment that promotes the protonation of a species, while thephosphatidylcholine containing lipids act to suppress the [M + H]+ signal from atypical drug compound.26
In order to investigate whether a matrix effect could explain the results inFigure 8.4, a control section of rat brain was spin coated with 5 μl of a 1 ×10⁻³ M concentration solution of a related drug molecule, haloperidol, whichshould provide a submonolayer covering of the drug over the surface. When thetissue section was imaged, there were significant similarities to the raclopride resultin Figure 8.4. In Figure 8.5, the distribution of drug [M + H]+ signal (m/z 376)across two different domains of the tissue is shown. The signal from the PC headgroup (m/z 184) indicates the distribution of gray matter, while the peak from the

Mahoney c08a.tex V1 - 01/18/2013 7:40pm Page 282
0
2000
4000
6000
8000
10,0
00
(a)
(b)
(c)
(d)
250
250
275
275 40
0
200
600
300
300
325
325
350
350
355
360
345
400
200
1000 800
600
350
355
360
345
350
375
Mas
s -t
o- c
hang
e ra
tio
375
400
400
425
425
450
450
475
475
500
500
Sec
tion
cont
aini
ngra
clop
ride
Con
trol
sect
ion
0
2000
4000
6000
8000
10,0
00 0
2000
4000
6000
8000
10,0
00
Max
cou
nt: 1
6,25
5
Max
cou
nt: 2
130
(a)
(b)
(c)
(d)
Max
cou
nt: 2
47
m/z
369
m/z
347
250
250
275
275 40
0
200
600
300
300
325
325
350
350
355
360
345
400
200
1000 800
600
350
355
360
345
350
375
Mas
s -t
o- c
hang
e ra
tio
375
400
400
425
425
450
450
475
475
500
500
Sec
tion
cont
aini
ngra
clop
ride
Con
trol
sect
ion
m/z
184
0
2000
4000
6000
8000
10,0
00
ResponseF
igur
e8.
4A
SIM
Sim
agin
gin
vest
igat
ion
into
the
dist
ribu
tion
ofth
edr
ugra
clop
ride
from
ase
ctio
nta
ken
from
ara
tdo
sed
invi
vo.
Inth
ein
set
mas
ssp
ectr
a,th
elo
wer
spec
trum
dem
onst
rate
sth
epr
esen
ceof
the
[M+
H]+
ofth
era
clop
ride
atm
/z34
7w
ithits
isot
ope
peak
atm
/z34
9,w
hich
are
abse
ntfr
omth
eco
ntro
lsp
ectr
um.
The
imag
esar
esh
own
ona
ther
mal
scal
ean
dill
ustr
ate
the
dist
ribu
tion
of(a
)m
/z18
4fr
omph
osph
atid
ylch
olin
ehe
adgr
oup,
(b)
m/z
369
from
chol
este
rol,
and
(c)
m/z
347
from
the
drug
racl
opri
de,
the
max
imum
coun
tspe
rpi
xel
ofth
eio
nof
inte
rest
are
quot
ed.
Inal
lof
the
imag
es,
the
gree
npi
xels
repr
esen
tth
esu
bstr
ate.
The
optic
alim
age
(d)
show
sth
ear
eath
atw
asan
alyz
ed.
The
tota
lim
aged
area
was
1.6
×8.
0m
m,
with
anio
ndo
seof
8.8
×10
11io
n/cm
2.
Rep
rodu
ced
from
Jone
set
al.,35
with
perm
issi
onfr
omE
lsev
ier.
282
Mahoney c08a.tex V1 - 01/18/2013 7:40pm Page 283
8.5 EXAMPLES OF BIOLOGICAL STUDIES USING CLUSTER-ToF-SIMS 283
Max counts:727
Max counts:1247
Max counts:232
m/z 376m/z 369m/z 184
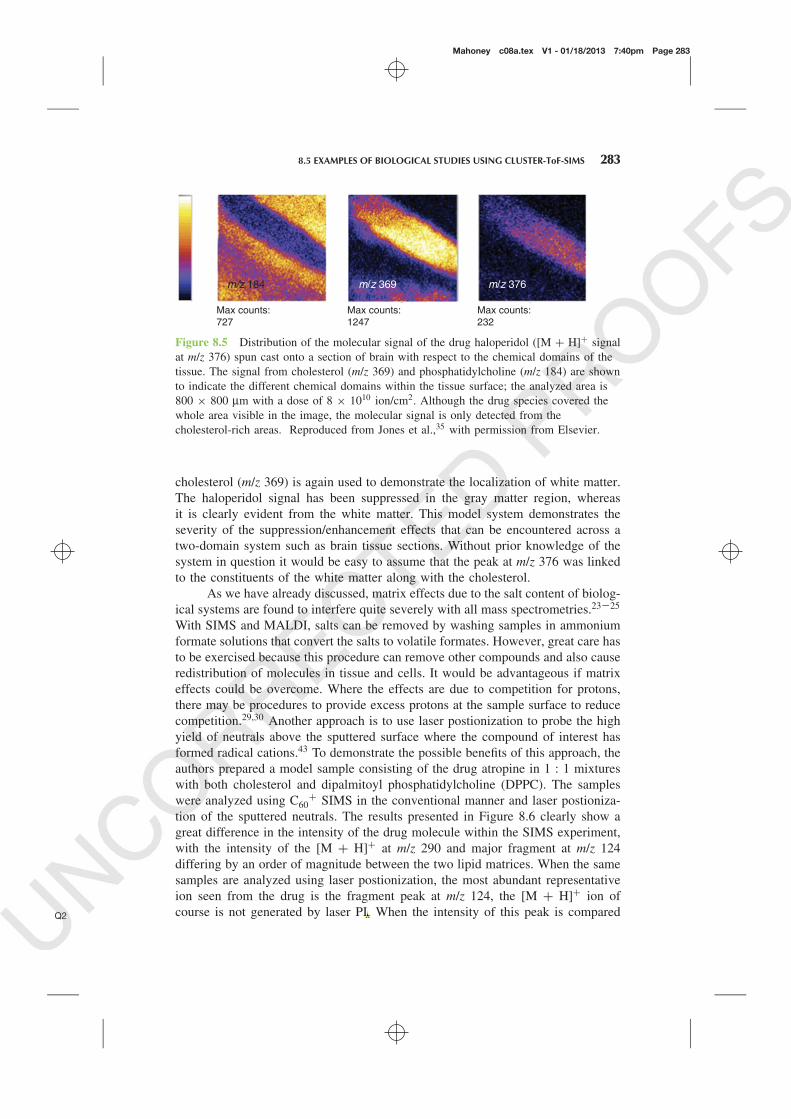
Figure 8.5 Distribution of the molecular signal of the drug haloperidol ([M + H]+ signalat m/z 376) spun cast onto a section of brain with respect to the chemical domains of thetissue. The signal from cholesterol (m/z 369) and phosphatidylcholine (m/z 184) are shownto indicate the different chemical domains within the tissue surface; the analyzed area is800 × 800 μm with a dose of 8 × 10¹⁰ ion/cm2. Although the drug species covered thewhole area visible in the image, the molecular signal is only detected from thecholesterol-rich areas. Reproduced from Jones et al.,35 with permission from Elsevier.
cholesterol (m/z 369) is again used to demonstrate the localization of white matter.The haloperidol signal has been suppressed in the gray matter region, whereasit is clearly evident from the white matter. This model system demonstrates theseverity of the suppression/enhancement effects that can be encountered across atwo-domain system such as brain tissue sections. Without prior knowledge of thesystem in question it would be easy to assume that the peak at m/z 376 was linkedto the constituents of the white matter along with the cholesterol.
As we have already discussed, matrix effects due to the salt content of biolog-ical systems are found to interfere quite severely with all mass spectrometries.23–25
With SIMS and MALDI, salts can be removed by washing samples in ammoniumformate solutions that convert the salts to volatile formates. However, great care hasto be exercised because this procedure can remove other compounds and also causeredistribution of molecules in tissue and cells. It would be advantageous if matrixeffects could be overcome. Where the effects are due to competition for protons,there may be procedures to provide excess protons at the sample surface to reducecompetition.29,30 Another approach is to use laser postionization to probe the highyield of neutrals above the sputtered surface where the compound of interest hasformed radical cations.43 To demonstrate the possible benefits of this approach, theauthors prepared a model sample consisting of the drug atropine in 1 : 1 mixtureswith both cholesterol and dipalmitoyl phosphatidylcholine (DPPC). The sampleswere analyzed using C60
+ SIMS in the conventional manner and laser postioniza-tion of the sputtered neutrals. The results presented in Figure 8.6 clearly show agreat difference in the intensity of the drug molecule within the SIMS experiment,with the intensity of the [M + H]+ at m/z 290 and major fragment at m/z 124differing by an order of magnitude between the two lipid matrices. When the samesamples are analyzed using laser postionization, the most abundant representativeion seen from the drug is the fragment peak at m/z 124, the [M + H]+ ion ofcourse is not generated by laser PI. When the intensity of this peak is comparedQ2

Mahoney c08a.tex V1 - 01/18/2013 7:40pm Page 284
284 CHAPTER 8 CLUSTER ToF-SIMS IMAGING AND THE CHARACTERIZATION
Atropine andcholesterol
0.00 0.00
0.05
0.10
0.15
0.20
0.30
0.25
0.35
0.40 SIMS withpost ionization
0.01
0.02
0.03
0.04
0.05
0.06
0.07
0.08
0.09 SIMSm/z 290
m/z 124 m/z 124
Atropine andcholesterol
Nor
mal
ized
sig
nal
inte
nsity
of a
trop
ine
Nor
mal
ized
sig
nal
inte
nsity
of a
trop
ine
Atropine andDPPC
Atropine andDPPC
Figure 8.6 The analysis of a drug molecule mixed with two abundant biological lipids:cholesterol and DPPC. The SIMS analysis, reliant upon ionization at or just above thesurface demonstrates strong differences between the ionization probability of the drugatropine to its [M + H]+ ion (m/z 290) and major fragment (m/z 124), whereas when themolecule is laser postionized the difference is negligible within experimental error. The ionused to identify the atropine in the laser postionization was a characteristic fragment atm/z 124. Reproduced from Jones et al.,35 with permission from Elsevier.
across the two samples, the difference is negligible within experimental error. Thissuggests that the same amount of the drug molecule is present at the surface tobe sampled, and the same number are being sputtered into the vacuum; however,the nature of the sample has a great effect on the percentage of these moleculesthat enter the vacuum in a charged state. Clearly, there are potential benefits ofseparating the desorption and ionization steps within surface mass spectrometry.
8.5.3 Microbial Mat—Surface and Subsurface Analysisin Streptomyces
Polyatomic primary ions not only offer the possibility of good sensitivity in 2Dimaging at micrometer spatial resolution, their use also offers the possibility of delv-ing into the subsurface chemistry. An early biological investigation that illustratedthese capabilities was a study by Vaidyanathan et al. of the antibiotic productionof the mycelial, soil-dwelling microorganism Streptomyces coelicolor. S. coeli-color is a member of the actinomycetes family of gram-positive bacteria, whichare prolific in the production of secondary metabolites of therapeutic importance.The microorganism produces at least four antibiotics, including methylenomycin,calcium-dependent-antibiotic (CDA), actinorhodin (a blue pigment), and undecyl-prodigiosin (a red pigment). Normally, actinorhodin is produced in excess ofundecylprodigiosin. Under salt stress growth conditions (2.5% NaCl), the trendis reversed and the red pigment is observed at the surface in excess of the blue.However, little was known about the distribution of these antibiotics within thebacteria. A detailed ToF-SIMS study of the bacteria under normal and salt-stressedculture conditions was recently performed where depth profiling of the bacteriawas carried out using C60
+.44 A bacterial suspension was transferred to a pieceof a silicon wafer and the bacteria were heat fixed for analysis in the ToF-SIMS
Mahoney c08a.tex V1 - 01/18/2013 7:40pm Page 285
8.5 EXAMPLES OF BIOLOGICAL STUDIES USING CLUSTER-ToF-SIMS 285
20 μm
00
0.00 753.42
10
10
15
15
5
5
[μm]
[μm] [μm
]
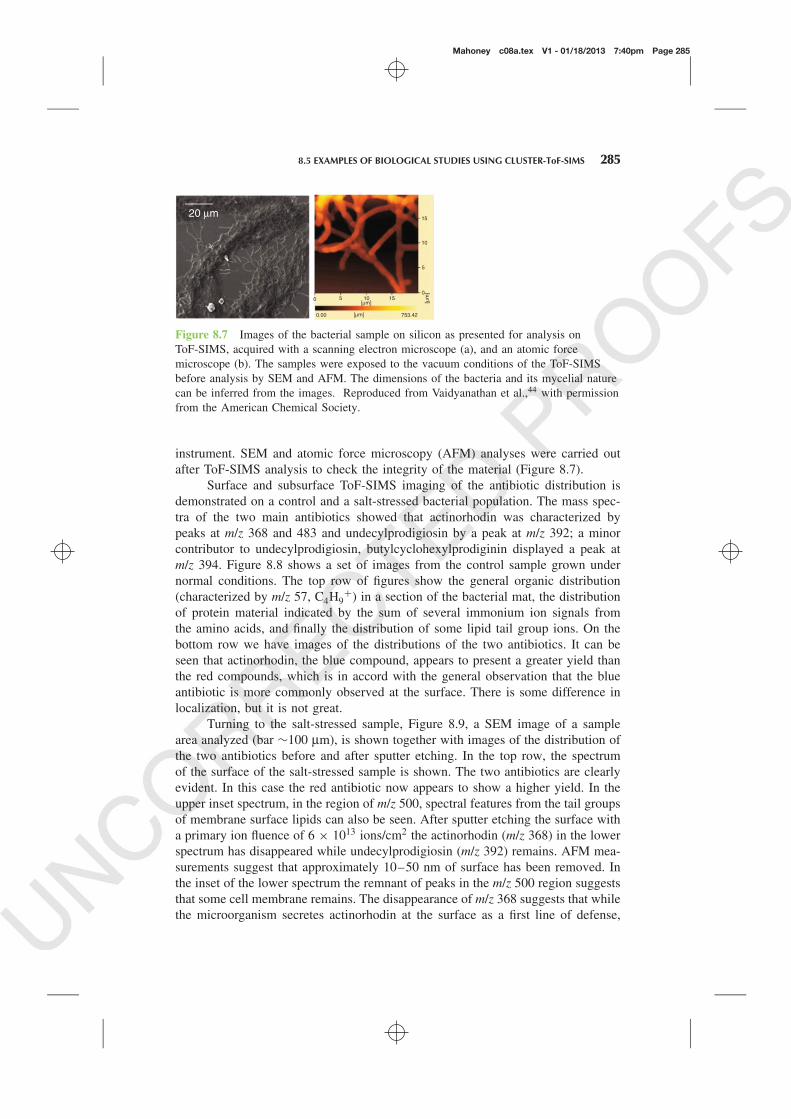
Figure 8.7 Images of the bacterial sample on silicon as presented for analysis onToF-SIMS, acquired with a scanning electron microscope (a), and an atomic forcemicroscope (b). The samples were exposed to the vacuum conditions of the ToF-SIMSbefore analysis by SEM and AFM. The dimensions of the bacteria and its mycelial naturecan be inferred from the images. Reproduced from Vaidyanathan et al.,44 with permissionfrom the American Chemical Society.
instrument. SEM and atomic force microscopy (AFM) analyses were carried outafter ToF-SIMS analysis to check the integrity of the material (Figure 8.7).
Surface and subsurface ToF-SIMS imaging of the antibiotic distribution isdemonstrated on a control and a salt-stressed bacterial population. The mass spec-tra of the two main antibiotics showed that actinorhodin was characterized bypeaks at m/z 368 and 483 and undecylprodigiosin by a peak at m/z 392; a minorcontributor to undecylprodigiosin, butylcyclohexylprodiginin displayed a peak atm/z 394. Figure 8.8 shows a set of images from the control sample grown undernormal conditions. The top row of figures show the general organic distribution(characterized by m/z 57, C4H9
+) in a section of the bacterial mat, the distributionof protein material indicated by the sum of several immonium ion signals fromthe amino acids, and finally the distribution of some lipid tail group ions. On thebottom row we have images of the distributions of the two antibiotics. It can beseen that actinorhodin, the blue compound, appears to present a greater yield thanthe red compounds, which is in accord with the general observation that the blueantibiotic is more commonly observed at the surface. There is some difference inlocalization, but it is not great.
Turning to the salt-stressed sample, Figure 8.9, a SEM image of a samplearea analyzed (bar ∼100 μm), is shown together with images of the distribution ofthe two antibiotics before and after sputter etching. In the top row, the spectrumof the surface of the salt-stressed sample is shown. The two antibiotics are clearlyevident. In this case the red antibiotic now appears to show a higher yield. In theupper inset spectrum, in the region of m/z 500, spectral features from the tail groupsof membrane surface lipids can also be seen. After sputter etching the surface witha primary ion fluence of 6 × 10¹³ ions/cm2 the actinorhodin (m/z 368) in the lowerspectrum has disappeared while undecylprodigiosin (m/z 392) remains. AFM mea-surements suggest that approximately 10–50 nm of surface has been removed. Inthe inset of the lower spectrum the remnant of peaks in the m/z 500 region suggeststhat some cell membrane remains. The disappearance of m/z 368 suggests that whilethe microorganism secretes actinorhodin at the surface as a first line of defense,

Mahoney c08a.tex V1 - 01/18/2013 7:40pm Page 286
286 CHAPTER 8 CLUSTER ToF-SIMS IMAGING AND THE CHARACTERIZATION
m/z 368
m/z 57 ProteinLipids m/z500−600
m/z 390−395
1
0.8
0.8
0.6
0.6
0.35
0.3
0.25
0.2
0.15
0.1
0.08
0.05
0.1
0.15
0.06
0.04
0.02
0.4
0.4
0.2
Figure 8.8 Images acquired using 40 keV C60+ of the control sample of S. coelicolor
grown under normal conditions. The images are 128 × 128 pixels from a 200 × 250 μmfield of view, total ion fluence <1013 cm−2. The images are normalized to total ion countat each pixel. Protein is the sum of ion counts for the immonium ions at m/z 30, 44, 70,84, 86, and 110. Reproduced from Vaidyanathan et al.,44 with permission from theAmerican Chemical Society.
when under stress the red pigments are generated in excess in the subsurface as asecond line of defense. This ability to depth profile molecules in a biological matrixopens up exciting possibilities. In this example, a heterogeneous bacterial mat hasbeen studied. There was no attempt to determine accurately the depth removed inuncovering the surface; however, useful and biologically interesting informationwas extracted. The issues involved in more quantitative depth profiling and theprospect for three dimensional imaging will be explored in the next section.
8.5.4 Cells
Analysis and imaging of single cells using ToF-SIMS challenges the capabilityof securing adequate ion yield from small areas. The dimensions of most bio-logical cells lie between 10 and 50 μm in diameter; this means that to locateand distinguish the spatial distribution of chemistry requires spatial resolution ofaround 1 μm, preferably submicrometer. There are some cell systems with verylarge dimensions that have allowed studies to be carried out which demonstratethe potential offered by ToF-SIMS analysis. A recent study that combined MALDIand C60 —ToF-SIMS using the Q-Star ortho-ToF instrument referred to earlierinvestigated the lipid composition of a single neuron from an Aplysia californica

Mahoney c08a.tex V1 - 01/18/2013 7:40pm Page 287
Sur
face
mem
bran
e
Sub
surf
ace
afte
r C
60 e
tch
SE
M
m/z
368
m/z
390
–395
00
5000
10,0
00
1000
2000
3000
4000
200
400
600
800
200
400
600
800
350
400
450
500
550
600
300
350
400
450
500
550
600
300
Fig
ure
8.9
Spec
tra
and
imag
esac
quir
edus
ing
40ke
VC
60+
ofth
esa
lt-st
ress
edsa
mpl
eof
S.co
elic
olor
.T
heup
per
spec
trum
and
imag
essh
owth
eQ
3yi
eld
and
dist
ribu
tion
ofth
etw
oan
tibio
tics
atth
esu
rfac
eof
a20
0×
250
μm2
area
ofth
eba
cter
ial
mat
.T
helo
wer
spec
trum
and
imag
essh
owth
eyi
eld
and
antib
iotic
dist
ribu
tion
ofth
esu
bsur
face
unco
vere
dfo
llow
edsp
utte
ring
with
aC
60+
fluen
ceof
1013
cm−2
.R
epro
duce
dfr
omV
aidy
anat
han
etal
.,44w
ithpe
rmis
sion
from
the
Am
eric
anC
hem
ical
Soci
ety.
287

Mahoney c08a.tex V1 - 01/18/2013 7:40pm Page 288
288 CHAPTER 8 CLUSTER ToF-SIMS IMAGING AND THE CHARACTERIZATION
sea slug.45 The neuron dimensions are in the millimeter range and despite thelimited imaging capability of the Q-star, a clear total ion image could be acquired,Figure 8.10d. SIMS and MALDI spectra were compared. The major peaks in theSIMS spectra are found at m/z 709.5, 719.5, 725.5, 768.5, and 784.5, Figure 8.10a,whereas the major peaks in the MALDI spectrum were m/z 746.5, 768.5, and796.5, Figure 8.10b. The lipid molecular ion at m/z 746.5 produces a peak atm/z 768.5 when it attaches to a sodium ion, and this species is observed in bothspectra. Loss of −N(CH3)3 yields the expected fragment at m/z 709.5. In order toconfirm this idea, tandem MS was needed and was available by exploiting the qToFconfiguration of the Q-star. The precursor ions can be selected by the scanning thequadrupole and these are fragmented in a quadrupole collision cell. The resultingfragments are analyzed using the ToFMS. Unfortunately, the yield of precursor ionsusing SIMS was not sufficient to carry out MS–MS analysis so the ions at m/z 746.5and 768.5 were studied in the MALDI mode. The tandem MS spectra produced184.07 fragments, Figure 8.10c, typically associated with glycerophosphocholineand sphingomyelin. Although sphingomyelin lipids also produce a characteristic
(a) (b)
(d)(c) Mass-to-charge ratio
Mass-to-charge ratio Mass-to-charge ratio700 750 800 850650 700 750 800 850650
Inte
nsity
Inte
nsity
Inte
nsity
25
150
0.020
5
746
796768
10
15
20
25
30
35
0.04
0.06
0.08
0.10
697
703
709
719725 786
768735
756
184
709
768
200
100 200 300 400 500 600 700 800
Figure 8.10 Lipid profile obtained from a single neuron with SIMS (a) and from acompilation of neurons with MALDI (b). The tandem MS spectrum shows that m/z 709and 184 are major fragments of m/z 768.5, the sodiated adduct of major lipid componentm/z 746.5 (c). Optical image (d, left) and black and white SIMS total ion image (d, right)of cultured aplysia neuron on silicon wafer (image size 2.00 × 4.75 mm). Reproducedfrom Passerelli and Winograd,45 with permission from John Wiley & Sons.

Mahoney c08a.tex V1 - 01/18/2013 7:40pm Page 289
8.5 EXAMPLES OF BIOLOGICAL STUDIES USING CLUSTER-ToF-SIMS 289
184.07 fragment group and are abundant in neurons, the nitrogen group in thesphingosine moiety produces only odd molecular ion species.46 Therefore, fromthe characteristic fragmentation peak and the odd–even parity, the authors wereable to deduce that the m/z 746 is most likely a glycerophosphocholine lipid.Tandem MS of the m/z 768.5 peak produces an m/z 709.5 peak and confirms thefragmentation pathway theory. On the basis of information obtained, it was possibleto reduce the possible lipid contributing to peak m/z 746.5 to the following lipids:a diacylglycerophospholipid with fatty acid constituents consisting of 33 carbonsand one double bond (33a : 1 GPCho, 746.5779 Da), an ether glycerophospholipid(34e : 1 GPCho, 746.6143 Da), and a plasmalogen glycerophospholipid (34p : 0GPCho, m/z 746.6143). This demonstrates the value and limitations of MS–MS.Without other separation methods such as ion mobility it will not be possible todistinguish the latter two molecules.
The first attempt to probe the 3D distribution of chemistry in a single cellalso exploited a large cell system to make the study less challenging. The researchfocused on a freeze-dried Xenopus laevis oocyte (a frog’s egg) using a 40 keV C60
+
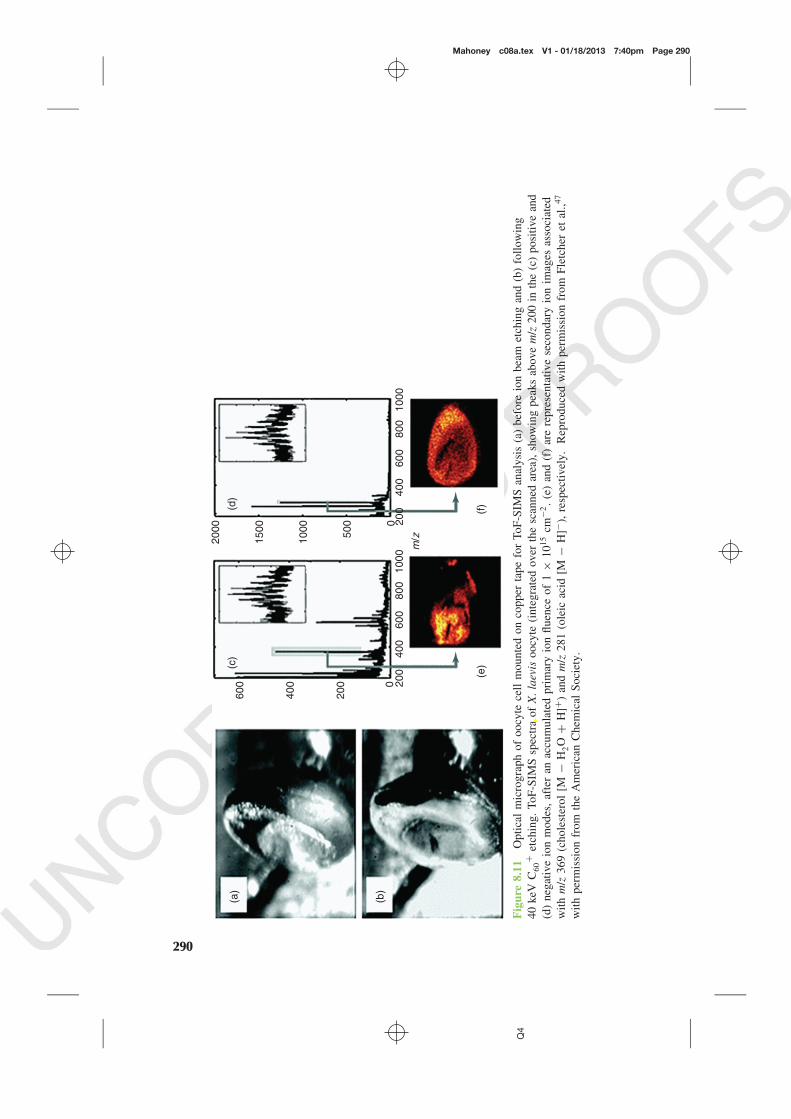
ion beam for both sputtering and analysis.47 The frog’s egg is approximately 1 mmin diameter and the size meant that topography effects were important in assess-ing the data generated. However, the study did demonstrate that the experimentalapproach is feasible and that molecular information continued to be accessible evenafter the removal of more than 100 μm of cell and that the spatial distribution ofspecific molecules in a cell could be described. Figure 8.11 shows the cell beforeand after depth profile analysis, together with the positive and negative ion spectraused to reconstruct the chemical images.
The study used a conventional pulsed ion beam ToF-SIMS system and, as aconsequence, took many days of sputter etching and analysis. A total ion fluence of106 cm−2 was used. The intense peak at m/z 369 is attributed to the cholesterol [M +H − H2O]+. The m/z 540–700 envelop contains peaks at m/z 548, 574, and 576 thatcan be attributed to phosphatidylcholines with fatty acid side chains of compositionC16 : 0, C18 : 2, and C18 : 1, respectively, without the phosphocholine head group.These assignments are corroborated by the detection of the corresponding fatty acidpeaks in the negative ion spectra at m/z 255, 279, and 281 for fatty acid side chainsof composition C16 : 0, C18 : 2, and C18 : 1, respectively. These lipids correspondto the three found most abundantly in analyses of biological cell extractions. Thereis a similar set of molecular ion peaks between m/z 800 and 1000. By generatinga stack of 2D images for a particular m/z or range of m/z values, it is possible toput together a 3D image as shown on the left-hand side of Figure 8.12.
The right-hand side of Figure 8.12 shows the distribution of four lipidmolecules within the volume of oocyte analyzed. Three-dimensional images, whileuseful in providing qualitative pictures of the distribution of specific chemistry arenot always very useful in giving an idea of relative signal intensities as a functionof location. One way to help assess relative intensities is to use the isosurfacetechnique. The isosurface highlights regions of pixels with intensity values above aspecified threshold. By selecting a high threshold, regions of high intensity can beclearly visualized. Low thresholds, just excluding noise, can be used to visualize the
Mahoney c08a.tex V1 - 01/18/2013 7:40pm Page 290
(a)
(b)
(c)
(d)
(e)
(f)
00
500
1000
1500
2000
200
400
600 20
040
060
080
010
0020
040
060
080
010
00
m/z
Fig
ure
8.11
Opt
ical
mic
rogr
aph
ofoo
cyte
cell
mou
nted
onco
pper
tape
for
ToF-
SIM
San
alys
is(a
)be
fore
ion
beam
etch
ing
and
(b)
follo
win
gQ
440
keV
C60
+et
chin
g.To
F-SI
MS
spec
tra
ofX
.la
evis
oocy
te(i
nteg
rate
dov
erth
esc
anne
dar
ea),
show
ing
peak
sab
ove
m/z
200
inth
e(c
)po
sitiv
ean
d(d
)ne
gativ
eio
nm
odes
,af
ter
anac
cum
ulat
edpr
imar
yio
nflu
ence
of1
×10
15cm
−2.
(e)
and
(f)
are
repr
esen
tativ
ese
cond
ary
ion
imag
esas
soci
ated
with
m/z
369
(cho
lest
erol
[M−
H2O
+H
]+)
and
m/z
281
(ole
icac
id[M
−H
]−),
resp
ectiv
ely.
Rep
rodu
ced
with
perm
issi
onfr
omFl
etch
eret
al.,47
with
perm
issi
onfr
omth
eA
mer
ican
Che
mic
alSo
ciet
y.
290

Mahoney c08a.tex V1 - 01/18/2013 7:40pm Page 291
(a)
(b)
(c)
(d)
(e)
(f)
Fig
ure
8.12
Thr
ee-d
imen
sion
alim
agin
gof
part
ofth
eX
enop
usla
evis
oocy
te.
(aan
dd)
show
how
asse
mbl
ing
ast
ack
of2D
imag
esen
able
sa
3Dim
age
tobe
prod
uced
,(b
,c,
e,an
df)
show
the
dist
ribu
tion
offo
urdi
ffer
ent
lipid
sin
the
oocy
tese
ctio
n.R
epro
duce
dw
ithpe
rmis
sion
from
Flet
cher
etal
.,47w
ithpe
rmis
sion
from
the
Am
eric
anC
hem
ical
Soci
ety.
291
Mahoney c08a.tex V1 - 01/18/2013 7:40pm Page 292
292 CHAPTER 8 CLUSTER ToF-SIMS IMAGING AND THE CHARACTERIZATION
sample as a whole. Thus, for this particular example, Figure 8.13 shows isosurfaceplots for the lipid head group m/z 184 with a low threshold so the whole cell isseen, the cholesterol fragment at m/z 369 with a median threshold, and the lipid lessthe head group fragments at m/z 540–600 with a high threshold showing that theyare in high concentration in the outer membrane region. Although this exampleshowed what is possible in principle, the cell was so large that spatial resolutionwas not challenged and yields were high for the molecules imaged. The topographyof the cell was such that, although the cell-like structure is evident, no accuracycan be claimed in terms of the observable cell dimensions.
The frog egg study has been taken further using the J105 buncher-ToF-SIMSsystem and a DC C60
+ primary beam. The mode of operation of the J105 meansthat samples of complex geometry such as the frog’s egg can be analyzed withrelative ease. Figure 8.14 shows that the chemical changes during the cellulardivision associated with embryo development after fertilization can be followedin some detail (Tian et al., Unpublished Work and Reference 48). Furthermore, itis possible to focus on specific areas of the egg following cell division and thecells can be imaged and depth profiled. It can be seen that cellular lipid contentscan be discerned that have been associated with Golgi structures. Linking theseobservations with the biology of embryo development is challenging; however,what is very clear is that ToF-SIMS imaging using C60
+ is an effective means forprobing the chemistry of large single cells in three dimensions.
The studies described so far have been concerned with large cells. Goodyields of molecules and fragments have been detected because pixel areas of manysquare micrometers have been sampled. However, most cells of interest are below50 μm in diameter. There have been a number of studies that have explored the useof normal rat kidney (NRK) cells and HeLa cells as model systems to uncover thecapability of SIMS in 2D and 3D imaging. Two approaches have been used: thefirst combines liquid metal cluster beams for analysis and 2D imaging and C60
+for sputter etching on a pulsed beam ToF-SIMS. The second has used a DC C60
+beam for sputtering with simultaneous collection of secondary ions to generateeither 2D or 3D images using the J105 instrument (Fig. 8.15).Q5
A study by Breitenstein et al. illustrates the first approach.49 NRK cells werestudied whose cellular architecture is well known. The cells are approximately 20μm in diameter. Six confluent layers of cells, grown on cover slips under ordinarycell-culture conditions, were analyzed using ToF-SIMS after the cells had beenstabilized with chemical fixation. In this case, the layers were removed by 10 keVC60
+ sputtering and analysis was carried out using a metal cluster ion beam, 25 keVBi3
+. The authors were only able to clearly detect cholesterol, phospholipids, andimmonium ions from the amino acids in proteins. The figure associated with thiswork was presented earlier in Chapter 1 (Fig. 1.8). Figure 1.8a–d shows the 2Dxy distributions after the forty-fifth sputter cycle with amino acid fragments inred, phosopholipids in green, and substrate peaks in blue. These are overlaid inFigure 1.8d. The depth profile experiment collects the data such that the observedxz distribution appears as a vertical inverse of the actual distribution in the cellssitting on a flat surface, as shown in Figure 1.8e. The authors carried out a mathe-matical transformation to provide a presentation that mirrors the real distribution,

Mahoney c08a.tex V1 - 01/18/2013 7:40pm Page 293
8.5 EXAMPLES OF BIOLOGICAL STUDIES USING CLUSTER-ToF-SIMS 293
m/z 184 m/z 369 m/z 540–600
Figure 8.13 Isosurface representation of C60 depth profile of oocyte. See text for details.
1200 × 1200 μm,Total ion m/z 86 Phosphocholine m/z 184 PC
ST3
ST5
ST6
ST8
ST1
m/z 369 Cholesterol m/z 577 Glycerol lipid
Figure 8.14 Biochemical changes at successive stages of embryo development after frogzygote fertilization as monitored by the J105 3D Chemical Imager using a DC 40 keVC60
+ primary beam. The images track the early development stages of embryo. The firstcolumn shows the total ion images at each stage. The morphographic changes are clearlyseen here, from two cells to hundreds of cells on the animal side of the embryo. Someimportant biomolecules located on the surface are imaged. Phosphocholine lipids aremainly distributed at cell junctions. Cholesterol occurs all over the cell except at stage 3.At stage 8, phosphocholine lipids and cholesterol appear to be distributedcomplementarily. Reproduced with permission from Malmberg et al.,40 with permissionfrom the Royal Society of Chemistry.
Mahoney c08a.tex V1 - 01/18/2013 7:40pm Page 294
294 CHAPTER 8 CLUSTER ToF-SIMS IMAGING AND THE CHARACTERIZATION
300 μm, 128 pixel
Total + SIMS
Total + SIMS image ofSt.8 embryo afterdepth profiling
m/z 369+ cholesterol
m/z 184+ phosphocholine
1200 μm, 256 pixel
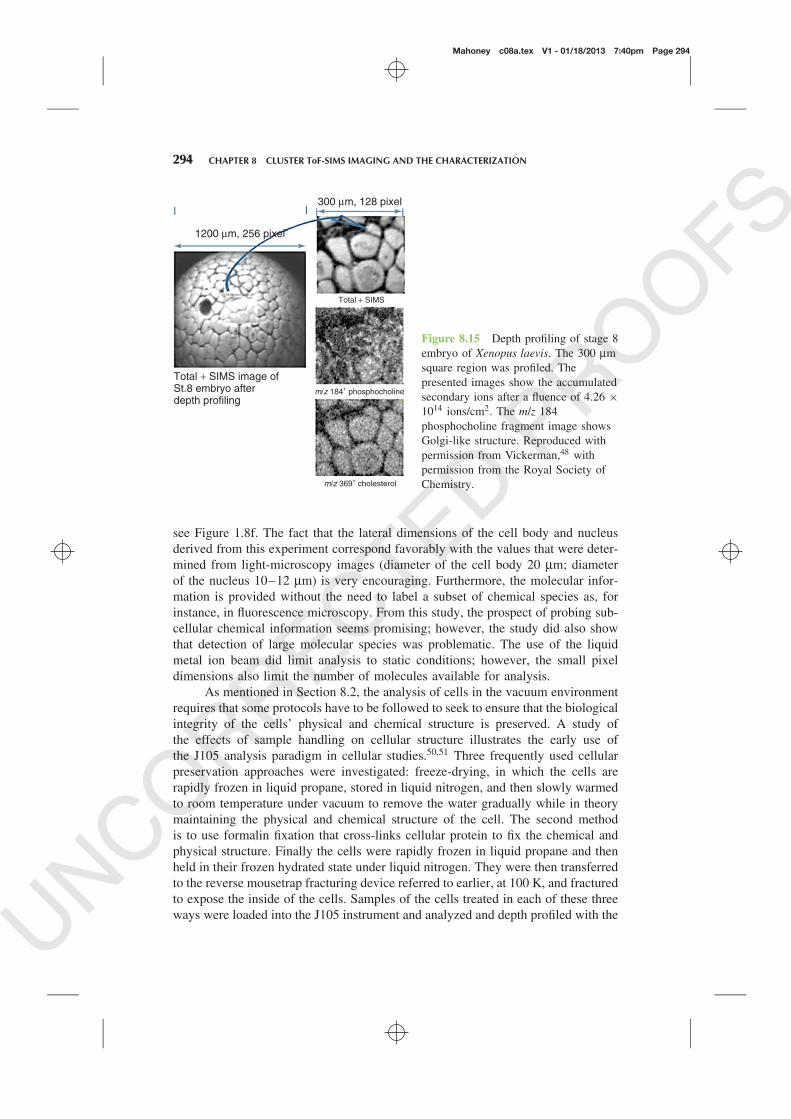
Figure 8.15 Depth profiling of stage 8embryo of Xenopus laevis. The 300 μmsquare region was profiled. Thepresented images show the accumulatedsecondary ions after a fluence of 4.26 ×10¹⁴ ions/cm2. The m/z 184phosphocholine fragment image showsGolgi-like structure. Reproduced withpermission from Vickerman,48 withpermission from the Royal Society ofChemistry.
see Figure 1.8f. The fact that the lateral dimensions of the cell body and nucleusderived from this experiment correspond favorably with the values that were deter-mined from light-microscopy images (diameter of the cell body 20 μm; diameterof the nucleus 10–12 μm) is very encouraging. Furthermore, the molecular infor-mation is provided without the need to label a subset of chemical species as, forinstance, in fluorescence microscopy. From this study, the prospect of probing sub-cellular chemical information seems promising; however, the study did also showthat detection of large molecular species was problematic. The use of the liquidmetal ion beam did limit analysis to static conditions; however, the small pixeldimensions also limit the number of molecules available for analysis.
As mentioned in Section 8.2, the analysis of cells in the vacuum environmentrequires that some protocols have to be followed to seek to ensure that the biologicalintegrity of the cells’ physical and chemical structure is preserved. A study ofthe effects of sample handling on cellular structure illustrates the early use ofthe J105 analysis paradigm in cellular studies.50,51 Three frequently used cellularpreservation approaches were investigated: freeze-drying, in which the cells arerapidly frozen in liquid propane, stored in liquid nitrogen, and then slowly warmedto room temperature under vacuum to remove the water gradually while in theorymaintaining the physical and chemical structure of the cell. The second methodis to use formalin fixation that cross-links cellular protein to fix the chemical andphysical structure. Finally the cells were rapidly frozen in liquid propane and thenheld in their frozen hydrated state under liquid nitrogen. They were then transferredto the reverse mousetrap fracturing device referred to earlier, at 100 K, and fracturedto expose the inside of the cells. Samples of the cells treated in each of these threeways were loaded into the J105 instrument and analyzed and depth profiled with the

Mahoney c08a.tex V1 - 01/18/2013 7:40pm Page 295
8.5 EXAMPLES OF BIOLOGICAL STUDIES USING CLUSTER-ToF-SIMS 295
40 keV C60+. A series of 2D chemical images of successive layers were acquired
by accumulating the secondary ions generated between each layer. The 2D imageswere then combined to produce a 3D image. Unlike the situation with pulsed beamToF-SIMS instruments, the vast majority of material sputtered from the cells wasused in generating the analysis data enabling a higher ion yield per pixel (voxel).Figure 8.16 compares selected 2D images at three stages through each of the cellsystems, top surface, after removal of several layers and then several further layersdeeper in. Two ions have been used to image the cells, m/z 184 corresponding to thephosphocholine lipid head group that is mainly to be found in the cell membraneand m/z 120 corresponding to an amino acid, phenylalanine associated with proteinin the cell nucleus. It should be remembered that the data shown represent secondaryions accumulated with ion fluences well beyond the static limit.
There is a clear difference between the three systems right from the start.The frozen hydrated freeze-fractured sample shows a ring of m/z 184 with m/z120 in the center demonstrating that the cells had indeed been fractured. Themembrane material is clearly separately located from the nucleus as the cell isprofiled. The freeze-dried cells show a rather dispersed distribution of m/z 184 atthe start and as the cells are profiled, m/z 120 does begin to appear, indicating thata membrane has been removed, but both ions are still quite dispersed and not asclearly located as they are for the frozen-hydrated sample suggesting that perhaps
Frozenhydratedfreezefractured
Increase in primary ion fluence
Freezedried
Formalinfixed
(a) (b) (c)
(f)(e)(d)
(g) (h) (i)
Figure 8.16 A comparison of three different sample preparations, freeze-fracture,frozen-hydrated (a–c), freeze-dried (d–f), and formalin fixed (g–i) for the m/z 184.06(green) and m/z 120.10 (red) shown in color-overlay. The figure shows an increase inprimary ion fluence from left to right with each layer obtained using a fluence of 3 × 10¹³
ions/cm2 acquired over a field of view 256 × 256 μm2 and 256 × 256 pixels.Reproduced from Rabbani et al.,50 with permission from John Wiley & Sons.

Mahoney c08a.tex V1 - 01/18/2013 7:40pm Page 296
296 CHAPTER 8 CLUSTER ToF-SIMS IMAGING AND THE CHARACTERIZATION
the sample pretreatment does not maintain the original cellular distribution as wellas is hoped. Finally, the fixed cells seem to be much larger than the other two atthe start. There are suggestions that the fixing process can expand the cell volumeand the data would support this. As the cell is profiled, the membrane and nuclearcomponents seem to be quite well localized however, and it is noteworthy thatone cell shows evidence of mitosis giving rise to two nuclei. This imaging datahave been complemented by assembling the data into depth profiles for the fixed-and frozen-hydrated samples, Figure 8.17. These show that for the frozen hydratedsample, as expected, membrane m/z 184 and nuclear material are evident at thesurface. Nuclear material, in this case m/z 136 from adenine, is predominant inthe center and membrane is evident just before reaching the substrate. The frozen-hydrated sample seems to preserve the physical and chemical state of the cell ratherwell. The profile for the fixed sample indicates some mixing of the nuclear materialinto the membrane in both the upper and lower regions of the cell, suggesting thatthe fixing chemistry may interfere with the original chemical distribution.
Overall, the data suggest that it may well be advantageous to carry out anal-yses in the frozen-hydrated state. The data assembled during this study has beenused to produce a 3D representation of the cell structure and from these to producemovies to explore the structural distribution of cellular components. This 3D imag-ing data was presented in Chapter 6 (Fig. 6.26).51 Such data present significantchallenges in data handling as the raw data files that provide the information forthe 3D images amount to many gigabytes.
A similar study of cell pretreatment for vacuum analysis has also been fol-lowed recently by Castner et al. using the liquid metal ion beam analysis with C60
+sputtering approach.52 In this study, a somewhat different set of treatments weretried. The control set was a brief wash in ammonium acetate followed by drying inair. Figure 8.18 shows images of some of the positive ions detected immediatelyupon analysis, followed by the result of a sputter cycle 1 1 × 10¹⁴ 20 keV C60 ions.It can be seen that the C60 etch cleans up the substrate surface and also removesthe phospholipid membrane (sum of peaks at m/z 58, 86, and 184) uncovering the
Q7
nuclear area in the center. The K/Na ratio is now higher in the cell than outsideit. When images are taken at higher resolution, the subcellular structure is clearlyseen. In the negative ion images, ions associated with nucleic acids in the cell’snucleus are observed. Figure 8.19 shows a series of images of before and after C60sputtering from samples prepared by other preparation protocols. It is interestingthat in all cases the cell morphology is different from the control set, which seemsto be closer to what might be expected. The authors suggest that the best resultwas obtained when the short ammonium rinse was followed by plunge-freezing inliquid ethane and freeze-drying, Figure 8.20e. They argue that this method resultedin an optimal K/Na ratio inside the cells, as well as the preservation of morphol-ogy with minimal membrane damage. It is not entirely clear why they believe itis better than their frozen hydrated sample Figure 8.19d. Certainly the abovemen-tioned result seemed to suggest that the use of frozen hydrated samples was tobe preferred. However, they do believe it is more important to observe that C60“cleaning” always resulted in the removal of surface contamination, which madeimaging of subcellular features possible.

Mahoney c08a.tex V1 - 01/18/2013 7:40pm Page 297
8.5 EXAMPLES OF BIOLOGICAL STUDIES USING CLUSTER-ToF-SIMS 297
00
500
1000
2000
2500
3000
1500
00 2 4 6 8 10
1000
2000
3000
4000
5000
6000
2 4 6 8 10
Adenine
Phosphocholine
Adenine
Phosphocholine
PC frommembrane
Adeninefromnucleus
Freeze fractured
Formalin fixed
(a)
(b)
Figure 8.17 Plots showing the variation of phosphocholine and adenine signal as afunction of depth through the center of a single formalin fixed freeze-dried HeLa cell (a)and a freeze-fractured frozen hydrated HeLa cell (b). The freeze-fractured cell has a lowerphosphocholine-to-adenine ratio at the start of the analysis and clear separation of theadenine and phosphocholine as the cell substrate interface is approached. Recreated fromFletcher et al. data,51 with permission from John Wiley & Sons.
8.5.5 Depth Scale Measurement
All the studies that exploit the depth profiling capability, whether it is simpleremoving contamination or exploring subsurface chemistry, or the construction ofa 3D image would benefit from some measure of the z-scale. It is well known thatdifferent materials sputter at different rates, so pure sputtering time can at best only

Mahoney c08a.tex V1 - 01/18/2013 7:40pm Page 298
298 CHAPTER 8 CLUSTER ToF-SIMS IMAGING AND THE CHARACTERIZATION
Na+
Bef
ore
Afte
rZ
oom
in
K+ Phosphol. Total pos.
100 μm
100 μm
120 μm
C60 crater
Figure 8.18 Three-dimensional visualization of the membrane (green, m/z 184.1,Q6phosphocholine) and nucleus (red, m/z 136.1, adenine) chemistry in the frozen hydratedHeLa-M cells following the use of PCA to identify the interface between the cells and thesubstrate. Reproduced from Fletcher et al.,51 with permission from John Wiley & Sons.
(a) Rinsed withammonium acetate
and fixed in 4%paraformaldehyde
Afte
r
C60++ = 3.5 × 10¹³
K/Na = 2.1C60
+ = 7.3 × 10¹³
9.3 3.5 × 10¹³
5.0 3.5 × 10¹³
9.3 3.5 × 10¹³
40.0
Bef
ore
(b) Rinsed withammonium acetatesubmersed in LN2 +
freeze-dried
(d) Rinsed withammonium acetate
frozen-hydrated,LN2 + cold-stage
(e) Rinsed withammonium acetate,submersed in liquid
ethane + freeze-dried
(c) Vitrified intrehalose
Figure 8.19 Positive and negative ion images of HeLa cells prepared by a wash-and-drymethod. The images in the first row were acquired before C60
++ etching, the second andthe third rows were acquired after etching with 1.03 × 10¹⁴ C60
++ cm−2. Reproducedwith permission from Brison et al.,52 with permission from John Wiley & Sons.
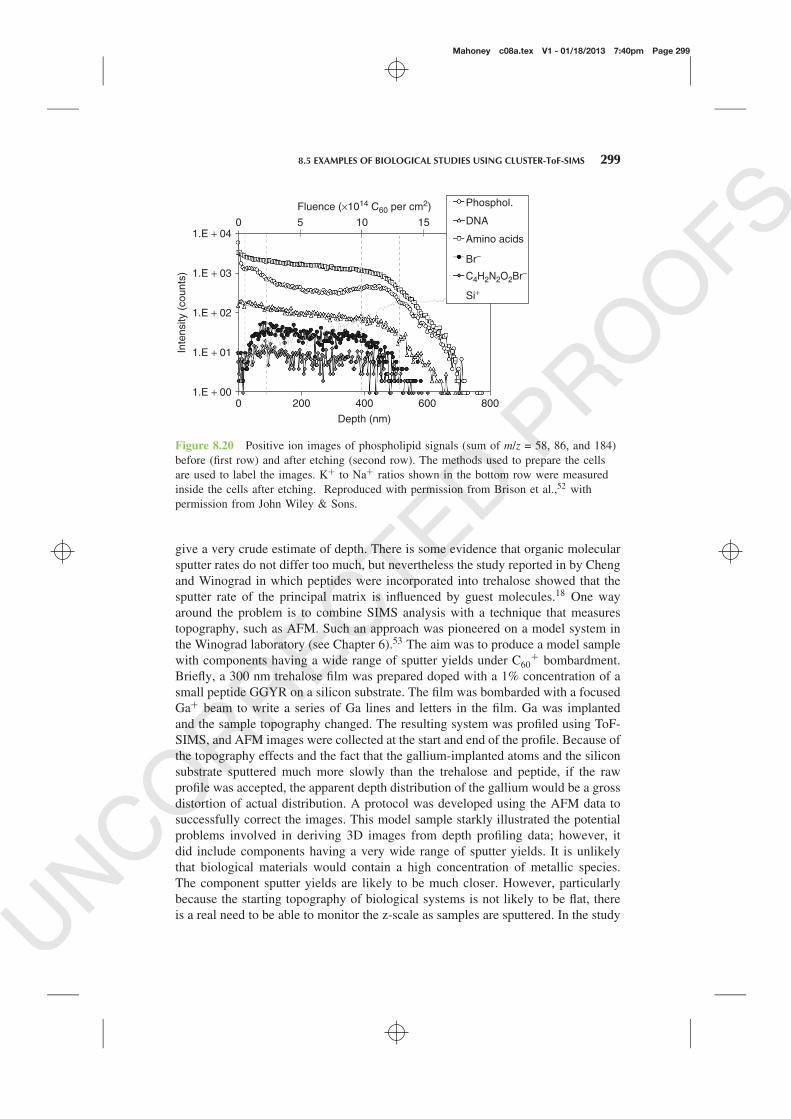
Mahoney c08a.tex V1 - 01/18/2013 7:40pm Page 299
8.5 EXAMPLES OF BIOLOGICAL STUDIES USING CLUSTER-ToF-SIMS 299
0
Fluence (×1014 C60 per cm2)
5 10 15
Inte
nsity
(co
unts
)
Depth (nm)
1.E + 00
1.E + 02
1.E + 03
1.E + 04
1.E + 01
8006004000 200
Phosphol.
DNA
Br−
Si+
C4H2N2O2Br−
Amino acids
Figure 8.20 Positive ion images of phospholipid signals (sum of m/z = 58, 86, and 184)before (first row) and after etching (second row). The methods used to prepare the cellsare used to label the images. K+ to Na+ ratios shown in the bottom row were measuredinside the cells after etching. Reproduced with permission from Brison et al.,52 withpermission from John Wiley & Sons.
give a very crude estimate of depth. There is some evidence that organic molecularsputter rates do not differ too much, but nevertheless the study reported in by Chengand Winograd in which peptides were incorporated into trehalose showed that thesputter rate of the principal matrix is influenced by guest molecules.18 One wayaround the problem is to combine SIMS analysis with a technique that measurestopography, such as AFM. Such an approach was pioneered on a model system inthe Winograd laboratory (see Chapter 6).53 The aim was to produce a model samplewith components having a wide range of sputter yields under C60
+ bombardment.Briefly, a 300 nm trehalose film was prepared doped with a 1% concentration of asmall peptide GGYR on a silicon substrate. The film was bombarded with a focusedGa+ beam to write a series of Ga lines and letters in the film. Ga was implantedand the sample topography changed. The resulting system was profiled using ToF-SIMS, and AFM images were collected at the start and end of the profile. Because ofthe topography effects and the fact that the gallium-implanted atoms and the siliconsubstrate sputtered much more slowly than the trehalose and peptide, if the rawprofile was accepted, the apparent depth distribution of the gallium would be a grossdistortion of actual distribution. A protocol was developed using the AFM data tosuccessfully correct the images. This model sample starkly illustrated the potentialproblems involved in deriving 3D images from depth profiling data; however, itdid include components having a very wide range of sputter yields. It is unlikelythat biological materials would contain a high concentration of metallic species.The component sputter yields are likely to be much closer. However, particularlybecause the starting topography of biological systems is not likely to be flat, thereis a real need to be able to monitor the z-scale as samples are sputtered. In the study

Mahoney c08a.tex V1 - 01/18/2013 7:40pm Page 300
300 CHAPTER 8 CLUSTER ToF-SIMS IMAGING AND THE CHARACTERIZATION
by Castner’s group referred to earlier (Figs. 8.20 and 8.21), the HeLa cells whosenucleus had been labeled with bromodeoxyuridine (BrdU) were sputtered to removevarious components of the cell’s structure, outer membrane, cytoplasm, nucleus,and lower membrane, and AFM used to measure the material removed at thesedifferent stages. They used ToF-SIMS peaks to determine when these componentshad been largely removed. This provided somewhat crude z-scale estimates ascells are not geometrically flat; however, they were able to estimate the sputtertime for each cell component. For a 1 nA, 10 keV C60
+ beam incident at 45◦ andrastered over 500 × 500 μm2, 20 s of etching was necessary to remove the surfacecontamination (∼20 nm). After approximately 75 s of etching, the top membranewas completely removed (∼54 nm) with intracellular components visible. After 100s of etching, the cytoplasm of the cells was completely sputtered away (∼85 nm)and only the nucleus remained. Finally, the bottom membrane was reached after403 s of etching, and the cell was completely sputtered after 515 s (∼508 nm).Both the atomic and molecular species from BrdU were detected inside the cell’snucleus after the surface contamination and the top membrane were removed byC60 etching (see Figure 8.20).
This approach using AFM has been applied in a somewhat different mode toan analysis of a cheek cell shown here.54 Before analysis in a SIMS system, thetopography of the cell is measured with an AFM. Then the cell is analyzed usingSIMS and a secondary ion image is generated. This image is rotated to correspondwith the AFM image and then overlaid on that image to give image Figure 8.21that displays the topography in x, y, and z axes and the secondary ion intensity isprovided as a gray scale. In this case, the z direction data is provided by the AFM.If the cell was then chemically profiled using SIMS, the z stack of images could beoffset using the initial AFM image. Although this method of topography measure-ment provides a reasonable approximation, there are a number of disadvantages,particularly if the SIMS analysis was to be performed on cryogenically preservedsamples. Also, if the sample was prone to considerable variations in sputter rateduring the analysis, the only way of measuring these variations would be to removethe sample from the vacuum and remake the AFM measurement at regular intervals
300350 250 200100150
μm
μm
μm
50 0300
SI image draped over AFM image; gray scale SIintensity
200
0
3
100
Figure 8.21 Depth profiles of HeLa cells acquired in the dual beam mode with 25 keVBi3
+ for analysis and 10 keV C60+ for etching. The depth profiles were reconstructed from
a single cell nucleus region. The depth scales were calibrated using AFM. Reproducedwith permission from Brison et al.,52 with permission from John Wiley & Sons.
Mahoney c08a.tex V1 - 01/18/2013 7:40pm Page 301
8.5 EXAMPLES OF BIOLOGICAL STUDIES USING CLUSTER-ToF-SIMS 301
as in the example from the Castner group. This procedure would obviously be timeconsuming and in many cases may even be detrimental to sample integrity. Thereare a number of alternative methods of mapping topography. A possible solutionthat might prove more compatible with the UHV conditions required for SIMSanalysis is that of white light or laser interferometry. Often employed in metro-logical applications, a white light source is used with a beam splitter and one ofa variety of interferometers. The systems are compatible with optical microscopetype accessories, but produce an image of the interference pattern from the samplethat can be transformed to provide a topographic map. Such a noncontact tech-nique is much more applicable to UHV analysis, and if mounted in an appropriatemanner could provide real-time mapping of topographic variation during a depthprofile analysis. However, integrating such a system with a normal SIMS analysisarrangement could be technically challenging.
8.5.6 High Throughput Biomaterials Characterization
A somewhat different, although extremely important analysis direction is the appli-cation of cluster-based ToF-SIMS in high throughput analysis of combinatoriallibraries of materials and drugs of potential use in medical therapeutic situations.Over a number of years Davies, Alexander, and coworkers have been explor-ing the use of polymer microarrays to discover new polymers with compositionsthat deliver favorable performance in cellular applications where the role of thematerial surface can have an important role in defining the nature and extent of thematerial–cellular interactions.55,56 They have exploited methods of preparing poly-mer microarrays of varying composition using noncontact printing.57 These arrayscan then be characterized using a variety of surface-sensitive techniques, such aswettability using water contact angle (WCA), topography, roughness and hardnessusing AFM, elemental and chemical composition using XPS, chemical functional-ity using Raman, IR, and ToF-SIMS. The polymer arrays can then be tested forthe attachment of various proteins that mediate cell attachment. Following this thepolymer protein combinations can be tested for cell attachment and activity. Suchstudies on microarrays that can number around 500 different sample spots generateenormous amounts of data. A ToF-SIMS spectrum from each spot with over 1000significant peaks from the positive and negative spectrum obviously cannot be ana-lyzed by “stare and compare” methods. Principal component analysis (PCA) andpartial least squares (PLS) methods have been used to draw out the features of theanalytical output that correlate with surface functionality that is of interest. PCAwas introduced in Chapter 4. Briefly, PCA is a statistical technique that seeks toreduce the complexity of a large data set with multiple variables to a few principalcomponents that describe the most significant trends and the largest differencesin the data. From the output generated it is possible to determine which the keysurface features are (e.g., ToF-SIMS ion fragments) that contribute to the chemi-cal diversity of a large number of materials. PLS seeks to combine two differentsets of experimental data, the so-called explanatory variables (e.g., surface chemicalinformation from ToF-SIMS spectra) and the responses (cell adhesion or activity) tobuild a predictive model of the response data set. The degree of agreement between

Mahoney c08a.tex V1 - 01/18/2013 7:40pm Page 302
302 CHAPTER 8 CLUSTER ToF-SIMS IMAGING AND THE CHARACTERIZATION
the experimental observations of, say, cell adhesion, and the prediction determinethe degree of correlation between the explanatory and response functions. The PLSmodel also generates a set of regression coefficients for each explanatory vari-able from which key explanatory variables, for example, ToF-SIMS ion fragmentscontrolling the response variable, such as cellular adhesion, can be extracted.
A particularly impressive study has been to develop new substrates that couldbe used to clonally expand human pluripotent stem cells on chemically-defined syn-thetic materials.58 Human pluripotent stem cells hold great promise for regenerativemedicine and human disease modeling and thus have attracted intense researchinterest for methodologies to expand these cell lines sufficiently for therapeuticuse. The discovery of a material that supports the outgrowth of stem cells whilemaintaining their pluripotency would be an important step toward realizing thebenefits of stem cells, and has been the focus of the authors’ cell based-polymermicroarray studies. Cell-compatible, biomaterial microarrays were prepared from22 acrylate monomers with diversified hydrophobicity, hydrophilicity, and cross-linking densities. The arrays were prepared by copolymerization between each of16 “major” monomers and each of six “minor” monomers at six different ratios[100 : 0, 90 : 10, 85 : 15, 80 : 20, 75 : 25, 70 : 30 (v/v)]. In this way, arrayswith 496 different combinations were created, consisting of the major monomer(70–100%) and minor monomer (0–30%). These monomer mixtures were robot-ically deposited in triplicate on a noncell adhesive layer of poly(2-hydroxyethylmethacrylate) covering conventional glass slides (75 mm × 25 mm), and thenpolymerized with a long wave-length ultraviolet source. A prior study across thearray of a range of different preadsorbed proteins had demonstrated that pread-sorption of fetal bovine serum (FBS) most effectively promotes the growth of hEScells. Using FBS-coated arrays it was demonstrated that a moderate wettability(WCA ∼70◦) is associated with optimal frequency of hES cell-colony formation.Other factors such as polymer roughness or elastic modulus had no effect. To try tounderstand of how wettability modulates colony formation, a “secondary” group of48 polymers with 12 replicates was assembled. This secondary array was designedto encompass the favorable range of WCA determined from the primary array. Ingood agreement with the primary array data, a moderate wettability (WCA ∼70◦)again effectively supported optimal hES cell clonal growth
In order to determine the polymer surface chemistry that provided favorableperformance, a 25 keV Bi3
+ primary beam probed each 300 μm diameter polymerspot on the 576 spot array under static conditions. An ION-TOF IV instrumentwas used. The cluster Bi3
+ beam was rastered over a 100 × 100 μm area of eachspot for 10 s acquisition time providing a good yield of ions in the mass rangeup to m/z 200. The instrument was operated in high mass resolution mode, m/�m∼6000. Using PLS on the ToF-SIMS spectra, the surface chemistry implied bythe spectra was correlated to the colony-formation frequency observed on eachpolymer in the secondary array, Figure 8.22. A “leave one out” cross validationmethod was used for the PLS analysis. Both ToF-SIMS and hES cell data weremean-centered before analysis. The individual peak intensities were normalized tothe total secondary ion count to remove the effect of primary ion beam fluctuation.The positive and negative ion intensity data was arranged into one concatenated
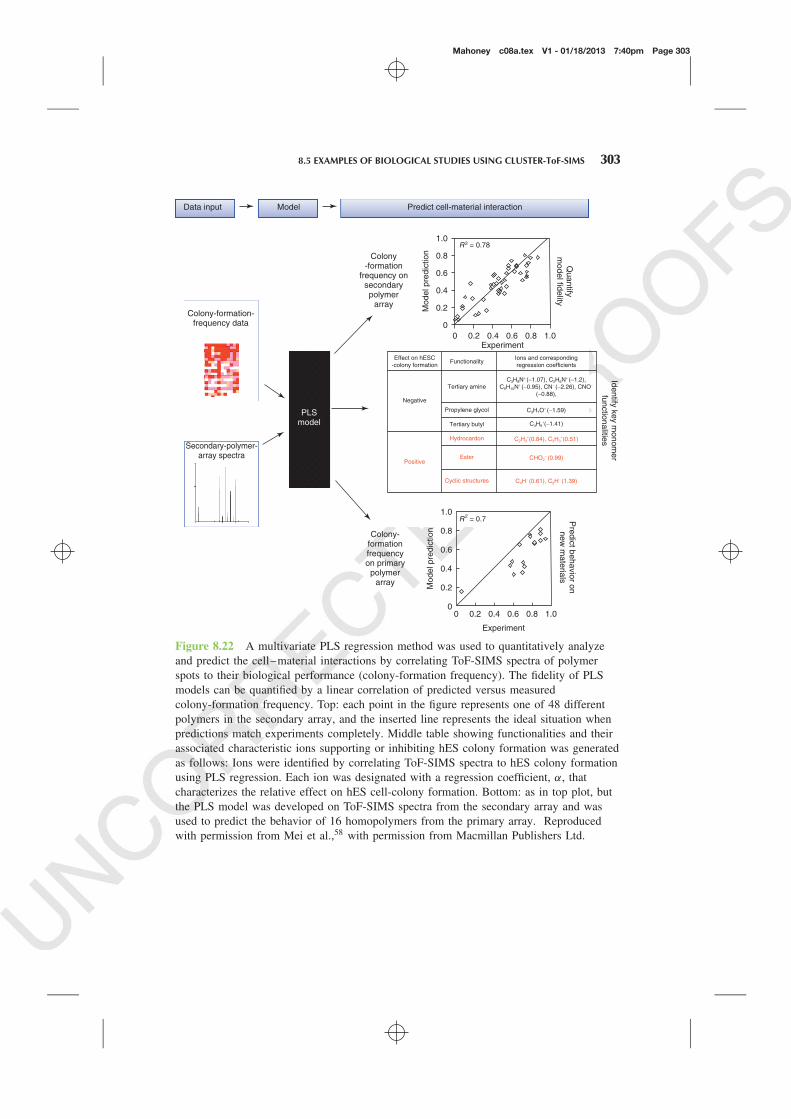
Mahoney c08a.tex V1 - 01/18/2013 7:40pm Page 303
8.5 EXAMPLES OF BIOLOGICAL STUDIES USING CLUSTER-ToF-SIMS 303
PositiveEster
Hydrocardon
Cyclic structures
CHO2− (0.99)
C4H− (0.61), C2H
− (1.39)
C2H3+(0.84), C3H3
+(0.51)
C4H9+(−1.41)
C3H8N+ (−1.07), C2H6N
+ (−1.2),C5H10N
+ (−0.95), CN− (−2.26), CNO−
(−0.88),
C3H7O+ (−1.59)
Colony-formationfrequencyon primary
polymerarray
Colony-formation
frequency onsecondarypolymer
array
PLSmodel
Colony-formation-frequency data
Secondary-polymer-array spectra
1.0
1.0
0.8
0.8
0.6
0.6
0.4
0.4
0.2
0.20
0
Experiment
Mod
el p
redi
ctio
n
Predict behavior on
new m
aterials
R2 = 0.7
1.0
1.0
0.8
0.8
0.6
0.6
0.4
0.4
0.2
0.20
0Experiment
Mod
el p
redi
ctio
n
Quantify
model fidelity
R2 = 0.78
Negative
Propylene glycol
Tertiary butyl
Tertiary amine
FunctionalityIons and correspondingregression coefficients
Identify key monom
erfunctionalities
Effect on hESC-colony formation
Data input Model Predict cell-material interaction
Figure 8.22 A multivariate PLS regression method was used to quantitatively analyzeand predict the cell–material interactions by correlating ToF-SIMS spectra of polymerspots to their biological performance (colony-formation frequency). The fidelity of PLSmodels can be quantified by a linear correlation of predicted versus measuredcolony-formation frequency. Top: each point in the figure represents one of 48 differentpolymers in the secondary array, and the inserted line represents the ideal situation whenpredictions match experiments completely. Middle table showing functionalities and theirassociated characteristic ions supporting or inhibiting hES colony formation was generatedas follows: Ions were identified by correlating ToF-SIMS spectra to hES colony formationusing PLS regression. Each ion was designated with a regression coefficient, α, thatcharacterizes the relative effect on hES cell-colony formation. Bottom: as in top plot, butthe PLS model was developed on ToF-SIMS spectra from the secondary array and wasused to predict the behavior of 16 homopolymers from the primary array. Reproducedwith permission from Mei et al.,58 with permission from Macmillan Publishers Ltd.

Mahoney c08a.tex V1 - 01/18/2013 7:40pm Page 304
304 CHAPTER 8 CLUSTER ToF-SIMS IMAGING AND THE CHARACTERIZATION
data matrix. A total of 181 positive and 43 negative ions were selected from agroup of polymers from the array containing all 22 monomers to form the peaklists. The PLS model constructed from the training polymer samples produced aset of regression coefficients for each secondary ion. These regression coefficientswere used to predict the hES cell colony formation on the test samples using theirSIMS spectra. Good agreement between measured colony-formation frequency andthat predicted from the ToF-SIMS spectra was found (R2 = 0.78). Each secondaryion associated with functionalities in the polymer structures could be listed withits regression coefficient, α, a quantitative measure of its contribution to colony-formation frequency (Table in Fig. 8.22). The tertiary amine moiety (characteristicions C3H8N+, C2H6N+, CN−) and tertiary-butyl moiety (C4H9
+) were identified bythe negative regression coefficient to be correlated most strongly with a low colony-formation frequency, and hydrocarbon ions (C2H3
+, C3H3+), oxygen-containing
ions (CHO2−, C3H3O+, C2H3O+) from esters, and ions from cyclic structures
(C6H−, C4H−, C2H−) had the largest effect on promoting colony formation. Theoxygen-containing ions and hydrocarbon ions can be attributed to the acrylategroups (CH2 = CHCO2
−) in each monomer, which form the backbone chain andthe pendant ester groups after polymerization. Monomers with di- and triacrylates,which contain the most acrylate groups in the library, indeed showed the highestcolony-formation frequencies.
The conclusions derived from “secondary” array provided an understandableview of the role of surface chemical structure in all the cell responses seen onthe original larger array. To illustrate this, the hES cell colony formation of all16 homopolymers in the original array was predicted entirely on their ToF-SIMSspectra using the PLS model from the “secondary” array (see lower regressionplot in Fig. 8.22) suggesting that the model is able to predict the cell behavior ofacrylate polymers outside the original training set of the model. Using this body ofinformation, further FBS coated “hit” polymer arrays (polymers that support bothrobust growth and hES cell-colony formation) were developed that demonstratedcapacity to maintain pluripotency of hES cells after more than 2 months of culture.The study was further extended to a more clinically relevant culture system forhES cells based on human serum (HS)-coated hit polymer arrays. It was shownthat HS-coated hit polymer arrays supported the expansion of dissociated hES cellsin a similar manner to arrays coated with FBS. Further, the HS-coated hit arrayscould support long-term culture for more than 1 month, with robust expression ofhES cell markers.
In contrast to the aspirations of cell and tissue analysis, this study demon-strates in a powerful way that accessing a relatively small mass range of fragmentions utilizing metal cluster initiated ToF-SIMS provides sensitivity to the detailedsurface chemical functionality of complex systems that are important in determin-ing their biological activity. Furthermore, because of its sensitivity and rapidityof analysis, this ToF-SIMS capability along with MVA techniques can be used toprobe the impact of these surface properties on the biological activities of largelibraries of polymeric materials in a high throughput mode of operation.

Mahoney c08a.tex V1 - 01/18/2013 7:40pm Page 305
REFERENCES 305
8.6 FINAL THOUGHTS AND FUTURE DIRECTIONS
As is clear from this chapter, the pace of progress in finding new applicationsfor cluster SIMS in biology is picking up rapidly. So far, unfortunately, we havelearned very little new biology. Researchers are still grappling with developing theappropriate instrumentation, sample preparation, and sensitivity, and it is likely thatthey will be important for years to come. As the sophistication with these issuesdeepens, it seems clear that by clever choice of the biological systems someonewill hit a “home run” and the biologists will take notice.
Perhaps the most tantalizing development emerging from cluster bombard-ment is the emergence of 3D imaging protocols. This type of experiment willrequire a detailed understanding of molecular depth profiling and new strategiesfor calibrating the z-scale. We can look for both fundamental and applied studies toadvance these aspects. Already, researchers are thinking about in situ AFM or laserinterferometry as possible solutions. It is also clear that to resolve the sensitivityissue satisfactorily, the field will have to more efficiently detect the secondary ions.This means that either the instrumentation has to collect all the sputtered material,or that the ionization probability needs to be increased dramatically. We expectbreakthroughs in both areas in the not too distant future.
REFERENCES
1. Fletcher, J. S.; Lockyer, N. P.; Vickerman, J. C. Mass Spectrom. Rev. 2011, 30 (1), 142–174.2. Carado, A.; Passarelli, M. K.; Kozole, J.; Wingate, J. E.; Winograd, N.; Loboda, A. V. Anal. Chem.
2008, 80 (21), 7921–7929.3. Fletcher, J. S.; Rabbani, S.; Henderson, A.; Blenkinsopp, P.; Thompson, S. P.; Lockyer, N. P.;
Vickerman, J. C. Anal. Chem. 2008, 80 (23), 9058–9064.4. Colliver, T. L.; Brummel, C. L.; Pacholski, M. L.; Swanek, F. D.; Ewing, A. G.; Winograd, N.
Anal. Chem. 1997, 69 (13), 2225–2231.5. Pacholski, M. L.; Donald, M. C.; Ewing, A. G.; Winograd, N. J. Am. Chem. Soc. 1999, 121,
4716–4717.6. Roddy, T. P.; Cannon Jr, D. M.; Meserole, C. A.; Winograd, N.; Ewing, A. G. Anal. Chem. 2002,
74 (16), 4011–4019.7. Parry, S.; Winograd, N. Anal. Chem. 2005, 77 (24), 7950–7957.8. Kurczy, M. E.; Piehowski, P. D.; Parry, S. A.; Jiang, M.; Chen, G.; Ewing, A. G.; Winograd, N.
Appl. Surf. Sci. 2008, 255 (4), 1298–1304.9. Hoppert, M.; Holzenburg, A. Electron Microscopy in Microbiology ; Springer: 1998.Q8
10. Severs, N. J.; Newman, T. M.; Shotton, D. M. A Practical Introduction to Rapid Freezing Tech-niques. In Rapid Freezing, Freeze Fracture and Deep Etching ; Severs, N. J., Shotton, D. M., Eds.;Wiley-Liss: New York, 1995.
11. Sjovall, P.; Johansson, B.; Lausmaa, J. Appl. Surf. Sci. 2006, 252 (19), 6966–6974.12. Jones, E. A.; Lockyer, N. P.; Vickerman, J. C. Anal. Chem. 2008, 80 (6), 2125–2132.13. Pacholski, M. L.; Winograd, N. Chem. Rev. 1999, 99, 2977–3006.14. Hill, R.; Blenkinsopp, P.; Thompson, S.; Vickerman, J.; Fletcher, J. S. Surf. Interface Anal. 2011,
43 (1–2), 506–509.15. Lanekoff, I.; Kurczy, M. E.; Hill, R.; Fletcher, J. S.; Vickerman, J. C.; Winograd, N.; Sjoevall,
P.; Ewing, A. G. Anal. Chem. 2010, 82 (15), 6652–6659.16. MacAleese, L.; Duursma, M. C.; Klerk, L. A.; Fisher, G.; Heeren, R. J. Proteomics 2011, 74 (7),
993–1001.
Mahoney c08a.tex V1 - 01/18/2013 7:40pm Page 306
306 CHAPTER 8 CLUSTER ToF-SIMS IMAGING AND THE CHARACTERIZATION
17. Passarelli, M. K.; Winograd, N. Biochim. Biophys. Acta Mol. Cell Biol. Lipids 2011, 1811 (11),976.
18. Cheng, J.; Winograd, N. Anal. Chem. 2005, 77 (11), 3651–3659.19. Jones, E. A.; Lockyer, N. P.; Kordys, J.; Vickerman, J. C. J. Am. Soc. Mass Spectrom. 2007, 18
(8), 1559–1567.20. Cheng, J.; Wucher, A.; Winograd, N. J. Phys. Chem. B. 2006, 110 (16), 8329–8336.21. Cheng, J.; Kozole, J.; Hengstebeck, R.; Winograd, N. J. Am. Soc. Mass Spectrom. 2007, 18 (3),
406–412.22. McPhail, D. S.; Dowsett, M. G. In Surface Analysis - The Principal Techniques , 2nd ed.;
Vickerman, J. C., Gilmore, I. S., Eds.; John Wiley & Sons, Ltd: Chichester, UK, 2009; pp207–254.
23. Tang, L.; Kebarle, P. Anal. Chem. 1991, 63 (23), 2709–2715.24. Amado, F. M. L.; Domingues, P.; Graca, S.-M. M.; Ferrer-Correia, A. J.; Tomer, K. B. Rapid
Commun. Mass Spectrom. 1997, 11, 1347.25. King, R.; Bonfiglio, R.; Fernandez-Metzler, C.; Miller-Stein, C.; Olah, T. J. Am. Chem. Soc. 2000,
11, 942.26. Jones, E. A.; Lockyer, N. P.; Vickerman, J. C. Appl. Surf. Sci. 2006, 252, 6727.27. Piwowar, A. M.; Lockyer, N. P.; Vickerman, J. C. Anal. Chem. 2009, 81 (3), 1040–1048.28. Piwowar, A. M.; Fletcher, J. S.; Kordys, J.; Lockyer, N. P.; Winograd, N.; Vickerman, J. C. Anal.
Chem. 2010, 82 (19), 8291–8299.29. Wucher, A.; Sun, S.; Szakal, C.; Winograd, N. Anal. Chem. 2004, 76 (24), 7234–7242.30. Conlan, X. A.; Lockyer, N. P.; Vickerman, J. C.. Rapid Commun. Mass Spectrom. 2006, 20 (8),
1327–1334.31. Lee, J. L. S.; Gilmore, I. S.. In Surface Analysis - The Principal Techniques , 2nd ed.;
Vickerman, J. C., Gilmore, I. S., Eds.; John Wiley & Sons, Ltd: Chichester, UK, 2009; pp563–613.
32. Sjovall, P.; Lausmaa, J.; Johansson, B. Anal. Chem. 2004, 76 (15), 4271–4278.33. Benabdellah, F.; Seyer, A.; Quinton, L.; Touboul, D.; Brunelle, A.; Laprevote, O., Anal. Bioanal.
Chem. 2010, 396 (1), 151–162.34. Briggs, D.; Hearn, M. J. Vacuum 1986, 36 (11–12), 1005–1010.35. Jones, E. A.; Lockyer, N. P.; Vickerman, J. C.. Int. J. Mass Spectrom. 2007, 260 (2–3), 146–157.36. Tahallah, N.; Brunelle, A.; De La Porte, S.; Laprevote, O. J. Lipid Res. 2008, 49, 434–454.37. Touboul, D.; Brunelle, A.; Halgand, F.; De La Porte, S.; Laprevote, O. J. Lipid Res. 2005, 46,
1388–1395.38. Touboul, D.; Roy, S.; Germain, D. P.; Chaminade, P.; Brunelle, A.; Laprevote, O. Int. J. Mass
Spectrom. 2007, 260 (2), 158–165.39. Debois, D.; Bralet, M. P.; Le Naour, F.; Brunelle, A.; Laprevote, O. Anal. Chem. 2009, 81 (8),
2823–2831.40. Malmberg, P.; Borner, K.; Chen, Y.; Friberg, P.; Hagenhoff, B.; Mannsson, J. E.; Nygren, H.
Biochim. Biophys. Acta Mol. Cell Biol. Lipids 2007, 1771 (2), 185–195.41. Brulet, M.; Seyer, A.; Edelman, A.; Brunelle, A.; Fritsch, J.; Ollero, M.; Laprevote, O. J. Lipid
Res. 2010, 51 (10), 3034–3045.42. Camps, M.; Cortes, R.; Gueye, B.; Palacios, J. M. Neuroscience 1998, (28), 275.43. Willey, K. F.; Vorsa, V.; Braun, R. M.; Winograd, N. Rapid. Commun. Mass Spectrom. 1998, 12
(18), 1253–1260.44. Vaidyanathan, S.; Fletcher, J. S.; Goodacre, R.; Lockyer, N. P.; Micklefield, J.; Vickerman, J. C.
Anal. Chem. 2008, 80 (6), 1942–1951.45. Passarelli, M. K.; Winograd, N. Surf. Interface Anal. 2011, 43, 269–271.46. Murphy, R. C.; Harrison, K. A. Mass Spectrom. Rev. 1994, 13, 57.47. Fletcher, J. S.; Lockyer, N. P.; Vaidyanathan, S.; Vickerman, J. C. Anal. Chem. 2007, 79 (6),
2199–2206.48. Vickerman, J. C. Analyst 2011, 136 (11), 2199–2217.49. Breitenstein, D.; Rommel, C. E.; Mollers, R.; Wegener, J.; Hagenhoff, B. Angew. Chem. Int. Ed.
2007, 46 (28), 5332–5335.

Mahoney c08a.tex V1 - 01/18/2013 7:40pm Page 307
REFERENCES 307
50. Rabbani, S.; Fletcher, J. S.; Lockyer, N. P.; Vickerman, J. C. Surf. Interface Anal. 2011, 43,380–384.
51. Fletcher, J. S.; Rabbani, S.; Henderson, A.; Lockyer, N. P.; Vickerman, J. C. Rapid Commun. MassSpectrom. 2011, 25 (7), 925–932.
52. Brison, J.; Benoit, D. S. W.; Muramoto, S.; Robinson, M.; Stayton, P. S.; Castner, D. G. Surf.Interface Anal. 2011, 43, 354–357.
53. Wucher, A.; Cheng, J.; Winograd, N. Anal. Chem. 2007, 79 (15), 5529–5539.54. Fletcher, J. S.; Henderson, A.; Biddulph, G. X.; Vaidyanathan, S.; Lockyer, N. P.;
Vickerman, J. C. Appl. Surf. Sci. 2008, 255, 1264–1270.55. Davies, M. C.; Alexander, M. R.; Hook, A. L.; Yang, J.; Mei, Y.; Taylor, M.; Urquhart, A. J.;
Langer, R.; Anderson, D. G. J. Drug Target. 2010, 18 (10), 741–751.56. Hook, A. L.; Anderson, D. G.; Langer, R.; Williams, P.; Davies, M. C.; Alexander, M. R. Bioma-
terials 2010, 31 (2), 187–198.57. Anderson, D. G.; Putnam, D.; Lavik, E. B.; Mahmood, T. A.; Langer, R. Biomaterials 2005, 26
(23), 4892–4897.58. Mei, Y.; Saha, K.; Bogatyrev, S. R.; Yang, J.; Hook, A. L.; Kalcioglu, Z. I.; Cho, S. W.;
Mitalipova, M.; Pyzocha, N.; Rojas, F. Nat. Mater. 2010, 9 (9), 768–778.

Mahoney c08a.tex V1 - 01/18/2013 7:40pm Page 308

Mahoney c08a.tex V1 - 01/18/2013 7:40pm Page 308
Queries in Chapter 8
Q1. We have shortened the running head since it exceeds the hsize value. pleaseconfirm if it is fine.
Q2. Please provide expansion for abbreviations PI and UHV, if necessary.
Q3. For figure 8.9, please provide parameters and units.
Q4. For figure 8.11, please provide parameters and units for part figures (c) and(d).
Q5. Figure 8.15 was not cited in the text. An attempt has been made to insert thefigure into a relevant point in the text –please check that this is OK.
Q6. The caption of Figures 8.18–8.20 does not seem to match with the artworkand the text explanation. Please check.
Q7. For figure 8.17, please provide parameters and units for both (a) and (b).
Q8. Please provide publisher location for Ref. [9].


