
Galley 2, 4/15/2013 FOR INTERNAL DIS
Charting a Steady CourseTurning Brazil inTo a Business and invesTmenT HuB

Brazil Investments & Business (BRAiN) is a private nonprofit organization whose mission is to reinforce Brazil’s position as an international business and investment hub through a regional focus and a global projection, contributing to the sustainable economic and social development of Brazil and Latin America.
The Boston Consulting Group (BCG) is a global management consulting firm and the world’s leading advisor on business strategy. We partner with clients from the private, public, and not-for-profit sectors in all regions to identify their highest-value opportunities, address their most critical challenges, and transform their enterprises. Our customized approach combines deep in sight into the dynamics of companies and markets with close collaboration at all levels of the client organization. This ensures that our clients achieve sustainable compet itive advantage, build more capable organizations, and secure lasting results. Founded in 1963, BCG is a private company with 78 offices in 43 countries. For more information, please visit bcg.com.

APRIL 2013 | The Boston Consulting Group • BRAiN
Charting a Steady CourSe
TuRnInG BRAzIL InTo A BusIness And InvesTmenT HuB
ANDRE XAvIER
MASAO UkON
JULIANA ABREU
FRedeRICk PIeRRu
JOAO MOREIRA
PAulO OlIveIRA
PedRO GueRRA

2 | Charting a steady Course
ContentS
3 IntroductIon
5 Investment AttrActIveness: the seven PIllArsmacroeconomic environmentinstitutional environmentTalent and Human CapitalPhysical infrastructureFinancial infrastructureglobal Connectivityimage
16 Immense PromIse
17 For Further reAdIng
18 note to the reAder

The Boston Consulting Group • BRAin | 3
If you know whence you came, there are absolutely no limitations to where you can go. —James Baldwin
Few observers doubt the immense potential of Brazil, one of the world’s most significant emerging economies. Indeed, Brazil has
great advantages. Compared with its colleagues in the BRIC quartet of emerging giants, it is richer than India and China and larger and more democratically stable than Russia.1 It is the largest nation in latin America, with one-third of the region’s population generating 44 percent of its GDP.2 Already the sixth largest economy in the world, it could become the fifth by 2020, according to forecasts by the Econo-mist Intelligence Unit. But growth, and the investment decisions that underpin it, doesn’t happen by magic. Substantial growth takes enlightened government and well-informed decisions by potential investors.
Decision makers and investors need a compass to guide their choices. In order to know where Brazil is going, they need to know where it is now—and how it got there. They need an informed sense of Brazil’s comparative advantages and disadvantages, as well as how it is chang-ing—in what direction and how fast. They need a view of Brazil’s so-ciety as well as its economy that goes beyond clichéd images of bril-liant football teams, the Rio carnival, and the poverty and crime of the favelas. They should be aware, for example, that Brazilian finan-cial regulations set standards that most global banking centers fail to match.
Investors and decision makers also need authoritative, balanced infor-mation. Alongside the exuberant forecasts, it is important to know about Brazil’s limitations—and to be aware of strictures such as Euro-pean trade commissioner Karel de Gucht’s warning in May 2012 that “Brazil should be proud of the enormous progress it has made in re-cent years, but it must also know it cannot stand still if it wishes to move to the next stage of development.”
We aim to provide that compass and guide. This document has its foundations in BCG’s support for the development of The Attractive-ness of Brazil as an Investment and Business Hub, a report published in October 2012 by Brasil Investimentos e Negócios (BRAiN). In this re-port, we look at Brazil in terms of seven pillars critical to the aspira-tions of any country with the potential to establish itself as an attrac-tive business and investment hub. We provide investors and others interested in doing business in Brazil with a framework to assist them in thinking about the relative attractiveness of the country in the con-
introduCtion

4 | Charting a steady Course
text of different business objectives—and how best to explore the op-portunities Brazil offers.
notes1. The comparison of Brazil’s wealth with India and China is based on GDP per capita. Its size compared with Russia is based on population and nominal GDP.2. Numbers are from dataworldbank.org, accessed August 15, 2012.

The Boston Consulting Group • BRAin | 5
BCG’s analysis identified seven key pillars that underpin a country’s or
region’s relative attractiveness as a business or investment hub:
Macroeconomic environment, • including economic growth, predictability, and capital investment
Institutional environment, • including political and legal systems, legal security, level of bureaucracy, and business operations
Talent and human capital, • including demographics, education and training, and talent mobility and attraction
Physical infrastructure, • including urban mobility, logistics connectivity, telecom-munications, and basic services
Financial infrastructure, • including funding for the economy and effective risk allocation
Global connectivity, • including trade in goods and services, capital and invest-ment flows, international business operations, and flow of people
Image • of the country, including percep-tions of Brazil as a place to do business, to live, or to visit
We analyzed each pillar of Brazil’s perfor-mance through a number of indicators—a to-tal of 57 in all—and weighed these results against the performance of 13 other coun-tries. (For a list of these countries, see the sidebar below.) We chose these countries from three distinct groups—international hubs, developed nations, and developing na-
inveStment attraCtiveneSS
THe seven PILLARs
Brazil’s performance was compared with the following 13 countries:
International hubsHong Kong •singapore •u.K. •u.s. •
Developed nationsFrance •germany •Japan •Korea •
developing nations Chile •China •india •mexico •russia •
Brazil versus THe World

6 | Charting a steady Course
tions—as a means of illustrating Brazil’s cur-rent position. For each pillar, a dashboard graphic is used to summarize in what direc-tion and to what degree Brazil has to progress in order to become a business and invest-ment hub, and how it compares with other existing and potential hubs.
macroeconomic environmentBrazil offers an attractive macroeconomic en-vironment. It has grown steadily, is stable and predictable, and is increasingly regarded as a safe place to invest. (See Exhibit 1.) The pri-mary remaining weaknesses are its income inequality and low saving and investment rates. This means Brazil will probably contin-ue to need foreign investment in order to achieve its desired growth rates.
While growth slowed in 2011 and 2012, Bra-zil’s overall economic performance is in striking contrast to its slower and more er-ratic growth of the 1980s and 1990s. It is
now economically stable after having grown rapidly in the second half of the last decade, when it averaged 4.4 percent annual growth from 2006 through 2010. Brazil is well be-hind India and China, but it comfortably outgrew developed nations such as the U.S. In spite of the recent slowdown, it is still pro-jected to grow faster than any of the devel-oped nations sampled, albeit at slower rates than China and India.
This growth has been driven by upward so-cial mobility, which has created a much larger middle class with greater purchasing power. In 2011, it was estimated that 55 percent of Brazilian adults lived in middle-class house-holds—defined as having a monthly income of between $1,200 and $5,174—compared with only 38.6 percent in 2002.
Furthermore, poverty and inequality have decreased. The World Bank estimates that the proportion of the population living in poverty (defined as a per capita daily income
Income distribution
Economic growth1
Monetary stability1
Fiscal solidity1
External vulnerability
Economic volatility
Human development
International hubs Other developed nations Developing nations
Brazil
Chile
ChinaGermany
France
U.K.
Hong Kong
Hong Kong
IndiaJapan
South KoreaMexico
RussiaSingapore
U.S.
Brazil
ChileChina
Hong KongIndiaSouth Korea
Mexico Russia
Singapore
Brazil
ChileChina
GermanyFrance
South Korea
U.K.Hong Kong
India
Japan
Mexico
Russia Singapore U.S.
Russia
India Brazil
China
MexicoChile
South Korea
Singapore
U.S.France
Germany
Japan
Japan
U.S.
Singapore France
U.K. GermanyIndia
Brazil
Mexico
Hong Kong
China Russia
Hong Kong
U.S.
U.K. Singapore
France Germany
Japan
Chile
Russia China
South Korea
Mexico
India
Brazil
Brazil
Chile
Mexico
Russia U.S.Singapore
Hong Kong China JapanIndia
U.K.France
South Korea
Germany
Poor Needs improvement Good Excellent
U.K.
SouthKorea
Chile
Source: BCG analysis.Note: Information for some countries was not available for every indicator.1Based on projected data.
Exhibit 1 | Brazil Is Increasingly Considered a Safe Place to Invest
The Boston Consulting Group • BRAin | 7
of less than $2) fell from 21 percent to 11 percent from 2003 through 2009. The num-ber living in extreme poverty (less than $1.25 per day) fell from 10 percent to 2.2 percent from 2004 through 2009. Brazil’s poorest 10 percent saw their incomes rise by 7 percent annually in the first decade of this century, whereas the richest 10 percent saw income growth of only 1.7 percent. The result is that Brazil’s Gini coefficient—a measure of the equality of income distribution, with 0 ex-pressing total equality and 100 expressing to-tal inequality—reached a 50 year low at 51.9 in 2011. This is a sign that Brazil is beginning to combat the extreme disparities often cited as a serious drag on its social and economic potential.
Brazil has shown adeptness in taming inflation and managing public finances.
Brazil has also managed to tame inflation. In-flation targets were introduced in 1999, and annual rates have been in single figures since 2001. While higher than ideal—and also high-er than in China—at 5 percent on average, projected inflation from 2012 through 2016 runs lower than both historic levels and lev-els held by competitors such as Russia and India.
In addition, the country has shown adeptness in managing public finances. Public-sector debt as a proportion of GDP declined by more than a third from 2002 through 2011, falling from 60.4 percent to 36.4 percent. More important, Brazil has become a net for-eign creditor since 2006—with reserves and credits exceeding those held by overseas countries. This is a significant reversal of Bra-zil’s previous long-term history as a net for-eign debtor. And real interest rates, a signifi-cant factor influencing investment costs for government and the private sector, are at their lowest level since tracking began in 1986. The 2012 level of 2.7 percent is in sharp contrast to an 11.7 percent level six years ago, and Brazil’s real interest rates are now com-parable with those of China and Russia.
All these improvements mean that Brazil is now widely recognized as a much safer coun-try in which to invest. Its score in J.P. Mor-gan’s Emerging Market Bond Index Plus risk scale has remained at around 200 points since 2011.1 In 2002, it scored more than 2,000 points but has improved steadily ever since—reaching investment grade in 2008.
This helps attract foreign capital—an impor-tant attribute, since domestic savings remains a weakness. Brazil invested 17.3 percent of GDP from 2002 through 2011, lower not only than the 22 percent needed to maintain the 4 to 4.5 percent growth rate seen from 2006 through 2010 but also well behind BRIC peers India (30 percent) and China (42 per-cent). Given these low savings ratios, Brazil cannot expect to finance its future growth on its own. This opens up space for savvy foreign investors and businesses willing to bet on Brazil’s continued growth and prosperity.
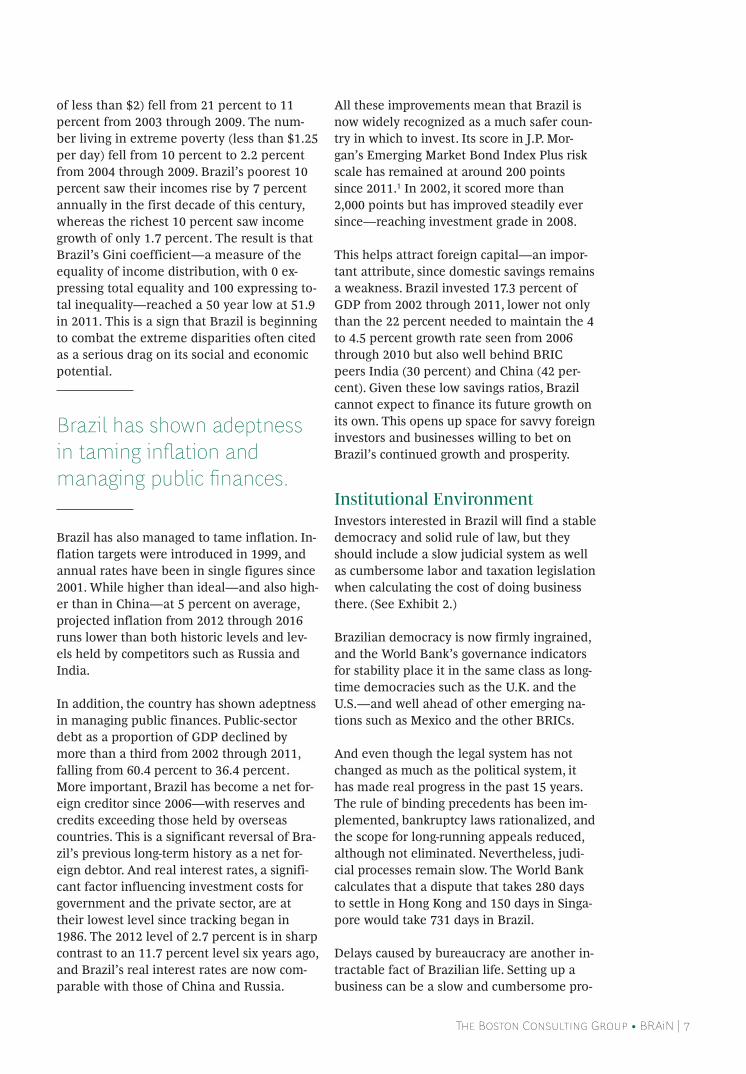
institutional environmentInvestors interested in Brazil will find a stable democracy and solid rule of law, but they should include a slow judicial system as well as cumbersome labor and taxation legislation when calculating the cost of doing business there. (See Exhibit 2.)
Brazilian democracy is now firmly ingrained, and the World Bank’s governance indicators for stability place it in the same class as long-time democracies such as the U.K. and the U.S.—and well ahead of other emerging na-tions such as Mexico and the other BRICs.
And even though the legal system has not changed as much as the political system, it has made real progress in the past 15 years. The rule of binding precedents has been im-plemented, bankruptcy laws rationalized, and the scope for long-running appeals reduced, although not eliminated. Nevertheless, judi-cial processes remain slow. The World Bank calculates that a dispute that takes 280 days to settle in Hong Kong and 150 days in Singa-pore would take 731 days in Brazil.
Delays caused by bureaucracy are another in-tractable fact of Brazilian life. Setting up a business can be a slow and cumbersome pro-
8 | Charting a steady Course
cess that demands 15 steps, taking an average of 120 days. But change is already beginning. For example, the state of Minas Gerais has pi-oneered a one-stop interactive system that simplifies the process to 11 steps and reduces the number of days to set up a business to an average of 19. This system is being piloted in eight other states.
Similar complexities are to be found in the labor market, as well as in labor taxes and so-cial-security charges. A Brazilian company may have to pay nine separate taxes, com-pared with five in singapore and three in Hong Kong.2 It must also deal with copious new tax requirements and regulations.
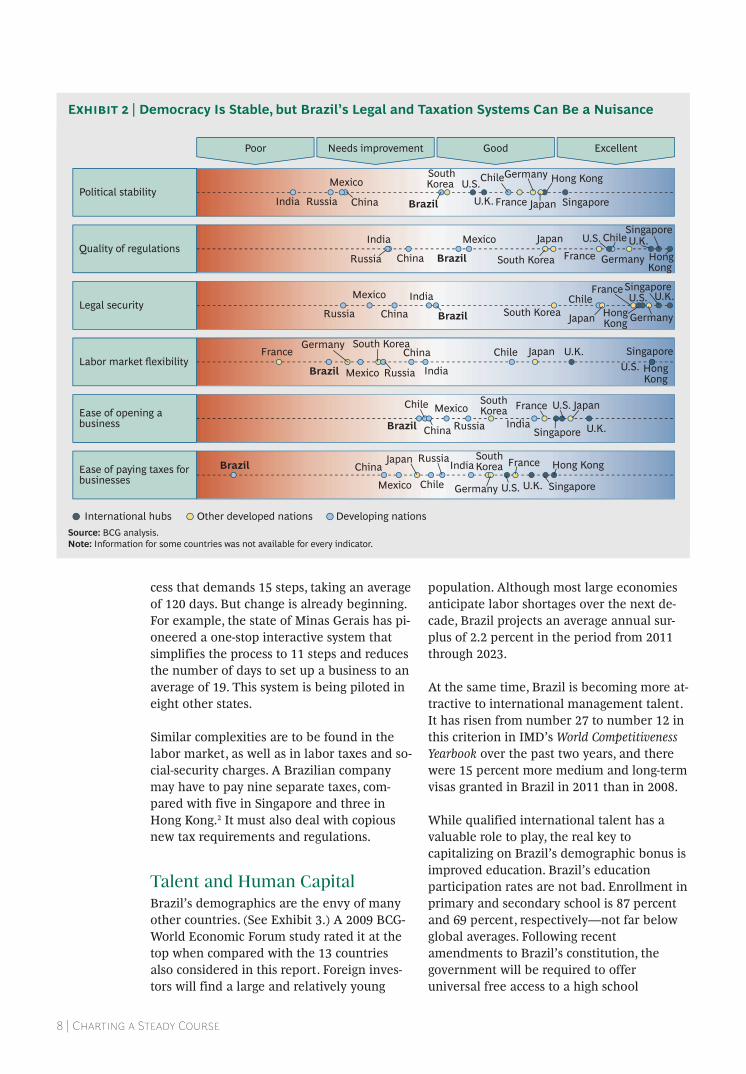
talent and human CapitalBrazil’s demographics are the envy of many other countries. (See Exhibit 3.) A 2009 BCG-World Economic Forum study rated it at the top when compared with the 13 countries also considered in this report. Foreign inves-tors will find a large and relatively young
population. Although most large economies anticipate labor shortages over the next de-cade, Brazil projects an average annual sur-plus of 2.2 percent in the period from 2011 through 2023.
At the same time, Brazil is becoming more at-tractive to international management talent. It has risen from number 27 to number 12 in this criterion in IMD’s World Competitiveness Yearbook over the past two years, and there were 15 percent more medium and long-term visas granted in Brazil in 2011 than in 2008.
While qualified international talent has a valuable role to play, the real key to capitalizing on Brazil’s demographic bonus is improved education. Brazil’s education participation rates are not bad. Enrollment in primary and secondary school is 87 percent and 69 percent, respectively—not far below global averages. Following recent amendments to Brazil’s constitution, the government will be required to offer universal free access to a high school
International hubs Other developed nations Developing nations
Brazil
Chile
China
Germany
U.K.
Hong Kong
India
SouthKoreaMexico
Russia Singapore
U.S.
Brazil
Chile
China
France
U.K.India
JapanSouthKoreaMexico
Russia Singapore
U.S.
Brazil
Chile
China GermanyFranceU.K.India Japan
South Korea
Mexico
Russia
SingaporeU.S.
BrazilChile
China Germany
FranceU.K.India
JapanSouth Korea
Mexico
Russia
SingaporeU.S.
France
Brazil
Germany
Mexico
South Korea
Russia
China
India
Chile Japan U.K.U.S. Hong
Kong
Singapore
Brazil
Mexico
ChinaJapan Russia
IndiaSouthKorea
U.K.
France
U.S. Singapore
Hong Kong
Chile
Political stability
Quality of regulations
Legal security
Labor market flexibility
Ease of opening abusiness
Ease of paying taxes forbusinesses
Poor Needs improvement Good Excellent
HongKong
HongKong
Germany
France Japan
Source: BCG analysis.Note: Information for some countries was not available for every indicator.
Exhibit 2 | Democracy Is Stable, but Brazil’s Legal and Taxation Systems Can Be a Nuisance

The Boston Consulting Group • BRAin | 9
education by 2016. And although university enrollment is, at 27 percent, lower than the global average, this is a higher rate than in China and India.
The issue with education is not just quantity but quality. The Organisation for Economic Cooperation and Development (OECD) rates Brazilian basic education at below average. The country’s students scored 401 on the Pro-gramme for International Assessment (PISA)
test, compared with the OECD mean of 497 and a global mean of 468. A government study rates language and math skills at the lower end of expected performance in prima-ry schools and below expectations at the sec-ondary level.
This means Brazil performs very poorly in in-ternational talent comparisons. The Heidrick & Struggles Global Talent Index, which proj-ects performance through 2015, ranks Brazil
Internationalizationof education(foreign languagesand experience)
Quantity ofhigher education
Alignment betweenhigher educationand the market
Demographicattractiveness1
Quantity of primaryand secondaryeducation
Ease of immigrationprocedures
Quality of primaryand secondaryeducation
Availability of qualifiedmanagers andengineers
Intensity of researchand development
Attractiveness tointernational talent
Diaspora management
Poor Needs improvement Good Excellent
International hubs Other developed nations Developing nations
U.K. GermanySingapore Hong Kong
Chile Russia
India
Brazil
Brazil
Chile
ChinaGermanyFrance U.K.
Hong Kong
India
Japan
South Korea
Mexico
Russia
Singapore
U.S.
Brazil ChileChina Germany
France
U.K. Hong KongIndia
Japan
SouthKorea
Russia SingaporeU.S.
Brazil
ChileChinaGermany
France U.K.Hong Kong India
JapanSouthKoreaMexico Russia
Singapore
U.S.
Brazil
Chile
China Germany
France U.K.
Kong Hong
India
Japan
South Korea MexicoRussia SingaporeU.S.
Brazil
Chile China Germany
France
U.K.Hong Kong
India
Japan
South Korea
Russia
Singapore
Brazil
China
Germany
France
U.K. India
Japan
South Korea MexicoRussia
U.S.
Brazil Chile China
GermanyFrance U.K.
Hong KongIndia
Japan South KoreaMexico Russia
SingaporeU.S.
Brazil Chile
China
Germany France
U.K.Hong Kong
India JapanSouth Korea
MexicoRussia Singapore
U.S.
Brazil
ChileChina Germany France U.K.
HongKong
India
Japan
SouthKoreaMexico Russia
Singapore U.S.
Brazil Chile China
Germany
France U.K.
Hong KongJapan
SouthKorea
Mexico
RussiaSingapore
U.S.
Source: BCG analysis.Note: Information for some countries was not available for every indicator.1Based on projected data.
Exhibit 3 | Brazil’s Demographics Have Great Appeal

10 | Charting a steady Course
38 out of 60 countries—behind not only its BRIC peers but also Latin American neigh-bors Mexico and Argentina. These weakness-es make it tough for employers to locate staff with the right skills. For example, Brazil trails the other 13 countries in availability of quali-fied engineers and managers.
The good news is that Brazilians are increas-ingly aware that education matters. More than 70 percent of middle-class children have had more education than their parents. Addi-tionally, there are many initiatives to attack these deficiencies. For example, nearly 225,000 students from the state of São Paulo are enrolled in Centro Paulo Souza, which manages technical schools run by the state government. In 2011, the national govern-ment launched Programa Nacional de Acesso ao Ensino Técnico e ao Empreso (Pronatec), a program that enables underprivileged stu-dents to attend private technical schools. This supplements the Programa Universidade para Todos (ProUni) university scholarship program, which supports 195,000 students from households with incomes of less than three times the minimum wage.
these improvements are essential if Brazil is to tackle its impending productivity chal-
lenge. Approximately 75 percent of Brazilian GDP growth over the past decade was due to a larger workforce and only 25 percent to pro-ductivity gains. (For further detail, see “Bra-zil: Facing the Productivity Challenge,” BCG article, September 2012.) With the country close to full employment, future GDP gains will depend on ensuring that the workforce has the skills needed to drive increased pro-ductivity.
Companies investing in Brazil will continue to be attracted by young and plentiful labor, but their business plans will nonetheless have to incorporate the need for training and peo-ple development. This will allow them to tap the Brazilian demographic bonus and turn it into an asset.
Physical infrastructureBrazil is, at last, giving serious attention to strengthening the weakest of its seven pil-lars, a physical infrastructure that has not kept pace with economic development and threatens to choke growth. (See Exhibit 4.) For starters, Brazil ranks dead last in air transportation quality compared with the 13 other countries. One reason is that its main airports are overcrowded and struggling to
Urban mobility
Quality and cost oftelecommunications
Power availability
Basic servicesavailable to the urbanpopulation1
International hubs Other developed nations Developing nations
Brazil
China GermanyFrance
U.K.
India
Mexico Russia U.S.
Brazil
Chile ChinaGermany
FranceU.K.
Hong Kong
India JapanMexico
Russia
Singapore
U.S.
Brazil
Chile
China GermanyFrance
U.K. Hong Kong
HongKong
India
Japan
SouthKorea
South Korea
South Korea
Mexico Russia
Singapore
U.S.
BrazilChileChina
GermanyFrance
U.K.India
JapanMexico
RussiaSingapore
U.S.
SouthKorea
Brazil
Chile
China
Germany
FranceU.K.
India
JapanMexicoRussia
Singapore
U.S.
Poor Needs improvement Good Excellent
Quality of airtransportation
Source: BCG analysis.Note: Information for some countries was not available for every indicator.1Based on projected data.
Exhibit 4 | Physical Infrastructure Lags Behind Economic Development

The Boston Consulting Group • BRAin | 11
meet growing demand. São Paulo’s interna-tional airport is currently running at 146 percent of nominal capacity. This capacity is projected to increase by two-thirds, to 35 million passengers, by 2014, but it will still fall short of demand, projected at 40 million. Congonhas, São Paulo’s domestic airport, plans to expand by a quarter over the same period, but it will fall further behind de-mand, forcing it to process 22 million pas-sengers through facilities designed for a maximum of 15 million.
Furthermore, travelers are unlikely to enjoy journeys across Brazil’s major cities to the air-ports. The 2010 IBM Commuter Pain Index rated São Paulo the sixth-worst city for tran-sit, with a daily average (in 2008) of 114 kilo-meters of traffic jams, and Rio de Janeiro eighth, with an average of 95 kilometers. Among the handful of cities rated worse, Bei-jing and Mexico, which top the list, offer trav-elers and commuters more alternatives, nota-bly more extensive subway networks.
These inadequacies are being addressed. In mid-August 2012, the Brazilian government announced the Integrated Logistical Plan, projecting investment over the next five years of more than $40 billion in roads and rail net-works, expanding roads by 7,500 kilometers and railroads by 10,000 kilometers. This fol-lows the auctioning off to private operators, in early 2012, of three of Brazil’s most impor-tant airports—São Paulo International, Campinas, and Brasília—which handle around 50 million passengers annually. Air-ports in rio de Janeiro and Belo horizonte will likely follow suit.
Both the airport concessions and the Integrated Logistical Plan emphasize the role of private companies as both builders and operators, giving the private sector an overdue role in investing in Brazil’s infra-structure in order to reduce bottlenecks and improve efficiency. This fresh investment comes on top of earlier infrastructural development. In 2007, the government introduced the Accelerated Growth Program (PAC), which put $217 billion into projects that address issues such as energy, health, housing, transportation, and sanitation.3 PAC2, running from 2011 to 2014, has more
than double the budget—$471 billion, of which 34 percent was spent by June 2012.
Brazilian cities are also expanding their met-ro systems in advance of the 2014 soccer World Cup and the 2016 Olympics. São Paulo plans to expand its subway lines from 74 kilo-meters to 104 kilometers from 2012 through 2014, and Rio de Janeiro intends to provide 55 kilometers by 2015, compared with the current 42 kilometers.
Companies will find young and plentiful labor, but training will be necessary.
All this represents an overdue correction to one area of economic life in which Brazil has regressed rather than advanced. During the 1970s, when numerous large projects were implemented, infrastructure spending was around 5.4 percent of GDP, but by the first decade of the twenty-first century, spending declined to little more than 2 percent. This contrasts sharply with China, which invested approximately 11 percent of its GDP in infra-structure in 2010, and India, which plans to invest 7.6 percent of its GDP from 2008 through 2012.
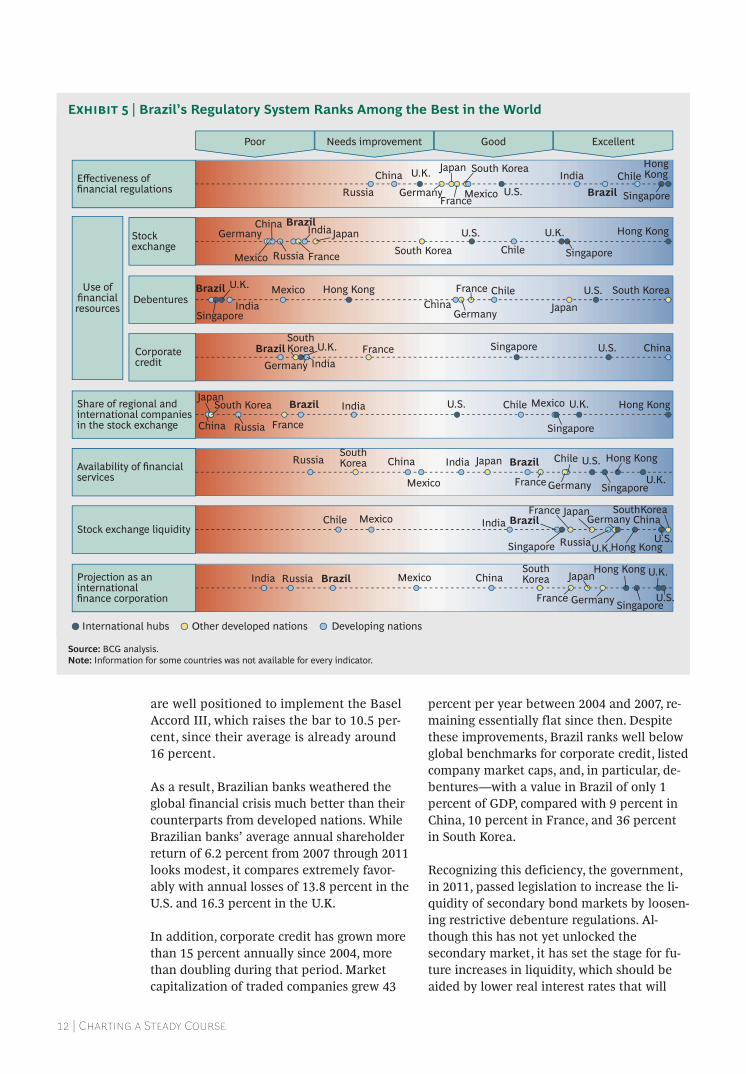
Financial infrastructureInvestors in Brazil know that their money is protected by a regulatory system equal to the best in the world. (See Exhibit 5.) The World Competitiveness Yearbook rates Brazilian finan-cial regulation ahead not only of other BRICs—with India the only serious challeng-er—but also of global financial centers such as the U.S. and the U.K.
Brazil has entrenched rules requiring that investment funds disclose their positions to the regulator, that all derivatives transac-tions be recorded in a central database, and that banks adhere to strict guidelines—in-cluding the maintenance of a Basel Index of 11 percent, compared with the current glob-al norm of 8 percent. Brazil’s central bank says that Brazil-based financial institutions
12 | Charting a steady Course
are well positioned to implement the Basel Accord III, which raises the bar to 10.5 per-cent, since their average is already around 16 percent.
As a result, Brazilian banks weathered the global financial crisis much better than their counterparts from developed nations. While Brazilian banks’ average annual shareholder return of 6.2 percent from 2007 through 2011 looks modest, it compares extremely favor-ably with annual losses of 13.8 percent in the U.S. and 16.3 percent in the U.K.
In addition, corporate credit has grown more than 15 percent annually since 2004, more than doubling during that period. Market capitalization of traded companies grew 43
percent per year between 2004 and 2007, re-maining essentially flat since then. Despite these improvements, Brazil ranks well below global benchmarks for corporate credit, listed company market caps, and, in particular, de-bentures—with a value in Brazil of only 1 percent of GDP, compared with 9 percent in China, 10 percent in France, and 36 percent in South Korea.
Recognizing this deficiency, the government, in 2011, passed legislation to increase the li-quidity of secondary bond markets by loosen-ing restrictive debenture regulations. Al-though this has not yet unlocked the secondary market, it has set the stage for fu-ture increases in liquidity, which should be aided by lower real interest rates that will
Effectiveness offinancial regulations
Stockexchange
Availability of financialservices
Debentures
Stock exchange liquidity
Projection as aninternationalfinance corporation
Corporatecredit
Share of regional andinternational companiesin the stock exchange
Poor Needs improvement Good Excellent
International hubs Other developed nations Developing nations
Brazil Chile
China France
U.K.IndiaJapan Mexico
Russia Singapore
U.S.
India Russia Brazil Mexico ChinaSouthKorea
SouthKorea
South Korea
SouthKorea
SouthKorea
South Korea
South Korea
South Korea
France
Japan
Germany
Hong Kong
Hong Kong
Hong Kong
Hong Kong
HongKong
Hong Kong
Hong Kong
Singapore
U.K.
U.S.
BrazilChileChina
GermanyFrance
U.K. IndiaJapan
MexicoRussia SingaporeU.S.
BrazilChile ChinaFrance
U.K.
IndiaJapan
Mexico
RussiaSingaporeU.S.
Germany
Brazil China
GermanyFranceU.K.
IndiaSingapore U.S.
Brazil ChileChina
Germany
FranceU.K.
India Japan
Mexico
Singapore
U.S.
Brazil
Chile
ChinaGermany
France
U.K.IndiaJapan
Mexico Russia Singapore
U.S.
Brazil ChileChina
GermanyFrance U.K.
India Japan
Mexico
Russia
Singapore
U.S.
Use offinancialresources
Source: BCG analysis.Note: Information for some countries was not available for every indicator.
Exhibit 5 | Brazil’s Regulatory System Ranks Among the Best in the World
The Boston Consulting Group • BRAin | 13
drive investors to other investment vehicles, such as debentures.
Finally, well-established companies have ac-cess to international capital markets and lo-cal stock markets for funding, but Brazil’s small and medium-sized businesses remain underrepresented on the country’s stock ex-change.
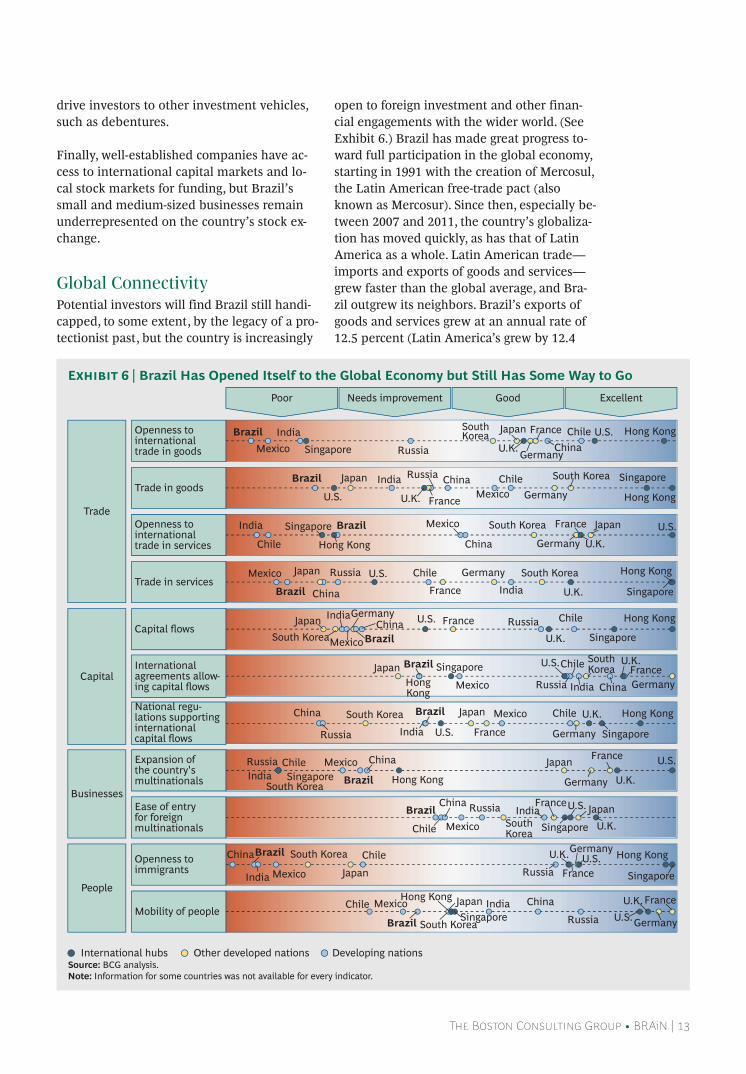
global ConnectivityPotential investors will find Brazil still handi-capped, to some extent, by the legacy of a pro-tectionist past, but the country is increasingly
open to foreign investment and other finan-cial engagements with the wider world. (See Exhibit 6.) Brazil has made great progress to-ward full participation in the global economy, starting in 1991 with the creation of Mercosul, the Latin American free-trade pact (also known as Mercosur). Since then, especially be-tween 2007 and 2011, the country’s globaliza-tion has moved quickly, as has that of Latin America as a whole. Latin American trade—imports and exports of goods and services—grew faster than the global average, and Bra-zil outgrew its neighbors. Brazil’s exports of goods and services grew at an annual rate of 12.5 percent (Latin America’s grew by 12.4
Poor Needs improvement Good Excellent
International hubs Other developed nations Developing nations
Brazil
Chile China Germany
France
U.K.
India JapanMexico
Singapore
U.S.
Brazil Chile
China GermanyFrance
U.K.
India
Japan
Mexico Russia
Singapore U.S.
Brazil ChileChina
GermanyFrance
U.K.
India
Japan Mexico
Russia SingaporeU.S.
Brazil
Chile
China France
U.K.India Japan
Mexico
Russia
Singapore
U.S.
Brazil ChileChina Germany
France
U.K.
India JapanMexico Russia SingaporeU.S.
MexicoIndia
Russia U.K.Chile U.S.Brazil France
China
Japan
Germany
Singapore
Brazil ChileChinaGermanyFranceU.K.
IndiaJapanMexico
Russia Singapore
U.S.
Brazil
Chile
China
Germany
France U.K.India
JapanMexico Russia
Singapore
U.S.
Brazil
ChileChinaGermany
France
U.K.
IndiaJapan
Mexico
RussiaSingapore
U.S.
Brazil
Chile China
Germany
France
U.K.IndiaJapanMexicoRussia
SingaporeU.S.
Brazil
Chile China
Germany
FranceU.K.Hong Kong
Hong Kong
Hong Kong
Hong Kong
Hong Kong
Hong Kong
Hong Kong
Hong Kong
HongKong
Hong Kong
IndiaJapan
South Korea
South Korea
SouthKorea
South Korea
South Korea
South Korea
SouthKorea
South Korea
SouthKorea
South Korea
South Korea
MexicoRussiaSingapore U.S.
Openness tointernationaltrade in goods
Trade in goods
Internationalagreements allow-ing capital flows
Openness toimmigrants
National regu-lations supportinginternationalcapital flows
Expansion ofthe country'smultinationals
Trade in services
Capital flows
Ease of entryfor foreignmultinationals
Mobility of people
Trade
Capital
Openness tointernationaltrade in services
Businesses
People
Source: BCG analysis.Note: Information for some countries was not available for every indicator.
Exhibit 6 | Brazil Has Opened Itself to the Global Economy but Still Has Some Way to Go

14 | Charting a steady Course
percent annually), and imports expanded at 19.7 percent (16.7 percent for Latin America).
This growth took off, however, from a very low base. Brazil’s share of global trade in goods and services is still only 1 percent, well below its 3 percent share of the world’s GDP. Latin America as a whole continues to lag behind, accounting for only 6 percent of global trade in goods and 4 percent in servic-es, compared with 8 percent of global GDP.
One reason is that tariffs remain high. Bra-zil’s import tariffs average 22.1 percent, compared with a global average of 14.1 per-cent. Duties imposed on Brazilian goods are also just above the global norm of 12.1 per-cent. A further handicap is Brazil’s limited participation in the General Agreement on Trade in Services (GATS). The country has only 17 GATS agreements, compared with regional leader Mexico’s 30 and world lead-er Vietnam’s 50. It rates 105 out of 141 coun-tries in the Fraser Institute’s Openness to In-ternational Trade rankings—behind China, Mexico, India, and Chile, which ranks ninth worldwide.
Brazil suffers from a lack of effort to promote it as a place to live or do business.
Brazil receives more foreign investment than any other Latin American economy, but this reflects the country’s size rather than its openness to capital flows. When investment is weighted by GDP, Brazil is far outpaced by Chile, whose regional lead reflects participa-tion in 51 bilateral investment treaties—with partners including the U.S., Canada, and In-dia. Brazil participates in only 14 investment treaties, all with Mercosul partners.
The broader context is formed by limited Lat-in American investment participation. The re-gion’s share of investments both by outsiders in Brazil and by Brazil in other countries has increased since 2007, but these levels are still small compared with other regions and com-pared with the country’s contribution to glob-
al GDP. Investors are hampered by a lack of standardized continentwide regulatory prac-tices, but this is being addressed—in account-ing, at least. In 2011, Brazil adopted the Inter-national Financial Reporting Standards. This move should facilitate comparison and inte-gration with the global competitive landscape.
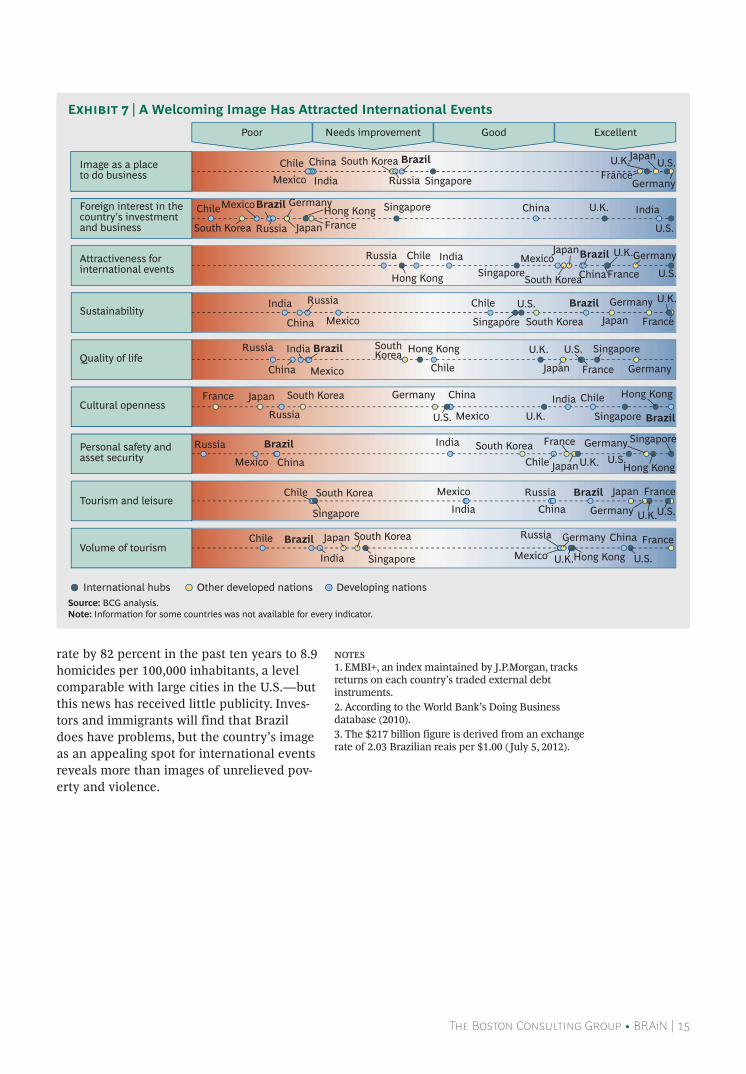
imageBrazil has an open, welcoming image that ap-peals to the rest of the world. Among the countries we compared it with, not one is more open to new ideas, according to interna-tional executives surveyed for the World Com-petitiveness Yearbook. The country ranks among the best in terms of culture and at-tractiveness to tourists—scoring tenth and thirteenth, respectively, out of the 50 coun-tries included in the Anholt-GfK Roper Na-tion Brands index.
That positive image is reflected in the coun-try’s success in attracting international events. (See Exhibit 7.) It hosted 304 international congresses and events in 2011, up from 133 in 2003—an increase of 11 percent per year that makes it seventh in the world overall. It will stage the 2014 soccer World Cup, and Rio will be the host city for the 2016 Olympic Games—events projected to attract 600,000 and 380,000 foreign visitors, respectively.
But Brazil’s image is weaker in other respects. Despite its high scores for culture and tour-ism, its overall Nation Brands rating is below average, reflecting low international opinion of Brazilian goods and of the country as a place to live. The Economist Intelligence Unit’s study of the best cities to live in 2012 rated São Paulo and Rio de Janeiro 42 and 43, respectively, out of 70, well below Latin American peers Buenos Aires, Santiago, and Lima. For personal safety and asset security, the World Competitiveness Yearbook rated Bra-zil low, not far ahead of Mexico and well be-hind India, Chile, and the U.S.
Not all of these misgivings about Brazil are ill-founded, but they are compounded by the lack of a concerted attempt to promote the country as a place to live or do business. Im-ages of poverty and violence go unchal-lenged. São Paulo has reduced its murder
The Boston Consulting Group • BRAin | 15
rate by 82 percent in the past ten years to 8.9 homicides per 100,000 inhabitants, a level comparable with large cities in the U.S.—but this news has received little publicity. Inves-tors and immigrants will find that Brazil does have problems, but the country’s image as an appealing spot for international events reveals more than images of unrelieved pov-erty and violence.
notes1. EMBI+, an index maintained by J.P.Morgan, tracks returns on each country’s traded external debt instruments.2. According to the World Bank’s Doing Business database (2010).3. The $217 billion figure is derived from an exchange rate of 2.03 Brazilian reais per $1.00 ( July 5, 2012).
Image as a placeto do business
Foreign interest in thecountry’s investmentand business
Attractiveness forinternational events
Sustainability
Quality of life
Cultural openness
Personal safety andasset security
Tourism and leisure
Volume of tourism
Poor Needs improvement Good Excellent
International hubs Other developed nations Developing nations
BrazilChile ChinaGermany
France
U.K. India
Japan
Mexico
Russia
Singapore
U.S.
BrazilChile
China
Germany
France
U.K.IndiaJapanMexico
Russia
Singapore
U.S.
BrazilChile ChinaGermany France
U.K.Hong Kong
Hong Kong
Hong Kong
Hong Kong
Hong Kong
Hong Kong
India
Japan South Korea
South Korea
South Korea
South Korea
SouthKorea
South Korea
South Korea
South Korea
South Korea
Mexico
Russia
Singapore U.S.
Brazil
ChileChina GermanyFrance
U.K.India
JapanMexico
Russia SingaporeU.S.
Brazil
ChileChinaGermanyFrance
U.K.IndiaJapan
MexicoRussia SingaporeU.S.
Brazil
ChileChina
GermanyFrance
U.K.
India
JapanMexico
Russia Singapore
U.S.
BrazilChile China
GermanyFrance
U.K.
India
Japan
Mexico Russia Singapore
U.S.
BrazilChileChina Germany
France
U.K.India
JapanMexico Russia
Singapore U.S.
BrazilChile
China
Germany
France
U.K.IndiaJapan
MexicoRussiaSingapore U.S.
Source: BCG analysis.Note: Information for some countries was not available for every indicator.
Exhibit 7 | A Welcoming Image Has Attracted International Events
16 | Charting a steady Course
immenSe PromiSe
The Brazil of today is an increasingly attractive place to do business. The
country has vastly improved political and legal systems and appealing demographic dynamics, all of which offer huge opportuni-ties to employers willing to invest in training their employees. Its infrastructure is still subpar, but the government’s increased openness to private investment bodes well for future development in this area. The financial market as a whole is solid, very profitable, and underpinned by world-class regulation. The country is increasing its connections with the world and has shown growing receptivity to foreign investment and other forms of engagement. Culturally, it is seen as possessing unmatched openness to
new ideas and, as it hosts the World Cup and Olympics, it will have the chance to further improve that perception.
Even though Brazil is starting to attack its chronic bureaucratization, its creaking infra-structure, and the relics of a protectionist past, these challenges will not be eliminated overnight and must be reckoned with by any-one planning to work or invest in Brazil. The bottom line is that investing in Brazil is not for the uncommitted or faint-hearted but of-fers immense promise to the well-informed investor.

The Boston Consulting Group • BRAin | 17
The Boston Consulting Group pub-lishes other publications that may be of interest to decision makers and investors interested in under-standing the Brazilian economic and business environment. Recent examples are listed here.
Allies and Adversaries: 2013 BCG Global ChallengersA report by The Boston Consulting Group, January 2013
Brazil: Confronting the Productivity ChallengeA report by The Boston Consulting Group, January 2013
From Wealth to Well-Being: Introducing the BCG Sustainable Economic Development AssessmentA report by The Boston Consulting Group, November 2012
Capturing Payments Opportunities in Rapidly Developing Economies: Lessons From Brazil and IndiaAn article by The Boston Consulting Group, October 2012
For Further reading

18 | Charting a steady Course
note to the reader
About the AuthorsAndré Xavier is a partner and managing director in the São Paulo office of The Boston Consulting Group. You may contact him by e-mail at [email protected]. Masao Ukon is a partner and managing director in the firm’s São Paulo office. You may contact him by e-mail at [email protected]. Juliana Abreu is a principal in BCG’s São Paulo office. You may contact her by e-mail at [email protected]. Frederick Pierru is a principal in the firm’s Mexico City office. You may contact him by e-mail at [email protected]. João Moreira is a project leader in BCG’s São Paulo office. You may contact him by e-mail at [email protected]. Paulo Oliveira is the CeO and Pedro Guerra a director of Brasil Investments and Business (BRAiN). You may contact them by e-mail at [email protected] and [email protected].
AcknowledgmentsWe would like to thank many cur-rent and former BCG colleagues without whom this report would not be possible: Antonio Riera, Bruno Antunes, Camila Penazzo, Carlo Ca-labro, Cristiana Oashi, daniel Zon-enschein, david Michael, débora Mayer, Diana Gerbase, Duncan Martin, Flavio Magalhaes, Frankie leung, Giuliano Giordano, Henrique Sinatura, Ignacio Pena, Jorge Becer-ra, José Shintate, Juliana Barbosa, luis Figueira, Marcos Aguiar, Paulo Nakamura, Philippe dutheil, Philippe Morel, Rafael Zuana, Sil-mara Costa, Thiago Miskulin, Tjun Tang, v. Chandrashekhar, and Wal-ter Piacsek.
We extend further thanks to BRAiN’s executives and staff mem-bers: luiz Roberto Calado, André luiz Sacconato, José Manoel Moulin Ribeiro Netto, daniel Peres Rosenfeld, Eduardo Oliveira Limei-ra, Filipe de Oliveira Pelepka, dani-lo Corrêa vivan, Juliana dib Rezende, and Sandra de Souza Lima.
We would also to acknowledge Huw Richards for his writing support, as well as katherine Andrews, Gary Callahan, Sarah davis, Angela diBattista, Belinda Gallaugher, and Sara Strassenreiter for contribu-tions to the editing, design, and pro-duction of this report.
For Further ContactAndré XavierPartner and Managing DirectorBCG São Paulo+55 11 3046 [email protected]
Masao UkonPartner and Managing DirectorBCG São Paulo+55 11 3046 [email protected]
Juliana AbreuPrincipalBCG São Paulo+55 11 3046 [email protected]
Frederick PierruPrincipalBCG Mexico City+52 55 5258 [email protected]
João MoreiraProject LeaderBCG São Paulo+55 11 3046 [email protected]
Paulo OliveiraCEO BRAiN+55 11 [email protected]
Pedro GuerraDirector BRAiN+55 11 [email protected]

© The Boston Consulting Group, Inc. 2013. All rights reserved.
For information or permission to reprint, please contact BCG at:e-mail: [email protected]: +1 617 850 3901, attention BCG/PermissionsMail: BCG/Permissions The Boston Consulting Group, Inc. One Beacon Street Boston, MA 02108 USA
To find the latest BCG content and register to receive e-alerts on this topic or others, please visit bcgperspectives.com.
Follow bcg.perspectives on Facebook and Twitter.
4/13


