ARTICLE IN PRESS
Optics and Lasers in Engineering 43 (2005) 151–162
0143-8166/$ -
doi:10.1016/j
�Correspo
E-mail ad
Characterization of Kovar-to-Kovar laser weldedjoints and its mechanical strength
C.W. Tana,b, Y.C. Chana,�, Bernard N.W. Leungb,John Tsunb, Alex C.K. Sob
aDepartment of Electronic Engineering, City University of Hong Kong, 83 Tat Chee Avenue,
Kowloon, Hong KongbPhotonic Manufacturing Service Ltd., 1607, New East Ocean Centre, 9 Science Museum Road,
Tsimshatsui East, Kowloon, Hong Kong
Received 1 January 2004; received in revised form 1 May 2004; accepted 1 June 2004
Available online 1 September 2004
Abstract
For the packaging of a pump laser in butterfly package, the most crucial assembly step is the
fiber-to-laser diode coupling and attachment. The use of laser welding as the joining method
offers several advantages if compared with the adhesive joints: strong joining strength, short
process time and less contamination. This paper reports on laser welding process
characteristics; weld strength and its fracture mode. The penetration depth and melt area of
laser spot welds were found to be complicated functions of laser pulse energy, intensity, and
beam diameter. Effects of pulse width, input power and size of the focal spot on the rate of
energy input to the workpieces and consequently, the weld strength were reported. The weld
strength was found to be dependent on the overlapping area between the two joining
materials. Surface roughness, Ra; has influence on the fraction of energy absorbed, A, and
therefore, affecting the penetration depth. Thermal analysis was carried out on the laser-
welded joints and its heat-affected zone (HAZ) induced by various power densities was
examined. These data are important in order to optimize and utilize the laser welding process
as an effective manufacturing tool for fabrication of reliable pump laser.
r 2004 Elsevier Ltd. All rights reserved.
Keywords: Absorptivity; Heat-affected zone; Laser spot weld; Penetration depth; Weld strength
see front matter r 2004 Elsevier Ltd. All rights reserved.
.optlaseng.2004.06.012
nding author. Tel.: +852-2788-7130; fax: +852-2788-8803.
dress: [email protected] (Y.C. Chan).
ARTICLE IN PRESS
C.W. Tan et al. / Optics and Lasers in Engineering 43 (2005) 151–162152
1. Introduction
The use of glass fiber as the transmission medium in communication networks hasa reasonably long history. However, for most of the period, active optoelectroniccomponents have been limited primarily to light sources and photodetectors. Theresulting packaging solution has been the butterfly package [1]. For the packaging ofa pump laser in butterfly package, the most crucial assembly step is the fiber-to-laserdiode coupling and attachment. The use of laser welding as the joining method offersseveral advantages if compared with the adhesive joints: strong joining strength,short process time and less contamination. It also provides high-speed and high-volume production, and hence the packaging is potentially low cost. Laser welding isa high-energy beam process and the energy density of the laser is achieved by theconcentration of light waves [2]. Application of laser welding technique to asemiconductor laser butterfly package requires mechanical elements such assubmount, ferrule, weld-clips and housing to facilitate fiber handling and retentionwithin the package [3].
Wang et al. [4–5] reported that the weld strength of invar–invar joint increaseslinearly with the increase in power density, however, decreases as the Au thicknessincreases. This observation was related to the increase in thermal conductivity of thewelded material by Au coating, which may lead to the formation of Au solid solutionin the welded sections [4–5].
Sub-micron misalignment or shifts induced during operation in a typical singlemode fiber application may result in significant power loss or light couplingefficiency loss. This would greatly degrade the performance of the packaged module.Since mechanical strength in the weld joint is a prerequisite for not being subjected tomisalignment, it is very critical to understand the effect of various weldingparameters on the weld strength. If the laser welding process characteristic, weldstrength and all other packaging parameters can be optimized, these shifts which aredue to mechanical weakness could be minimized.
This study reports on laser welding process characteristics and the weld strength ofthe welds. Kovar-to-kovar welds that were produced by laser spot weldingtechniques were studied.
2. Experimental procedure
In the process of fabricating a butterfly pump laser, dual beam Newport LaserWeldt Fiber Attachment Systems, LW 4200 was used for pigtail fiber assembly tothe semiconductor laser. It is configured for 2-beam welding of butterfly or DIPpackages in a horizontal optical axis configuration. The system consists of a UnitekMiyachi pulsed Nd:YAG laser and a fiber optic beam-delivery system. The laserbeam power and energy were measured by using Newport Power meter, Model 1835-C.
The model proposed by Ion [6] was modified and used to perform the theoreticalestimation on the temperature–time profile, width of heat-affected zone (HAZ),
ARTICLE IN PRESS
C.W. Tan et al. / Optics and Lasers in Engineering 43 (2005) 151–162 153
absorptivity, A and the peak temperature. The temperature, T(K), at a point in theHAZ increases rapidly from the initial value, T0; to a peak, Tp; and then decreases toroom temperature. The following analytical expression can be derived for thetemperature profiles in the HAZ
T � T0 ¼AðIBEÞe�ðrcr2=4ltÞffiffiffiffiffiffiffiffiffiffiffiffiffiffi
4plrctp : ð1Þ
As for the width of HAZ, at two isotherm positions corresponding to T1 ¼ 873Kand Tm ¼ 1723K
WHAZ ¼ AðIBEÞ
ffiffiffiffiffi2
pe
r1
2rc
1
T1 � T0�
1
Tm � T0
� �: ð2Þ
Peak temperature is estimated by
Tp � T0 ¼AðIBEÞ
ffiffiffiffiffiffiffiffiffiffi2=pe
p2rcr
; ð3Þ
where A is the absorptivity, IBE the incident beam energy, l the thermalconductivity, r the density, c the heat capacity, t the time, r the lateral distancefrom the heat source, e the base of natural logarithms.
By rearranging Eq. (2), A can be calculated from the width of HAZ and theprocess parameters
A ¼WHAZ
IBE
ffiffiffiffiffipe
2
r2rc
1
1T1�T0
� 1Tm�T0
h i : ð4Þ
The shear test was carried out by using INSTRON Mini 44 Tester with a cross-head speed of 0.1 mm/min on 5 samples per experiment run [7]. The shear blade wasplaced approximately 0.5 mm from the top surface of the weld clip.
3. Results and discussion
3.1. Process characteristics
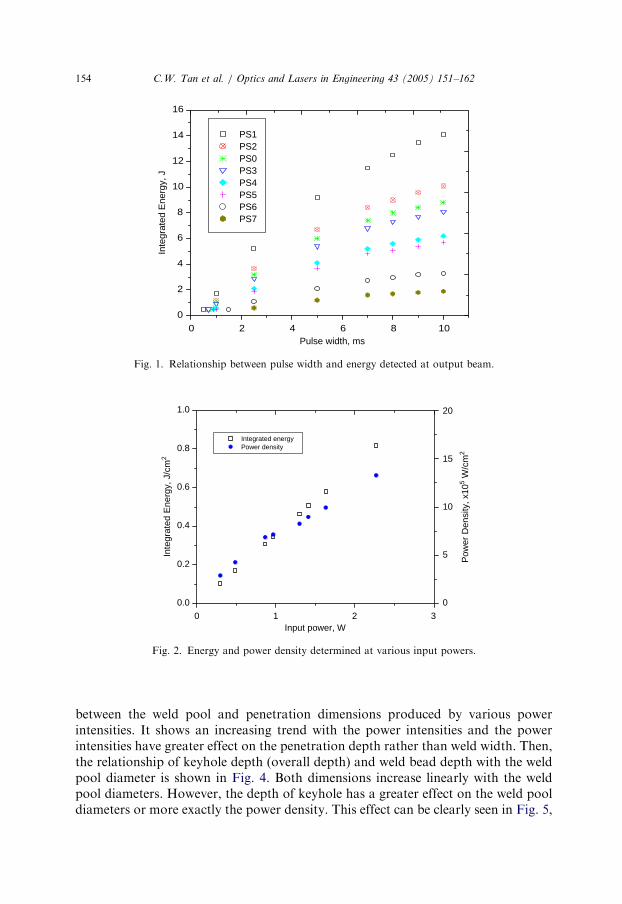
The output laser power of this laser welding system is scheduled by the physicalschedule ranges from 0 to 7. The integrated energy of each physical schedule ismeasured by power meter, and the effect of pulse width of the integrated energy ispresented in Fig. 1. Basically, the longer the pulse width, the higher the integratedenergy determined. It is also shown that the physical schedule indicates differentinput power and energy. Fig. 2 shows the energy and power density determined onthe substrate surface at various input powers. Energy density and power intensityhave a linear relationship with the input power. These different settings were thenused to produce weld joints in the following parts.
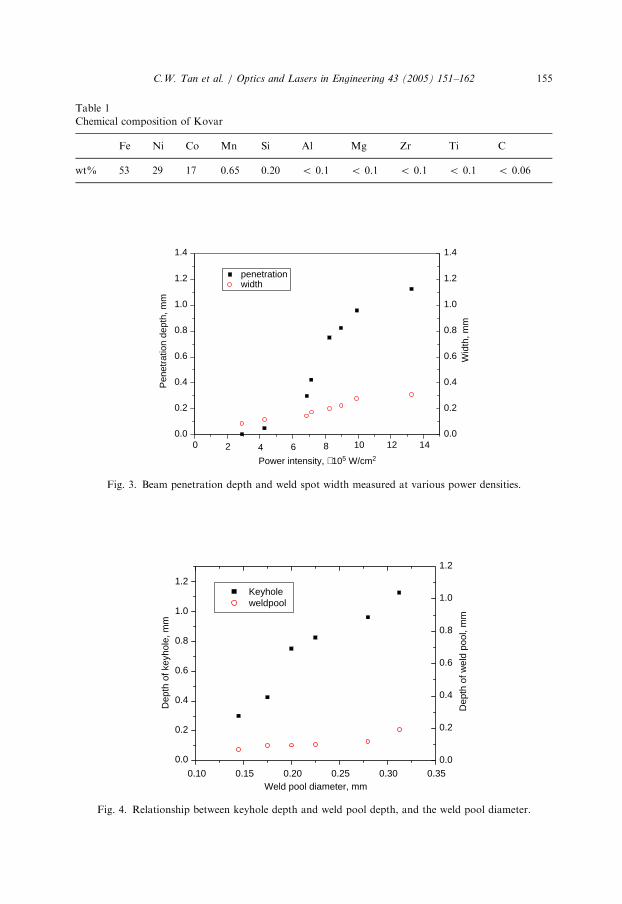
Table 1 shows the chemical composition of Kovar determined by using EDX. Thisfinding is very close to the data provided by vendors. Fig. 3 shows the relationship
ARTICLE IN PRESS
0
0.0
0.2
0.4
0.6
0.8
1.0
Integrated energy Power density
Input power, W
Inte
grat
ed E
nerg
y, J
/cm
2
0
5
10
15
20
Pow
er D
ensi
ty, x
105 W
/cm
2
321
Fig. 2. Energy and power density determined at various input powers.
0 2 8 10
0
2
4
6
8
10
12
14
16
Inte
grat
ed E
nerg
y, J
Pulse width, ms
PS1 PS2 PS0 PS3 PS4 PS5 PS6 PS7
64
Fig. 1. Relationship between pulse width and energy detected at output beam.
C.W. Tan et al. / Optics and Lasers in Engineering 43 (2005) 151–162154
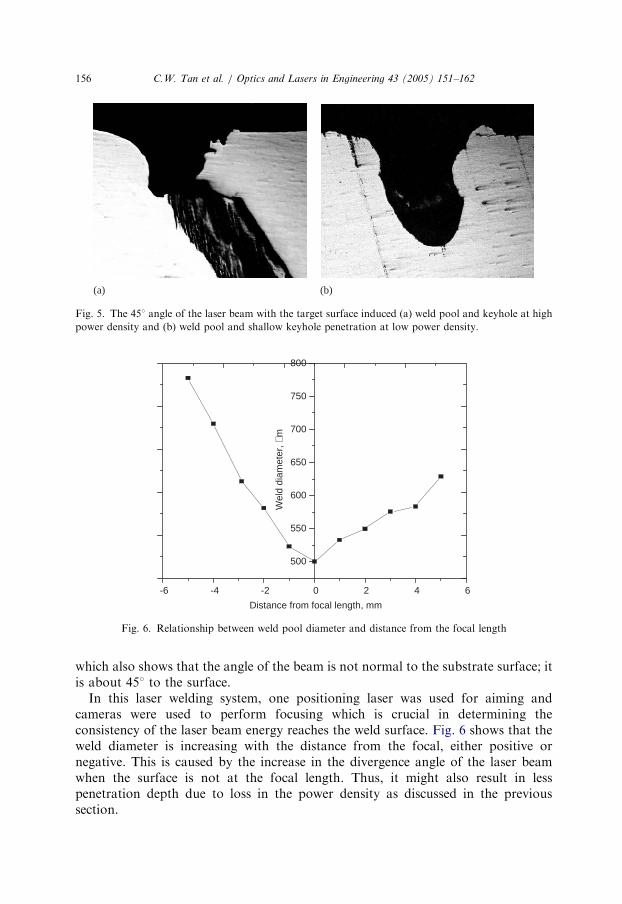
between the weld pool and penetration dimensions produced by various powerintensities. It shows an increasing trend with the power intensities and the powerintensities have greater effect on the penetration depth rather than weld width. Then,the relationship of keyhole depth (overall depth) and weld bead depth with the weldpool diameter is shown in Fig. 4. Both dimensions increase linearly with the weldpool diameters. However, the depth of keyhole has a greater effect on the weld pooldiameters or more exactly the power density. This effect can be clearly seen in Fig. 5,
ARTICLE IN PRESS
Table 1
Chemical composition of Kovar
Fe Ni Co Mn Si Al Mg Zr Ti C
wt% 53 29 17 0.65 0.20 o 0.1 o 0.1 o 0.1 o 0.1 o 0.06
0 10 12 140.0
0.2
0.4
0.6
0.8
1.0
1.2
1.4
Pen
etra
tion
dept
h, m
m
Power intensity, ×105 W/cm2
penetration width
0.0
0.2
0.4
0.6
0.8
1.0
1.2
1.4
Wid
th, m
m
8642
Fig. 3. Beam penetration depth and weld spot width measured at various power densities.
0.10 0.15 0.20 0.25 0.30 0.35
Dep
th o
f key
hole
, mm
Weld pool diameter, mm
Keyhole weldpool
0.0
0.2
0.4
0.6
0.8
1.0
1.2
0.0
0.2
0.4
0.6
0.8
1.0
1.2
Dep
th o
f wel
d po
ol, m
m
Fig. 4. Relationship between keyhole depth and weld pool depth, and the weld pool diameter.
C.W. Tan et al. / Optics and Lasers in Engineering 43 (2005) 151–162 155
ARTICLE IN PRESS
(a) (b)
Fig. 5. The 451 angle of the laser beam with the target surface induced (a) weld pool and keyhole at high
power density and (b) weld pool and shallow keyhole penetration at low power density.
-6 -4 -2 0 2 4 6
500
550
600
650
700
750
800
Wel
d di
amet
er, µ
m
Distance from focal length, mm
Fig. 6. Relationship between weld pool diameter and distance from the focal length
C.W. Tan et al. / Optics and Lasers in Engineering 43 (2005) 151–162156
which also shows that the angle of the beam is not normal to the substrate surface; itis about 451 to the surface.
In this laser welding system, one positioning laser was used for aiming andcameras were used to perform focusing which is crucial in determining theconsistency of the laser beam energy reaches the weld surface. Fig. 6 shows that theweld diameter is increasing with the distance from the focal, either positive ornegative. This is caused by the increase in the divergence angle of the laser beamwhen the surface is not at the focal length. Thus, it might also result in lesspenetration depth due to loss in the power density as discussed in the previoussection.
ARTICLE IN PRESS
C.W. Tan et al. / Optics and Lasers in Engineering 43 (2005) 151–162 157
3.2. Modeling
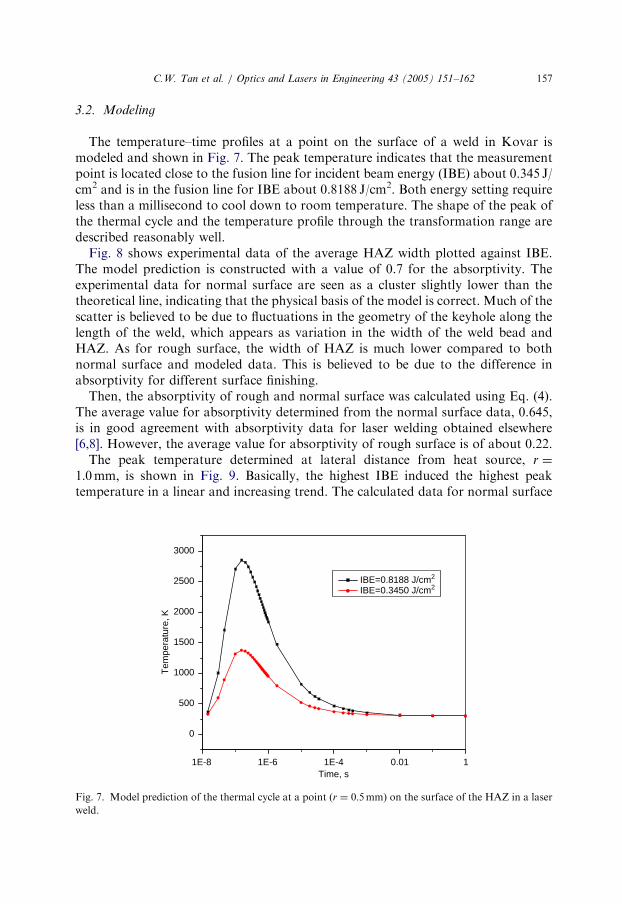
The temperature–time profiles at a point on the surface of a weld in Kovar ismodeled and shown in Fig. 7. The peak temperature indicates that the measurementpoint is located close to the fusion line for incident beam energy (IBE) about 0.345 J/cm2 and is in the fusion line for IBE about 0.8188 J/cm2. Both energy setting requireless than a millisecond to cool down to room temperature. The shape of the peak ofthe thermal cycle and the temperature profile through the transformation range aredescribed reasonably well.
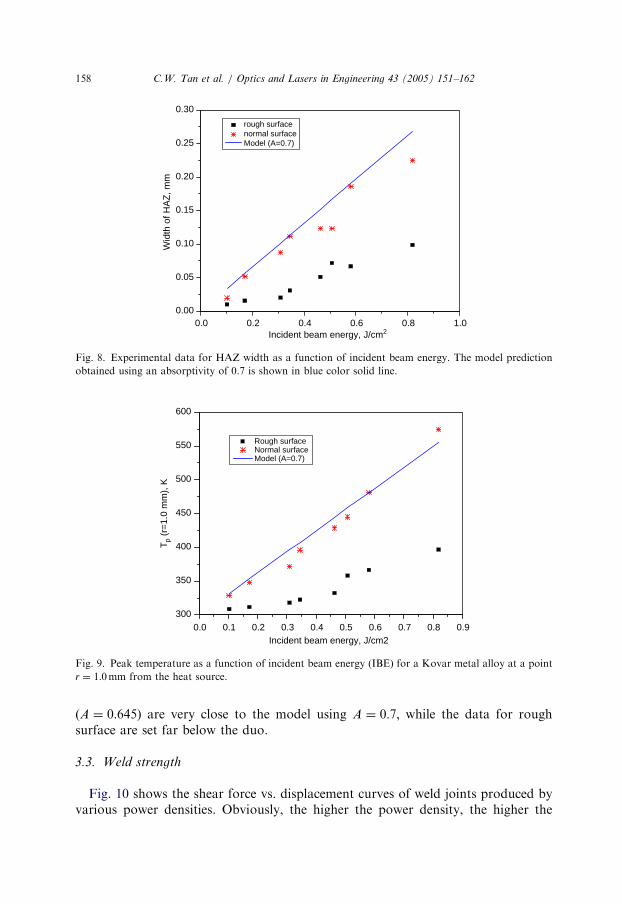
Fig. 8 shows experimental data of the average HAZ width plotted against IBE.The model prediction is constructed with a value of 0.7 for the absorptivity. Theexperimental data for normal surface are seen as a cluster slightly lower than thetheoretical line, indicating that the physical basis of the model is correct. Much of thescatter is believed to be due to fluctuations in the geometry of the keyhole along thelength of the weld, which appears as variation in the width of the weld bead andHAZ. As for rough surface, the width of HAZ is much lower compared to bothnormal surface and modeled data. This is believed to be due to the difference inabsorptivity for different surface finishing.
Then, the absorptivity of rough and normal surface was calculated using Eq. (4).The average value for absorptivity determined from the normal surface data, 0.645,is in good agreement with absorptivity data for laser welding obtained elsewhere[6,8]. However, the average value for absorptivity of rough surface is of about 0.22.
The peak temperature determined at lateral distance from heat source, r ¼
1:0mm; is shown in Fig. 9. Basically, the highest IBE induced the highest peaktemperature in a linear and increasing trend. The calculated data for normal surface
1E-8 1E-6 1E-4 0.01 1
0
500
1000
1500
2000
2500
3000
Tem
pera
ture
, K
Time, s
IBE=0.8188 J/cm2
IBE=0.3450 J/cm2
Fig. 7. Model prediction of the thermal cycle at a point (r ¼ 0:5mm) on the surface of the HAZ in a laser
weld.
ARTICLE IN PRESS
0.0 0.2 0.4 0.6 0.8 1.00.00
0.05
0.10
0.15
0.20
0.25
0.30
Wid
th o
f HA
Z, m
m
Incident beam energy, J/cm2
rough surface normal surface Model (A=0.7)
Fig. 8. Experimental data for HAZ width as a function of incident beam energy. The model prediction
obtained using an absorptivity of 0.7 is shown in blue color solid line.
0.0 0.1 0.2 0.3 0.4 0.5 0.6 0.7 0.8 0.9300
350
400
450
500
550
600
Tp
(r=
1.0
mm
), K
Incident beam energy, J/cm2
Rough surface Normal surface Model (A=0.7)
Fig. 9. Peak temperature as a function of incident beam energy (IBE) for a Kovar metal alloy at a point
r ¼ 1:0mm from the heat source.
C.W. Tan et al. / Optics and Lasers in Engineering 43 (2005) 151–162158
(A ¼ 0:645) are very close to the model using A ¼ 0:7; while the data for roughsurface are set far below the duo.
3.3. Weld strength
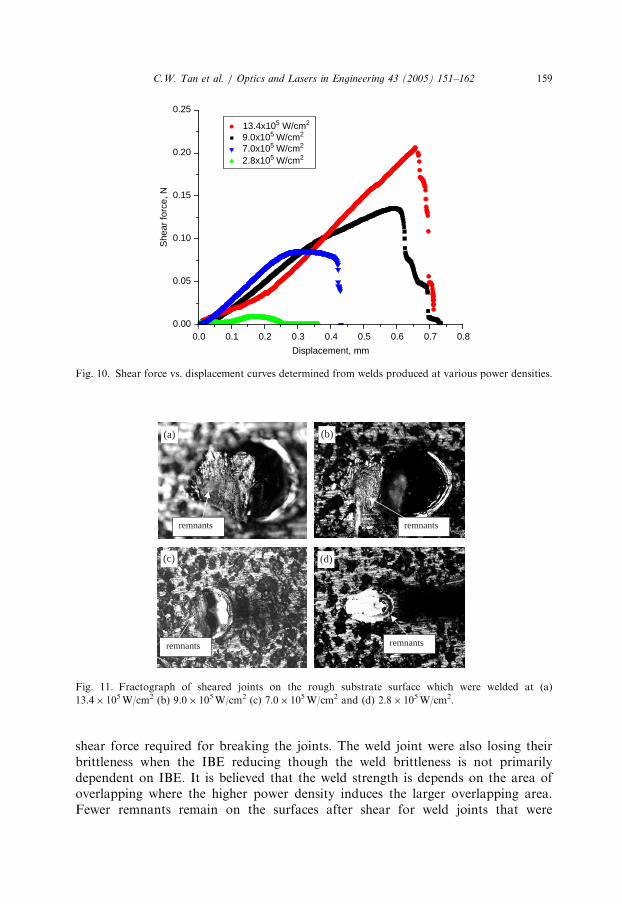
Fig. 10 shows the shear force vs. displacement curves of weld joints produced byvarious power densities. Obviously, the higher the power density, the higher the
ARTICLE IN PRESS
0.0 0.1 0.2 0.3 0.4 0.5 0.6 0.7 0.80.00
0.05
0.10
0.15
0.20
0.25
She
ar fo
rce,
N
Displacement, mm
13.4x10⁵ W/cm2
9.0x10⁵ W/cm2
7.0x10⁵ W/cm2
2.8x10⁵ W/cm2
Fig. 10. Shear force vs. displacement curves determined from welds produced at various power densities.
remnants remnants
remnants remnants
(a) (b)
(c) (d)
Fig. 11. Fractograph of sheared joints on the rough substrate surface which were welded at (a)
13.4� 105 W/cm2 (b) 9.0� 105 W/cm2 (c) 7.0� 105 W/cm2 and (d) 2.8� 105 W/cm2.
C.W. Tan et al. / Optics and Lasers in Engineering 43 (2005) 151–162 159
shear force required for breaking the joints. The weld joint were also losing theirbrittleness when the IBE reducing though the weld brittleness is not primarilydependent on IBE. It is believed that the weld strength is depends on the area ofoverlapping where the higher power density induces the larger overlapping area.Fewer remnants remain on the surfaces after shear for weld joints that were
ARTICLE IN PRESS
C.W. Tan et al. / Optics and Lasers in Engineering 43 (2005) 151–162160
produced at lower power density, as shown in Fig. 11. This is an evidence to supportthe idea that larger overlapping area results in higher shear strength.
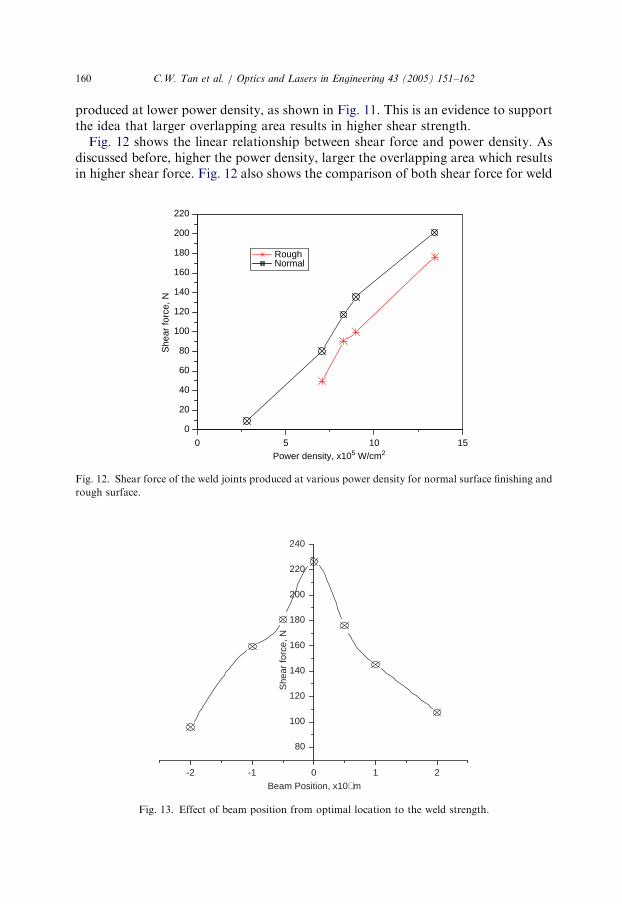
Fig. 12 shows the linear relationship between shear force and power density. Asdiscussed before, higher the power density, larger the overlapping area which resultsin higher shear force. Fig. 12 also shows the comparison of both shear force for weld
0 10 15
0
20
40
60
80
100
120
140
160
180
200
220
She
ar fo
rce,
N
Power density, x105 W/cm2
Rough Normal
5
Fig. 12. Shear force of the weld joints produced at various power density for normal surface finishing and
rough surface.
-2 -1 0 1 2
80
100
120
140
160
180
200
220
240
She
ar fo
rce,
N
Beam Position, x10µm
Fig. 13. Effect of beam position from optimal location to the weld strength.
ARTICLE IN PRESS
C.W. Tan et al. / Optics and Lasers in Engineering 43 (2005) 151–162 161
joints that were produced on the rough and normal surface. In the previous section,modeling results showed that the rougher surface will lose absorptivity, A, thus,reduce in its beam penetration, HAZ, and also the overlapping area. Therefore, theshear force data of rough surface welded joints were lower than the shear force datafor normal surface.
It’s very important to have a positioning laser beam in order to aim at the rightposition during laser welding. Fig. 13 shows the effect of shifting from the targetposition to the shear force. It demonstrates that when the beam was off target eitherto the left or to the right, result in a declining in shear force results.
4. Conclusions
The penetration depth and melt area of laser spot welds were found, to be acomplicated function of laser pulse energy, intensity, and beam diameter. Defocusedlaser beam diversifies the beam thus increases the weld pool diameter but decreasesin penetration depth. The weld strength was dependent on the overlap area betweenthe two joining materials. Effects of pulse width, input power, and size of the focalspot on the rate of energy input to the workpieces and consequently on, the weldstrength is reported. Surface roughness, Ra, has influence on the imaginary part ofthe refractive index, k, and therefore, affects the penetration depth. Thermal analysiswas carried out on these laser-welded joints. Higher power density should producestronger weld joint. However excessive setting will harm the laser device due tooverheating. Base on the result of this study, one should be able to have a better ideaon optimizing the process parameters. These data are important in order to optimizeand utilize the laser-welding process as an effective manufacturing tool forfabrication of reliable pump laser.
Acknowledgment
The authors would like to acknowledge the grant from the Government of theHong Kong Special Administrative Region—Innovation and Technology Fund(ITF), University–Industry Collaboration Program (Project no. UIT/033, and CityUref: 9440025).
References
[1] Velsher B. Application-specific optoelectronic packaging. Proceedings of the IEEE ECTC, San Diego,
CA: 2002. p. 794–800.
[2] http://www.joiningtech.com/pages/reflaser2.html.
[3] Lin Y, Liu W, Shi FG. Laser welding induced alignment distortion in butterfly laser module packages:
effect of welding sequence. IEEE Trans. Adv. Pack. 2002;25(1):73–8.

ARTICLE IN PRESS
C.W. Tan et al. / Optics and Lasers in Engineering 43 (2005) 151–162162
[4] Wang SC, Wang C, Tu YK, Wang CJ, Chi S, Wang WH, Cheng WH. Effect of Au coating on joint
strength in laser welding for Invar–Invar packages. Proceedings of the IEEE ECTC, Orlando, FL:
1996. p. 942–5.
[5] Wang SC, Chang HL, Wang C, Wang CM, Liaw JW, Sheen MT, Sheu YC, Kuang JH, Chi S, Yang
YD, Cheng WH. Effect of Au thickness on laser beam penetration in Invar-to-Invar packages.
Proceedings of the IEEE ECTC, San Jose, CA: 1997. p. 1272–6.
[6] Ion JC. Modeling of laser welding of Carbon manganese steels. In: Cerjak H, Bhadeshia HKDH,
editors. Mathematical modelling of weld phenomena 3. London: The Institute of Materials; 1997.
p. 917–31.
[7] Tan CW, Chan YC, Yeung NH. Behaviour of anisotropic conductive joints under mechanical loading.
Microelectronics Reliability 2003;43(3):481–6.
[8] Duley WW. Laser welding. New York: Wiley; 1998.


