148
CHAPTER 5
Trends and Policies of Urbanization
5.1 Trends of Urbanization
5.1.1 Overview of Trends of Urbanization
at Global Level
5.1.2 Overview of Trends of Urbanization in India
5.1.3 Urban Growth in India and Gujarat
5.1.4 Development and Growth of
Urban Centres of Gujarat
5.1.5 Population Growth and Trend of
Urbanization in Gujarat
5.1.6 Urban Growth by size class
5.1.7 Spatial Pattern of Urbanization
5.2 Urban Policies
5.2.1 Overview of five year plan of India
5.2.2 Overview of five year plan of Gujarat
5.2.3 Comparative Analysis between India and Gujarat
5.2.4 Urban Policy of India
5.2.5 Urban Policy of Gujarat Impact of Urbanization
Trend and Policy on Urban Regions
149
CHAPTER 5
Trends and Policies of Urbanization
5.1 Trends of UrbanizationUrbanization indicates population residing in the urban area of a nation.
The trend of urbanization at global, national, as well as state level helps to
understand the significance and problems of urban region.
5.1.1. Overview of Trends of Urbanization at Global Level“A city may be defined in several ways: as a population aggregate; as a
community; and as a political entity” (Hicks, 1946). However, community,
culture, political ideologies, amenities, and services differ from economy to
economy. Hence, population aggregate is best suited common indicator to
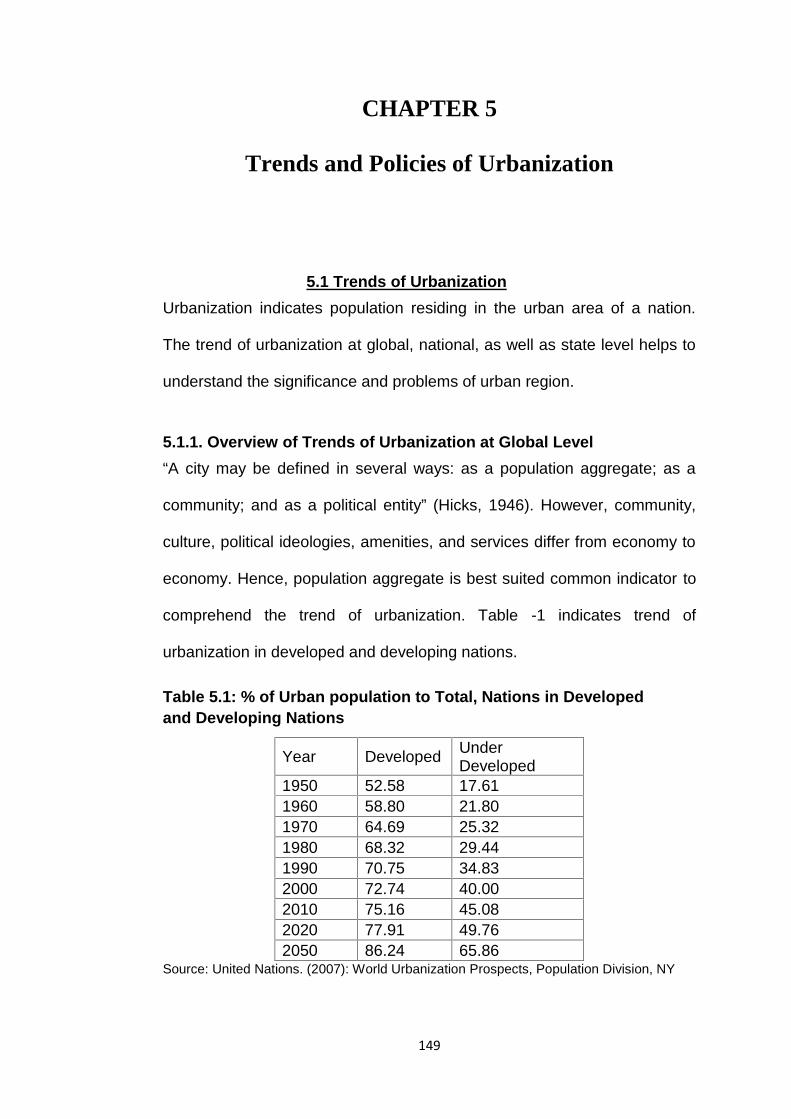
comprehend the trend of urbanization. Table -1 indicates trend of
urbanization in developed and developing nations.
Table 5.1: % of Urban population to Total, Nations in Developedand Developing Nations
Year Developed UnderDeveloped
1950 52.58 17.611960 58.80 21.801970 64.69 25.321980 68.32 29.441990 70.75 34.832000 72.74 40.002010 75.16 45.082020 77.91 49.762050 86.24 65.86
Source: United Nations. (2007): World Urbanization Prospects, Population Division, NY
150
The trend of urbanization in underdeveloped and developed nations is
indicated by table-1. During 1950’s the percentage of urban population to
total in developing nation was only 17.61 percent while in case of
developed nation it is more than fifty percent. The growth of urbanization in
developed nations is almost 1.64 times in eleven decades while that of
underdeveloped nations is 3.73 times. This however is positive change in
case of underdeveloped nations. In case of urbanised developed nations,
growth of urban population is possible only if there is growth in total
population.
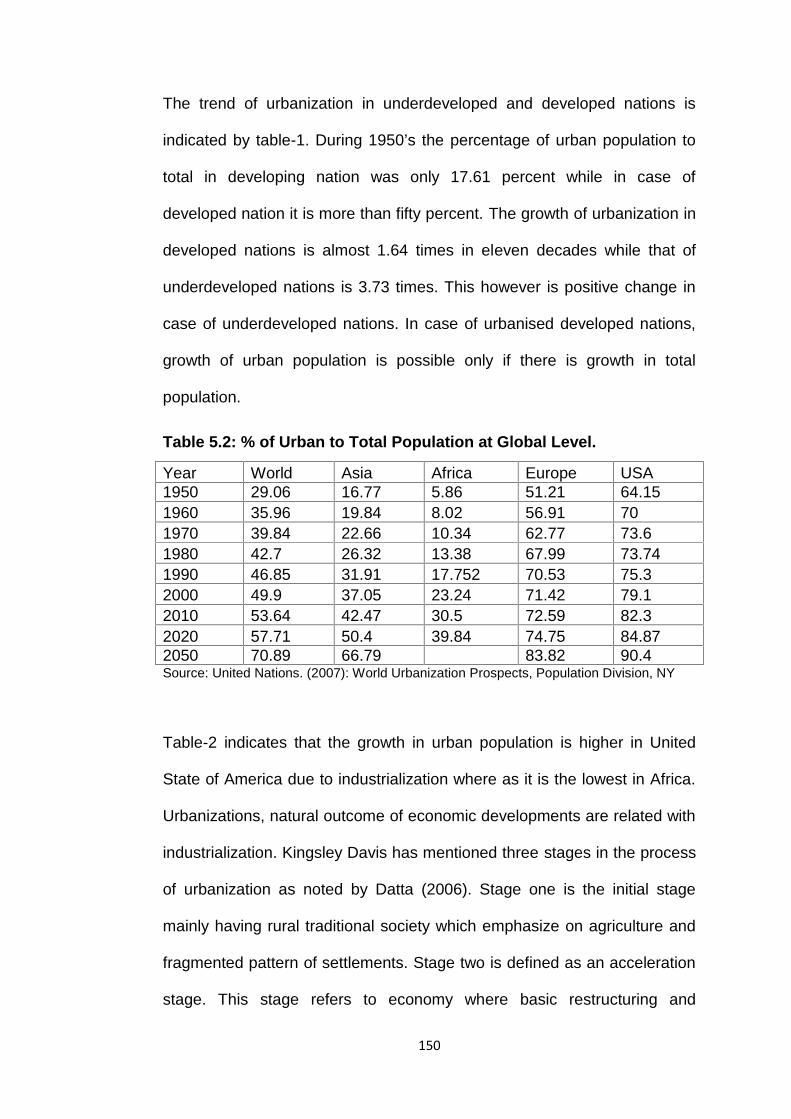
Table 5.2: % of Urban to Total Population at Global Level.
Year World Asia Africa Europe USA1950 29.06 16.77 5.86 51.21 64.151960 35.96 19.84 8.02 56.91 701970 39.84 22.66 10.34 62.77 73.61980 42.7 26.32 13.38 67.99 73.741990 46.85 31.91 17.752 70.53 75.32000 49.9 37.05 23.24 71.42 79.12010 53.64 42.47 30.5 72.59 82.32020 57.71 50.4 39.84 74.75 84.872050 70.89 66.79 83.82 90.4Source: United Nations. (2007): World Urbanization Prospects, Population Division, NY
Table-2 indicates that the growth in urban population is higher in United
State of America due to industrialization where as it is the lowest in Africa.
Urbanizations, natural outcome of economic developments are related with
industrialization. Kingsley Davis has mentioned three stages in the process
of urbanization as noted by Datta (2006). Stage one is the initial stage
mainly having rural traditional society which emphasize on agriculture and
fragmented pattern of settlements. Stage two is defined as an acceleration
stage. This stage refers to economy where basic restructuring and

151
investment in social overhead capital includes transportation;
communication etc has already taken place. Proportion of urban population
in this state gradually increases from 25% to 40%, 50%, 60% and so on.
Hence, dependence on primary sector decreases gradually. Third stage is
known as terminal stage where urban population exceeds 70% or more. At
this stage, level of urbanization remains more or less same or constant.
Rate of growth of urban population and total population becomes same at
this terminal stage. Hence, we can conclude that most of the developed
countries of Europe and USA are in the terminal stage except for Latin
America. While most of the nations of Asian and African continent are in
the second stage of urbanization. However, few of them are even at the
first stage of urbanization.
Table 5.3: % of Urban to Total Population, India and her NeighbouringCountries
Year World Asia India China Pakistan Srilanka Nepal1950 29.06 16.77 17.04 13 17.52 15.33 2.671960 35.96 19.84 17.92 16.01 22.1 16.44 3.481970 39.84 22.66 19.76 17.04 24.82 19.52 3.961980 42.07 26.32 23.01 19.64 28.06 18.78 6.091990 46.85 31.91 25.55 27.04 30.57 17.2 0.882000 49.9 37.05 27.66 35.78 33.17 15.71 1.342010 53.64 42.47 30.06 44.93 37.03 15.13 1.822020 57.71 50.4 34.26 53.22 42.76 16.9 2.392050 70.98 66.79 55.17 72.92 63.66 33.97 46.33
Source: United Nations. (2007): World Urbanization Prospects, Population Division, NY
Table-3 shows the level of urbanization in India and her neighboring
nations. Among Asian countries India and China are rapidly growing
countries in terms of population, economies and political influences etc. In
next decade i.e.2020 urban population of India is expected to grow just by
152
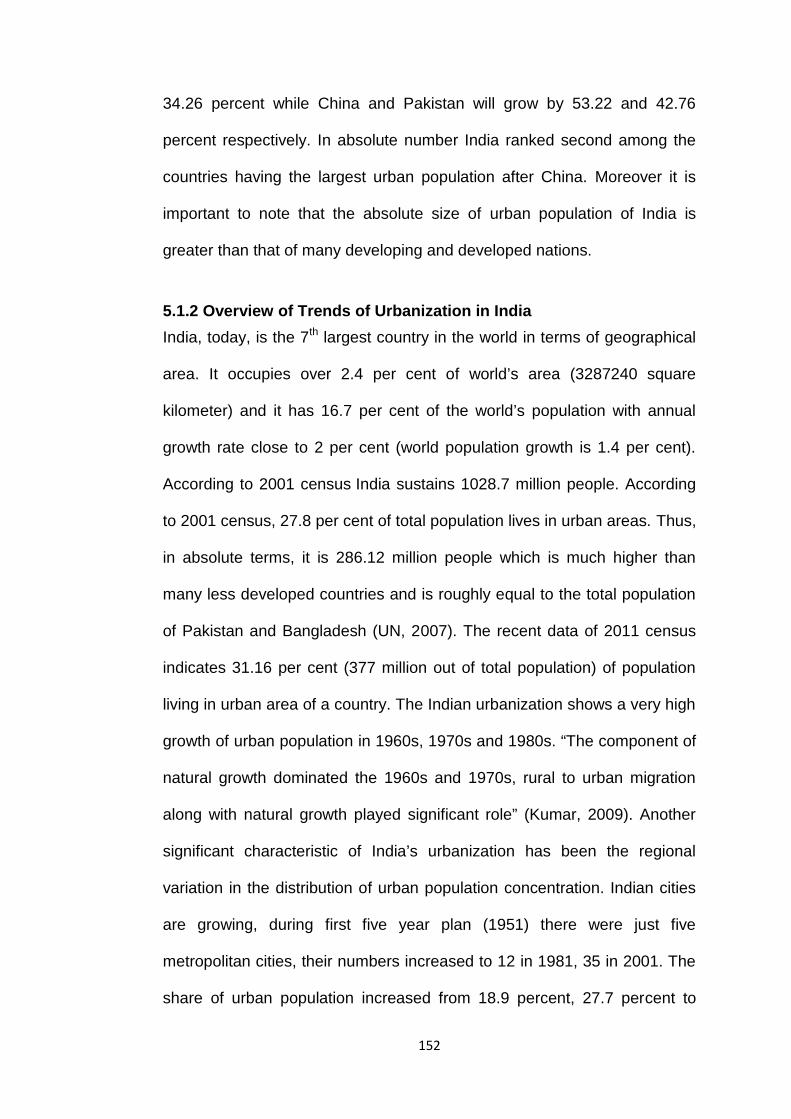
34.26 percent while China and Pakistan will grow by 53.22 and 42.76
percent respectively. In absolute number India ranked second among the
countries having the largest urban population after China. Moreover it is
important to note that the absolute size of urban population of India is
greater than that of many developing and developed nations.
5.1.2 Overview of Trends of Urbanization in IndiaIndia, today, is the 7th largest country in the world in terms of geographical
area. It occupies over 2.4 per cent of world’s area (3287240 square
kilometer) and it has 16.7 per cent of the world’s population with annual
growth rate close to 2 per cent (world population growth is 1.4 per cent).
According to 2001 census India sustains 1028.7 million people. According
to 2001 census, 27.8 per cent of total population lives in urban areas. Thus,
in absolute terms, it is 286.12 million people which is much higher than
many less developed countries and is roughly equal to the total population
of Pakistan and Bangladesh (UN, 2007). The recent data of 2011 census
indicates 31.16 per cent (377 million out of total population) of population
living in urban area of a country. The Indian urbanization shows a very high
growth of urban population in 1960s, 1970s and 1980s. “The component of
natural growth dominated the 1960s and 1970s, rural to urban migration
along with natural growth played significant role” (Kumar, 2009). Another
significant characteristic of India’s urbanization has been the regional
variation in the distribution of urban population concentration. Indian cities
are growing, during first five year plan (1951) there were just five
metropolitan cities, their numbers increased to 12 in 1981, 35 in 2001. The
share of urban population increased from 18.9 percent, 27.7 percent to
153
37.8 percent respectively. A large proportion of the urban population has
been concentrated in these few cities and states like Maharashtra, Gujarat,
Tamilnadu, Karnataka Punjab and West Bengal. These states accounts for
about half of the country’s urban population. “It is Industrialization process
during – 1960s and 70’s which led to accelerated urban growth in these
states-except Punjab”(Kumar, 2009). However, urbanization i.e. people
moving into cities does not guarantee growth unless provided absolute
quality of opportunity in urban area.
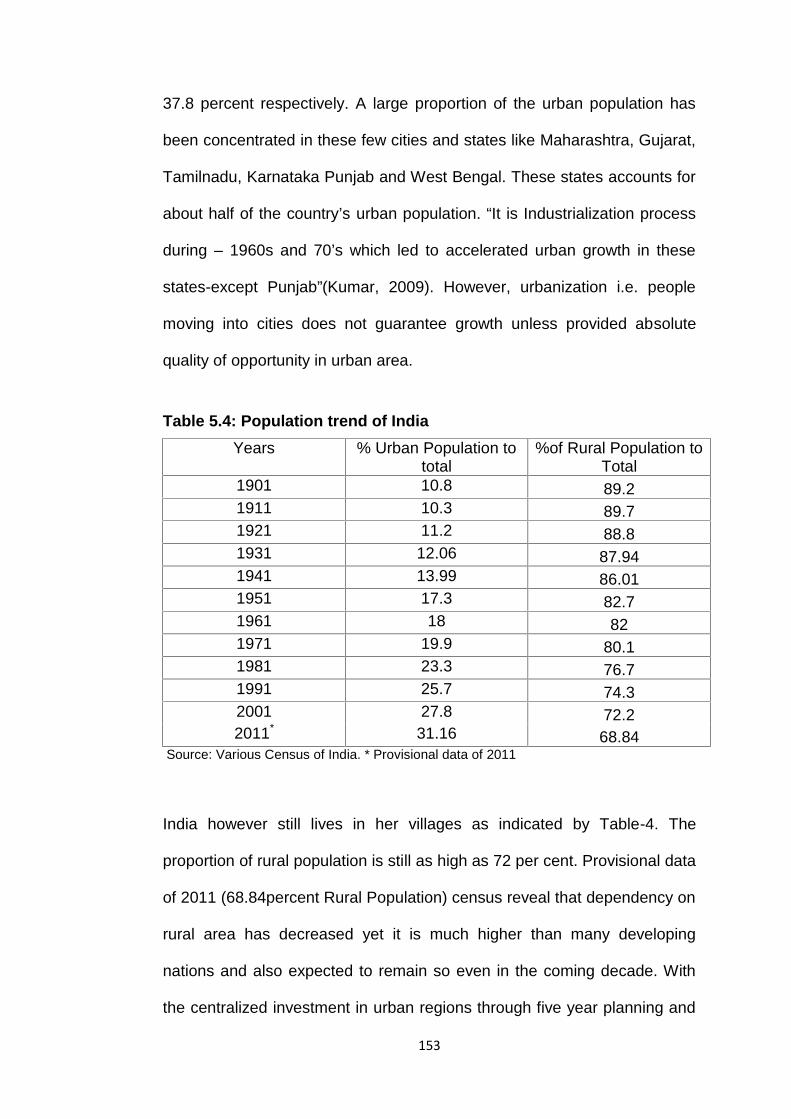
Table 5.4: Population trend of IndiaYears % Urban Population to
total%of Rural Population to
Total1901 10.8 89.21911 10.3 89.71921 11.2 88.81931 12.06 87.941941 13.99 86.011951 17.3 82.71961 18 821971 19.9 80.11981 23.3 76.71991 25.7 74.32001 27.8 72.22011* 31.16 68.84
Source: Various Census of India. * Provisional data of 2011
India however still lives in her villages as indicated by Table-4. The
proportion of rural population is still as high as 72 per cent. Provisional data
of 2011 (68.84percent Rural Population) census reveal that dependency on
rural area has decreased yet it is much higher than many developing
nations and also expected to remain so even in the coming decade. With
the centralized investment in urban regions through five year planning and
154
with the liberalization that leads to higher movement from rural to urban
region, as table-5, indicates mammoth jump towards urban region has
been made possible. The trend has continued and economic reforms
added fuel to this trend. It is important to note that urban population has
increased 2.57 times while rural population of a nation increased just by
0.80 times in the last hundred years.
In the Indian Context urbanization can be defined as per the criteria
adopted in the 2001 census;
a) All statutory towns i.e. all places with municipal corporations, municipal
board, cantonment board, notified area etc
b) Census towns which are non-statutory towns or actually rural areas but
satisfy the following criteria
1. Minimum Population of 5000
2. At least 75% of the male working population engaged in non-agriculture
activity,
3. Density of population of at least 400 persons per Square Kilometer
It is important to note that less than one third of population live in cities and
towns, these areas generate over two third of country's Gross Domestic
Product (GDP).
.(WB)(http://www.worldbank.org.in/WBSITE/EXTERNAL/COUNTIRES/SO
UTHASIAEXT/INDIAEXTN/O,,contentMDK:21207992~pagePK:141137~pi
PK:141127~theSitePK:295584,00.html). They account for 90 per cent of
government revenue. Another “estimate of central statistical organization
indicate that urban share in gross domestic product (GDP) was 37.7percent
155
in 1970-71, 52 percent in 1999-2000, 62 to 63 percent in 2009-10(mid-term
appraisal of 11th five year plan) and will be 75 per cent in 2030” (GOI,2011).
Hence there is increasing contribution from urban regions. According to
available data of 2000(UNFPA,2001) three out of world's 21 mega cites in
millions are in India namely, Mumbai (3rd) Delhi (13th) and Kolkata (9th). In
2001, India had 35 cities / urban areas with a population of more than one
million people. In total, some 108 million Indians, or 10.5 per cent of the
national population, live in the country’s 35 largest cities (City Mayors,
http://www.citymayors.com/gratis/indian_cities.htmll). The concentration of
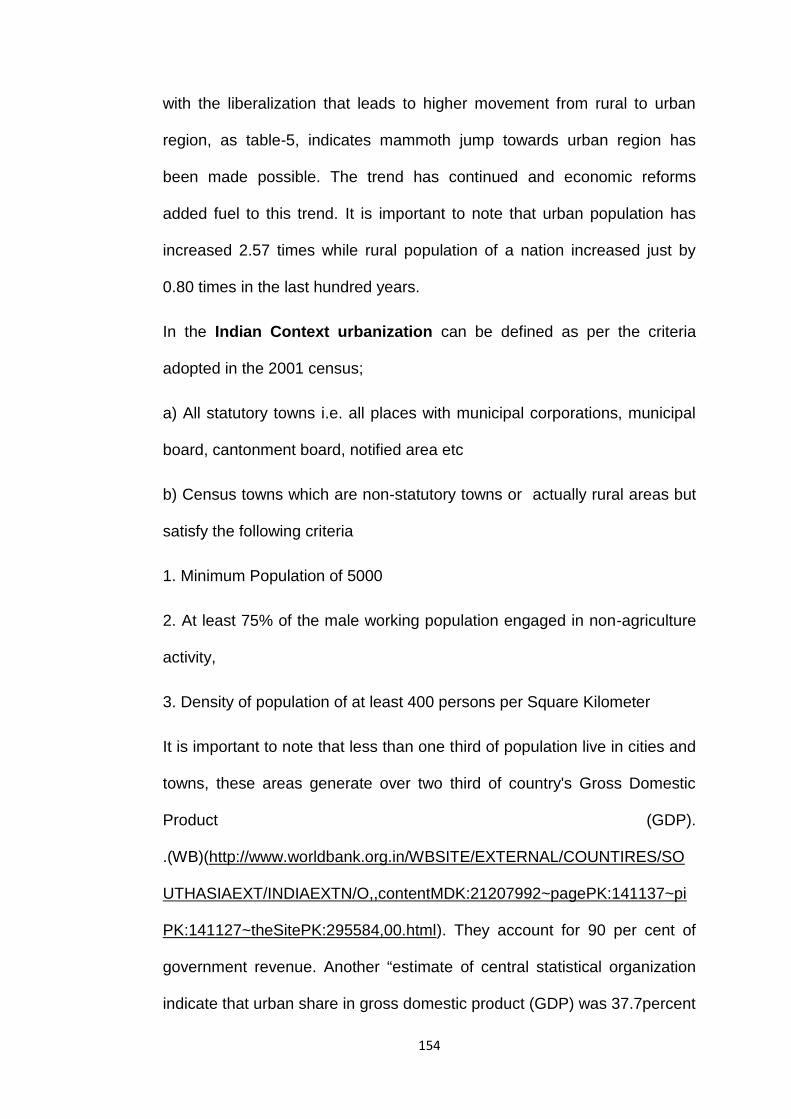
urban population in larger cities is increasing which can be seen from the
table given below:
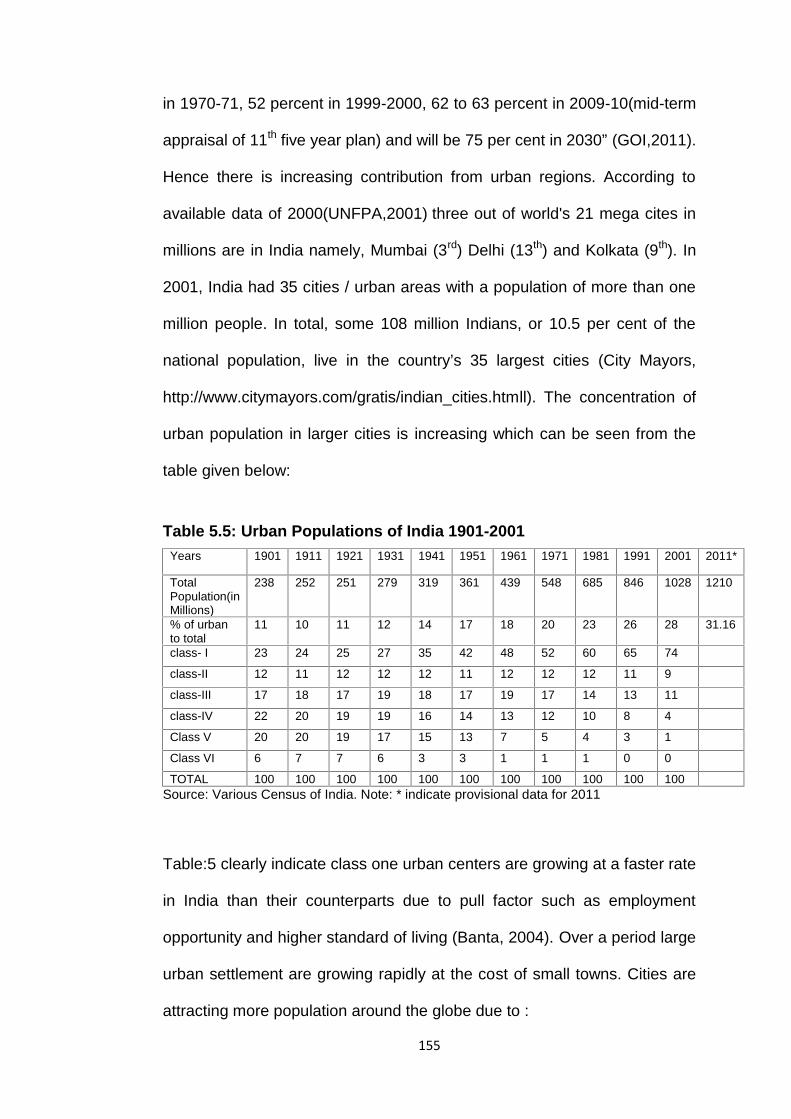
Table 5.5: Urban Populations of India 1901-2001Years 1901 1911 1921 1931 1941 1951 1961 1971 1981 1991 2001 2011*
TotalPopulation(inMillions)
238 252 251 279 319 361 439 548 685 846 1028 1210
% of urbanto total
11 10 11 12 14 17 18 20 23 26 28 31.16
class- I 23 24 25 27 35 42 48 52 60 65 74
class-II 12 11 12 12 12 11 12 12 12 11 9
class-III 17 18 17 19 18 17 19 17 14 13 11
class-IV 22 20 19 19 16 14 13 12 10 8 4
Class V 20 20 19 17 15 13 7 5 4 3 1
Class VI 6 7 7 6 3 3 1 1 1 0 0
TOTAL 100 100 100 100 100 100 100 100 100 100 100Source: Various Census of India. Note: * indicate provisional data for 2011
Table:5 clearly indicate class one urban centers are growing at a faster rate
in India than their counterparts due to pull factor such as employment
opportunity and higher standard of living (Banta, 2004). Over a period large
urban settlement are growing rapidly at the cost of small towns. Cities are
attracting more population around the globe due to :
156
a) Economies of Scale
b) Desire for better life & employment
c) More Economic Opportunities
d) Structural shift (Agriculture sector to Industrial sector)
e) Availability of Better and specialized goods & services
f) Inherent bias of Indian policy maker in favour of urban areas.(In case of
India). (Bhatt, 1984).
5.1.3. Urban Growth in India and Gujarat
India is a rapidly urbanizing nation and Gujarat is one of the most
urbanized states of India. Gujarat is the 5th highest urbanized state with
37.35 % population living in urban areas as compared to 27.3 % for the
India according to 2001 census. The provisional data of census 2011
indicates that urban population of India will grow by 31.16 percent while in
case of Gujarat it will be as high as 42.58 percent.
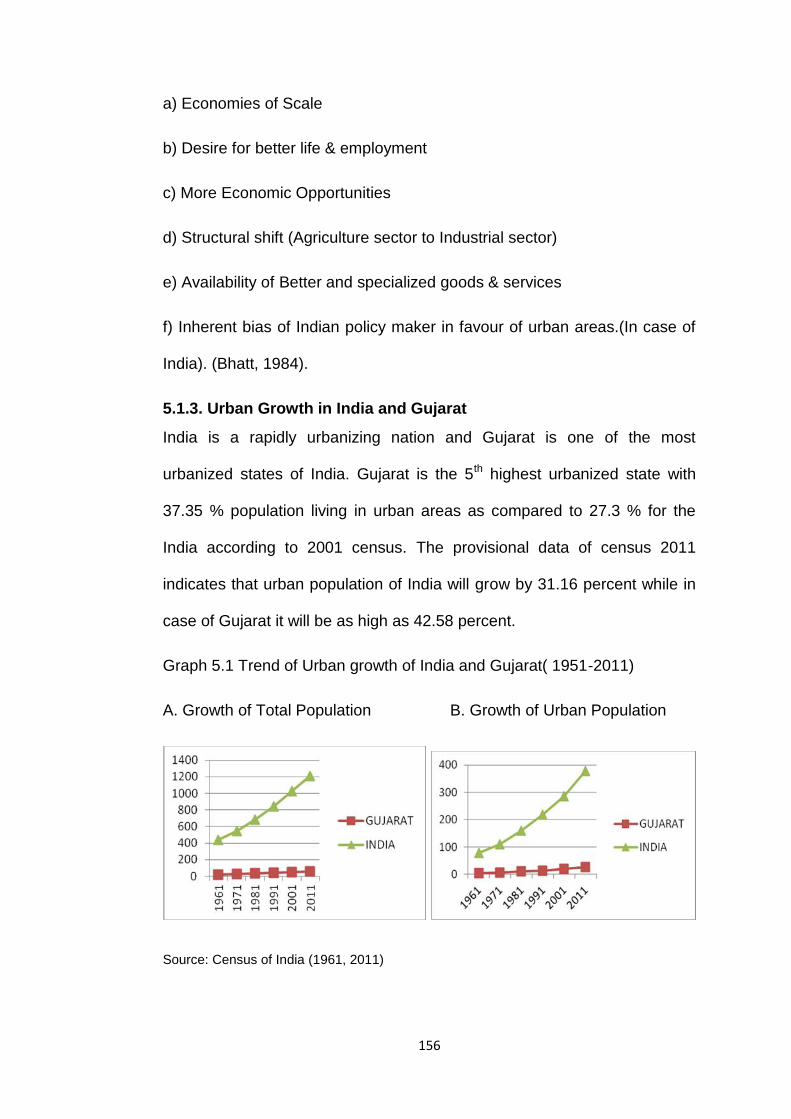
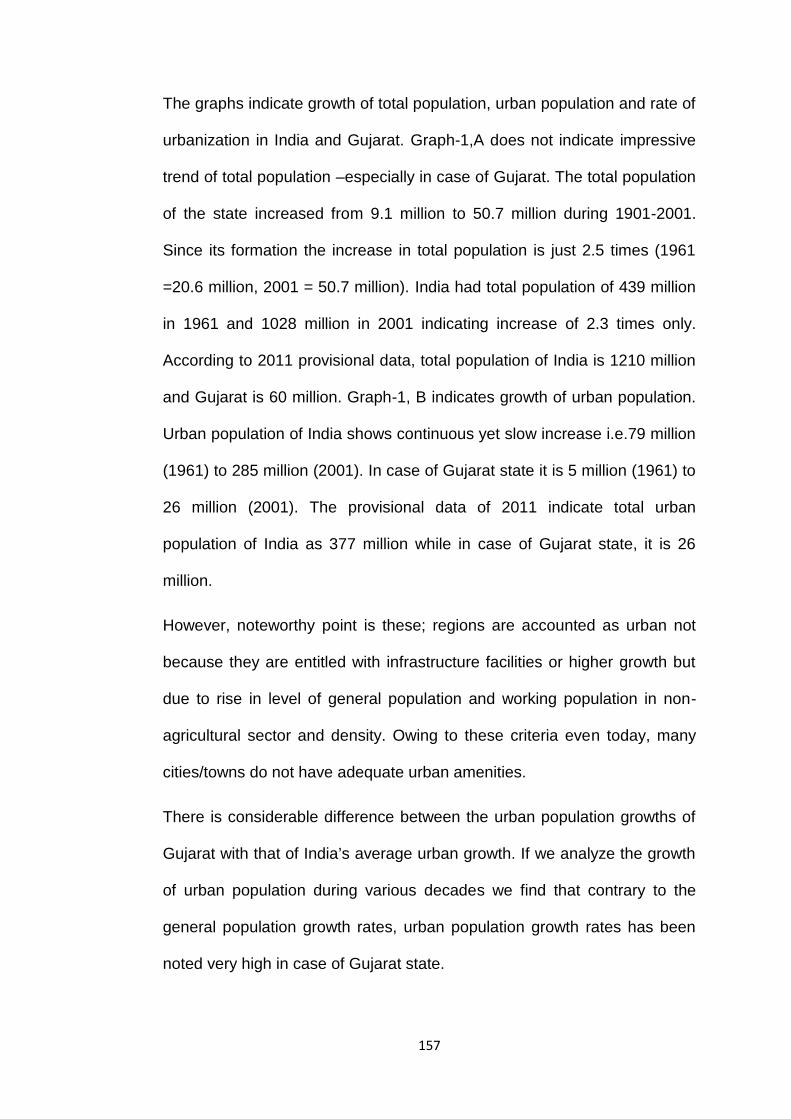
Graph 5.1 Trend of Urban growth of India and Gujarat( 1951-2011)
A. Growth of Total Population B. Growth of Urban Population
Source: Census of India (1961, 2011)
157
The graphs indicate growth of total population, urban population and rate of
urbanization in India and Gujarat. Graph-1,A does not indicate impressive
trend of total population –especially in case of Gujarat. The total population
of the state increased from 9.1 million to 50.7 million during 1901-2001.
Since its formation the increase in total population is just 2.5 times (1961
=20.6 million, 2001 = 50.7 million). India had total population of 439 million
in 1961 and 1028 million in 2001 indicating increase of 2.3 times only.
According to 2011 provisional data, total population of India is 1210 million
and Gujarat is 60 million. Graph-1, B indicates growth of urban population.
Urban population of India shows continuous yet slow increase i.e.79 million
(1961) to 285 million (2001). In case of Gujarat state it is 5 million (1961) to
26 million (2001). The provisional data of 2011 indicate total urban
population of India as 377 million while in case of Gujarat state, it is 26
million.
However, noteworthy point is these; regions are accounted as urban not
because they are entitled with infrastructure facilities or higher growth but
due to rise in level of general population and working population in non-
agricultural sector and density. Owing to these criteria even today, many
cities/towns do not have adequate urban amenities.
There is considerable difference between the urban population growths of
Gujarat with that of India’s average urban growth. If we analyze the growth
of urban population during various decades we find that contrary to the
general population growth rates, urban population growth rates has been
noted very high in case of Gujarat state.

158
Table 5.6: Urban Growth of Gujarat and India 1901 to 2011
Years % Urban Population tototal(Gujarat)
% Urban Population tototal(India)
1901 22.33 10.81911 19.25 10.31921 20.15 11.21931 20.5 12.061941 23.79 13.991951 27.23 17.31961 25.77 181971 28.08 19.91981 31.1 23.31991 34.49 25.72001 37.35 27.82011* 42.58 31.16
Source: Banta,P.K. (2004) “Urbanization and Urban Governanxe,Nagarlok,Vol XXXVI,No-2,
Census of India. Note: * indicate provisional data
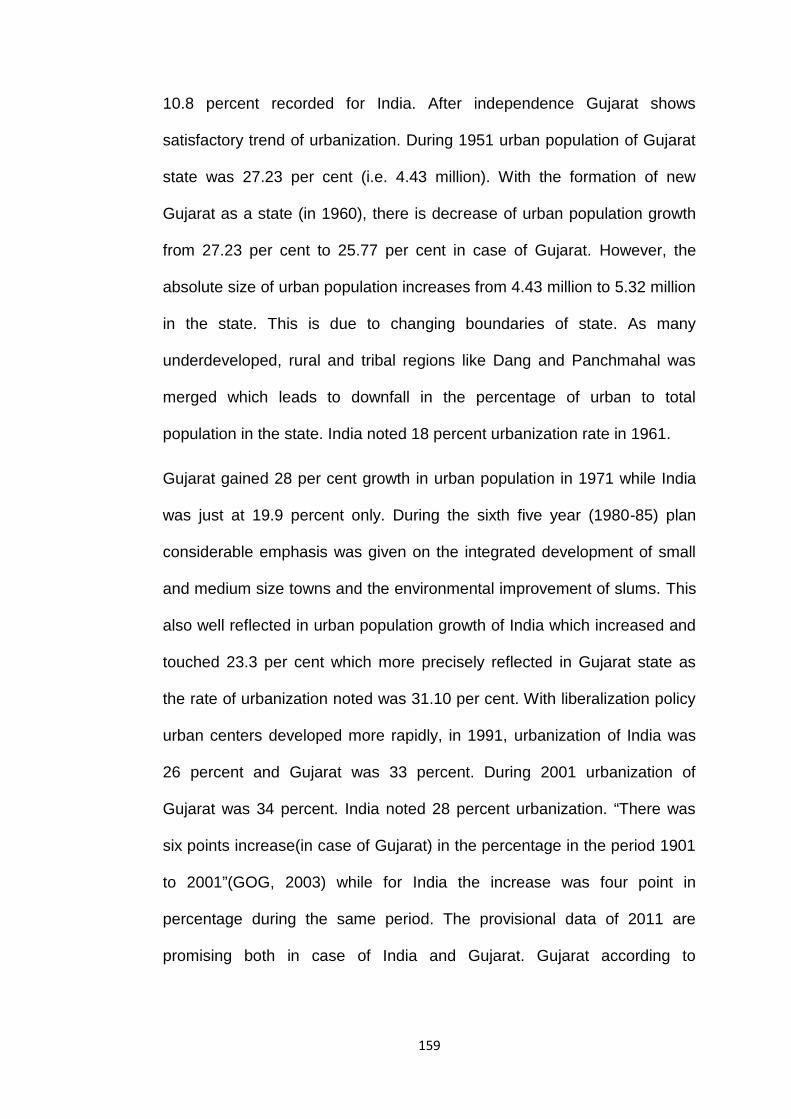
Graph 5.2: Urbanization in India and Gujarat (1991-2011).
Source: Census of India (1961, 2011), Banta,P.K. (2004) “Urbanization and UrbanGovernance, Nagarlok, Vol XXXVI,No-2
Table- 6 indicates percentage of urban population as percentage of total
population in India as well as Gujarat. During 1901, the percentage of
urban population to total population was 22.33 percent for Gujarat against
159
10.8 percent recorded for India. After independence Gujarat shows
satisfactory trend of urbanization. During 1951 urban population of Gujarat
state was 27.23 per cent (i.e. 4.43 million). With the formation of new
Gujarat as a state (in 1960), there is decrease of urban population growth
from 27.23 per cent to 25.77 per cent in case of Gujarat. However, the
absolute size of urban population increases from 4.43 million to 5.32 million
in the state. This is due to changing boundaries of state. As many
underdeveloped, rural and tribal regions like Dang and Panchmahal was
merged which leads to downfall in the percentage of urban to total
population in the state. India noted 18 percent urbanization rate in 1961.
Gujarat gained 28 per cent growth in urban population in 1971 while India
was just at 19.9 percent only. During the sixth five year (1980-85) plan
considerable emphasis was given on the integrated development of small
and medium size towns and the environmental improvement of slums. This
also well reflected in urban population growth of India which increased and
touched 23.3 per cent which more precisely reflected in Gujarat state as
the rate of urbanization noted was 31.10 per cent. With liberalization policy
urban centers developed more rapidly, in 1991, urbanization of India was
26 percent and Gujarat was 33 percent. During 2001 urbanization of
Gujarat was 34 percent. India noted 28 percent urbanization. “There was
six points increase(in case of Gujarat) in the percentage in the period 1901
to 2001”(GOG, 2003) while for India the increase was four point in
percentage during the same period. The provisional data of 2011 are
promising both in case of India and Gujarat. Gujarat according to
160
provisional data of 2011 indicates 43 percent of population lives in urban
region while in case of India it is showing 31 percent.
5.1.4. Development and Growth of Urban Centers in Gujarat
A study of the evolution and growth of urban centers in Gujarat is essential
to understand. It is necessary to analyze the nature and magnitude of the
factor affecting urbanization and to distinguish patter of urban growth in
various parts of the state. Such a study might also be helpful in visualizing
the future prospects of urbanization as well in policy formulation.
D.a. Urban Centers of Gujarat in Ancient India:
(Gujarat has a long and ancient tradition of urbanization.) The first phase of
urbanization in the Indian sub-continent is associated with the Indus valley
civilization i.e. the present day state of Gujarat. It contains major ancient
metropolitan cities from the Indus valley such as Lothal, Dholavira. The
ancient history of Gujarat was enriched by their commercial activities. The
site shows a planned city with underground drainage system, wells and
paved streets. For the purpose of navel trade dockyard and ware house
were also created which led to the development and growth of urban
regions/cities in ancient Gujarat (Rao, 1985). The history of urbanization in
Gujarat dates back to pre-histories period around 5000 BC to 7000 BC.
Even during the period of Mahabharata, many cities were said to have
existed and out of which, the archaeology survey of India and National
Institute of Ocean Technology (NIOT) discovered sample of a city called
Dwarawati or Dwarka (drs.nio.org/drs/bit
stream/2264/3602/I/man_environ_34_72a.pdf). Dwarka was one of the
161
important ports of ancient times; it also had maritime trade and commerce
with Rome. Ranki-ki-vav (queen steps well) the ancient capital of Gujarat,
Patan was assumed to have been built in the memory of Bhimdev I (A.D.
1022 to 1063)to solve the problem of water. Siddharaj Jaysinh, (1094-
1143) another king belonging to Solanki dynasty constructed Sahastra ling
talav-a big lake, to supply water for various purpose in Patan. Provision of
basic amenities, infrastructure and planned development has always been
regarded as the pillar of city/urban economy since the beginning of the
state. The history of financial capital i.e. Ahmedabad goes back to eleventh
centry. “a well established town, named Ashapalli was established on the
eastern bank of river named after its founder Ashabeel” (Jain, 1988). A
solanki king Karnadev conqured and Ashapalli was merged and exapneded
into a new city named Karnavati (Jain, 1988). Ahmedashah established
today’s old walled city, Ahmedabad in 1411 A.D.. Historically Ahmedabad
had been one of the most important urban centres of trade and commerce
in western India (CDP of Ahmedabad, 2006). The city was once known as
the “Manchester of India” thanks to its textile industries.
D.b Urban Centers of Gujarat in Modern India:
After independence, then new Indian government grouped the former
princely state of Gujarat into three larger units; Saurashtra, which included
the former princely states of the Kaathiawad peninsuala, Kutch and
Mumbai state, which include the former British district of Mumbai
presidency together with most of Baroda state and the other former princely
states of eastern Gujarat. It is important to note that in the initial five year
162
plans (1951-55 and 1955-60) there was no allocation for present day
(separate) Gujarat. On 1st May 1960, the new states of present Gujarat and
Maharashtra came into existence. The first capital of Gujarat was
Ahmedabad.
5.1.5 Population Growth and Trend of Urbanization in Gujarat
Gujarat state is situated on the west coast of India. According to 2001
census it is the seventh largest state in the country in terms of area
(1,92022 sq.km) and tenth largest in terms of population (50.50 million now
60.6 million according to doll) Geographically the state can be divided into
five regions, viz. south, central, North, Saurashtra and Kutch regions,
Administratively, the state is divided into 26 districts and 229 talukas (CDP
of Ahmedabad, 2006) According to 2001 census, Gujarat is the 5th highest
urbanized state with 37.35 % (as compared to 27.3% for India ) population
living in urban areas. Provisional data of 2011 also indicate higher urban
growth of 43 percent (as compared to 31 percent for India). Hence, state is
able to contribute significantly to Indian Economy, The value of output is
about 11% and value added by the manufacturing sector in Gujarat is
about 11.39% There are 225 urban agglomerations in the state (CDP of
Ahmedabad, 2006). Difference in the level of urbanization and urban
growth can be seen in various district and territories of Gujarat. The
geographical factors, and especially commercialization and industrialization
attitude of common man leads to economic development and thus has
influenced the trend and the pattern of urbanization in Gujarat. Gujarat has

163
always remained high on the scale of urbanization. Gujarat has a long and
ancient tradition of urbanization.
Table 5.7: Trends of Urbanization in GujaratCensusyear
Totalnumbersof Towns
TotalPopulation
Decennialgrowth oftotalpopulation
Urbanpopulation
% of urbanto totalpopulation
Absolute % Absolute %
1961 181 20633350 - 5316624 25.771971 216 26697475 6064125 29.39 7496500 2179876 41 28.08
1981 255 34085799 7388324 27.67 10601653 3105153 41.42 31.1
1991 264 41309582 7223783 21.19 14246061 3644408 34.38 34.49
2001 242 50671017 9361435 22.66 18930250 4684189 32.88 37.36
2011 NA 60383628 9712611 19.17 25712811 6782561 35.83 42.58
(source : computer from Census Report and Abstract of Gujarat, 2008 Note NA = notavailable. *= Provisional Data)
In table -7 trends of urbanization of Gujarat has been shown. It is clearly
revealed by the table that urban population growth rate in the state has
always remained higher. However, decadal growth rate decreases in 1981.
Total population of the state increased from 20 million to 60 million
indicating an increase of almost more than two times during last sixty
years. Urban population of the state has increased from 5 million to 25
million indicating an increase of almost four times during last sixty years.
Urbanization in the state has increased from 25.77 percent to 42.58
percent in the last sixty years. The numbers of towns has also increased
with every census year except in the case of census of 2001.
E.B. Growth of Urban Population at District Level
The most common indicator used for the measurement of urbanization is
the proportion of people living in urban area. This is also known as “degree
of urbanization” (GOG, 2003) Urbanization basically indicates redistribution

164
of population due to rural – urban migrations and increase in natural
population growth rate. The regions, which are geographically favourable,
industrially and commercially developed have been attracting migrants from
the country side in search of employment which further accelerate the
process of urbanization.
The comparative trend of urbanization in Gujarat and India as shown in
table -6 indicates urban population growth of Gujarat state, is even greater
than of national urban growth rate, Evidently, Gujarat recorded a much
faster growth in the urban population than that of India. Hence, for a better
understanding of the pattern of urbanization in Gujarat, a district level
analysis is essential. The decadal urban growth (1961-2011) among the
district is provided in table – 8

165
Table 5.8 : District wise Growth of Urban Population in Gujarat State,
1961-2011 (Percentage growth)
Years 1961-71 1971-81 1981-91 1991-2001
2001-2011*
Ahmedabad 45 43 29 31 28Amreli ND ND ND 23 23Anand ND ND ND 30 25Banaskathakatha 51 46 55 45 50Bharuch 33 29 35 35 50Bhavnagar 28 39 29 33 26Dahod ND ND ND 37 22Dang 0 0 0 0 0Gandhinagar ND 64 77 49 53Jamnagar 34 34 21 39 16Junagadh 29 33 25 37 27Kutch 42 34 42 31 53Kheda ND ND ND 32 29Mehsana 35 32 36 21 25Narmda 20 13 51 18 18Navasari ND ND ND 21 22Panchmahalmahal 41 29 26 31 32Patan ND ND ND 16 18Porbandar ND ND ND 23 9Rajkot 36 39 38 41 36Sabarkathakanth 56 56 25 22 61Surat 58 88 62 81 66Surendranagar 30 32 24 28 23Tapi ND ND ND ND 14Vadodara 52 58 41 29 25Valsad 38 49 33 69 66
Source : District Census of Gujarat 2001, Government of Gujarat
Note : N.D. = New Districts as per census 2001 * indicate provisional data according to2011 census
Table - 8 indicates growth in urban population in various Districts since the
inception of the state. The growth of Ahmedabad, Vadodara, Surat had
been very high during the decade of 1961-71. Surprisingly even
Sabarkathakath and Banasskathakath also indicate higher growth even
though most of these districts are agriculture and dairy product oriented.

166
The decade of 1971-1981 indicates higher urban population in the new
capital of Gujarat i.e. Gandhinagar, The capital of Gujarat has moved from
Ahmedabad to Gandhinagar in 1970’s. With the formation of new district,
concentration of urban population has also increased in this district due to
political importance and pollution free environment. Vadodara, Surat and
Sabarkathakanth continue to remain high on the scale of urbanization
during this decade.
During the decade of 1981-91, Gandhinagar continues to be high on the
scale of urbanization with 76.7 percent, however, urban growth rate in
Surat (61%), Ahmedabad (29%), Vadodara (41%) has shown downward
trend while Banaskathakatha remains high on the scale of urbanization. In
case of Ahmedabad, closure of textile mills during 1980’s was assumed to
be a prominent factor. Narmada, a tribal region of the state indicates higher
position.
Surat gained higher position during the decade of 1991-2001 with 80
percent growth rate in urban population. Valsad surprisingly indicates
higher urban growth during this decade. Valsad-Ahmedabad corridor is
heavily industrialized tract which could be one of the reasons for higher
position in both the districts. Banaskathakath also noted growth of 44
percent in this decade.
According to the provisional data of 2011, the decadal growth rate of 2001-
2011 is more balanced and equal for almost all districts. Valsad and Surat
progress well on the range of urbanization. Sabarkathakatha, Gandhinagar
and Kutch are also on high scale of urbanization. Overall picture of Gujarat
is better than national urban decadal growth rate.
167
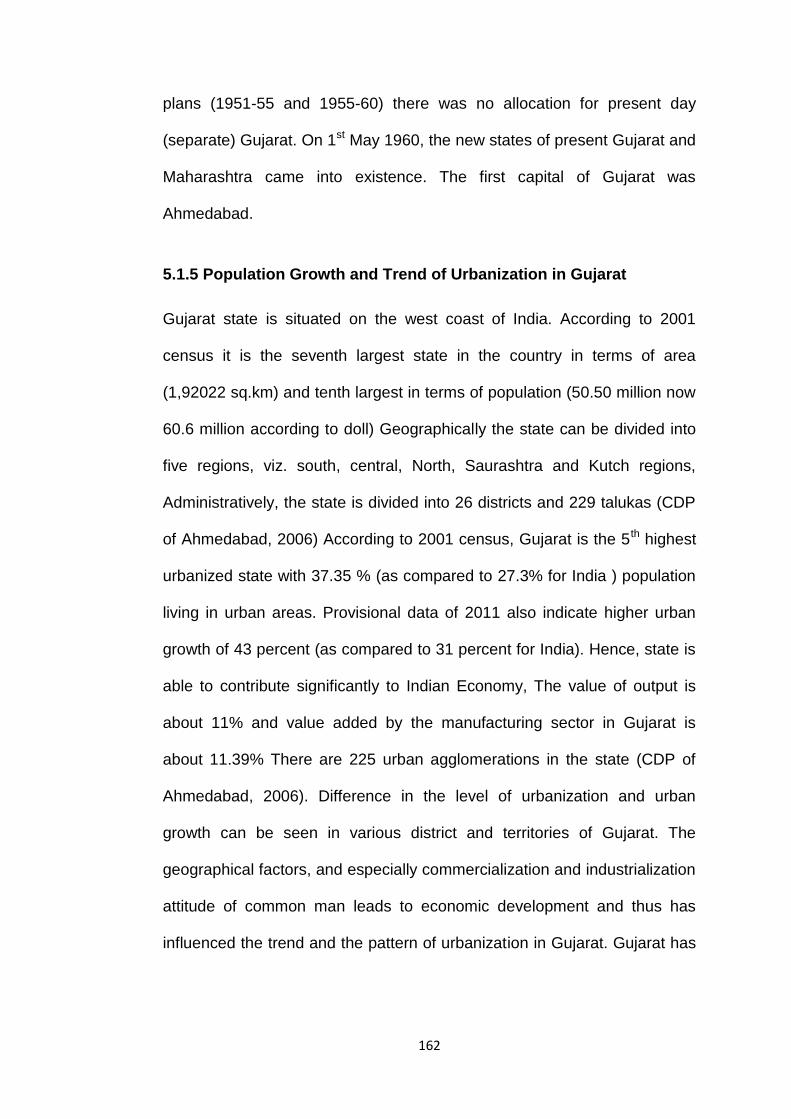
Table 5.9: District wise Growth and rank of Urban Population in
Gujarat State, 1961-2001 (% Growth)
Years 1961
1961
1971
1971
1981
1984
1991
1991
2001
2001
2011
2011
Ahmedabad 65 1 69 1 74 1 77 1 80 1 84 1Amreli 16 14 17 15 18 18 19 18 22 16 25 16Anand 19 12 20 12 20 15 24 13 27 14 30 14Banaskathakatha
6 24 7 24 8 23 10 24 11 22 13 22
Bharuch 16 15 18 14 20 14 23 14 28 11 34 11Bhavnagar 31 5 31 5 32 7 34 7 32 8 41 8Dahod 11 20 11 20 10 21 9 25 0 26 9 26Dang 0 25 0 25 0 25 11 21 10 23 11 23Gandhinagar 11 19 16 19 21 12 29 8 38 7 43 7Jamnagar 34 4 33 4 36 6 39 6 44 6 45 6Junagadh 23 8 22 10 23 10 25 12 27 12 33 12Kutch 19 11 23 9 24 9 39 9 29 10 35 10Kheda 16 16 16 18 17 19 17 19 20 18 23 18Mehsana 16 17 17 16 18 17 21 15 22 17 25 17Naramda 9 22 8 22 8 24 10 23 10 24 10 24Navasari 17 13 18 13 22 11 26 11 27 13 31 13Panchmahalmahal
10 21 11 21 11 20 12 20 11 21 14 21
Patan 20 10 20 11 20 13 20 17 20 19 21 19Porbandar 36 3 40 2 42 2 45 4 45 5 49 5Rajkot 37 2 37 3 40 4 46 3 51 3 58 3Sabarkathakanth
7 23 8 23 10 22 11 22 13 20 15 20
Surat 26 6 31 6 41 3 49 2 68 2 80 2Surendranagar
22 9 23 8 24 8 26 10 26 15 28 15
Tapi NA NA NA NA NA NA NA NA 10 25 10 25Vadodara 25 7 30 7 36 5 42 5 49 4 50 4Valsad 15 18 16 17 20 16 21 16 30 9 37 9Source : District Census Handbook (1961-2001), GOG and Census of India – 2011, GOI
The history of urbanization indicates that the growth of urbanization has
continuously increased due to the available opportunities of employment in
those urban centers where industrial and commercial establishment are
located. Table -9 indicates rank of various districts as per urban population.
Ahmedabad district remains leading district in the state throughout the
period. Surat district shows a significant increase in its urban population. It
168
moves upward in rank position and from sixth in 1961 to second position in
1991. In case of Rajkot except during 1971 and 1981, this district has
remained third its rank. Vadodara, ranked seventh, according to 1961
census. It then come to sixth position during 1971 census. During 1981 and
1991 it further moved to the fifth rank during this census years. The urban
population in Vadodara district has increased and was ranked fourth
position during 2001 and 2011. The districts continue to grow more rapidly
than the urban growth rate of the state even today. Gandhinagar, now is
the Municipal Corporation, with that Gujarat state now has eight major
corporations in the state.
The Dangs, Dahod, Tapi and Narmada districts have remained lower in
urban population. Many such districts were completely rural in population
but were registered as urban population only during the last two decades.
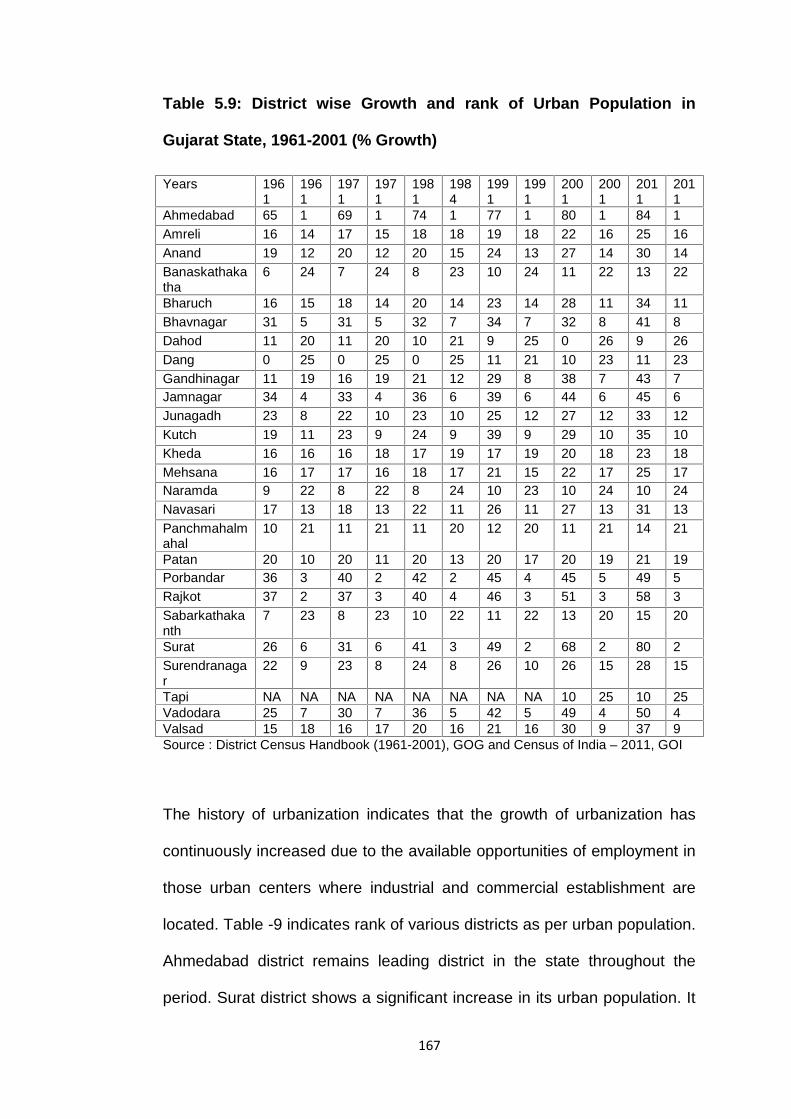
5.1.6 Urban Growth by Size ClassThe growth in the number and size of towns is a good indicator of
urbanization. In case of Indian scenario, we have noticed the trend of big
cities becoming bigger and small cities evaporating. Class- wise analysis of
various municipalities of the Gujarat state will help us to know whether the
trend of big cities becoming bigger has been noted at the state level also.
Table 5.10: Urban Population of various size class of Gujarat (inLakhs)Year 190
11911
1921
1931
1941 1951 1961 1971 1981 1991 2001
Class – I
4.06 3.32 3.9 4.2 10.18
15.97
22.5 33.81
53.16
85.4 129.16
Class – II
1.1 1.56 1.51 2.29 2.38 2.47 5.61 11.74
18.02
22.01
24.6
Class –III
3.42 3.71 3.71 5.36 7.06 10.18
12.86
13.28
17.83
17.24
24.46

169
Class –IV
5.64 4.39 5.1 5.5 6.31 5.77 7.17 10.53
12.16
13.4 8.72
Class – V
4.25 4.15 4.35 4.84 5.4 8.62 4.61 5.4 4.51 4.01 1.89
Class –VI
1.84 1.74 1.92 1.33 1.27 1.27 0.36 0.21 0.34 0.34 0.45
Source : Government of Gujarat (2003) , Urbanization in Gujarat, Socio-economicalanalysis division
Table - 5 provides an overview of an uneven distribution of population in
the various size class town / cities during 1951-2001 of India. Table -10
indicates again the same trend in case of Gujarat as well. In general there
has been supremacy of class I towns in case of India (table -5) and Gujarat
(Table -10)
The population of size class I cities has increased from 4.06 lakhs in 1901
to 129.16 lakhs in 2001. It clearly indicates the increase of thirty one times.
The population of size class II, III and IV cities has increased from 1.10
lakhs to 3.24 lakhs and 5.64 lakhs in 1901 to 26.92 lakhs, 22.56 lakhs and
4.24 lakhs in 2001 respectively. However, soon after independence, there
has been tremendous increase in the class I cities almost of eight times
from 1951 to 2001. While during the same period the class – II cities
indicate an increase of almost twelve times, especially according to 1981
census when the development of small and medium towns started by the
planning commission of India in sixth five year plan. The class – III cities
indicate an increase of 2.4 times, class – IV indicates 1.6 times, class – V
indicates 0.13 times and class – VI indicates an increase of 0.456 times
during the same time period. The trend towards bigger cities has been
noted down even in case of Gujarat state. This leads to higher urban
170
population density which can be registered in class – I cities and mega
cities of the state.
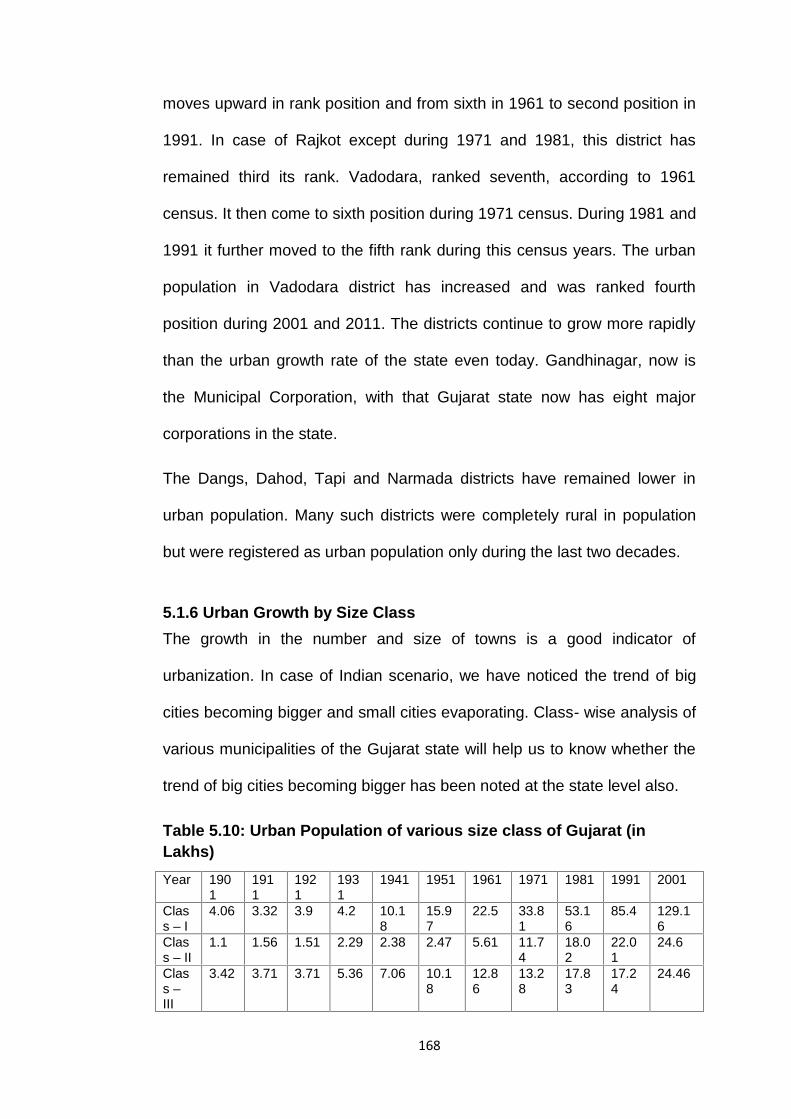
Table 5.11: Number of Towns by population size classes (1961-2001)
SizeClass
1961 1971 1981 1991 2001
I 6 7 11 19 27II 9 18 27 33 43III 43 42 57 58 77IV 54 73 86 92 54V 60 71 61 51 26VI 9 5 13 11 15All sizeclass
181 216 255 264 242
Source : Government of Gujarat (2003) , Urbanization in Gujarat, Socio-economicalanalysis division
Table 11 indicates number of towns registered according to class size
since 1961. Over a period of time, total number of towns has increased
from 181 in 1961 to 242 in 2001. However, 21 towns was added in class
size - I towns while 34 towns were added in class size – I and III since
inception of the state. Size class IV towns indicate random trends of ups
and downs within the time frame of 1961 and 2001. While size class V
towns recorded decrease of 36 towns since 1961. Surprisingly size class VI
indicate further addition of 6 towns, however this may be due to shift of
rural to urban area as urbanization has increased.
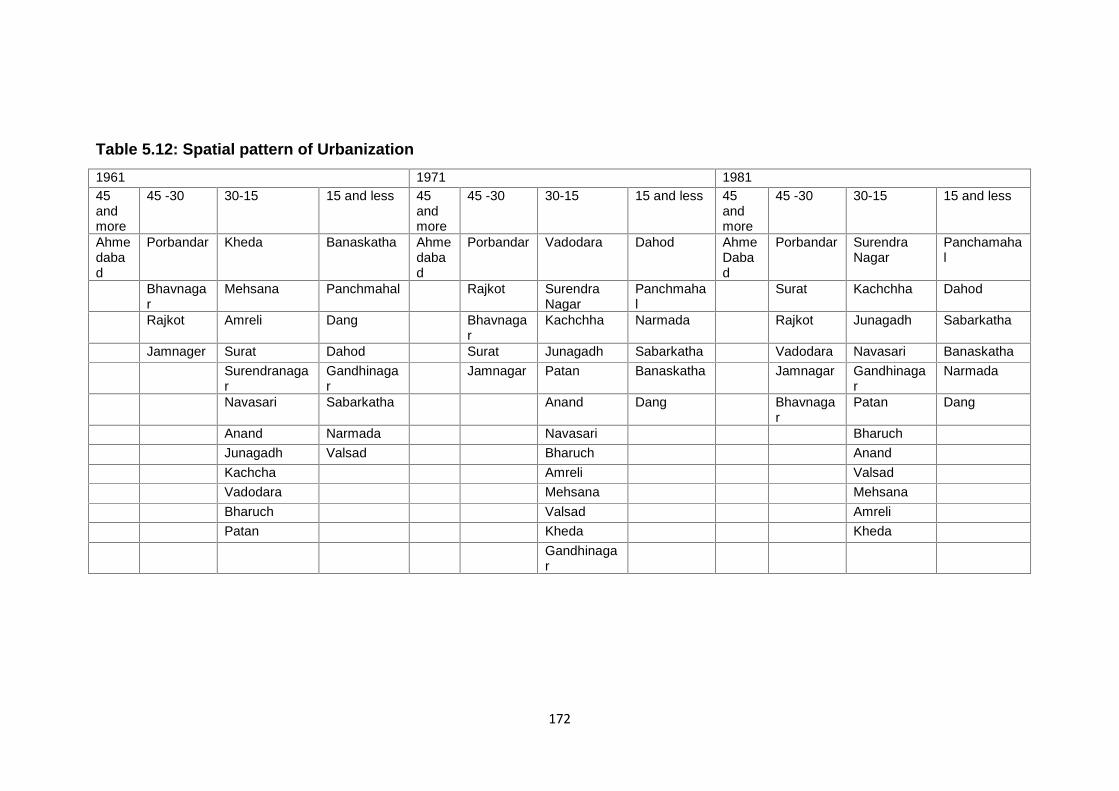
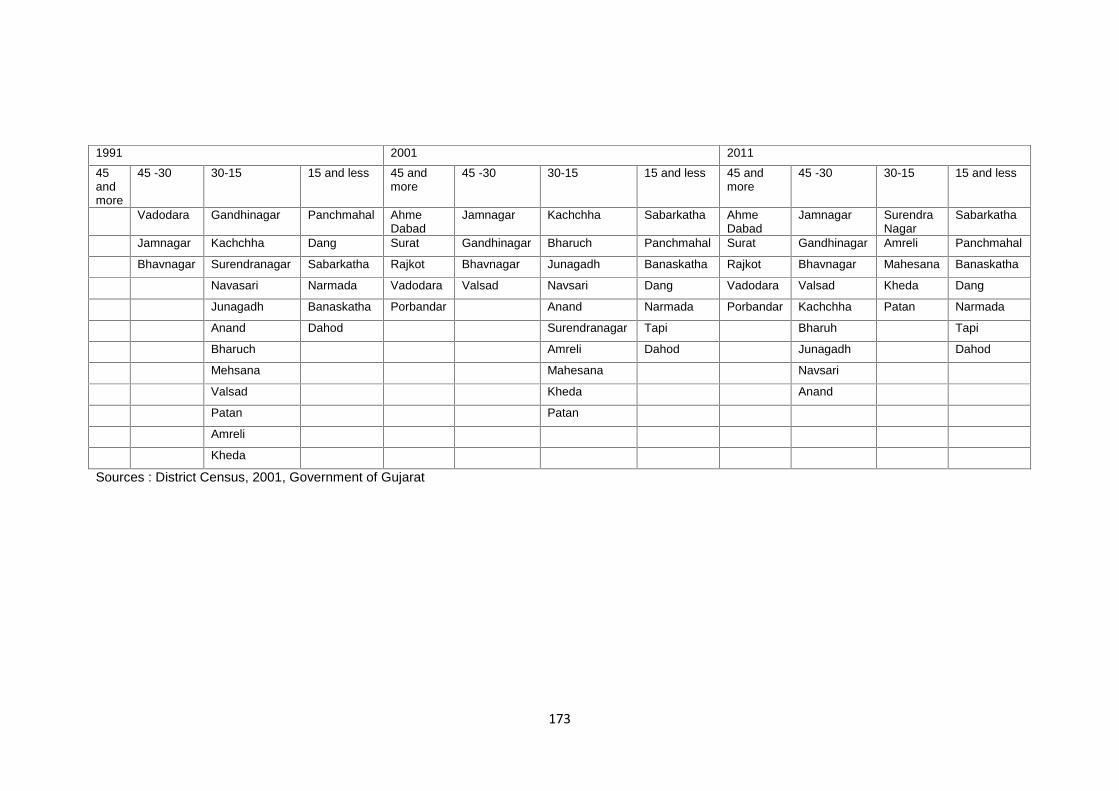
5.1.7 Spatial Pattern of UrbanizationThe concentration of population in urban areas is due to many reasons like
migration, natural growth in population, economic development,
industrialization and commercial activities, expectation of employment
opportunity, better urban services, geographical pattern, and social

171
development etc. City life “creates new economic activities, new political
ideas and ideals, new form of social interaction, new possibilities of
interchanges of idea” (Banker, 1965). Gujarat is broadly divided into four
area / sub regions on the basis of their level of urbanization and they are:
Very high concentration (45% and above)
High concentration (30 % to 45% )
Medium concentration (15% to 30 %)
Low concentration (15% and less)
Gujarat is a highly urbanized state as shown in graph – 1. It is important to
understand the change of scope and scale the spatial analysis of the state
is very essential.
Graph : 1 The graph indicating the 2011 census provisional data clearly
reflect urban Gujarat.
Gujarat is a rapidly urbanizing state although the Dang was 100 percent
rural. According to provisional data of 2011 census even the tribal area
(Dang) of the state has also urbanizing. Hence the balance urban growth is
registered in the state. However the spatial pattern of urbanization over a
period of time will help to understand the growth of urban population in the
state.
172
Table 5.12: Spatial pattern of Urbanization1961 1971 198145andmore
45 -30 30-15 15 and less 45andmore
45 -30 30-15 15 and less 45andmore
45 -30 30-15 15 and less
Ahmedabad
Porbandar Kheda Banaskatha Ahmedabad
Porbandar Vadodara Dahod AhmeDabad
Porbandar SurendraNagar
Panchamahal
Bhavnagar
Mehsana Panchmahal Rajkot SurendraNagar
Panchmahal
Surat Kachchha Dahod
Rajkot Amreli Dang Bhavnagar
Kachchha Narmada Rajkot Junagadh Sabarkatha
Jamnager Surat Dahod Surat Junagadh Sabarkatha Vadodara Navasari BanaskathaSurendranagar
Gandhinagar
Jamnagar Patan Banaskatha Jamnagar Gandhinagar
Narmada
Navasari Sabarkatha Anand Dang Bhavnagar
Patan Dang
Anand Narmada Navasari BharuchJunagadh Valsad Bharuch AnandKachcha Amreli ValsadVadodara Mehsana MehsanaBharuch Valsad AmreliPatan Kheda Kheda
Gandhinagar
173
1991 2001 2011
45andmore
45 -30 30-15 15 and less 45 andmore
45 -30 30-15 15 and less 45 andmore
45 -30 30-15 15 and less
Vadodara Gandhinagar Panchmahal AhmeDabad
Jamnagar Kachchha Sabarkatha AhmeDabad
Jamnagar SurendraNagar
Sabarkatha
Jamnagar Kachchha Dang Surat Gandhinagar Bharuch Panchmahal Surat Gandhinagar Amreli Panchmahal
Bhavnagar Surendranagar Sabarkatha Rajkot Bhavnagar Junagadh Banaskatha Rajkot Bhavnagar Mahesana Banaskatha
Navasari Narmada Vadodara Valsad Navsari Dang Vadodara Valsad Kheda Dang
Junagadh Banaskatha Porbandar Anand Narmada Porbandar Kachchha Patan Narmada
Anand Dahod Surendranagar Tapi Bharuh Tapi
Bharuch Amreli Dahod Junagadh Dahod
Mehsana Mahesana Navsari
Valsad Kheda Anand
Patan Patan
Amreli
Kheda
Sources : District Census, 2001, Government of Gujarat

174
175
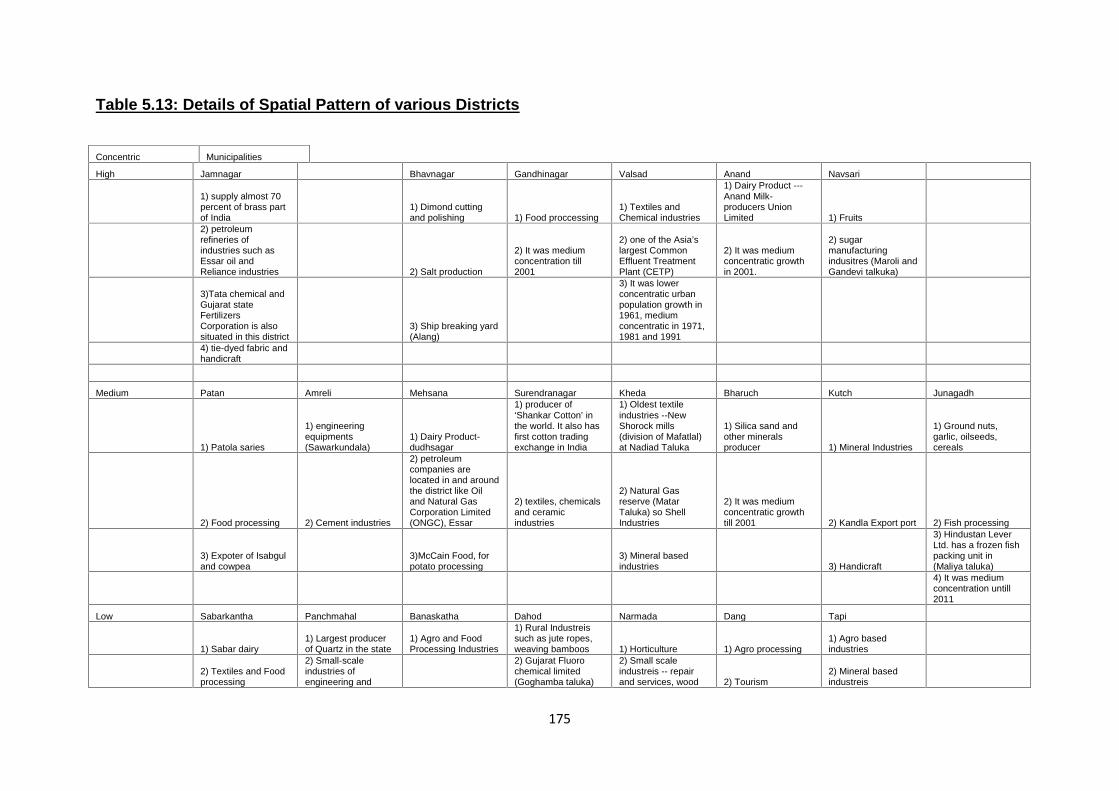
Table 5.13: Details of Spatial Pattern of various Districts
Concentric Municipalities
High Jamnagar Bhavnagar Gandhinagar Valsad Anand Navsari
1) supply almost 70percent of brass partof India
1) Dimond cuttingand polishing 1) Food proccessing
1) Textiles andChemical industries
1) Dairy Product ---Anand Milk-producers UnionLimited 1) Fruits
2) petroleumrefineries ofindustries such asEssar oil andReliance industries 2) Salt production
2) It was mediumconcentration till2001
2) one of the Asia’slargest CommonEffluent TreatmentPlant (CETP)
2) It was mediumconcentratic growthin 2001.
2) sugarmanufacturingindusitres (Maroli andGandevi talkuka)
3)Tata chemical andGujarat stateFertilizersCorporation is alsosituated in this district
3) Ship breaking yard(Alang)
3) It was lowerconcentratic urbanpopulation growth in1961, mediumconcentratic in 1971,1981 and 1991
4) tie-dyed fabric andhandicraft
Medium Patan Amreli Mehsana Surendranagar Kheda Bharuch Kutch Junagadh
1) Patola saries
1) engineeringequipments(Sawarkundala)
1) Dairy Product-dudhsagar
1) producer of‘Shankar Cotton’ inthe world. It also hasfirst cotton tradingexchange in India
1) Oldest textileindustries --NewShorock mills(division of Mafatlal)at Nadiad Taluka
1) Silica sand andother mineralsproducer 1) Mineral Industries
1) Ground nuts,garlic, oilseeds,cereals
2) Food processing 2) Cement industries
2) petroleumcompanies arelocated in and aroundthe district like Oiland Natural GasCorporation Limited(ONGC), Essar
2) textiles, chemicalsand ceramicindustries
2) Natural Gasreserve (MatarTaluka) so ShellIndustries
2) It was mediumconcentratic growthtill 2001 2) Kandla Export port 2) Fish processing
3) Expoter of Isabguland cowpea
3)McCain Food, forpotato processing
3) Mineral basedindustries 3) Handicraft
3) Hindustan LeverLtd. has a frozen fishpacking unit in(Maliya taluka)4) It was mediumconcentration untill2011
Low Sabarkantha Panchmahal Banaskatha Dahod Narmada Dang Tapi
1) Sabar dairy1) Largest producerof Quartz in the state
1) Agro and FoodProcessing Industries
1) Rural Industreissuch as jute ropes,weaving bamboos 1) Horticulture 1) Agro processing
1) Agro basedindustries
2) Textiles and Foodprocessing
2) Small-scaleindustries ofengineering and
2) Gujarat Fluorochemical limited(Goghamba taluka)
2) Small scaleindustreis -- repairand services, wood 2) Tourism
2) Mineral basedindustreis

176
auto-mobiles for Regrigerators products, paper andfood products
3) Small scaleindustreis -- Rubber,Food product, readymade garments,ceramic andengineering product
V.high
Ahmedabad Surat Rajkot Porbandar Vadodara1)Textiles andchemicals
1) 42% of world'stotal rough diamond 1) Cloth mills
1)Sea foodprocessing
1) Culture andEducation center
2) Hub for stockexchange
cutting & polishinghub
2) dyeing, printingbusiness (Jetpurtaluka)
2) port and shipbuilding
2) chemicals andpharmaceuticals,cotton textiles andmachine tools
3) AhmedabadTextile Industry’sResearch Association
2) 40 % if nation’stotal man made fabric
3) ginning andpressing business(Paddhari taluka)
3) It was highconcentrate group in1961,1971,1981.
3) It was mediumconcentrate group in1961,1971 and highconcentrate group in1981 and 1991.
3) Mineral basedindustries
4) firebricks andceramic related
4) It was mediumconcentrate group in1961.
industries (crockery)businesses(Wankaner and Morbitalukas
177
Very High ConcentrationDuring the foundation year of the state (1961 census) there was only one
district which had very high concentration of urban population. The
numbers of districts have increased five times in the last two decades.
Ahmedabad was the only district during 1961 having very high
concentration of urban population in the state. It remained in very high
concentrated group though.
With liberalization and Globalization in 1991, Surat, Rajkot and Porbandar
have also attained very high concentration and have remained in this list.
Surat is the diamond district of India.
Rajkot is famous for its historical background.
Porbandar is the birth place of Mahatma Gandhi. This district remains high
on the scale of urbanization since the inception of the state.
Vadodara district has been a cultural and educational centre since the
inception of the state.
High ConcentrationJamnagar district has remained in the high concentration since last sixty
decades. It is the major supplier to the electric and electronics factories
located in Delhi, Bangalore and Mumbai.
Bhavnagar is the second largest district in the state after Surat having
industries for diamond cutting and polishing.
Gandhinagar district come into existence in 1970 and the capital of the
state was shifted from Ahmedabad to Gandhianagar. The food processing
178
industry developed in this district becomes its proximity to agricultural
districts such as Mehsana, Sabarkantha, Ahmeabad, Kheda and Anand.
Valsad– Ahmedabad golden corridor is noted for industrialization which
helped to develop Valsad further.
Anand district separated from Kheda in 2001.
Navasari district also separated from Valsad during 2001 census year. This
district is the exporter of fruits to all over India.
Medium ConcentrationBharuch district was having medium urban population growth till census
year 2001.
Kutch is the largest district of the state in terms of area
Junagadh district is agriculture based hence urban population growth rate
was medium until the census year 2011. Processed fish are exported to
Singapore, China, Hong–kong, Japan, Dubai and to other parts of the
world.
Patan district was separated from Banaskatha district in 2001. The district
was once the capital of ancient Gujarat.
Amreli district has always shown medium concentration of urban population
since the last six decades. Large reserve of limestones is found and hence
major cement industries have developed in the district.
Mehsana district has always a medium concentration of urban population
since last six decades.
179
Surendranagar district has medium concentration of urban population since
last six decades.
Kheda has many mineral based industries due to the availability of various
minerals.
Low concentrationThe districts which fall under low concentration are mostly depend on
primary sector which is not well developed.
ConclusionThe population trends of any region highlight the changing cultural, social
and more importantly the economic pattern. Macro and Micro analysis of
population growth rate clearly indicate the positive impact of
industrialization and modernization. The micro analysis of urbanized state
of Gujarat emphasized it more clearly.
5.2. URBAN POLICYThe proper conduct of finance of urban region is one of the aspects of the
government; it cannot be studied successfully in isolation. The entire
political system was to understand the public finance. The analysis of
working of taxes or expenditure is not enough but it is a step in the process
of selecting the best policy. Analysis of urban policy has been relatively
easy due to Five year planning. According to the constitution the urban
planning and policy is state’s subject without constitution amendment,
central government does not have a power to pass legislation on
urbanization of cities or urban planning. It can issue directives, provide
advisory services set up model legislation and fund program which the
180
state can follow at will. However, this has taken the initiative for policy
making in these areas, much of what exist as policy has come from central
government. This central governments statement on urban policy is known
as five year plan. Planning commission laid down the base for five year
plans. They not only lay out plans but also monitor the execution of those
plans and make sure that all machineries of the central and the state work
in co-ordination.
5.2.1 Overview of India Five Year Plan :
The five year plan growth performance is indicated in the table-1. During
the first five year plan, India was faced with the problems of influx of
refugees, server food shortage and mounting inflation. India also required
to correct the disequilibrium caused by Second World War and the partition
of the country. However it has achieved 3.6 percent growth rate while
target was just 2.1 percent only. The highest priority was given to
transportation and communication as well as agriculture and irrigation
projects such as Bhakra and Hirakund dam. This plan was based on
Harrod-Damoar growth model. The second five year plan was based on
Mahalanobis model. Due to success of first five year growth rate, it has
targeted 4.5 percent while able to achieved only 4.21 percent only. This
plan emphasized on heavy industrial development with the announcing of
Industrial policy in 1956. The major were, iron and steel industries, heavy
chemical, engineering and machine building industries. Industrial and
mineral sector has been allocated 19 per cent of total allocation which
helped to accelerate the economy. Third five year plan, emphasized on
agriculture along with development of heavy industries. Due to Sino-India
181
war, India witnessed increases in price of product which leads to cost-push
inflation. It has failed to achieve growth rate of 5.6 percent as actually
growth rate was just 2.72 percent. There was a plan holiday for three years
when annual plan was shaping the economy. During The fourth five year
plan, India faced famine, drought and stint of recession, price hike in 1971
along with war of 1965 and 1972. Hence it was able to achieve only 2.05
percent growth rate while target was 5.7 percent. However the green
revolution was the major success initially. The fifth five year plan lowered
the target as 4.4 percent and actually able to achieve 4.83 percent. This
plan targeted on elimination of poverty by direct attacking on
unemployment, underemployment. One fourth of total allocation was for
industrial and mineral sector. Due to oil price shock economy faced
stagflation. The sixth five year plan aimed at annual growth rate of 5.2
percent and achieved 5.54 percent. This plan was prepared twice due to
power shift at the central government. The Nehruvian model of growth was
re-introduced which aimed at direct attack on problems of poverty by
creating condition of an expanding economy. Family planning was
implemented first time with allocation of Rs 2831.05 crores. The
nationalization of banks, oil companies, insurance companies, coal mines
included under the ten point program. Seventh Five Year Plan targeted 5
percent growth rate but achieved 6.02 percent. This plan year already
paved the way for development by increasing the production in agriculture
and industrial sector, curbing the rate of inflation and maintaining a balance
in the transaction of goods, services and money. National policy on
education was announced for large scale, 4 percent was allocated for

182
education. Eight five year plan which was supposed to introduced in 1990,
however due to political instability it was introduced in 1992. India moved
ahead with the line of reforms as experimented during 1980’s. Import
licensing, MRTP act, price and distribution controls were replaced by
liberalization, privatization and globalization during this five year plan. The
new constitution amendment act i.e. 73rd and 74th paved the way for third
layer of government i.e. urban and rural local government. Ninth five year
plan targeted 6.5 percent growth rate and actually realization was 5.35
percent. The plan emphasized on social justice and equity. Energy
development, social services and industrial development remained high on
the priority list. Tenth five year plan had 8 percent of target growth rate but
able to achieved 7.7 percent only. There were few new areas which
required more attention i.e. national security, energy and food security.
Eleventh five year plan had 8.6 percent target growth rate while it was able
to achieve 7.9 percent. With rapidly increasing urban population this plan
specifically focus on urban area with the introduction of Jawaharlal Nehru
National Urban Renewable Mission for urban services, infrastructure and
urban poor. The important component was urban infrastructure
development schemes for small and medium towns and urban
infrastructure and government which were allocated Rs 6000 crores and Rs
5000 crores respectively.

183
Table: 5.14. Allocation of various sector (for India)1 <
,
0
INDIA o C O C O C O C O C O C O C O C O C O C O1 1 2 2 3 3 4 4 5 5 6 6 7 7 8 8 9 9 10 10 n
AgricultureA nd
Allied Sectors
361 29
0
568 549 1068 108'J 2728 2120 4644 4865 5695 6624 10524 12793 22467 24896 42462 37239 58933 60702 136381
Irrigation,Rood Control and
Rural Development
434 19
8
38! 431 650 665 1087 1354 3440 3877 17524 17927 25885 31836 66950 71771 130106 !58795 13106 13106 13106
Industry and Minerals 173 97 890 112
5
1784 1967 3630 3107 10201 9581 15018 16948 22108 29220 46922 47889 65148 44695 58939 64655 153600Energy Development 127 38
5
532 452 1012 1252 2448 2932 7294 7400 2653
5
30751 55129 61689 115561 128905 222375 21924
3
403927 363635 854123Communication 497 51
8
1385 1261 1486 211
2
3237 3080 6881 6870 15546 17678 27119 37974 81036 101548 0 23608
5
324945 346879 667823Science, Teclinology And
Environment
0 0 0 0 0 72 140 131 0 0 865 1020 2463 3024 9042 7110 18458 15667 30424 28673 87933
Special Programme K5 0 0 0 0 0 0 298 776 817 1483 1580 2804 3470 6750 4933 3649 5408 20879 16423 26329General Economic Services 0 0 0 0 0 0 0 0 0 0 0 0 1396 2250 4550 6182 14580 13734 38630 30349 62523General Services 0 0 0 0 0 0 0 0 0 0 0 0 1028 1514 1811 3419 12496 15646 16328 20489 42283Other
Progra
m
52 15
6
99 149 200 173 192 180 0 0 801 848 0 0 0 0 0 0
Social
Services
340 31
6
945 706 1300 1191 2439 2365 6050 6017 14035 15917 31545 34960 79012 88807 183273 194529 347391 436529 1102327
TOTAL 206
9
96
0
480
0
4672 750
0
852
0
1590
1
1556
7
3928
6
3942
6
9750
3
10929
2
18000
0
21873
0
43409
9
48545
7
69254
7
94(041 131350
2
138144
0
314642
8Source: Five year plan of India

184
Table 5.15. Percentage of the (total and actual) expenditure as allocated funds(for India)INDIA O C As% O C As "A O C As%ci O C As V. of O C As % c>l O C As % of o c As % of 0 C As % of a C As % of O C As % of O
1 1 aSoca
i
2 2 alloca
t
3 3 allocat
e
4 4 allocate
d
5 5 allocate
d
6 allocate
d
7 7 allocate
d
S 8 allocate
d
9 •) allocate
d
10 10 allocate
d
11
Agriculture
And Allied
Sectors
17 15 80 13 12 99 M 13 102 17 14 78 12 12 105 6 6 116 6 6 122 f 5 111 6 4 88 4 4 103 4
Imgatic-ii,
Flood
Control and
Rural
Development
21 10 46 10 9 92 8 8 102 7 9 125 10 10 m IS 16 102 14 15 123 15 15 107 23 16 122 1 1 100 0
Industry and
Minerals
8 5 56 19 24 130 24 23 110 23 20 86 26 24 94 15 16 113 12 13 132 tl 10 102 9 5 69 4 5 110 5
Energy
Development
6 20 303 11 10 87 13 15 124 15 19 120 19 19 101 27 28 us 31 28 112 27 27 112 32 23 99 31 26 90 27
Transport and
Commurucalio
rt
24 26 104 29 27 94 20 25 142 20 20 95 18 17 100 16 16 114 15 17 140 19 II 125 0 2.5 25 25 107 21
Science,
Teclmology And
Environment
0 0 0 0 0 1 1 1 93 0 0 1 1 IIS 1 ] 123 2 1 79 3 2 85 2 2 94 3
Special
Programm
e
4 0 0 0 0 0 0 0 2 2 2 105 2 1 107 2 2 124 2 1 73 1 1 148 2 1 79 1
Economi
c
Services
0 0 0 0 0 0 0 0 0 0 0 0 1 1 161 1 1 136 ? 1 94 3 2 79 2
Genera
l
Service
s
0 0 0 0 0 0 0 0 0 0 0 0 1 1 147 0 1 189 2 2 125 1 1 125 1
Other
Progra
m
3 8 101 2 3 155 3 2 87 1 [ 91 0 0 1 1 106 0 0 0 0 0 0 0 0 0
Social
Service*
16 16 93 20 15 77 17 14 92 15 15 97 1.5 15 99 14 15 113 18 16 111 18 18 112 26 21 106 26 32 126 35
TOTAL 206
9
m
o
9E 480
0
467
2
97 750
0
852
0
81 1590
1
1556
7
3978
6
3942
6
99 9750
3
10929
2
101 18000
0
21B71
Q
91 4J409
9
■18545
7
101 69254
7
94104
1
7B 131350
2
138144
0
119 314642
8
Source: Five year plan of India

185
5.2.2 Overview of Gujarat Five Year Plan:The state of Gujarat, situated on west coast of India, came into being on
May 1st, 1960 had 19 district with population of 2.06 crores spread in the an
area of 1,87,091 square kilometers and which now has grown in 25 district
with 60 million (according to 2011 census) population spread in 1,92,022
square kilometers (seventh largest) and geographically the state may be
divided into five regions, viz., South, Central, North, Saurasthra and Kutch
regions. Gujarat has 26 regions, 226 Talkuas and 242 towns.
Government of Gujarat, in very short time period prepared the draft of third
five year plan. Third five year plan allocated 42 percent of total fund for
irrigation, flood and power sector. The growth rate was 3.3 percent. Fourth
five year plan aimed at growth with stability. The irrigation, flood and power
sector was given highest priority with 48 percent allocation. The growth rate
was 5 percent. Fifth five year plan achieved only 4.4 percent growth rate
due to decline in primary sector. Once again the major allocation was for
irrigation, flood and power sector (56percent) followed by agriculture (15.18
percent), social services (15 percent). Sixth five year plan faced worst
drought affecting economy of 13 districts. In the water scarce state,
irrigation is an important sector throughout the all plan period. Gujarat
energy development agency was also established-the thermal power
station was also established (Gandhinagar, Mahuva, Utran, Kandala,
Sikka). Seventh five year plan again passed through the drought affecting
12 districts. Hence Rs 1657 crores were allocated for irrigation, flood and
power sector. World Bank project allocated for this sector is now known as
Sardar Sarovar Projet with Rs 1063 crores in this plan year. After decade of

186
drought crisis the eight five year plan created hope for a better and stable
economy. The new industrial policy (1990-95), covered 140 talukas (out of
184). Environment had been added with respect to irrigation and flood
control under this plan year. With ninth five year plan, country entered new
era of liberalization. The greater earthquake (2001) and drought (2002)
again break the progress of the economy. During this plan period, “the
industrial policy after 2000” was introduced to reshape the industrial sector
of Gujarat under which business units established in each district except
dang. The tenth five year plan addresses the challenges of agro vision -
2010 and able to achieve 6.8 percent growth rate. The state government
addresses the demand and supply scenario of urban infrastructure in vision
2010.
Table 5.16. Allocation to various sectors (for Gujarat)
Sector ofDevelopment
0 C 0 C O C O C O C O C O C O C O C
2 2 3 3 4 4 5 5 6 6 7 7 8 8 9 9 10 10Agriculture andallied services
17 17 38 34 70 64 178 17 368 409 386 406 732 789 2010 2076 4169 2194
RuralDevelopmentand Co-operation
19 20 19 14 10 10 21 28 12 42 124 186 425 558 116? 1070 1600 1745
Irrigation, Floodand Power
57 51 98 112 220 291 650 537 2072 1944 1657 1152 3756 3309 8382 7149 0 0
Industrial andMinerals
5 4 8 10 20 20 49 53 171 215 258 449 667 644 1205 1346 2430 1202
Transport andcommunication
17 27 25 23 36 46 96 113 339 388 382 392 649 807 80! 2050 2215 4374
Power(energy) 0 0 0 0 0 0 0 0 0 0 1467 1537 2675 2550 4041 3972 0 0Science,Technology andEnvironment
0 0 0 0 0 0 0 0 0 0 10 3 15 8 58 175 383 575
Border areadevelopmentprog.
0 0 0 0 0 0 0 0 0 0 0 0 0 0 0 29 45 0
General services(Decentralizalion districtplanning)
0 0 0 0 0 0 0 0 200 172 2 1 10 2 9 8 986 1271
Social andCommunitysendees
28 29 48 47 64 79 174 154 573 0 1451 1242 2255 2706 9609 8380 17727 15796
EconomicServices
0 0 0 0 0 0 2 3 6 6 263 165 316 285 726 818 986 1271Miscellaneous 3 1 1 1 35 35 0 0 0 0 0 0 0 0 0 0 0 0Grand Total 146 1500 237 240 455 545 1170 1005 3760 3849 6000 5535 11500 11658 28000 27072 47000 45418
Source: Five year plan of Gujarat
187
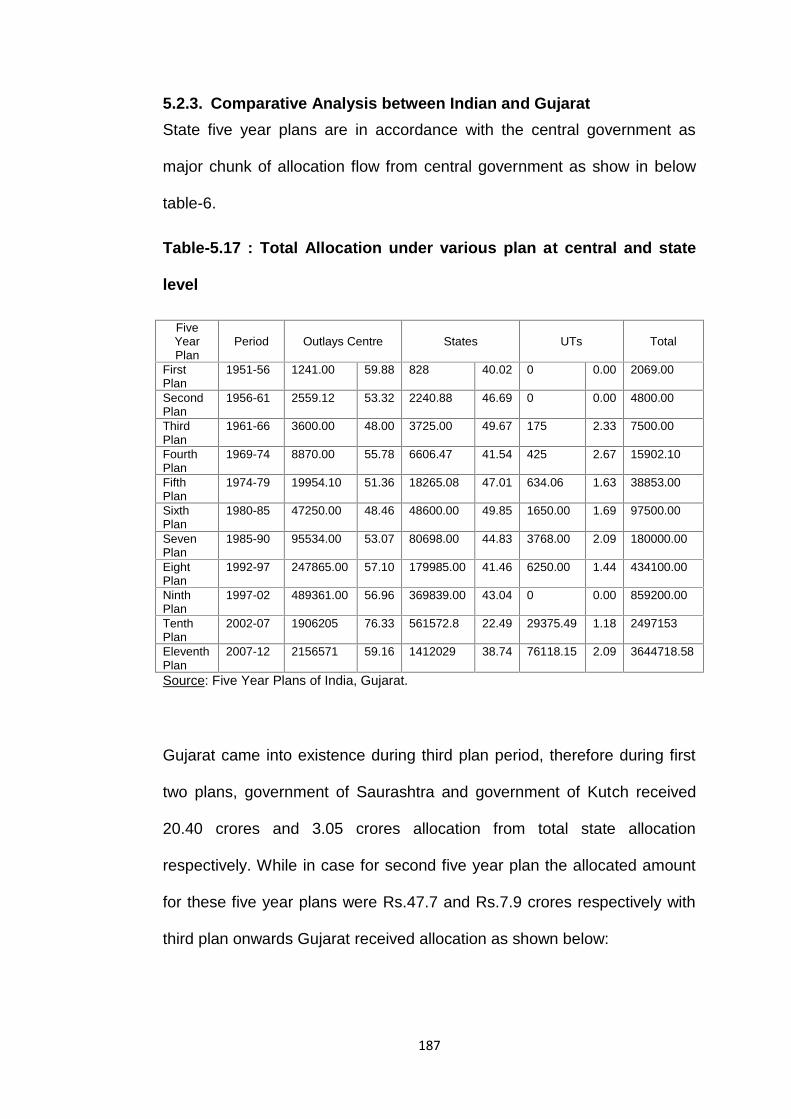
5.2.3. Comparative Analysis between Indian and GujaratState five year plans are in accordance with the central government as
major chunk of allocation flow from central government as show in below
table-6.
Table-5.17 : Total Allocation under various plan at central and state
level
FiveYearPlan
Period Outlays Centre States UTs Total
FirstPlan
1951-56 1241.00 59.88 828 40.02 0 0.00 2069.00
SecondPlan
1956-61 2559.12 53.32 2240.88 46.69 0 0.00 4800.00
ThirdPlan
1961-66 3600.00 48.00 3725.00 49.67 175 2.33 7500.00
FourthPlan
1969-74 8870.00 55.78 6606.47 41.54 425 2.67 15902.10
FifthPlan
1974-79 19954.10 51.36 18265.08 47.01 634.06 1.63 38853.00
SixthPlan
1980-85 47250.00 48.46 48600.00 49.85 1650.00 1.69 97500.00
SevenPlan
1985-90 95534.00 53.07 80698.00 44.83 3768.00 2.09 180000.00
EightPlan
1992-97 247865.00 57.10 179985.00 41.46 6250.00 1.44 434100.00
NinthPlan
1997-02 489361.00 56.96 369839.00 43.04 0 0.00 859200.00
TenthPlan
2002-07 1906205 76.33 561572.8 22.49 29375.49 1.18 2497153
EleventhPlan
2007-12 2156571 59.16 1412029 38.74 76118.15 2.09 3644718.58
Source: Five Year Plans of India, Gujarat.
Gujarat came into existence during third plan period, therefore during first
two plans, government of Saurashtra and government of Kutch received
20.40 crores and 3.05 crores allocation from total state allocation
respectively. While in case for second five year plan the allocated amount
for these five year plans were Rs.47.7 and Rs.7.9 crores respectively with
third plan onwards Gujarat received allocation as shown below:

188
Table-5.18 : Gujarat’s Share in various Plan (Rs. Incrores)
PlanYear 1 2 3 4 5 6 7 8 9 10 11
Gujarat 23.45
55.6
235 297 244 6000
28000
40007
106918
% tototalallocation
1.13 1.16
3.13
1.87
0.25
3.33 3.26 1.60 70.56
% astotalstateallocation
2.83 2.48
6.31
4.50
0.50
7.44 7.57 7.12 7.57
Source: Various Five Year Plan document, Government of India.
Gujarat received on an average very less except under 11th five year out of
total state allocation Gujarat on an average received 5.15 per cent.
However out of total allocated amount for various plans, Gujarat received
9.60 per cent, thanks to JNNRUM. Under JNNRUM, state and local bodies
required to reform their administrative and financial structure so as to
receive grant. For example, crude based double entry for all urban local
body is a mandatory reform. However, matching grant condition is also
applicable for local government to be able to be eligible for such grants. For
Instance, Ahmedabad Municipal Corporation was able to finance 50 per
cent of total amount, while matching grant from JNNRUM was 35 per cent
and rest of 15 per cent has been allocated from state government. Hence,
efficiency and effective implementation of project is must to be able to
receive grant under JNNRUM flagship program.
Sectorial comparison between Gujarat and India in absolute number will
not help in analysis hence, percentage of allocation out of total allocation in
various plan has been taken up for analysis purpose.

189
5.2.4 Urban Policy of IndiaAccording to constitution the urban planning and policy is state’s subject,
without constitution amendment, central government does not have a
power to pass legislation on urbanization or cities-urban planning. It can
issue directives provide advisory services set up model legislation and fund
program which the state can follow at will. However, in spite of being
empowered to do so very few state governments has taken the initiative for
policy making in these areas much of what exist as policy has come from
central government. This central government’s statement on urban policy
as expressed in five year plan (shaw-98).
Urban policy in five year plan of India can help the policy maker, economist
and researcher to analyze the changes in the trend of policy towards urban
region.
Urban HousingFirst five year plan
The housing was major area of concern for urban planner with increasing
urban population. It appeared that during the first plan about 6,00,000 units
had been provided in the private sector. Thus, during the first plan about
1.3 million urban houses were provided.
Second five year planSince, second plan onwards, the gap between urban population and urban
housing was felt however, urban housing, was not merely as a problem by
itself but as part of the wider problem of the planning of urban areas and of
their economic and other relationships with the regions in which they were
situated.

190
Third five year planGovernment allocated Rs 142 crores against Rs 84 crores in the second
outlay. Life insurance Corporation, whose contribution was, estimated
about Rs 60 crores.
Fifth five year planA provision was made to increase the enquiry participation in HUDCO to
enable it to generate resources of the order of Rs.150 crores in the Fifth
Plan period.
Sixth five year planThe sixth plan made a provision of Rs.96 crores in the central sector with a
matching provision in the State’s sector for the development of about 200
towns.
Seventh five year planThe national building organization (NBO) has estimated that the housing
shortage in 1981 was around 21 million dwelling units (16 million in rural
and 5 million in urban areas).
Eight five year planThe earlier projections of the national building organization (NBO) put the
urban housing stock 42.6 million during the period 1991.
Ninth five year planThe total plan outlay in the 46 years of planning on urban housing was
10,340 crore. Housing up-gradation has to cover about 7.5 million units in
urban during the ninth plan period.
191
Tenth five year planThe working Group on Housing had estimated the urban housing shortage
at the beginning of Tenth Plan at 8.89 million units and 3.5 million houses
for the urban poor.
Water and sanitation
First five year planNational Water Supply Program was launched in 1954. As safe and pure
drinking water is the basic requirement for both urban and rural.
Second five year planWater supply and drainage schemes, water supply schemes were taken up
Third five year planImportance of basic amenities like water supply, sanitation, transport and
power planning of land was also realized during third five year plan. Urban
water supply schemes were being executed by municipalities and
corporations with the help of loans provided by the central and state
governments.
Fourth five year planImportance and benefit of the economics of scale was realized to provide
basic amenities during fourth plan year as noted by planning commission -
it is necessary to create larger planning of area provided by law that the
plan formulated by regional authority were implemented by local
authorities.
192
Fifth five year planIn the first three years with an investment of Rs.257.54 crores, about 266
towns were expected to be covered with water supply and 46 towns with
sewerage and drainage systems with an outlay of Rs.281.63 crores for the
remaining two years of the fifth plan, about 254 towns were expected to be
covered with water supply and 38 sewerage and drainage systems.
Due to employment opportunity, migration rate slowly but steadily moved
towards towns and bigger urban regions, result into to overcrowding and
slums. Fifth five year plan were emphasized on the development of these
areas.
Sixth five year planThe proposed investment of about Rs.150 crores was expected to benefit
about 10.0 million people, assuming a per capita expenditure of Rs.150.
This scheme was applicable to all urban areas irrespective of the size of
the city/town. This forms part of the minimum needs program.
The UNDP Global Project in India was intended to assist and promote
installation of water-seal latrines in 110 towns in 7 states. According to
reports by the end of sixth plan only 57.27 million (33 per cent of the urban
population) people could be provided with sanitation facilities.
Seventh five year planDuring seventh five year plan emphasized on utilization of urban waster
through cost effective processes to reduce environmental pollution, also to
producing energy for domestic and other productive uses.
193
It was first time recommended in seventh five year plan to pay for water
supply from beneficiaries in urban areas and the State Governments and
local bodies was advice to explore the possibility of raising funds for water
supply schemes through suitable levies (capital charges) on the potential
beneficiaries.
The most important change has taken place during Eighth Five Year Plan
(1992-97) i.e. introduction of 73rd and 74th constitutional amendment act.
The distinctive features of the plan were as follows;
i Spatial and economic dimension of planning for the urban sector
needs to be consolidated and operationalised.
ii Convergence of all related programs to create the desired impact in
small and medium towns beyond the threshold level is necessary.
Eighth five year planIn the initial period of the planning, from the first to the fifth plan, the outlay
on urban drinking water was considered substantial with respect to the size
of the urban population (17.3 to 19.9 per cent) but thereafter, the thrust in
the plan program was diverted to rural water supply and sanitation, in spite
of the rapidly increasing proportion of urban population which was 17 per
cent at the time of the first five year and 25.7 per cent at the time of the
eighth plan.
Ninth five year planThe total plan outlay in the 46 years of planning for urban water supply and
sanitation was Rs.15,100 crore. The urban drinking water supply in the
ninth plan was to address the priority concerns of universal coverage,
194
adequacy in terms of minimum per capita consumption norms, quality,
distance from source as well as regularity of supply, and operational issues
of drying and inaccessible sources of water, recycling of waste water and
sewage for non-domestic use, water harvesting, among other.
Tenth five year planThe traditional role of municipal bodies had been one of providing basic
amenities of civic life such as water and sanitation. According to the 54th
round of National Sample Survey (NSS) an estimated 70 per cent of urban
households reported being served by tap and 21 per cent by tube-well or
hand-pump.
Low cost Latrines the main objective of the scheme was to convert the
existing dry latrines into low cost pour flush latrines and provide alternative
employment to the liberated scavengers.
Regional Planning and Urban Development:
Second five year planThe aim should be to have balanced urban-rural regions development.
(1) The towns and cities such as Delhi, Bombay, Calcutta, Madras,
Ahmedabad, Hyderabad, Kanpur, Lucknow, Puna etc. was
required early attention due to rapid urbanization.
(2) The preparation of regional plans for such towns was too prepared.
(3) Development of river valley areas was required careful surveys of
their topography resources, development needs and potential.
(4) Town and country planning legislation has enacted only in four
states up till second five year plan.
(5) A number of programs on urban development and re-development.

195
Fiscal Changes and Urban Development
Forth five year planFiscal changes were also proposed by planning commission like levy tax
on vacant land, of course levied only in metro and rapidly developing cities
with higher purchasing power.
(b) Regional studies in respect of metropolitan regions around Delhi,
Greater Bombay and Calcutta were initiated.
(d) By 1968, almost all the states introduced Town Planning Legislation
with varying scope.
Special Case of Calcutta Metropolitan Region
Forth five year planMigration from Bangladesh was established then in West Bangle. A
provision of Rs.42 crores has been made in the West Bangal Plan for
integrated urban development of the Calcutta Metropolitan Region.
Decentralization:
Forth five year planImportance of Decentralization theorem was emphasized for the first time
during this plan year.
Urban Development
Fifth five year planUrban Development programs were taken up in the three metropolitan
cities of Calcutta, Bombay and Madras and none other cities in 1974-75.
Additional six cities were taken up in 1975-76 and it was expected to take
up six more during 1976-77.

196
Seventh five year planUrban development in this plan period covers the issues such as: Re-
examination of the planned and integrated development of small and
medium towns and cities along with slowing down of the growth of big
metropolises; revitalization of civic bodies; thorough-going reforms of
municipal tax systems and municipal administration in general,
concentration on the improvement of slums and the provision of basic
municipal services.
Eighth five year planUrban local bodies were expected to shape better of such growing cities
especially after 74th constitutional amendment act. In the report of National
Commission on Urbanization (1988), emphasized was on more effective
implementation of the strategies adopted during the seventh plan and partly
in formulation of new strategies. For instance, in 1950-51 the contribution of
urban sector to India’s GDP was estimated at only 29 per cent, which
increased to 47 per cent in 1980-81.
Ninth five year planThe total plan outlay in the 46 years of planning has been Rs.8580/- crore
on urban development.
Integrated Development of Small and Medium Towns was ambitious
plan to developed the small and medium town which reduce the pressure
on bigger urban towns as well as local government.

197
Sixth five year planUnfortunately urban development has seen as complementary to rural
development and policies affecting urbanization was such as to strengthen
the links between towns and cities and their hinterland. Urban areas of all
sizes mentioned in sixth five year plan were seen as only market centers
for agriculture output and provide a variety of service functions in addition
to operating as centers of manufacturing activities as noted by planning
commission.
Seventh five year planDSMT was to provide complementary infrastructural support during the
seventh plan period 145 additional towns were covered with a central
provision of Rs.88 crores. A centrally sponsored scheme known as Urban
Basic Services was introduced in 1986, with the primary objective of
enhancing the survival and development of women and children of urban
low income families.
Eighth five year planThe integrated development of small and medium towns (IDSMT) scheme
was initiated by the government in 1979-80 with a view to reducing the
migration of population from rural areas to large cities, generating
employment by increasing resource generating ventures in the small and
medium towns and providing sufficient infrastructure facilities in these
towns.
The Regional Plan - The National Capital Region approved by the National
Capital Region Planning Board (NCRPB) has the following objectives;

198
i) Reducing pressure of population of Delhi and
ii) Achieving a balanced and harmonious development of the National
Capital Region.
Environmental Improvement of Urban Slums (EIUS):
Seventh five year planWithin towns and cities there was a much greater need for community
participation as urban local government were not equally capable of
providing urban services due to lack of autonomy.
The seventh five year plan includes a provision of Rs.930 crores in the
states’ sector for provision of infrastructure facilities like roads, pavements,
minor civic works as well as amenities as bus sheds, market and shopping
complexes and theatre.
Accelerated Urban Water Supply Program (AUWSP): The potable water
has always been an important aspect in urban regions of the country.
Eighth five year planA new program was launched in the eighth plan for urban water supply,
namely the Accelerated Urban Water Supply Program (AUWSP), which
was targeting to small towns (population less than 20,000, 1991 census).
However, the revenue base of the urban local bodies in these was weak.
The Asian Development Bank has provided this type of assistance for the
first time in India for some urban projects in Karnataka during the eighth
plan the key urban concern was, growing gap between demand and supply
of basic services.
199
Ninth five year planThe ninth plan sub-group of the planning commission on environment and
health had concluded that the unsatisfactory progress in supply of safe
drinking water and sanitary disposal of solid and liquid waste had
contributed to the continued high morbidity from water-borne and vector-
borne diseases.
The “polluter pays” principle should be applied and the proceeds may be
used to finance waste disposal program.
External Assistance for various projects
Ninth five year planNinth five year plan noted external assistants for various project expanded
well beyond this five year plan.
(a) The OECF (Japan) has provided assistance for city water supply
project in Shoplapur and New Mumbai and some other infrastructure
activities. The World Bank has extended a grant of US $ 1.0 million
to HUDCO.
(b) The World Bank had also provided a line of credit to the Government
of Maharashtra.
(c) The Overseas Development Administration (ODA, UK) supports
slum improvement projects in seven Indian cities.
(d) The Government of Netherlands supports a pilot project, Bangalore
Urban Poverty Alleviation Project (BUPP), at an estimated cost of
Rs.1.5 crore in phase-I.
(e) The World Bank and the Asian Development Bank had provided
external assistance for urban sector projects, the former in Tamil
Nadu and Uttar Pradesh and the latter in Karnataka.
200
(f) The ADB was funding the Karnataka Urban Infrastructure
Development Project, whose estimated cost was $ 132 million.
(g) Another ADB activity was the India Urban Sector Profile (TA Study),
US $ 435,000. The project was reviewed India’s Urban Sector
policies and programs.
Urban Mapping and Disaster Management
Ninth five year planA vulnerability Atlas was being developed to indicate disaster-prone sites in
the country.
Environmental Issues and Ganga Action Plan
Ninth five year planAnother centrally sponsored scheme, the Ganga action plan (GAP),
implemented by the central ministry of environment and Forest has
contributed to the improvement of the sanitation facilities in 25 Class I cities
along the river Ganga in the States of Uttar Pradesh, Bihar and West
Bengal.
Data Base and other Regulation
Ninth five year planFurther, the ninth plan strengthens the activity relating to data base,
monitoring and evaluation as the existing system had been found to be
inadequate.
201
Urban Transport
Ninth five year planRapidly urbanizing cities push up the income level of individuals. Except for
mega cities, modal split in favour of mass transport was poor. The
development activities in the Ninth Plan would give a thrust to multi-modal
transport program in order to meet the requirements of all categories of
passengers.
Urban Governance
Tenth five year planDuring tenth five year plan, the constitution (74th) Amendment Act, 1992
was intended to give a more focused thrust decentralization and the
creation of a democratic governance structure with local responsibilities
being assumed and managed at the local level.
Thrust Areas
Tenth five year plan(a) Investments over the years and institutional effort had resulted in the
setting up of a variety of urban infrastructure and services.
(b) Public-private partnerships were brought on to the urban agenda for
improving efficiency and better service delivery. However, capacity
building in the public services had to be given highest priority.
(c) Finances of the ULBs need strengthening through smooth working
of the state finance commission awards, rationalisation and
improvement of the property taxation system, and a sufficient level
of levy of user charges.
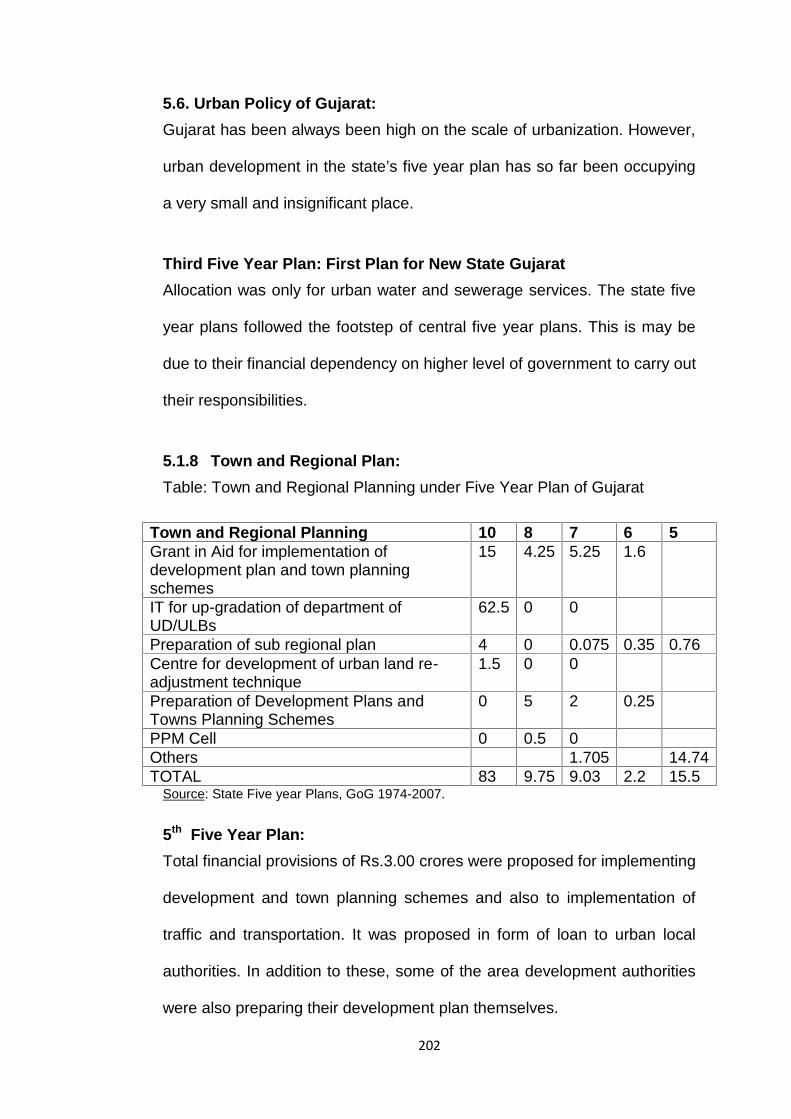
202
5.6. Urban Policy of Gujarat:Gujarat has been always been high on the scale of urbanization. However,
urban development in the state’s five year plan has so far been occupying
a very small and insignificant place.
Third Five Year Plan: First Plan for New State GujaratAllocation was only for urban water and sewerage services. The state five
year plans followed the footstep of central five year plans. This is may be
due to their financial dependency on higher level of government to carry out
their responsibilities.
5.1.8 Town and Regional Plan:Table: Town and Regional Planning under Five Year Plan of Gujarat
Town and Regional Planning 10 8 7 6 5Grant in Aid for implementation ofdevelopment plan and town planningschemes
15 4.25 5.25 1.6
IT for up-gradation of department ofUD/ULBs
62.5 0 0
Preparation of sub regional plan 4 0 0.075 0.35 0.76Centre for development of urban land re-adjustment technique
1.5 0 0
Preparation of Development Plans andTowns Planning Schemes
0 5 2 0.25
PPM Cell 0 0.5 0Others 1.705 14.74TOTAL 83 9.75 9.03 2.2 15.5
Source: State Five year Plans, GoG 1974-2007.
5th Five Year Plan:Total financial provisions of Rs.3.00 crores were proposed for implementing
development and town planning schemes and also to implementation of
traffic and transportation. It was proposed in form of loan to urban local
authorities. In addition to these, some of the area development authorities
were also preparing their development plan themselves.
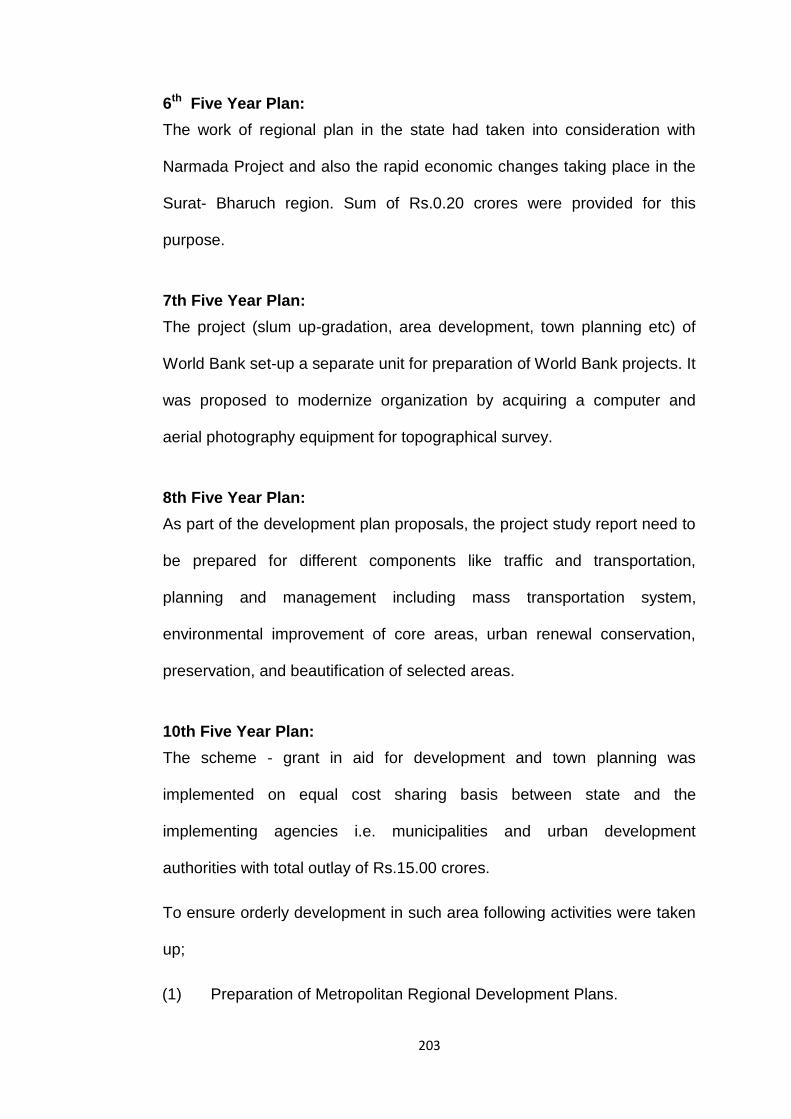
203
6th Five Year Plan:The work of regional plan in the state had taken into consideration with
Narmada Project and also the rapid economic changes taking place in the
Surat- Bharuch region. Sum of Rs.0.20 crores were provided for this
purpose.
7th Five Year Plan:The project (slum up-gradation, area development, town planning etc) of
World Bank set-up a separate unit for preparation of World Bank projects. It
was proposed to modernize organization by acquiring a computer and
aerial photography equipment for topographical survey.
8th Five Year Plan:As part of the development plan proposals, the project study report need to
be prepared for different components like traffic and transportation,
planning and management including mass transportation system,
environmental improvement of core areas, urban renewal conservation,
preservation, and beautification of selected areas.
10th Five Year Plan:The scheme - grant in aid for development and town planning was
implemented on equal cost sharing basis between state and the
implementing agencies i.e. municipalities and urban development
authorities with total outlay of Rs.15.00 crores.
To ensure orderly development in such area following activities were taken
up;
(1) Preparation of Metropolitan Regional Development Plans.
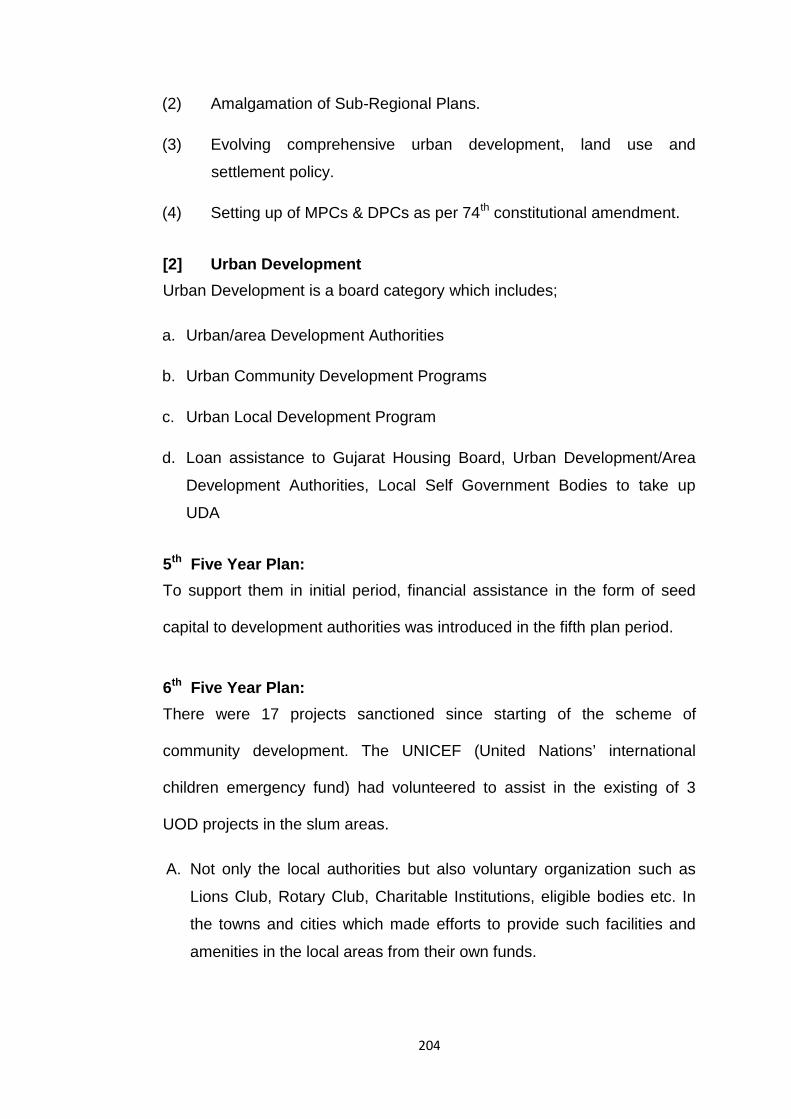
204
(2) Amalgamation of Sub-Regional Plans.
(3) Evolving comprehensive urban development, land use and
settlement policy.
(4) Setting up of MPCs & DPCs as per 74th constitutional amendment.
[2] Urban DevelopmentUrban Development is a board category which includes;
a. Urban/area Development Authorities
b. Urban Community Development Programs
c. Urban Local Development Program
d. Loan assistance to Gujarat Housing Board, Urban Development/Area
Development Authorities, Local Self Government Bodies to take up
UDA
5th Five Year Plan:To support them in initial period, financial assistance in the form of seed
capital to development authorities was introduced in the fifth plan period.
6th Five Year Plan:There were 17 projects sanctioned since starting of the scheme of
community development. The UNICEF (United Nations’ international
children emergency fund) had volunteered to assist in the existing of 3
UOD projects in the slum areas.
A. Not only the local authorities but also voluntary organization such as
Lions Club, Rotary Club, Charitable Institutions, eligible bodies etc. In
the towns and cities which made efforts to provide such facilities and
amenities in the local areas from their own funds.
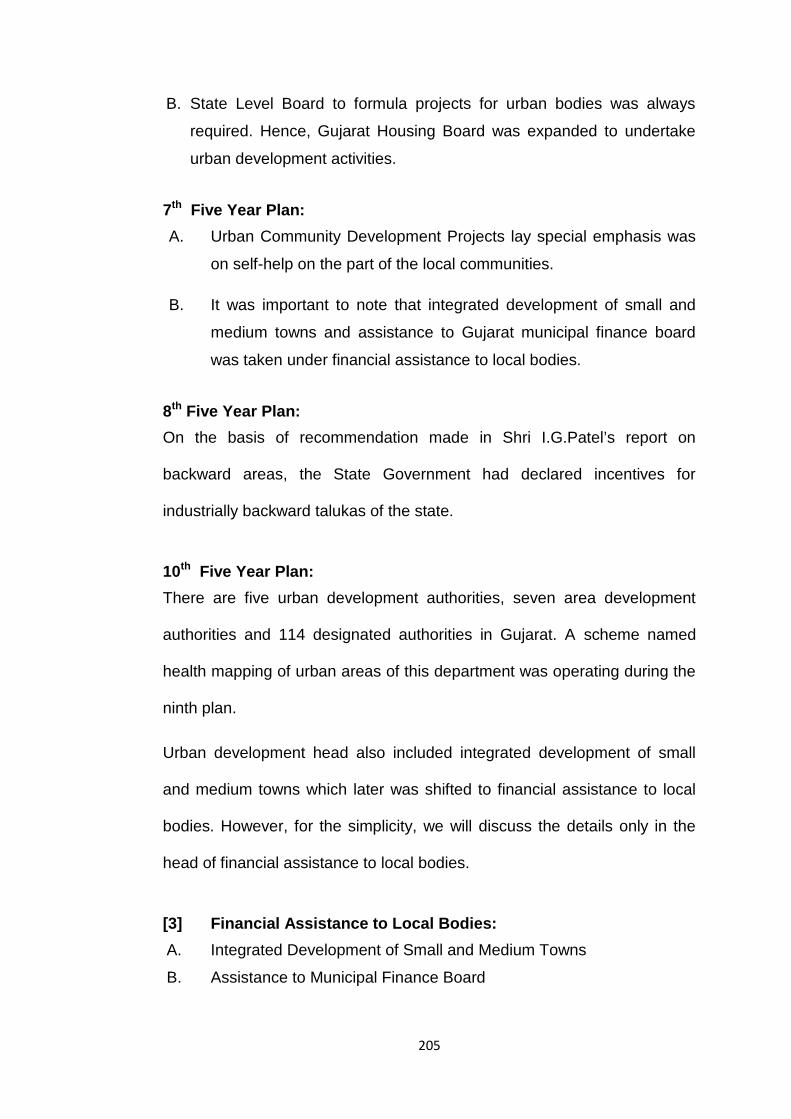
205
B. State Level Board to formula projects for urban bodies was always
required. Hence, Gujarat Housing Board was expanded to undertake
urban development activities.
7th Five Year Plan:A. Urban Community Development Projects lay special emphasis was
on self-help on the part of the local communities.
B. It was important to note that integrated development of small and
medium towns and assistance to Gujarat municipal finance board
was taken under financial assistance to local bodies.
8th Five Year Plan:On the basis of recommendation made in Shri I.G.Patel’s report on
backward areas, the State Government had declared incentives for
industrially backward talukas of the state.
10th Five Year Plan:There are five urban development authorities, seven area development
authorities and 114 designated authorities in Gujarat. A scheme named
health mapping of urban areas of this department was operating during the
ninth plan.
Urban development head also included integrated development of small
and medium towns which later was shifted to financial assistance to local
bodies. However, for the simplicity, we will discuss the details only in the
head of financial assistance to local bodies.
[3] Financial Assistance to Local Bodies:A. Integrated Development of Small and Medium Towns
B. Assistance to Municipal Finance Board

206
Table 5.19: Financial Assistance to urban local bodies
Financial Assistance to Urban LocalBodies
10 8 7 6(Loan)
Urban Infrastructure 0Institutional Finance for MunicipalCorporation
0
Creation of revolving funds for urbaninfrastructure
150
Loan to municipalities for miscellaneousdevelopment activities
0 2 1
Market borrowing to municipal corporation formisc. development activities
0 80 13 5.6
TOTAL 250 80 15 6.6Source: Five Year Plan, Government of Gujarat
6th Five Year Plan:The State Government had appointed an expert committee to study the
problems, potential and prospects of the development of such towns and
the committee submitted its report. Accordingly, as many as 18 towns had
been identified.
A. The Gujarat Municipal Finance Board has to meet with the
administrative expenditure for this purpose an outlay of Rs.0.25 crores
were provided as grant for the sixth five year plan 1980-85.
B. Loans worth Rs.0.31 crores sanctioned to municipalities for purchase of
fire fighter and other purpose for the year 1978-79 and 1979-80.
Scheme did continue in sixth five year plan as well with allocated fund
of Rs.1.00 crores.
C. Open market borrowings were sanctioned to municipal corporations for
development activities.
7th Five Year Plan:A. Open market borrowings were sanctioned to Municipal Corporation
for their development activities. The amount that can be raised is
subject to restrictions imposed by the Reserve Bank of India.

207
C. Loans are given to local bodies for misc. development activities
which were not covered in the sectoral program of the State Plan
which was worth Rs.17.61 lakhs as sanctioned during the sixth five
year plan purchase of fire fighters and for other purposes.
8th Five Year Plan:The Small and Medium Towns have a crucial role to play in the process of
urbanization. The Government of India during the Sixth Five Year Plan
initiated the loan scheme and at the first instances 17 towns were covered
in Gujarat.
10th Five Year Plan:D. Fund for Urban Infrastructure
1. Institutional Finance for Municipal Corporations
2. Creation of Revolving Fund for Urban Infrastructure (Urban
Infrastructure Municipalities and City Development)
[4] City Survey:City Survey was introduced under section 95 with section 131 of the Land
Revenue Code. It provides the basis for preparation of development plans
under town financing act. City Survey maps are also useful for providing
accurate topographical details required for various development schemes.
6th Five Year Plan:City survey scheme has been conducted for the walled city Ahmedabad. It
is also useful for land ceiling act.
7th Five Year Plan:City Survey is useful in determining unauthorized non-agricultural uses and
detecting encroachments on public lands.

208
8th Five Year Plan:During the eighth five year plan, computerization of the city survey records
in two city areas were proposed as an experiments. Thus, an outlay of
Rs.5.00 crores was provided for the scheme of city survey village.
[5] Minimum Need Program:The services under the scheme are to be provided in the existing slums on
Government to Municipal land as well as lands belonging to private owners.
The scheme envisages that the land covered under slum area, is to be
acquired by the Government. The allocation increased five times from the
year of implementation to tenth five year plan.
Minimum Need Program 10 8 7 6 5Environment Improvement in Urban Slums 75 21 5 5 17Development of Tribal Nagar palika and inTribal Pockets in other Urban Areas
5
TOTAL 80 21 2 2 17
6th Five Year Plan:In case of minimum need program which carry the scheme “Environment
Improvement in Urban Slums” under central sector covered cities with
population of 8 lakhs and more. Hence, only Ahmedabad city was given
priority. An outlay of Rs.5.00 crores was provided under sixth five year plan
of 1980-85.
7th Five Year Plan:The scope of the scheme was extended to cities with a population of 3
lakhs and above. Accordingly, Vadodara, Surat and Rajkot cities were also
covered.
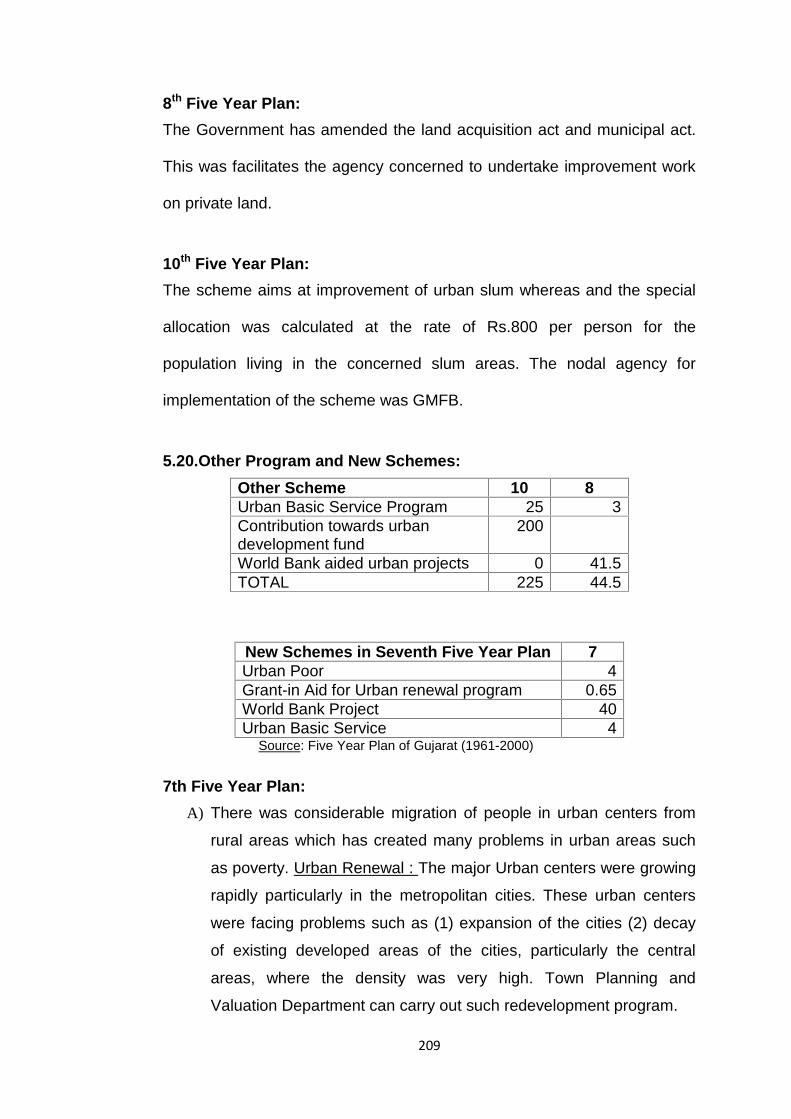
209
8th Five Year Plan:The Government has amended the land acquisition act and municipal act.
This was facilitates the agency concerned to undertake improvement work
on private land.
10th Five Year Plan:The scheme aims at improvement of urban slum whereas and the special
allocation was calculated at the rate of Rs.800 per person for the
population living in the concerned slum areas. The nodal agency for
implementation of the scheme was GMFB.
5.20.Other Program and New Schemes:Other Scheme 10 8Urban Basic Service Program 25 3Contribution towards urbandevelopment fund
200
World Bank aided urban projects 0 41.5TOTAL 225 44.5
New Schemes in Seventh Five Year Plan 7Urban Poor 4Grant-in Aid for Urban renewal program 0.65World Bank Project 40Urban Basic Service 4
Source: Five Year Plan of Gujarat (1961-2000)
7th Five Year Plan:A) There was considerable migration of people in urban centers from
rural areas which has created many problems in urban areas such
as poverty. Urban Renewal : The major Urban centers were growing
rapidly particularly in the metropolitan cities. These urban centers
were facing problems such as (1) expansion of the cities (2) decay
of existing developed areas of the cities, particularly the central
areas, where the density was very high. Town Planning and
Valuation Department can carry out such redevelopment program.
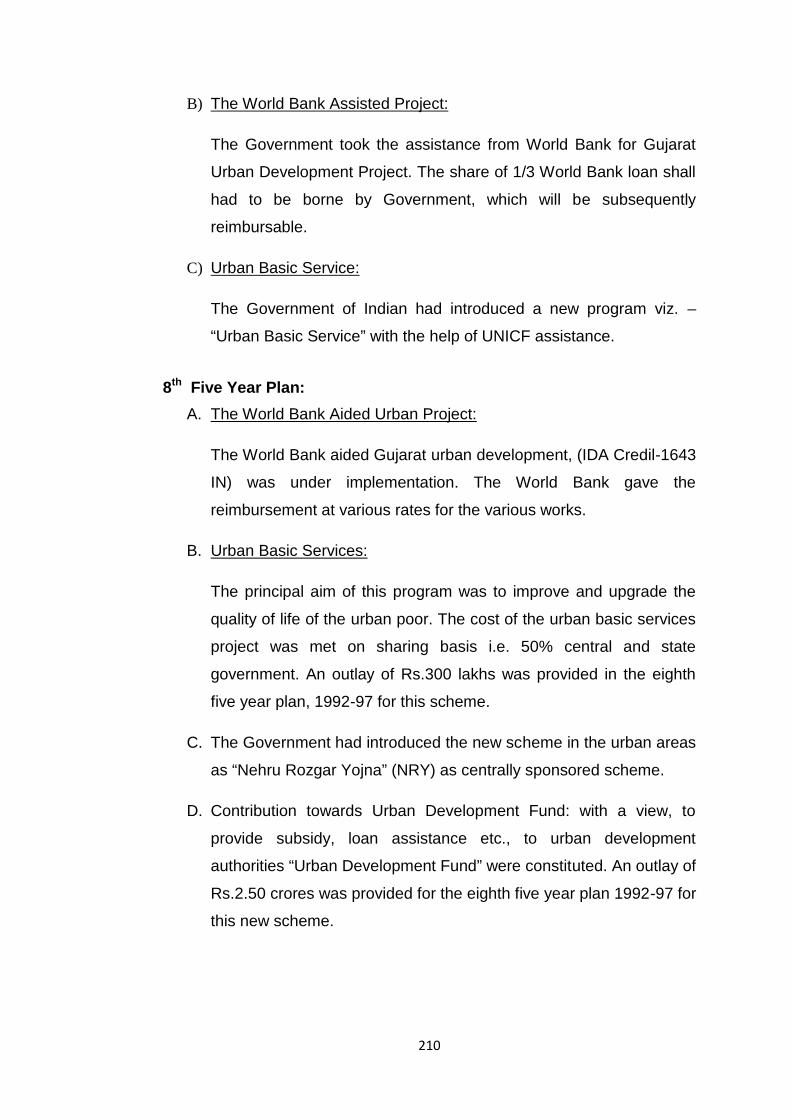
210
B) The World Bank Assisted Project:
The Government took the assistance from World Bank for Gujarat
Urban Development Project. The share of 1/3 World Bank loan shall
had to be borne by Government, which will be subsequently
reimbursable.
C) Urban Basic Service:
The Government of Indian had introduced a new program viz. –
“Urban Basic Service” with the help of UNICF assistance.
8th Five Year Plan:A. The World Bank Aided Urban Project:
The World Bank aided Gujarat urban development, (IDA Credil-1643
IN) was under implementation. The World Bank gave the
reimbursement at various rates for the various works.
B. Urban Basic Services:
The principal aim of this program was to improve and upgrade the
quality of life of the urban poor. The cost of the urban basic services
project was met on sharing basis i.e. 50% central and state
government. An outlay of Rs.300 lakhs was provided in the eighth
five year plan, 1992-97 for this scheme.
C. The Government had introduced the new scheme in the urban areas
as “Nehru Rozgar Yojna” (NRY) as centrally sponsored scheme.
D. Contribution towards Urban Development Fund: with a view, to
provide subsidy, loan assistance etc., to urban development
authorities “Urban Development Fund” were constituted. An outlay of
Rs.2.50 crores was provided for the eighth five year plan 1992-97 for
this new scheme.

211
E. Financial Assistance to urban development authorities for
identification infrastructure: Their main function was to check on the
under irregular construction in the areas under their jurisdiction.
9th Five Year Plan:All new schemes introduced ninth five year plan continued in tenth five year
plan also hence, the tenth five year plan allocation is also mention.
A. Institutional Strengthening of Manpower
B. Eleventh Finance Commission
C. The National Slum Development Program
D. The Swarnim Jayanti Shaheri Rozgar Yojna
1. Urban Self Employment Program (USEP)
2. Urban Wage Employment Program (UWEP)
E. Gujarat Urban Development Corporation
F. Relief in Electricity Development Scheme
G. Vajpayee Town Development Scheme
H. District Urban Development Agency
I. State Subsidy in Swarnim Jayanti Shaheri Rojgar Yojna
J. Survey Below Poverty Level Families
K. Assistances to local bodies for setting up treatment and disposal
facilities in connection with solid waste management
L. Financial Assistance to Gujarat Fire Service Board
M. Externally Aided Projects
N. Low Cost Sanitation Projects
O. Assistance to Disaster Management Authorities
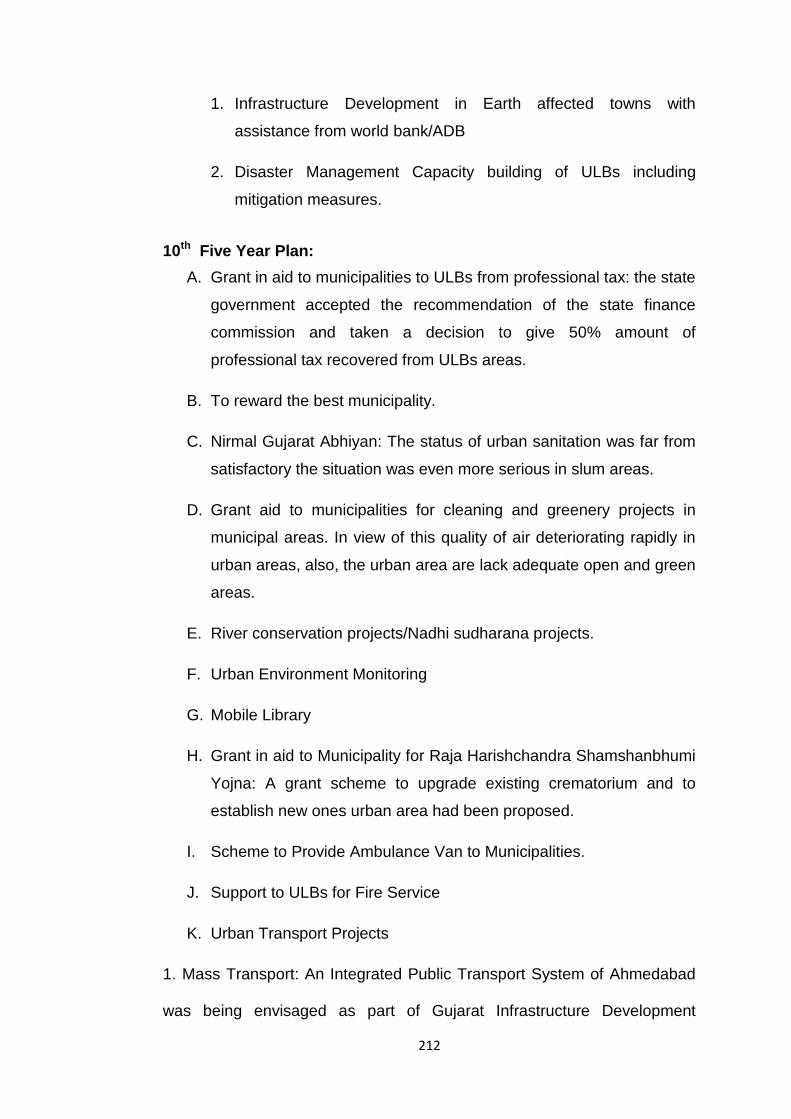
212
1. Infrastructure Development in Earth affected towns with
assistance from world bank/ADB
2. Disaster Management Capacity building of ULBs including
mitigation measures.
10th Five Year Plan:A. Grant in aid to municipalities to ULBs from professional tax: the state
government accepted the recommendation of the state finance
commission and taken a decision to give 50% amount of
professional tax recovered from ULBs areas.
B. To reward the best municipality.
C. Nirmal Gujarat Abhiyan: The status of urban sanitation was far from
satisfactory the situation was even more serious in slum areas.
D. Grant aid to municipalities for cleaning and greenery projects in
municipal areas. In view of this quality of air deteriorating rapidly in
urban areas, also, the urban area are lack adequate open and green
areas.
E. River conservation projects/Nadhi sudharana projects.
F. Urban Environment Monitoring
G. Mobile Library
H. Grant in aid to Municipality for Raja Harishchandra Shamshanbhumi
Yojna: A grant scheme to upgrade existing crematorium and to
establish new ones urban area had been proposed.
I. Scheme to Provide Ambulance Van to Municipalities.
J. Support to ULBs for Fire Service
K. Urban Transport Projects
1. Mass Transport: An Integrated Public Transport System of Ahmedabad
was being envisaged as part of Gujarat Infrastructure Development
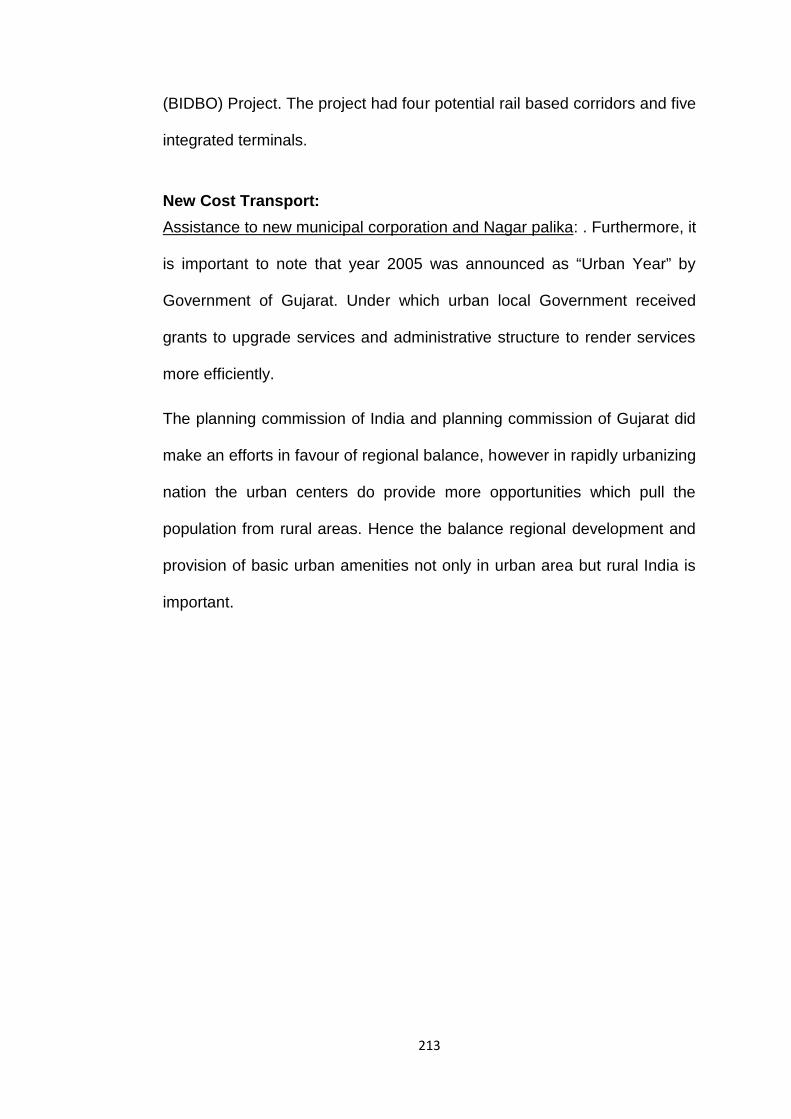
213
(BIDBO) Project. The project had four potential rail based corridors and five
integrated terminals.
New Cost Transport:Assistance to new municipal corporation and Nagar palika: . Furthermore, it
is important to note that year 2005 was announced as “Urban Year” by
Government of Gujarat. Under which urban local Government received
grants to upgrade services and administrative structure to render services
more efficiently.
The planning commission of India and planning commission of Gujarat did
make an efforts in favour of regional balance, however in rapidly urbanizing
nation the urban centers do provide more opportunities which pull the
population from rural areas. Hence the balance regional development and
provision of basic urban amenities not only in urban area but rural India is
important.


