
CHAPTER 5 –ENERGY EFFICIENCY
Phot
o: P
aulo
Bar
ros/
Met
ro-D
F

81
MAIN MESSAGES• Global trend: During the period 2014-15, global primary energy intensity fell by 2.8%, reaching 5.3
megajoules (MJ) per 2011 purchasing power parity dollar (PPP $). This is the fastest decline since 2010, the start of the tracking period. Thus, the headline indicator for energy efficiency, which is the compound annual growth rate of primary energy intensity since 2010, improved from -2.0% (2010-14) to -2.2% (2010-15).
• 2030 target: However, this rate is still short of the -2.6% target needed to meet the 2030 Sustainable Development Goal (SDG) 7.3 target for energy efficiency. Historical trends show that a 2.6% annual improvement was achieved in only three individual years since 1990, making the goal challenging. Each year that the improvement rate is not met raises the effective target for the remaining years to 2030, and this now stands at -2.7%.
• Regions and income groups: On a global level, GDP grew nearly twice as fast as primary energy supply1 in 2010–15, but results were mixed among regions and income groups. A lack of consistent progress was noticeable in the Western Asia and Northern Africa region and the Latin America and Caribbean region, with Western Asia and Northern Africa being the only region where GDP growth did not outpace energy supply. All income groups achieved faster GDP growth than energy supply, but progress continues to be slow in low-income countries, where energy intensity is higher than the global average.
• Demand-side intensity: Globally, although the industry sector still consumes the most energy, it made the most progress toward improved efficiency, which was especially noticeable in the upper- and lower-middle-income groups. Among high-income countries, transport remains the highest energy-consuming sector. Recent innovations in digitalization and electric mobility represent a key opportunity for policy makers to drive reductions in transport energy intensity, especially for freight transport. Residential energy intensity increased in low- and middle-income countries since 2010. As housing demand and service levels grow with economic development in low- and lower-middle-income countries, energy efficiency in the residential sector is critical to avoid costly lock-ins of inefficient buildings and appliances.
• Supply-side intensity: The average thermal efficiency of fossil fuel powered electricity generation continues to increase, reaching 39% in 2015. This increase is driven primarily by more efficient natural gas power plants. By contrast, the average efficiency of coal-fired plants remained relatively stagnant, suggesting limited uptake of supercritical technology. There was a similar lack of progress in the thermal efficiency of oil-fired power generation. Power transmission and distribution losses remained unchanged, and continue to show a strong correlation with income levels, highlighting the potential for improvement in developing countries.

82
Tracking SDG7: The Energy Progress Report 2018
• Largest energy suppliers: The performance of the world’s top twenty countries in terms of energy supply is critical to achieving the SDG 7.3 target. In 2015, these countries accounted for nearly 80% of total primary energy supply. Encouragingly, six of them, including two of the world’s top five (Japan and the United States), seem to have reached a peak in energy demand, and reduced their annual primary energy supply in 2010–15 while continuing to grow GDP. Eight of the largest countries also outperformed the world average in reducing their energy intensity during the tracking period, with China, Indonesia, Japan, and the United Kingdom exceeding 3% improvement.
FIGURE 5.1 • Primary energy intensity in 2015 (MJ/2011 $US PPP)
100% of the global average and aboveFrom 75% up to 100% of the global averageFrom 50% up to 75% of the global averageUnder 50% of the global averageTop 20 Energy Supply Countries
Source: International Energy Agency (IEA), World Development Indicators (WDI) and United Nations Statistics Division (UNSD) data
83
Chapter 5 –Energy Efficiency
THE STORY IN PICTURES
GLOBAL TRENDS
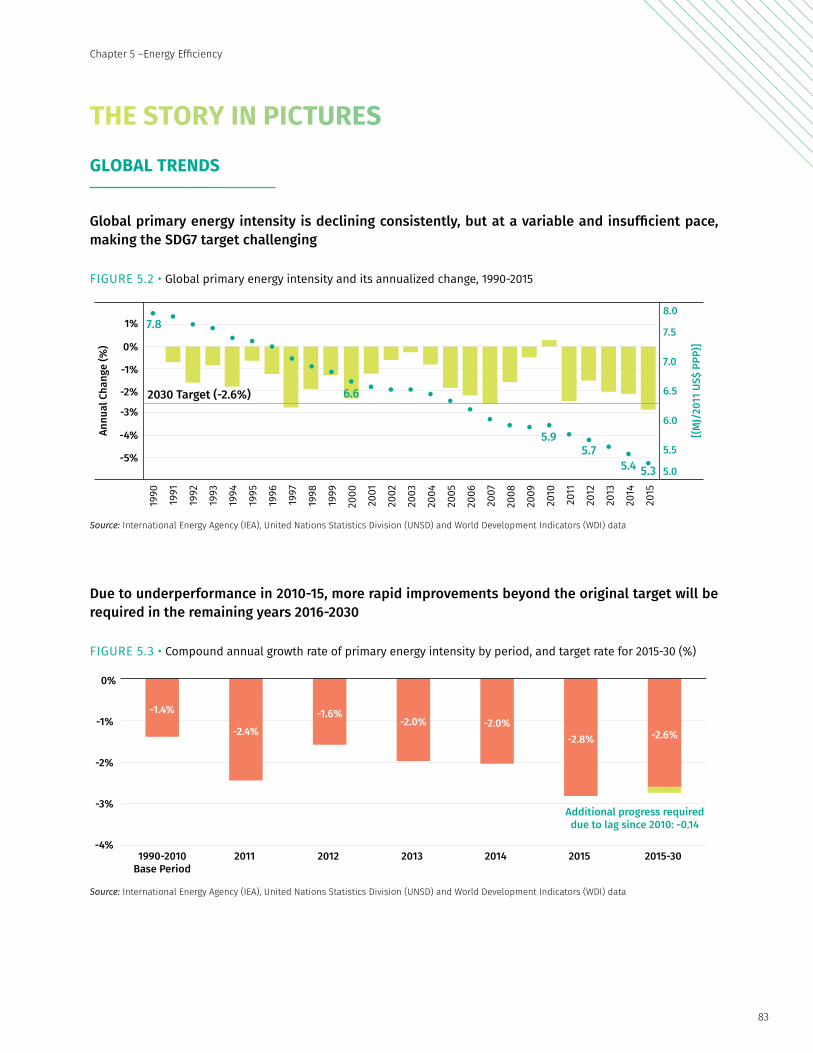
Global primary energy intensity is declining consistently, but at a variable and insufficient pace, making the SDG7 target challenging
Due to underperformance in 2010-15, more rapid improvements beyond the original target will be required in the remaining years 2016-2030
FIGURE 5.2 • Global primary energy intensity and its annualized change, 1990-2015
1990
1991
1992
1993
1994
1995
1996
1997
1998
1999
2000
2001
2002
2003
2004
2005
2006
2007
2008
2009
2010
2011
2012
2013
2014
2015
Annu
al C
hang
e (%
)
2030 Target (-2.6%)
1%
0%
-1%
-2%
-3%
-4%
-5%
[(MJ/
2011
US$
PPP
)]
8.0
7.5
7.0
6.5
6.0
5.5
5.0
7.8
6.6
5.95.7
5.4 5.3
Source: International Energy Agency (IEA), United Nations Statistics Division (UNSD) and World Development Indicators (WDI) data
FIGURE 5.3 • Compound annual growth rate of primary energy intensity by period, and target rate for 2015-30 (%)
-1.4%
-2.4% -1.6%
-2.0% -2.0% -2.8% -2.6%
-4%
-3%
-2%
-1%
0%
1990-2010Base Period
2011 2012 2013 2014 2015 2015-30
Additional progress required due to lag since 2010: -0.14
Source: International Energy Agency (IEA), United Nations Statistics Division (UNSD) and World Development Indicators (WDI) data

84
Tracking SDG7: The Energy Progress Report 2018
The decrease in total primary energy intensity means that in 2015, each unit of energy produced nearly 1.5 times more gross domestic product (GDP) than in 1990
Cumulative energy savings from intensity improvements since 2010 are large enough to meet India’s energy needs in 2015
FIGURE 5.4 • Trends in underling components of primary energy intensity at a global level, 1990-2015 (Index, 1990=100)
50
100
150
200
250
1990
1991
1992
1993
1994
1995
1996
1997
1998
1999
2000
2001
2002
2003
2004
2005
2006
2007
2008
2009
2010
2011
2012
2013
2014
2015
GDPTotal Primary Energy SupplyPrimary Energy Intensity
Source: International Energy Agency (IEA), United Nations Statistics Division (UNSD) and World Development Indicators (WDI) data
FIGURE 5.5 • Final energy consumption with and without energy savings from intensity improvements
335
345
355
365
Actual energy consumption Consumption without energy intensity savings
2010 2011 2012 2013 2014 2015
Ener
gy c
onsu
mpt
ion
(EJ)
Source: WHO Global Health Observatory; WDI data

85
Chapter 5 –Energy Efficiency
REGIONS AND INCOME GROUPS
All income groups are making progress in reducing energy intensity, particularly lower-middle income and upper-middle income countries
However, regional progress is uneven, with Western Asia and Northern Africa, in particular, barely having reduced primary energy intensity since 1990
FIGURE 5.6 • Primary energy intensity by income group, as an index (1990=100) for 1990-2015 and in absolute terms for 2015
Low Income High Income Lower-middle IncomeUpper-middle Income
12.9
4.6
5.8 4.9
0.0
2.0
4.0
6.0
8.0
10.0
12.0
14.0
Prim
ary
ener
gy in
tens
ity(in
com
e gr
oup)
in 2
015
Global Average: 5.3
1990
1991
1992
1993
1994
1995
1996
1997
1998
1999
2000
2001
2002
2003
2004
2005
2006
2007
2008
2009
2010
2011
2012
2013
2014
2015
50
60
70
80
90
100
110
120
Source: International Energy Agency (IEA), United Nations Statistics Division (UNSD) and World Development Indicators (WDI) data
FIGURE 5.7 • Primary energy intensity at a regional level, as an index (1990=100) for 1990-2015 and in absolute terms for 2015
5.6 5.2
4.7 5.1
7.5
3.9
5.0
0.0
1.0
2.0
3.0
4.0
5.0
6.0
7.0
8.0
Prim
ary
ener
gy in
tens
ity(re
gion
al le
vel)
in 2
015 Global Average: 5.3
1990
1991
1992
1993
1994
1995
1996
1997
1998
1999
2000
2001
2002
2003
2004
2005
2006
2007
2008
2009
2010
2011
2012
2013
2014
2015
50
60
70
80
90
100
110
120
Eastern Asia and South-eastern AsiaCentral Asia and Southern AsiaWestern Asia and Northern Africa
Australia and New ZealandSub-Saharan Africa
Latin America and the CaribbeanNorthern America and Europe
Source: International Energy Agency (IEA), United Nations Statistics Division (UNSD) and World Development Indicators (WDI) data

86
Tracking SDG7: The Energy Progress Report 2018
DEMAND-SIDE EFFICIENCY
Energy intensity reductions were driven primarily by industry, which has the largest share in final energy consumption and the fastest rate of improvement among all end-use sectors
High income and upper-middle income countries account for more than three quarters of energy savings
FIGURE 5.8 • Breakdown of total final energy consumption by sector, 2015; and compound annual growth rate of energy intensity by sector, 2010-2015
-2.7
-2.2
-2.1
-1.4
-1.2
-0.6
-3.0% -2.5% -2.0% -1.5% -1.0% -0.5% 0.0%
Industry
Residential
Services
Agriculture
PassengertransportFreighttransport
Compound Annual Growth Rate (%, 2010-15)
Industry32%
Transport32%
Residential24%
Services9%
Agriculture3%
Source: International Energy Agency (IEA), United Nations Statistics Division (UNSD) and World Development Indicators (WDI) data
FIGURE 5.9 • Breakdown of total final energy consumption by income group, 2015; and compound annual growth rate of energy intensity by income group, 2010-2015
2.1%
2.5%
2.9%
2.5%
-3.0% -2.5% -2.0% -1.5% -1.0% -0.5% 0.0%
HIgh Income
Upper MiddleIncome
Lower MIddleIncome
Low Income
High Income41%
Low Income2%
LowerMiddleIncome
19%
UpperMiddleIncome
39%
Source: International Energy Agency (IEA), United Nations Statistics Division (UNSD) and World Development Indicators (WDI) data
87
Chapter 5 –Energy Efficiency
SUPPLY-SIDE EFFICIENCY
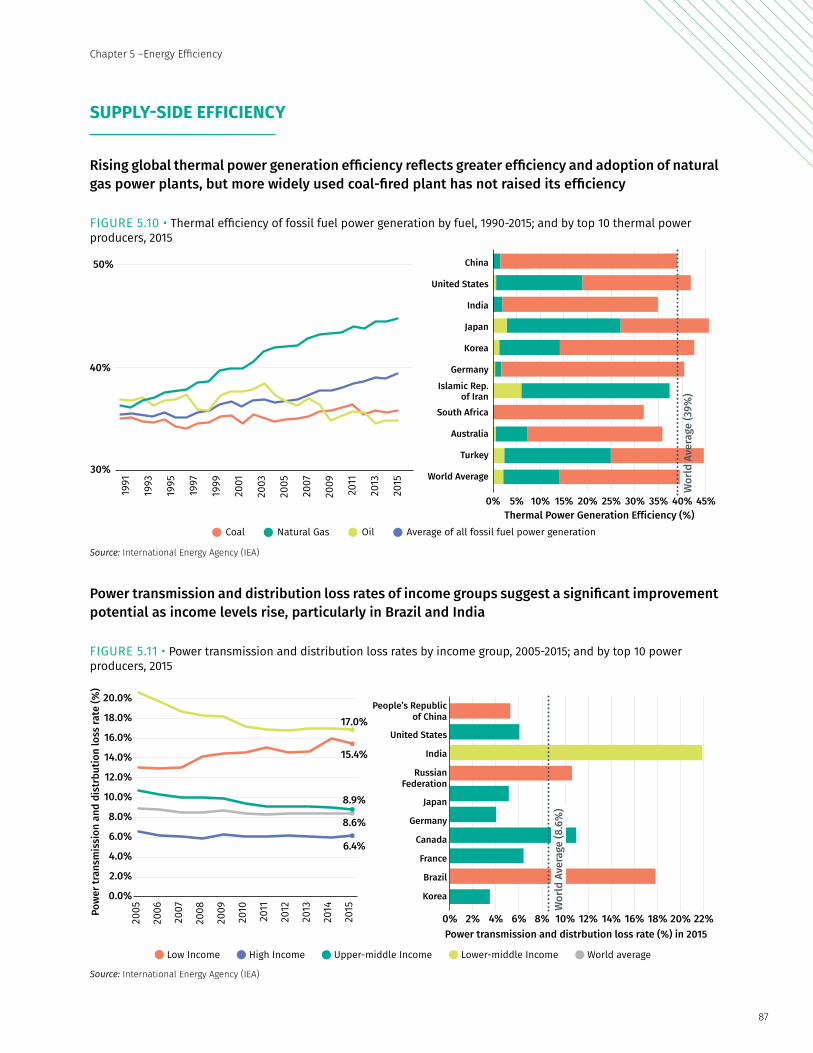
Rising global thermal power generation efficiency reflects greater efficiency and adoption of natural gas power plants, but more widely used coal-fired plant has not raised its efficiency
Power transmission and distribution loss rates of income groups suggest a significant improvement potential as income levels rise, particularly in Brazil and India
FIGURE 5.10 • Thermal efficiency of fossil fuel power generation by fuel, 1990-2015; and by top 10 thermal power producers, 2015
Coal Average of all fossil fuel power generationNatural Gas Oil
30%
40%
50%
1991
1993
1995
1997
1999
2001
2003
2005
2007
2009
2011
2013
2015
China
United States
India
Korea
Japan
Germany
Islamic Rep.of Iran
South Africa
Turkey
World Average
Australia
0% 5% 10% 15% 20% 25% 30% 35% 40% 45%Thermal Power Generation Efficiency (%)
Wor
ld A
vera
ge (3
9%)
Source: International Energy Agency (IEA)
FIGURE 5.11 • Power transmission and distribution loss rates by income group, 2005-2015; and by top 10 power producers, 2015
People’s Republicof China
United States
India
Japan
RussianFederation
Germany
Canada
France
Korea
Brazil
0% 2% 4% 6% 8% 10% 12% 14% 16% 18% 20% 22%Power transmission and distrbution loss rate (%) in 2015
Wor
ld A
vera
ge (8
.6%
)
0.0%
18.0%
8.0%
16.0%
14.0%
12.0%
10.0%
6.0%
4.0%
2.0%
20.0%
2006
2005
2007
2008
2009
2010
2011
2012
2014
2013
2015Po
wer
tran
smis
sion
and
dis
trbu
tion
loss
rate
(%)
17.0%
15.4%
8.9%
8.6%
6.4%
Low Income High Income Lower-middle Income World averageUpper-middle Income
Source: International Energy Agency (IEA)

88
Tracking SDG7: The Energy Progress Report 2018
COUNTRY TRENDS
Eight of the world’s largest energy users reduced their energy intensity more rapidly than the world as a whole
FIGURE 5.12 • Top 20 energy supply countries’ compound annual growth rate of energy intensity, 2010-2015, and primary energy intensity, 2015, with bubbles scaled to energy supply
Compound Annual Growth Rate (%, 2010-15)
China
United States of America
IndiaRussian Federation
Japan Germany
Brazil
Republic of Korea
Canada
France
Iran
Indonesia
Saudia Arabia
Mexico
United Kingdom Italy
South Africa
NigeriaThailand
Turkey
0
1
2
3
4
5
6
7
8
9
-5% -4% -3% -2% -1% 0% 1% 2% 3% 4%
Prim
ary
Ener
gy In
tens
ity (M
J/20
11 U
S$PP
P, 2
015)
World Average (5.3 MJ/2011 US$PPP)
Glob
al A
vera
ge: (
-2.2
%)
-
Lower middle incomeLow income
High incomeUpper middle income
Source: International Energy Agency (IEA), United Nations Statistics Division (UNSD) and World Development Indicators (WDI) data
89
Chapter 5 –Energy Efficiency
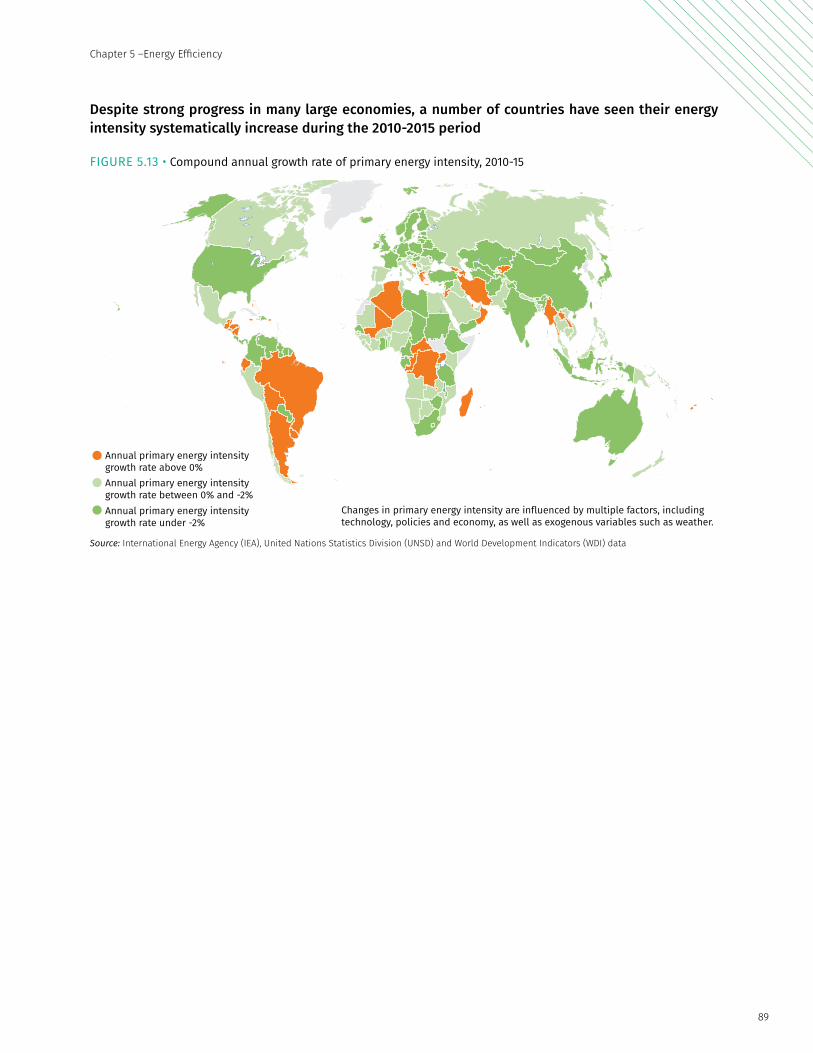
Despite strong progress in many large economies, a number of countries have seen their energy intensity systematically increase during the 2010-2015 period
FIGURE 5.13 • Compound annual growth rate of primary energy intensity, 2010-15
Annual primary energy intensitygrowth rate above 0%Annual primary energy intensitygrowth rate between 0% and -2%Annual primary energy intensitygrowth rate under -2%
Changes in primary energy intensity are influenced by multiple factors, including technology, policies and economy, as well as exogenous variables such as weather.
Source: International Energy Agency (IEA), United Nations Statistics Division (UNSD) and World Development Indicators (WDI) data
90
Tracking SDG7: The Energy Progress Report 2018
POLICY IMPLICATIONS
1 IEA World Energy Statistics and Balances 2017 (database)2 IEA Energy Efficiency 2017, adapted from World Energy Statistics and Balances 2017 and CO2 Emissions from Fuel Combustion (databases)
Energy efficiency is imperative to sustainable development – it can narrow energy access gaps, minimize growing energy demands, improve service levels, and lower costs for all sectors of the economy.
The Sustainable Development Goal 7.3 target of doubling the global rate of improvement in energy efficiency by 2030 is tracked through improvements in energy intensity. Reducing energy supply relative to GDP growth decreases energy intensity and creates significant economic, environmental, and social benefits. Energy intensity is the direct inverse of energy productivity. A reduction in energy intensity is directly correlated with an increase in energy productivity, meaning that more economic output is achieved for every unit of energy consumed. As SDG 7 is currently under review by the United Nations (UN), Policy Brief #1 on ensuring universal access to electricity, and Policy Brief #4 on “Doubling the Global Rate of Improvement in Energy Efficiency” outline priority actions on energy efficiency.
In 2015, the global economy continued its long-term trend of decreasing its primary energy intensity by achieving its highest rate of annual improvement since 1990. This was the first time since the start of the tracking period in 2010, that the SDG7 target rate of improvement (2.6%) was surpassed. Global energy demand decreased by 0.8% while GDP grew over 3%. Continuing this trend through 2030 will remain a challenge given the growing energy demands of many emerging economies. Policymakers can benefit from a wealth of proven policies and available technologies, prioritizing the most impactful sectors in their respective countries.
The impacts of energy intensity improvements cannot be ignored. In terms of economic expenditures, energy intensity improvements between 2000-2015 have avoided over $4 trillion in global spending.1 The global economy produced an additional $40,000 (USD PPP 2011) per MJ of energy in 2015 compared to 2000. Energy intensity improvements have avoided a billion tonnes of greenhouse gas emissions per year since 2014.2
91
Chapter 5 –Energy Efficiency
REGIONAL AND INCOME GROUP VARIATIONS
Since the start of the tracking period in 2010, energy intensity improved each year in all regions other than the Western Asia and Northern Africa region, where a yearly regression occurred on two separate occasions. The GDP growth of most countries in this region is tied heavily to energy intensive oil and gas extraction. The sharp decline in oil and gas prices throughout most of the tracking period partly explains the modest pace of GDP growth relative to energy supply. Despite large increases in energy demand, emerging economies in the Asia and the Pacific and the Africa regions have now surpassed the global rate of improvement in energy intensity, but intensity levels continue to be higher than the world average. High income countries throughout Europe and the Americas are also showing consistent decline in energy intensity during the tracking period, but at a slower rate than low and middle income countries.
The performance of the world’s 20 largest energy supply countries is critical to achieving the SDG7 target. In 2015, these countries accounted for nearly 80% of total primary energy supply worldwide. The pace of energy intensity improvement in eight of the world's twenty largest energy supply countries (referred to as the Top 20) surpassed the world average of 2.2% during the 2010-2015 tracking period. China, the world’s largest energy consumer, led the way with an energy intensity improvement rate of over 4%. Brazil and Iran were the only two top 20 countries that did not improve energy intensity since 2010. According to the World Bank's Regulatory Indicators for Sustainable Energy (RISE) index, top 20 countries score significantly higher than the world average on energy efficiency policies and regulations, which may provide a possible explanation for performance on reducing energy intensity.
BOX 5.1 • TRACKING ENERGY EFFICIENCY
Energy efficiency policy development requires a sound national energy balance, with detailed demand-side data, in order to understand the dynamics of energy-use across various sectors. Energy intensity (energy use per unit of activity) is a key metric used in efficiency analysis and policy development. However, in addition to improvements in energy efficiency, energy intensity is also influenced by other factors, including the electricity generation mix, structure of an economy, the exchange rate, the affordability of energy services, the size of a country, climate and behaviour.
To generate a greater understanding of energy efficiency, data relating energy use to specific activities at a subsector level are required. Examples include lighting energy use per unit of floor area in buildings, or energy use per unit of production in an industry subsector. The availability of data necessary for a more detailed understanding of energy efficiency trends is variable across countries. Therefore, a critical need is to increase the quantity and quality of data necessary for analysis of energy efficiency trends in order to better understand the impact of policy measures and areas where further action is needed. Further information about the development of energy efficiency indicators has been published by the World Bank’s Regulatory Indicators for Sustainable Energy (RISE)index,1 and the International Energy Agency (IEA)2 with training courses also available for policymakers and statisticians.3 1 https://rise.worldbank.org2 https://www.iea.org/publications/freepublications/publication/energy-efficiency-indicators-essentials-for-policy-making.html3 https://edx.iea.org/

92
Tracking SDG7: The Energy Progress Report 2018
BOX 5.2 • INNOVATIVE TRENDS: DIGITALIZATION CAN IMPROVE ACCESS TO ENERGY SERVICES AND ENABLE SYSTEMS EFFICIENCY
Improvements in data collection, analytics and connectivity, which form the fundamental elements of digitalization, are set to have a big impact on energy systems across the buildings, industry and transport sectors. There is however high uncertainty on the potential impacts of digitalization given the speed of technology developments and the extent to which barriers are overcome.
In industry, digital metering, monitoring and process controls are already helping many businesses identify and implement efficiency improvements. Advances in digital technologies such as 3D printing and greater connectivity across supply chains and markets offer further opportunities for efficiency gains. In the transport sector, vehicle automation and shared mobility services could revolutionise how people and goods are moved, but the energy implications are unclear, with energy consumption having the potential to increase or decrease substantially, depending on the how these technologies are used. In buildings, digitalization is bringing new energy services to consumers, such as smart thermostats, occupancy sensors, remote control and enhanced safety features. IEA modelling estimates that these advances have the potential to cut global buildings energy use by 10% by 2040. However, digitalization also comes with an energy cost, in particular the greater use of standby power by connected devices, which could offset much of the potential savings.
Source: IEA (2017), Digitalization and Energy, IEA/OECD, Paris, www.iea.org/digital
FIGURE 5.15. • Digitalization’s potential impact on transport, buildings, and industry
BuildingsTransport Industry
Mag
nitu
de o
f oot
entia
l cha
nge
to e
nerg
y de
man
d
Barriers to digitalization
Low
High
Low High
Smart thermostats
Occupancysensors
Daylighting sensors
Big data in aviation
Unmanned shipping
Mobility as a service
Autonomous cars/trucks
Beyond the plant fence
Additive manufacturing
Accelerating innovation in industryOptimised process control
Industrial automation
Drone delivery
User programming
Remote control
Source: IEA (2017), Digitalization and Energy, IEA/OECD, Paris, www.iea.org/digital
93
Chapter 5 –Energy Efficiency
An important emerging trend to note is that some developed countries seem to have reached a peak in total primary energy supply, and have even experienced reductions on a yearly basis. Traditionally, reductions in energy supply have occurred only in conjunction with lower output in large economies, for example during economic recessions. Thanks in part to energy efficiency improvements, six of the top 20 energy supply countries – France, Germany, Italy, Japan, the UK and the US – managed to reduce annual energy supply and still continue to grow GDP steadily. It should be noted that all six are high income countries that are not experiencing the same kind of rapid economic growth as emerging economies in the top 20 group such as China, India, Indonesia, and South Africa. Evidently, reducing energy supply should not be the prescribed universal goal to meet the SDG7 target. Rather, improving energy intensity will enable countries to increase the productivity of each unit of energy used.
DEMAND-SIDE EFFICIENCY
Analyzing the industry, transport and residential sectors is key to evaluate demand-side efficiency since these sectors account for the majority of the world’s total final energy consumption. While the industry sector continues to consume the most energy, it has also made the most progress towards improved efficiency. Industrial energy intensity improved by 2.7% per year during the 2010-2015 tracking period, accounting for the largest share of energy savings during that period. Upper middle income and high income countries accounted for 39% and 41% of global energy savings respectively, a combined share of 80%. Amongst individual countries, China had the largest contribution, accounting for more than a third (35%) of global energy savings. The United States accounted for 13%, India for 8%, Japan, the Russian Federation and the United Kingdom of Great Britain and Northern Ireland accounted for 3% each. Savings in the industry sector accounted for the largest contribution in all of these countries. In addition to China and India, other emerging economies such as Malaysia, and Vietnam were also among the world’s top 10 highest savings in industrial energy consumption. Efficiency improvements in industry can be attributed to key policy actions and the addition of new and more efficient production technologies in energy-intensive industry processes. Of particular relevance is China’s Top 10,000 Energy-Consuming Enterprises Program, which covers two-thirds of the country’s energy consumption, and focuses primarily on the industrial sector. It imposes a mandatory absolute energy-saving target of 250 million tonnes of coal equivalent (approximately 7,327 TJ) by 2015, as part of China’s 12th Five-Year Plan.
Globally, transport has also improved its energy intensity, but at a slower pace for both passengers and freight. Passenger transport improved its energy intensity by 1.2% per annum in 2010-2015, less than the 1.9% improvement in 2000-2010, while freight transport improved by 0.5% per annum in 2010-2015, less than the 0.8% improvement in 2000-2010. High income and upper middle income countries need to prioritize the transport sector given their growing transport demands, particulary for freight transport. These two income groups are responsible for 90% of transport energy consumption since 2010. Increased freight transport in these advanced economies is an important factor. Although freight transport accounts for 43% of global energy consumption in the transport sector, its share of global emissions from the transport sector is more than 50% and growing (see Box 5.3). This is particularly worrying, considering that only 16% of energy consumption by trucks is covered by fuel economy standards worldwide.

94
Tracking SDG7: The Energy Progress Report 2018
Low and lower middle income economies also showed improvements in industrial and transport energy intensity since 2010, but the residential sector should remain the most pressing priority for the lower income groups. Residential energy intensity increased by 2.4% per annum and 1.8% per annum for low income and lower middle income countries, respectively, in 2010-2015. An increase in housing energy demand due to economic development makes the residential sector the highest energy consuming sector among these countries. Households often cannot afford newer, more efficient appliances and heating/cooling systems, which coupled with poor building design and lack of sufficient insulation, result in poor service levels and high cost for energy. Innovations in the lighting sector that produced affordable, energy efficient lighting products are applicable to all income groups. Similar technology innovations for key household appliances and cooling equipment would address the growing residential energy demands in lower income countries. (see Box 4.4)
BOX 5.3 • THE SUSTAINABILITY OF ROAD FREIGHT TRANSPORT REQUIRES URGENT POLICY ACTION
In 2015, road freight oil demand grew to 17 million barrels per day – a 50% increase since 2000. Over the period between 2010 and 2015, CO2 emissions from road freight transport increased by 17%, driven by strong growth in China and India, and the continued expansion of the heavy-duty vehicle fleet. The amount of goods transported by heavy-duty vehicles increased by 65% and truck sales grew by 60%.
Source: IEA (2017), The Future of Trucks – Implications for Energy and the Environment, IEA/OECD, Paris, https://www.iea.org/publications/freepublications/publication/the-future-of-trucks---implications-for-energy-and-the-environment.html
Despite the large and growing impact of road freight transport, regulatory policy has only recently begun to catch up. While more than 55% of energy consumption by cars was covered by fuel economy standards in 2016, only 16% of consumption by trucks was covered, with standards limited to Canada, China, Japan and the United States, and under development in the European Union, India, Korea, Mexico, and Saudi Arabia. Other policy approaches are available and are having significant impacts in some jurisdictions. Non-regulatory measures such as road tolls, scrappage programmes and voluntary green freight programmes are in place in many markets. Various member states of the European Union have experimented with these types of measures as well as having the highest fuel taxes in the world. In 2016, trucks in Europe were 14% more efficient per tonne-kilometre than those of the United States and 22% more efficient than those in China.
Sources: IEA (2017), The Future of Trucks – Implications for Energy and the Environment, IEA/OECD, Paris, https://www.iea.org/publications/freepublications/publication/the-future-of-trucks---implications-for-energy-and-the-environment.html
IEA (2017), Energy Efficiency 2017, IEA/OECD, Paris, http://www.iea.org/efficiency/
FIGURE 5.16 • Global road freight transport CO2 emissions
0.0
0.5
1.0
1.5
2.0
2.5
3.0
2010 2015 2010 2015Country/region Vehicle type
Gt CO2
Heavy trucksMedium trucksLight commercial
Rest of the WorldMexicoRussian FederationASEANAfricaChinaIndiaEuropean UnionUnited States

95
Chapter 5 –Energy Efficiency
BOX 5.4 • BUILDING ENERGY USE IN THE 21ST CENTURY: SPACE HEATING IS THE LARGEST BUILDING END-USE BUT SPACE COOLING IS GROWING THE FASTEST
Final energy consumption in buildings continues to grow, with all buildings end-uses increasing since 2000. Space heating, cooking and water heating are the largest buildings end-uses, however they have risen relatively slowly, with less than 25% growth since 2000. Space cooling, lighting and appliances grew the fastest, with each increasing by more than 45% since 2000.
Source: IEA (2017), Energy Efficiency 2017, IEA/OECD, Paris, http://www.iea.org/efficiency/
Cooling appears to have peaked in the Global North (cold and temperate countries) in 2010 with a slight decrease in space cooling energy consumption, largely driven by efficiency gains in Japan and the United States. However, globally, cooling continues to be the fastest growing building end-use, owing to growth in the Global South (mostly hot countries), where residential buildings have seen more than 300% growth, driven by increased wealth and comfort demands for cooling.
Residential buildings in the Global South also have the largest growth in appliances energy demand with nearly 170% growth since 2000. Lighting energy consumption growth is largest in non-residential buildings, growing by two-thirds since 2000. Lighting appears to have hit a global tipping point in 2015, with higher efficiency lighting enabling growing energy service demand to be met by flat or even decreasing energy consumption for the first time.
Source: IEA (2017), Energy Efficiency 2017, IEA/OECD, Paris, http://www.iea.org/efficiency/
FIGURE 5.17 • Trends in global buildings final energy by end-use
0
10
20
30
40
50
2000 2004 2008 2012 2016
Global buildings final energy consumption (EJ)
Space heating Space cooling Water heating Lighting Cooking Appliances and other
0
10
20
30
40
50
60
70
2000 2004 2008 2012 2016
Growth in global buildings final energy since 2000

96
Tracking SDG7: The Energy Progress Report 2018
SUPPLY-SIDE EFFICIENCY
Although the growth of clean renewable power generation has been significant in recent years, thermal power generation with fossil fuels still maintains a majority share in the electricity sector throughout the world. Natural gas is the only source that improved thermal power efficiency considerably since 2010, while coal and oil power efficiency remain stagnant. On a global level, despite the improvement of natural gas efficiency to surpass 45% as of 2015, thermal power efficiency remains below 39% on average worldwide. Coal still accounts for the vast majority of thermal power generation in many large energy consumers such as China, India, Korea, Germany, South Africa and Australia. Among the top 20 countries, half of them had thermal power efficiencies below the world average of 39% in 2015. Thermal efficiency trends clearly dictate that natural gas-powered options should be prioritized over coal-powered or oil-powered options as a long-term investment when thermal generation is necessary.
Losses in natural gas transmission and distribution have maintained a consistent declining trend since 1990. From 2012-2015, however, losses increased slightly. This reversal seems to be caused by loss increases in Malaysia, Pakistan and the Russian Federation, which together account for nearly two-thirds of global losses during this period. In 2015, average global electricity transmission and distribution (T&D) losses stayed relatively constant at 8.6%. This amounted to nearly 2,000 terawatt-hours (TWh) of electricity, equivalent to the entire electricity consumption of India and Japan combined. Although this remains a large amount, it is encouraging not to see any increase in T&D losses given the large amount of renewable energy generation capacity additions during the tracking period, which can put heavy strains on grid operations. The quality of grid infrastructure needs to keep up with the complex demands of new capacity additions. It is not surprising that loss rates remain correlated to income levels. Losses in high income countries have been consistently below the world average and have exhibited an overall downward trend, while those of upper middle income countries have been rapidly declining towards the world average. Lower middle income countries improved the most, reducing losses to 17% in 2015 from above 20% before 2005. Low income countries were the only group that showed an upward trend in T&D loss rate, jumping to 15.4% in 2015 from below 14% before 2005. As low income countries add generation capacity to meet growing energy demands, grid infrastructure needs to be upgraded concurrently to avoid further increases in losses.
CONCLUSIONS
Sustainable Development Goal 7.3 is crucial to the sustainable energy agenda. Energy efficiency will continue to address critical issues in the production, delivery, and consumption of energy for all income levels and geographical constraints. Tracking energy intensity toward the SDG7 target has revealed important priorities for policymakers to focus on. Transport energy intensity needs to improve, especially in high income and upper middle income countries. The residential sector is regressing in energy efficiency, particularly in developing countries with growing heating and cooling needs. On the supply side, the transition to more efficient and clean energy sources, such as renewables and natural gas, is not scaling up fast enough to keep up with 2030 target projections
97
Chapter 5 –Energy Efficiency
REFERENCES
IEA (International Energy Agency). 2017a. Digitalization and Energy 2017. Paris: Organisation for Economic Co-operation and Development and IEA.
———. 2017b. The Future of Trucks: Implications for Energy and the Environment, Second Edition. Paris: Organisation for Economic Co-operation and Development and IEA.
———. 2017c. Energy Technology Perspectives 2017: Catalysing Energy Technology Transformations. Paris: Organisation for Economic Co-operation and Development and IEA.
World Bank. 2016. Regulatory Indicators for Sustainable Energy (RISE) 2016. World Bank Group.


