2011 trends in global energy efficiency
DESCRIPTION
Trends in Global Energy EfficiencyTRANSCRIPT

Trends in global energy efficiency 2011An analysis of industry and utilities
Researched and written by Enerdata and the Economist Intelligence Unit

Contents
Introduction Raising awareness about energy efficiency 2
Part I – The frugal manufacturer: Using energy sparingly (researched and written by the Economist Intelligence Unit)
Introduction 4 About the research 6 Executive summary 7 A critical role for energy efficiency 8 Industry’s weak commitment to improvement 10 Regulatory issues set the agenda 14
Part II – Overview of energy efficiency in industry and utilities (researched and written by Enerdata)
Introduction 20 Global report 22 Country reports China 34 United States 40 India 46 Russia 52 Japan 58 Germany 64 Canada 70 France 76 Brazil 82 South Korea 88 United Kingdom 94 Indonesia 100 Mexico 106 Saudi Arabia 112 Italy 116 South Africa 122 Australia 128 Turkey 134 Argentina 140
Annex
Survey details 146 Abbreviations 151 Sources and methodology 152

2 Introduction | Trends in global energy efficiency 2011
IntroductionRaising awareness about energy efficiency
Using energy more efficiently brings benefits on several fronts: it makes the energy go further, curbs emissions of carbon dioxide and saves money. The International Energy Agency estimates that energy efficiency measures can deliver half of the cuts in emissions that are needed over the next 25 years to slow global warming, compared with a business-as-usual scenario.
Industrial companies and power utilities are among the biggest users of energy and are therefore among the most sensitive to the need to be more efficient. In no other area are so few players capable of making such a big difference. In spite of this, practice shows that it can be difficult even for energy-intensive businesses to capture the opportunities, with a lack of information, expertise and funds being common barriers to faster deployment of energy-efficient technologies.
This new publication, sponsored by ABB, is a contribution to raising awareness about the importance of using energy more efficiently and the opportunities that exist for industry and power utilities.

Trends in global energy efficiency 2011 | Introduction 3
The report is divided into two parts. The first measures and analyzes the attitudes and ambitions of businesses around the world in relation to using energy more efficiently. It is designed and produced by the Economist Intelligence Unit, which pro-vides independent research and analysis, based on a global survey of executives and on related interviews.
The second part of the report is an overview of energy efficien-cy in industry and utilities globally, with in-depth reviews of 19 countries that collectively account for about three-quarters of the world’s energy consumption. This section is researched
and written by Enerdata, an independent information and consulting company specialized in the global energy industry and carbon market. The data is from a large variety of public sources, and comes together here in the most comprehensive overview of energy efficiency in industry and utilities that is publicly available.

4 Part I | Trends in global energy efficiency 2011
Part IThe frugal manufacturer: Using energy sparingly

Trends in global energy efficiency 2011 | Part I 5
As the world leaves a long era of energy abundance and enters an era of constraint, many complex challenges face government, business and society. Among these is resolving the conflict between raising living standards in developing regions by continuing to expand industrial production, and lessening the negative environmental impacts of industrial manufacturing activities across the world.
One of the approaches to addressing this challenge is to improve energy efficiency in the core of industry’s production processes.
The frugal manufacturer: Using energy sparingly is a report researched and written by the Economist Intelligence Unit, which discusses how companies can promote long-term financial growth by managing energy efficiency in their manu-facturing processes. The research was commissioned by ABB. The Economist Intelligence Unit bears sole responsibility for the content of this report. The findings and views expressed in the report do not necessarily reflect the views of the sponsor. Christopher Watts was the author of the report, and Aviva Freudmann was the editor.
April 2011

6 Part I | Trends in global energy efficiency 2011
About the research
About the researchIn January-February 2011, the Economist Intelligence Unit surveyed 348 senior executives, mostly in North America, Asia-Pacific, and Western Europe, on their plans to invest in improving energy efficiency in production processes, the issues they face as they consider these investments, and the factors that are likely to influence industrial energy efficiency in the coming years. This white paper is based on the results of that survey, as well as on a program of in-depth interviews and desk research on the topic of industrial energy efficiency. In addition, this study is based on a separate comprehensive analysis of the worldwide energy consumption patterns of seven energy-intensive industries, carried out by Enerdata.
More than two-thirds of respondents to our survey are execu-tives at director level. Respondents are most likely to have responsibility for strategy and business development, finance, general management, and operations and production. Around 58 percent are from businesses with $500 million or more in global annual revenues. The survey focuses entirely on the manufacturing and power sectors, with manufacturing having the strongest representation.
In addition to the online survey, the Economist Intelligence Unit conducted 15 in-depth interviews with senior business execu-tives, policy makers, and other experts in industrial energy efficiency. The insights from these interviews appear through-out the report. The Economist Intelligence Unit would like to thank all survey respondents, as well as the following execu-tives (listed alphabetically by organization name) who partici-pated in the interview program:
– Steve Schultz, Global Manager of Corporate Energy, 3M, US
– R. Neal Elliott, Associate Director for Research, American Council for an Energy-Efficient Economy, US
– Satish Agarwal, Chief, Corporate Manufacturing, Apollo Tyres, India
– Zheng Daqing, Senior Vice President, BASF Group, and country board member, BASF Greater China, China
– Wan Xiaotao, Sustainable Development Coordinator, Bayer China, China
– Hans-Joachim Leimkühler, Director, Process Design, Bayer Technology Services, Germany
– Ajay Mathur, Director General, Bureau of Energy Efficiency, India
– Luis Farías, Senior Vice President for Energy and Climate Change, CEMEX, Mexico
– Doug May, Vice President Energy and Climate Change, The Dow Chemical Company, US
– Terry McCallion, Director, Energy Efficiency and Climate Change, European Bank for Reconstruction and Development, UK
– Ian Gilmour, Safety, Health and Environment and Manufacturing Manager, Orica, Australia
– Len Sauers, Vice President of Sustainability, Procter & Gamble, US
– Andreas Genz, Senior Vice President, Energy Services, Stora Enso, Finland
– L. Rajasekar, Executive President, UltraTech Cement, India
– Pradeep Monga, Director, Energy and Climate Change, United Nations Industrial Development Organization, Austria

Trends in global energy efficiency 2011 | Part I 7
Executive summaryIndustry accounts for around one-third of the world’s final energy demand; around 60 percent of this industrial demand is from developing countries. Industry’s total energy use contin-ues to grow as a result of expanding production volumes, a trend that is likely to continue in the coming decades as living standards rise in developing regions. Meanwhile, energy use by industry is in many parts of the world less than fully efficient, and in some parts of industry leaves much room for improvement.
Against this background, businesses are facing a future of constraints, including restricted access to energy, and curbs on carbon dioxide emissions. As such, improving industrial energy efficiency is no longer optional—but a clear pre-requi-site for long-term financial growth. Those companies that do not address industrial energy efficiency are likely to find that their long-term financial performance will be negatively affect-ed; meanwhile, those firms that seek continuous improvement in energy efficiency are likely to steal a march over competitors.
This white paper is based on three streams of research: an online survey of 348 senior executives; 15 in-depth interviews with corporate executives, policy makers, and other experts, complemented by extensive desk research; and an analysis of worldwide industrial energy consumption patterns compiled by Enerdata. These provide a backdrop to the discussion of overall trends in industrial energy efficiency, including the drivers behind companies’ efforts to improve energy efficiency; the ways executives are overcoming the obstacles they face along the way; and the long-term outlook for energy efficiency in industry.
Here are the main findings of the research:
Industry executives say improvements in energy efficiency will be critical to their businesses. In all, 88 percent of manu-facturers say industrial energy efficiency will be a critical suc-cess factor for their business in the coming two decades. The reasons are largely related to cost competitiveness, especially for companies in energy-intensive manufacturing sectors. Efforts to improve energy efficiency may also foster innovation, as well as leading to numerous other benefits.
Above all, companies look for financial returns from their investments in energy efficiency. Sub-optimal efficiency practices are widespread across industry; the potential for saving through improvement in energy efficiency is large. In making the financial and business case for investments in efficiency, the price of energy is one of the biggest factors, cited by 59 percent of survey respondents.
Although companies see energy efficiency as critical to their businesses, only a minority actually take action to improve efficiency. In our sample, only 40 percent say they have invested in capital, plant and equipment within the past three years to improve energy efficiency. Among less energy-intensive manufacturers, only 34 percent have done so. Only half of firms in our sample have energy management systems in place; just one-third (34 percent) have undertaken a compa-ny-wide energy audit; and fewer than half (48 percent) regularly report progress in improving industrial energy efficiency.
This gap between awareness and action is caused largely by lack of information. Asked to name the barriers impeding investments, 42 percent of executives cite a lack of a clear-cut financial case. In part, this is due to lack of information about energy efficiency options, which 27 percent name as a barrier, and lack of information on benchmark efficiency levels for their industry. Twenty-seven percent of executives name lack of funds as a barrier to investment.
Leading firms are overcoming some of these obstacles, however. Companies and policy makers are adopting simple measures to overcome these barriers. These include careful timing of efficiency improvements to minimize the negative financial impact of plant downtime, and piloting programs in small business zones. In the absence of reliable sector-based energy efficiency benchmarks, some companies are measuring energy efficiency against past performance, or against optimal performance.
New regulations will intensify pressure on companies to improve energy efficiency. Voluntary energy efficiency pro-grams are increasingly being joined by regulatory mandates, for example in India, where the country’s first binding industrial energy efficiency regulations came into effect on April 1, 2011. Increasingly, industrial energy efficiency regulation will be linked to wider sustainability commitments. Accordingly, 73 percent of executives expect to increase expenditure on energy effi-ciency in the coming three years.
Improvements will come from existing technologies—and from process innovations. There is plenty of scope for energy efficiency improvements using existing technologies. In time, advances in process technology will improve efficiency. Survey results indicate that government incentives for investment in energy efficiency are less widespread in developing countries (44 percent) than in developed markets (55 percent); and that more executives in developing markets (38 percent) expect taxpayers to shoulder the cost than in developed markets (27 percent). Ultimately, though, most investments in energy efficiency pay their own way.
Executive summary

8 Part I | Trends in global energy efficiency 2011
1. A critical role for energy efficiency“In our Indian operations, around 50-55 percent of the direct costs to convert raw materials into finished goods is energy,” says Satish Agarwal, Chief of Corporate Manufacturing at Apollo Tyres, based in Gurgaon in northern India. That’s one of the reasons why, in the past three years or so, Apollo Tyres has invested some $12 million in energy efficiency improvements to its plants, including the installation of heat exchange devices for its boilers, flash steam systems to capture and use process heat, and insulation materials to reduce heat loss. These latest investments are part of an ongoing initiative that has so far led to a 40 percent reduction in the firm’s energy intensity.
Against a background of intensifying competition, rising energy prices, and closer regulatory scrutiny, Agarwal is not alone in understanding the extent to which energy efficiency is a critical success factor in industry. Indeed, among manufacturing sector managers that responded to our survey, 72 percent “agree strongly” or “agree somewhat” that energy efficiency is a critical success factor for manufacturers today. Looking forward over the next two decades, 88 percent of respondents expect energy efficiency to be a critical factor in manufacturers’ profitability.
Variations in these results highlight the diverse backgrounds of companies represented in the survey. For example, among companies in particularly energy-intensive manufacturing segments, such as iron and steel, chemicals and petrochemi-cals, cement, pulp and paper, and aluminum, 82 percent of executives agree that industrial energy efficiency is a critical
factor in their profitability today (versus 67 percent in less energy-intensive activities). This apparent sharper awareness of the role of energy efficiency perhaps reflects characteristics of energy-intensive segments that include high energy costs as a proportion of total costs; recent energy price volatility and price increases; and relatively thin profit margins (Figure 1).
Seen from a regional viewpoint, executives in developing countries are more likely to agree that energy efficiency is a critical success factor for manufacturers (82 percent) than in developed countries (67 percent). “We believe that, in develop-ing countries, one of the reasons they are more aware of ener-gy efficiency is that energy is a scarce resource,” says Pradeep Monga, Director of Energy and Climate Change at the United Nations Industrial Development Organization (UNIDO). Indeed, the survey findings appear to confirm a greater appreciation of energy efficiency in those economies that use most energy (see box: Emerging markets in the energy spotlight).
Why are improvements in energy efficiency critical for long-term profitability? For a start, because of the significant cost savings they bring. Doug May, Vice President of Energy and Climate Change at The Dow Chemical Company in the US, says that his firm’s energy efficiency efforts since 1994 have contributed total cost savings of some $9.4 billion. “Energy efficiency is a gift that keeps on giving,” he says.
The “co-benefits” of improving efficiencyCost savings are one thing. In fact, behind headline figures such as Dow’s, there are further advantages of improving
Over the next two decades, energy efficiency will bea critical factor in manufacturers’ profitability
The argument for energy efficiency investmentsmust be made on a case by case basis
Industries need clearer benchmarks for whatconstitutes energy efficiency in their sectors
Taxpayers should bear more of the cost ofcompanies’ energy efficiency compliance
Energy efficiency is already a critical success factor for manufacturers
Neither agree nor disagree Disagree somewhatAgree strongly Agree somewhat Disagree strongly Don’t know
53% 34% 9%
33% 39% 19% 6%
37% 40%
37%
11% 20% 16% 22% 28% 2%
40% 11% 8%
1%
12% 8%
0 10 20 30 40 50 60 70 80 90 100
2%
1%
1%
1%
2%
3%
2%
1%
Figure 1: To what extent do you agree or disagree with the following statements? Please select one in each row.
A critical role for energy efficiency

Trends in global energy efficiency 2011 | Part I 9
industrial energy efficiency that contribute to long-term finan-cial performance. For example, using less energy in production processes means companies can face relatively higher energy prices without feeling the pinch—a clear competitive advan-tage. “[Improving] energy productivity is one of the best risk management approaches that a manufacturing company can undertake in the current market place,” comments Neal Elliott, Associate Director for Research at the American Council for an Energy-Efficient Economy (ACEEE). Luis Farías, Vice President of Energy and Climate Change at Mexican cement producer CEMEX, agrees: “Energy is a large cost component in cement,” he says. “So energy efficiency gives us more predictability in our future earnings and cash flows.”
Box: Emerging markets in the energy spotlight
Over the past several decades, developed countries have seen an ongoing structural shift in their econo-mies—from manufacturing to services. These days, the services sector in most developed economies is signifi-cantly larger than the manufacturing sector, and is grow-ing faster, too. Of course, the services sector uses significantly less energy per unit of economic output than the manufacturing sector—so when it comes to energy intensity, developed economies are becoming less energy-intensive.
Today, developing countries dominate global industrial energy use, for a number of reasons. First, the econo-mies in developing countries have shifted from agricul-ture to manufacturing in recent years. Second, recent economic development has increased demand for infrastructure and buildings, which in turn require large amounts of cement, steel and other energy-intensive materials. And third, developing countries comprise about 80 percent of the world’s population.
These basic trends are reflected in economic growth and industrial energy demand statistics from the International Energy Agency (IEA). Between 1990 and 2008 the UK economy grew a total 54 percent (as measured by total GDP), according to IEA data, while industrial energy use fell 7 percent; in the US, economic growth in that time-frame was 66 percent in total, with energy use growing 4 percent. Meanwhile, in India, GDP growth in the period 1990-2008 amounted to some 205 percent, while ener-gy use in industry accelerated 63 percent. And while the Chinese economy expanded a total 485 percent between 1990 and 2008, its industrial energy use rose 172 percent.
Besides advantages such as these, efforts to improve the energy efficiency of industrial production processes are often associated with further benefits, say experts. These include lower plant downtime and longer maintenance cycles; improved productivity; better product quality; compliance with building and environmental codes; employee health and safety; or benefits around research and innovation. These so-called “co-benefits” are not to be sniffed at, according to Elliott: “We typically see non-energy savings benefits being three to five times the value of energy savings,” he says.
Despite an appreciation of the critical contribution of energy efficiency to long-term profitability among industry executives, relatively low energy efficiency appears to remain the norm in production processes across large sections of industry. In some cases, this is down to inefficient operation of plant and equipment—in its simplest form, leaving motors running con-tinuously, whether they are in use or not. In other cases, it’s down to inefficient equipment. Terry McCallion, Director of Energy Efficiency and Climate Change at the European Bank for Reconstruction and Development (EBRD) in London, puts it simply: “In some areas of industry, it seems like pumps and motors have got two modes: On, and Off.” Industry experts estimate around two-thirds of global industrial electricity is consumed by electric motors. And yet, market penetration of medium-voltage variable-speed drives—which improve the efficiency of industrial motors by as much as 40-60 percent by regulating their speed—was as low as 13 percent in Europe in 2009, according to estimates from market research firm Frost & Sullivan.
It’s little wonder, therefore, that the scope for energy savings in industry is so great. According to analysis from UNIDO, the potential for energy savings in production processes is as high as 50 percent of current demand in some industry sectors (see box: Where are the potential savings?). In all, realizing these potential energy efficiencies would lead to estimated cost savings of $230-260 billion a year. That’s equivalent to cutting total production costs by around 3-4 percent, according to UNIDO.
The search for financial returnNot surprisingly, given the potential for energy-related cost savings, executives interviewed for this report mostly say first and foremost that they are looking for a demonstrable financial return on any investment they make in improving energy effi-ciency. Typically, industry executives measure this return on the basis of simple payback period (investment cost divided by annual savings), or internal rate of return. For example, in March 2011, Indian cement producer UltraTech Cement placed an order for $90 million-worth of waste heat recovery systems; L. Rajasekar, Executive President at the firm, expects these will

10 Part I | Trends in global energy efficiency 2011
have fully covered their costs after some 6-8 years. In many cases, though, the payback period on investments in energy efficiency is as short as six months.
As industry executives weigh up the financial case for invest-ments in improving energy efficiency, several significant exter-nal factors come into play. One is energy prices. Experts reck-on that the higher the proportion of energy costs in total production costs, the more financially compelling the invest-ments in improving energy efficiency can be. When asked to name the main factors influencing decisions about efficiency investments, 59 percent of respondents cite the price of ener-gy. Among energy-intensive manufacturers, the figure is 67 percent; among less energy-intensive manufacturers, it’s 57 percent (Figure 2).
The investments made by Apollo Tyres are a case in point. As Ajay Mathur, Director General of the Bureau of Energy Efficien-cy (BEE), a Government of India body, further points out: “For industry in India, the delivered cost of energy is very high. And as far as India is concerned, the energy pressures will only increase. So for those industries for which energy is an essen-tial and a large part of their costs, managing energy becomes amazingly important for their competitiveness.” Price volatility and long-term price trends, as much as current prices, are a factor in industrial companies’ investment considerations. “The immediate price spikes cause concern,” says Steve Schultz, Global Manager of Corporate Energy at US industrial and consumer goods maker 3M. “But the fact that the price trend is
upward, and has been upward, helps solidify some of that action.”
Besides energy prices, other factors that survey respondents say influence their decisions to invest in energy efficiency improvements include national energy legislation, cited by 27 percent of executives. Some of these policies focus directly or indirectly on industrial energy use. And another factor that influences decisions about investments in energy efficiency is a wish to improve the company’s image, cited by 26 percent of executives. This factor appears to be increasingly important as sustainability issues rise in prominence.
Many of these factors vary from continent to continent; from region to region; and from plant to plant—explaining why 76 percent of survey respondents say investments in improving energy efficiency must be judged on a case-by-case basis. Andreas Genz, Senior Vice President of Energy Services for Finnish pulp and paper firm Stora Enso, is one executive who agrees. “Our machines all look the same, but they are tailor-made,” he says. “So you have to define tailor-made measures to improve energy efficiency, too.”
2. Industry’s weak commitment to improvementWhile most industry managers appear to appreciate the impor-tance of energy efficiency in securing long-term financial per-formance, it appears that relatively few are practicing the discipline of continuous improvement in energy efficiency. Only 40 percent say they have invested in capital, plant and equip-
Cost-benefit analysis of each investment, including break-even analysis
The price of energy
National energy legislation and regulations
A wish to improve the company’simage as environmentally concerned
Corporate best practice in my industry
Pressure from customers and/or shareholders to reduce costs
A wish to foster innovation in manufacturing processes
Expectation of tighter regulationsgoverning energy use and/or carbon emissions
Local energy legislation and regulations
Pressure from non-governmentorganizations and/or energy activists
Other, please specify
0 10 20 30 40 50 60 70 80 90 100
59%
58%
27%
26%
21%
20%
19%
11%
11%
7%
2%
Figure 2: What are the main factors that will influence your company’s investment in industrial energy efficiency over the next three years, in your
view? Select up to three.
Industry’s weak commitment to improvement

Trends in global energy efficiency 2011 | Part I 11
ment within the past three years to improve energy efficiency. These are more likely to be in developing economies, where 49 percent have invested in equipment to improve energy efficien-cy, than in developed regions, where just 34 percent have done so. North America trails clearly in this respect, with only 21 percent of respondents saying their firms have invested in equipment over the past three years to improve energy efficiency.
Box: Where are the potential savings?
In a November 2010 working paper, Global Energy Efficiency Benchmarking – An Energy Policy Tool, the United Nations Industrial Development Organization (UNIDO) estimates the current energy saving potential in manufacturing industry and petroleum refineries to be some 23-26 percent of current total industrial energy demand worldwide.
While the energy efficiency potential in developed coun-tries amounts to approximately 15-20 percent, the potential in developing countries is higher at around 30-35 percent. Industrialized countries have the poten-tial to save $65 billion or more in energy costs, according to the report. Developing countries have the potential to save $165 billion or more.
Worldwide, the largest potential savings in absolute terms are in the energy-intensive sectors, such as met-als, paper, cement, and chemicals. That said, the largest potential savings in percentage terms are in less energy-intensive sectors. In some, given the prevalence of small plants equipped with old technology, savings potential is as high as 40-50 percent.
Looking beyond investments in plant and equipment, at indus-trial companies’ energy efficiency practices, the situation remains poor—but slightly less so. Forty-six percent of firms do not have a company-wide energy management system in place to track and optimize energy use, according to survey results; 50 percent do have such systems; the rest don’t know. Among relatively smaller firms in the survey sample (those with annual revenues under $1 billion), a clear majority, 55 percent, have no energy management system. These findings are all the more surprising given that experts consider various kinds of energy management systems to be highly cost-effective (Figure 3).
0 10 20 30 40 50 60
Yes
No
Don’t know
50%
46%
4%
Figure 3: Do you have a company-wide energy management
system in place to track and optimize energy use?
At one level, an energy management system may refer to an organizational framework to actively take control of corporate energy use—as, for example, the new ISO 50001 standard, due in the second half of 2011, will set out (see box: ISO 50001—a new energy management standard). “Energy effi-ciency is not complicated,” insists May of Dow. “It just takes discipline, and it takes a commitment to measuring it, looking for the opportunities, having the behavior and the organization in place to identify them and address them.”
At another level, an energy management setup may include systems of software, switches, and controls. Consider, for example, the case of Bayer MaterialScience, which supplies plastics and other materials to customers such as car manu-facturers. The firm has introduced plant analytics that enable it to reduce variation in its product quality and allow the plant to run closer to its “nameplate” capacity. The system cost some $700,000, with a payback period expected within one year. “Such investments are not very big,” says Hans-Joachim Leimkühler, Director of Process Design at Bayer Technology Services, which acts as an in-house counsel for Bayer Materi-alScience. “But the results are sometimes very considerable.”
Further evidence of industry’s hesitance to take control of energy efficiency emerges in the survey. Just 34 percent of companies have conducted an energy audit across the entire company or group. McCallion of the EBRD highlights the role energy audits can play in measuring and managing energy use: “An energy audit is the key driver for companies to realize not just which technical measures to pursue, but what the financial benefits of those technical measures are,” he says. “It’s how you end up with investments that have internal rates of return in excess of 100 percent. You need to look to energy audits to unlock [these projects].” Given industry’s apparent weak com-mitment to gauging its energy use and striving to manage its energy needs, it perhaps comes as little surprise that fewer than half of firms (48 percent) regularly report progress on

12 Part I | Trends in global energy efficiency 2011
improving energy efficiency at either plant level, business unit level, or group level (Figure 4).
0 10 20 30 40 50 60
Yes
No
Don’t know
48%
49%
3%
Figure 4: Does your company regularly report its progress on
improving energy efficiency, for example as part of its annual report?
In a further indication of industry’s lack of emphasis on core energy efficiency, survey findings show that companies are far more likely to have undertaken measures to drive energy efficiency in areas other than their core manufacturing process-es. Asked in which specific areas their companies have under-taken measures in the past three years to improve energy efficiency, 67 percent of respondents say lighting systems, 48 percent air conditioning, 45 percent heating and 42 percent water use. Just 40 percent have taken energy efficiency mea-sures relating to plant and equipment in their factories(Figure 5).
A question of fundingWhat holds companies back from making a stronger commit-ment to energy efficiency improvements in their core produc-tion processes? When asked to name the two most significant obstacles to investment in energy efficiency, 42 percent of executives point to a “lack of a clear-cut financial case for energy efficiency investments,” more than any other obstacle. The next biggest barrier, highlighted by 28 percent of respon-dents, is “lack of funds.” In some cases, particularly in high-growth markets, group management is torn between allocating capital to expand capacity, and committing funds to increase energy efficiency. This point is illustrated by Rajasekar of Ultra-Tech Cement, which is doubling its production capacity every 10 years. “[Market] capacity continues to grow, so we also have to grow,” he says. “If we don’t grow, then we don’t main-tain our market share” (Figure 6).
Lighting systems
Air-conditioning
Heating
Water use
Capital, plant and equipment in our factories
A company-wide energy audit
Insulation of our buildings
New products or services for our customers
IT stock
Other, please specify
We have not undertaken any energy efficiencymeasures within the past three years
67%
48%
45%
42%
40%
34%
32%
28%
22%
4%
6%
0 10 20 30 40 50 60 70 80 90 100
Figure 5: With regard to which of the following has your organization undertaken measures within the past three years to improve energy
efficiency? Select all that apply.
Industry’s weak commitment to improvement

Trends in global energy efficiency 2011 | Part I 13
0 10 20 30 40 50 60
Lack of a clear-cut financial case for energy efficiency investments
Lack of funds
Lack of information about energy efficiency options
Insufficient commitment by senior management
Unclear who is responsible for such investments
Other, please specify
We have no such barriers
Don’t know
42%
28%
27%
12%
12%
3%
18%
2%
Figure 6: What, if any, are the main barriers to investment in industrial
energy efficiency in your organization? Select up to two.
Interviews with industry executives reveal a number of prac-tices that help their companies to overcome some of the finan-cial barriers to investment. The 3M group, for example, allo-cates capital to each of the six business units; from there, points out Schultz, “they determine what their best opportuni-ties are. It may be growth, and it may be margin improvement.” Furthermore, as plant managers at the firm make a financial case for investment, they can make use of 3M’s corporate-wide energy projects database. Says Schultz: “That database allows us to share information from facility to facility, so that one facility can learn from another facility what worked, and sometimes also what didn’t work.”
There are other ways to make the financial investment case more compelling. For example, measures to improve the efficiency of existing equipment can be all the more cost-effec-tive if undertaken as part of normal capital investment and plant maintenance cycles, to reduce production downtime. “Timing and coordination with operations is absolutely critical in our business,” notes May of Dow, whose plants run day and night. “The economics really get impacted if you’re bringing down the equipment just to implement the project.” And as top management become increasingly aware of the importance of some “softer” benefits of energy efficiency for long-term growth, it may be that these benefits add weight to the financial case. Says Ian Gilmour, Safety, Health and Environment and Manufacturing Manager at Orica, an Australian chemicals manufacturer: “The other way I argue it is: Image, reputation, and benefit to society. And I have a board that listens to that argument.”
Benchmarking alternativesFinancial barriers are not the only issue holding back invest-ments in energy efficiency. One of the challenges in putting together a sound investment case, and securing funding, for efficiency improvements lies in what some managers say is a lack of information about energy options. This is the third most significant barrier, flagged by 27 percent of respondents. One notable variance in the survey results is that, in the Asia-Pacific region, 37 percent of respondents highlight the issue of inad-equate information—considerably more than the proportion of managers there that blame lack of funds (24 percent).Meanwhile, among smaller firms, the proportion of managers who say that lack of information is a barrier is higher than the sample average, at 32 percent. BEE Director General Mathur illustrates the effects of inadequate specialist information: “There can be a problem of ‘I’m going to get this new technol-ogy, will it work?’ The guy who comes to the door says, ‘Put this widget in, and your energy consumption will drop by half.’ Will it? Or will the plant stop? So the perceived risk of new technologies is something that constrains the early adoption of energy efficient technologies.” Furthermore, in making assess-ments such as these, it’s possible that smaller companies have fewer resources available to manage energy efficiency: In 17 percent of smaller firms, responsibility for energy efficiency rests with a dedicated energy efficiency manager, in contrast to 24 percent at larger firms (Figure 7).
Chief executive officer
Chief financial officer
Head of sustainability
Energy efficiency or environmentalhealth & safety manager
Individual line-of-business managers or business-unit heads
Other, please specify
Nobody has responsibility
Don’t know
32%
9%
5%
20%
19%
10%
5%
2%
0 10 20 30 40
Figure 7: Who has formal responsibility for energy efficiency
in your organization?
In India, BEE has a dedicated program to provide information on industrial efficiency to small and medium enterprises (SMEs). The body’s Director General, Mathur, says many of India’s SMEs are organized in geographic and sector-based clusters. “We are bringing in state-of-the-art engineering knowledge through consultants who go into these plants and

14 Part I | Trends in global energy efficiency 2011
see what is possible,” he says. The consultants discuss the options in seminars with equipment vendors, plant managers, and lenders, before a project is implemented. Later, others in the cluster can see the investment in action, and if they want to do the same, “the business case is already proven—there’s somebody who’s doing it,” says Mathur. BEE is rolling out this model in 25 SME clusters nationwide.
Box: ISO 50001—a new energy management standard
Since 2008, the International Organization for Standard-ization, a Geneva-based group that establishes operat-ing norms for business, government and society, has been compiling an international energy management standard—ISO 50001. The standard is due to launch in the second half of 2011.
What can companies expect? ISO 50001 will provide a framework to help them plan and manage their energy use. Rather than setting out technical requirements, the standard will set out the procedures and practices that constitute a sound energy management system.
Among other areas, ISO 50001 will cover the following: Making better use of existing energy-consuming assets; benchmarking, measuring, documenting, and reporting energy intensity improvements; transparency and com-munication in the management of energy resources; energy management best practices; assessing and prioritizing the implementation of new energy-efficient technologies; promoting energy efficiency throughout the supply chain; and energy management improve-ments in the context of carbon dioxide emissions reduc-tion projects.
ISO 50001 is likely to be particularly appealing for those organizations that already operate according to the ISO 9001 quality management standard. Experts say the new energy management standard may be worthwhile for any organization with large energy bills—say, over $500,000 a year. In time, the ISO hopes that this new standard will have a positive impact on the way in which up to 60
The general lack of information about energy options is com-pounded, perhaps, by the widespread difficulty in benchmark-ing plant efficiency levels across geographic regions and industry segments. For some manufacturing processes, reli-able benchmarks are available: “In ammonia and ammonium nitrate, there’s a worldwide conference where everybody will share data,” says Orica’s Gilmour. “We all know what plants everybody else has got, and what kinds of efficiencies they get.
It’s all published data,” he says. But in many cases, bench-marking remains a challenge. “The diversity of manufacturing processes and product mixes varies so much from plant to plant, that it becomes almost impossible to benchmark against either a domestic or even global competitor,” points out the ACEEE’s Elliott. It’s plain to see why, then, 77 percent of survey respondents agree that “industries need clearer benchmarks for what constitutes energy efficiency” in their sectors.Still, in the general absence of reliable benchmarks, industry is using a variety of other yardsticks to measure their energy efficiency, and efficiency gains. Leimkühler, the process design director at Bayer Technology Services, provides one example: “We cannot compare Plant A with Plant B. So we compare Plant A actual with Plant A optimal,” a level that is arrived at through workshops with plant staff. Some companies are comparing a plant’s energy efficiency performance with its prior-year performance, to track continuous improvement; other companies are benchmarking not their energy use, but rather the way they manage energy—a practice that ISO 50001 is likely to reinforce. 3. Regulatory issues set the agendaIndustrial production is set to continue expanding in the com-ing decades. Yet, at the same time, growing concern about climate change is leading to pressure on industrial companies to minimize their environmental impact. While the majority (58 percent) of surveyed executives indicate they increased their investments in energy efficiency in the past year, versus the prior year, a very significant proportion (42 percent) say their investments were static in the past year, or fell. Even among those that did increase their investments, almost half (48 percent) did so by 10 percent or less (Figure 8).
More than 50% increase from previous year
30% - 50% increase from previous year
10% - 30% increase from previous year
1% -10% increase from previous year
Static – no change from previous year
1% - 10% reduction from previous year
10% - 30% reduction from previous year
30% - 50% reduction from previous year
More than 50% reduction from previous year
4%
6%
21%
28%
33%
5%
2%
1%
0%
0 10 20 30 40 50
Figure 8: Over the past year, how much, if at all, has your company’s
investment in industrial energy efficiency changed over the previous
year?
Regulatory issues set the agenda

Trends in global energy efficiency 2011 | Part I 15
On a positive note, manufacturers in high energy-intensity industries are more likely (15 percent) to have increased invest-ment very significantly (defined as 30 percent or more year-on-year) than lower energy-intensity manufacturers (10 percent) or power producers (5 percent). Apollo Tyres is one example: The company says its investments in energy efficiency have grown 50 percent year-on-year (from a low base), due to new waste heat recovery equipment at its plant in Vadodara in western India. It’s possible that some other energy-intensive manufac-turers are now taking steps to mitigate against a return to the peak energy prices seen in 2008, as economic conditions gradually stabilize and restrictions on capital expenditure begin to ease.
While, on the whole, growth in investment in energy efficiency remained modest in the past year, executives appear confident that their companies will increase spending on improvements in efficiency in the coming three years. Seventy-three percent of all respondents expect their company to spend more in the coming three years. Of these, about 13 percent expect a very significant increase. In Western Europe, a slightly higher pro-portion (16 percent) than average expects a very significant increase, perhaps in anticipation of intensifying regulatory pressure in the European Union (Figure 9).
More than 50% increase from previous year
30% - 50% increase from previous year
10% - 30% increase from previous year
1% -10% increase from previous year
Static – no change from previous year
1% - 10% reduction from previous year
10% - 30% reduction from previous year
30% - 50% reduction from previous year
More than 50% reduction from previous year
6%
8%
29%
30%
22%
2%
3%
0%
1%
0 10 20 30 40 50
Figure 9: How do you expect your company’s investment in industrial
energy efficiency to develop over the next three years?
Indeed, regulation is already beginning to emerge as a major theme driving investment in improvement of industrial energy efficiency. For now, it does not appear that industry managers consider energy regulation to be a heavy burden. Asked how they would describe industrial energy efficiency regulation in their home countries, 50 percent say “modest, not onerous,” compared to 40 percent who say it is “somewhat stringent” or
“very stringent.” Power firms are more likely (45 percent) to consider regulation stringent than manufacturers (39 percent). And while more respondents in developed economies (45 percent, with Western Europe as high as 53 percent) are likely to take this view than in developing markets (32 percent), one exception is North America, where just 31 percent consider regulation to be stringent (Figure 10).
Very stringent
Somewhat stringent
Modest, not onerous
Non-existent
Don’t know
15%
25%
50%
8%
1%
0 10 20 30 40 50 60
Figure 10: In the country in which you are based, how would you
describe legislation and regulation governing industrial energy
efficiency?
A light regulatory frameworkUntil recently, few businesses have been subject to mandatory energy efficiency requirements. More widespread are opt-in schemes, such as the Energy Star program in the US, or the Energy Efficiency Opportunities (EEO) program in Australia, which provide a basis for companies to improve their industrial energy efficiency. The EEO, for example, calls on participating companies to identify, assess and report on potential energy savings improvements. “It doesn’t mandate we actually do any of them,” says Orica’s Gilmour. “But it requires us to do the audit, and it requires us to give sight to directors of the [effi-ciency improvement] opportunities. I actually think that’s rea-sonably helpful.”
As policy makers across the globe address climate change issues, voluntary industrial energy efficiency frameworks, such as those in the US and Australia, are increasingly being joined by mandatory regulations. In the US in 2010, for example, new regulations came into force under the Energy Independence and Security Act that stipulate the minimum energy efficiency of new industrial motors sold in the US. Canada, Mexico, and Brazil have introduced similar requirements; and the European Union is scheduled to adopt related regulation in three stages, starting in June 2011. Meanwhile, in April this year, India launched the Perform, Achieve and Trade scheme as part of the country’s National Action Plan on Climate Change (see box: India’s policy makers increase the pressure on industry).

16 Part I | Trends in global energy efficiency 2011
These regulations specifically target industrial energy efficiency. Industry managers are also anticipating other pressures that will require them to make a stronger commitment to improving industrial energy efficiency. For example, since 2008, the European Union has been phasing in the European Union Emission Trading System (EU ETS) as part of a wider climate change package, with the goal of cutting carbon dioxide emis-sions 20 percent by 2020, relative to 1990. In China, mean-while, further regulation may also be on the way. “It’s obvious that Chinese regulation is getting more and more strict,” says Wan Xiaotao, Sustainable Development Coordinator at Bayer China.
Box: Process improvements that save energy
− When Thai joint venture SCG-Dow Group opens its new propylene oxide (PO) facility near Map Ta Phut, a coastal town in Thailand, later in 2011, produc-tion will be based on the new Hydrogen Peroxide to Propylene Oxide (HPPO) process. Compared to prior PO production, the process, developed jointly by Dow and BASF, reduces waste water by 70-80 percent and cuts energy use by 35 percent. Further-more, because plants based on HPPO technology are smaller and simpler than conventional PO plants, they require 25 percent less capital to build.
− Germany’s Bayer MaterialScience (BMS) is currently constructing a new production facility for toluene diisocyanate (TDI, a polyurethane raw material) in Caojing, near Shanghai in China. When it goes on-stream in the middle of 2011, the facility will use a new production process developed and trialed over the past seven years. The process uses 60 percent less energy, and 80 percent less solvent, than con-ventional TDI production. As TDI is increasingly beco-ming commodity-like, these production cost savings will contribute strongly to competitiveness.
Production process improvements are set to assume a major role in tomorrow’s industrial energy efficiency. Presented here are two examples from the chemicals sector.
Climate change mitigation policies such as these will affect even those manufacturers whose production activity is less energy-intensive—especially in cases where their energy use represents a significant proportion of their environmental impact, for example through carbon dioxide emissions. The EU’s cap-and-trade system is a case in point. Says McCallion of the EBRD: “I think there’s going to be pressure inside the European Union to meet the 2020 targets. Investments are going to be very much linked to the evolution of the carbon
markets and what sort of cap-and-trade systems will be in place that will affect the operations of the companies.”
Besides legislation and regulation, pressure to act in accor-dance with sound sustainability principles will also continue to intensify within the business environment—and from within companies themselves. Says Schultz of 3M: “A lot of custom-ers are expecting their suppliers to be more conscious of the results of their actions and that has driven a lot of concern and, I think, activity in the area.” For its part, chemicals maker BASF has a group-wide initiative to improve the energy efficiency of its chemical production processes by 25 percent by 2020 relative to 2002. “As part of this, in 2009, we reduced the specific energy consumption per ton of product in Greater China by 17 percent,” says Zheng Daqing, a board member of BASF Greater China.
Existing technologies will lead the wayAs they seek a balance between maximizing economic output and minimizing environmental impact, it’s likely industrial companies will increasingly turn their focus to energy efficiency. To cut energy use in production processes in the short term, points out McCallion of the EBRD, there is significant scope for further penetration of existing technologies—including vari-able-speed drives, and more-efficient motors, for example. Furthermore, there appears to be room for better management of energy use. In other words, significant improvements in industrial energy efficiency appear to be within relatively easy reach of many industry executives today.For a few executives, however, this is not the case. Wan at Bayer China is one. “If we look at Bayer MaterialScience in China, the plants and equipment are pretty much new,” he says. “They’ve all been built within the last five to six years, so there is little opportunity to upgrade the equipment to improve efficiency.” In cases such as these, and many more besides, further advances in production processes will enable industry to improve efficiency (see box: Process improvements that save energy). Mathur of BEE in India predicts: “We will probably start seeing changes in manufacturing processes occurring towards the end of this decade.”
For this to happen, of course, research and development, innovation, and collaboration have a central role to play, a point that is highlighted by Rajasekar of UltraTech Cement. He says the company typically allocates 0.2-0.3 percent of annual revenues to its corporate research and development efforts, and in addition funds common research programs run by the European Cement Research Academy, based in Düsseldorf, Germany. “We need to have more and more collaborative work on research, because some of these things are not possible in individual companies,” Rajasekar says. “Ultimately, the results
Regulatory issues set the agenda

Trends in global energy efficiency 2011 | Part I 17
have to be for [the benefit of] the whole industry.”
Not surprisingly, as industry grapples with the compliance issues around energy efficiency and environmental legislation, the question emerges: Who will pay? Some industrial compa-nies are calling on policy makers to improve tax incentives and subsidy schemes for energy efficiency improvement measures. Among the survey sample, 51 percent say that, in the country in which they are based, incentives or subsidies are on offer for companies to upgrade to more efficient equipment. In devel-oped economies these appear more widespread (55 percent of respondents say they are available) than in developing regions (44 percent). Monga of UNIDO names Thailand as one example of a country successful in promoting energy efficiency. “The Energy Conservation Fund of Thailand provides loans through designated banks, at a lower rate of interest, to enterprises who are going to install energy efficient equipment or systems,” he says (Figure 11).
In developing countries, 38 percent of managers believe that taxpayers should bear more of the cost of companies’ energy efficiency compliance. By contrast, this figure is 27 percent in developed economies. Pointing to the continued expansion of industrial production in developing countries and the great potential for absolute energy savings, some companies in these countries argue for further policies to promote energy efficiency in industry, including technical and financial assis-tance. Agarwal of Apollo Tyres states the case: “Energy proj-ects are sometimes very capital intensive,” he says. “So the support of the government in terms of giving tax breaks or some other thing to these kinds of investments is always helpful.”
Ultimately, though, executives say that most investments in improving energy efficiency pay their own way—with or without policy incentives. As regulation intensifies, it is becoming more and more plain that, to secure long-term financial performance, companies must strive for continuous energy efficiency
Box: India’s policy makers increase the pressure on industry
To add momentum to improvements in energy efficiency in India’s heavy industry, the Government of India recently intro-duced a mandatory energy efficiency scheme for the country’s largest industrial sites. The so-called Perform, Achieve and Trade (PAT) scheme, the country’s first set of mandatory industrial energy regulations, came into force on April 1, 2011.
PAT is a market-based mechanism, similar to carbon dioxide emissions trading mechanisms seen elsewhere. Under the PAT scheme, over 600 individual industrial units in eight sectors across India, including plants that produce cement, power, chemicals, pulp and paper, iron and steel, and aluminum, are given targets to improve their energy efficiency. In all, these units account for around half of India’s industrial energy demand.
The PAT scheme requires each plant to cut its specific energy consumption by a fixed percentage over a three-year time-frame, based on its current energy use. There is no industry-wide benchmark, nor is the required percentage reduction negotiable. Under the PAT scheme, plant owners are required to appoint an energy manager, provide authorities with an energy consumption report, comply with energy efficiency norms, and allow designated energy auditors to verify compli-ance. Failure to comply results in a hefty fine.
Each industrial site is allocated a quota of energy saving certificates (ESCerts); sites that exceed their energy savings targets are given extra certificates. The certificates can be traded at market-driven prices via the Indian Energy Exchange. Those failing to meet efficiency improvement targets can comply with the PAT scheme by buying extra ESCerts.
Government officials say that the scheme is designed to accommodate the ongoing strong industrial growth in India; the wide bandwidth of specific energy consumption across individual sectors; and the need for transparent procedures that cannot be manipulated or negotiated. Over a 10-year period the government expects a 10-15 percent improvement in energy efficiency, largely driven by upgrades in technology.
L. Rajasekar, Executive President of Indian cement manufacturer UltraTech Cement, points out how the new PAT scheme adds weight to the financial case for investment in improving energy efficiency. “If you take into consideration the penalties [for non-compliance], then your payback period comes down, practically by half,” he says. “If you have a six year payback, it becomes three years. In a way, it will help us.”

18 Part I | Trends in global energy efficiency 2011
improvement in their industrial processes. Those that do not do so face an uncertain future. As McCallion, the EBRD’s energy efficiency and climate change head, concludes: “The compa-nies where [energy] is not a key element of their cost, or they’re not enlightened and they’re behind the curve—they’re the ones that will be hit hard by tightening regulatory pressure.”
0 10 20 30 40 50 60
Incentives and/or subsidies for upgradingto more efficient equipment / appliances
Efficiency standards on industrialequipment, appliances, etc
Incentives to switch to renewable energy
Requirements for environmental impact statements or audits
Taxes on pollution or carbon emissions
Codes for energy efficiency of buildings
Carbon cap-and-trade programs
“Green IT” codes (energy efficiencystandards for IT equipment)
Other, please specify
No legislation in place
Don’t know
51%
47%
46%
41%
38%
37%
25%
20%
2%
5%
3%
Figure 11: In the country in which you are based, what types of laws
and regulations does the government use to promote industrial energy
efficiency? Select all that apply.
ConclusionsAs industry faces the challenges of adapting to an era of ener-gy constraints, leading businesses are scrutinizing the energy efficiency of their manufacturing operations. Efforts to mea-sure, manage, and continuously improve energy efficiency save cash in the short term. In the longer term, such efforts enhance competitiveness, foster innovation, and pave the way for companies to meet environmental and other sustainability commitments. In other words, investments in improving indus-trial energy efficiency are critical not only for short-term profit-ability, but for long-term financial performance as well.The experiences and viewpoints of executives, policy makers and other experts interviewed for this report provide a number of insights into the topic of investment in improving energy efficiency in industrial processes:
− Sub-optimal practices are widespread—despite the critical role of energy efficiency. Energy efficiency saves costs and makes companies more competitive. Amid volatile, but rising, global energy prices, efficiency is especially critical for those companies operating in energy-intensive indust-
ries, where exposure to cost fluctuations is high, and profit margins are thin. While companies recognize this, many continue to operate inefficient equipment, or to operate equipment inefficiently.
− Lack of information deepens inertia. A major reason for the gap between awareness of gains from efficiency and actual investment in efficiency is poor information. This includes lack of information on latest technologies and alternative ways to improve efficiency; lack of efficiency benchmarks, and insufficient information on the payback of specific projects.
− Companies blame lack of cash—but can overcome this obstacle. Many firms cite a lack of cash or a need to priori-tize investment in expanding manufacturing capacity as the reason for deferring efficiency investments. Yet other com-panies show how it’s possible to overcome these obstac-les. For a start, there are many simple, low-cost projects with short payback periods.
− Regulatory pressure will intensify—meaning companies should act soon. Emerging regulations will increasingly require companies to improve their energy efficiency. The scope for savings using existing technologies is large; in the future, research will lead to further gains, for example through process innovations. To secure long-term financial performance, companies must strive for continuous energy efficiency improvement. Those that do not will face signifi-cant pressure.
Conclusions

Trends in global energy efficiency 2011 | Part I 19

20 Part II | Trends in global energy efficiency 2011
Part IIOverview of energy efficiency in industry and utilities

Trends in global energy efficiency 2011 | Part II 21
The global data show that there have been substantial improvements in energy efficiency in energy-intensive indus-tries, including power generation, over the last 20 years. The spread of efficient processes and technologies are responsible for these energy productivity gains. Nevertheless, significant potential for using energy more efficiently still exists, particu-larly in emerging economies. Globally, the amount of energy used per unit of GDP has decreased by 1.4 percent / year on average since 1990. The pace of improvement accelerated over the period 2004-2008 due to the surge in oil prices, but was little changed in 2009 following the global economic slowdown.
A general overview of energy efficiency is followed by in-depth reviews of the countries of the Group of 20 (G-20), which collectively account for about three-quarters of the world’s energy consumption. The countries are presented in order of their total primary energy consumption (including biomass). Each report begins with an overview of national low-carbon policies, to provide a broad context for the sections on energy efficiency in the power sector and other industries, with special emphasis given to the main energy-intensive industries.Interactive maps presenting the global energy efficiency data can be found at: www.abb.com / energyefficiency
Part II provides an overview of energy efficiency in industry and utilities. It presents overall, regional and per-country energy and CO2 efficiency trends and their main drivers based on homogeneous energy efficiency indicators over the period 1990-2009. Analyses are based on energy efficiency indicators from Enerdata’s world energy database. The database provides harmonized energy data collected from more than 200 sources around the world1.
1 For more information about Enerdata and the information provided, go to “Sources and methodology” at the end of the report.

22 Part II | Trends in global energy efficiency 2011
1. Global energy efficiency trends1.1 Global trendsIn 2009, total energy consumption per unit of GDP (primary energy intensity1), measured at purchasing power parity and taking the world as a reference, ranged from 1.8 in the CIS2 to 0.6 in the EU (Figure 1): energy use per unit of GDP in the CIS is three times higher than in European countries. Levels in OECD Asia and Latin America exceed the European level by about 15 percent while North America stands 40 percent higher but remains below the world average. India and Other Asia are on a par with the world average, with energy intensity levels 60 percent higher than in Europe. The high energy inten-sity in the CIS, China and the Middle East is explained by various factors, including the predominance of energy-inten-sive industries and low energy prices.
0
0.5
1.0
1.5
2.0
2.5
3.0
3.5
4.0
4.5
5.0
Nor
mal
ized
aga
inst
the
Wor
ld=
1
at exchange rate
at ppp
CIS
Chi
na
Mid
dle
-Eas
t
Afri
ca
Indi
a
Oth
erA
sia
Wor
ld
Nor
thA
mer
ica
OE
CD
Asi
a
Latin
Am
eric
a
Eur
ope
Source: Enerdata
Figure 1: Primary energy intensities by world region (2009)
Global energy intensity decreased by 1.4 percent / year between 1990 and 2009 (Figure 2). With the exception of the Middle East, the energy required per unit of GDP has also decreased in all world regions since 1990. That trend is explained by the combined effect of high energy prices, energy efficiency programs and, more recently, CO2 abatement poli-cies in OECD countries, as well as other economic factors, such as the move by economies towards service activities.The largest reductions were seen in countries or regions with the highest primary intensity in 1990 (China, CIS, India). The largest drop in energy intensity since 1990 was achieved in China (-4.6 percent / year), while in the CIS countries and India the reduction was twice as slow. The sharp reduction seen in China was mainly driven by the rapid growth of machinery and transport equipment, ie, the branch with the lowest energy intensity, in the industrial value added. It can also be attributed to a more efficient use of coal and higher energy prices. Above-
average reductions were also achieved in North America and the EU (-1.8 percent / year and -1.7 percent / year, respective-ly). Compared with the world average, energy productivity3 in other world regions improved to a lesser extent over the peri-od. In the Middle East, energy consumption has been growing at a faster pace than the GDP; consequently, energy intensity has increased by 1 percent / year since 1990. The surge in oil prices over the 2004-2008 period accelerated reductions in all regions except China, which was not affected. The global economic crisis in 2009 induced a net slowdown in the energy intensity reduction in all regions except North America. This poor performance was mainly caused by industry, a sector in which energy consumption did not decrease at the same pace as the value added due to lower efficiency. The exception of North America is probably due to a deeper recession in energy-intensive branches than in other industries.
-6%
-5%
-4%
-3%
-2%
-1%
0%
1%
2%
3%
%/y
ear
1990-2009 1990-2004 2004-2008 2008-2009
CIS
Chi
na
Mid
dle
-Eas
t
Afri
ca
Indi
a
Oth
erA
sia
Wor
ld
Nor
thA
mer
ica
OE
CD
Asi
a
Latin
Am
eric
a
Eur
ope
Source: Enerdata
Figure 2: Trends in primary energy intensity by world region
About 80 percent of countries in the world have decreased their energy intensity since 1990 (Figure 3). Productivity gains in about 30 percent of countries were moderate, since their energy intensity decreased by less than 1 percent / year, whereas the reduction in about 15 percent of countries (mainly Asian and East European) took place at the rapid pace of over 3 percent / year. In more than 20 percent of countries, on the other hand, energy productivity is decreasing (mainly in the Middle East, Africa and Latin America).
Global report
1 Primary energy intensity measures the total amount of energy required to generate one unit of GDP. GDP is expressed at constant exchange rate or purchasing power parity (ppp) to remove the impact of inflation and changes in
currency rates. Using purchasing power parity rates instead of exchange rates to convert GDP in the same currency (eg, $) makes it possible to account for differences in general price levels: it increases the value of GDP in regions
with a low cost of living (case of developing countries) and, therefore, decreases their energy intensities (Figure 1). Definitions of indicators are available in “Sources and methodology” at the end of the report.
2 Definitions of regions are available in “Sources and methodology” at the end of the report.
3 Energy productivity increase is another way to refer to energy intensity decrease by analogy with labor productivity increase.
Trends in global energy efficiency 2011 | Part II 23
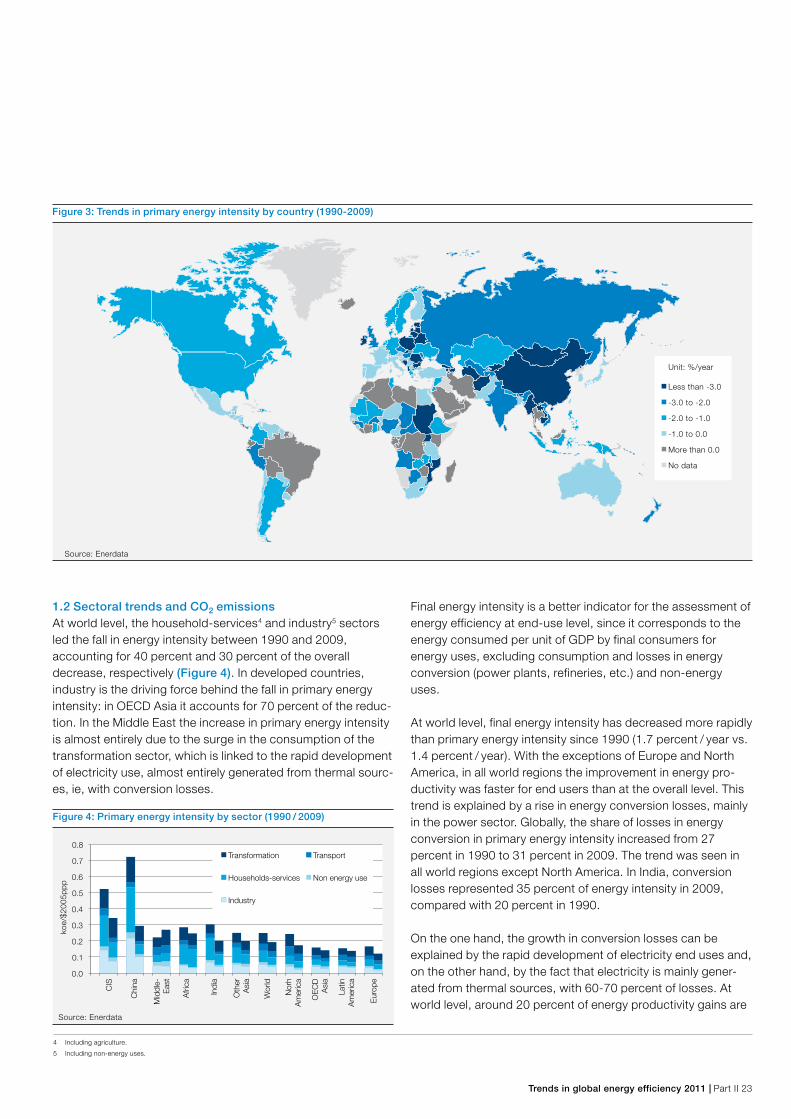
1.2 Sectoral trends and CO2 emissions At world level, the household-services4 and industry5 sectors led the fall in energy intensity between 1990 and 2009, accounting for 40 percent and 30 percent of the overall decrease, respectively (Figure 4). In developed countries, industry is the driving force behind the fall in primary energy intensity: in OECD Asia it accounts for 70 percent of the reduc-tion. In the Middle East the increase in primary energy intensity is almost entirely due to the surge in the consumption of the transformation sector, which is linked to the rapid development of electricity use, almost entirely generated from thermal sourc-es, ie, with conversion losses.
0.0
0.1
0.2
0.3
0.4
0.5
0.6
0.7
0.8
koe/
$200
5pp
p
Transformation Transport
Households-services Non energy use
Industry
CIS
Chi
na
Mid
dle-
Eas
t
Afri
ca
Indi
a
Oth
erA
sia
Wor
ld
Nor
hA
mer
ica
OE
CD
Asi
a
Latin
Am
eric
a
Eur
ope
Source: Enerdata
Figure 4: Primary energy intensity by sector (1990 / 2009)
Final energy intensity is a better indicator for the assessment of energy efficiency at end-use level, since it corresponds to the energy consumed per unit of GDP by final consumers for energy uses, excluding consumption and losses in energy conversion (power plants, refineries, etc.) and non-energy uses.
At world level, final energy intensity has decreased more rapidly than primary energy intensity since 1990 (1.7 percent / year vs. 1.4 percent / year). With the exceptions of Europe and North America, in all world regions the improvement in energy pro-ductivity was faster for end users than at the overall level. This trend is explained by a rise in energy conversion losses, mainly in the power sector. Globally, the share of losses in energy conversion in primary energy intensity increased from 27 percent in 1990 to 31 percent in 2009. The trend was seen in all world regions except North America. In India, conversion losses represented 35 percent of energy intensity in 2009, compared with 20 percent in 1990.
On the one hand, the growth in conversion losses can be explained by the rapid development of electricity end uses and, on the other hand, by the fact that electricity is mainly gener-ated from thermal sources, with 60-70 percent of losses. At world level, around 20 percent of energy productivity gains are
Unit: %/year
Less than -3.0
-3.0 to -2.0
-2.0 to -1.0
-1.0 to 0.0
More than 0.0
No data
Source: Enerdata
Figure 3: Trends in primary energy intensity by country (1990-2009)
4 Including agriculture.
5 Including non-energy uses.

24 Part II | Trends in global energy efficiency 2011
counterbalanced by increasing losses in energy conversion. In India and China that percentage is even higher: the soaring electricity demand led to a sharp rise in conversion losses, since most power generation is from coal. In North America and the EU, primary energy intensity decreased slightly faster than final intensity due to the fact that energy conversion losses decreased over the period. This drop is related to the reduction in thermal power generation, led by the development of renewables in the power mix (primarily wind energy), the growing efficiency of thermal power plants (boosted by the spread of gas combined-cycle technologies) and the increas-ing use of cogeneration facilities.
CO2 intensity, which indicates the level of CO2 emissions from energy use per unit of GDP, has been decreasing by 1.5 per-cent / year at world level since 1990 (Figure 5). It has fallen in all regions since 1990 except in the Middle East. In the case of most developed regions the decrease in CO2 intensity is great-er than energy productivity improvements due to a shift to carbon-free energy sources (renewables, nuclear) or energy sources with a lower CO2 emission factor (natural gas). In developing countries fuel substitutions had a reverse impact due to the decreasing share of carbon-free energy (India, Latin America) and the increasing share of coal in energy consump-tion (China, other Asia). In the Middle East, CO2 intensity rose at a slower pace than energy intensity due to a switch to natu-ral gas.
-6%
-5%
-4%
-3%
-2%
-1%
0
1%
2%Primary intensity Final intensity CO2 intensity
%/y
ear
Chi
na CIS
Indi
a
Nor
thA
mer
ica
Eur
ope
Wor
ld
Oth
erA
sia
Afri
ca
OE
CD
Asi
a
Latin
Am
eric
a
Mid
dle
Eas
t
Source: Enerdata
Figure 5: Energy and CO2 intensity trends (1990-2009) (% / year)6
Electricity consumption per capita varies greatly among the different regions (Figure 6). In North America, it is five times higher than the world average (and 20 times higher than in India).
Globally, electricity consumption per capita has increased by one-third since 1990. With the exception of the CIS, it rose in all world regions or countries between 1990 and 2009. It
increased sharply in most developing countries and regions. In China, electricity consumption per capita has increased fivefold since 1990, while in the Middle East it was two times higher in 2009 than in 1990. In developed countries, which already had very high levels, electricity consumption per capita increased to a lesser extent: by 10 percent in North America and around 20 percent in the EU.
At world level, the share of industry in electricity consumption reached 40 percent in 2009. The largest share of industry was seen in China, where the sector accounts for more than 60 percent of total electricity consumption. In developing coun-tries that share is generally higher than the world average (>40-60 percent), with the exception of the Middle East where it is just 20 percent. In OECD Asia and the EU industry accounted for 37 percent of electricity consumption in 2009, while it accounted for just 23 percent in North America.
Source: Enerdata
0
2,000
4,000
6,000
8,000
10,000
12,000
14,000
NorthAmerica
OECDAsia
Europe World
Kw
h/ca
p
OtherIndustry
Figure 6: Variation of per capita electricity consumption by sector
(1990 / 2009)
Source: Enerdata
0
1,000
2,000
3,000
4,000
5,000
6,000
Kw
h/ca
p
Other
Industry
CIS
Chi
na
Mid
dle
-Eas
t
Afri
ca
Indi
a
Oth
erA
sia
Wor
ld
Latin
Am
eric
a
Global report
6 Non-energy uses are not included in the final energy intensity.

Trends in global energy efficiency 2011 | Part II 25
2. Energy efficiency performance in power generation2.1 Global power generation efficiencyAt world level, thermal sources represented around 65 percent of total electricity production in 2009 (Figure 7). Coal is the main source used to produce electricity (40 percent) while natural gas accounted for more than 20 percent, on average. CO2-free sources represented about one third of the power mix. The Middle East shows the largest share of thermal sourc-es in its power mix, with natural gas and oil representing over 90 percent of the total. In China and India coal is by far the main fuel used for power generation, and thermal sources as a whole account for more than 80 percent of electricity genera-tion. Latin America has the largest share of CO2-free energies in its power mix, since hydroelectricity accounts for 50 percent of total power generation. Europe ranks second in terms of CO2-free electricity production with an above-average share of nuclear energy (25 percent, compared with 13 percent at world level) and “new renewables” (wind and biomass, with 8 percent of the total, half of which for wind energy, compared with 3 percent at world level); in Europe, when hydroelectricity is included, the total share of renewables is 23 percent and is growing rapidly.
0%10%20%30%40%50%60%70%80%90%
100%Other* Wind Hydro Nuclear Natural gas Oil Coal-Lignite
*Including biomass, geothermal and solar CO2-free sources
CIS
Chi
na
Mid
dle
-Eas
t
Afri
ca
Indi
a
Oth
erA
sia
Wor
ld
Nor
thA
mer
ica
OE
CD
Asi
a
Latin
Am
eric
a
Eur
ope
Source: Enerdata
Figure 7: Power generation by source (2009)
In almost half of the countries in the world the energy efficiency of electricity generation is above 40 percent (world average), while in about one-third of countries energy efficiency is above 50 percent (Figure 8). In countries with a large share of hydro-electricity in their power generation mix (Canada, Brazil and Norway) the energy efficiency of electricity generation exceeds 60 percent.
2.2 Thermal power generation efficiencyAt world level, the energy efficiency of thermal power plants has improved by 3 percentage points since 1990, from 32 percent in 1990 to 35 percent in 2009 (Figure 9). This level is far lower than the average in North America or the EU (40 percent), or the level of the world’s best performer (Spain, with
Unit: %
Less than 30
30 to 40
40 to 50
50 to 60
More than 60
No data
Source: Enerdata
Figure 8: Energy efficiency of total electricity generation (2009)
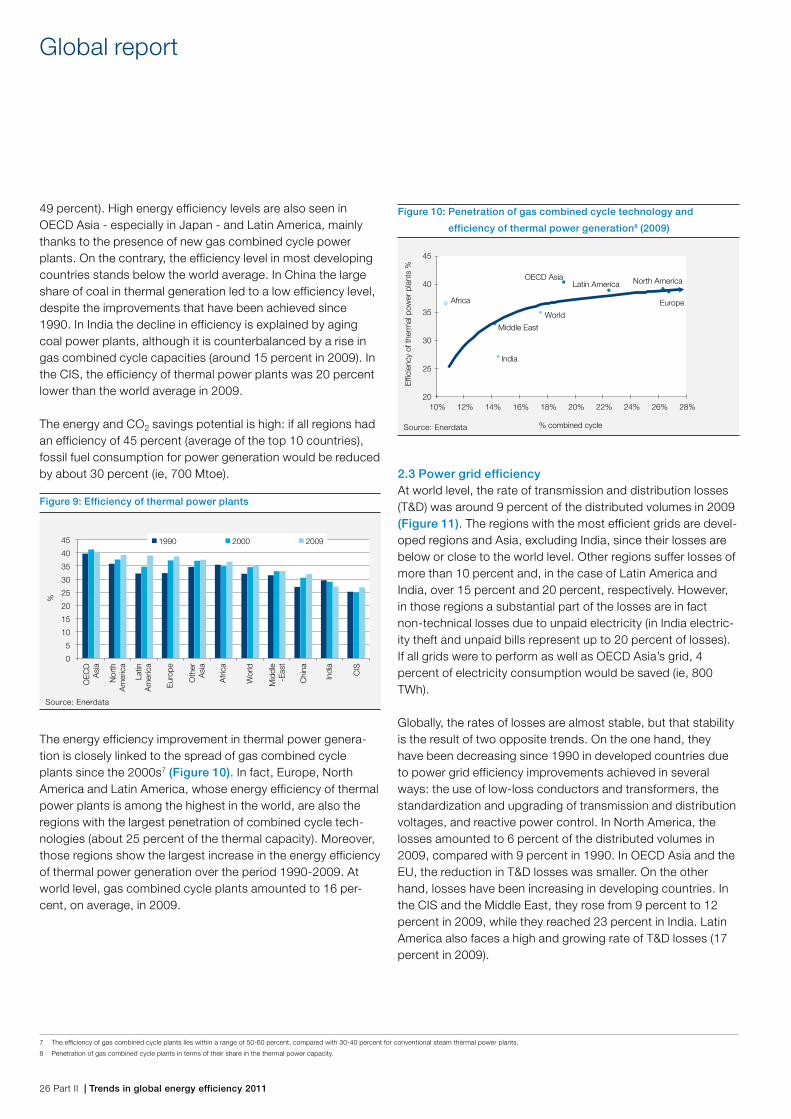
26 Part II | Trends in global energy efficiency 2011
49 percent). High energy efficiency levels are also seen in OECD Asia - especially in Japan - and Latin America, mainly thanks to the presence of new gas combined cycle power plants. On the contrary, the efficiency level in most developing countries stands below the world average. In China the large share of coal in thermal generation led to a low efficiency level, despite the improvements that have been achieved since 1990. In India the decline in efficiency is explained by aging coal power plants, although it is counterbalanced by a rise in gas combined cycle capacities (around 15 percent in 2009). In the CIS, the efficiency of thermal power plants was 20 percent lower than the world average in 2009.
The energy and CO2 savings potential is high: if all regions had an efficiency of 45 percent (average of the top 10 countries), fossil fuel consumption for power generation would be reduced by about 30 percent (ie, 700 Mtoe).
0
5
10
15
20
25
30
35
40
45
%
1990 2000 2009
CIS
Chi
na
Mid
dle
-Eas
t
Afri
ca
Indi
a
Oth
erA
sia
Wor
ld
Nor
thA
mer
ica
OE
CD
Asi
a
Latin
Am
eric
a
Eur
ope
Source: Enerdata
Figure 9: Efficiency of thermal power plants
The energy efficiency improvement in thermal power genera-tion is closely linked to the spread of gas combined cycle plants since the 2000s7 (Figure 10). In fact, Europe, North America and Latin America, whose energy efficiency of thermal power plants is among the highest in the world, are also the regions with the largest penetration of combined cycle tech-nologies (about 25 percent of the thermal capacity). Moreover, those regions show the largest increase in the energy efficiency of thermal power generation over the period 1990-2009. At world level, gas combined cycle plants amounted to 16 per-cent, on average, in 2009.
World
India
Latin AmericaOECD Asia North America
20
25
30
35
40
45
10% 12% 14% 16% 18% 20% 22% 24% 26% 28%
% combined cycle
Africa
Effi
cien
cy o
f the
rmal
pow
er p
lant
s %
Europe
Middle East
Source: Enerdata
Figure 10: Penetration of gas combined cycle technology and
efficiency of thermal power generation8 (2009)
2.3 Power grid efficiencyAt world level, the rate of transmission and distribution losses (T&D) was around 9 percent of the distributed volumes in 2009 (Figure 11). The regions with the most efficient grids are devel-oped regions and Asia, excluding India, since their losses are below or close to the world level. Other regions suffer losses of more than 10 percent and, in the case of Latin America and India, over 15 percent and 20 percent, respectively. However, in those regions a substantial part of the losses are in fact non-technical losses due to unpaid electricity (in India electric-ity theft and unpaid bills represent up to 20 percent of losses). If all grids were to perform as well as OECD Asia’s grid, 4 percent of electricity consumption would be saved (ie, 800 TWh).
Globally, the rates of losses are almost stable, but that stability is the result of two opposite trends. On the one hand, they have been decreasing since 1990 in developed countries due to power grid efficiency improvements achieved in several ways: the use of low-loss conductors and transformers, the standardization and upgrading of transmission and distribution voltages, and reactive power control. In North America, the losses amounted to 6 percent of the distributed volumes in 2009, compared with 9 percent in 1990. In OECD Asia and the EU, the reduction in T&D losses was smaller. On the other hand, losses have been increasing in developing countries. In the CIS and the Middle East, they rose from 9 percent to 12 percent in 2009, while they reached 23 percent in India. Latin America also faces a high and growing rate of T&D losses (17 percent in 2009).
Global report
7 The efficiency of gas combined cycle plants lies within a range of 50-60 percent, compared with 30-40 percent for conventional steam thermal power plants.
8 Penetration of gas combined cycle plants in terms of their share in the thermal power capacity.

Trends in global energy efficiency 2011 | Part II 27
0
5
10
15
20
25
%
1990 2009
CIS
Chi
na
Mid
dle
-Eas
t
Afri
ca
Indi
a
Oth
erA
sia
Wor
ld
Nor
thA
mer
ica
OE
CD
Asi
a
Latin
Am
eric
a
Eur
ope
Source: Enerdata
Figure 11: Trends in T&D losses
2.4 CO2 emissionsThe world’s CO2 emission factor (CO2 emission per kWh pro-duced) was about 500 gCO2 / kWh in 2009. Almost half of the countries have an emission factor below that level and half have an emission factor above that level (Figure 12). About 20 percent of countries produce electricity with an emission factor below 200 gCO2 / kWh and more than 10 percent of countries have a CO2 emission factor above 800 gCO2 / kWh.
Low CO2 emission factors are seen in countries with a large share of nuclear energy or hydroelectricity in their power mix. In France (75 percent of nuclear), Brazil (60 percent of hydroelec-tricity) or Nordic countries (nuclear and hydroelectricity), CO2 emissions per kWh produced are very low (<100 gCO2 / kWh).
On the contrary, high CO2 emission factors are recorded in countries with a large share of coal in their power mix (mainly in Asia, Africa and Eastern Europe).
The CO2 emission factor increased slightly over the 1990-2009 period (+0.3 percent / year). In fact, it decreased in developed countries thanks to the switch to low-carbon and carbon-free energies in the power generation mix, and increased in devel-oping countries due to the increasing use of coal (Indonesia, India, Brazil, etc.). If the energy efficiency of thermal power generation were 45 percent (average of the top 10 countries) in all regions, CO2 emissions per kWh produced would be reduced by about 20 percent (ie, 2.3 GtCO2).
Unit: gCO2/kWh
Less than 200
200 to 400
400 to 600
600 to 800
More than 60
No data
Source: Enerdata
Figure 12: CO2 emission factor in power generation (2009)

28 Part II | Trends in global energy efficiency 2011
3. Industry3.1 Global trendsAt world level, the share of electricity in industrial consumption increased from 20 percent in 1990 to 24 percent in 2009 (Figure 13). That share is higher in developed countries: in 2009 it was above 30 percent in Europe and North America, and above 25 percent in OECD Asia. In the Middle East, elec-tricity represented just 12 percent of industrial energy con-sumption in 2009, showing a slight increase since 1990.
Industrial electricity use is on the rise in all world regions. The largest increases were seen in emerging Asian countries, and primarily in China, where the share of electricity in industrial energy consumption soared from 10 percent to 20 percent. Over the period that share also grew substantially in Europe and OECD Asia (+7-8 points), while in North America it has remained relatively stable since 1990. At world level, as well as in Latin America, electricity accounted for 24 percent of indus-trial consumption in 2009 and has steadily increased by 5 points since 1990.
0
5
10
15
20
25
30
35
%
1990 2009
CIS
Chi
na
Mid
dle
-Eas
t
Afri
ca
Indi
a
Oth
erA
sia
Wor
ld
Nor
thA
mer
ica
OE
CD
Asi
a
Latin
Am
eric
a
Eur
ope
Source: Enerdata
Figure 13: Share of electricity in industrial consumption
The energy required per unit of value added (industrial intensity) has decreased in all regions since 1990. As a result of the globalization of industrial activities, energy intensity levels are converging. At world level, it fell by 1.6 percent / year between 1990 and 2009 (1 percent / year between 2000 and 2009).
Industrial energy intensity is lowest in Europe and OECD Asia, where it stands 40 percent below the world average (Figure 14). Since 1990, European industrial energy intensity has decreased by 2.5 percent / year, while North America and OECD Asia show reductions of around 1.5 percent / year over the period. Energy intensity is slightly higher in North America than in Europe and OECD Asia: it stands just 13 percent below the world average and 50 percent above the EU average.
0
0.05
0.1
0.15
0.2
0.25
0.3
0.35
0.4
koe/
$200
5ppp
1990 2000 20090.6
CIS
Chi
na
Mid
dle
-Eas
t
Afri
ca
Indi
a
Oth
erA
sia
Wor
ld
Nor
thA
mer
ica
OE
CD
Asi
a
Latin
Am
eric
a
Eur
ope
Source: Enerdata
Figure 14: Industrial energy intensity
The sharpest decreases over the period 1990-2008 were seen in countries with the highest levels of industrial energy intensity (Figure 15). In China and India, industrial energy intensity was reduced by 5.5 percent / year and 3.2 percent / year, respec-tively, between 1990 and 2008. However, despite large reduc-tions over the period, both countries still have above average industrial energy intensity levels: 20 percent higher in the case of India and 40 percent in the case of China. The CIS is cur-rently the world region with the highest industrial energy inten-sity (75 percent above the world average), despite the achieve-ment of a large reduction between 2000 and 2009 (5 percent / year). In the Middle East, industrial energy intensity remains among the lowest in the world and has decreased moderately since 1990 (0.3 percent / year).
The slowdown caused by the global economic crisis in 2009 had a strong impact on industrial energy intensity trends, especially in developed countries. In OECD countries, industrial energy intensity dropped significantly in 2009: the drop in energy consumption was much sharper than the reduction in industrial production, since energy-intensive industries were most severely hit; as a result, the average reduction in industrial intensity measured until 2008 was slower than over the period 1990-2009 (for instance, 0.8 percent / year between 1990 and 2008 for OECD Asia, compared with 1.4 percent / year over 1990-2009). Conversely, in other world regions, and primarily in China, India, the CIS and the Middle East, the economic crisis led to a smaller reduction in industrial energy intensity. In India, for instance, it fell by 3.2 percent / year between 1990 and 2008, compared with 3 percent / year when calculated until 2009. Energy consumption decreased to a lesser extent than industrial production.
Global report

Trends in global energy efficiency 2011 | Part II 29
-14%
-12%
-10%
-8%
-6%
-4%
-2%
0%
2%
4%
%/y
ear
1990-2008 2008-2009
CIS
Chi
na
Mid
dle
-Eas
t
Afri
ca
Indi
a
Oth
erA
sia
Wor
ld
Nor
thA
mer
ica
OE
CD
Asi
a
Latin
Am
eric
a
Eur
ope
Source: Enerdata
Figure 15: Trends in energy intensity of industry
Industrial cogeneration (CHP) covered around 6 percent of industrial electricity consumption in 2009, compared with around 8 percent in 1990 (Figure 16). This decreasing trend is strongly influenced by the trend in North America, since in 1990 that region represented more than half of the worldwide electricity production from industrial CHP and in 2009 one-third. A reverse trend was seen in all other regions. In Europe, the share of cogeneration increased by 7 points between 1990 and 2009 and reached 15 percent in 2009. Following this increase, the share in Europe is now larger than in North Ameri-ca, where CHP accounted for 14 percent of industrial con-sumption in 2009, compared with 18 percent in 1990. In OECD Asia, CHP represents just 5 percent, approximately, of indus-trial consumption, up slightly since 1990. In turn, a sharp rise was seen in Other Asia, where the share of CHP in industrial consumption increased from 3 percent to 8 percent between 1990 and 2009. In the CIS, the share of CHP is higher (10 percent in 2009) but has developed at a slower pace since 1990 (by 3 points).
0
2
4
6
8
10
12
14
16
18
20
%
1990
2009
CIS
Oth
erA
sia
Wor
ld
Nor
thA
mer
ica
OE
CD
Asi
a
Latin
Am
eric
a
Eur
ope
Source: Enerdata
Figure 16: Share of industrial cogeneration in industrial consumption
At world level, energy-intensive industries accounted for 55 percent of industrial consumption in 2009, up from 50 percent in 1990 (Figure 17). Steel absorbs 20 percent of industrial consumption while the non-metallic minerals (cement, glass, ceramics etc.) and chemical industries consume 15 percent each and the paper industry 5 percent.
The share of energy-intensive industries in industrial consump-tion is highest in OECD countries, the CIS and China, and stands below the world average in other developing countries. The large share of energy-intensive industries in China and the CIS partly explains the previously observed high industrial energy intensity. However, thanks to the use of more efficient technologies that is not the case in developed regions, which include the countries with the lowest industrial energy intensity.
Industrial energy intensity trends are influenced by energy productivity improvements in each individual branch (ie, steel, chemicals, non-metallic minerals), but also by changes in the structure of the industrial value added. Industrial activities have moved toward less energy-intensive branches (equipment, textiles etc.), which lowers energy intensity. In India, a decrease in the share of energy-intensive industries (from over 35 per-cent in 1990 to 30 percent in 2009) contributed to the increase in the country’s industrial energy productivity, in addition to energy efficiency improvements. In turn, an increasing share of energy-intensive industries in the CIS between 1990 and 2009 played its part in limiting the improvements in energy produc-tivity over the period.
0%10%20%30%40%50%60%70%80%90%
100%Other Paper Non metallic minerals Chemicals Steel
CIS
Chi
na
Mid
dle
-Eas
t
Afri
ca
Indi
a
Oth
erA
sia
Wor
ld
Nor
thA
mer
ica
OE
CD
Asi
a
Latin
Am
eric
a
Eur
ope
Source: Enerdata
Figure 17: Share of energy-intensive industries in industrial
consumption (1990 / 2008)

30 Part II | Trends in global energy efficiency 2011
3.2 Steel industry The steel industry is the main industrial energy consumer and the largest source of industrial CO2 emissions: it represents about 20 percent of global industrial energy consumption and 15 percent of industrial CO2 emissions from fuel combustion. Half of the world’s crude steel production is supplied by China, Japan and the United States.
The countries that showed the greatest reductions in their specific consumption between 1990 and 2008 were also the countries that made the greatest use of the electric process, since on average this process uses only half the energy required by the most widespread process, ie, the oxygen / blast furnace process9 (Figure 18). At world level, 38 percent of steel was produced through the electric process in 2008, up from 28 percent in 1990.
-5%
-4%
-3%
-2%
-1%
0%
1%
2%
%/y
ear
1990-2008 2000-2008
Chi
na
Turk
ey
Uni
ted
Sta
tes
Rus
sia
Eur
opea
nU
nion
Taiw
an
Ukr
aine
Japa
n
Bra
zil
Sou
thK
orea
Source: Enerdata
Figure 18: Trends in the specific energy consumption of the steel
industry10
TaiwanTurkey
Brazil
Ukraine
Japan
China
Russia
United StatesSouth Korea
0
0.1
0.2
0.3
0.4
0.5
0.6
0.7
0.8
0% 10% 20% 30% 40% 50% 60% 70% 80% 90% 100%
toe/
t
% electric steel
EuropeanUnion
Source: Enerdata
Figure 19: Specific energy consumption of steel industry (2009)
The countries with the largest share of electric steel (Europe, US, South Korea, Taiwan, Turkey) have the lowest energy
consumption per ton of steel produced (Figure 19). However, the diffusion of the electric process is not the only factor that has an impact on energy efficiency in the steel industry. For the same share of steel produced using the elec-tric process, specific consumption is 1.5 to 2 times higher in Russia, China, Ukraine and Brazil than in Japan. This lower energy performance can be explained by several factors, such as the use of outdated processes like open-hearth furnaces in Russia and Ukraine, or the use of small-sized plants and low-quality ore in China. Accordingly, the potential for further ener-gy and CO2 savings is still high. The energy consumption of the steel industry could be reduced by 40 percent if the main producing countries were to have the same energy efficiency as that achieved by the world’s best performer through its current mix of processes; about 60 percent of those energy savings would take place in China.
3.3 Chemical industryThe chemical industry is the second-largest industrial energy consumer, accounting for just over 14 percent of total industrial energy consumption11. In the United States the chemical industry is even the largest energy-intensive branch, with 25 percent of industrial consumption in 2009.
In 2009, the United States had the highest energy consump-tion per unit of value added among the world’s main producers of chemical products (Figure 20). Moreover, its energy inten-sity has increased by 0.8 percent / year since 1990, whereas it has decreased in the case of almost all other main producers. China’s energy intensity is also high, since coal-based produc-tion in China requires much more energy than natural gas-based production in other countries.
The largest decrease in the energy intensity of chemicals since 1990 (-4.8 percent / year) was seen in Mexico. In China, the sector’s energy intensity fell by 4.3 percent / year between 1990 and 2008. As a result of that large decrease, in 2008 China’s energy intensity, which in 1990 was the highest in the world, was 15 percent lower in the chemical industry than in the US. Other countries such as South Korea, Germany, France and the UK also saw substantial decreases in their energy intensity, whereas Iran and Spain posted a growth. Since the chemical industry is highly diverse it is difficult to link these energy intensity reductions to the spread of more effi-cient processes in particular and to genuine energy efficiency improvements; indeed, part of the energy intensity reduction may be explained by a change in the product mix, for instance from heavy chemicals to light chemicals.
Global report
9 According to the International Steel Industry Institute, two times less energy is required to produce one ton of steel using the electric process than when using the oxygen / blast furnace process
(0.2-0.3 tep / t compared with 0.5-0.7 tep / t).
10 1992-2008 for Ukraine. No data for India.
11 Excluding chemical feedstocks

Trends in global energy efficiency 2011 | Part II 31
0.0
0.1
0.2
0.3
0.4
0.5
0.6
koe/
$200
5pp
p
1990
2000
2008
Chi
na
US
A
Ger
man
y
Japa
n
Kor
ea Iran
Bra
zil
Mex
ico
Fran
ce UK
Spa
in
Italy
0.89
Source: Enerdata
Figure 20 : Energy intensity of chemical industry
3.4 Cement industryThe non-metallic minerals industry (cement, glass, ceramics etc.) is the third-largest industrial energy user, accounting for just under 14 percent of industrial energy consumption. The cement industry absorbs most of the energy consumption of the non-metallic minerals industry and, on average, represents around 70-80 percent of the branch’s consumption. China alone accounts for half of the energy consumption for cement production.
The energy efficiency of cement production strongly depends on the process used to produce the clinker, the main compo-nent in cement manufacturing12 (dry or wet), and the type of kiln. Indeed, the dry process avoids the need for water evapo-ration and is much less energy intensive than the wet process; whereas vertical shaft kilns are the most energy intensive, dry kilns with pre-heater and pre-calciner are the most efficient (Figure 21).
Figure 21: Unit consumption of clinker by technology / process used
Technology / process Unit consumption
Vertical shaft kilns 5 GJ / t (0.119 toe / t)
Wet kilns 5.8-6.7 GJ / t (0.139-0.160 toe / t)
Long dry process 4.5 GJ / t (0.107 toe / t)
Dry kiln (four stages pre-heater) 3.2 GJ / t (0.076 toe / t)
Dry kiln (six stages pre-heater and pre-calciner) 2.8 GJ / t (0.067 toe / t)
The most efficient technologies used to produce cement are found in Japan, Mexico and in European countries, whereas the technologies used in Asian and North American countries are less efficient. Vertical shaft kilns are used for almost half of the cement production in China, since while being more energy intensive, that technology is better suited to the smaller facto-ries found in the country.
Between 1990 and 2008, the average energy consumption per ton of cement produced decreased in the main producing countries, except in France, the US, Turkey and Russia (Figure 22). This can mainly be explained by the shift from wet to dry-process cement kilns and the replacement of older dry kilns by new ones using pre-heaters and pre-calciners. The largest drop in the specific energy consumption of the cement industry was seen in China, where the replacement of small cement plants by larger facilities has led to a 5 percent / year decrease since 1990. Although significant progress has been recorded in China, the country continues to have the highest energy savings potential. Indeed, if the main producing coun-tries were to have the same energy efficiency as the world’s best performer through the same clinker-to-cement ratio, the specific energy consumption of the cement industry would drop by 20 percent, with China accounting for about 80 per-cent of those savings.
-8%
-6%
-4%
-2%
0%
2%
4%
6%
%/Y
ear
1990-2008 2000-2008
Chin
a
Spai
n
Ger
man
y
UK
Kore
a
Italy
Japa
n
Braz
il
Mex
ico
Fran
ce
USA
Turk
ey
Source: Enerdata
Figure 22: Unit consumption trends in the cement industry for the main
producers13
12 Cement is produced by grinding clinker and additives such as ashes; on average, cement is made of between 80-90 percent of clinker.
13 Energy intensity trends for the United States, Japan, South Korea and Mexico. No data for India.
Source: International Energy Agency

32 Part II | Trends in global energy efficiency 2011
3.5 Paper industryThe paper industry accounts for 6 percent of global industrial energy consumption. The consumption is mainly used to produce steam. The world’s largest producers are the United States, with more than 30 percent of the branch’s consump-tion, Japan, the European Union, China and Canada.
The efficiency of the paper industry is primarily related to the technical age of production facilities. In the United States, aging pulp and paper mills lead to a high specific consumption that exceeds the average level of the main producers. Other factors are the share of imported pulp, the process used to manufacture the pulp and the share of recycled paper. The specific energy consumption is higher in pulp exporting coun-tries. In Canada, the widespread use of mechanical pulping, ie, the process with the highest specific energy consumption per ton produced, combined with aging facilities, leads to a high ratio. The mechanical process is used for less than 10 percent of the world’s pulp production. A high use of recycled paper can also improve the industry’s specific consumption. South Korea and Turkey are among the main producers with the lowest energy consumption per ton of paper.
Between 1990 and 2008, the energy consumption per ton of paper decreased in all the world’s main producing countries except Brazil (Figure 23). The largest reduction was seen in China, where specific consumption has decreased by more than 4 percent / year since 1990. In Mexico and South Korea energy consumption per ton of paper also decreased sharply over the period (by 4 percent / year and 3 percent / year, respectively). Moderate reductions took place in the European Union and Japan (less than 1 percent / year). In turn, in the Unites States, which is the largest producer, specific consump-tion has surged by 6 percent / year since 1990.
0.0
0.2
0.4
0.6
0.8
1.0
1.2
toe/
t
1990 2000 2008
Bra
zil
Can
ada
Uni
ted
Sta
tes
Eur
opea
nU
nion
Japa
n
Chi
na
Mex
ico
Sou
thK
orea
Turk
ey
Source: Enerdata
Figure 23: Trends in energy consumption per ton of paper
3.6 Aluminum industryAluminum production is made up of primary aluminum produc-tion and recycling. Primary aluminum production is 20 times more energy intensive than recycling. The world’s main produc-ers are China, Russia, North America, Australia and Brazil, which together account for about 60 percent of global production.
The primary production of aluminum requires large amounts of electricity for aluminum smelting, while alumina plants use steam energy, with combined heat and power production in modern facilities. Two main types of smelters are used: the Hall-Héroult system with pre-baked anodes (10 percent of the market), the energy efficiency of which is relatively high (elec-tricity consumption ranging between 13–16.5 MWh / t); and the older Søderberg cell with in-situ baked electrodes (70 percent of the market), the electricity consumption of which ranges from 15 MWh / t to 18 MWh / t.
The specific electricity consumption for primary aluminum production varies on a narrow range among world regions, from 14.5 MWh / t to 15.7 MWh / t in 2009 (Figure 24). It is lower in the Pacific Islands (Australia), where it stands 5 per-cent below the world average, in Africa, where new facilities have been implemented, and in Asia. Specific consumption is 1-3 percent higher than the world average in the United States, Canada and Latin America, although the highest rates are seen in Europe. Accordingly, the electricity savings potential in primary aluminum production is limited.
At world level, specific electricity consumption for primary aluminum production has decreased by 5 percent since 1990. That downward trend was seen in all world regions, with sharp drops in Asia and North America. The reductions were most limited in Europe and Latin America.
13
13.5
14
14.5
15
15.5
16
16.5
17
MW
h/t
1990 2000 2009
Pac
ific
Afri
ca
Asi
a
Wor
ld
Nor
th A
mer
ica
Sou
th A
mer
ica
Eur
ope
Source: International Aluminium Institute (2010)
Figure 24: Specific electricity consumption for primary aluminum
Global report

Trends in global energy efficiency 2011 | Part II 33
According to the International Energy Agency, since the current best practice, ie, that of Hall-Héroult electrolysis cells, is esti-mated at 12.9–13 MWh / t of aluminum, the global potential for electricity efficiency improvements using the current technol-ogy is estimated at 15 percent. Over time, electrolysis process designs using aluminum chloride or carbothermic processes could become the most energy-efficient way to produce pri-mary aluminum.
4. ConclusionOver the last 20 years significant progress has been recorded in terms of energy efficiency. At world level, the energy required per unit of GDP (the energy intensity) has been decreasing by 1.4 percent per year since 1990. Improvements were achieved in all regions, with the largest reductions found in the regions with the highest energy intensities (China, CIS and India). That in turn impacted CO2 emissions from energy combustion, which on a global level have decreased at the same pace as energy intensity. Industry and power generation accounted for almost half of that reduction (about 30 percent and 15 percent, respectively).
At world level, the energy efficiency of thermal power plants has improved by 3 percentage points since 1990 thanks to a widespread switch to gas combined cycle technology. How-ever, strong disparities still exist between developed countries, where thermal power plants are very efficient (up to 49 percent for Spain, the best performer), and developing countries, where efficiency is low due to aging plants and the large share of coal in thermal generation (particularly in China and India). Power grid efficiency improvements led to a reduction in the rate of transmission and distribution losses in developed coun-tries thanks to the use of low-loss conductors and transform-ers, the standardization and upgrading of transmission and distribution voltages, and reactive power control. However, those technologies are still poorly implemented in developing countries.
The energy required per unit of industrial value added has been decreasing in all regions; as a result of the globalization of industrial activities, energy intensity levels are converging. The global economic crisis in 2009 had a strong impact on indus-trial energy intensity trends, especially in developed countries, since energy-intensive industries were severely hit.
In the steel industry, which is the main industrial energy con-sumer, significant progress has been made over the last 20 years thanks to the spread of the electric process. However, the main producers still use outdated processes like open-hearth furnaces (Russia and Ukraine) or small-sized plants and low quality ore (China).
In the chemical industry, the energy consumption per unit of value added decreased in all main producing countries except in the United States, which is the world’s main producer of chemical products and also the country with the highest ener-gy intensity.
The spread of dry processes and kilns using pre-heaters and pre-calciners led to reductions in the average energy con-sumption per ton of cement (specific energy consumption) in several large producing countries. The sharpest drop in spe-cific energy consumption was achieved in China, thanks to the replacement of small cement plants by larger facilities.
Nevertheless, a great deal still remains to be done, as shown by the significant energy savings potentials identified in this study. In the power sector, the improvement of power genera-tion efficiency could reduce fossil fuel consumption for power generation by 30 percent, and power grid efficiency improve-ments could reduce global electricity consumption by 4 per-cent. In industry, the energy efficiency improvement potential is 40 percent in the case of steel, 20 percent for cement and 15 percent for aluminum; potentials in the chemical and paper industries are also high.

34 China | Country reports
ChinaEnergy efficiency report
Objectives:
– 17% reduction in energy intensity by 2015 is being considered
Overview 2009 2000-2009 (% / year)
Primary intensity (EU=100)1 242 -- -1.3% -CO2 intensity (EU=100) 306 -- -1.0% --CO2 emissions per capita (in tCO2 / cap) 5 ++ 8.3% --Power generation 2009 2000-2009 (% / year)Efficiency of thermal power plants (in %) 32 - 0.5% +Rate of electricity T&D losses (in %) 6.2 + -2.2% +CO2 emissions per kWh generated (in gCO2 / kWh) 842 -- -0.7% -Industry 2009* 2000-2009* (% / year)Energy intensity (EU=100) 234 -- -0.5% --Share of industrial CHP in industry consumption (in %) - -Unit consumption of steel (in toe / t) 0.46 - -3.8% ++*2008 and 2000-2008 for steel
1 The European Union, as the best-performing region, is used as the benchmark.
Latest update: January 2011
++ Among best countries + Better than the EU average - Below the EU average -- Among countries with lowest performances

Country reports | China 35
1. Overview1.1. Policies: a 17% reduction in energy intensity by 2015 is being consideredChina has made energy efficiency and conservation its highest priority energy strategy. Since issuing the medium- and long-term plan for energy conservation in 2004, several important high-level approaches have been taken to put China on a less energy-intensive development path.
Several types of policy measures have been implemented to promote energy efficiency and conservation: energy efficiency labels, minimum efficiency standards, financial incentives, pricing and government procurement. Financial tools include direct funding of energy efficiency projects in industry and buildings, subsidized loans and loan and credit guarantees. 1.2. Energy consumption trends: sharp increase since 2002China’s energy consumption per capita is high compared with non-OECD countries: 1.7 toe versus 1.2 toe for non-OECD countries. However, Chinese energy consumption per capita is close to the world average (1.8 toe).
Total energy consumption increased by 2.3 percent / year between 1990 and 2002. Ever since 2002 it has increased at a rate of over 10 percent / year. Final consumption followed the same trend as total energy consumption, although it increased at a slower rate per year. This very rapid growth was mainly driven by energy consumption in the industrial sector.
Coal plays an important role in meeting the country’s energy demand, accounting for 68 percent of consumption in 2009, and its market share is increasing (it was 58 percent in 2000). The market share of oil is decreasing (17 percent in 2009 compared with 20 percent in 2000). In 2009 gas, which is increasing, accounted for just 3 percent of consumption.
Source: Enerdata
60
560
1060
1560
2060
2560
Mto
e1990 1995 2000 2005 2009
Primary consumption
Final consumption
Figure 1: Total and final energy consumption trends
While the share of energy consumption by industry is steady at the world level and is decreasing in developed countries, it is increasing significantly in China: from 45 percent in 1990 to around 60 percent in 2009. The households, services and agriculture sectors absorbed more than 50 percent of con-sumption in 1990 and 31 percent in 2009. Transport currently accounts for 10 percent compared with 5 percent in 1990 (threefold increase in the number of cars per capita).
Source: Enerdata
0%
20%
40%
60%
80%
100%
1990 2000 2005 2009
Households - Services -Agriculture
Transport
Industry (including non energy uses)
Figure 2: Distribution of final energy consumption by sector
The country’s electricity consumption per capita is 60 percent higher than the average of non-OECD countries (2,400 kWh in 2009, compared with 1,450 kWh in non-OECD countries) and is still less than half that of the OECD countries. Total electricity consumption is increasing very rapidly: by 8 percent / year between 1990-2000 and by 12 percent / year during the 2000s.

36 China | Country reports
ChinaEnergy efficiency report
Electricity represents 16 percent of final energy consumption, with an increasing market share (6 percent in 1990 and 10 percent in 2000). The industrial sector consumes about 70 percent of the electricity used in the country.
Source: Enerdata
0
500
1000
1500
2000
2500
3000
3500
Industry Others
TWh
1990 1995 2000 2005 2009
Figure 3: Electricity consumption trends by sector
1.3. Energy efficiency and CO2 trends: very high energy intensities with intensive use of carbon-based energyTotal energy consumption per unit of GDP (primary energy intensity), measured at purchasing power parity, is about 20 percent higher than the average in non-OECD countries and about twice as high as in OECD countries.
Total energy intensity decreased at a very rapid rate of 4.6 percent / year between 1990 and 2009. That rapid trend, which is among the top 10 performances at world level, has to be related to the high energy intensity that prevailed in the 1990s. Since 2000, Chinese total energy intensity has decreased slowly (1.3 percent / year). The reduction in final energy inten-sity (final energy consumption per unit of GDP) was even faster; the difference is explained by increasing losses in power gen-eration due to the fact that electricity is produced predominantly.
CO2 emissions per unit of GDP (CO2 intensity) decreased at a slower pace than the total energy intensity because of the increasing market share of coal (about 20 percent less between 1990 and 2009).
Source: Enerdata
-6.0%
-5.0%
-4.0%
-3.0%
-2.0%
-1.0%
0.0%
1990-2009 2000-2009
%/y
ear
Primary energy intensity
Final energy intensity
CO2 intensity
Figure 4: Energy and CO2 intensity trends
2. Power generation2.1. Policies: 15% renewables by 2020 The previous policy focused on shutting down small and aging plants. Starting in early 2007, the National Development and Reform Commission (NDRC) issued orders to retire small and inefficient power plants: a total of 50 GW of small, inefficient power plants were required to be shut down in 2010. The objectives for the next five-year plan have not been announced yet.
Renewables should play a growing role in the production of electricity, since by 2020 China plans to have invested RMB 1,200 billion (US$180 billion) mainly in solar, wind, hydropower and biomass technologies. China aims for renewables to account for at least 15 percent of the country’s primary energy consumption in 2020.
2.2. Power generation trends by source: domination of coal China has one of the world’s largest shares of electricity pro-duction from coal: in 2009, 80 percent of electricity was gener-ated from coal, while hydroelectricity accounted for 15 percent and nuclear and wind power for around 2 percent and 1 per-cent of total power generation, respectively. Thus, CO2-free electricity generation accounted for 18 percent of total power generation. That share has seen a slight decrease since 1990 when it was around 20 percent.

Country reports | China 37
Source: Enerdata
0
500
1000
1500
2000
2500
3000
3500
4000
1990 2000 2009
TWh
Other*
Wind
Hydro
Nuclear
Gas
Oil
Coal-Lignite
*Including biomass, geothermal and solar
Figure 5: Power generation by source
2.3. Efficiency of the power sector: standard efficiency rates The efficiency of power generation is low compared to interna-tional standards. The average efficiency of thermal power generation was just 32 percent in 2009, which is 8 percentage points lower than the OECD average. Nevertheless, average efficiency has increased since 1998. That trend is driven by the rise in new thermal power plants, which are more efficient, combined with the closure of small and inefficient plants.
Source: Enerdata
25
27
29
31
33
35
37
%
1990 1995 2000 2005 2009
Total power generation
Thermal power plants
Figure 6: Efficiency of power generation and thermal power plants
Source: Enerdata
0
100
200
300
400
500
600
700
GW
Steam
1990 1995 2000 2005 2009
Figure 7: Thermal electricity capacity, by technology
The rate of T&D losses in the Chinese grid is just above 6 percent of the distributed volumes, which is below the world average (9 percent). Those losses have decreased slightly over time (7.5 percent in 1990).
Source: Enerdata
3
4
5
6
7
8
9
10
1990 1995 2000 2005 2009
%
Figure 8: Electric T&D losses
The average CO2 emission factor for power generation is 36 percent higher than in non-OECD countries, at 840 gCO2 / kWh in 2009. It has fallen by about 13 percent since 1990.

38 China | Country reports
ChinaEnergy efficiency report
Source: Enerdata
300
400
500
600
700
800
900
1000
1100
1990 1995 2000 2005 2009
gCO
2 /
kWh
Figure 9: CO2 emission factor for power generation
3. Industry3.1. Policies: measures for largest enterprises The most significant energy efficiency program in industry is called Top-1,000 Energy-Consuming Enterprises. Within the framework of this program, the designated enterprises are required to appoint energy managers; measure and report on energy consumption; prepare energy conservation plans; and reach energy consumption reduction targets. These 1,000 enterprises represent about one third of the county’s total consumption and about half of the industrial demand.
In 2007, the National Development and Reform Commission (NDRC) issued orders to retire small and inefficient plants in various industrial sub-sectors. It also announced measures to decrease the nation’s kiln and boiler consumption of coal by 70 million tons: the selection of high-quality coal; the renovation of medium-sized and small boilers and kilns with advanced tech-niques such as circulating fluidized bed (CFB) and pulverized coal firing; and the establishment of a scientific management and operation system.
3.2. Energy consumption trends: sharp increase in consumptionEnergy consumption in industry increased at the steady rate of 2 percent / year between 1990 and 2000. From 2000 to 2009 it then increased at the very rapid pace of 11 percent / year, ie, almost twice as fast as the average of non-OECD countries. Contrary to most countries, the global economic crisis did not cause the sector’s energy consumption to fall.
Source: Enerdata
20
120
220
320
420
520
620
720
820
920
1990 1995 2000 2005 2009
Mto
e
Figure 10: Industrial energy consumption
The share of electricity in industrial energy consumption has increased since 1990 and in 2009 reached 22 percent of the total (compared with 11 percent in 1990). The use of coal and lignite in industry has more than doubled since 1990; however, its share in total energy consumption is decreasing (from 80 percent in 1990 to 69 percent in 2009).
The share of energy-intensive industries in the overall energy consumption of industry has increased since 1990 due to the massive development of new infrastructure. The steel indus-try’s share of energy consumption in particular has increased steadily and now stands at around 35 percent. The share of the chemical industry has declined slightly, while the non-metallic minerals (cement, ceramics, etc.) and paper industries have maintained their shares of energy consumption over the period.
Source: Enerdata
0%
10%
20%
30%
40%
50%
60%
70%
80%
90%
100%
1990 2000 2005 2009
Heat
Electricity
Gas
Oil
Coal/Lignite
Figure 11: Energy consumption of industry, by source

Country reports | China 39
Source: Enerdata
0%
10%
20%
30%
40%
50%
60%
70%
80%
90%
100%
Other
Paper
Non metallic minerals
Chemical
Steel
1990 2000 2005 2008
Figure 12: Energy consumption of industry, by branch
3.3. Energy intensity trends: a very rapid reductionOver the period 1990-2008, the reduction in the consumption per unit of industrial value added (energy intensity) was very high and on average reached 5.5 percent / year, which is twice as high as the average for non-OECD countries. The largest energy efficiency improvement took place in the cement indus-try with a reduction of 5 percent / year, followed by the chemi-cal industries (-4 percent / year). Over the period the energy consumption per tonne of steel also decreased significantly, by almost 3 percent / year.
Source: Enerdata
-6.0%
-5.0%
-4.0%
-3.0%
-2.0%
-1.0%
0.0%
1.0%
%/y
ear
Total*
Steel
Chemical
Cement
Paper
Total*
Steel
Chemical
Cement**
Paper
1990-2008 2000-2008
*Including construction and mining
**Non metallic minerals
Figure 13: Trends in the energy intensity of industrial branches

40 United States | Country reports
United States Energy efficiency report
Objectives:
– 200 TWh in energy savings by 2025
Overview 2009 2000-2009 (% / year)
Primary intensity (EU=100)1 140 -- -2.1% +CO2 intensity (EU=100) 156 -- -2.4% +CO2 emissions per capita (in tCO2 / cap) 16.7 -- -1.7% ++Power generation 2009 2000-2009 (% / year)Efficiency of thermal power plants (in %) 39 - 0.5% +Rate of electricity T&D losses (in %) 6 + 0.1% --CO2 emissions per kWh generated (in gCO2 / kWh) 508 -- -1.2% -Industry 2009* 2000-2009* (% / year)Energy intensity (EU=100) 137 - -1.7% -Share of industrial CHP in industry consumption (in %) 17 - 1.1% -Unit consumption of steel (in toe / t) 0.39 + -2.4% +*2008 and 2000-2008 for steel
++ Among best countries + Better than the EU average - Below the EU average -- Among countries with lowest performances
1 The European Union, as the best-performing region, is used as the benchmark.
Latest update: January 2011

Country reports | United States 41
1. Overview1.1. Policies: energy efficiency policies gaining momentumIn 2002-2003 the government took an extensive set of mea-sures aimed at improving the energy efficiency of electrical appliances. Under the Global Climate Change Initiative (2002), the United States targets an 18 percent reduction in green-house gas intensity (ratio of greenhouse gas emissions to economic output) by 2012. The energy efficiency program includes tax incentives for renewable energy, cogeneration and new technology; voluntary agreements with the business community; comprehensive transportation programs; and new efficiency standards for domestic appliances. The Energy Independence and Security Act (2005) also targeted lighting and energy efficiency in construction and created an Office of High-Performance Green Buildings. In 2006, the EPA initiated the National Action Plan for Energy Efficiency (NAPEE), a private-public program, targeting energy savings of 200 TWh by 2025.
Tax incentives are a privileged instrument; the existing house-hold energy efficiency tax credits were reinforced by the Ameri-can Recovery and Reinvestment Act (2009). The ARRA allo-cated a total of 2.7 billion dollars to the Energy Efficiency and Conservation Block Grant (EECBG) program, which will fund the development of energy efficiency programs by local gov-ernments and states. In a growing number of states, energy demand reduction targets are linked to markets for energy savings certificates (“Energy Efficiency Portfolio Standards” or white certificates).
1.2. Energy consumption trends: high consumption offer-ing energy efficiency marginsUS energy consumption is 7 toe per capita, which is 60 per-cent higher than the average of OECD countries (4.3 toe / cap). In 2009 China overtook the United States as the world’s largest energy consumer. US primary energy consumption grew by 1.7 percent / year between 1990 and 2000 and then stagnated until 2007. It has been decreasing since then (by 2.3 percent in 2008 and by 5 percent in 2009).
Source: Enerdata
0
500
1000
1500
2000
2500
1990 1995 2000 2005 2009M
toe
Primary consumption
Final consumption
Figure 1: Total and final energy consumption trends
The fuel mix has remained roughly stable since 1990. Oil (37 percent in 2009) is the main energy source, followed by gas (25 percent) and coal (22 percent). Hydro and nuclear electricity accounted for 12 percent and biomass for 4 percent. Transport is the main energy-consuming sector (40 percent of end-user consumption), followed by the households, services and agriculture sector (34 percent). The share of industry – includ-ing non-energy uses – in final consumption is declining (from 23 percent in 1990 to 18 percent in 2009).
Source: Enerdata
0%
20%
40%
60%
80%
100%
1990 2000 2005 2009
Households - Services -Agriculture
Transport
Industry (including non energy uses)
Figure 2: Distribution of final energy consumption by sector
Electricity consumption per capita is three times higher than the OECD average (7,600 kWh in 2009). The share of electricity in final consumption rose from 18 percent in 1990 to 21 per-cent in 2009.
Electricity consumption increased strongly between 1990 and 2000, by 2.8 percent / year, and then slowed down until 2008

42 United States | Country reports
(1.1 percent / year). In 2009 it decreased by 4 percent, to 3,740 TWh, as a result of the economic crisis.
Source: Enerdata
0
500
1000
1500
2000
2500
3000
3500
4000
4500
TWh
Industry Others
1990 1995 2000 2005 2009
Figure 3: Electricity consumption trends by sector
The electricity demand of the industrial sector increased by 2.8 percent / year over the period 1990-2000, but has been decreasing since then (-2.7 percent between 2000 and 2008, and -13 percent in 2009). Consequently, the share of the industrial sector in electricity consumption dropped from 32 percent in 1990 to 21 percent in 2009. Electricity consumption grew rapidly in the households and services sectors: their market shares accounted for 37 percent and 41 percent, respectively, in 2009. Indeed, the US’s switch to a service economy led to a rapid growth in the power consumption of this sector (3.1 percent / year since 1990).
1.3. Energy efficiency and CO2 trends: noticeable progressUS total energy consumption per unit of GDP (primary energy intensity, measured at purchasing power parity) was 20 percent higher than the OECD average in 2009. However, it decreased by 1.8 percent / year between 1990 and 2009. Final energy intensity has evolved at a similar pace as total energy con-sumption per unit of GDP. This rapid decrease in energy inten-sity contributed to most of the reduction (about 90 percent) in CO2 intensity (CO2 emissions per unit of GDP), which dropped by 2.1 percent between 1990 and 2009
Source: Enerdata
-3.0%
-2.5%
-2.0%
-1.5%
-1.0%
-0.5%
0.0%
1990-2009 2000-2009
%/y
ear
Primary energy intensity
Final energy intensity
CO2 intensity
Figure 4: Energy and CO2 intensity trends
2. Power generation2.1. Policies: tax credits and renewable energy thresholdsThe use of renewable energies should increase substantially, since the target set at the federal level is for renewables to account for 20 percent of power production by 2020. At the state level, 33 states adopted Renewable Portfolio Standards (RPS) or voluntary goals, which require electricity providers to generate minimum percentages of their power from renewable energy sources. California and Maine have set ambitious targets (33 percent by 2030 and 40 percent by 2017, respec-tively). The RPS requirement is linked to a system of tradable renewable energy credits (RECs). The use of solar PV in build-ings is being encouraged. An example is the Californian Solar Initiative, which involves the construction by 2015 of 3 GW of solar energy.
The American Recovery and Reinvestment Act of 2009 pro-moted a Production Tax Credit (PTC), a federal incentive that provides tax credits proportional to the amount of renewable generation; and the Investment Tax Credit (ITC), which grants a 30 percent investment tax credit for installations under con-struction in 2009-2010 and operational before 2013-2017. In 2008, Congress authorized loans amounting to 10 billion dollars for renewable and / or energy efficient systems; 6 billion dollars for retrofitted coal-based power facilities using CCS; and 2 billion dollars for advanced coal gasification. The DOE’s FutureGen program proposes federal funding to demonstrate CCS technologies.
2.2. Power generation trends by source: stable CO2-free generationIn 2009, power generation amounted to 4,200 TWh. Power production is mainly thermal (around 70 percent). The share of coal in total power production decreased from 53 percent in
United States Energy efficiency report

Country reports | United States 43
1990 to 45 percent in 2009, to the benefit of gas, which saw its market share almost double; gas now accounts for 23 percent, compared with 12 percent in 1990.
Source: Enerdata
0
500
1000
1500
2000
2500
3000
3500
4000
4500
1990 2000 2009
TWh
Other*
Wind
Hydro
Nuclear
Gas
Oil
Coal-Lignite
*Including biomass, geothermal and solar
Figure 5: Power generation by source
The share of carbon-free energies has remained stable since 1990, at around 29 percent of power generation (2009), with nuclear power accounting for 20 percent of that amount (stable since 1990). The share of hydroelectricity has decreased slightly (7 percent compared with 9 percent in 1990) to the benefit of wind (1.7 percent).
2.3. Efficiency of the power sector: gas technology brings improvements The average efficiency of the electricity sector has been increasing since 2000 (+0.5 percent / year) and in 2009 reached 40 percent. This improvement is linked to fuel substi-tutions in the power mix between 2000 and 2009: power generation from renewables soared (+18 percent), while pro-duction from gas grew by 50 percent. The increasing share of gas in thermal power generation helped raise the average efficiency of thermal power plants from 36 percent in 2001 to 39 percent in 2009. Indeed, since 2000 additional thermal capacities have consisted of combined-cycle power plants, which have a higher efficiency than steam turbines: the share of CCGTs in the overall thermal capacity rose from 9 percent in 2000 to 28 percent in 2009.
Source: Enerdata
Total power generation
Thermal power plants
30
32
34
36
38
40
42
%
1990 1995 2000 2005 2009
Figure 6: Efficiency of power generation and thermal power plants
Source: Enerdata
0
100
200
300
400
500
600
700
800
900
1000
GW
1990 1995 2000 2005 2009
Steam Gas turbines Combined cycles
Figure 7: Thermal electricity capacity, by technology
The rate of electricity transmission and distribution losses in the USA is low (6 percent compared with 6,6 percent on aver-age for the OECD countries) and decreased significantly between 1990 and 2000, from 10 percent to 4.6 percent.

44 United States | Country reports
Source: Enerdata
%
1990 1995 2000 2005 20093
4
5
6
7
8
9
10
Figure 8: Electric T&D losses
The average emission factor for power generation is high (500 gCO2 / kWh), which is explained by the share of fossil fuels and, in particularly, of coal in power generation. It remained stable between 1990 and 2000, but has fallen since then (by 10 percent between 2000 and 2009). That general improvement is linked to a slight increase in nuclear power production (+0.4 percent / year between 2000 and 2009) and, especially, to the expansion of CCGT power generation and renewable energy sources.
Source: Enerdata
400
450
500
550
600
650
700
gCO
2 /
kWh
1990 1995 2000 2005 2009
Figure 9: CO2 emission factor for power generation
3. Industry3.1. Policies: energy audits and voluntary agreements as the key industrial policyThe USA promotes energy efficiency in industry through R&D programs, notably the Industrial Technologies Program, which was launched in 1999 to develop innovative technologies. In addition, the DOE created 26 Industrial Assessment Centers
(IACs) to lead energy efficiency audits in small- and medium-sized industries.
The EPA promotes voluntary agreements, such as “Climate Savers” (2000). In 2007 the “Climate Leaders” initiative (2002) was reinforced through the “Save Energy Now” campaign, targeting a 25 percent reduction in energy intensity by 2020.As part of the National Energy Policy, the Green Power Partner-ship and the Combined Heat and Power Partnership (2001) aim to promote the use of renewable sources and CHP in the industrial sector.
3.2. Energy consumption trends: growing share of energy-intensive industriesAfter a fall caused by the economic crisis in 1993, industrial energy consumption rose by 4.7 percent / year until 2000. However, it has been declining since then (by 2.9 per-cent / year) and in 2009 alone fell by 12 percent.
Source: Enerdata
0
50
100
150
200
250
300
350
400
Mto
e
1990 1995 2000 2005 2009
Figure 10: Industrial energy consumption
The share of electricity in industrial energy consumption increased between 1990 and 1994 (from 25 percent to 35 percent of energy consumption) and has been declining since then, reaching 26 percent in 2009. The share of gas remained stable at about 40 percent over the 1990-2009 period. Coal and oil consumption in the industrial sector has gradually fallen since 1990, accounting for 10 percent and 9 percent, respec-tively, in 2009; biomass has developed and quadrupled its share in industrial energy consumption, reaching 12 percent in 2009.
The share of energy-intensive industries in the overall energy consumption of industry was 63 percent in 2009, compared with 57 percent in 1990. The share of the non-metallic minerals industry (cement) in industrial energy consumption has increased slightly over the last decades, from 7 percent to 9
United States Energy efficiency report

Country reports | United States 45
percent in 2009, while the share of the steel industry fell from 13 percent to 9 percent. The share of the chemical industry in energy consumption oscillated between 20 percent and 30 percent between 1990 and 2006, when it stabilized around 26 percent.
Source: Enerdata
0%
10%
20%
30%
40%
50%
60%
70%
80%
90%
100%
1990 2000 2005 2009
Heat
Electricity
Biomass
Gas
Oil
Coal/Lignite
Figure 11: Energy consumption of industry, by source
Source: Enerdata
Other
Paper
Non metallic minerals
Chemical
Steel
1990 2000 2005 2008
0%
10%
20%
30%
40%
50%
60%
70%
80%
90%
100%
Figure 12: Energy consumption of industry, by branch
3.3. Energy intensity trends: deterioration in energy-inten-sive industriesThe energy intensity of industry dropped slightly between 1990 and 2008, by 1.4 percent / year. Energy consumption per tonne of steel decreased by 2.1 percent / year but this improvement was counterbalanced by the increase in the energy consump-tion per unit of production in the other energy-intensive sec-tors. Indeed, energy intensity rose between 1990 and 2009: by 0.8 percent / year in the chemical and paper sectors and by 1.7 percent / year in the non-metallic minerals industry. Between 2000 and 2008, the energy intensity of the chemical sector dropped by 1.3 percent / year, contributing to the decrease in
the overall energy intensity of industry, despite the sharp increase in the energy intensity of the non-metallic minerals sector (+5.4 percent / year).
Source: Enerdata
-3.0%
-2.0%
-1.0%
0.0%
1.0%
2.0%
3.0%
4.0%
5.0%
6.0%
%/y
ear 1990-2008 2000-2008
Total*
Steel
Chemical
Cement**
Paper
*Including construction and mining
**Non metallic minerals
Figure 13: Trends in the energy intensity of industrial branches
Industrial CHP accounts for about 16 percent of the electricity consumption of the industrial sector.
Source: Enerdata
5%
7%
9%
11%
13%
15%
17%
19%
2009200820072006200520042003200220012000
Figure 14: Share of industrial CHP in industrial consumption

46 India | Country reports
IndiaEnergy efficiency report
Objectives:
– 5% of savings in energy consumption by 2015
Overview 2009 2000-2009 (% / year)
Primary intensity (EU=100)1 164 -- -2.9% ++CO2 intensity (EU=100) 181 -- -1.2% --
CO2 emissions per capita (in tCO2 / cap) 1.4 ++ 4.5% --Power generation 2009 2000-2009 (% / year)Efficiency of thermal power plants (in %) 27 -- 0.2% -Rate of electricity T&D losses (in %) 23 -- -2.8% +CO2 emissions per kWh generated (in gCO2 / kWh) 963 -- 0.5% --Industry 2009* 2000-2009* (% / year)Energy intensity (EU=100) 192 -- -3.3% ++Unit consumption of steel (in toe / t) 0.39 - -5.1% ++*2008 and 2000-2008 for steel
++ Among best countries + Better than the EU average1 - Below the EU average1 -- Among countries with lowest performances
1 The European Union, as the best-performing region, is used as the benchmark.
Latest update: January 2011

Country reports | India 47
1. Overview1.1. Policies: 5% reduction in energy consumption by 2015In 2001 Parliament adopted a law on energy efficiency, known as the Energy Conservation Act. This law came into force in March 2002. It required large energy consumers to implement specific actions and introduced energy consumption labels and performance standards for electrical appliances. The Bureau of Energy Efficiency was created to implement those provisions.
Within the National Action Plan on Climate Change (NAPCC) adopted in 2008, a National Mission for EnhancedEnergy Efficiency was launched with several targets for 2014-2015: annual fuel savings of at least 23 Mtoe, a cumulative avoided electricity capacity addition of 19,000 MW and a CO2 emission mitigation of 98 Mt.
1.2. Energy consumption trends: surge driven by electricity demandTotal energy consumption per capita remains very low. In 2009, it reached 0.6 toe, compared with 1.8 toe on average for the world and around 1 toe for non-OECD countries.
Primary energy consumption has been increasing rapidly since 1990 (4 percent / year), with a growth rate of over 5 per-cent / year since 2005. The global economic downturn in 2009 did not affect this rapid pace. Final energy consumption has grown at a rate of 3.5 percent / year since the year 2000.
Coal is the country’s top energy source with 42 percent of primary energy consumption in 2009, followed by biomass (26 percent). Oil products covered 23 percent of the country’s needs, gas accounted for 7 percent, and nuclear and hydro electricity reached 2 percent in 2009.
Source: Enerdata
60
160
260
360
460
560
660
760
1990 1995 2000 2005 2009
Mto
e
Primary consumption
Final consumption
Figure 1: Total and final energy consumption trends
The households, services and agriculture sector represents nearly 50 percent of final consumption. Industry consumes 40 percent of final consumption while transport accounts for 10 percent. Excluding biomass, transport accounts for 17 percent and industry for 50 percent.
Source: Enerdata
0%
10%
20%
30%
40%
50%
60%
70%
80%
90%
100%
1990 2000 2005 2009
Households - Services -Agriculture
Transport
Industry (including non energy uses)
Figure 2: Distribution of final energy consumption by sector
Electricity consumption per capita is very low: 560 kWh in 2009, compared with an average of about 1,400 kWh in non-OECD countries. The share of electricity in final energy con-sumption is developing over time and reached 12 percent in 2009 (7 percent in 1990). Electricity consumption has increased by more than 6 percent / year since 2000, ie, more rapidly than total energy consumption. Industry accounts for 45 percent of total electricity consumption. Compared with other countries the share of agriculture in electricity consump-tion is high (20 percent), which is explained by the heavily subsidized rates, while the share of households is 22 percent. The household electrification rate is 61 percent and 84 percent of villages are electrified (2009).

48 India | Country reports
IndiaEnergy efficiency report
Source: Enerdata
0
100
200
300
400
500
600
700
Industry Others
1990 1995 2000 2005 2009
TWh
Figure 3: Electricity consumption trends by sector
1.3. Energy efficiency and CO2 trends: large reduction in very high energy intensityTotal energy consumption per unit of GDP (primary energy intensity), measured at purchasing power parity, is close to the world average but remains lower than the average in non-OECD countries.
Total energy intensity has decreased by 2.2 percent / year since 1990. Between 1990 and 2009, final energy consumption per unit of GDP (final intensity) decreased more rapidly than pri-mary energy intensity. The soaring electricity demand leads to a rise in conversion losses since most power generation is from coal, which in turn results in a slower reduction in primary energy intensity.
CO2 emissions per unit of GDP (CO2 intensity) decreased by 0.5 percent / year between 1990 and 2009, which is much slower than energy intensity. This is mainly explained by the decreasing share of carbon-free energy sources in the fuel mix (mainly biomass and hydro). The NAPCC (2008) aims to reduce carbon intensity by 20-25 percent by 2020 (compared with 2005 levels).
Source: Enerdata
-4.0%
-3.5%
-3.0%
-2.5%
-2.0%
-1.5%
-1.0%
-0.5%
0.0%1990-2009 2000-2009
%/y
ear
Primary energy intensity
Final energy intensity
CO2 intensity
Figure 4: Energy and CO2 intensity trends
2. Power generation2.1. Policies: ambitious targets for renewablesElectricity production falls chronically short of the country’s electricity needs (with a peak capacity deficit of almost 20 percent). The capacity expansion is systematically below the needs, and the objectives fixed in the Plans are rarely met.
The government’s target under the 11th Plan (2007-2012) is to install a renewable power capacity of 14,500 MW, of which 10,500 MW would be from wind. The Government will grant Rs3,600bn (US$79bn) in subsidies for wind power projects (Rs0.49 / kWh (US$0.49 / kWh) for a minimum of four years and a maximum of 10 years) to be connected to the national grid. The subsidies will be applicable to projects of up to 4 GW and are earmarked for developers until 2012. India has announced its goal of having a solar energy capacity of 20 GW by 2022, as forecasted in the 13th Five-Year Plan (2018-2022).
2.2. Power generation trends by source: growing market share for coalPower generation is increasingly based on fossil fuels, which in 2009 accounted for around 85 percent of the country’s elec-tricity generation, compared with 75 percent in 1990. Coal is the main fuel for electricity production, accounting for 70 percent in 2009 compared with 66 percent in 1990. Natural gas is developing rapidly: in 2009, it accounted for 12 percent of the power generation compared with 3 percent in 1990. The share of hydroelectricity fell significantly, from 25 percent in 1990 to 12 percent in 2009. Among CO2-free energy sources, wind energy has started to develop significantly in recent years, but in 2009 it still accounted for less than 2 percent of the total. Nuclear represents around 2 percent of total electricity genera-tion. Altogether, the share of carbon-free power generation decreased from 27 percent in 1990 to 16 percent in 2009.

Country reports | India 49
Source: Enerdata
0
100
200
300
400
500
600
700
800
900
1000
1990 2000 2009
TWh
Other*
Wind
Hydro
Nuclear
Gas
Oil
Coal-Lignite
*Including biomass, geothermal and solar
Figure 5: Power generation by source
2.3. Efficiency of the power sector: deterioration in energy efficiencyThe efficiency of the power sector is decreasing and in 2009 stood at 30 percent, compared with 36 percent in 1990. The reduction of the share of hydroelectricity, the development of nuclear power and the aging of coal power plants explains the deterioration of this ratio. The rise in gas-fired capacities, which are more efficient than coal, leads to a smaller drop in the efficiency of thermal power plants. In 2009 thermal power plants had an efficiency rate of 27 percent, compared with 30 percent in 1990. The use of more efficient technologies, such as gas combined cycles and cogeneration, also limited the fall in the ratio for thermal power generation. In 2009, combined cycles accounted for around 15 percent of thermal capacities and almost the entire gas-fired power production.
Source: Enerdata
25
27
29
31
33
35
37
%
1990 1995 2000 2005 2009
Total power generation
Thermal power plants
Figure 6: Efficiency of power generation and thermal power plants
Source: Enerdata
0
20
40
60
80
100
120
140
160
Steam Combined cycles
GW
1990 1995 2000 2005 2009
Figure 7: Thermal electricity capacity, by technology
Transmission and distribution losses are very high but have been decreasing since 2000 (from 30 percent to about 25 percent in 2009). Around 5 percent of these losses are non-technical losses (unpaid electricity). The losses exceed 40 percent in eight states, range between 30 percent and 40 percent in seven other states and between 20 percent and 30 percent in a further eight states. India is far above the average for non-OECD countries, which stands at 11 percent.
Source: Enerdata
0
5
10
15
20
25
30
35
%
1990 1995 2000 2005 2009
Figure 8: Electric T&D losses
As a result of the fast-growing share of fossil fuel in power generation, the average CO2 emission factor has increased by about 20 percent since 1990, reaching 960 gCO2 / kWh in 2009. However, the growth in CO2 emissions per kWh gener-ated has slowed down since 2000, at 0.5 percent / year com-pared with 1 percent / year between 1990 and 1999.

50 India | Country reports
IndiaEnergy efficiency report
Source: Enerdata
0
200
400
600
800
1000
1200
gCO
2 /
kWh
1990 1995 2000 2005 2009
Figure 9: CO2 emission factor for power generation
3. Industry3.1. Policies: an ambitious program for energy intensive branchesIn the framework of the Energy Conservation Act, large indus-trial energy consumers in nine sectors have to implement energy audits, appoint certified energy managers and report energy consumption data.
As part of the National Mission for Enhanced Energy Efficiency, energy efficiency improvement targets should be assigned to the country’s most energy-intensive industrial units and an Energy Savings Certificate market (ESCerts) should be created.
3.2. Energy consumption trends: sustained growthEnergy consumption in industry has soared by 5.5 per-cent / year since 2003, supported by a high GDP growth rate (6-9 percent / year since 2003). In 2009, the sector’s energy consumption was not affected by the global economic slow-down and increased by 7 percent.
Source: Enerdata
20
40
60
80
100
120
140
Mto
e
1990 1995 2000 2005 2009
Figure 10: Industrial energy consumption
The share of electricity in industrial energy consumption is increasing steadily (5.5 percent / year) and reached 20 percent in 2009, compared with 13 percent in 1990. Coal is the domi-nant fuel but its market share is decreasing (from 40 percent in 1990 to 35 percent in 2009).
The share of energy-intensive industries in the overall energy consumption of industry has been stable since 1990. They accounted for just below 40 percent of the sector’s energy consumption in 2009. The shares of the steel industry and the non-metallic minerals industry (cement, ceramics, etc.) have remained pretty stable since then and in 2009 stood at about 20 percent and 10 percent, respectively. The market share of the chemical industry has decreased slightly since 1990, from 9 percent down to 8 percent in 2009. The paper industry has maintained its market share since 1990 (2 percent of the total).
Source: Enerdata
0%
10%
20%
30%
40%
50%
60%
70%
80%
90%
100%
1990 2000 2005 2009
Biomass
Electricity
Gas
Oil
Coal/Lignite
Figure 11: Energy consumption of industry, by source

Country reports | India 51
Source: Enerdata
0%
10%
20%
30%
40%
50%
60%
70%
80%
90%
100%
Other
Paper
Non metallic minerals
Chemical
Steel
1990 2000 2005 2008
*Estimated electricity consumption by branch
Figure 12: Energy consumption of industry, by branch
3.3. Energy intensity trends: large improvements achieved in industryBetween 1990 and 2009, energy intensity in industry fell by more than 3 percent / year. Since 2000, it has decreased at the even faster pace of 3.8 percent / year.
Source: Enerdata
-3.9%
-3.8%
-3.7%
-3.6%
-3.5%
-3.4%
-3.3%
-3.2%
-3.1%
-3.0%
-2.9%
1990-2008 2000-2008
%/y
ear
*Including construction and mining
Total*
Figure 13: Trends in the energy intensity of industrial branches

52 Russia | Country reports
RussiaEnergy efficiency report
Objectives:
– 56% reduction in energy intensity by 2030
Overview 2009 2000-2009 (% / year)
Primary intensity (EU=100)1 261 -- -4.8% ++CO2 intensity (EU=100) 280 -- -5.3% ++CO2 emissions per capita (in tCO2 / cap) 10.0 -- -0.2% -Power generation 2009 2000-2009 (% / year)Efficiency of thermal power plants (in %) 26 -- 1.0% +Rate of electricity T&D losses (in %) 11 -- -1.2% -CO2 emissions per kWh generated (in gCO2 / kWh) 341 - -0.1% -Industry 2009* 2000-2009* (% / year)Energy intensity (EU=100) 268 -- -4.5% ++Share of industrial CHP in industry consumption (in %) 13 - -1.0% --Unit consumption of steel (in toe / t) 0.70 -- 0.3% -*2008 and 2000-2008 for steel
Among best countriesBetter than the EU averageBelow the EU average Among countries with lowest performances
1 The European Union, as the best-performing region, is used as the benchmark.
Latest update: February 2011

Country reports | Russia 53
1. Overview1.1. Policies: 56% reduction in energy intensity by 2030Energy efficiency is a priority in the Energy Strategy of Russia for the period up to 2030, defined in 2009. The Energy Strat-egy sets a 56 percent energy intensity reduction target for 2030 (compared with 2005). To reach that goal Russia plans to create a favorable economic environment, including the pro-gressive liberalization of energy prices on the domestic market to promote more rational energy use, and the establishment of a market for energy services. New standards, tax incentives and penalties, as well as energy audits will have to be adopted. The Energy Strategy also aims to increase the energy efficiency of buildings by 50 percent between 2005 and 2030 (+10 per-cent between 2005 and 2015). It will implement new manda-tory construction standards.
A Federal Law on Energy Conservation and Increase of Energy Efficiency was adopted in November 2009 to create the legal and economic framework for the promotion of energy efficien-cy. It mainly focuses on the efficiency of buildings and intro-duces the installation of compulsory meters, the establishment of a federal energy efficiency information network and energy efficiency certificates (“energy passports”).
1.2. Energy consumption trends: slow growth since 1998 Energy consumption per capita in Russia is twice as high as the world average, at about 4.4 toe / cap (2009). Total energy consumption (primary consumption) grew slightly between 1995 and 2008 (+0.6 percent / year) but fell by 10 percent in 2009 as a consequence of the global economic crisis.
Source: Enerdata
50
150
250
350
450
550
650
750
1995 2000 2005 2009
Mto
e
Primary consumption
Final consumption
Figure 1: Total and final energy consumption trends
Russia’s primary consumption is dominated by gas and oil, which account for 53 percent and 21 percent, respectively. The share of coal decreased slightly, from 21 percent in 1995 to 16 percent in 2009. Nuclear power covers 7 percent of primary
consumption, followed by hydroelectricity (2 percent) and biomass (1 percent).
Industry is the largest end user with 45 percent of final energy consumption (2009). Its share has remained relatively stable since 1995. The households, services and agriculture sector’s share dropped slightly over the 1995-2009 period, from 44 percent to 40 percent (decreasing consumption), to the benefit of transport (15 percent, compared with 10 percent in 1995).
Source: Enerdata
0%
20%
40%
60%
80%
100%
1995 2000 2005 2009
Households - Services -Agriculture
Transport
Industry (including non energy uses)
Figure 2: Distribution of final energy consumption by sector
Electricity consumption per capita is twice as high as the world average, at around 5,700 kWh / cap (close to the EU average). After a decline between 1995 and 1998, electricity consump-tion grew at the steady pace of 2.6 percent / year until 2008. In 2009 it fell by 4.3 percent. Over 60 percent of electricity is consumed in industry.
Source: Enerdata
0
100
200
300
400
500
600
700
800
900
TWh
1995 2000 2005 2009
Industry Others
Figure 3: Electricity consumption trends by sector

54 Russia | Country reports
RussiaEnergy efficiency report
1.3. Energy efficiency and CO2 trends: statistical improve-ment rather than efficiency gainsBetween 1995 and 2009 the very strong growth in Russian GDP, triggered by high energy prices, led to significant decreases in energy intensity and CO2 intensities.
Total energy consumption per unit of GDP (primary energy intensity) decreased by 3.9 percent / year over the 1995-2009 period. Meanwhile, final energy intensity (final consumption per unit of GDP) fell by 4.8 percent / year, in line with the decrease in industrial energy intensity (-5.3 percent / year).
CO2 intensity (CO2 emissions per unit of GDP) fell at the signifi-cant pace of 4.3 percent / year between 1995 and 2009. About 90 percent of that reduction is attributable to the drop in ener-gy intensity and 10 percent to fuel substitutions (mainly the reduced share of coal in primary consumption, which fell from 21 percent in 1995 to 9 percent in 2009, and the 3 percent increase in the share of nuclear and hydroelectricity).
Source: Enerdata
-7.0%
-6.0%
-5.0%
-4.0%
-3.0%
-2.0%
-1.0%
0.0%
1995-2009 2000-2009
%/y
ear
Primary energy intensity
Final energy intensity
CO2 intensity
Figure 4: Energy and CO2 intensity trends
2. Power generation2.1. Policies: 38% share of CO2-free power generation by 2030The Energy Strategy of Russia for the period up to 2030 (2009) aims to reduce the share of gas in the thermal mix to 60-62 percent by 2030 (over 70 percent in 2008), to the benefit of coal (from 26 percent in 2008 to 34-36 percent in 2030), and to increase the share of CO2-free generation to at least 38 per-cent by 2030. Nuclear generation is expected to increase to 20 percent of total power generation by 2030, while power gen-eration from renewable sources (including hydropower) should account for 18-19 percent. Excluding large hydropower plants (over 25 MW), renewables should account for 4.5 percent of electricity production. The Energy Strategy plans to create the institutional basis for renewable energy use in the energy
sector, including a tax system that encourages renewable power plants and a system of guaranteed access to electricity networks. Russia is considering introducing public-private partnerships to accelerate the diffusion of advanced renewable technologies.
Russia also aims to modernize its energy infrastructure. Under the Energy Strategy, by 2030 the generation efficiency rate should be increased to at least 41 percent in coal-fired power plants, 53 percent in gas-fired power plants and 36 percent in nuclear power plants. It also aims to reduce the carbon factor (CO2 emissions per kWh produced) in thermal power plants from about 340 gCO2 / kWh to 270 gCO2 / kWh and to cut grid losses to 8 percent by 2030.
2.2. Power generation trends by source: growing share of gasGas accounts for 49 percent of the electricity mix (41 percent in 1995). The shares of coal and oil decreased from 19 percent and 8 percent in 1995 to 15 percent and 2 percent, respec-tively, in 2009. Over time, CO2-free generation has grown from 32 percent to 35 percent; that growth was achieved thanks to nuclear power generation (which rose from 12 percent to 17 percent), since the share of hydroelectricity decreased slightly, from 21 percent to 18 percent.
Source: Enerdata
0
200
400
600
800
1000
1200
1995 2000 2009
TWh
Other*
Wind
Hydro
Nuclear
Gas
Oil
Coal-Lignite
*Including biomass, geothermal and solar
Figure 5: Power generation by source
2.3. Efficiency of power sector: low efficiency rateRussia’s average power generation efficiency rate is kept low by the high share of low-efficiency power plants: in 2009 oil-fired, coal-fired and nuclear power accounted for 33 per-cent of the power generation (38 percent in 1995). Neverthe-less, the generation efficiency rate rose over the years, from 29 percent to 32 percent. That improvement was triggered by thermal power plants, which saw their average efficiency increase from 23 percent to 26 percent, which remains 24

Country reports | Russia 55
percent below the world average. The share of gas combined-cycle plants in the total capacity is insignificant.
Source: Enerdata
10
15
20
25
30
35
%
1995 2000 2005 2009
Total power generation
Thermal power plants
Figure 6: Efficiency of power generation and thermal power plants
Source: Enerdata
135
140
145
150
155
160
165
170
GW
Steam
1995 2000 2005 2009
Figure 7: Thermal electricity capacity, by technology
The rate of T&D losses is 30 percent higher than the world average, at 11 percent.
Source: Enerdata
3
5
7
9
11
13
15
%
1995 2000 2005 2009
Figure 8: Electric T&D losses
The carbon factor (CO2 emissions per kWh generated) is below the world average, at 340 gCO2 / kWh (close to the EU average).
Source: Enerdata
200
250
300
350
400
450
500
gCO
2 /
kWh
1995 2000 2005 2009
Figure 9: CO2 emission factor for power generation

56 Russia | Country reports
RussiaEnergy efficiency report
3. Industry3.1. Policies: Energy audits and energy passportsRussia has developed sectoral energy efficiency programs (especially in the energy-intensive industries like steel, cement, paper or aluminum), such as the Federal Targeted Program for an Energy Efficient Economy (2002-2010) that promoted high-efficiency technologies in those sectors.
The Federal Law on Energy Conservation and Increase of Energy Efficiency (November 2009) includes energy audits and energy efficiency state standards for industrial consumers. Large consumers (with an energy expenditure exceeding 10 million rubles / year (US$0.330 million / year) are submitted to mandatory energy audits. The law also introduces incentives and tax benefits for heavy industry to replace inefficient equip-ment by energy-efficient machinery.
3.2. Energy consumption trends: stagnating consumption since 1998After a 25 percent fall between 1995 and 1998, energy con-sumption in Russia’s industry remained roughly stable between 1999 and 2008. In 2009 it dropped by 7 percent as a conse-quence of the global economic crisis.
Source: Enerdata
60
80
100
120
140
160
180
Mto
e
1995 2000 2005 2009
Figure 10: Industrial energy consumption
District heating covers one-third of industrial energy consump-tion. Nevertheless, it has fallen since 1995, when it stood at 48 percent, to the benefit of electricity (from 16 percent in 1995 to 23 percent in 2009), gas (20 percent compared with 15 per-cent in 1995) and oil (9 percent). The share of coal remained relatively stable, at 14 percent.
Energy-intensive industries are gaining importance, which shows the opposite trend compared with most countries: their share increased from 58 percent to 67 percent between 1995 and 2008. Steel is the largest consuming sector (32 percent in
2008, from 28 percent in 1995). The share of the chemical branch remained relatively stable (18 percent in 2008), while that of the non-metallic minerals industry increased over the period, from 6 percent to 11 percent. The paper branch accounts for 5 percent of industrial energy consumption.
Source: Enerdata
0%
10%
20%
30%
40%
50%
60%
70%
80%
90%
100%
1995 2000 2005 2009
Heat
Electricity
Biomass
Gas
Oil
Coal/Lignite
Figure 11: Energy consumption of industry, by source
Source: Enerdata
Other
Paper
Non metallic minerals
Chemical
Steel
1995 2000 2005 2008
0%
10%
20%
30%
40%
50%
60%
70%
80%
90%
100%
Figure 12: Energy consumption of industry, by branch
3.3. Energy intensity trends: limited energy efficiency gainsBetween 1995 and 2008 energy intensity in Russia’s industry decreased rapidly, by 5.3 percent / year. However, efficiency gains in the energy-intensive branches were limited: the unit consumption of steel (total energy consumption per ton of steel produced) decreased by 2.5 percent / year while that of the chemicals branch dropped by 1 percent / year. The unit con-sumption of the non-metallic minerals industry even grew by 2.8 percent / year, while that of the paper sector –although relatively marginal in industrial energy consumption– increased by 26 percent / year.

Country reports | Russia 57
Source: Enerdata
-6%
0%
6%
12%
18%
24%
30%
Total*
Steel
Chemical
Cement**
Paper%/y
ear
1995-2008 2000-2008
*Including construction and mining
**Non metallic minerals
Figure 13: Trends in the energy intensity of industrial branches
The share of electricity produced by CHP facilities in industrial electricity consumption has been decreasing slowly since 1996. At 13 percent in 2009, it is twice as high as the world average.
Source: Enerdata
0%
2%
4%
6%
8%
10%
12%
14%
16%
18%
20%
1995 20052000 2009
Figure 14: Share of industrial CHP in industrial consumption

58 Japan | Country reports
JapanEnergy efficiency report
Objectives:
– 30% improvement in energy efficiency by 2030
Overview 2009 2000-2009 (% / year)
Primary intensity (EU=100)1 98 + -2.0% +CO2 intensity (EU=100) 106.2 - -1.9% -
CO2 emissions per capita (in tCO2 / cap) 7.9 - -1.5% +Power generation 2009 2000-2009 (% / year)Efficiency of thermal power plants (in %) 44 ++ -0.1% -Rate of electricity T&D losses (in %) 5 ++ 0.7% --CO2 emissions per kWh generated (in gCO2 / kWh) 438 - 1.3% --Industry 2009* 2000-2009* (% / year)Energy intensity (EU=100) 84 + -5.0% ++Unit consumption of steel (in toe / t) 0.30 + -1.6% -*2008 and 2000-2008 for steel; 2003-2009 for CHP
++ Among best countries + Better than the EU average1 - Below the EU average1 -- Among countries with lowest performances
1 The European Union, as the best-performing region, is used as the benchmark.
Latest update: December 2010

Country reports | Japan 59
1. Overview1.1. Policies: 30% energy efficiency improvement target for 2030The energy efficiency policy is governed by the Energy Conser-vation Law (Rational Use of Energy Act), voted in 1979, which obliges manufacturers and importers to enhance the energy efficiency of their products. The government drafted the New National Energy Strategy to promote energy conservation measures in 2006; the strategy also presented the Energy Conservation Frontrunner Plan. The target set in the plan is to further improve energy efficiency by at least 30 percent by 2030.
Energy efficiency standards for many electrical appliances and vehicles were created under the Top-Runner Program in 1999 and reinforced in 2006. It currently concerns 23 products. The first set of targets, fixed for the first period, has been achieved.
1.2. Energy consumption trends: similar consumption per capita as in EUJapan has a slightly higher level of energy consumption per capita than the European Union (10 percent higher).
Total energy consumption has been decreasing since 2004 (-5 percent over the period 2004-2008) and the economic crisis led to a fall in the total energy demand in 2009 (-10 percent).
Oil is the country’s main energy source. In 2009 it accounted for 43 percent of total consumption, showing a steady down-ward trend (58 percent in 1990 and 50 percent in 2000). The shares of gas (17 percent), coal (22 percent) and hydro and nuclear power (17 percent) are increasing slightly. Since 2003 the share of fossil fuel has increased significantly as a conse-quence of the shutdown of several nuclear power units.
Source: Enerdata
60
110
160
210
260
310
360
410
460
510
560
1990 1995 2000 2005 2009
Mto
e
Primary consumption
Final consumption
Figure 1: Total and final energy consumption trends
The share of industry in energy consumption is decreasing. In 2009, industry accounted for 29 percent of final energy con-sumption (39 percent including non-energy uses), the house-holds, services and agriculture sector for 36 percent and the transport sector for 25 percent.
Source: Enerdata
0%
20%
40%
60%
80%
100%
1990 2000 2005 2009
Households - Services -Agriculture
Transport
Industry (including non energy uses)
Figure 2: Distribution of final energy consumption by sector
Electricity consumption per capita reached 7,400 kWh in 2009. The growth of electricity consumption has greatly slowed down compared to the 1990s (2.4 percent / year between 1990 and 2000 and 1 percent / year between 2000 and 2007). Since 2007 electricity demand has been decreasing by about 4 percent / year due to the economic crisis. Industry absorbs 31 percent of consumption, followed by the service and house-hold sectors (67 percent).
Source: Enerdata
0
200
400
600
800
1000
1200
TWh
Industry Others
1990 1995 2000 2005 2009
Figure 3: Electricity consumption trends by sector

60 Japan | Country reports
JapanEnergy efficiency report
1.3. Energy efficiency and CO2 trends: consumption per GDP close to the EU averagePrimary energy intensity (total energy consumption per unit of GDP), measured at purchasing power parity, is close to the EU average.
Between 1990 and 2009 primary energy intensity decreased at a slower pace than in the EU as a whole: 0.7 percent / year compared with 1.7 percent / year for the EU. However, since 2000 the reduction has been twice as fast as over the whole period. Final energy intensity (final energy consumption per unit of GDP) decreased almost twice as fast as primary energy intensity over the period 1990-2009. This gap is due to the increasing share of low-efficiency energy sources in power generation (mainly coal and, to a lesser extent, nuclear power).
CO2 emissions per unit of GDP (CO2 intensity) decreased more rapidly than primary energy intensity over the period 1990-2009 due to substitutions of oil by natural gas and nuclear power (1.1 percent / year compared with 0.7 percent / year).
Source: Enerdata
-3.0%
-2.5%
-2.0%
-1.5%
-1.0%
-0.5%
0.0%
1990-2009 2000-2009
%/y
ear
Primary energy intensity
Final energy intensity
CO2 intensity
Figure 4: Energy and CO2 intensity trends
2. Power generation2.1. Policies: 10% of renewables by 2020Until 2010, there was a policy on electricity production from renewables with quotas. Now the development of renewable energy is driven by the general target set out in the Basic Act on Global Warming Countermeasures, ie, 10 percent of renew-ables in primary energy consumption by 2020. Under the Renewable Portfolio Standard (RPS) introduced in 2003, the government fixed quotas obliging electricity producers to produce 3 percent of the energy demand from renewables by 2010. At the end of 2009 Japan had a photovoltaic capacity of 2,627 MW and ranked third in the world, after Germany and Spain. New feed-in tariffs for solar photovoltaic electricity (2009) are between ¥39-¥47 / kWh (US$0.42-0.5060 / kWh) for
the household sector and around ¥23 / kWh (US$0.25 / kWh) for professionals, and those rates are secured for a period of 10 years. They are available for surplus electricity production only and are supposed to be revised downward in the next few years. In addition, it has been proposed to expand the feed-in tariff scheme to electricity generated from hydropower sta-tions, wind turbines and geothermal facilities.
2.2. Power generation trends by source: low share from renewablesThe shares of oil and nuclear in electricity production are falling (from 13 percent in 2000 to 8 percent in 2009, and from 31 percent in 2000 to 27 percent in 2009, respectively), to the benefit of gas (26 percent of production in 2009) and coal (28 percent of production), which is playing a growing role in ther-mal power generation. Carbon-free power generation, exclud-ing nuclear, accounted for 11 percent of electricity production in 2009, with hydropower accounting for 8 percent of that amount.
Source: Enerdata
0
200
400
600
800
1000
1200
1990 2000 2009
TWh
Other*
Wind
Hydro
Nuclear
Gas
Oil
Coal-Lignite
*Including biomass, geothermal and solar
Figure 5: Power generation by source
2.3. Efficiency of the power sector: slight increase thanks to gasThe efficiency of the power sector has increased slightly since 1994, reaching 42 percent in 2009. This improvement is due to a switch in the power generation mix to natural gas and to the rise in gas combined cycles. The efficiency of thermal power plants has improved (+2 percent) and in 2009 stood at 44 percent. In 2009, combined cycles accounted for more than 18 percent of the country’s total thermal capacity.

Country reports | Japan 61
Source: Enerdata
Total power generation
Thermal power plants
30
32
34
36
38
40
42
44
46
%
1990 1995 2000 2005 2009
Figure 6: Efficiency of power generation and thermal power plants
Source: Enerdata
0
20
40
60
80
100
120
140
160
180
200
GW
1990 1995 2000 2005 2009
Steam Gas turbines Combined cycles
Figure 7: Thermal electricity capacity, by technology
The Japanese grid shows a low, steady rate of T&D losses of around 5 percent of the distributed volumes, which is below the average of OECD countries.
Source: Enerdata
3
3.5
4
4.5
5
5.5
6
6.5
7
%
1990 1995 2000 2005 2009
Figure 8: Electric T&D losses
Since 1998, the average CO2 emission factor for power gen-eration has increased dramatically and exceeded the 1990 level. It reached 440 gCO2 / kWh in 2009. The trend seen since 1998 is explained by the increasing use of coal and gas for power generation, and the correlative decline in the share of nuclear power capacity. However, CO2 emissions decreased by about 13 percent between 1990 and 1998 thanks to the spread of nuclear power (from 24 percent to 33 percent of total power generation).
Source: Enerdata
300
320
340
360
380
400
420
440
460
gCO
2 /
kWh
1990 1995 2000 2005 2009
Figure 9: CO2 emission factor for power generation

62 Japan | Country reports
JapanEnergy efficiency report
3. Industry3.1. Policies: market-based instruments combined with voluntary agreementsSince the mid-1970s, various financial and fiscal incentives have been put in place to encourage energy conservation and efficiency in industry. Furthermore, a tax incentive scheme (Tax Scheme for Promoting Investment in the Reform of the Energy Demand-Supply Structure) was introduced for businesses investing in specified energy conservation and efficient equip-ment, providing a special depreciation rate of 30 percent of the acquisition cost. For small businesses, the special depreciation rate is coupled with a 7 percent tax deduction off the acquisi-tion cost. Large industrial companies are obliged to name an energy manager who is in charge of implementing an energy plan in the company.
In the Revised Energy Conservation Act (2008), sectoral approaches have for the first time been introduced as a domestic regulatory measure. Sectoral benchmarks are being established for certain sub-sectors, initially in energy-intensive industries. Indicators are established for companies to bench-mark their energy efficiency level against others within the same sub-sector, and medium- and long-term targets are set (to be achieved around 2015-2020).
Low interest loans are available for the installation of cogenera-tion systems. This applies to equipment that generates over 50 kW of output and with over 60 percent efficiency in primary energy use.
Voluntary agreements concerned more than 1,100 industrial companies, with different targets among sub-sectors.
3.2. Energy consumption trends: decrease in 2008 / 2009 due to crisisEnergy consumption in industry decreased slightly between 1990 and 2007 (-4 percent), while the country’s total energy consumption increased slightly (+15 percent). In 2008 and 2009, the global economic downturn caused a dramatic fall in the sector’s energy consumption: in 2009 it was 31 percent lower than in 2007.
Source: Enerdata
20
40
60
80
100
120
140
Mto
e
1990 1995 2000 2005 2009
Figure 10: Industrial energy consumption
Electricity consumption decreased at the same pace as energy consumption until 2007, and then dropped by 20 percent between 2007 and 2009. However, the share of electricity in industrial energy consumption has increased since 1990 and in 2009 reached 32 percent of the total (compared with 25 per-cent in 1990). The use of coal and lignite in industry was steady until 2005 (just above 40 percent of total energy consumption) but has recently decreased. Nevertheless, coal consumption remains high, at 34 percent of total energy consumption in 2009. Natural gas consumption in industry is low (only 9 per-cent of the total). The share of energy-intensive industries in the overall energy consumption of industry has increased since 1990. The steel industry’s share of energy consumption in particular has increased steadily and now stands at 40 percent. The share of the chemical industry is steady (around 11 percent), as are the shares of the non-metallic minerals (cement, ceramics, etc.) and paper industries, which each account for 9 percent of total energy consumption.

Country reports | Japan 63
Source: Enerdata
0%
10%
20%
30%
40%
50%
60%
70%
80%
90%
100%
1990 2000 2005 2009
Biomass
Electricity
Gas
Oil
Coal/Lignite
Figure 11: Energy consumption of industry, by source
Source: Enerdata
Other
Paper
Non metallic minerals
Chemical
Steel
1990 2000 2005 2008
0%
10%
20%
30%
40%
50%
60%
70%
80%
90%
100%
Figure 12: Energy consumption of industry, by branch
3.3. Energy intensity trends: rapid decrease, due to struc-tural changesOver the period 1990-2008, the reduction in energy intensity (consumption per unit of industrial value added) was quite high (1.3 percent / year). It accelerated after 2000 (-3 percent / year on average). Energy efficiency improvements for the four energy-intensive industries were lower over the period 1990-2008 (0.5 percent per year), which means that most of the reduction in the sector’s energy intensity was due to structural changes in industrial activity, with a shift to less intensive industries: the share of machinery and other equipment in the total value added of manufacturing has doubled and is now over 60 percent.
Source: Enerdata
-3.0%
-2.5%
-2.0%
-1.5%
-1.0%
-0.5%
0.0%
0.5%
1.0%
Total*
Steel
Chemical
Cement**
Paper%
/yea
r
1990-2008 2000-2008
*Including construction and mining
**Non metallic minerals
Figure 13: Trends in the energy intensity of industrial branches

64 Germany | Country reports
GermanyEnergy efficiency report
Objectives:
– 231 TWh of end-user energy savings by 2016
Overview 2009 2000-2009 (% / year)
Primary intensity (EU=100)1 99 + -1.3% -CO2 intensity (EU=100) 106 - -1.6% -CO2 emissions per capita (in tCO2 / cap) 8.9 - -1.1% -Power generation 2009 2000-2009 (% / year)Efficiency of thermal power plants (in %) 37 - -0.2% -Rate of electricity T&D losses (in %) 5 + -2.8% +CO2 emissions per kWh generated (in gCO2 / kWh) 433 - -1.1% -Industry 2009* 2000-2009* (% / year)Energy intensity (EU=100) 86 + -1.5% -Share of industrial CHP in industry consumption (in %) 11 - 13.8% ++Unit consumption of steel (in toe / t) 0.39 + 0.5% --*2008 and 2000-2008 for steel; 2002-2009 for CHP
++ Among best countries + Better than the EU average - Below the EU average -- Among countries with lowest performances
1 The European Union, as the best-performing region, is used as the benchmark.
Latest update: January 2011

Country reports | Germany 65
1. Overview1.1. Policies: 9.6% of end-user energy savings by 2016Germany has adopted a National Energy Efficiency Action Plan 2008-2016, which sets an energy savings target of 231 TWh in buildings, transport and small industries, excluding sectors under the EU Energy Trading Scheme (ETS), for 2016. That target corresponds to at least 9.6 percent of the reference final energy consumption.
The Integrated Energy and Climate Change Program (IECCP), adopted in August 2007, aims to cut CO2 emissions by 40 percent by 2020 (compared with 1990 levels). The plan sets an energy efficiency improvement objective of 3 percent / year on average by 2020. The ambitious energy efficiency program for buildings (existing energy standards tightened by 30 percent in 2009 for new buildings and then by another 30 percent by 2012) should play a major part in the achievement of that objective. Mandatory standards on electric household appli-ances are an additional measure. Germany adopted a new package of climate measures in 2008 to implement the IECCP. The legislative package focuses on the transport and construc-tion sectors. In 2009, thermal standards for new buildings were reinforced by approximately 30 percent. About 500 million euros (1 euro = US$1.39) will be spent on the retrofitting of existing buildings over the period 2009-2012.
1.2. Energy consumption trends: decreasing share of coal in the energy supplyPer capita consumption was around 3.8 toe in 2009, which is 15 percent above the EU average. Germany is the largest consumer of energy in Europe. Total consumption has fluctu-ated in a range of 330-350 Mtoe since 1992, and has decreased slightly since 2002 (1.1 percent / year). In 2009 it dropped by 6 percent, with a noticeable reduction in industry.Oil is the main energy source since it covers 33 percent of the country’s energy supply, compared with 37 percent in 2000. The share of coal has been scaled down since 1990, from 37 percent to 24 percent in 2009. In turn, natural gas has an increasing role in meeting the energy needs: its share has risen from 15 percent in 1990 to 23 percent today. In 2009, nuclear power represented 11 percent and wind 1 percent of overall consumption, while biomass accounted for 7 percent.
Source: Enerdata
60
110
160
210
260
310
360
410
1990 1995 2005 20092000M
toe
Primary consumption
Final consumption
Figure 1: Total and final energy consumption trends
The households, services, and agriculture sector represented more than 40 percent of final energy consumption in 2009. The share of industry (including non-energy uses) amounted to 35 percent while transport accounted for 25 percent of final ener-gy consumption.
Source: Enerdata
0%
10%
20%
30%
40%
50%
60%
70%
80%
90%
100%
1990 2000 2005 2009
Households - Services -Agriculture
Transport
Industry (including non energy uses)
Figure 2: Distribution of final energy consumption by sector
Electricity consumption per capita was 6,200 kWh in 2009, ie, slightly higher than the EU average (by about 10 percent). The share of electricity in final energy consumption has increased steadily since 1990 and accounted for 19 percent in 2009. Electricity consumption grew regularly between 2000 and 2007, at a pace of 1.2 percent / year. It stagnated in 2008 and dropped by 5 percent in 2009, since electricity consumption from industry, which represents around 43 percent of the total, fell by 9.5 percent in that same year.

66 Germany | Country reports
GermanyEnergy efficiency report
Source: Enerdata
0
100
200
300
400
500
600
Industry Others
1990 1995 2000 2005 2009
TWh
Figure 3: Electricity consumption trends by sector
1.3. Energy efficiency and CO2 trends: strong improvement in energy intensity since 1990Total energy consumption per unit of GDP (primary energy intensity), measured at purchasing power parity, is in line with the EU average. It decreased by 1.7 percent / year between 1990 and 2009. During the recent period (2000-2009), energy intensity reductions were achieved at a slower pace than in the EU (1.3 percent / year compared with 1.7 percent / year since 2000).
Total energy intensity decreased slightly faster than final energy intensity over the period 2000-2009, due to a reduction in power conversion losses following the substitution of coal by natural gas and the diffusion of wind power.CO2 emissions per unit of GDP (CO2 intensity) decreased faster than the total energy intensity over the period 2000-2009 (1.6 percent / year compared with 1.3 percent / year), due to the massive substitution of coal and lignite by gas.
Source: Enerdata
-3.0%
-2.5%
-2.0%
-1.5%
-1.0%
-0.5%
0.0%1990-2009 2000-2009
Primary energy intensity
Final energy intensity
CO2 intensity
%/y
ear
Figure 4: Energy and CO2 intensity trends
2. Power generation2.1. Policies: almost 40% of power from renewables by 2020In August 2010, the Federal Cabinet adopted a national action plan for renewables. The plan sets the share of renewables in electricity generation at 38.6 percent in 2020. According to the plan, the share of renewables in final energy consumption would reach 19.6 percent in 2020, thereby exceeding the 18 percent target set by the EU Directive on the promotion of energy use from renewable sources.
2.2. Power generation trends by source: coal remains the largest energy sourceCO2-free sources accounted for 40 percent of the total elec-tricity production in 2009. Nuclear power is the second-largest energy source in the country’s electricity mix after coal and lignite, with a market share of 23 percent. Power generation from wind energy and biomass has expanded very rapidly in recent years and in 2009 they accounted for 6 percent and 7 percent of the total, respectively (compared with less than 2 percent each in 2000). Coal (including lignite) remains the largest source of energy in power generation, although its share decreased from 58 percent in 1990 to 44 percent in 2009. The share of natural gas has developed rapidly and was just below 15 percent in 2009 (compared with 7 percent in 1990).

Country reports | Germany 67
Source: Enerdata
0
100
200
300
400
500
600
700
1990 2000 2009
TWh
Other*
Wind
Hydro
Nuclear
Gas
Oil
Coal-Lignite
*Including biomass, geothermal and solar
Figure 5: Power generation by source
2.3. Efficiency of the power sector: rapid improvements The efficiency of the power sector has increased strongly since 1990 (by 5 percentage points) and stood at 39 percent in 2009. The efficiency of thermal power plants rose from 32 percent in 1990 to 37 percent in 2009, driven by the increasing market share of natural gas.
Source: Enerdata
30
31
32
33
34
35
36
37
38
39
40
%
1990 1995 2000 2005 2009
Total power generation
Thermal power plants
Figure 6: Efficiency of power generation and thermal power plants
Source: Enerdata
0
10
20
30
40
50
60
70
80
90
100
GW
1990 1995 2000 2005 2009
Steam Gas turbines Combined cycles
Figure 7: Thermal electricity capacity, by technology
The rate of T&D losses in the German grid is around 5 percent of the distributed volumes, which is significantly lower than the EU average (by about 25 percent).
Source: Enerdata
0
1
2
3
4
5
6
7
8
%
1990 1995 2000 2005 2009
Figure 8: Electric T&D losses
The average CO2 emission factor for power generation has fallen by about 20 percent since 1990, and is now below 450 gCO2 / kWh. The drivers behind that decrease in the amount of CO2 emitted per kWh produced are energy efficiency improve-ments, the increasing share of natural gas and, to a lesser extent, renewables.

68 Germany | Country reports
GermanyEnergy efficiency report
Source: Enerdata
300
350
400
450
500
550
600
gCO
2 /
kWh
1990 1995 2000 2005 2009
Figure 9: CO2 emission factor for power generation
3. Industry3.1. Policies: support for CHPWithin the framework of the 2007 climate-energy plan the share of cogeneration should double by 2020, reaching 25 percent of total electricity production, thanks to a doubling of the current subsidy (to 750 million euros per annum, over $1 billion per annum).Since 2002 the CHP law entitles operators to a bonus on top of the market price for electricity produced from cogeneration plants fed into the grid. The amount of the bonus varies according to the type of installation, from 1.5 euro cents / kWh for existing plants to 5.1 euro cents / kWh for new, small plants (US$0.02 / kWh to US$0.07 / kWh). The federal government supports third-party financing of CHP projects by granting exemptions from the “eco-tax” for cogeneration facilities.
3.2. Energy consumption trends: development of electric-ity and natural gas usesIndustrial energy consumption decreased slightly between 2003 and 2008, by 0.8 percent / year, which is a slightly faster decline than the country’s total energy consumption over the same period. In 2009, the sector’s consumption dropped by 9 percent following the global economic slowdown.
The share of electricity in the sector’s energy consumption has increased significantly, from 25 percent in 1990 to 35 percent in 2009. Natural gas is also playing an increasing role in indus-trial energy consumption: it accounted for 30 percent of the total in 2009 (below 25 percent in 1990). In turn, the use of coal has fallen since 1990, from 35 percent in 1990 to below 20 percent in 2009. Oil represented 5 percent of the total in 2009. An increasing share of industrial energy consumption is met by biomass, which accounted for 5 percent of the total in 2009.The share of energy-intensive industries has increased slightly since 1990 and in 2009 represented around 65 percent of
industrial energy consumption. From among those branches, steel is the largest consuming industry, with 23 percent of overall consumption.
Source: Enerdata
30
35
40
45
50
55
60
65
70
75
Mto
e
1990 1995 2000 2005 2009
Figure 10: Industrial energy consumption
The share of the chemical industry in the sector’s energy con-sumption fell slightly, accounting for 19 percent in 2009. In turn, the share of the paper industry has developed since 1990 and in 2009 represented 10 percent of industrial energy con-sumption (5 percent in 1990). The share of the non-metallic minerals industry is around 10 percent of the total.
Source: Enerdata
0%
10%
20%
30%
40%
50%
60%
70%
80%
90%
100%
1990 2000 2005 2009
Heat
Electricity
Biomass
Gas
Oil
Coal/Lignite
Figure 11: Energy consumption of industry, by source
3.3. Energy intensity trends: large structural effect in ener-gy intensity reductionsBetween 1991 and 2008 consumption per unit of industrial value added (energy intensity) fell by 1.3 percent / year. The largest reductions were seen in the energy intensity of the chemical industry (3.3 percent / year). An above-average decrease in the energy required per tonne produced was also

Country reports | Germany 69
achieved in the cement industry (1.7 percent / year). The energy consumption per tonne of steel has fallen by 0.6 percent / year since 1991, while a 0.4 percent / year decrease was achieved in the paper industry.
Source: Enerdata
0%
10%
20%
30%
40%
50%
60%
70%
80%
90%
100%
Other
Paper
Non metallic minerals
Chemical
Steel
1990 2000 2005 2008
Figure 12: Energy consumption of industry, by branch
Source: Enerdata
-4.0%
-3.5%
-3.0%
-2.5%
-2.0%
-1.5%
-1.0%
-0.5%
0.0%
0.5%
1.0%
Total*
Steel
Chemical
Cement**
*Including construction and mining
**Non metallic minerals
Paper
%/y
ear
1990-2008 2000-2008
Figure 13: Trends in the energy intensity of industrial branches
The share of combined heat and power in the electricity con-sumption of industry has developed rapidly since 2003. It was above 11 percent in 2006 (from just 5 percent in 2003) but has stagnated since then. However, that level remains below the average of EU countries (17 percent in 2009).
Trends in the energy intensity of manufacturing (ie, excluding mining and construction) are influenced by changes in the energy intensities of each industrial branch as well as by changes in the structure of industrial value added. Over the period 1992-2008, the energy intensity of manufacturing decreased by 1.1 percent / year but, when calculated at con-stant structure to remove the effect of these structural chang-
es, the decrease is almost half as fast, at 0.6 percent / year. The difference reflects the impact of changes in the structure of industry, mainly an increase in the share of machinery and transport equipment in the industrial value added, ie, the branch with the lowest energy intensity. This structural effect explains about 45 percent of the total variation. Over the period 2000-2008 the impact of structural changes was even more important. The increasing share of equipment in the total value added led to a reduction in the energy intensity of manufactur-ing, whereas if the value added structure had remained the same the energy intensity would have actually increased.
Source: Enerdata
0%
2%
4%
6%
8%
10%
12%
14%
16%
18%
20%
2003 2004 2005 2006 2007 2008 2009
Figure 14: Share of industrial CHP in industrial consumption
Source: Enerdata
-1.3%
-1.1%
-0.9%
-0.7%
-0.5%
-0.3%
-0.1%
0.1%
0.3%
Real variation
Change at constant structure
Structural effect
%/y
ear
1990-2008 2000-2008
Figure 15: Trends in the energy intensity of manufacturing
and structural effect

70 Canada | Country reports
CanadaEnergy efficiency report
Objectives:
– The country has no quantitative target for energy efficiency
Overview 2009 2000-2009 (% / year)
Primary intensity (EU=100)1 179 -- -1.6% -CO2 intensity (EU=100) 171 -- -1.8% -CO2 emissions per capita (in tCO2 / cap) 15 -- -1.1% -Power generation 2009 2000-2009 (% / year)Efficiency of thermal power plants (in %) 42 + 1.1% +Rate of electricity T&D losses (in %) 8.3 - -0.3% -CO2 emissions per kWh generated (in gCO2 / kWh) 181 ++ -2.1% +Industry 2009* 2000-2009* (% / year)Energy intensity (EU=100) 187 -- -1.6% -Share of industrial CHP in industry consumption (in %) 0.06 -- 0.7% -Unit consumption of steel (in toe / t) 0.51 - -0.2% -*2008 and 2000-2008 for steel
++ Among best countries + Better than the EU average - Below the EU average -- Among countries with lowest performances
1 The European Union, as the best-performing region, is used as the benchmark.
Latest update: January 2011

Country reports | Canada 71
1. Overview1.1. Policies: energy efficiency labels and standards Canada has energy efficiency labels and minimum energy performance standards for a large range of appliances and equipment (more than 40 products are presently concerned). Minimum performance standards for standby power use were implemented in 2010. More stringent standards will follow in 2012.
A new program called the ecoENERGY Efficiency Initiative involves the investment of more than 1 billion Canadian dollars (US$960 million) between 2007 and 2011 to promote smarter energy use in dwellings, public buildings, transport and indus-tries. The largest part is dedicated to the retrofitting of buildings.
1.2. Energy consumption trends: per capita 10% higher than in the USACanada’s energy consumption per capita is very high (7.5 toe in 2009); it is about 10 percent higher than in the US and twice as high as the average of OECD countries.
Over the period 2000-2008 total energy consumption increased by 0.8 percent / year. However, in 2009 it decreased by 5 percent, to just above its 2000 level.
Oil products represent the main source of energy for consum-ers, at 36 percent, followed by natural gas (29 percent) and electricity, the contribution of which is particularly high (21 percent). The structure of consumption is relatively stable.
Source: Enerdata
50
100
150
200
250
300
1990 1995 2000 2005 2009
Mto
e
Primary consumption
Final consumption
Figure 1: Total and final energy consumption trends
The industrial sector is the main energy-consuming sector (39 percent, including 11 percent for non-energy uses), followed by the households and services sector (34 percent) and trans-port (28 percent). The distribution by sector is rather stable.
Source: Enerdata
0%
20%
40%
60%
80%
100%
1990 2000 2005 2009
Households - Services -Agriculture
Transport
Industry (including non energy uses)
Figure 2: Distribution of final energy consumption by sector
The country’s electricity consumption per capita is among the highest in the world, at around 15,000 kWh in 2009, ie, almost twice as high as the OECD average and about 30 percent higher than in the US. Electricity represents 22 percent of final energy consumption. Electricity consumption is dominated by industry (34 percent), followed by households (29 percent) and services (28 percent). Electricity consumption increased on a regular basis between 1990 and 2005 (+1.2 percent per year) when it reached 539 TWh, and has recently decreased (515 TWh in 2009).
Source: Enerdata
0
100
200
300
400
500
600
TWh
Industry Others
1990 1995 2000 2005 2009
Figure 3: Electricity consumption trends by sector

72 Canada | Country reports
CanadaEnergy efficiency report
1.3. Energy efficiency and CO2 trends: nuclear reduces CO2 intensityPrimary energy intensity (total energy consumption per unit of GDP), measured at purchasing power parity, is 50 percent higher than the OECD average and 30 percent higher than in the US. Primary energy intensity has decreased by 1.3 per-cent / year between 1990 and 2009.
On average, over the period 1990 to 2009 final energy intensity decreased at a faster pace than primary energy intensity: the proportion of hydroelectricity production decreased over this period, causing a loss in the energy performance of power generation. CO2 intensity followed a similar pattern. However, since 2000, the increasing share of nuclear power combined with a reduction in the share of power production from coal has led to a slightly more rapid reduction in CO2 intensity.
Source: Enerdata
-2.0%
-1.8%
-1.6%
-1.4%
-1.2%
-1.0%
-0.8%
-0.6%
-0.4%
-0.2%
0.0%
1990-2009 2000-2009
%/y
ear
Primary energy intensity
Final energy intensity
CO2 intensity
Figure 4: Energy and CO2 intensity trends
2. Power generation2.1. Policies: promotion of renewables for power generationThere are federal programs aimed at encouraging the develop-ment of renewables, such as the EPEE program for wind (“Programme d’Encouragement à la Production d’Energie Eolienne”, promotion program for wind generation). However, most of the incentives depend on the policies of the provinces. For instance, in May 2009 Ontario adopted a bill on renewables (Green Energy and Green Economy Act) involving feed-in tariffs: the contribution of renewables (without hydropower) in the total power supply should reach 13 percent in 2018 (10 percent from wind alone). Quebec is developing its wind capacity through several calls for tender: the total wind capac-ity in Quebec should reach between 3,500 MW and 4,000 MW in 2015.
2.2. Power generation trends by source: increase in the share of carbon-based energiesIn 2009 Canada’s electricity production amounted to 620 TWh, showing a decrease compared to 2008 (650 TWh) and bringing it back to its 2005 level. Canada is the world’s third-largest producer of hydroelectricity (367 TWh in 2009, after China and Brazil). On average, hydroelectricity represents 59 percent of production but its share is decreasing (62 percent in 1990); coal and nuclear power follow with 17 percent and 15 percent, respectively, ahead of gas (6 percent), oil and biomass.
Source: Enerdata
0
100
200
300
400
500
600
700
1990 2000 2009
TWh
Other*
Wind
Hydro
Nuclear
Gas
Oil
Coal-Lignite
*Including biomass, geothermal and solar
Figure 5: Power generation by source
2.3. Efficiency of the power sector: close to the OECD average The efficiency of the power sector remained steady between 1990 and 2005, at 58 percent. It has recently increased and in 2009 reached 61 percent thanks to the closure of certain oil power plants and the spread of more efficient technologies like gas power plants. On average, the efficiency of power genera-tion is close to the OECD average. This high ratio is driven by the major role played by hydroelectricity, the efficiency of which is considered to be equal to 100 percent.

Country reports | Canada 73
Source: Enerdata
30
35
40
45
50
55
60
65
%
1990 1995 2000 2005 2009
Total power generation
Thermal power plants
Figure 6: Efficiency of power generation and thermal power plants
Source: Enerdata
0
5
10
15
20
25
30
35
40
45
GW
Steam Gas turbines
1990 1995 2000 2005 2009
Figure 7: Thermal electricity capacity, by technology
The rate of T&D losses in the Canadian grid is above 7 percent of the distributed volumes, ie, higher than in the US (6 percent) but close to the average of OECD countries. Those losses are irregular but tend to increase.
Source: Enerdata
3
4
5
6
7
8
9
10
%
1990 1995 2000 2005 2009
Figure 8: Electric T&D losses
The average CO2 emission factor for power generation is quite low (around 180 gCO2 / kWh in 2009) thanks to the high share of hydroelectricity.
Source: Enerdata
0
50
100
150
200
250
gCO
2 /
kWh
1990 1995 2000 2005 2009
Figure 9: CO2 emission factor for power generation
3. Industry3.1. Policies: ecoENERGY for Industry programThe program “ecoENERGY for Industry” is designed to improve industrial energy efficiency and decrease energy-related indus-trial greenhouse gases. It is expected to achieve energy sav-ings equivalent to the energy used by between 65,000 and 146,000 households.
In 2007, Canada implemented the accelerated Capital Cost Allowance (CCA), under Class 43.1 and 43.2 of Schedule II to the Income Tax Regulations, which entitles investors to an accelerated write-off of certain equipment used to produce energy in a more efficient way or to produce energy from alter-

74 Canada | Country reports
CanadaEnergy efficiency report
native renewable sources.The Cross-cutting Measures for Industry Program involves different measures implemented in 2007, including the expan-sion of the Canadian Industry Program for Energy Conservation (CIPEC); emissions benchmarking studies; improved tracking and reporting of energy efficiency and emission trends; the industrial energy innovators initiative; and support for energy audits.
3.2. Energy consumption trends: drop in consumption in 2008 due to the crisisEnergy consumption in industry increased at a moderate pace between 1990 and 2007 (1.1 percent / year). In 2009, industrial energy consumption was affected by the global economic downturn and dropped by 6 percent. The sector accounted for 20 percent of total energy consumption in 2009.
Source: Enerdata
20
25
30
35
40
45
50
55
60
65
Mto
e
1990 1995 2000 2005 2009
Figure 10: Industrial energy consumption
The share of fossil fuels in the sector’s energy consumption is steady over time, at around 58 percent. The use of gas has increased slightly, from 35 percent of the total to around 39 percent in 2009. The use of electricity to meet energy needs in industry has been stable since 1990, at around 30 percent. Biomass is quite developed and accounted for 12 percent of the total in 2009.
The share of energy-intensive industries has fallen since 1990, from 54 percent of the sector’s consumption to 40 percent in 2008, since the industrial structure has evolved during this time. Consumption by the paper industry in particular decreased from 31 percent in 1990 to 23 percent in 2008, in line with a lower share in the industrial value added.
Source: Enerdata
0%
10%
20%
30%
40%
50%
60%
70%
80%
90%
100%
1990 2000 2005 2009
Biomass
Electricity
Gas
Oil
Coal/Lignite
Figure 11: Energy consumption of industry, by source
Source: Enerdata
Other
Paper
Non metallic minerals
Chemical
Steel
1990 2000 2005 2008
0%
10%
20%
30%
40%
50%
60%
70%
80%
90%
100%
Figure 12: Energy consumption of industry, by branch
3.3. Energy intensity trends: noticeable energy efficiency improvementsBetween 1990 and 2008 energy consumption per unit of industrial value added decreased by 1.3 percent / year. Energy consumption per unit of production decreased significantly in the cement and chemical industries (around -3 percent / year and -6 percent / year, respectively, over the periods 1990-2008 and 2000-2008 for both branches). In the steel industry, energy efficiency was improved by 0.9 percent / year over the period 1990-2008.

Country reports | Canada 75
Source: Enerdata
-7%
-6%
-5%
-4%
-3%
-2%
-1%
0%
1%
Total*
Steel
Chemical
Cement**
Paper
%/y
ear
1990-2008 2000-2008
*Including construction and mining
**Non metallic minerals
Figure 13: Trends in the energy intensity of industrial branches

76 France | Country reports
FranceEnergy efficiency report
Objectives:
– 139 TWh of end-user energy savings, or about 9 percent, in 2016– 345 TWh of lifetime energy savings obligations for energy distributors over 2010-2013
Overview 2009 2000-2009 (% / year)
Primary intensity (EU=100)1 109 - -1.3% -CO2 intensity (EU=100) 68 ++ -2.2% +CO2 emissions per capita (in tCO2 / cap) 5.4 + -1.6% +Power generation 2009 2000-2009 (% / year)Efficiency of thermal power plants (in %) 33 - -0.6% --Rate of electricity T&D losses (in %) 7 - -0.3% -CO2 emissions per kWh generated (in gCO2 / kWh) 83 ++ 0.9% --Industry 2009* 2000-2009* (% / year)Energy intensity (EU=100) 95 + -2.9% +Share of industrial CHP in industry consumption (in %) 10 - 3.1% -Unit consumption of steel (in toe / t) 0.34 - 0.7% --*2008 and 2000-2008 for steel
++ Among best countries + Better than the EU average - Below the EU average -- Among countries with lowest performances
1 The European Union, as the best-performing region, is used as the benchmark.
Latest update: January 2011

Country reports | France 77
1. Overview1.1. Policies: 9 percent energy savings target for 2008-2016France has adopted a National Energy Efficiency Action Plan 2008-2016 (NEEAP), which sets an energy savings target of at least 9 percent between 2008 and 2016, ie, 139 TWh (12 Mtoe) in buildings, transport and small industries (excluding sectors under ETS). The 2005 energy law aims to reduce final energy intensity by 2 percent / year by 2015 and implements energy saving obliga-tions for energy utilities, known as the energy savings certifi-cate scheme. This scheme set the volume of energy savings for energy companies over a first period from July 2006 until July 2009 at 54 TWh (lifetime cumulative savings), split accord-ing to energy source. At the end of the first period the volume of certificates exceeded the target and amounted to 65 TWh. Most of the certificates were obtained in residential buildings (above 85 percent). A second period of white certificates was approved in December 2010 and extended to the transport sector. The target is to reach 345 TWh (lifetime cumulated) over 2010-2013.
In the framework of the Finance Law 2005, the government reinforced the tax credit system, which can go up to 50 per-cent, to support the diffusion of energy efficiency materials.
1.2. Energy consumption trends: higher than EU averageFrance has one of the highest levels of energy consumption in the European Union. In 2009 France’s total consumption per capita was 4 toe, which is 20 percent above the European average. Over the period 2000-2008 total energy consumption increased by 0.5 percent / year. However, in 2009 it decreased by 5 percent, to just below its 2000 level.
Nuclear power is the principal energy source, with a stable share of over 40 percent of total consumption. Oil meets 30 percent of the energy needs and its share has been decreasing since 1990. The role of natural gas in the energy supply has increased over time and accounts for 15 percent of the total. The contribution of coal was scaled down from 9 percent in 1990 to 4 percent in 2009, while the use of biomass remains low (6 percent in 2009).
Source: Enerdata
60
110
160
210
260
310
1990 1995 2000 2005 2009M
toe
Primary consumption
Final consumption
Figure 1: Total and final energy consumption trends
The share of industry in energy consumption fell from 35 per-cent in 1990 to around 25 percent in 2009 (including non-ener-gy uses). The households, services and agriculture sectors absorb more than 40 percent of consumption and the trans-port sector around 30 percent.
Source: Enerdata
0%
20%
40%
60%
80%
100%
1990 2000 2005 2009
Households - Services -Agriculture
Transport
Industry (including non energy uses)
Figure 2: Distribution of final energy consumption by sector
The country’s electricity consumption per capita is significantly higher than the European average due to the high penetration of electric heating (7,250 kWh in 2009, compared with 5,650 kWh in the EU). The share of electricity in final energy con-sumption is increasing steadily and reached 23 percent in 2009 (compared with 18 percent in 1990). The country’s electricity demand has been increasing relatively rapidly: almost 2 per-cent / year on average since 1990 and over 1 percent / year since 2000. It dropped by 2 percent in 2009, with a significant reduction of power consumption in the industrial sector.

78 France | Country reports
FranceEnergy efficiency report
Source: Enerdata
0
50
100
150
200
250
300
350
400
450
500
Industry Others
1990 1995 2000 2005 2009
TWh
Figure 3: Electricity consumption trends by sector
1.3. Energy efficiency and CO2 trends: reductions achieved since 1990Total energy consumption per unit of GDP (primary energy intensity), measured at purchasing power parity, is 9 percent higher than the EU average.
This total energy intensity has decreased at a slower pace than in the EU as a whole, at 1 percent / year compared with 1.7 percent / year for the EU between 1990 and 2009. Despite energy substitution and the diffusion of more efficient technolo-gies achieved over the period, this drop in total energy intensity was not as fast as the reduction in final energy consumption per unit of GDP (final intensity). This trend is related to the increasing share of electricity in the energy supply, which leads to growing conversion losses in power generation, since most of the electricity is produced from nuclear, which has a low efficiency rate.
CO2 emissions per unit of GDP (CO2 intensity) decreased almost twice as fast as the total energy intensity over the period 1990-2009 due to substitutions of oil and coal by elec-tricity, natural gas and biomass; fuel substitutions explain about 40 percent of the CO2 intensity reduction.
Source: Enerdata
-2.5%
-2.0%
-1.5%
-1.0%
-0.5%
0.0%
1990-2009 2000-2009
%/y
ear
Primary energy intensity
Final energy intensity
CO2 intensity
Figure 4: Energy and CO2 intensity trends
2. Power generation2.1. Policies: +38 GW of renewable capacities by 2020According to the European Directive that promotes the use of energy derived from renewable sources, the national target is to increase the share of renewables in final consumption to 23 percent by 2020.
The European target was included in the framework of a pro-gram called Grenelle de l’Environnement, which defines installed capacity targets for electricity production from renew-able energies in 2020: 25,000 MW of wind, 6,000 MW of which is offshore; 5,400 MW of solar photovoltaic; 2,300 MW of biomass; and 3,000 MW of hydroelectric for peak periods.
The development of renewables is supported through the purchase of electricity generated from renewables at feed-in tariffs. The implementation of a Solar Plan, as from 2000, through tax credit (raised to 50 percent for the installation of either photovoltaic or thermal solar panels in 2006), has result-ed in a rapid growth of the solar photovoltaic market. In Janu-ary 2010 the Government clarified the conditions that need to be met in order to benefit from the new feed-in tariffs intro-duced in 2009, and which should stay unchanged until 2012. However, feed-in tariffs for large installations were cut by 12 percent with effect from September 2010, in an effort to soften the rapid development of new solar energy capacities. In the framework of its 2011 budget, France announced a reduction in the tax break for household-solar installations from 50 per-cent to 25 percent as of September 2010.

Country reports | France 79
2.2. Power generation trends by source: CO2-free genera-tion mixFrance has the world’s largest share of nuclear in electricity production. More than 75 percent of electricity is generated from nuclear power, while hydroelectricity represents around 10 percent of power generation. Wind energy accounted for 1 percent of the total in 2009. Consequently, more than 85 percent of electricity generation is CO2-free.
Within thermal generation, the use of coal and oil has been decreasing since 1990 to the benefit of natural gas, which reached 4 percent of total production in 2009 (2 percent in 2000). Despite the fact that its market share fell sharply, coal was still the largest thermal source for power generation in 2009.
Source: Enerdata
0
100
200
300
400
500
600
1990 2000 2009
TWh
Other*
Wind
Hydro
Nuclear
Gas
Oil
Coal-Lignite
*Including biomass, geothermal and solar
Figure 5: Power generation by source
2.3. Efficiency of the power sector: low efficiency rates in power generationThe efficiency of the power sector has decreased since 1990 and stood at 36 percent in 2009. The ratio is driven by the major role played by nuclear energy, which has the lowest power generation efficiency rate.
Source: Enerdata
30
32
34
36
38
40
42
44
%
1990 1995 2000 2005 2009
Total power generation
Thermal power plants
Figure 6: Efficiency of power generation and thermal power plants
Source: Enerdata
0
5
10
15
20
25
30
GW
1990 1995 2000 2005 2009
Steam Gas turbines Combined cycles
Figure 7: Thermal electricity capacity, by technology
The rate of T&D losses in the French grid is just below 7 per-cent of the distributed volumes, slightly above the EU average. These losses have been decreasing slightly over time (8 per-cent in 1990).

80 France | Country reports
FranceEnergy efficiency report
Source: Enerdata
3
4
5
6
7
8
9
10
%
1990 1995 2000 2005 2009
Figure 8: Electric T&D losses
The average CO2 emission factor for power generation is very low since more than 85 percent of the electricity is produced from CO2-free technologies. The amount of CO2 emitted per kWh produced is around 80 gCO2.
Source: Enerdata
0
20
40
60
80
100
120
140
gCO
2 /
kWh
1990 1995 2000 2005 2009
Figure 9: CO2 emission factor for power generation
3. Industry3.1. Policies: EU Emission Trading Scheme main driver of improvementsThe main driver of energy efficiency improvements is the EU ETS that sets CO2 quotas in energy-intensive branches. Energy audits in industry are subsidized at rates between 50 percent and 70 percent depending on the type of audit. Combined heat and power generation is supported through a feed-in tariff of between €6.1c / kWh and €9.15c / kWh (US$0.085-0.127 / kWh),, depending on factors including capacity, the natural gas price or even the number of operating hours.
3.2. Energy consumption trends: increase in electricity and natural gas demandEnergy consumption in industry increased at a moderate pace between 1990 and 2000 (0.8 percent / year), but has decreased by 3 percent / year since then. In 2009, industrial energy consumption was impacted by the global economic downturn and dropped by 9 percent.
Source: Enerdata
20
25
30
35
40
45
50
1990 1995 2000 2005 2009
Mto
e
Figure 10: Industrial energy consumption
The share of fossil fuels in the sector’s energy consumption has fallen over time, from around 70 percent in 1990 to 60 percent in 2009. The use of electricity to meet energy needs in industry has increased since 1990, from 28 percent in 1990 to 35 percent in 2009. Biomass is also developing and reached 5 percent of the total in 2009. The use of coal has been scaled down from 25 percent to around 15 percent of the total in 2009. In turn, the share of natural gas has developed and accounted for half of the fossil fuels used in industry in 2009 (30 percent of the total).
The share of energy-intensive industries has fallen slightly since 1990, from 60 percent of the sector’s consumption to below 55 percent in 2008. Consumption by the steel industry in particu-lar fell from 23 percent in 1990 to 16 percent in 2008. The shares of the chemical and paper industries fell slightly over the period. In turn, energy consumption in the non-metallic metals industry represented 13 percent of the sector’s consumption in 2008, up from 11 percent in 1990.
3.3. Energy intensity trends: noticeable energy intensity reductionsBetween 1990 and 2008, the energy consumption per unit of industrial value added decreased by 1.5 percent / year. A significant reduction of energy consumption per unit of value added was seen in the chemical industry (above 3.5 per-cent / year). In the steel industry the energy used per tonne of

Country reports | France 81
steel decreased by 1.2 percent / year over the period 1990-2008, while the energy required per tonne of paper decreased by 0.9 percent / year. Energy efficiency in the cement industry did not improve since the energy consumption per tonne of cement increased slightly.
The sector’s energy intensity was not only influenced by energy efficiency improvements but also by changes in the structure of the industrial value added. When calculated at constant struc-ture, the energy intensity of manufacturing has decreased to a lesser extent, by 0.3 percent / year, compared with 1.1 per-cent / year for the actual value. The difference is due to struc-tural changes in the industry, which tend toward a growing share of machinery and transport equipment, a branch with the lowest energy intensity when measuring value added in the manufacturing industry. The structural effect explains 70 per-cent of the total variation over the period 2000-2008 and 60 percent between 1990 and 2008.
Source: Enerdata
0%
10%
20%
30%
40%
50%
60%
70%
80%
90%
100%
1990 2000 2005 2009
Biomass
Electricity
Gas
Oil
Coal/Lignite
Figure 11: Energy consumption of industry, by source
Source: Enerdata
Other
Paper
Non metallic minerals
Chemical
Steel
1990 2000 2005 2008
0%
10%
20%
30%
40%
50%
60%
70%
80%
90%
100%
Figure 12: Energy consumption of industry, by branch
Source: Enerdata
-4.5%
-4.0%
-3.5%
-3.0%
-2.5%
-2.0%
-1.5%
-1.0%
-0.5%
0.0%
0.5%
1.0%
Total*
Steel
Chemical
Cement**
*Including construction and mining
**Non metallic minerals
Paper%
/yea
r
1990-2008 2000-2008
Figure 13: Trends in the energy intensity of industrial branches
Source: Enerdata
4%
5%
6%
7%
8%
9%
10%
11%
200220012000 2003 2004 2005 2006 2007 2008 2009
Figure 14: Share of industrial CHP in industrial consumption
Source: Enerdata
-1.6%
-1.4%
-1.2%
-1.0%
-0.8%
-0.6%
-0.4%
-0.2%
0.0%
Real variation
Change at constant structure
Structural effect
%/y
ear
1990-2008 2000-2008
Figure 15: Trend in the energy intensity of manufacturing
and structural effect

82 Brazil | Country reports
BrazilEnergy efficiency report
Objectives:
– 109 TWh of electricity savings by 2030
1 The European Union, as the best-performing region, is used as the benchmark.
Overview 2009 2000-2009 (% / year)
Primary intensity (EU=100)1 109 - -0.4% --CO2 intensity (EU=100) 69 ++ -1.9% -
CO2 emissions per capita (in tCO2 / cap) 1.7 ++ 0.0% -Power generation 2009 2000-2009 (% / year)Efficiency of thermal power plants (in %) 42 + 2.1% ++Rate of electricity T&D losses (in %) 16 -- -0.1% --CO2 emissions per kWh generated (in gCO2 / kWh) 56 ++ -4.5% ++Industry 2009* 2000-2009* (% / year)Energy intensity (EU=100) 213 -- -0.1% --Unit consumption of steel (in toe / t) 0.62 -- 0.2% -*2008 and 2000-2008 for steel
++ Among best countries + Better than the EU average1 - Below the EU average1 -- Among countries with lowest performances
Latest update: February 2011

Country reports | Brazil 83
1. Overview1.1. Policies: 109 TWh of electricity savings by 2030In December 2008 Brazil’s president signed the National Cli-mate Change Plan (PNMC). The plan largely focuses on reduc-ing deforestation. The Plan also contains provisions regarding energy efficiency and renewable energy. It seeks to increase energy efficiency across various sectors of the economy in line with best practices, and to maintain the high renewable energy mix in Brazil’s transport and electricity sectors.
A national energy efficiency action plan is foreseen to fall within the framework of the PNMC. It will involve a reduction in elec-tricity consumption of around 10 percent by 2030 compared with a reference scenario (equivalent to savings of 106 TWh), which would avoid 30 million tons of CO2 emissions that same year. The plan also involves the replacement of one million old refrigerators per year for 10 years. Lastly, the plan aims to improve energy efficiency in industry, transport and buildings.
In December 2009, Brazil announced it would decrease its total greenhouse gas emissions by 36.1-38.9 percent by 2020 compared with a business as usual scenario; although the largest part would be achieved through a reduction in defores-tation and land use changes, 6.1-7.7 percent of the reduction would come from energy uses.
1.2. Energy consumption trends: rapid increaseAt 1.2 toe, Brazil’s per capita consumption is 31 percent lower than the world average of 1.8 toe.
Total energy consumption increased at the rapid pace of 3 percent / year between 1990 and 2008. In 2009 it decreased as a consequence of the global economic crisis. Final consump-tion followed the same trend as total energy consumption.Oil is the main source of energy, accounting for 40 percent of the country’s overall consumption. Non-commercial energy sources (wood, bagasse) come second with 32 percent, fol-lowed by hydroelectricity (14 percent), gas (7 percent), coal (5 percent) and nuclear power (3 percent).
Source: Enerdata
Primary consumption
Final consumption
60
80
100
120
140
160
180
200
220
240
260
Mto
e1990 1995 2000 2005 2009
Figure 1: Total and final energy consumption trends
Industry plays an important role in final energy consumption (46 percent, including non-energy uses). The transport sector is also a large consumer: it absorbs one-third of final con-sumption and is a large consumer of biomass (alcohol con-sumption accounts for 20 percent of transport consumption). The households, services and agriculture sector accounts for just 22 percent of final energy consumption (2009). The distri-bution of final energy consumption by sector is relatively stable.
Source: Enerdata
0%
20%
40%
60%
80%
100%
1990 2000 2005 2009
Households - Services -Agriculture
Transport
Industry (including non energy uses)
Figure 2: Distribution of final energy consumption by sector
The country’s electricity consumption per capita is 16 percent lower than the world average, but 45 percent higher than the average of non-OECD countries (2,100 kWh in 2009, com-pared with 2,500 kWh world average). It is still more than three times lower than the average of OECD countries. Total electric-ity consumption increased at the steady pace of 3.5 per-cent / year between 1990 and 2009, except in 2001 / 2002

84 Brazil | Country reports
BrazilEnergy efficiency report
when it decreased by 7 percent because of a low level of hydro production linked to a severe drought.
Electricity represents 18 percent of final energy consumption, and its market share is increasing slightly (16 percent in 1990). Sectoral shares have remained roughly stable over the last decade. Industry absorbs nearly half of the consumption (25 percent for services and 24 percent for the households sector).
Source: Enerdata
0
50
100
150
200
250
300
350
400
450
TWh
Industry Others
1990 1995 2000 2005 2009
Figure 3: Electricity consumption trends by sector
1.3. Energy efficiency and CO2 trends: overall energy efficiency improvements since 2000Total energy consumption per unit of GDP (primary energy intensity), measured at purchasing power parity, is about 31 percent lower than the world average
Total energy intensity has been decreasing at a moderate pace since 2000 (less than 0.5 percent per year between 2000 and 2009), and more slowly than the world average (1.3 per-cent / year). The reduction in final energy intensity (final energy consumption per unit of GDP) was slightly faster over the same period.
Since 2000, CO2 emissions per unit of GDP (CO2 intensity) have decreased more rapidly than total energy intensity (almost 2 percent per year), thanks to fuel switches to CO2-free fuels and, in particular, to the declining market share of oil (47 per-cent in 2000 compared with 40 percent in 2009).
Source: Enerdata
-2.5%
-2.0%
-1.5%
-1.0%
-0.5%
0.0%
0.5%
1990-2009 2000-2009
%/y
ear
Primary energy intensity
Final energy intensity
CO2 intensity
Figure 4: Energy and CO2 intensity trends
2. Power generation2.1. Policies: promotion of power production from renew-able energiesIn 2002, a program was launched to encourage the develop-ment of renewable energies (PROINFA) and to raise the share of renewables in primary consumption to 10 percent by 2020. The program contributed to Brazil becoming the largest wind producer in Latin America, with a capacity of 610 MW at the end of 2009. In 2008, the decision was made to award new contracts through competitive bidding. In 2009, tax exemp-tions for the wind energy industry were extended until January 2012. Brazil’s wind capacity is expected to increase rapidly resulting from projects submitted to the first wind power auc-tion in 2009 totaling 13 GW followed in 2010 by further tenders for 3 GW.
Since 1998 the Brazilian energy regulator, ANEEL, has imposed obligations on electric power distribution companies to make investments that reduce electric waste, including the taking of energy efficiency measures.
2.2. Power generation trends by source: large share of hydroelectricityBrazil is the world’s second-largest hydroelectricity producer after China, with a production of 390 TWh in 2009, and the country has one of the world’s largest shares of hydroelectricity production: 84 percent in 2009, while 5 percent of electricity is generated from biomass. Over 13 percent of electricity produc-tion comes from thermal plants and 3 percent from nuclear power. CO2-free electricity generation represents almost 92 percent of total power generation; it has fallen slightly since 1990 when it was around 94 percent (hydroelectricity account-ed for about 93 percent of that amount).

Country reports | Brazil 85
Source: Enerdata
0
50
100
150
200
250
300
350
400
450
500
TWh
Other*
Wind
Hydro
Nuclear
Gas
Oil
Coal-Lignite
1990 2000 2009
*Including biomass, geothermal and solar
Figure 5: Power generation by source
2.3. Efficiency of the power sector: high efficiency thanks to hydro Thanks to the large share of hydroelectricity, the efficiency of power generation is high compared with international stan-dards. In 2009 the average efficiency of thermal power genera-tion was equal to 42 percent, which is 7 points higher than the world average, thanks to the deployment of new gas combined cycle power plants since 2000.
Source: Enerdata
30
40
50
60
70
80
90
100
%
1990 1995 2000 2005 2009
Total power generation
Thermal power plants
Figure 6: Efficiency of power generation and thermal power plants
Source: Enerdata
0
5
10
15
20
25
30
GW
Steam Combined cycles
1990 1995 2000 2005 2009
Figure 7: Thermal electricity capacity, by technology
The rate of T&D losses in the Brazilian grid is above 16 percent of the distributed volumes, ie, higher than the world average (9 percent). Those losses have increased slightly over time (13 percent in 1990). The PNMC aims to decrease non-technical losses in electricity distribution at a rate of 1,000 GWh per year for the next 10 years.
Source: Enerdata
10
11
12
13
14
15
16
17
18
%
1990 1995 2000 2005 2009
Figure 8: Electric T&D losses
Thanks to the large share of hydropower, the average CO2 emission factor for power generation is almost 10 times lower than the world average at just 56 gCO2 / kWh in 2009, and remains relatively stable.

86 Brazil | Country reports
BrazilEnergy efficiency report
Source: Enerdata
0
10
20
40
60
100
120
140
gCO
2 /
kWh
1990 1995 2000 2005 2009
Figure 9: CO2 emission factor for power generation
3. Industry3.1. PoliciesThere is no specific policy for the industrial sector.
3.2. Energy consumption trends: decrease due to global crisisIndustrial energy consumption increased at the steady pace of 3.5 percent / year between 1990 and 2008. The global crisis had a significant impact, since industrial energy consumption dropped by 6.3 percent in 2009.
Source: Enerdata
20
30
40
50
60
70
80
90
Mto
e
1990 1995 2000 2005 2009
Figure 10: Industrial energy consumption
Biomass represents a high share of industrial energy consump-tion, with more than 43 percent. It has increased slightly since 1990 (40 percent). In 2009 electricity accounted for 21 percent of that consumption, oil for 16 percent and coal for 10 percent. The use of natural gas has increased over time, but accounted for just 9 percent in 2009.
The share of energy-intensive industries in industrial energy consumption has fallen slightly since 1990, now accounting for about half of that consumption. The steel industry’s share of energy consumption in particular has decreased steadily and is now just above 20 percent. The share of the chemical industry has also declined, while the non-metallic minerals (cement, ceramics, etc.) and paper industries have maintained their shares over the period.
Source: Enerdata
0%
10%
20%
30%
40%
50%
60%
70%
80%
90%
100%
1990 2000 2005 2009
Biomass
Electricity
Gas
Oil
Coal/Lignite
Figure 11: Energy consumption of industry, by source
Source: Enerdata
0%
10%
20%
30%
40%
50%
60%
70%
80%
90%
100%
1990 2000 2005 2008
Other
Paper
Non metallic minerals
Chemical
Steel
Figure 12: Energy consumption of industry, by branch

Country reports | Brazil 87
3.3. Energy intensity trends: no reduction in intensityOver the period 1990-2008, consumption per unit of industrial value added (energy intensity) increased by 0.4 percent / year. However, in certain branches energy efficiency improvements gained momentum; in the cement and steel industries, for instance, energy consumption per ton produced decreased by 2 percent / year and 0.6 percent / year, respectively.
Source: Enerdata
-5%
-4%
-3%
-2%
-1%
0%
1%
2%
3%
4%
Total*
Steel
Chemical
Cement**
Paper
%/y
ear
1990-2008 2000-2008
*Including construction and mining
**Non metallic minerals
Figure 13: Trends in the energy intensity of industrial branches

88 South Korea | Country reports
South KoreaEnergy efficiency report
Objectives:
– 38 Mtoe of end-user energy savings by 2030
Overview 2009 2000-2009 (% / year)
Primary intensity (EU=100)1 154 -- -1.5% -CO2 intensity (EU=100) 161 -- -1.5% -CO2 emissions per capita (in tCO2 / cap) 10.6 -- 1.9% --Power generation 2009 2000-2009 (% / year)Efficiency of thermal power plants (in %) 40 + -0.3% -Rate of electricity T&D losses (in %) 4 ++ -2.0% +CO2 emissions per kWh generated (in gCO2 / kWh) 489 - 1.2% --Industry 2009* 2000-2009* (% / year)Energy intensity (EU=100) 137 - -3.7% +Share of industrial CHP in industry consumption (in %) 11 - -3.2% --Unit consumption of steel (in toe / t) 0.34 + 1.2% --*2008 and 2000-2008 for steel
++ Among best countries + Better than the EU average - Below the EU average -- Among countries with lowest performances
1 The European Union, as the best-performing region, is used as the benchmark.
Latest update: February 2011

Country reports | South Korea 89
1. Overview1.1. Policies: 38 Mtoe of energy savings by 2030Since 1993 South Korea has developed five-year Basic Ratio-nal Energy Utilization Plans. The 4th Basic Plan 2008-2012 set an energy intensity reduction target of 11.3 percent between 2007 and 2012. In 2008, South Korea announced its Basic National Energy Plan 2008-2030, which aims to reduce energy intensity by 46 percent between 2007 and 2030. The overall energy savings goal for 2030 is nearly 38 Mtoe, 44 percent of which should be from industry (17 Mtoe), 32 percent from the households and services sector (12 Mtoe), 19 percent from the transport sector (7 Mtoe), and 5 percent from the public sector (1.9 Mtoe).
The Korean Energy Management Corporation (KEMCO), cre-ated in 1980 through the Rational Energy Utilization Act, imple-ments the energy efficiency programs. The Rational Energy Utilization Act (1979) was amended in 2002, 2003 and 2008 to introduce new energy-saving measures. Three labeling pro-grams have been launched to promote high-efficiency appli-ances: the Energy Efficiency Standards and Labeling Program (1992), the High-efficiency Appliances Certification Program (1996) and the E-Standby Program (1999).
South Korea’s energy efficiency strategy includes building codes for new buildings over a certain size and a certification system; businesses with buildings that consume more than 2 ktoe / year can participate in Energy Saving Partnerships or enter into voluntary agreements. Businesses and individuals who invest in energy-saving facilities are entitled to tax reduc-tions (up to 20 percent of investment costs for a year) or low-interest loans. Energy service companies (ESCOs) have been operating since 1992.
1.2. Energy consumption trends: buoyant energy consumption South Korea’s energy consumption per capita is more than twice as high as the world average (around 5 toe / cap in 2009) and has been higher than the OECD average since 2007 (+11 percent in 2009). The strong growth in total energy consump-tion (4.9 percent / year for primary consumption between 1990 and 2009) was only interrupted briefly by the Asian crisis in 1998.
Source: Enerdata
0
50
100
150
200
250
1990 1995 2000 2005 2009M
toe
Primary consumption
Final consumption
Figure 1: Total and final energy consumption trends
Oil is the most popular fuel in South Korea, with 40 percent of primary consumption in 2009 (54 percent in 1990), followed by coal (28 percent in 2009). Nuclear accounts for 17 percent of primary consumption (15 percent in 1990). The share of gas rose to 13 percent in 2009, from 3 percent in 1990. Biomass represents just 3 percent of primary consumption.
Industry is the largest consuming sector in South Korea and its share in final consumption is increasing from 43 percent in 1990 to 55 percent in 2009 (including non-energy uses), while the households and services sector share is falling, with its share dropping from 36 percent in 1990 to 26 percent in 2009. The share of transport has remained relatively stable over time (19 percent in 2009).
Source: Enerdata
0%
20%
40%
60%
80%
100%
1990 2000 2005 2009
Households - Services -Agriculture
Transport
Industry (including non energy uses)
Figure 2: Distribution of final energy consumption by sector

90 South Korea | Country reports
South KoreaEnergy efficiency report
Electricity consumption per capita is high at around 8,500 kWh / cap in 2009, which is more than three times as high as the world average and 12 percent higher than the OECD aver-age. Total electricity consumption is growing very rapidly: around 8 percent / year on average between 1990 and 2009, which is almost twice as fast as final consumption. The share of electricity in final energy consumption has almost doubled since 1990, from 12 percent to 23 percent in 2009.
Source: Enerdata
0
50
100
150
200
250
300
350
400
450
TWh
Industry Others
1990 1995 2000 2005 2009
Figure 3: Electricity consumption trends by sector
The electricity consumption growth of industry was rapid (+5.8 percent / year). However, this sector’s share in electricity con-sumption fell from 61 percent in 1990 to 51 percent in 2009, as a result of an even stronger demand from the households and services sector (+9.2 percent / year).
1.3. Energy efficiency and CO2 trends: significant improve-ment for final consumers Primary energy intensity (primary energy per unit of GDP, measured at purchasing power parity) is much higher than the EU average (around 50 percent). In 2009 primary energy inten-sity was almost at the same level as in 1990 (-0.1 percent / year).
Contrary to primary intensity, final energy intensity (final energy per unit of GDP) decreased significantly, by 1.4 percent / year between 1990 and 2009 indicating improvements in consumer energy efficiency. Those divergent trends between the primary and final intensities can be explained by increasing losses in power generation. Those losses are due to the very rapid increase in electricity consumption and the high share of low-efficiency power plants in the electricity generation mix; since 2009 coal-fired, oil-fired and nuclear power plants have accounted for more than 80 percent of power generation. Larger improvements took place between 2000 and 2009, with final intensity declining by 2.6 percent / year.
CO2 intensity (CO2 emissions per unit of GDP) decreased slightly by 0.8 percent / year between 1990 and 2009. Most of that decrease (around 90 percent) can be attributed to fuel substitutions: the share of oil and coal in primary consumption declined by 13 percentage points between 1990 and 2009.
Source: Enerdata
-3.0%
-2.5%
-2.0%
-1.5%
-1.0%
-0.5%
0.0%
1990-2009 2000-2009
%/y
ear
Primary energy intensity
Final energy intensity
CO2 intensity
Figure 4: Energy and CO2 intensity trends
2. Power generation2.1. Policies: 11% share of renewables in total energy consumption by 2030According to its National Energy Plan 2008-2030, South Korea aims to produce 11 percent of the energy it consumes from renewables by 2030; intermediate targets are set at 4.3 per-cent in 2015 and 6.1 percent in 2020.
The government provides subsidies to accelerate the develop-ment of renewables, and more specifically to reach its target of “one million green homes” equipped with PV, solar thermal or wind installations. Subsidies are granted to regions to carry out renewable projects. Low-interest loans were created to cover up to 90 percent of the installation cost of renewable facilities (up to 50 percent for large corporations) and up to 20 percent of the investment can be tax-exempted. Renewable Energy Service Companies (RESCOs) were created in 2005 to contrib-ute to the development of the domestic renewable industry.In 2002 South Korea also introduced feed-in tariffs for PV, wind, hydropower, waste, biomass and biogas, tidal power and fuel cells. Incentive tariffs for PV will be changed into a Renew-able Portfolio Standard (RPS) as of 2012. In 2005 nine energy companies signed an agreement with the government, known as the Renewable Portfolio Agreement, to invest in renewable energies.

Country reports | South Korea 91
2.2. Power generation trends by source: nuclear power overtaken by coal generationSouth Korea’s electricity mix is divided between thermal gen-eration (65 percent in 2009) and nuclear power (33 percent). The share of coal has increased dramatically, from 17 percent in 1990 to 47 percent in 2009, while gas-fired generation rose from 9 percent to 15 percent. The share of oil fell from 18 percent to 3 percent. CO2-free generation accounts for 35 percent of the power mix and mainly consists of nuclear power (renewables account for less than 2 percent).
Source: Enerdata
0
50
100
150
200
250
300
350
400
450
500
1990 2000 2009
TWh
Other*
Wind
Hydro
Nuclear
Gas
Oil
Coal-Lignite
*Including biomass, geothermal and solar
Figure 5: Power generation by source
2.3. Efficiency of the power sector: rising share of com-bined-cycle power plants The average efficiency of power generation increased slightly between 1990 and 2000; it then remained stable at around 38 percent (2009). This improvement is linked to the growth in the efficiency rate of thermal power plants (from 32 percent in 1990 to around 40 percent since 2000), which was achieved through a switch to natural gas in the generation mix and through a growing share of combined cycle power plants in the thermal capacity. Combined cycle power plants now account for one third of the thermal capacity.
Source: Enerdata
Total power generation
Thermal power plants
30
32
34
36
38
40
42
44
%
1990 1995 2000 2005 2009
Figure 6: Efficiency of power generation and thermal power plants
Source: Enerdata
0
5
10
15
20
25
30
35
40
45
Steam
GW
1990 1995 2000 2005 2009
Figure 7: Thermal electricity capacity, by technology
South Korea’s rate of T&D losses is among the lowest in the world (3.8 percent in 2009).

92 South Korea | Country reports
South KoreaEnergy efficiency report
Source: Enerdata
1
2
3
4
5
6
7
8
%
1990 1995 2000 2005 2009
Figure 8: Electric T&D losses
Despite a significant share of nuclear power (33 percent), the carbon factor (CO2 emissions per kWh produced) is high at around 500 gCO2 / kWh. The downward trend in CO2 emissions per kWh was broken in 2005 when the growth in nuclear gen-eration was interrupted.
Source: Enerdata
300
350
400
450
500
550
600
gCO
2 /
kWh
1990 1995 2000 2005 2009
Figure 9: CO2 emission factor for power generation
3. Industry3.1. Policies: 17 Mtoe of energy savings by 2030The Basic National Energy Plan 2008-2030 sets an energy use reduction target of nearly 17 Mtoe in industry by 2030 (a 13 percent reduction, approximately, from a BAU scenario).
KEMCO promotes five-year voluntary agreements with indus-trial groups; businesses that enter into voluntary agreements or invest in energy-saving technologies are entitled to financial and technical support and tax credits covering up to 20 per-cent of the investment cost. Since 2007 large energy consum-
ers (over 2 ktoe / year) have to carry out mandatory energy audits every 5 years; in the case of small and medium sized enterprises (under 5 ktoe / year) up to 90 percent of the audit costs can be subsidized. Under the Integrated Energy Supply Act (1999), industries that invest in CHP plants for their own supply of heat are entitled to tax reductions.
The Energy Saving Partnership Program (ESP) aims to share new energy saving technologies within the industrial branches; factories consuming more than 20 ktoe can participate in the ESP (over 10 ktoe in the automobile, food, electrical and elec-tronics industries). To date, 195 companies are involved in this program, which has made it possible to save 285 ktoe of fuel and 393 GWh of electricity between 2000 and 2007.
3.2. Energy consumption trends: soaring industrial energy demandThe energy consumption of South Korea’s industry doubled between 1990 and 2000 (despite the 1998 drop caused by the Asian crisis) and grew by 1.3 percent / year between 2000 and 2008. In 2009 energy consumption fell by 6.7 percent, as industry was hit by the global economic downturn.
Source: Enerdata
20
25
30
35
40
45
50
55
Mto
e
1990 1995 2000 2005 2009
Figure 10: Industrial energy consumption
The energy mix in industrial consumption changed dramatically between 1990 and 2009. The share of oil, which accounted for 48 percent of energy consumption, fell significantly and now accounts for just 11 percent. Oil was progressively replaced by electricity (from 22 percent to 36 percent of industrial con-sumption) and by gas (from 1 percent in 1993 to 11 percent in 2009). Coal consumption remained stable at around 30 per-cent. Since 2000, biomass has accounted for 5 percent of industrial consumption.
The share of the energy-intensive sectors in industrial energy consumption is high (62 percent in 2009). The steel industry is

Country reports | South Korea 93
the main consuming sector, accounting for 33 percent of consumption in 2009 (26 percent in 1990), followed by the chemical industry (15 percent) and the non-metallic mineral branch (11 percent in 2009, down from 15 percent in 1990). The paper and pulp industry accounts for just 4 percent of industrial consumption.
Source: Enerdata
0%
10%
20%
30%
40%
50%
60%
70%
80%
90%
100%
1990 2000 2005 2009
Heat
Electricity
Biomass
Gas
Oil
Coal/Lignite
Figure 11: Energy consumption of industry, by source
Source: Enerdata
Other
Paper
Non metallic minerals
Chemical
Steel
1990 2000 2005 2008
0%
10%
20%
30%
40%
50%
60%
70%
80%
90%
100%
Figure 12: Energy consumption of industry, by branch
3.3. Energy intensity trends: efficiency gains hindered by steel sectorBetween 1990 and 2008, the decrease in industrial energy intensity was limited (-1.2 percent / year) despite efficiency gains in the chemical industry (-2.6 percent / year), the cement sector (-0.3 percent) and the paper branch (-1.8 percent / year). This was because energy consumption per ton of steel pro-duced during the same period grew by 1.2 percent / year off setting the improvements in the other branches.
Source: Enerdata
-5.0%
-4.0%
-3.0%
-2.0%
-1.0%
0.0%
1.0%
2.0%
Total*
Steel
Chemical
Cement**
Paper
%/y
ear
1990-2008 2000-2008
*Including construction and mining
**Non metallic minerals
Figure 13: Trends in the energy intensity of industrial branches
The share of industrial CHP in electricity consumption is rela-tively low in South Korea. Since 2006, CHP has covered about 11 percent of industrial electricity consumption.
Source: Enerdata
0%
2%
4%
6%
8%
10%
12%
14%
16%
18%
20%
2003 2004 2005 2006 2007 2008 2009
Figure 14: Share of industrial CHP in industrial consumption

94 United Kingdom | Country reports
United Kingdom Energy efficiency report
Objectives:
– 136.5 TWh of end-user energy savings by 2016– 185 Mt of CO2 savings in the households sector by energy distributors by 2011
Overview 2009 2000-2009 (% / year)
Primary intensity (EU=100)1 83 ++ -2.8% ++CO2 intensity (EU=100) 91 + -2.8% +CO2 emissions per capita (in tCO2 / cap) 7.6 - -1.9% ++Power generation 2009 2000-2009 (% / year)Efficiency of thermal power plants (in %) 44 ++ 0.3% -Rate of electricity T&D losses (in %) 8 - -0.4% -CO2 emissions per kWh generated (in gCO2 / kWh) 435 - -0.9% -Industry 2009* 2000-2009* (% / year)Energy intensity (EU=100) 87 ++ -1.3% --Share of industrial CHP in industry consumption (in %) 23 + 1.9% -Unit consumption of steel (in toe / t) 0.41 + -2.2% +*2008 and 2000-2008 for steel; 2001-2009 for CHP
++ Among best countries + Better than the EU average - Below the EU average -- Among countries with lowest performances
1 The European Union, as the best-performing region, is used as the benchmark.
Latest update: January 2011

Country reports | United Kingdom 95
1. Overview1.1. Policies: energy savings policies expressed in terms of avoided CO2 emissionsThe National Energy Efficiency Action Plan 2008-2016 sets an energy savings target of 136.5 TWh by 2016 for buildings, transport and small industries, excluding sectors under the Emissions Trading Scheme (ETS), corresponding to 9 percent of the reference energy consumption of final consumers. An energy saving obligations system, called Energy Efficiency Commitment (EEC), requires energy suppliers to encourage their domestic customers to reduce their energy consumption (50 percent must be low-income households). The 1 percent energy consumption reduction target set for the first period (2002-2005) was doubled over the second period (2005-2008). The EEC scheme resulted in annual energy savings of around 6 TWh / year for electricity and around 8 TWh / year for fossil fuels over the period 2002-2008 (or about 5 percent and 2 percent, of household energy consumption in 2008, respectively). Since April 2008, the energy savings obligation imposed on energy suppliers is expressed in terms of CO2 savings and is called Carbon Emissions Reduction Target (CERT). The CERT set for the three-year period up to the end of April 2011 is 185 MtCO2 (lifetime savings).
1.2. Energy consumption trends: stabilizing energy needsUK energy consumption is 3.2 toe per capita, which is in line with the EU average. Total energy consumption was relatively stable between 1995 and 2005, when it started to decrease by more than 2 percent / year. In 2009 total consumption dropped by 5 percent, whereas the country’s GDP decreased by 4 percent. An above-average decrease was seen in industry.
Source: Enerdata
50
70
90
110
130
150
170
190
210
230
250
1990 1995 2000 2005 2009
Mto
e
Primary consumption
Final consumption
Figure 1: Total and final energy consumption trends
The supply structure is dominated by natural gas, which accounts for 40 percent of the total compared with 23 percent in 1990, and by oil with 33 percent (37 percent in 1990). The share of coal has been scaled down from 30 percent in 1990 to 15 percent in 2009. Hydroelectricity and nuclear power account for 10 percent while biomass represents 2 percent of the total. In 2009, coal and natural gas consumption decreased by 15 percent and 8 percent, respectively.
Industry (including non-energy uses) accounted for 28 percent of final consumption in 2009. In that same year the house-holds, services and agriculture sector represented 41 percent of the total and transport 31 percent.
Source: Enerdata
0%
20%
20%
30%
40%
50%
60%
70%
80%
90%
100%
1990 2000 2005 2009
Households - Services -Agriculture
Transport
Industry (including non energy uses)
Figure 2: Distribution of final energy consumption by sector
Electricity consumption per capita has been stable at around 5,800 kWh since the beginning of the year 2000. The share of electricity in final energy consumption has been increasing steadily since 1990 and now stands at 20 percent. Electricity consumption increased on a regular basis between 1990 and 2005. It remained relatively stable between 2005 and 2008. In 2009 electricity demand fell by 7 percent as a result of the global economic downturn, with the decrease in industry reaching as much as 11 percent. Industry accounts for around 30 percent of electricity consumption.

96 United Kingdom | Country reports
United Kingdom Energy efficiency report
Source: Enerdata
0
50
100
150
200
250
300
350
400
TWh
Industry Others
1990 1995 2000 2005 2009
Figure 3: Electricity consumption trends by sector
1.3. Energy efficiency and CO2 trends: considerable energy intensity reductionThe UK’s total energy consumption per unit of GDP (primary energy intensity), measured at purchasing power parity, is 15 percent lower than the EU average.
It has also decreased more rapidly than in the EU, by more than 2 percent / year between 1990 and 2009 (compared with the EU average of 1.7 percent / year). Total energy intensity decreased a little faster than final energy consumption per unit of GDP (final intensity), which indicates a slight reduction in conversion losses in the energy sector.
CO2 emissions per unit of GDP (CO2 intensity) decreased more rapidly than the total energy intensity over the period 1990-2009, as a result of switching to fuels with a lower carbon content (mainly from coal to gas).
Source: Enerdata
-3.0%
-2.5%
-2.0%
-1.5%
-1.0%
-0.5%
0.0%1990-2009 2000-2009
Primary energy intensity
Final energy intensity
CO2 intensity
%/y
ear
Figure 4: Energy and CO2 intensity trends
2. Power generation2.1. Policies: 30% of renewables by 2020In 2009, the government launched the Low Carbon Transition Plan, which aims to generate 30 percent of electricity from renewables and 40 percent from low-emission energy sources by 2020. Moreover, to achieve the 2020 target, wind energy should account for more than 66 percent and biomass for around 22 percent of electricity generation from renewables. According to the European Directive on the promotion of renewable energy, the national target is to increase the share of renewables to 15 percent of the country’s final energy con-sumption by 2020.
Since March 2003, the development of renewable energies has been ensured by Renewable Obligation Certificates (ROCs). One ROC is issued for each MWh of eligible renewable output generated. Since its introduction, electricity suppliers have been required to source increasing proportions of their electric-ity from certified renewable sources. The current level is 11.1 ROCs per 100 MWh (2010 / 2011) and will reach 15.4 ROCs per 100 MWh by 2015 / 2016, where it will remain until 2026-2027. The Renewable Obligation Certificates mechanism was first extended until 2027 in the 2007 White Paper on Energy, and was further extended to 2037 in April 2010. In February 2010, in line with the Energy Act 2008, the government announced new incentives to produce electricity from renew-able facilities of up to 5 MW. Electricity produced from low-carbon technology installed since July 2008 will receive subsi-dies, even when the electricity is for the producer’s own use.
2.2. Power generation trends by source: large role of ther-mal sourcesThe use of coal in electricity generation has been scaled down from 65 percent in 1990 to 30 percent in 2009. The market share of oil decreased significantly over the period and accounted for just 1 percent of the total in 2009, compared with 10 percent in 1990. In turn, the role of natural gas in electricity production has surged since 1990, and now repre-sents 45 percent of the country’s total power generation. On average, thermal energies account for around 75 percent of the electricity produced in the UK. Nuclear energy accounts for 20 percent of the total. Other CO2-free technologies account for just 5 percent, despite the fact that the share of renewables in power production is developing rapidly (+10 percent / year between 2000 and 2009).

Country reports | United Kingdom 97
Source: Enerdata
0
50
100
150
200
250
300
350
400
1990 2000 2009
TWh
Other*
Wind
Hydro
Nuclear
Gas
Oil
Coal-Lignite
*Including biomass, geothermal and solar
Figure 5: Power generation by source
2.3. Efficiency of the power sector: high increases thanks to more efficient technologiesThe efficiency of the power sector has increased substantially, from 36 percent in 1990 to 43 percent in 2009. Despite the large role of thermal energies, that energy efficiency level is above the EU average and equal to or greater than the levels in countries with a larger share of hydropower in their power mix. In fact, the energy efficiency of thermal power plants is rela-tively high in the UK and has increased rapidly, exceeding 44 percent in 2009. This improvement is due to a switch in the power generation mix to natural gas, and to the spread of efficient technologies like gas combined cycles and cogenera-tion. In 2009, combined cycles accounted for 43 percent of the thermal electricity capacity.
Source: Enerdata
30
32
34
36
38
40
42
44
46
%
1990 1995 2000 2005 2009
Total power generation
Thermal power plants
Figure 6: Efficiency of power generation and thermal power plants
Source: Enerdata
0
10
20
30
40
50
60
70
80
GW
1990 1995 2000 2005 2009
Steam Gas turbines Combined cycles
Figure 7: Thermal electricity capacity, by technology
The rate of T&D losses in the grid amounts to 8 percent, ie, 15 percent above the EU average.
Source: Enerdata
3
4
5
6
7
8
9
10
%
1990 1995 2000 2005 2009
Figure 8: Electric T&D losses
Thanks to the fuel switch in thermal generation and the devel-opment of new technologies, the average CO2 emission factor for power generation dropped significantly between 1990 and 1999, by about 35 percent to 450 gCO2 / kWh; it has remained relatively stable since then.

98 United Kingdom | Country reports
United Kingdom Energy efficiency report
Source: Enerdata
300
350
400
450
500
550
600
650
700
750
gCO
2 /
kWh
1990 1995 2000 2005 2009
Figure 9: CO2 emission factor for power generation
3. Industry3.1. Policies: limited CO2 emission allowances for large energy consumersThe CHP capacity has increased rapidly in order to meet the official target of 10 GW in 2010, set within the framework of the Strategy for Combined Heat and Power of the climate change program. In 2009, it reached 5.5 GW.
Energy efficiency in energy-intensive industries is driven by the EU ETS introduced in 2010. The Carbon Reduction Commit-ment (CRC) Energy Efficiency Scheme aims to improve energy efficiency and thus cut CO2 emissions in large energy-consum-ing private and public organizations. The scheme involves a cap on emissions for each qualified entity and the purchase of allowances to emit carbon dioxide. The first sale of allowances will start in 2012.
3.2. Energy consumption trends: decreasing energy needs in industryEnergy consumption in industry has been decreasing at a pace of 2.3 percent / year since 2000, ie, more rapidly than the overall energy consumption over the same period.
Source: Enerdata
20
22
24
26
28
30
32
34
36
38
Mto
e
1990 1995 2000 2005 2009
Figure 10: Industrial energy consumption
Natural gas accounts for around 35 percent of industrial energy consumption, compared with 30 percent in 1990. Electricity use developed rapidly and has now reached 30 percent. The market share of coal was reduced from 25 percent to 15 per-cent over the period. Oil has maintained a share of 20 percent since 1990. Biomass is marginal with 1 percent of the total.
The share of energy-intensive industries has decreased since 1990, from 50 percent to less than 45 percent in 2008. The chemical industry accounts for 17 percent of the total. The share of steel has decreased significantly, from 20 percent in 1990 to 13 percent in 2008. The non-metallic minerals and paper industries have market shares of 8 percent and 7 per-cent, respectively.
Source: Enerdata
0%
10%
20%
30%
40%
50%
60%
70%
80%
90%
100%
1990 2000 2005 2009
Heat
Electricity
Biomass
Gas
Oil
Coal/Lignite
Figure 11: Energy consumption of industry, by source

Country reports | United Kingdom 99
Source: Enerdata
0%
10%
20%
30%
40%
50%
60%
70%
80%
90%
100%
Other
Paper
Non metallic minerals
Chemical
Steel
1990 2000 2005 2008
Figure 12: Energy consumption of industry, by branch
3.3. Energy intensity trends: moderate reductions in indus-trial branchesBetween 1990 and 2008, the consumption per unit of industrial value added (energy intensity) decreased at the moderate pace of 0.9 percent / year. The largest decrease was seen in the chemical industry (2 percent / year). The steel industry showed an above-average reduction in its energy consumption per tonne produced (1.3 percent / year) while energy consumption per tonne of cement fell slightly less (0.9 percent / year). In turn, the energy consumption per tonne of paper increased by 0.7 percent / year over the period.
Source: Enerdata
-7%
-5%
-3%
-1%
1%
3%
5%
Total*
Steel
Chemical
Cement**
*Including construction and mining
**Non metallic minerals
Paper
%/y
ear
1990-2008 2000-2008
Figure 13: Trends in the energy intensity of industrial branches
Combined heat and power generation has developed since 1990 and in 2009 made up 23 percent of industry’s electricity consumption. That level is far above the EU average.
Source: Enerdata
0%
5%
10%
15%
20%
25%
1990 20001995 2005 2009
Figure 14: Share of industrial CHP in industrial consumption
The energy intensity of manufacturing industries (ie, excluding construction and mining) decreased by 1.2 percent / year over the period 2000-2008. That trend is influenced by the changes in the energy efficiency of the various industrial branches, but also by changes in the structure of the value added of manu-facturing. When calculated at constant structure to remove the effect of changes in the structure of the value added of manu-facturing and to better capture the true energy efficiency improvements, the decrease was faster (1.8 percent / year); the difference (about 0.5 percent / year) reflects the effect of the increasing share of chemicals, ie, an energy intensive branch, which has offset part of the energy efficiency improvements. Over the period 1990-2008 structural changes were negligible.
Source: Enerdata
-2.0%
-1.5%
-1.0%
-0.5%
0.0%
0.5%
1.0%
Real variation
Change at constant structure
Structural effect
%/y
ear
1990-2008 2000-2008
Figure 15: Trends in the energy intensity of manufacturing
and structural effect

100 Indonesia | Country reports
IndonesiaEnergy efficiency report
Objectives:
– Growth in energy consumption slower than GDP growth by 2025 – Industrial energy intensity reduction target of about 1% per year until 2025
Overview 2009 2000-2009 (% / year)
Primary intensity (EU=100)1 184 -- -2.1% +CO2 intensity (EU=100) 172 -- -0.6% --
CO2 emissions per capita (in tCO2 / cap) 1.7 ++ 3.1% --Power generation 2009 2000-2009 (% / year)Efficiency of thermal power plants (in %) 35 - -1.1% --Rate of electricity T&D losses (in %) 10 -- -0.9% -CO2 emissions per kWh generated (in gCO2 / kWh) 715 -- 2.2% --Industry 2009* 2000-2009* (% / year)Energy intensity (EU=100) 156 - 1.2% --Unit consumption of steel (in toe / t) 0.20 ++ -12.8% ++*2008 and 2000-2008 for steel
++ Among best countries + Better than the EU average1 - Below the EU average1 -- Among countries with lowest performances
1 The European Union, as the best-performing region, is used as the benchmark.
Latest update: January 2011

Country reports | Indonesia 101
1. Overview1.1. Policies: growth in energy consumption slower than GDP growth by 2025 The goal of the National Energy Conservation Master Plan (2005), entitled RIKEN, is to achieve Indonesia’s energy saving potential through energy efficiency and conservation (EE&C) measures, and so avoid wasteful energy use in Indonesia.
RIKEN identified the following sectoral energy saving poten-tials: 15-30 percent in industry, 25 percent in commercial buildings for electricity, and 10-30 percent in the households sector.
The National Energy Policy (2006) states that Indonesia’s goal is to achieve an energy elasticity of less than 1 in 2025 (the energy elasticity is the rate of change of total primary energy supply over the rate of change of GDP).
The Clean Technology Fund (CTF) aims to accelerate the country’s initiatives to promote energy efficiency and renew-able energy, and to help reach the objective of increasing electricity access from 65 percent of the population to 90 percent by 2020.
1.2. Energy consumption trends: steady increase since 1990Total energy consumption per capita remains low. In 2009 it reached 0.8 toe, compared with the world average of 1.8 toe and around 1 toe for non-OECD countries.
With the exception of 1997, when Indonesia was hit by the Asian financial crisis, primary energy consumption has been increasing steadily and rapidly (3.5 percent / year since 1990). The global economic downturn in 2009 did not affect that rapid pace. Final energy consumption has grown at the same rate.
In 2009 oil was the country’s dominant source of energy, providing 32 percent of the total. Biomass came second with 27 percent, while coal accounted for 19 percent, gas for 18 percent and primary electricity (hydroelectricity, geothermal) for 4 percent. The share of coal is increasing strongly at the expense of oil.
Source: Enerdata
50
70
90
110
130
150
170
190
210
230
1990 1995 2000 2005 2009M
toe
Primary consumption
Final consumption
Figure 1: Total and final energy consumption trends
The share of industry in final energy consumption is increasing and reached 40 percent in 2009 (+9 percentage points since 1990). Because of substitutions of inefficient biomass fuels with modern fuels (LPG, kerosene or electricity), the share of the households, services and agriculture sector decreased from 55 percent in 1990 to 43 percent in 2009, despite increasing incomes in the household sector. The share of transport is 18 percent (14 percent in 1990).
Source: Enerdata
0%
20%
40%
60%
80%
100%
Households - Services -Agriculture
Transport
Industry (including non energy uses)
1990 2000 2005 2009
Figure 2: Distribution of final energy consumption by sector
Electricity consumption per capita is very low and in 2009 reached 570 kWh, compared with a world average of 2,500 kWh. It has grown rapidly since 1990 (over 7 percent / year).The share of electricity in final energy consumption is low and is developing slowly: it reached 8 percent in 2009, up from 3 percent in 1990. Electricity consumption has increased by more than 8.5 percent / year since 1990, ie, more rapidly than total energy consumption. That large increase is explained by the use of electricity in all sectors and the increase in the coun-

102 Indonesia | Country reports
IndonesiaEnergy efficiency report
try’s electrification rate. At the end of the eighties, only 52 percent of households and one-fifth of villages were electrified, compared with 65 percent of households and 85 percent of villages at present. The current plan is to continue the electrifi-cation process, with micro-hydroelectricity and decentralized production. The objective is to reach an electrification rate of 90 percent by 2020. The share of industry in electricity con-sumption is decreasing, from 51 percent in 1990 to 43 percent in 2000, and in 2009 accounted for 37 percent of the total; households accounted for 39 percent and the services sector for 24 percent.
Source: Enerdata
0
20
40
60
80
100
120
140
Industry Others
TWh
1990 2000 2005 20091995
Figure 3: Electricity consumption trends by sector
1.3. Energy efficiency and CO2 trends: slow decrease in primary energy intensityTotal energy consumption per unit of GDP (primary energy intensity), measured at purchasing power parity, is 16 percent higher than the world average; it has decreased by 1.2 per-cent / year since 1990. At the same time, CO2 emissions per unit of GDP (CO2 intensity) increased by 1 percent / year due to the greater use of coal in energy consumption (19 percent share in 2009 compared with 3 percent in 1990), mainly used in industry and to produce electricity. However, CO2 intensity decreased by 0.6 percent / year between 2000 and 2009 thanks to energy efficiency improvements (2 percent / year).
Source: Enerdata
-3.0%
-2.5%
-2.0%
-1.5%
-1.0%
-0.5%
0.0%
0.5%
1.0%
1.5%1990-2009 2000-2009
%/y
ear
Primary energy intensity
Final energy intensity
CO2 intensity
Figure 4: Energy and CO2 intensity trends
2. Power generation2.1. Policies: promotion of geothermal power production The official objective is to increase the share of renewables from 5 percent in 2005 to 10.6 percent by 2025 (3.8 percent of which would be from geothermal energy and 5 percent from biofuels). Geothermal plants will account for 39 percent of the second 10,000 MW crash program launched in 2010, and hydroelectricity for 12 percent. In 2008 the government imple-mented feed-in tariffs for electricity produced from renewables.
2.2. Power generation trends by source: growing market share of fossil fuel productionPower generation is increasingly based on fossil fuels, which in 2009 accounted for around 87 percent of the country’s elec-tricity generation, compared with 78 percent in 1990. Coal is the main fuel for electricity production, accounting for 40 percent in 2009 compared with 33 percent in 1990. Natural gas is developing rapidly: from nothing in 1990 to 19 percent of power generation in 2009. The share of hydroelectricity fell sharply, from 21 percent in 1990 to 8 percent in 2009. Among CO2-free energy sources, geothermal energy has started to grow significantly in recent years, but in 2009 it still accounted for less than 5 percent of the total.

Country reports | Indonesia 103
Source: Enerdata
0
20
40
60
80
100
120
140
160
1990 2000 2009
TWh
Other*
Hydro
Gas
Oil
Coal-Lignite
*Including biomass, geothermal and solar
Figure 5: Power generation by source
2.3. Efficiency of the power sector: no improvementThe efficiency of the power sector tends to fluctuate and has decreased slightly since 1990. It stood at 38 percent in 2009, compared with 40 percent in 1990. The reduction of the share of hydroelectricity and the development of coal power plants explain the deterioration of that ratio. In 2009 thermal power plants had an efficiency rate of 35 percent; that rate has remained relatively stable since 1990. The limited development of more efficient technologies, such as gas combined cycles and cogeneration, did not permit an increase in the ratio for thermal power generation.
Source: Enerdata
30
32
34
36
38
40
42
44
46
1990 1995 2000 2005 2009
%
Total power generation
Thermal power plants
Figure 6: Efficiency of power generation and thermal power plants
Source: Enerdata
0
5
10
15
20
25
30
35
40
45
50
GW
1990 1995 2000 2005 2009
Steam Combined cycles
Figure 7: Thermal electricity capacity, by technology
The rate of T&D losses in the Indonesian grid is above 10 percent of the distributed volumes, ie, above the world average (9 percent). Those losses tend to fluctuate significantly and have decreased slightly since 2005.
Source: Enerdata
3
5
7
9
11
13
15
17
19
%
1990 1995 2000 2005 2009
Figure 8: Electric T&D losses
As a result of the fast-growing share of fossil fuel in power generation, and in particular of coal, the average CO2 emission factor has increased by about 10 percent since 1990, reaching 715 gCO2 / kWh in 2009

104 Indonesia | Country reports
IndonesiaEnergy efficiency report
Source: Enerdata
300
350
400
450
500
550
600
650
700
750
800
gCO
2 /
kWh
1990 1995 2000 2005 2009
Figure 9: CO2 emission factor for power generation
3. Industry3.1. Policies: energy intensity decrease of around 1 per-cent / year until 2025Indonesia’s goal under the National Energy Conservation Master Plan is to reduce energy intensity by around 1 per-cent / year, on average, until 2025. Fiscal incentives (tax deduc-tions and soft loans) together with other instruments such as training and educational programs as well as energy audits are used to implement that plan.
3.2. Energy consumption trends: sustained growthIndustrial energy consumption has soared by 6 percent / year since 1990, ie, faster than the economic growth rate of 4.5 percent / year. In 2009, the sector’s energy consumption was not affected by the global economic slowdown and continued to increase rapidly.
Source: Enerdata
0
10
20
30
40
50
60
Mto
e
1990 1995 2000 2005 2009
Figure 10: Industrial energy consumption
The share of coal in industrial energy consumption is increasing steadily and reached 45 percent in 2009, compared with 4 percent in 1990. Oil was the dominant fuel, but its market share is decreasing (from 30 percent in 1990 to 14 percent in 2009).
The share of energy-intensive industries in the overall energy consumption of industry has been stable since 1990. They accounted for just under 20 percent of the sector’s energy consumption in 1990 and 15 percent in 2009. The share of the non-metallic minerals industry (cement, ceramics, etc.) has remained relatively stable since then. The market share of the chemical industry has decreased slightly since 1990 and the paper industry has maintained its market share since 1990 (1 percent of the total). The share of energy in the steel industry has declined from 9 percent to 2 percent.
Source: Enerdata
0%
10%
20%
30%
40%
50%
60%
70%
80%
90%
100%
1990 2000 2005 2009
Biomass
Electricity
Gas
Oil
Coal/Lignite
Figure 11: Energy consumption of industry, by source
Source: Enerdata
Other
Paper
Non metallic minerals
Chemical
Steel
1990 2000 2005 2008
0%
10%
20%
30%
40%
50%
60%
70%
80%
90%
100%
Figure 12: Energy consumption of industry, by branch

Country reports | Indonesia 105
3.3. Energy intensity trends: no improvement achieved in industryBetween 1990 and 2009 industrial energy intensity increased by 0.7 percent / year. Since 2000, it has increased at the even faster pace of 1.2 percent / year. Between 1990 and 2009, the energy consumed per ton of steel produced decreased by more than 4 percent / year. Since 2000, it has decreased at the even faster pace of 12 percent / year.
Source: Enerdata
-12%
-10%
-8%
-6%
-4%
-2%
0%
2%
Total*
Steel
%/y
ear
1990-2008 2000-2008
*Including construction and mining
Figure 13: Trends in the energy intensity of industrial branches

106 Mexico | Country reports
MexicoEnergy efficiency report
Objectives:
– Energy savings target of 2% for 2012 and 18% for 2030
Overview 2009 2000-2009 (% / year)
Primary intensity (EU=100)1 109 - 0.9% --CO2 intensity (EU=100) 117 - 0.6% --CO2 emissions per capita (in tCO2 / cap) 3.8 ++ 0.9% --Power generation 2009 2000-2009 (% / year)Efficiency of thermal power plants (in %) 42 + 1.8% ++Rate of electricity T&D losses (in %) 19 -- 2.3% --CO2 emissions per kWh generated (in gCO2 / kWh) 477 - -1.8% +Industry 2009* 2000-2009* (% / year)Energy intensity (EU=100) 82 ++ -0.2% --Share of industrial CHP in industry consumption (in %) - -Unit consumption of steel (in toe / t) 0.36 - -1.0% -*2008 and 2000-2008 for steel
++ Among best countries + Better than the EU average - Below the EU average -- Among countries with lowest performances
1 The European Union, as the best-performing region, is used as the benchmark.
Latest update: January 2011

Country reports | Mexico 107
1. Overview1.1. Policies: 2% energy savings for 2012In November 2009 the government adopted an energy savings program (PRONASE) for the period 2009-2012. It estimates the energy savings potential at 2 percent in 2012 and 18 per-cent in 2030, compared with a reference scenario. The plan identifies seven priorities: road transport vehicles, lighting, household appliances, cogeneration, electric motors, energy efficiency standards for new buildings and water distribution.
The Electric Power Savings Trust Fund (FIDE) launched the Program for Financing of Electric Energy Saving (PFAEE). The Program finances the substitution of old, inefficient refrigera-tors and air-conditioners by modern and more efficient equip-ment. It also provides financial support for the thermal insula-tion of homes. The cost of more efficient lighting is also financed through a credit paid on electricity bills, which is largely recovered due to reduced electricity costs.
The FIDE label is a voluntary label that identifies energy-effi-cient products on the Mexican market; it certifies that the product has met specified standards. By 2012, FIDE aims to cover 7,700 products across 85 companies.
1.2. Energy consumption trends: rapid increase up to 2008Mexico’s primary energy consumption per capita is 1.6 toe, ie, 9 percent lower than the world average.
Total energy consumption grew at the steady pace of 1.5 percent per year between 1990 and 2002, and by 3.5 percent per year during 2002-2008. However, it fell by 2.5 percent in 2009 as a result of the global recession.
The share of oil in the country’s total consumption is 56 percent (2009); it has fallen to the benefit of gas (28 percent in 2009 compared with 19 percent in 1990). Coal, primary electricity (nuclear, hydro and wind) and biomass supply the rest of the market (approximately 5 percent each).
Source: Enerdata
60
80
100
120
140
160
180
200
1990 1995 2000 2005 2009M
toe
Primary consumption
Final consumption
Figure 1: Total and final energy consumption trends
Transport consumes 45 percent of final energy, industry 33 percent (8 percent of which for non-energy uses, mainly petro-chemicals) and the other sectors (households, services and agriculture) the remaining 22 percent.
Source: Enerdata
0%
10%
20%
30%
40%
50%
60%
70%
80%
90%
100%
1990 2000 2005 2009
Households - Services -Agriculture
Transport
Industry (including non energy uses)
Figure 2: Distribution of final energy consumption by sector
In 2009 electricity consumption per capita reached 1,900 kWh,
which is 31 percent higher than non-OECD per capita con-sumption but 33 percent lower than the world average.
Electricity accounts for 15 percent of the country’s final con-sumption. Electricity consumption has been rising strongly since 1990 (+4.5 percent / year on average). Industry saw its share increase from 53 percent to 57 percent. About 96 per-cent of the population (88 percent in rural areas and 99 percent in urban areas) is connected to the grid.

108 Mexico | Country reports
MexicoEnergy efficiency report
Source: Enerdata
0
50
100
150
200
250
TWh
Industry Others
1990 1995 2000 2005 2009
Figure 3: Electricity consumption trends by sector
1.3. Energy efficiency and CO2 trends: increasing energy and CO2 intensities since 2000Primary energy intensity decreased slowly, and less rapidly (0.5 percent) than final energy intensity (more than 0.6 percent) over the period 1990-2009.
CO2 emissions per unit of GDP (CO2 intensity) decreased slowly, and much less rapidly than total energy intensity, because of the growing share of coal in the total energy mix (from 19 percent in 1990 to 28 percent in 2009).
In 2009 energy intensities were above their 2000 levels, mainly as a result of the deep recession in 2009, when energy con-sumption decreased much less rapidly than GDP (primary energy consumption decreased by 2 percent whereas GDP dropped by 7 percent). Moreover, coal consumption increased by 13 percent in 2009, explaining the increase in CO2 intensity.
Source: Enerdata
-0.8%
-0.6%
-0.4%
-0.2%
0.0%
0.2%
0.4%
0.6%
0.8%
1.0%
1990-2009
2000-2009
Primary energy intensity
Final energy intensity
CO2 intensity
%/y
ear
Figure 4: Energy and CO2 intensity trends
2. Power generation2.1. Policies: 26% of renewable power capacity in 2012The Programa Sectorial de Energia 2007-2012 sets the target for renewable sources in the power capacity at 26 percent in 2012. Mexico aims to reach 3,000 MW of wind capacity by 2014, mainly in the region of Oaxaca (2,000 MW).
2.2. Power generation trends by source: natural gas is the main source of power generationSince 2002 natural gas has been the main source of energy used for the production of electricity (from 12 percent of the total electricity production in 1990 to 51 percent in 2009). The market share of oil fell to 20 percent, losing 34 points between 1990 and 2009. In 2009 the market share of coal reached 11 percent, followed by hydroelectricity with 10 percent and nuclear power with 4 percent.
Source: Enerdata
0
50
100
150
200
250
300
1990 2000 2009
TWh
Other*
Wind
Hydro
Nuclear
Gas
Oil
Coal-Lignite
*Including biomass, geothermal and solar
Figure 5: Power generation by source
2.3. Efficiency of the power sector: strong improvement The efficiency of thermal power generation and of the power sector as a whole has been increasing rapidly since 2002 (from 36 percent to 42 percent in 2009 in the case of thermal power generation). The recent improvement is due to a switch in the power generation mix to natural gas, and to the spread of gas combined cycle plants: in 2009, the gas combined cycle power capacity accounted for 43 percent of the total thermal capacity.

Country reports | Mexico 109
Source: Enerdata
30
32
34
36
38
40
42
44
46
48
%
1990 1995 2000 2005 2009
Total power generation
Thermal power plants
Figure 6: Efficiency of power generation and thermal power plants
Source: Enerdata
0
5
10
15
20
25
30
35
40
45
GW
1990 1995 2000 2005 2009
Steam Gas turbines Combined cycles
Figure 7: Thermal electricity capacity, by technology
The rate of T&D losses in the Mexican grid is just below 19 percent of the distributed volumes, which is much higher than the world average (9 percent). Those losses have increased slightly over time (14 percent in 1990).
Source: Enerdata
10
11
12
13
14
15
16
17
18
19
20
%
1990 1995 2000 2005 2009
Figure 8: Electric T&D losses
The average CO2 emission factor for power generation has fallen by about 19 percent since 2002, from 560 gCO2 to 480 gCO2 per kWh produced. The decline in the 2000s is linked to the sharp drop in electricity production from oil-fired power plants and their replacement by high-efficiency gas combined cycle facilities. The increase in the CO2 emission factor seen in 2009 was caused by the rise in coal-fired power generation.
Source: Enerdata
300
350
400
450
500
550
600
gCO
2 /
kWh
1990 1995 2000 2005 2009
Figure 9: CO2 emission factor for power generation

110 Mexico | Country reports
MexicoEnergy efficiency report
3. Industry3.1. Policies: standards on electric motorsThe Programa Nacional para el Aprovechamiento Sustentable de la Energia 2009-2012 promotes the development of cogen-eration and expects potential energy savings of 2.1 TWh by 2012. The actual cogeneration capacity of 3,300 MW (2,000 MW of which in facilities owned by the national oil company, Pemex, and 1,300 MW in the manufacturing industry) is expected to increase to 3,600 MW in 2012.
The program also plans the implementation of standards for electric motors and subsidies to substitute inefficient electric motors. The energy consumption reduction potential of electric motors is estimated at 3.5 TWh by 2012.
3.2. Energy consumption trends: smaller contribution from energy-intensive industriesAfter a deep recession in 1992, which saw industrial energy consumption decrease by 14 percent in one year, consumption then increased by 1.8 percent per year until 2008. In 2009 industrial energy consumption dropped by 5.3 percent as a result of the economic crisis.
Source: Enerdata
20
22
24
26
28
30
32
Mto
e
1990 1995 2000 2005 2009
Figure 10: Industrial energy consumption
The share of electricity in industrial energy consumption has increased very rapidly, reaching 35 percent in 2009 compared with 13 percent in 1990. The market share of natural gas fell from 46 percent in 1990 to 31 percent in 2009. The shares of coal and oil declined slightly.
The contribution of energy-intensive industries has decreased since 1990, from around 60 percent of industrial consumption to 49 percent in 2008. The chemical industry is the most affect-ed sector, since its energy consumption dropped to 10 percent in 2008 (from 25 percent in 1990).
Source: Enerdata
0%
10%
20%
30%
40%
50%
60%
70%
80%
90%
100%
1990 2000 2005 2009
Biomass
Electricity
Gas
Oil
Coal/Lignite
Figure 11: Energy consumption of industry, by source
Source: Enerdata
0%
10%
20%
30%
40%
50%
60%
70%
80%
90%
100%
Other
Paper
Non metallic minerals
Chemical
Steel
1990 2000 2005 2008
Figure 12: Energy consumption of industry, by branch
3.3. Energy intensity trends: slower energy intensity reduc-tion since 2000Industrial energy intensity (consumption per unit of industrial value added), which had been falling at a pace of 2 per-cent / year, has been decreasing less rapidly since 2000 (0.5 percent / year). The largest energy efficiency improvements were achieved in steel production (2.2 percent / year on aver-age between 1990 and 2008). Since 2000, the chemical indus-try has seen a rapid reduction in its energy intensity (more than 7 percent / year).

Country reports | Mexico 111
Source: Enerdata
-8.0%
-6.0%
-4.0%
-2.0%
0.0%
2.0%
Total*
Steel
Chemical
Cement***
%/y
ear
1990-2008** 2000-2008
*Including construction and mining
**1994-2008 for chemical ***Non metallic minerals
Figure 13: Trends in the energy intensity of industrial branches

112 Saudi Arabia | Country reports
Saudi ArabiaEnergy efficiency report
Objectives:
– Reducing the electricity intensity by 30% between 2005 and 2030– Halving the peak demand growth rate by 2015 compared with the period 2000-2005
Overview 2009 2000-2009 (% / year)
Primary intensity (EU=100)1 257 -- 2.3% --CO2 intensity (EU=100) 279 -- 2.0% --CO2 emissions per capita (in tCO2 / cap) 15.7 -- 3.1% --Power generation 2009 2000-2009 (% / year)Efficiency of thermal power plants (in %) 31 -- 0.7% +Rate of electricity T&D losses (in %) 8 - 1.5% --CO2 emissions per kWh generated (in gCO2 / kWh) 752 -- -0.8% -Industry 2009* 2000-2009* (% / year)Energy intensity (EU=100) - -Share of industrial CHP in industry consumption (in %) - -Unit consumption of steel (in toe / t) 0.09 ++ -*2008 and 2000-2008 for steel
++ Among best countries + Better than the EU average - Below the EU average -- Among countries with lowest performances
1 The European Union, as the best-performing region, is used as the benchmark.
Latest update: January 2011

Country reports | Saudi Arabia 113
1. Overview1.1. Policies: no centralized energy efficiency strategyIn Saudi Arabia there is no central administration in charge of energy efficiency. The country is considering the creation of a “Saudi Energy Efficiency Center”, responsible for the develop-ment of energy efficient technologies and conservation poli-cies. Subsidized electricity prices may be removed to limit the demand growth.
In 2008, the National Energy Efficiency Program defined eight objectives, including energy audit services and industry sup-port, efficient use of oil and gas, energy efficiency labels and standards for appliances, construction codes and technical management and training.
The plan aims to cut the electricity intensity by 30 percent between 2005 and 2030 and the growth in peak demand by 50 percent compared with the average 2000-2005 increase.
1.2. Energy consumption trends: buoyant growth for 20 yearsSaudi Arabia’s primary energy consumption per capita is four times higher than the world average, at 6.8 toe in 2009 com-pared with the world average of 1.8 toe.
Total energy consumption is growing steadily and very rapidly, at an average rate of 5.8 percent / year since 1990; and has tripled between 1990 and 2009.
Source: Enerdata
30
50
70
90
110
130
150
170
190
1990 2009
Mto
e
1995 2000 2005
Primary consumption
Final consumption
Figure 1: Total and final energy consumption trends
Final energy consumption also rose dramatically between 1990 and 2009 (+5.3 percent / year). The energy consumption of industry – including petrochemical uses – reached 50 percent of final consumption in 2009 (from 44 percent in 1990), while the petrochemical sector accounted for 36 percent (29 percent in 1990). The growth in the energy consumption of the trans-
port sector was less rapid than that of the households sector over the period 1990-2009 (+4.1 percent / year and +6.1 percent / year, respectively); their respective shares in final consumption reached 34 percent and 15 percent in 2009, compared with 43 percent and 13 percent in 1990.
Source: Enerdata
0%
10%
20%
30%
40%
50%
60%
70%
80%
90%
100%
1990 2000 2005 2009
Households - Services -Agriculture
Transport
Industry (including non energy uses)
Figure 2: Distribution of final energy consumption by sector
Electricity consumption per capita has been growing very rapidly. It stands at about 7,700 kWh / cap (2009) against 2500 kWh / cap for the world average. The share of electricity in final energy consumption increased from 12 percent in 1990 to about 15 percent in 2009.
The country’s electricity consumption has been growing rapidly since 1990 (+6 percent / year). That surge was propelled by demand in the households, services and agriculture sector, which reached 82 percent of total electricity consumption, from 73 percent in 1990. The sharp increase in the households sector (+6.7 percent / year) led to a relative erosion of the share of industry in electricity consumption (18 percent in 2009 compared with 27 percent in 1990).
Source: Enerdata
0
50
100
150
200
250
Industry Others
TWh
1990 1995 2000 2005 2009
Figure 3: Electricity consumption trends by sector

114 Saudi Arabia | Country reports
Saudi ArabiaEnergy efficiency report
1.3. Energy efficiency and CO2 trends: degradation of energy and CO2 intensitiesEnergy consumption is growing faster than GDP, resulting in increasing final and primary energy intensities, which is con-trary to the general trend observed in most countries: final and primary energy intensities rose by 2.3 percent / year, on aver-age, between 2000 and 2009. This increasing trend is due to the fact that the country’s development is based on energy-intensive industries, as well as on energy-intensive lifestyles in buildings and transport, encouraged by low energy prices.CO2 intensity has risen slowly (by 2 percent / year since 2000), ie, at a slower pace than energy consumption, which is explained by a switch in the power generation mix to natural gas.
Source: Enerdata
0.0%
0.5%
1.0%
1.5%
2.0%
2.5%
3.0%
1990-2009 2000-2009
Primary energy intensity
Final energy intensity
CO2 intensity
%/y
ear
Figure 4: Energy and CO2 intensity trends
2. Power generation2.1. Policies: energy audits in the power sectorThe National Energy Efficiency Program targets energy conser-vation in the power sector. It includes energy audits and the promotion of energy-efficient boilers to improve the efficiency of the steam system.
2.2. Power generation trends by source: 100 percent fos-sil-fuelled generationSaudi Arabia’s installed capacity is thermal and is divided between oil-fired and gas-fired facilities. Oil accounts for 55 percent of the power mix (2009) and gas supplies the rest.
Source: Enerdata
0
50
100
150
200
250
1990 2000 2009TW
h
Gas
Oil
*Including biomass, geothermal and solar
Figure 5: Power generation by source
2.3. Efficiency of the power sector: improving efficiency thanks to new technologiesThe efficiency of the power sector (thermal power plants) regularly increased over the period 1990-2009, rising from 27 percent to 31 percent. This improvement is due to the rising share of gas-fired capacity (+6.5 percent / year), notably since 2000 (+2.4 GW in CCGT capacity). The rate of T&D losses is about 9 percent.
Source: Enerdata
Thermal power plants*
26
27
28
29
30
31
32
%
1990 1995 2000 2005 2009
*All power generation is thermal
Figure 6: Efficiency of power generation and thermal power plants
The emission factor for power generation (CO2 emission per kWh produced) is high, although it has been falling on a regular basis since 1990 (0.6 percent / year). In 2009 it reached 750 gCO2 / kWh, which is 1.5 times higher than the world average. That level is explained by the fully-thermal electricity mix in Saudi Arabia.

Country reports | Saudi Arabia 115
Source: Enerdata
0
5
10
15
20
25
30
35
40
45
50
GW
1990 1995 2000 2005 2009
Steam Gas turbines Combined cycles
Figure 7: Thermal electricity capacity, by technology
Source: Enerdata
0
2
4
6
8
10
12
14
%
1990 1995 2000 2005 2009
Figure 8: Electric T&D losses
Source: Enerdata
300
400
500
600
700
800
900
1990 1995 2000 2005 2009
gCO
2 /
kWh
Figure 9: CO2 emission factor for power generation
3. Industry3.1. Policies: energy audits and high-efficiency motorsThe National Energy Efficiency Program includes energy audits in the industrial sector and the promotion of high-efficiency motors: according to studies, matching motor size to actual load could lead to energy savings of between 5 percent and 25 percent. Audits are led by Energy Service Companies (ESCOs).
3.2. Energy consumption trends: surging consumption since 1990The energy consumption of the industrial sector increased by about 5.2 percent / year between 1990 and 2009. Its electricity consumption rose by 3.8 percent / year over that same period.
Source: Enerdata
0
2
4
6
8
10
12
14
16
Mto
e
1990 1995 2000 2005 2009
Figure 10: Industrial energy consumption
The share of electricity in industrial energy consumption remained stable at around 11 percent between 1990 and 2009 (13 percent in 2009).
Source: Enerdata
0%
10%
20%
30%
40%
50%
60%
70%
80%
90%
100%
1990 2000 2005 2009
Electricity
Oil
Figure 11: Energy consumption of industry, by source

116 Italy | Country reports
ItalyEnergy efficiency report
Objectives:
– 126 TWh of end-user energy savings or about 10% in 2016– Mandatory energy savings of 6 Mtoe for energy distributors over the 2008-2012 period
Overview 2009 2000-2009 (% / year)
Primary intensity (EU=100)1 85 ++ -0.6% --CO2 intensity (EU=100) 94 + -1.0% --CO2 emissions per capita (in tCO2 / cap) 6.5 + -1.5% +Power generation 2009 2000-2009 (% / year)Efficiency of thermal power plants (in %) 42 + 0.2% -Rate of electricity T&D losses (in %) 6 + -0.4% -CO2 emissions per kWh generated (in gCO2 / kWh) 375 - -2.9% ++Industry 2009* 2000-2009* (% / year)Energy intensity (EU=100) 96 + -1.9% -Share of industrial CHP in industry consumption (in %) 12 - -0.3% -Unit consumption of steel (in toe / t) 0.21 ++ -2.6% +*2008 and 2000-2008 for steel; 2003-2009 for CHP
++ Among best countries + Better than the EU average - Below the EU average -- Among countries with lowest performances
Latest update: January 2011
1 The European Union, as the best-performing region, is used as the benchmark.
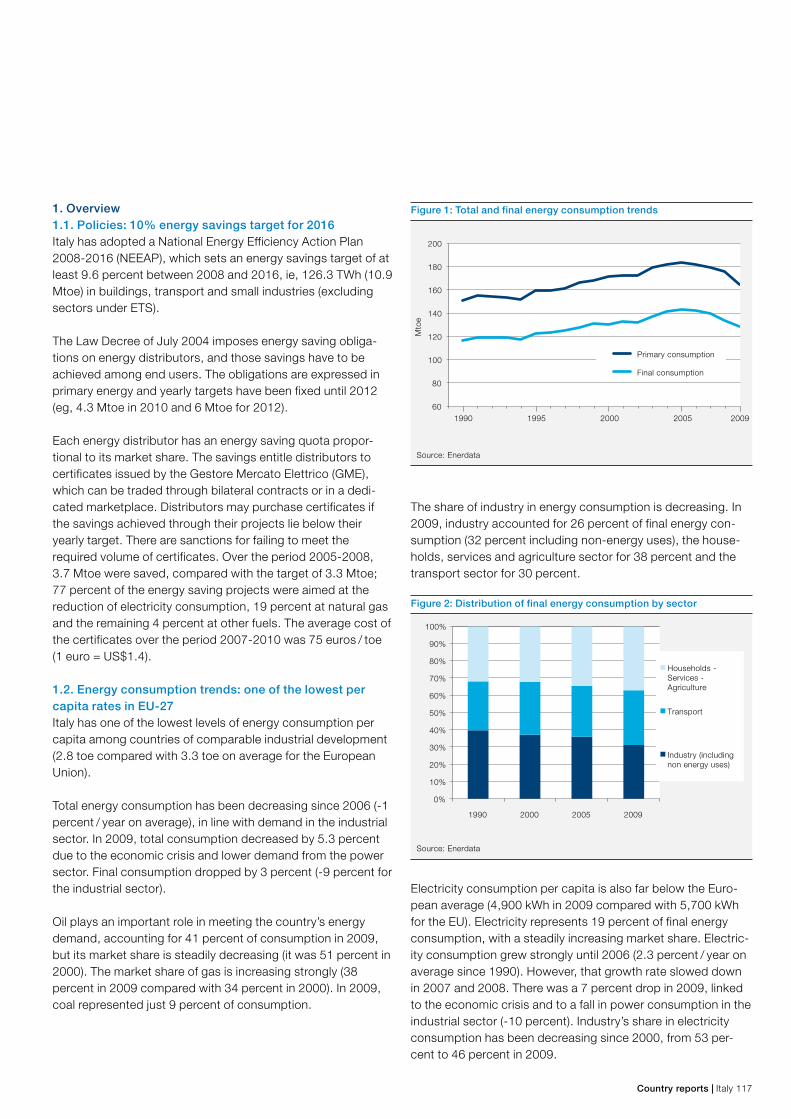
Country reports | Italy 117
1. Overview1.1. Policies: 10% energy savings target for 2016Italy has adopted a National Energy Efficiency Action Plan 2008-2016 (NEEAP), which sets an energy savings target of at least 9.6 percent between 2008 and 2016, ie, 126.3 TWh (10.9 Mtoe) in buildings, transport and small industries (excluding sectors under ETS).
The Law Decree of July 2004 imposes energy saving obliga-tions on energy distributors, and those savings have to be achieved among end users. The obligations are expressed in primary energy and yearly targets have been fixed until 2012 (eg, 4.3 Mtoe in 2010 and 6 Mtoe for 2012).
Each energy distributor has an energy saving quota propor-tional to its market share. The savings entitle distributors to certificates issued by the Gestore Mercato Elettrico (GME), which can be traded through bilateral contracts or in a dedi-cated marketplace. Distributors may purchase certificates if the savings achieved through their projects lie below their yearly target. There are sanctions for failing to meet the required volume of certificates. Over the period 2005-2008, 3.7 Mtoe were saved, compared with the target of 3.3 Mtoe; 77 percent of the energy saving projects were aimed at the reduction of electricity consumption, 19 percent at natural gas and the remaining 4 percent at other fuels. The average cost of the certificates over the period 2007-2010 was 75 euros / toe (1 euro = US$1.4).
1.2. Energy consumption trends: one of the lowest per capita rates in EU-27Italy has one of the lowest levels of energy consumption per capita among countries of comparable industrial development (2.8 toe compared with 3.3 toe on average for the European Union).
Total energy consumption has been decreasing since 2006 (-1 percent / year on average), in line with demand in the industrial sector. In 2009, total consumption decreased by 5.3 percent due to the economic crisis and lower demand from the power sector. Final consumption dropped by 3 percent (-9 percent for the industrial sector).
Oil plays an important role in meeting the country’s energy demand, accounting for 41 percent of consumption in 2009, but its market share is steadily decreasing (it was 51 percent in 2000). The market share of gas is increasing strongly (38 percent in 2009 compared with 34 percent in 2000). In 2009, coal represented just 9 percent of consumption.
Source: Enerdata
60
80
100
120
140
160
180
200
1990 1995 2000 2005 2009M
toe
Primary consumption
Final consumption
Figure 1: Total and final energy consumption trends
The share of industry in energy consumption is decreasing. In 2009, industry accounted for 26 percent of final energy con-sumption (32 percent including non-energy uses), the house-holds, services and agriculture sector for 38 percent and the transport sector for 30 percent.
Source: Enerdata
0%
10%
20%
30%
40%
50%
60%
70%
80%
90%
100%
1990 2000 2005 2009
Households - Services -Agriculture
Transport
Industry (including non energy uses)
Figure 2: Distribution of final energy consumption by sector
Electricity consumption per capita is also far below the Euro-pean average (4,900 kWh in 2009 compared with 5,700 kWh for the EU). Electricity represents 19 percent of final energy consumption, with a steadily increasing market share. Electric-ity consumption grew strongly until 2006 (2.3 percent / year on average since 1990). However, that growth rate slowed down in 2007 and 2008. There was a 7 percent drop in 2009, linked to the economic crisis and to a fall in power consumption in the industrial sector (-10 percent). Industry’s share in electricity consumption has been decreasing since 2000, from 53 per-cent to 46 percent in 2009.

118 Italy | Country reports
ItalyEnergy efficiency report
Source: Enerdata
0
50
100
150
200
250
300
350
Industry Others
TWh
1990 1995 2000 2005 2009
Figure 3: Electricity consumption trends by sector
1.3. Energy efficiency and CO2 trends: low energy intensity and slow improvement in energy efficiencyTotal energy consumption per unit of GDP (primary energy intensity), measured at purchasing power parity, is 15 percent lower than the EU average.
This total energy intensity has decreased much more slowly than in the EU as a whole, at 0.4 percent / year compared with 1.7 percent / year for the EU between 1990 and 2009 (and at 0.6 percent / year compared with 1.7 percent / year, respec-tively, since 2000). Total energy intensity decreased almost twice as fast as final energy consumption per unit of GDP (final intensity) over the period 1990-2009 due to a reduction in conversion losses (mainly from power generation). Notably, efficiency in electricity generation has been improved through the energy substitution of oil by natural gas as well as the diffusion of more efficient technologies, as explained below.
CO2 emissions per unit of GDP (CO2 intensity) decreased twice as fast as the total energy intensity over the period 1990-2009 due to substitutions of oil and coal by gas (1 percent / year compared with 0.4 percent / year).
Source: Enerdata
-1.2%
-1.0%
-0.8%
-0.6%
-0.4%
-0.2%
0.0%1990-2009 2000-2009
%/y
ear
Primary energy intensity
Final energy intensity
CO2 intensity
Figure 4: Energy and CO2 intensity trends
2. Power generation2.1. Policies: electricity suppliers must reach a share of 7.5% of renewables in 2013Since 2002, producers and importers of electricity (>100 GWh) have been obliged to supply a certain proportion of the power from renewable sources including wind, solar, geothermal and biomass. Compliance is monitored by the power market opera-tor GSE (Gestore dei Servizi Elettrici) and is rewarded with green certificates. The renewable proportion is gradually being increased, from 5.3 percent in 2010 to 7.55 percent in 2013. The promotion of renewables and combined heat and power (CHP) installations is supported by the payment of premium prices under a program introduced in 1992, known as CIP6. In 2009, CIP6 production amounted to 36 TWh (13 percent of total production), 20 percent of which was from renewables and 80 percent from “assimilated” sources (CHP or waste-to-energy).
According to the European Directive on the promotion of the use of energy from renewable sources, the national target is to increase the share of renewables in final energy consumption to 17 percent by 2020.
In December 2005 a decree, called Conto Energia, set up a feed-in tariff for photovoltaic electricity. In February 2007, the government announced a target of 3,000 MW of photovoltaic capacity in 2016, 1,200 MW of which will benefit from the new feed-in tariff for 20 years. The 20-year guaranteed tariff is fixed at between 35 euro cents / kWh and 48 euro cents / kWh (US$0.47 / kWh and US$0.64 / kWh), depending on the size of the facility and the level of building integration. The Govern-ment plans to cut subsidies for solar energy by 18 percent on average in 2011 and by 6 percent in 2012 and 2013. The new law could also introduce a 3 GW cap on conventional solar

Country reports | Italy 119
photovoltaic capacity by the end of 2013, in which case the incentives would only be granted to innovative solar projects (200 MW for concentrated photovoltaic and 300 MW for other innovative photovoltaic technology, previously not covered by the scheme).
2.2. Power generation trends by source: share of electricity production from renewables in line with the European averageThe share of oil in electricity production is falling rapidly (from 30 percent in 2000 to 10 percent in 2009) to the advantage of gas (50 percent in 2009). Between 2005 and 2009, about 15,000 MW of gas power plants were added to the Italian electricity system. Coal (15 percent of production) plays a moderate role in thermal power generation. Carbon-free power generation accounted for 25 percent of electricity production in 2009, 18 percent of which was from hydropower.
Source: Enerdata
0
50
100
150
200
250
300
350
1990 2000 2009
TWh
Other*
Wind
Hydro
Gas
Oil
Coal-Lignite
*Including biomass, geothermal and solar
Figure 5: Power generation by source
2.3. Efficiency of the power sector: strong improvementsThe efficiency of the power sector has been increasing since 1990 and reached 49 percent in 2009. This improvement is due to a switch in the power generation mix to natural gas, and to the spread of renewables and of efficient technologies such as gas combined cycles and cogeneration. There has been a noticeable improvement in the efficiency of thermal power plants (+5 percent), especially in recent years; in 2009 it stood at 42 percent. In 2009, the gas combined cycle power capacity accounted for more than 50 percent of the total thermal capacity.
The Italian grid shows a low rate of T&D losses, at around 6 per cent of the distributed volumes, ie, just below the EU average. Those losses have been reduced by 9 percent since 1990.
Source: Enerdata
30
35
40
45
50
55
%
1990 1995 2000 2005 2009
Total power generation
Thermal power plants
Figure 6: Efficiency of power generation and thermal power plants
Source: Enerdata
0
10
20
30
40
50
60
70
80 Steam Gas turbines Combined cycles
GW
1990 1995 2000 2005 2009
Figure 7: Thermal electricity capacity, by technology
Source: Enerdata
3
4
5
6
7
8
9
10
1990 1995 2000 2005 2009
%
Figure 8: Electric T&D losses

120 Italy | Country reports
ItalyEnergy efficiency report
As a result of efficiency improvements, the fuel switch in ther-mal generation and the spread of renewables, the average CO2 emission factor for power generation has fallen by about 25 percent since 1990, to less than 450 gCO2 / kWh in 2009.
Source: Enerdata
300
350
400
450
500
550
600
gCO
2 /
kWh
1990 1995 2000 2005 2009
Figure 9: CO2 emission factor for power generation
3. Industry3.1. Policies: promotion of cogenerationThe CIP6 programme has ensured the development of CHP installations across Italy since the 1990s. The support scheme provides for the payment of premium prices for the production of energy from “assimilated” sources (corresponding to CHP or waste-to-energy power plants). High-efficiency, biomass cogeneration installations are also supported through the green certificate scheme.
Legislative Decree No. 20 / 2007 called for an increasing use of high-efficiency cogeneration in industry and created incentives to support the diffusion of this technology. Incentives were defined for high-efficiency motors and inverters, mechanical vapour compression and, more broadly, for high-efficiency cogeneration.
3.2. Energy consumption trends: a drop in consumption over 2008-2009 due to the crisisEnergy consumption in industry increased at the steady rate of 1.2 percent / year between 1990 and 2007, ie, slightly more rapidly than the country’s total energy consumption. In 2008 and 2009, the global economic slowdown led to a noticeable drop in the sector’s energy consumption.
The share of electricity in industrial energy consumption has increased since 1990 and reached 35 percent of the total in 2009 (compared with 28 percent in 1990). That rise is partly due to an increased penetration of electric steel making. The use of coal and lignite in industry has decreased over time,
falling by two-thirds since 1990 and accounting for just 5 percent of industrial energy consumption in 2009. Natural gas represented up to 43 percent of the total in the early 2000s and fell to 30 percent in 2009. Biomass has developed and in 2009 accounted for 1.5 percent of industry’s energy consumption.
Source: Enerdata
20
25
30
35
40
45
Mto
e
1990 1995 2000 2005 2009
Figure 10: Industrial energy consumption
The share of energy-intensive industries in the overall energy consumption of industry has fallen since 1990 as a result of changes in the industrial structure and specialization. The steel industry’s energy consumption share in particular has steadily decreased and is now below 20 percent. The share of the chemical industry has also declined, while the non-metallic minerals (cement, ceramics, etc.) and paper industries have maintained their shares over the period.
Source: Enerdata
0%
10%
20%
30%
40%
50%
60%
70%
80%
90%
100%
1990 2000 2005 2009
Heat
Electricity
Biomass
Gas
Oil
Coal/Lignite
Figure 11: Energy consumption of industry, by source

Country reports | Italy 121
Source: Enerdata
0%
10%
20%
30%
40%
50%
60%
70%
80%
90%
100%
Other
Paper
Non metallic minerals
Chemical
Steel
1990 2000 2005 2008
Figure 12: Energy consumption of industry, by branch
3.3. Energy intensity trends: low energy intensity reductionOver the period 1990-2008, the reduction in consumption per unit of industrial value added (energy intensity) was very low (0.3 percent / year). The largest energy efficiency improvement took place in the steel industry with a 1.6 percent / year reduc-tion of energy consumption per tonne of steel. Energy con-sumption per unit of value added in the chemical industry and per tonne in the paper industry decreased by 0.7 percent / year over the period. Compared to the other industrial branches, the cement industry posted a moderate reduction in the energy required per tonne produced (0.3 percent / year between 1990 and 2008).
Source: Enerdata
-3.0%
-2.5%
-2.0%
-1.5%
-1.0%
-0.5%
0.0%
0.5%
1.0%
Total*
Steel
Chemical
Cement**
Paper
%/y
ear
1990-2008 2000-2008
*Including construction and mining
**Non metallic minerals
Figure 13: Trends in the energy intensity of industrial branches
Combined heat and power generation was rather stable, at around 12 percent of industry’s electricity consumption, ie, below the average of EU countries.
Source: Enerdata
0%
2%
4%
6%
8%
10%
12%
14%
16%
18%
20%
2003 2004 2005 2006 2007 2008 2009
Figure 14: Share of industrial CHP in industrial consumption
The variation in the energy intensity of industry is also influ-enced by changes in the mix of industrial activities, ie, by changes in the structure of industrial value added. Over the period 2000-2008 energy intensity decreased by 0.5 per-cent / year but, when calculated at constant structure, the decrease is slower, at 0.3 percent / year: the difference (about 0.2 percent / year) is due to changes in the industry structure, mainly an increase in the share of machinery and transport equipment in the industrial value added, the branch with the lowest energy intensity. This structural effect explains about 40% of the total variation. Over the period 1990-2008 the structural effect was negligible.
Source: Enerdata
-0.6%
-0.5%
-0.4%
-0.3%
-0.2%
-0.1%
0.0%
0.1%
Real variation
Change at constant structure
Structural effect
%/y
ear
1990-2008 2000-2008
Figure 15: Evolution of the energy intensity of manufacturing
and structural effect

122 South Africa | Country reports
South AfricaEnergy efficiency report
Objectives:
– 12% energy intensity reduction by 2015– 15% final energy demand reduction for industry by 2015
1 The European Union, as the best-performing region, is used as the benchmark.
Latest update: February 2011
Overview 2009 2000-2009 (% / year)
Primary intensity (EU=100)1 253 -- -1.1% -CO2 intensity (EU=100) 294 -- -1.7% -
CO2 emissions per capita (in tCO2 / cap) 6.9 + 0.4% -Power generation 2009 2000-2009 (% / year)Efficiency of thermal power plants (in %) 38 - 0.7% +Rate of electricity T&D losses (in %) 11 -- 2.7% --CO2 emissions per kWh generated (in gCO2 / kWh) 817 -- -0.7% -Industry 2009* 2000-2009* (% / year)Energy intensity (EU=100) 215 -- -2.3% -Unit consumption of steel (in toe / t) 0.60 -- -0.7% -*2008 and 2000-2008 for steel
++ Among best countries + Better than the EU average1 - Below the EU average1 -- Among countries with lowest performances

Country reports | South Africa 123
1. Overview1.1. Policies: 12% energy intensity reduction target for 2015Following the approval of the Energy Efficiency Strategy of South Africa by the Cabinet in 2005, a list of commitments was negotiated between industry and the government. The Minister for Energy and Minerals, together with the CEOs of 24 major energy users and seven industrial associations, signed the Energy Efficiency Accord, thereby voluntarily committing themselves to individually and collectively work toward the achievement of the government’s energy savings target. The strategy involves a 15 percent energy demand reduction target in industry by 2015 compared with a reference projection, and a 12 percent total energy intensity reduction target for the country as a whole by the same date.
1.2. Energy consumption trends: important role for coalSouth Africa’s energy consumption per capita is high com-pared with the world average: 2.7 toe versus 1.8 toe. Total energy consumption increased by 1.1 percent / year between 1990 and 2002. Ever since, it has increased at the very rapid rate of over 4 percent / year. Final consumption followed the same trend as total energy consumption between 1990 and 2002; since then it has increased at a slower rate per year.
Coal plays an important role in meeting the country’s energy demand, accounting for around 70 percent of consumption in 2009, but its market share is decreasing (74 percent in 2000). In 2009 oil accounted for 13 percent of consumption, and biomass for around 10 percent. The market share of gas is increasing slightly (3 percent in 2009 compared with 1.6 per-cent in 2000), while nuclear accounts for around 3 percent.
Source: Enerdata
Primary consumption
Final consumption
40
60
80
100
120
140
160
1990 1995 2000 2005 2009
Mto
e
Figure 1: Total and final energy consumption trends
While the share of industrial energy consumption is stable at a global level, it is decreasing significantly in South Africa: from
53 percent in 1990 to around 40 percent in 2009. The house-holds, services and agriculture sectors absorbed more than 25 percent of consumption in 1990 and 35 percent in 2009. Transport currently accounts for 24 percent.
Source: Enerdata
0%
20%
40%
60%
80%
100%
1990 2000 2005 2009
Households - Services -Agriculture
Transport
Industry (including non energy uses)
Figure 2: Distribution of final energy consumption by sector
The country’s electricity consumption per capita is about 60 percent higher than the world average (4,150 kWh in 2009, compared with the world average of 2,550 kWh). Total electric-ity consumption increased at a pace of 3 percent per year from 1990 to 2007. Because of the global crisis, electricity con-sumption has decreased by 3.5 percent per year since 2007.
Electricity represents 26 percent of final energy consumption, with an increasing market share (21 percent in 1990 and 25 percent in 2000). The industrial sector consumes about 60 percent of the electricity used in the country.
Source: Enerdata
0
50
100
150
200
250
TWh
Industry Others
1990 1995 2000 2005 2009
Figure 3: Electricity consumption trends by sector

124 South Africa | Country reports
South AfricaEnergy efficiency report
1.3. Energy efficiency and CO2 trends: decrease in CO2 intensity between 2000 and 2009Total energy consumption per unit of GDP (primary energy intensity), measured at purchasing power parity, is about 60 percent higher than the world average.
Total energy intensity decreased at the slow rate of 0.4 per-cent / year between 1990 and 2009. Since 2000, South Africa’s total energy intensity has decreased more rapidly (1 per-cent / year). On average, the reduction in final energy intensity (final energy consumption per unit of GDP) was faster between 1990 and 2008; those different trends are explained by increasing losses in power generation due to the fact that electricity consumption is growing rapidly, and that electricity is predominantly produced from coal.
CO2 emissions per unit of GDP (CO2 intensity) decreased at a faster pace than total energy intensity (about twice as fast between 1990 and 2009). Between 2000 and 2009, CO2 intensity decreased even faster: about 40 percent of that decrease is explained by energy switches to carbon-free energies (decrease in the share of coal in energy consumption), and the remaining 60 percent by the energy intensity reduction.
Source: Enerdata
-1.8%
-1.6%
-1.4%
-1.2%
-1.0%
-0.8%
-0.6%
-0.4%
-0.2%
0.0%
1990-2009 2000-2009
%/y
ear
Primary energy intensity
Final energy intensity
CO2 intensity
Figure 4: Energy and CO2 intensity trends
2. Power generation2.1. Policies: 10 TWh from renewables in 2013In 2003 the government published a White Paper on Renew-able Energy, which sets a 10 TWh renewable energy produc-tion target for 2013.
The Energy Regulator (NERSA) has approved the Renewable Energy Feed-In Tariff (Refit) guidelines. The Refit Power Pur-chase Agreement, which has a term of 20 years, will be reviewed every year throughout the first five years of its imple-mentation, and every three years thereafter.
The South African utility Eskom has launched a national Demand-Side Management (DSM) initiative to audit energy use in the industrial, commercial and households sectors. The DSM audits support Eskom’s long-term strategy to reduce South Africa’s electricity demand during peak periods.
2.2. Power generation trends by source: strong domination of coalSouth Africa has one of the world’s largest shares of electricity production from coal: in 2009, 92 percent of electricity was generated from coal, while nuclear power accounted for 6 percent and hydroelectricity for around 2 percent. Accordingly, CO2-free electricity generation accounted for 8 percent of total power generation. These shares have been stable since 1990.
Source: Enerdata
0
50
100
150
200
250
300
1990 2000 2009
TWh
Other*
Hydro
Nuclear
Gas
Oil
Coal-Lignite
*Including biomass, geothermal and solar
Figure 5: Power generation by source
2.3. Efficiency of the power sector: significant improve-ments over the last 10 yearsSince more than 90 percent of power generation is produced from coal, the overall efficiency of power generation is close to that of thermal power plants. The efficiency of thermal power generation currently corresponds to international standards, despite a steady decline in the past, from 38 percent in 1990 to less than 34 percent in 1998. It has been increasing since then and in 2009 reached 38 percent, which is 1 percentage point lower than the world average.

Country reports | South Africa 125
Source: Enerdata
Total power generation
Thermal power plants
30
31
32
33
34
35
36
37
38
39
40
%
1990 1995 2000 2005 2009
Figure 6: Efficiency of power generation and thermal power plants
Source: Enerdata
0
5
10
15
20
25
30
35
40
45
Steam
GW
1990 1995 2000 2005 2009
Figure 7: Thermal electricity capacity, by technology
The rate of T&D losses in the South African grid was above 11 percent of the distributed volumes in 2009, which is higher than the world average (9 percent). Those losses have increased over time (6.5 percent in 1990).
Source: Enerdata
3
4
5
6
7
8
9
10
11
12
%
1990 1995 2000 2005 2009
Figure 8: Electric T&D losses
The average CO2 emission factor for power generation is high because of the share of coal: it was 820 gCO2 / kWh in 2009, which is about 60 percent higher than the world average.
Source: Enerdata
300
400
500
600
700
800
900
1000
gCO
2 /
kWh
1990 1995 2000 2005 2009
Figure 9: CO2 emission factor for power generation
3. Industry3.1. Policies: voluntary energy saving commitmentsTo date, the Energy Efficiency Accord, which is a voluntary agreement with 24 major industrial energy users and seven industrial associations, is the main measure to promote energy savings in the sector.
3.2. Energy consumption trends: decrease in industrial use of coal and ligniteIndustrial energy consumption has varied significantly over time: it first decreased by 9 percent per year between 1990 and 1993 because of a recession (-2 percent of GDP between 2001 and 2002), and then increased, with energy consumption

126 South Africa | Country reports
South AfricaEnergy efficiency report
reaching its 1990 level (ie, 23 Mtoe) again in 1998. It then decreased again, by 3 percent per year, until 2001. Until the global crisis, industrial energy consumption increased steadily, reaching 23 Mtoe in 2008.
Source: Enerdata
15
16
17
18
19
20
21
22
23
24
Mto
e
1990 1995 2000 2005 2009
Figure 10: Industrial energy consumption
The share of electricity in industrial energy consumption has increased since 1990 and in 2009 reached 40 percent of the total (compared with 30 percent in 1990). The use of coal and lignite in industry has decreased by 30 percent since 1990, and its share in total energy consumption is also decreasing (from 50 percent in 1990 to 38 percent in 2009). The share of indus-trial gas consumption increased to 10 percent in 2009, up from 2 percent in 1990. Biomass accounted for 9 percent in 2009 and oil for 3 percent.
The share of energy-intensive industries in overall industrial energy consumption has decreased since 1990. The steel industry’s share of energy consumption in particular has decreased steadily and now stands at around 20 percent. The share of the chemical industry has increased slightly, while the non-metallic minerals sector (cement, ceramics, etc.) has maintained its share.
Source: Enerdata
0%
10%
20%
30%
40%
50%
60%
70%
80%
90%
100%
1990 2000 2005 2009
Biomass
Electricity
Gas
Oil
Coal/Lignite
Figure 11: Energy consumption of industry, by source
Source: Enerdata
Other
Paper
Non metallic minerals
Chemical
Steel
1990 2000 2005 2008
0%
10%
20%
30%
40%
50%
60%
70%
80%
90%
100%
Figure 12: Energy consumption of industry, by branch
3.3. Energy intensity trends: rapid reduction in energy intensityOver the period 1990-2008, the reduction in the consumption per unit of industrial value added (energy intensity) was high and, on average, reached 2 percent / year, which is 25 percent higher than the world average.

Country reports | South Africa 127
Source: Enerdata
-5.0%
-4.0%
-3.0%
-2.0%
-1.0%
0.0%
1.0%
2.0%
Total*
Steel
Chemical
Cement**
Paper
%/y
ear
1990-2008 2000-2008
*Including construction and mining
**Non metallic minerals
Figure 13: Trends in the energy intensity of industrial branches

128 Australia | Country reports
AustraliaEnergy efficiency report
Objectives:
– No energy savings target
Overview 2009 2000-2009 (% / year)
Primary intensity (EU=100)1 148 -- -1.0% -CO2 intensity (EU=100) 212 -- -1.0% --CO2 emissions per capita (in tCO2 / cap) 18.4 -- 0.6% -Power generation 2009 2000-2009 (% / year)Efficiency of thermal power plants (in %) 33 - -0.4% --Rate of electricity T&D losses (in %) 7 - -1.0% -CO2 emissions per kWh generated (in gCO2 / kWh) 928 -- 0.9% --Industry 2009* 2000-2009* (% / year)Energy intensity (EU=100) 176 -- -0.9% --Share of industrial CHP in industry consumption (in %) 6 -- 1.7% -Unit consumption of steel (in toe / t) 0.63 - -2.1% +*2008 and 2000-2008 for steel; 2002-2009 for CHP
++ Among best countries + Better than the EU average - Below the EU average -- Among countries with lowest performances
1 The European Union, as the best-performing region, is used as the benchmark.
Latest update: January 2011

Country reports | Australia 129
1. Overview1.1. Policies: National strategy for energy efficiency by 2019The Australian Ministerial Council on Energy endorsed the National Framework for Energy Efficiency (NFEE) in 2004 and approved the implementation of a number of energy efficiency packages. Stage 1, which came to a close in June 2008, included nine policy packages. Stage 2 started in July 2008, with five new energy efficiency measures: expanding and enhancing the Minimum Energy Performance Standards pro-gram for electrical appliances and gas appliances; developing a heating, ventilation and air conditioning (HVAC) high efficien-cy systems strategy; phasing-out of incandescent lighting in the households sector; providing government leadership to stimulate energy efficiency in buildings through green leases; and developing measures to improve the energy efficiency of water heaters. The National Strategy for Energy Efficiency (NSEE), released in 2009, incorporates and builds on measures in the NFEE. It is a coordinated, comprehensive 10-year strat-egy for energy efficiency improvements for households and businesses.
In July 2009, the New South Wales government implemented an energy saving obligation for electricity retailers and other parties who buy or sell electricity (Energy Savings Scheme, ESS). Total energy savings requirements are fixed for each year of the scheme, as a given percentage of the electricity sales. The target for the first year was set at 0.4 percent of total electricity sales, and will gradually increase to 4 percent in 2014.
1.2. Energy consumption trends: soaring energy consumptionAustralia’s per capita energy consumption is relatively high, at about 6 toe, ie, more than three times higher than the world average.
Energy consumption has increased regularly since 2000, at a pace of 2 percent per year. In 2009, the slowdown in economic activities led to a slight drop (0.6 percent) in primary and final energy consumption, mainly in industry.
The country’s total energy consumption is largely made up of fossil fuels. Coal (including lignite) is the main fuel, representing 45 percent of the total. The share of natural gas has tended to grow and in 2009 reached 21 percent (18 percent in 2000), while the market share of oil is decreasing over time but still accounted for 30 percent in 2009. Three states share three quarters of the consumption: New South Wales (27 percent), Victoria (26 percent) and Queensland (24 percent).
Source: Enerdata
0
20
40
60
80
100
120
140
Mto
e1990 1995 2000 2005 2009
Primary consumption
Final consumption
Figure 1: Total and final energy consumption trends
Industry (including non-energy uses) absorbs just over 40 percent of final consumption, followed by transport with 35 percent and the households, services and agriculture sector with 25 percent. These shares have remained relatively stable over time.
Source: Enerdata
0%
10%
20%
30%
40%
50%
60%
70%
80%
90%
100%
Households - Services -Agriculture
Transport
Industry (including non energy uses)
1990 2000 2005 2009
Figure 2: Distribution of final energy consumption by sector
Per capita electricity consumption was 10,000 kWh in 2009, which is nearly four times as high as the world average. The share of electricity in final consumption has been increasing since 2000 and was around 23 percent in 2009. Electricity consumption has been increasing rapidly, in particular since 2003. Over the period 1990-2009 it rose by 2.6 percent / year on average, ie, slightly more rapidly than total energy con-sumption. In 2009 it decreased by 2.1 percent due to the economic crisis. Industry is the main user of electricity with a stable share of over 45 percent of electricity consumption.

130 Australia | Country reports
Source: Enerdata
0
50
100
150
200
250
1990 1995 2000 2005 2009
Industry Others
TWh
Figure 3: Electricity consumption trends by sector
1.3. Energy efficiency and CO2 trends: high energy inten-sity achieving significant reductions Total energy consumption per unit of GDP (primary energy intensity), measured at purchasing power parity, was close to the world average in 2009. It decreased slightly between 1990 and 2009, by 0.7 percent / year. Final energy consumption per unit of GDP (final intensity) decreased much faster than primary energy intensity over the period 1990-2009 (by 1.4 per-cent / year), due to an increase in conversion losses in power generation related to the rapid development of electricity consumption.
CO2 emissions per unit of GDP (CO2 intensity) decreased three times as fast as total energy intensity over the period 1990-2009 (2.7 percent / year compared with 0.7 percent / year); only 25 percent of that reduction was due to the energy intensity reduction, while switching to fuels with a lower carbon content accounted for the remaining 75 percent.
Source: Enerdata
-3.0%
-2.5%
-2.0%
-1.5%
-1.0%
-0.5%
0.0%
%/y
ear
Primary energy intensity
Final energy intensity
CO2 intensity
1990-2009 2000-2009
Figure 4: Energy and CO2 intensity trends
2. Power generation2.1. Policies: 20% of renewables in power generation by 2020In September 2009, Australia set a target to source 20 percent of its power generation from renewables by 2020, and a bud-get of 30 billion Australian dollars (1 Australian dollar = US$0.78) has been allocated for that purpose, mainly to pro-tect the largest energy consumers. A Mandatory Renewable Energy Target (MRET) scheme was launched in 2001; it speci-fies renewable energy quotas for electricity producers and includes the possibility to trade renewable certificates. The renewable energy quota (ie, the volume of certificates) was set at 8.1 TWh in 2009 and at 9.5 TWh in 2010. In 2008, the vol-ume of certificates validated by the Office of the Renewable Energy Regulator (ORER) was slightly higher (7.4 TWh com-pared with 6.8 TWh).
In 2009, Australia launched a Solar Flagships program aimed at supporting large-scale solar power generation of up to 1,000 MW. In 2000, Australia introduced a voluntary measure for fossil fuel electricity generators to reduce the greenhouse intensity of energy supply. The Generator Efficiency Standards apply to new projects and existing electricity generators above a mini-mum threshold (30 MW), whether grid-connected, off-grid or self-generators. Since 2004 the best-practice efficiency guide-lines defined for new plants have been: natural gas plant, 52 percent net thermal efficiency (Higher Heating Value, HHV); black coal plant, 42 percent net thermal efficiency (HHV); and brown coal plant, 31 percent net thermal efficiency (HHV). The measure is implemented through legally binding, five-year Deeds of Agreement between the Australian government and participating businesses.
AustraliaEnergy efficiency report

Country reports | Australia 131
2.2. Power generation trends by source: coal dominates the power mixOf the total electricity production, 77 percent is produced from coal (2009). The market share of coal has been decreasing over time, while natural gas is expanding rapidly and in 2009 reached a 15 percent market share in the power mix, com-pared with 8 percent in 2000. Including oil, fossil fuels repre-sent more than 90 percent of the electricity generation mix. CO2-free technologies failed to grow (7 percent of the total in 2009, compared with 10 percent in 1990).
Source: Enerdata
0
50
100
150
200
250
300
TWh
Other*
Wind
Hydro
Gas
Oil
Coal-Lignite
1990 2000 2009
*Including biomass, geothermal and solar
Figure 5: Power generation by source
2.3. Efficiency of the power sector: slight increase since 2002 thanks to gasThe efficiency of the power sector decreased up to 2002 but has been increasing in recent years, thanks to switches to natural gas in the power generation mix and the spread of gas combined cycle units. Since 2006, all additional thermal capacity has been gas turbines and, more recently, gas com-bined cycle power units. At approximately 34 percent, the average efficiency of thermal power generation is not very high, because coal plays a significant role in the country’s fuel mix.
Source: Enerdata
30
32
34
36
38
40
42
1990 1995 2000 2005 2009
%
Total power generation
Thermal power plants
Figure 6: Efficiency of power generation and thermal power plants
Source: Enerdata
0
5
10
15
20
25
30
35
40
45
50
GW
Steam Gas turbines Combined cycles
1990 1995 2000 2005 2009
Figure 7: Thermal electricity capacity, by technology
The rate of T&D losses stood at 7 percent in 2009, ie, below the world average. That rate has increased slightly since 1990 (0.5 percentage point).
The widespread use of coal in power generation leads to a very high average CO2 emission factor: 930 gCO2 / kWh in 2009, which is more than 50 percent higher than the world average. That emission factor has increased by 15 percent since 1990 alone. However, in recent years the development of gas-fired power facilities has slowed down that pace of growth.

132 Australia | Country reports
Source: Enerdata
3
4
5
6
7
8
9
10
1990 1995 2000 2005 2009
%
Figure 8: Electric T&D losses
Source: Enerdata
650
700
750
800
850
900
950
gCO
2 /
kWh
1990 1995 2000 2005 2009
Figure 9: CO2 emission factor for power generation
3. Industry3.1. Policies: investment incentives and standardsThe Energy Efficiency Program was established in 2010 within the framework of the Australian Carbon Trust to promote take-up of energy efficient technologies and practices in the business sector. It provides innovative finance solutions and expert advice to help businesses achieve energy efficiency improvements and cost-effective carbon emission reductions. Five initial projects were announced in November 2010, an investment totaling 23.7 million Australian dollars over the next three years.
Under the Energy Efficiency Opportunities program (EEO), which came into force in 2006, all large energy-using busi-nesses – more than 139 GWh / year (12 Mtoe / year) – are required to undertake an energy audit every five years and to report publicly on cost-effective energy savings opportunities.
The EEO covers approximately 240 businesses across all sectors (mid-2010 figures) accounting for more than 60 per-cent of total business energy use.
The Minimum Energy Performance Standards program (MEPS) aims to increase the energy efficiency of products used in manufacturing sectors (three-phase electric motors, etc.).
3.2. Energy consumption trends: rapid increase in indus-try’s energy needsEnergy consumption in industry increased at the rapid pace of 1.8 percent / year between 1990 and 2009, which is slightly slower than total energy consumption. In 2009, the slowdown in economic activities led to a slower increase in the sector’s energy consumption (0.8 percent).
Source: Enerdata
20
21
22
23
24
25
26
27
28
29
Mto
e
1990 1995 2000 2005 2009
Figure 10: Energy consumption of industry
Natural gas is the main energy source in industrial energy consumption. Its share has increased slightly since 1990 and has remained stable at around 30 percent since 2000. The use of electricity has also grown over the period: in 2009 it accounted for 28 percent of the sector’s energy consumption, up from 25 percent in 1990. In turn, the share of coal and lignite has decreased since 1990 and in 2009 stood below 20 percent (compared with 25 percent in 1990). Oil accounted for 15 percent of industrial energy consumption in 2009, while biomass reached 10 percent.
In 2008, energy-intensive industries accounted for around 35 percent of industrial energy consumption, compared with more than 40 percent in 1990. The steel industry’s share in energy consumption in particular showed a substantial decrease, from 17 percent in 1990 to 12 percent in 2008. The non-metallic minerals and chemical industries have maintained their shares over the period. The share of the paper industry has also declined and is now below 5 percent.
AustraliaEnergy efficiency report

Country reports | Australia 133
Source: Enerdata
0%
10%
20%
30%
40%
50%
60%
70%
80%
90%
100%
1990 2000 2005 2009
Biomass
Electricity
Gas
Oil
Coal/Lignite
Figure 11: Energy consumption of industry, by source
Source: Enerdata
0%
10%
20%
30%
40%
50%
60%
70%
80%
90%
100%
1990 2000 2005 2008
Other
Paper
Non metallic minerals
Chemical
Steel
Figure 12: Energy consumption of industry, by branch
3.3. Energy intensity trends: larger improvements achieved in recent yearsBetween 1990 and 2008 the energy intensity of industry decreased by 0.7 percent / year. The steel and chemical indus-tries achieved a 1 percent / year reduction in energy consump-tion per tonne produced over the period. The decrease in energy consumption per tonne of paper produced over the period was greater, at around 1.5 percent / year. With the exception of the paper and non-metallic minerals industries, which saw their energy intensity levels increase, the sector’s energy intensity decreased more sharply over the period 2000-2008.
Source: Enerdata
-4.0%
-3.5%
-3.0%
-2.5%
-2.0%
-1.5%
-1.0%
-0.5%
0.0%
0.5%
1.0%
Total*
Steel
Chemical
Cement**
Paper
%/y
ear
1990-2008 2000-2008
*Including construction and mining
**Non metallic minerals
Figure 13: Trends in the energy intensity of industrial branches
Combined heat and power generation represents about 6 percent of the sector’s electricity consumption, and that share is relatively stable.
Source: Enerdata
4.0%
4.5%
5.0%
5.5%
6.0%
6.5%
7.0%
7.5%
8.0%
2002 2003 2004 2005 2006 2007 2008 2009
Figure 14: Share of industrial CHP in industrial consumption

134 Turkey | Country reports
TurkeyEnergy efficiency report
Objectives:
– 20% reduction in primary intensity by 2023
Overview 2009 2000-2009 (% / year)
Primary intensity (EU=100)1 88 + -1.5% -CO2 intensity (EU=100) 107 - -1.5% -CO2 emissions per capita (in tCO2 / cap) 3.2 ++ 0.8% --Power generation 2009 2000-2009 (% / year)Efficiency of thermal power plants (in %) 43 + 1.3% ++Rate of electricity T&D losses (in %) 15 -- -3.2% ++CO2 emissions per kWh generated (in gCO2 / kWh) 490 - 1.4% +Industry 2009* 2000-2009* (% / year)Energy intensity (EU=100) 67 ++ -6.7% ++Share of industrial CHP in industry consumption (in %) 8 -- -3.1% --Unit consumption of steel (in toe / t) 0.15 ++ -4.2% ++*2008 and 2000-2008 for steel
++ Among best countries + Better than the EU average - Below the EU average -- Among countries with lowest performances
1 The European Union, as the best-performing region, is used as the benchmark.
Latest update: January 2011
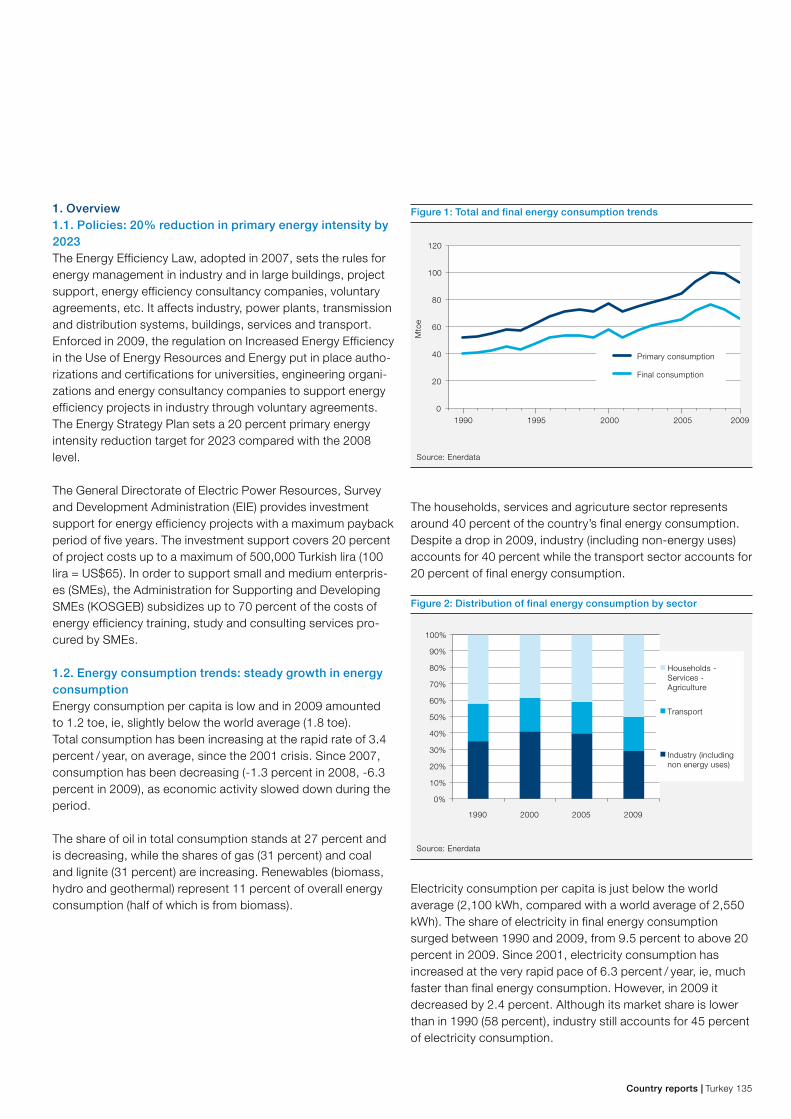
Country reports | Turkey 135
1. Overview1.1. Policies: 20% reduction in primary energy intensity by 2023The Energy Efficiency Law, adopted in 2007, sets the rules for energy management in industry and in large buildings, project support, energy efficiency consultancy companies, voluntary agreements, etc. It affects industry, power plants, transmission and distribution systems, buildings, services and transport. Enforced in 2009, the regulation on Increased Energy Efficiency in the Use of Energy Resources and Energy put in place autho-rizations and certifications for universities, engineering organi-zations and energy consultancy companies to support energy efficiency projects in industry through voluntary agreements. The Energy Strategy Plan sets a 20 percent primary energy intensity reduction target for 2023 compared with the 2008 level.
The General Directorate of Electric Power Resources, Survey and Development Administration (EIE) provides investment support for energy efficiency projects with a maximum payback period of five years. The investment support covers 20 percent of project costs up to a maximum of 500,000 Turkish lira (100 lira = US$65). In order to support small and medium enterpris-es (SMEs), the Administration for Supporting and Developing SMEs (KOSGEB) subsidizes up to 70 percent of the costs of energy efficiency training, study and consulting services pro-cured by SMEs.
1.2. Energy consumption trends: steady growth in energy consumptionEnergy consumption per capita is low and in 2009 amounted to 1.2 toe, ie, slightly below the world average (1.8 toe).Total consumption has been increasing at the rapid rate of 3.4 percent / year, on average, since the 2001 crisis. Since 2007, consumption has been decreasing (-1.3 percent in 2008, -6.3 percent in 2009), as economic activity slowed down during the period.
The share of oil in total consumption stands at 27 percent and is decreasing, while the shares of gas (31 percent) and coal and lignite (31 percent) are increasing. Renewables (biomass, hydro and geothermal) represent 11 percent of overall energy consumption (half of which is from biomass).
Source: Enerdata
0
20
40
60
80
100
120
1990 1995 2000 2005 2009M
toe
Primary consumption
Final consumption
Figure 1: Total and final energy consumption trends
The households, services and agricuture sector represents around 40 percent of the country’s final energy consumption. Despite a drop in 2009, industry (including non-energy uses) accounts for 40 percent while the transport sector accounts for 20 percent of final energy consumption.
Source: Enerdata
0%
10%
20%
30%
40%
50%
60%
70%
80%
90%
100%
1990 2000 2005 2009
Households - Services -Agriculture
Transport
Industry (including non energy uses)
Figure 2: Distribution of final energy consumption by sector
Electricity consumption per capita is just below the world average (2,100 kWh, compared with a world average of 2,550 kWh). The share of electricity in final energy consumption surged between 1990 and 2009, from 9.5 percent to above 20 percent in 2009. Since 2001, electricity consumption has increased at the very rapid pace of 6.3 percent / year, ie, much faster than final energy consumption. However, in 2009 it decreased by 2.4 percent. Although its market share is lower than in 1990 (58 percent), industry still accounts for 45 percent of electricity consumption.
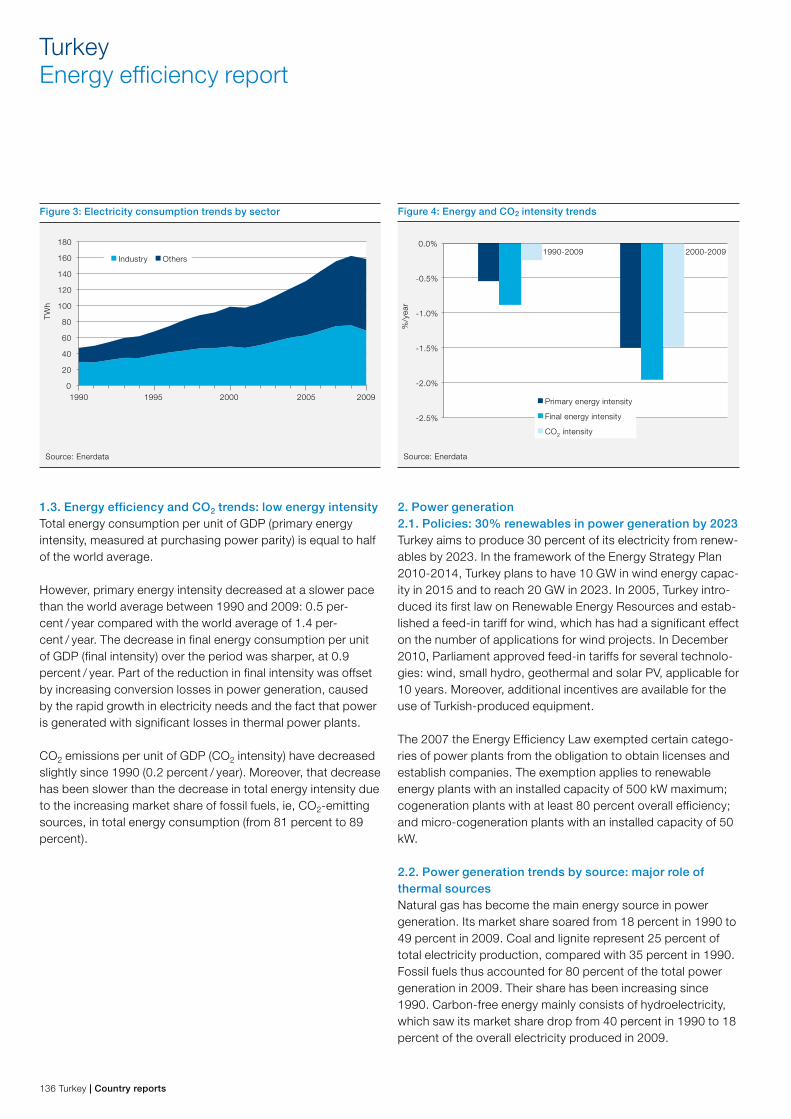
136 Turkey | Country reports
TurkeyEnergy efficiency report
Source: Enerdata
0
20
40
60
80
100
120
140
160
180
TWh
Industry Others
1990 1995 2000 2005 2009
Figure 3: Electricity consumption trends by sector
1.3. Energy efficiency and CO2 trends: low energy intensityTotal energy consumption per unit of GDP (primary energy intensity, measured at purchasing power parity) is equal to half of the world average.
However, primary energy intensity decreased at a slower pace than the world average between 1990 and 2009: 0.5 per-cent / year compared with the world average of 1.4 per-cent / year. The decrease in final energy consumption per unit of GDP (final intensity) over the period was sharper, at 0.9 percent / year. Part of the reduction in final intensity was offset by increasing conversion losses in power generation, caused by the rapid growth in electricity needs and the fact that power is generated with significant losses in thermal power plants.
CO2 emissions per unit of GDP (CO2 intensity) have decreased slightly since 1990 (0.2 percent / year). Moreover, that decrease has been slower than the decrease in total energy intensity due to the increasing market share of fossil fuels, ie, CO2-emitting sources, in total energy consumption (from 81 percent to 89 percent).
Source: Enerdata
-2.5%
-2.0%
-1.5%
-1.0%
-0.5%
0.0%1990-2009 2000-2009
%/y
ear
Primary energy intensity
Final energy intensity
CO2 intensity
Figure 4: Energy and CO2 intensity trends
2. Power generation2.1. Policies: 30% renewables in power generation by 2023Turkey aims to produce 30 percent of its electricity from renew-ables by 2023. In the framework of the Energy Strategy Plan 2010-2014, Turkey plans to have 10 GW in wind energy capac-ity in 2015 and to reach 20 GW in 2023. In 2005, Turkey intro-duced its first law on Renewable Energy Resources and estab-lished a feed-in tariff for wind, which has had a significant effect on the number of applications for wind projects. In December 2010, Parliament approved feed-in tariffs for several technolo-gies: wind, small hydro, geothermal and solar PV, applicable for 10 years. Moreover, additional incentives are available for the use of Turkish-produced equipment.
The 2007 the Energy Efficiency Law exempted certain catego-ries of power plants from the obligation to obtain licenses and establish companies. The exemption applies to renewable energy plants with an installed capacity of 500 kW maximum; cogeneration plants with at least 80 percent overall efficiency; and micro-cogeneration plants with an installed capacity of 50 kW.
2.2. Power generation trends by source: major role of thermal sourcesNatural gas has become the main energy source in power generation. Its market share soared from 18 percent in 1990 to 49 percent in 2009. Coal and lignite represent 25 percent of total electricity production, compared with 35 percent in 1990. Fossil fuels thus accounted for 80 percent of the total power generation in 2009. Their share has been increasing since 1990. Carbon-free energy mainly consists of hydroelectricity, which saw its market share drop from 40 percent in 1990 to 18 percent of the overall electricity produced in 2009.

Country reports | Turkey 137
Source: Enerdata
0
50
100
150
200
250
1990 2000 2009
TWh
Other*
Wind
Hydro
Gas
Oil
Coal-Lignite
*Including biomass, geothermal and solar
Figure 5: Power generation by source
2.3. Efficiency of the power sector: increasing energy efficiency in thermal power plantsThe efficiency of thermal power plants has increased signifi-cantly, from 34 percent in 1998 to 43 percent in 2009. That increase is linked to the growing share of gas combined cycles in thermal electricity production; in 2009 they represented 28 percent of the thermal capacity.
Source: Enerdata
Total power generation
Thermal power plants
30
35
40
45
50
55
%
1990 1995 2000 2005 2009
Figure 6: Efficiency of power generation and thermal power plants
Source: Enerdata
0
5
10
15
20
25
30
GW
Steam Combined cycles
1990 1995 2000 2005 2009
Figure 7: Thermal electricity capacity, by technology
The rate of T&D losses in the Turkish power grid is 14.5 percent of the volumes distributed. It has decreased sharply since 2000, following a noticeable surge. The world average stands at 9 percent.
Source: Enerdata
10
11
12
13
14
15
16
17
18
19
20
%
1990 1995 2000 2005 2009
Figure 8: Electric T&D losses
The fuel switch to natural gas and the development of gas combined cycles in electricity production led to a reduction in the average CO2 emission factor in Turkey between 2000 and 2004. In recent years the emission factor has shown an upward trend, with an increase in the market share of coal and lignite. In 2009, the amount of CO2 emissions required to produce one kWh was around 500 gCO2.

138 Turkey | Country reports
TurkeyEnergy efficiency report
Source: Enerdata
300
350
400
450
500
550
600
650
gCO
2 /
kWh
1990 1995 2000 2005 2009
Figure 9: CO2 emission factor for power generation
3. Industry3.1. Policies: subsidies for energy efficiency projectsIn 2009, the regulation on Increasing Energy Efficiency in the Use of Energy Resources and Energy, which set out the provi-sions of the 2007 Energy Efficiency Law, was adopted to support energy efficiency projects and voluntary agreements in industry.
The Turkish energy efficiency agency EIE can subsidize up to 20 percent of the project costs of industrial establishments investing in energy efficiency. In addition, if they are committed to reducing their energy intensity by 10 percent on average over a period of three years under a voluntary agreement, the EIE will subsidize 20 percent of their energy costs during the first year.
In the framework of the Energy Efficiency Law, industrial estab-lishments consuming more than 1,000 toe are obliged to report their energy consumption to the EIE and have an energy man-ager to monitor energy efficiency. In addition, larger companies that consume over 50,000 toe must establish energy manage-ment units.
3.2. Energy consumption trends: growing share of electric-ity and natural gasEnergy consumption in industry increased by an average 4.5 percent / year between 1990 and 2007, ie, more rapidly than the country’s overall energy consumption. Between 2008 and 2009, the sector’s consumption dropped substantially (18 percent / year on average) as a consequence of the global economic downturn.
Source: Enerdata
0
5
10
15
20
25
30
Mto
e
1990 1995 2000 2005 2009
Figure 10: Industrial energy consumption
The use of electricity in industry has surged since 1990, from 20 percent of the sector’s energy consumption in 1990 to 25 percent in 2005 and 35 percent in 2009. Coal (including lignite) is the second-largest energy source in industry. Its market share was relatively stable until 2007, at around 43 percent of the total, but dropped to 33 percent in 2009. The share of natural gas increased significantly and currently stands at more than 15 percent, compared with less than 5 percent in 1990. In turn, the use of oil was scaled down, particularly in recent years, from above 25 percent up to 2000, to 13 percent in 2006 and 6 percent in 2009.
Energy-intensive industries represent around 35 percent of the sector’s overall energy consumption. Of those industries the steel industry is the largest energy consumer, with around 20 percent of the total. Its market share has decreased slightly since 1990, when it represented around 25 percent of indus-trial consumption. The chemical industry, which has seen a steady decrease in its market share since 1990, accounts for less than 10 percent of the total. The non-metallic minerals industry (cement, ceramics, etc.) accounts for 5 percent of industrial energy consumption, while the paper industry has a low market share of 2 percent.

Country reports | Turkey 139
Source: Enerdata
0%
10%
20%
30%
40%
50%
60%
70%
80%
90%
100%
1990 2000 2005 2009
Biomass
Electricity
Gas
Oil
Coal/Lignite
Figure 11: Energy consumption of industry, by source
Source: Enerdata
0%
10%
20%
30%
40%
50%
60%
70%
80%
90%
100%
Other
Paper
Non metallic minerals
Chemical
Steel
1990 2000 2005 2008
Figure 12: Energy consumption of industry, by branch
3.3. Energy intensity trends: large reduction in industrial energy intensityBetween 1990 and 2008 energy consumption per unit of industrial value added (energy intensity) decreased by 2 per-cent / year. Further reductions were achieved over the period 2000-2008, at a pace of over 6 percent / year. Energy con-sumption per tonne of steel was reduced by 4 percent / year over the period, while the consumption per unit of value added in the chemical industry was cut by 6 percent / year. In turn, the cement industry posted an increase of over 4 percent / year in the energy required per tonne produced. Energy consumption per tonne of paper fell by more than 1.6 percent / year between 2000 and 2007.
Source: Enerdata
-8%
-6%
-4%
-2%
0%
2%
4%
6%
Total*
Steel
Chemical
Cement**
Paper%
/yea
r
1990-2008 2000-2008
*Including construction and mining
**Non metallic minerals
Figure 13: Trends in the energy intensity of industrial branches
Combined heat and power generation represents 8 percent of industrial electricity consumption. Its share, which has been rather stable since 2004, is above the world average (6 percent).
Source: Enerdata
0%
2%
4%
6%
8%
10%
12%
14%
2000 2001 2002 2003 2004 2005 2009200820072006
Figure 14: Share of industrial CHP in industrial consumption
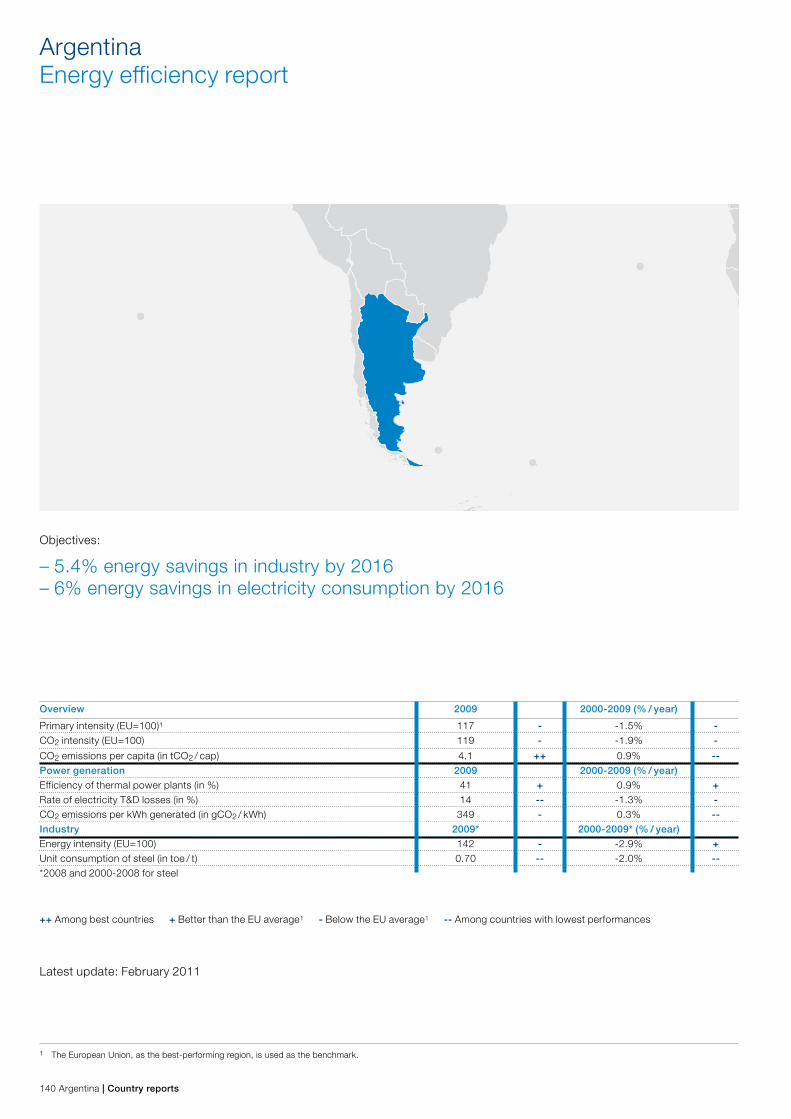
140 Argentina | Country reports
ArgentinaEnergy efficiency report
Objectives:
– 5.4% energy savings in industry by 2016– 6% energy savings in electricity consumption by 2016
Overview 2009 2000-2009 (% / year)
Primary intensity (EU=100)1 117 - -1.5% -CO2 intensity (EU=100) 119 - -1.9% -
CO2 emissions per capita (in tCO2 / cap) 4.1 ++ 0.9% --Power generation 2009 2000-2009 (% / year)Efficiency of thermal power plants (in %) 41 + 0.9% +Rate of electricity T&D losses (in %) 14 -- -1.3% -CO2 emissions per kWh generated (in gCO2 / kWh) 349 - 0.3% --Industry 2009* 2000-2009* (% / year)Energy intensity (EU=100) 142 - -2.9% +Unit consumption of steel (in toe / t) 0.70 -- -2.0% --*2008 and 2000-2008 for steel
++ Among best countries + Better than the EU average1 - Below the EU average1 -- Among countries with lowest performances
1 The European Union, as the best-performing region, is used as the benchmark.
Latest update: February 2011

Country reports | Argentina 141
1. Overview1.1. Policies: energy savings targets by sector In December 2007 the government launched the National Program for Rational and Efficient Use of Energy (PRONUREE). The PRONUREE includes short- and long-term objectives to improve energy efficiency in industry, transport, the household sector (10 percent energy savings target for 2016) and the services sector (12 percent energy savings target for 2016), as well as in public buildings (10 percent energy savings target for 2016). PRONUREE aims to decrease electricity consumption by 6 percent compared with a reference projection and to save 1,500 MW by 2016.
It also supports educational programs on energy efficiency, regulations to expand cogeneration activities, labeling of appliances, energy efficiency regulations, and broader utiliza-tion of the Clean Development Mechanism (CDM) to support the development of energy efficiency projects.
1.2. Energy consumption trends: rising per capita consumptionTotal energy consumption per capita increased on a regular basis until 2000 when it reached 1.7 toe / cap, and then fell following the economic crisis of 2001 (1.5 toe / cap). It started to increase again in 2002 and reached 1.9 toe in 2009, ie, slightly higher than the world average of 1.8 toe. This per capita consumption is among the highest in Latin America, after Venezuela.
Primary energy consumption has been increasing since 2002 (4.6 percent / year). Prior to that, the national crisis in 2001 had a significant negative impact: primary consumption decreased by 5 percent per year over 2000 / 2002. The pace was again affected over 2008-2009, this time by the global economic downturn in 2009, which led to a 2 percent decline. Final energy consumption followed the same trend as primary ener-gy consumption.
Natural gas consumption is increasing to the detriment of oil. The market share of gas grew from 40 percent in 1990 to 51 percent in 2009, while the share of oil fell from 46 percent to 36 percent. Biomass and coal play a relatively small role (4 percent and 2 percent, respectively); the rest of the energy consump-tion is supplied by nuclear power and hydroelectricity (7 per-cent). The rate of connection to the natural gas network is relatively high (approximately 60 percent).
Source: Enerdata
30
35
40
45
50
55
60
65
70
75
80
Mto
e1990 1995 2000 2005 2009
Primary consumption
Final consumption
Figure 1: Total and final energy consumption trends
The households, services and agriculture sector accounts for a third of final consumption, industry for 41 percent (including non-energy uses) and the transport sector for 26 percent.
Source: Enerdata
0%
20%
40%
60%
80%
100%
1990 2000 2005 2009
Households - Services -Agriculture
Transport
Industry (including non energy uses)
Figure 2: Distribution of final energy consumption by sector
Electricity demand per capita is approximately 2,600 kWh, which is close to the world average. Electricity consumption is growing strongly (7 percent / year since 2002). Industry is the largest electricity consumer (45 percent), ahead of the house-holds sector (29 percent). These shares have been stable since 2000.

142 Argentina | Country reports
ArgentinaEnergy efficiency report
Source: Enerdata
0
20
40
60
80
100
120
TWh
Industry Others
1990 1995 2000 2005 2009
Figure 3: Electricity consumption trends by sector
1.3. Energy efficiency and CO2 trends: introduction of new technologies Primary energy intensity (total energy consumption per unit of GDP), measured at purchasing power parity, is 26 percent lower than the world average.
Between 1990 and 2009 primary energy intensity decreased by 1.6 percent / year. Final energy intensity (final energy con-sumption per unit of GDP) decreased at a slower pace than primary energy intensity (1.2 percent / year). That gap is explained by the deployment of gas combined cycle plants, which led to energy savings in power generation.CO2 emissions per unit of GDP (CO2 intensity) decreased at almost the same pace as primary energy intensity over the period 1990-2009, which implies that fuel substitutions play a negligible role in the decrease in CO2 intensity.
Source: Enerdata
1990-2009 2000-2009
%/y
ear
Primary energy intensity
Final energy intensity
CO2 intensity
-2.5%
-2.0%
-1.5%
-1.0%
-0.5%
0.0%
Figure 4: Energy and CO2 intensity trends
2. Power generation2.1. Policies: 8% share of renewable energy in electricity consumption by 2016A 2006 law aims to increase the share of renewable energies to 4 percent of electricity production by 2013 and 8 percent by 2016. The law also includes feed-in tariffs for energy produc-tion from renewable sources: 129 Argentine cents / kWh (US$0.33 / kWh) for photovoltaics and 20 Argentine cents / kWh (US$0.51 / kWh) for wind and other sources (geothermal, biomass, biogas and small hydro). It involved a 15-year pay-ment period. Furthermore, the objective of the National Plan for Renewable Energy (GENREN) is to install 1,000 MW of renew-able capacities, including 500 MW of wind.
2.2. Power generation trends by source: increase in car-bon-based power generationThe shares of hydroelectricity and nuclear power in electricity production are falling (from 36 and 14 percent, respectively, in 1990, to 28 percent and 6 percent, respectively, in 2009), to the benefit of gas (52 percent of production in 2009) and recently oil (electricity production from oil fell from 10 percent in 1990 to 3 percent in 2000; it then increased, reaching 10 percent in 2009). Carbon-free power generation accounted for 36 percent of electricity production in 2009.
Source: Enerdata
0
20
40
60
80
100
120
140
1990 2000 2009
TWh
Other*
Wind
Hydro
Nuclear
Gas
Oil
Coal-Lignite
*Including biomass, geothermal and solar
Figure 5: Power generation by source
2.3. Efficiency of the power sector: improvement in the efficiency of thermal plants The efficiency of the thermal sector has increased by 10 per-centage points since 1990, reaching 41 percent in 2009. That improvement was achieved through a switch in the power generation mix to natural gas and to the rise in gas combined cycle plants since 1995. In 2009, combined cycle plants accounted for more than 40 percent of the country’s thermal capacity.

Country reports | Argentina 143
Source: Enerdata
25
30
35
40
45
50
55
%
1990 1995 2000 2005 2009
Total power generation
Thermal power plants
Figure 6: Efficiency of power generation and thermal power plants
Source: Enerdata
GW
0
5
10
15
20
25
Steam Gas turbines Combined cycles
1990 1995 2000 2005 2009
Figure 7: Thermal electricity capacity, by technology
The rate of T&D losses in the Argentinian grid has fallen from above 18 percent in 1990 to 13 percent in 2009, which is still above the world average.
Source: Enerdata
3
8
13
18
23
28
%
1990 1995 2000 2005 2009
Figure 8: Electric T&D losses
The average CO2 emission factor for power generation was 350 gCO2 / kWh in 2009, which is about 10 percent below its 1990 level. It has been increasing since 2002 and in 2009 was 35 percent higher than in 2002. The trend seen since 2002 is explained by the increasing shares of oil and gas in power generation, and by the correlative decline in the share of car-bon-free power generation (hydroelectricity and nuclear).
Source: Enerdata
200
250
300
350
400
450
gCO
2 /
kWh
1990 1995 2000 2005 2009
Figure 9: CO2 emission factor for power generation

144 Argentina | Country reports
ArgentinaEnergy efficiency report
3. Industry3.1. Policies: an energy savings target of 5.4% by 2016The objective of the PRONUREE is to reach 5.4 percent energy savings in industry by 2016. To date, no specific measures have been implemented.
3.2. Energy consumption trends: a twofold increase between 1990 and 2009Industrial energy consumption doubled between 1990 and 2009, while the country’s total energy consumption increased only slightly (+15 percent). Industrial energy consumption did not decline in 2001 despite the national economic recession. Likewise, the global crisis appears not to have affected indus-try’s consumption in 2009.
Source: Enerdata
0
5
10
15
20
25
30
Mto
e
1990 1995 2000 2005 2009
Figure 10: Industrial energy consumption
The dominant fuel in industry is gas. Nevertheless, its con-sumption has decreased by 10 percent, reaching 37 percent in 2009. On the contrary, the use of oil increased from 13 percent in 1990 to 24 percent in 2009. The share of electricity is rather large and stable (22 percent). Coal accounts for just 6 percent of energy consumption.
The share of energy-intensive industries in the overall energy consumption of industry is quite low and has remained stable since 1995 (21 percent in 1995 compared with 22 percent in 1990). The steel industry’s share of energy consumption has increased slightly and now stands at 15 percent. The share of the paper industry is stable, and the share of the non-metallic minerals sector (cement, ceramics, etc.) has decreased slight-ly, accounting for 8 percent of total energy consumption in 2008.
Source: Enerdata
0%
10%
20%
30%
40%
50%
60%
70%
80%
90%
100%
1990 2000 2005 2009
Biomass
Electricity
Gas
Oil
Coal/Lignite
Figure 11: Energy consumption of industry, by source
Source: Enerdata
0%
10%
20%
30%
40%
50%
60%
70%
80%
90%
100%
1990 2000 2005 2008
Other
Paper
Non metallic minerals
Steel
Figure 12: Energy consumption of industry, by branch

Country reports | Argentina 145

146 Annex | Trends in global energy efficiency 2011
AnnexSurvey details
0 10 20 30 40 50 60
Corporate finance, treasury management,investment or asset management
Corporate strategy or business development
50%
50%
Do you have responsibility for, or influence over, either of
the following?
$10bn or more
$5bn to $10bn
$1bn to $5bn
$500m to $1bn
$500m or less
12%
7%
20%
19%
42%
0 10 20 30 40 50
What are your organization’s global annual revenues in US dollars?
Other
Manager
Head of department
Head of business unit
SVP/VP/Director
Other C-level executive
CIO/Technology director
CFO/Treasurer/Controller
CEO/President/Managing director
Board member
0 10 20 30
3%
7%
18%
3%
16%
15%
4%
20%
11%
3%
Which of the following best describes your job title?
0 10 20 30 40 50
Finance
General management
Operations and production
IT
Marketing and sales
Customer service
Information and research
Risk
R&D
Procurement
Human resources
Legal
Supply-chain management
Other
Strategy and business development
47%
43%
27%
18%
15%
12%
7%
6%
4%
4%
4%
4%
3%
2%
2%
What are your main functional roles? Choose up to three.
Eastern Europe
Latin America
Middle East and Africa
North America
Asia-Pacific
Western Europe
1%
1%
5%
26%
32%
35%
0 10 20 30 40 50
In which region are you personally based?
Power & utilities
Manufacturing
17%
83%
0 10 20 30 40 50 60 70 80 90 100
What is your primary industry?
Survey demographics

Trends in global energy efficiency 2011 | Annex 147
0 10 20 30 40 50 60
Incentives and/or subsidies for upgradingto more efficient equipment / appliances
Efficiency standards on industrialequipment, appliances, etc
Incentives to switch to renewable energy
Requirements for environmental impact statements or audits
Taxes on pollution or carbon emissions
Codes for energy efficiency of buildings
Carbon cap-and-trade programs
“Green IT” codes (energy efficiencystandards for IT equipment)
Other, please specify
No legislation in place
Don’t know
51%
47%
46%
41%
38%
37%
25%
20%
2%
5%
3%
In the country in which you are based, what types of laws and regula-
tions does the government use to promote industrial energy efficien-
cy? Select all that apply.
Very stringent
Somewhat stringent
Modest, not onerous
Non-existent
Don’t know
15%
25%
50%
8%
1%
0 10 20 30 40 50 60
In the country in which you are based, how would you describe legisla-
tion and regulation governing industrial energy efficiency?
0 10 20 30 40 50 60 70
A benefit
A burden
Don’t know
60%
29%
11%
In your view and on balance, is industrial energy efficiency legislation
in the country in which you are based currently more of a benefit or a
burden to your industry?
0 10 20 30 40 50 60
Yes
No
Don’t know
50%
46%
4%
Do you have a company-wide energy management system in place to
track and optimize energy use?

148 Annex | Trends in global energy efficiency 2011
AnnexSurvey details
Over the next two decades, energy efficiency will bea critical factor in manufacturers’ profitability
The argument for energy efficiency investmentsmust be made on a case by case basis
Industries need clearer benchmarks for whatconstitutes energy efficiency in their sectors
Taxpayers should bear more of the cost ofcompanies’ energy efficiency compliance
Energy efficiency is already a critical success factor for manufacturers
Neither agree nor disagree Disagree somewhatAgree strongly Agree somewhat Disagree strongly Don’t know
53% 34% 9%
33% 39% 19% 6%
37% 40%
37%
11% 20% 16% 22% 28% 2%
40% 11% 8%
1%
12% 8%
0 10 20 30 40 50 60 70 80 90 100
2%
1%
1%
1%
2%
3%
2%
1%
To what extent do you agree or disagree with the following statements? Please select one in each row.
Lighting systems
Air-conditioning
Heating
Water use
Capital, plant and equipment in our factories
A company-wide energy audit
Insulation of our buildings
New products or services for our customers
IT stock
Other, please specify
We have not undertaken any energy efficiencymeasures within the past three years
67%
48%
45%
42%
40%
34%
32%
28%
22%
4%
6%
0 10 20 30 40 50 60 70 80 90 100
With regard to which of the following has your organization undertaken measures within the past three years to improve energy efficiency?
Select all that apply.

Trends in global energy efficiency 2011 | Annex 149
Cost-benefit analysis of each investment, including break-even analysis
The price of energy
National energy legislation and regulations
A wish to improve the company’simage as environmentally concerned
Corporate best practice in my industry
Pressure from customers and/or shareholders to reduce costs
A wish to foster innovation in manufacturing processes
Expectation of tighter regulationsgoverning energy use and/or carbon emissions
Local energy legislation and regulations
Pressure from non-governmentorganizations and/or energy activists
Other, please specify
0 10 20 30 40 50 60 70 80 90 100
59%
58%
27%
26%
21%
20%
19%
11%
11%
7%
2%
What are the main factors that will influence your company’s investment in industrial energy efficiency over the next three years, in your view?
Select up to three.
More than 50% increase from previous year
30% - 50% increase from previous year
10% - 30% increase from previous year
1% -10% increase from previous year
Static – no change from previous year
1% - 10% reduction from previous year
10% - 30% reduction from previous year
30% - 50% reduction from previous year
More than 50% reduction from previous year
4%
6%
21%
28%
33%
5%
2%
1%
0%
0 10 20 30 40 50
Over the past year, how much, if at all, has your company’s investment
in industrial energy efficiency changed over the previous year?
More than 50% increase from previous year
30% - 50% increase from previous year
10% - 30% increase from previous year
1% -10% increase from previous year
Static – no change from previous year
1% - 10% reduction from previous year
10% - 30% reduction from previous year
30% - 50% reduction from previous year
More than 50% reduction from previous year
6%
8%
29%
30%
22%
2%
3%
0%
1%
0 10 20 30 40 50
How do you expect your company’s investment in industrial
energy efficiency to develop over the next three years?
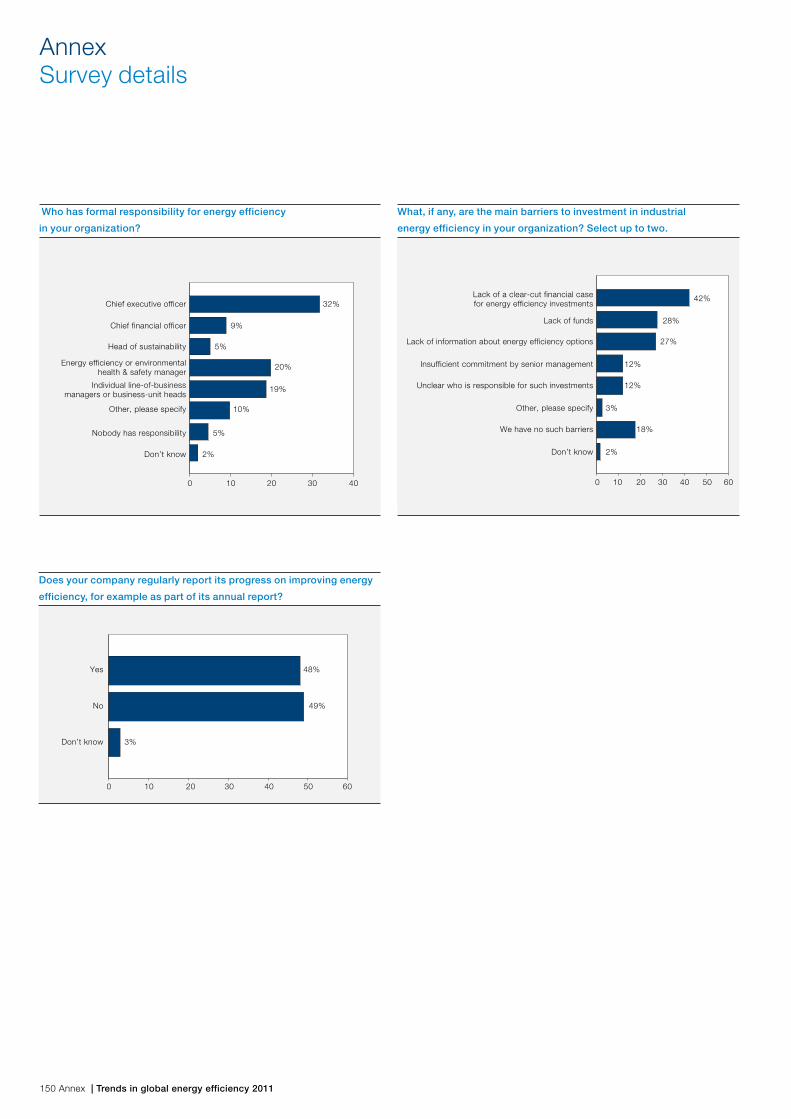
150 Annex | Trends in global energy efficiency 2011
Yes
No
Don’t know
0 10 20 30 40 50 60
48%
49%
3%
Does your company regularly report its progress on improving energy
efficiency, for example as part of its annual report?
0 10 20 30 40 50 60
Lack of a clear-cut financial case for energy efficiency investments
Lack of funds
Lack of information about energy efficiency options
Insufficient commitment by senior management
Unclear who is responsible for such investments
Other, please specify
We have no such barriers
Don’t know
42%
28%
27%
12%
12%
3%
18%
2%
What, if any, are the main barriers to investment in industrial
energy efficiency in your organization? Select up to two.
Chief executive officer
Chief financial officer
Head of sustainability
Energy efficiency or environmentalhealth & safety manager
Individual line-of-business managers or business-unit heads
Other, please specify
Nobody has responsibility
Don’t know
32%
9%
5%
20%
19%
10%
5%
2%
0 10 20 30 40
Who has formal responsibility for energy efficiency
in your organization?
AnnexSurvey details

Trends in global energy efficiency 2011 | Annex 151
AnnexAbbreviations
Energy and CO2 unitsW kW MW GW TW Wh kWh MWh GWh TWh g kg t Mt goe koe toe Mtoe CO2 gCO2 kCO2 tCO2 MtCO2
Indicatorstoe / cap kWh / cap tCO2 / cap gCO2 / kWh toe / t koe / $2005ppp kCO2 / $2005ppp
EconomyGDP ppp US$2005bn ppp $2005ppp OECD
TechnologyCCGT CHP PV LPG T&D
watt (unit of power)kilowatt (1,000 watts)megawatt (1 MW = 1,000,000 watts)gigawatt (1 GW = 1,000,000,000 watts)terawatt (1 TW = 1,000,000,000,000 watts)watt-hour (3,600 Joules)kilowatt-hour (1 kWh = 1,000 watt-hours)megawatt-hour (1 MWh = 1,000,000 watt-hours)gigawatt hour (1 GWh = 1,000,000,000 watt-hours)terawatt hour (1 TWh = 1,000,000,000,000 watt-hours)gram (unit of mass)kilogram (1,000 g)tonne = metric ton (1,000 kg)million tonnesgrams of oil equivalent (41,900 Joules)kilograms of oil equivalent (1,000 g oil equivalent)tonnes of oil equivalent (1,000 kg oil equivalent)million tonnes of oil equivalent (1,000,000,000 kg of oil equivalent)carbon dioxidegrams of carbon dioxidekilograms of carbon dioxide (1,000 g of carbon dioxide)tonnes of carbon dioxide (1,000 kg of carbon dioxide)million tonnes of carbon dioxide (1,000,000,000 kg of carbon dioxide)
tonnes of oil equivalent per capitakilowatt hour per capitatonnes of carbon dioxide per capitagrams of carbon dioxide per kilowatt-hourtonnes of oil equivalent per metric tonkilo of oil equivalent per constant 2005 dollar at purchasing power paritykilo of carbon dioxide per constant 2005 dollar at purchasing power parity
gross domestic productpurchasing power paritybillion of constant 2005 US dollars at purchasing power parityconstant 2005 dollar at purchasing power parityOrganisation for Economic Co-operation and Development
combined cycle gas turbinecombined heat and powerphotovoltaicliquefied petroleum gastransmission and distribution (of electricity)

152 Annex | Trends in global energy efficiency 2011
AnnexSources and methodology
Enerdata is an independent information and consulting firm specializing in global energy and carbon markets, providing information and advisory services on energy efficiency.
The analyses provided in Part I of this report are based on energy efficiency indicators in Enerdata’s world energy data base. This database provides harmonized energy data gath-ered from more than 200 sources around the world. Primary energy data comes from the International Energy Agency (IEA) and are completed with data from regional organizations such as the European statistics office (Eurostat); the Latin American energy organization (Olade); the Asian Development Bank; and the Organization of Oil Exporting Countries (OPEC). Data also comes from specialized institutions such as the international association for natural gas (Cedigaz), and from national sourc-es including national statistics agencies, ministries and utilities. These complementary data are used to correct and harmonize the primary data, and to update it rapidly. The methodology and definitions used by Enerdata are the same as those of the IEA and Eurostat.
Most of the detailed data by branch comes from the Odyssee database. Odyssee is a database dedicated to energy use and efficiency data and indicators in Europe where data from each European country’s official energy agencies is gathered. Ener-data is the technical coordinator of the European program Odyssee, on behalf of all EU energy agencies, and of Intelligent Energy Europe program of the European Commission.
Energy statistics in physical units are converted into common units, ktoe or Mtoe, on the basis of the following coefficients:
− Crude oil: fixed coefficient for most countries of 1.02 toe / ton
− Oil products: fixed coefficient for all countries (same as Eurostat or IEA)
− Natural gas: national coefficients for the major countries and fixed coefficient for the other countries (0.82 toe / 1000 m3)
− Coal, lignite: fixed coefficient for coke; national coefficient for production, imports, exports for the most important producers or importers
− Electricity: − nuclear: 1TWh = 0.26 Mtoe − hydroelectricity: 1TWh = 0.086 Mtoe − geothermal: 1TWh = 0.86 Mtoe - total production:
1TWh = 0.086 Mtoe − imports, export: 1TWh = 0.086 Mtoe − consumption: 1TWh = 0.086 Mtoe
For more information about the methodology please contact Enerdata : [email protected]
Key terms are defined as follows:
Energy consumption and CO2 emissionsPrimary energy consumptionThe primary consumption is the indicator of the total energy consumption of a country. Total energy consumption, for each energy product, is the sum of total production, balance of trade, aviation and marine bunkers (fuel used by boats and aircraft for international transport), and stock variations.
Final energy consumptionFinal consumption measures the needs of the final consumers of the country. They are broken down into several sectors: industry, transport, households, services, agriculture and non-energy uses.Final consumption is the difference between total consumption and the consumption of the energy sector (transformations).
Final energy consumption of industryFinal consumption of industry includes the final consumption of the mining sector, manufacturing sector, construction, and water distribution and processing. Final consumption excludes the fuel consumption of all modes of transport used by indus-try, and also excludes energy products employed for non energy uses (eg, raw materials in petrochemicals, lubricants).
Energy consumption per capitaEnergy consumption per capita corresponds to total energy consumption divided by the population.
totcppop =totcp
pop p(toe / cap)
with:totcp: primary consumption (Mtoe)pop: number of inhabitants (millions)
Electricity consumption per capitaElectricity consumption per capita corresponds to electricity consumption divided by the population.
with:eleci: electricity consumption (TWh)pop: number of inhabitants (millions)
elecipop =eleci
pop (kWh / cap)x 1000

Trends in global energy efficiency 2011 | Annex 153
CO2 emissions per capitaCO2 emissions per capita is calculated by dividing CO2 emis-sions from fuel combustion by the population. CO2 emissions cover the emissions from fossil fuels combustion (coal, oil and gas). They are calculated according to the UNFCCC methodology.
with:co2tot: CO2 emissions from fuel combustion (MtCO2)pop: number of inhabitants (millions)
co2pop =co2tot
pop (tCO2 / cap)
TransformationsConversion losses correspond to consumption of the energy sector during the operation of the energy transformation facili-ties (power plants, refineries etc.).
Energy and CO2 intensitiesPrimary energy intensityThe primary energy intensity is calculated by dividing the total energy consumption of a country by its Gross Domestic Prod-uct (GDP). It measures the total amount of energy necessary to generate one unit of GDP.
with:totcp: primary consumption (Mtoe)gdp$xxppp: GDP at constant exchange rate and purchasing power parity of the year 2005 in dollars (US$2005bn ppp)
eitotpcppp =totcp
pib$xxppa (koe / $2005ppp)
Final energy intensityThe final energy intensity is calculated by dividing the final energy consumption of a country by its GDP expressed at purchasing power parity. The final energy consumption is the energy consumed by end users (ie, industry, transport, house-holds, services and agriculture) excluding uses of petroleum products and natural gas as chemical feedstocks.
with:totfc: final consumption (Mtoe)gdp$xxppp: GDP at constant exchange rate and purchasing power parity of the year 2005 in dollar (US$2005bn ppp)
eitotfcppp =totfc
gdp$xxppp (koe / $2005ppp)
Efficiency of energy transformation This indicator identifies how much energy is lost, during the conversion of primary energy (in the form of energy consumed by the energy sector itself and through thermal or material losses during the transformation process), before reaching the end users (ie, industry, transport, households, services and agriculture).
It is calculated by dividing the final energy consumption by the primary energy consumption. The more divergent these values are the greater the losses and the smaller the percentage value shown.
eitotpcppp =final energy consumption
primary energy consumption (%)x 100
CO2 intensityThe CO2 intensity indicator is calculated by dividing CO2 emis-sions from fuel combustion by GDP. It describes the amount of CO2 produced per dollar of GDP produced. GDP is expressed at purchasing power parity to reflect differences in general price levels and relate energy consumption to the real level of economic activity.
with:CO2tot: CO2 emissions from fuel combustion (MtCO2)gdp$xxppp: GDP at constant exchange rate and purchasing power parity of the year 2005 in dollar (US$2005bn ppp)
co2pib$xxp =co2tot
gdp$xxppp (kCO2 / $2005ppp)

154 Annex | Trends in global energy efficiency 2011
Power generationEfficiency of power generationThe efficiency of power generation is calculated by dividing the total net electricity production by the energy inputs.
with:elepd: net electricity production (Mtoe)ehypd: electricity production from hydro (Mtoe) enupd: nuclear electricity production (Mtoe)cmsie, petie, gazie, encie: fuel inputs in thermal power plants (Mtoe)egepd: geothermal electricity production (Mtoe)esopd: electricity production from solar energy (Mtoe)ewnpd: electricity production from wind (Mtoe)
elepd
ehypd + enupd + cmsie + petie + gazie + encie + egepd + esopd + ewnpd (%)
x 100
Efficiency of thermal power plantsThe efficiency of thermal power plants is calculated by dividing the net thermal energy production by fuel inputs and is expressed as a percentage.
electricity prodcution of thermal power plants
fuel inputs (%)x 100
efficiency of thermal power plants
=
Rate of electricity T&D lossesThe rate of electricity T&D losses is the ratio between the quantity of energy lost during transport and distribution, and the electricity consumption.
electricity T&D losses
electricity consumption (%)x 100
Rate of electricity T&D losses =
CO2 emission factor in power generationThe CO2 emissions per kWh generated is calculated by dividing the total CO2 emissions from electricity generation and from the heat produced by cogeneration (CHP) plants by the total electricity and heat generation.
with:CO2ele: CO2 emissions from electricity generation (tCO2)CO2heatchp: CO2 emissions from heat produced from chp (tCO2)prdele: electricity generation (GWh)prdheatchp: heat production from CHP (GWh)
efelec =co2ele + co2heatchp
prdele + prdheatchp (gCO2 / kWh)
IndustryShare of electricity in industrial consumptionIt corresponds to the share of industrial energy consumption which is met by electricity.
with:elccfind: Final consumption of electricity by industry (Mtoe)totcfind: Final consumption of energy by industry (Mtoe)
pcelcindcf =elccfind
totcfind (%)x 100
Energy intensity of industryThe energy intensity of industry is calculated by dividing the total final energy consumption of industry by the value added of industry measured at constant purchasing power parity (ppp).
with:totfcind: final consumption of energy by industry (Mtoe)vadind$xxppp: value added of industry at constant exchange rate and purchasing power parity of the year 2005 in dollar (US$2005bn ppp)
eitotind = totfcind
vadind$xxppp (kCO2 / $2005ppp)
Energy intensity of non-metallic minerals industryThe non-metallic minerals industry corresponds to the manu-facturing of glass and glass products (e.g. flat glass, hollow glass, fibers, technical glassware etc.), ceramic products, tiles and baked clay products, and cement and plaster, from raw materials to finished articles. The energy intensity of the branch is calculated by dividing the final energy consumption of the branch by the value added of the branch measured at constant purchasing power parity (ppp).
with:totfcchi: final consumption of energy by non-metallic minerals industry (Mtoe)vadchi$xxppp: value added of non-metallic minerals industry at constant ppp in dollar 2005 (US$2005bn ppp)
eitotchi = totfcchi
vadchi$xxppp (kCO2 / $2005ppp)
AnnexSources and methodology
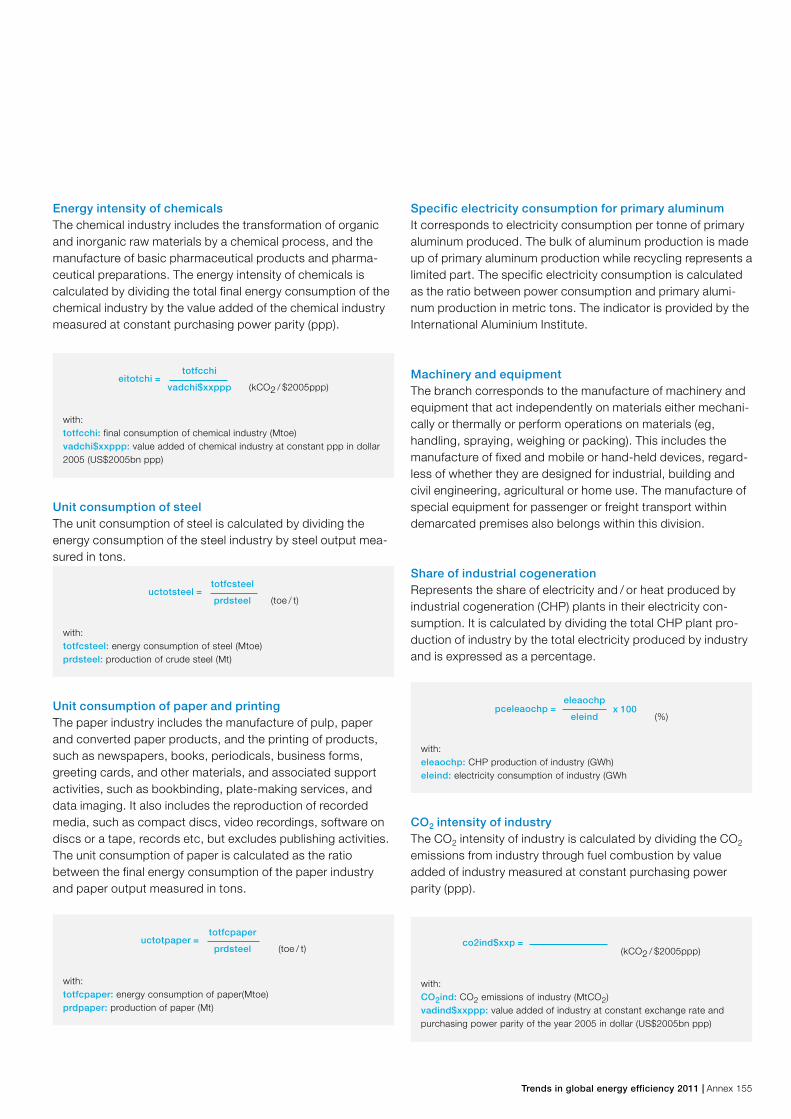
Trends in global energy efficiency 2011 | Annex 155
Energy intensity of chemicalsThe chemical industry includes the transformation of organic and inorganic raw materials by a chemical process, and the manufacture of basic pharmaceutical products and pharma-ceutical preparations. The energy intensity of chemicals is calculated by dividing the total final energy consumption of the chemical industry by the value added of the chemical industry measured at constant purchasing power parity (ppp).
with:totfcchi: final consumption of chemical industry (Mtoe)vadchi$xxppp: value added of chemical industry at constant ppp in dollar 2005 (US$2005bn ppp)
eitotchi = totfcchi
vadchi$xxppp (kCO2 / $2005ppp)
Unit consumption of steel The unit consumption of steel is calculated by dividing the energy consumption of the steel industry by steel output mea-sured in tons.
with:totfcsteel: energy consumption of steel (Mtoe) prdsteel: production of crude steel (Mt)
uctotsteel = totfcsteel
prdsteel (toe / t)
Unit consumption of paper and printing The paper industry includes the manufacture of pulp, paper and converted paper products, and the printing of products, such as newspapers, books, periodicals, business forms, greeting cards, and other materials, and associated support activities, such as bookbinding, plate-making services, and data imaging. It also includes the reproduction of recorded media, such as compact discs, video recordings, software on discs or a tape, records etc, but excludes publishing activities. The unit consumption of paper is calculated as the ratio between the final energy consumption of the paper industry and paper output measured in tons.
with:totfcpaper: energy consumption of paper(Mtoe) prdpaper: production of paper (Mt)
uctotpaper = totfcpaper
prdsteel (toe / t)
Specific electricity consumption for primary aluminumIt corresponds to electricity consumption per tonne of primary aluminum produced. The bulk of aluminum production is made up of primary aluminum production while recycling represents a limited part. The specific electricity consumption is calculated as the ratio between power consumption and primary alumi-num production in metric tons. The indicator is provided by the International Aluminium Institute.
Machinery and equipment The branch corresponds to the manufacture of machinery and equipment that act independently on materials either mechani-cally or thermally or perform operations on materials (eg, handling, spraying, weighing or packing). This includes the manufacture of fixed and mobile or hand-held devices, regard-less of whether they are designed for industrial, building and civil engineering, agricultural or home use. The manufacture of special equipment for passenger or freight transport within demarcated premises also belongs within this division.
Share of industrial cogenerationRepresents the share of electricity and / or heat produced by industrial cogeneration (CHP) plants in their electricity con-sumption. It is calculated by dividing the total CHP plant pro-duction of industry by the total electricity produced by industry and is expressed as a percentage.
with:eleaochp: CHP production of industry (GWh)eleind: electricity consumption of industry (GWh
pceleaochp = eleaochp
eleind (%)x 100
CO2 intensity of industryThe CO2 intensity of industry is calculated by dividing the CO2 emissions from industry through fuel combustion by value added of industry measured at constant purchasing power parity (ppp).
with:CO2ind: CO2 emissions of industry (MtCO2)vadind$xxppp: value added of industry at constant exchange rate and purchasing power parity of the year 2005 in dollar (US$2005bn ppp)
co2ind$xxp = (kCO2 / $2005ppp)

156 Annex | Trends in global energy efficiency 2011
EconomyConstant 2005 dollars ($2005)Monetary values are measured at constant price of a given reference year (2005) to remove the impact of inflation in com-parison. Constant prices are obtained by dividing current (or normal) prices by a deflator (price index).
Purchasing power parities (ppp)The purchasing power parity eliminates the differences in price levels between different countries: a money unit, at ppp, can buy the same basket of goods and services in all world regions. It reflects differences in general price levels and relates the energy consumption to the real level of economic activity. For instance, in regions with a low cost of living, the energy inten-sity will be lowered when measured at ppp (instead of exchange rates) since this will increase the value of the coun-try’s GDP. In addition ppp do not fluctuate as much as exchange rates, and provide a more stable comparison of energy intensities.
GDPGDP measures the economic activity of a country; it is usually measured at market prices. The GDP at market price is the sum of value added at factor cost, plus indirect taxes less subsidies.
Value addedValue added is the usual mode of measurement of the net output of a branch or sector in monetary units; it equals the difference between the gross output and the value of inputs; the value added can be measured at factor cost or at market prices.
Definition of world regions:North America corresponds to Canada, United States.
Latin America groups together Central America, Mexico, South America and the Caribbean. Central America corre-sponds to Belize, Costa Rica, El Salvador, Guatemala, Hondu-ras, Nicaragua and Panama; while South America includes Argentina, Bolivia, Brazil, Chile, Colombia, Ecuador, Guyana, Paraguay, Peru, Suriname, Uruguay and Venezuela. Caribbean countries are Bahamas, Barbados, Bermuda, Cuba, Dominica, Dominican Republic, Grenada, Haiti, Jamaica, Netherlands Antilles & Aruba, St Lucia, St Vincent and the Grenadines and Trinidad & Tobago.
Europe includes the European Union (Austria, Belgium, Den-mark, Finland, France, Germany, Greece, Ireland, Italy, Luxem-bourg, Netherlands, Portugal, Spain, Sweden, United King-dom, Cyprus, Czech Republic, Estonia, Hungary, Latvia, Lithuania, Malta, Poland, Slovak Republic, Slovenia, Bulgaria
and Romania) and Albania, Bosnia-Herzegovina, Croatia, Iceland, Macedonia, Norway, Serbia & Montenegro, Switzer-land and Turkey.
CIS countries are Armenia, Azerbaijan, Belarus, Georgia, Kazakhstan, Kyrgyzstan, Moldova, Russia, Tajikistan, Turk-menistan, Ukraine and Uzbekistan.
OECD Asia includes Australia, Japan, New Zealand and South Korea.
Other Asia corresponds to the Asia and Pacific regions, excluding OECD Asia, China and India. It includes Afghanistan, Bangladesh, Bhutan, Brunei, Cambodia, Hong Kong, Indone-sia, Nepal, Pakistan, Sri-Lanka, Lao, Macao, Malaysia, Mal-dives, Mongolia, Myanmar, North Korea, Philippines, Singa-pore, Taiwan, Thailand, Vietnam and the Pacific Islands.
Middle East includes Bahrain, Iran, Iraq, Israel, Jordan, Kuwait, Lebanon, Oman, Qatar, Saudi Arabia, Syria, United Arab Emirates and Yemen.
Africa is made up of North Africa countries, ie, Algeria, Egypt, Libya, Morocco and Tunisia, and Sub-Saharan countries: Angola, Benin, Botswana, Burkina Faso, Burundi, Cameroon, Cape Verde, Central African Republic, Chad, Comoro Islands, Congo, Cote d’Ivoire, Djibouti, Equatorial Guinea, Eritrea, Ethiopia, Gabon, Gambia, Ghana, Guinea, Guinea-Bissau, Kenya, Lesotho, Liberia, Madagascar, Malawi, Mali, Mauritania, Mauritius, Mozambique, Namibia, Niger, Nigeria, RD Congo, Rwanda, São Tomé and Principe, Senegal, Seychelles, Sierra Leone, Somalia, South Africa, Sudan, Swaziland, Tanzania, Togo, Uganda, Zambia and Zimbabwe.
AnnexSources and methodology

“Trends in global energy efficiency 2011” is based on data and information provided by Enerdata and the Economist Intelligence Unit. The data and infor-mation is published with the consent of Enerdata and the Economist Intelligence Unit.
Copyright notices
Part IThe survey and related analysis were designed and written by the Economist Intelligence Unit. Whilst ef-forts have been taken to verify the accuracy of this information, neither the Economist Intelligence Unit Ltd. nor its affiliates can accept any responsibility or liability for reliance by any person on this informati-on. © 2011 The Economist Intelligence Unit Ltd. All rights reserved.
Part IIAll information or data provided by Enerdata, in any form, is the property of Enerdata and is protected in each country by national laws governing intellectual property. All information or data provided by En-erdata is copyright protected, inclusive of material appearing in a hard copy format or electronically. Data provided by Enerdata are based on compilati-on and analysis of the best sources in the industry. Enerdata has agreements with those providers to use and publish this data.
All pictures Copyright ABB

Contact us ©
Cop
yright 2011 AB
B. A
ll rights reserved. D
esign by w
ww
.wem
akebran
ds.ch
ABB LtdCorporate CommunicationsP.O. Box 8131CH-8050 ZurichSwitzerlandPhone: +41 (0)43 317 71 11 Fax: +41 (0)43 317 79 58 www.abb.com