Download - CAPT Lab: Investigating the Effect of Temperature on Enzyme Activity Created by Mr. Cross - 2007
CAPT Lab: Investigating the Effect of
Temperature on Enzyme Activity
Created by Mr. Cross - 2007

Purpose
This presentation serves to either serve as a reminder to those students that
participated in this CAPT inquiry lab or to introduce this lab to those students that
did not participate in activity.

Directions
Read through the presentation and answer the questions as they are proposed.

Background• Enzymes are proteins that act as catalysts which speed
up chemical reactions. They do this by lowering the energy needed for a reaction to occur, the activation energy.
Reaction pathwaywithout enzyme
Activation energywithout enzyme
Reaction pathwaywith enzyme
Reactants
Products
Activation energy
with enzyme
Effects of Temperature and pH
• When the temperature or pH of the enyzme environment is not ideal the reaction may slow down or not occur at all.
Problem Statement
How does temperature affect the rate of an enzyme catalyzed
reaction?

MaterialsRaw liver Petri dish
Dropper pipette 1 % Hydrogen Peroxide Solution
Liver Puree 25 mL graduated cylinder
50 mL Beakers Filter-paper disks
Glass marking pencil Ice bath
3 thermometers Warm water bath
Clock or stop watch Forceps
Hot plate
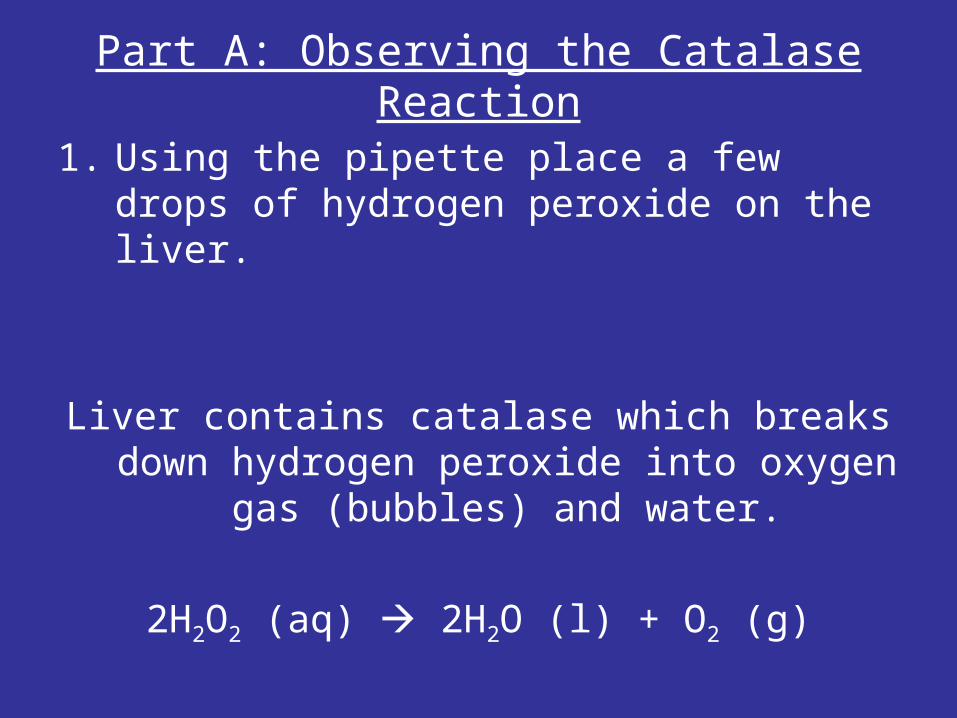
Part A: Observing the Catalase Reaction
1. Using the pipette place a few drops of hydrogen peroxide on the liver.
Liver contains catalase which breaks down hydrogen peroxide into oxygen gas
(bubbles) and water.
2H2O2 (aq) 2H2O (l) + O2 (g)
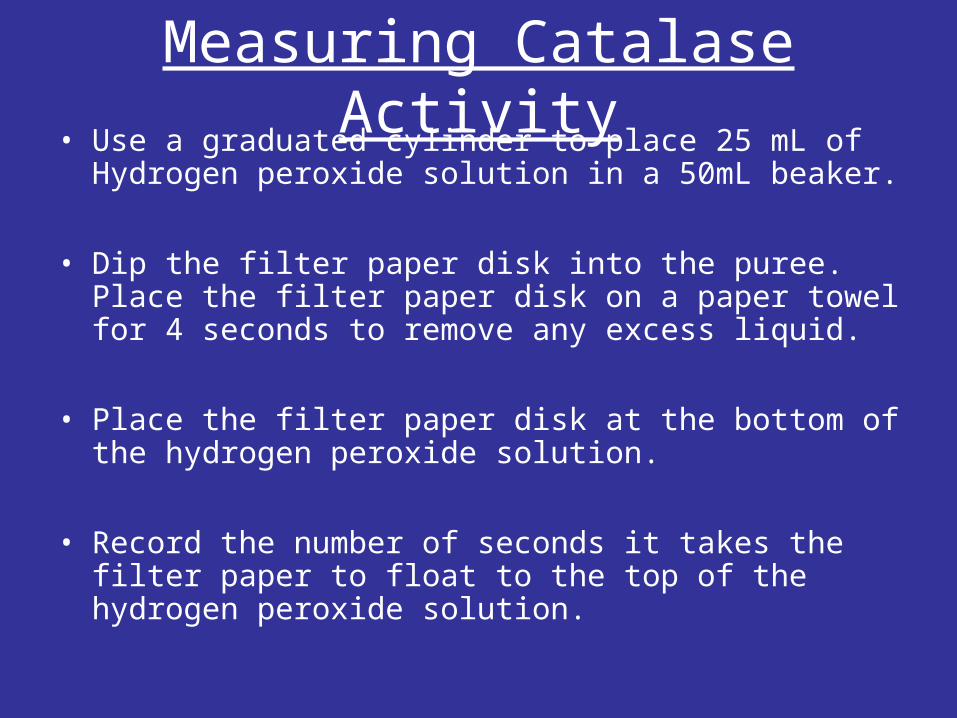
Measuring Catalase Activity• Use a graduated cylinder to place 25 mL of Hydrogen
peroxide solution in a 50mL beaker.
• Dip the filter paper disk into the puree. Place the filter paper disk on a paper towel for 4 seconds to remove any excess liquid.
• Place the filter paper disk at the bottom of the hydrogen peroxide solution.
• Record the number of seconds it takes the filter paper to float to the top of the hydrogen peroxide solution.

Your Task
• Design an experiment to test the affects of temperature on enzyme activity.
Write a Hypothesis
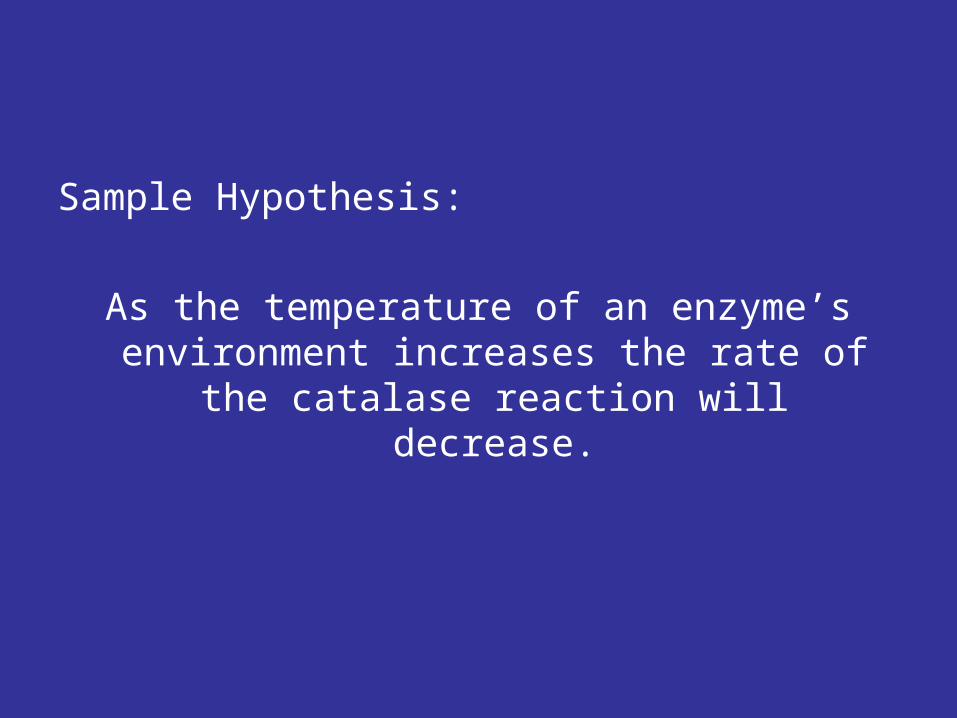
Sample Hypothesis:
As the temperature of an enzyme’s environment increases the rate of the
catalase reaction will decrease.

What is the independent variable (manipulated variable)?
Temperature
What is the dependent variable (responding variable)?
Rate of the reaction
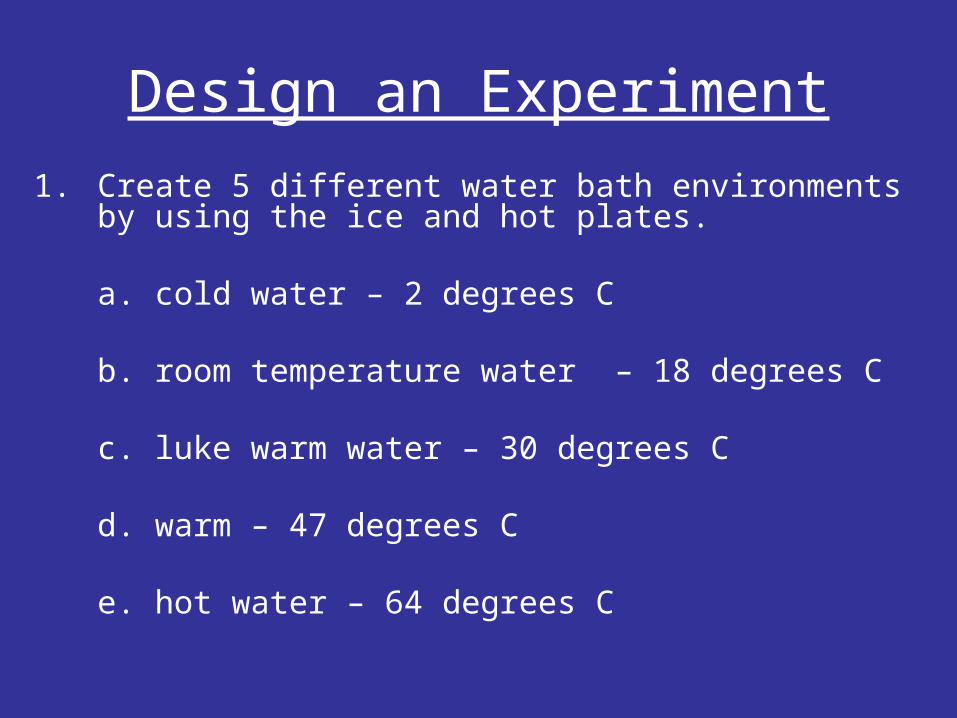
Design an Experiment
1. Create 5 different water bath environments by using the ice and hot plates.
a. cold water – 2 degrees C
b. room temperature water – 18 degrees C
c. luke warm water – 30 degrees C
d. warm – 47 degrees C
e. hot water – 64 degrees C

2. Using the graduated cylinder pour 25 mL of the Hydrogen peroxide into each of the 50 mL beakers.
3. Label each beaker so they correspond with step 1.
4. Place each beaker into their proper water bath for 10 minutes.
5. Measure the temperature of the hydrogen peroxide solution and record.

6. Dip the filter paper disk into the liver puree for 5 seconds.
7. Remove the disk and place it on the paper towel to remove the excess liquid.
8. Immediately place the disk at the bottom of the hydrogen peroxide solution.
9. Record how long it takes for the disk to float.
10. Repeat steps 5-9 for each solution.
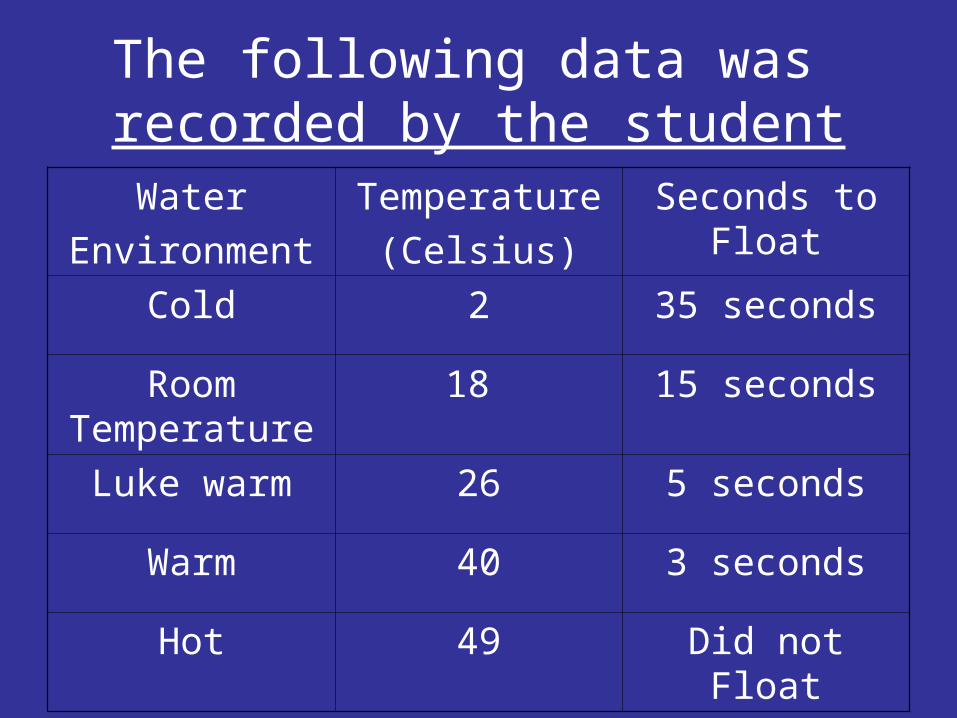
The following data was recorded by the student
Water
Environment
Temperature
(Celsius)
Seconds to Float
Cold 2 35 seconds
Room Temperature
18 15 seconds
Luke warm 26 5 seconds
Warm 40 3 seconds
Hot 49 Did not Float

The Affect of Temperature on Catalse Activity
35
15
53
0
5
10
15
20
25
30
35
40
0 10 20 30 40 50 60
Temperature (Celsius)
Tim
e to
Flo
at (
s)
Note: 49 degrees Celsius never floated.
Student 1’s Graph
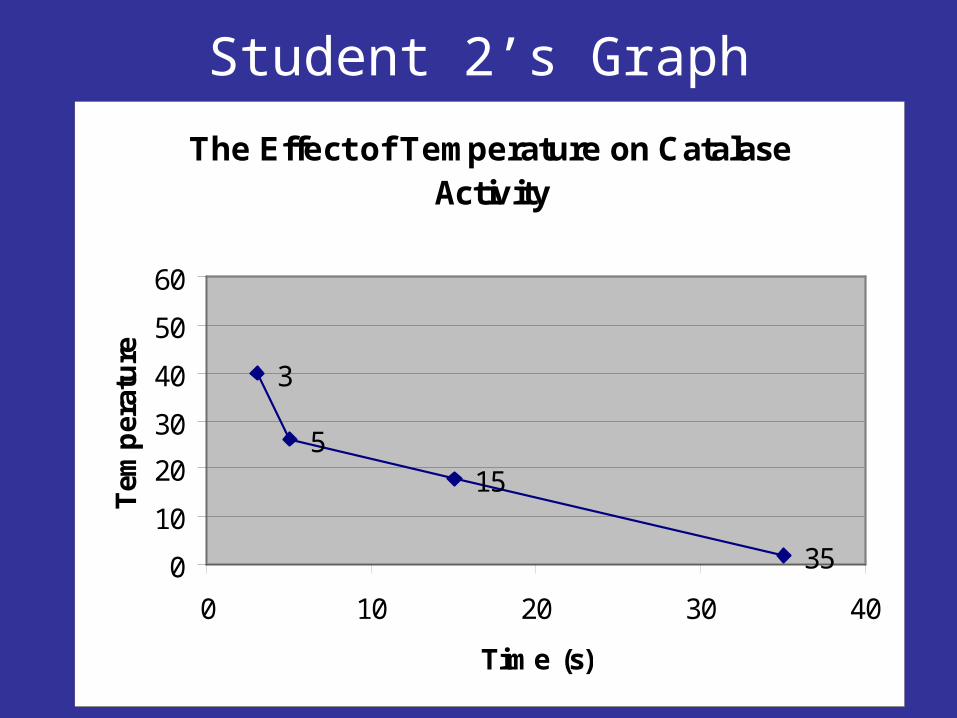
Student 2’s Graph
The Effect of Temperature on Catalase Activity
35
155
3
0
10
20
30
40
50
60
0 10 20 30 40
Time (s)
Tem
per
atu
re
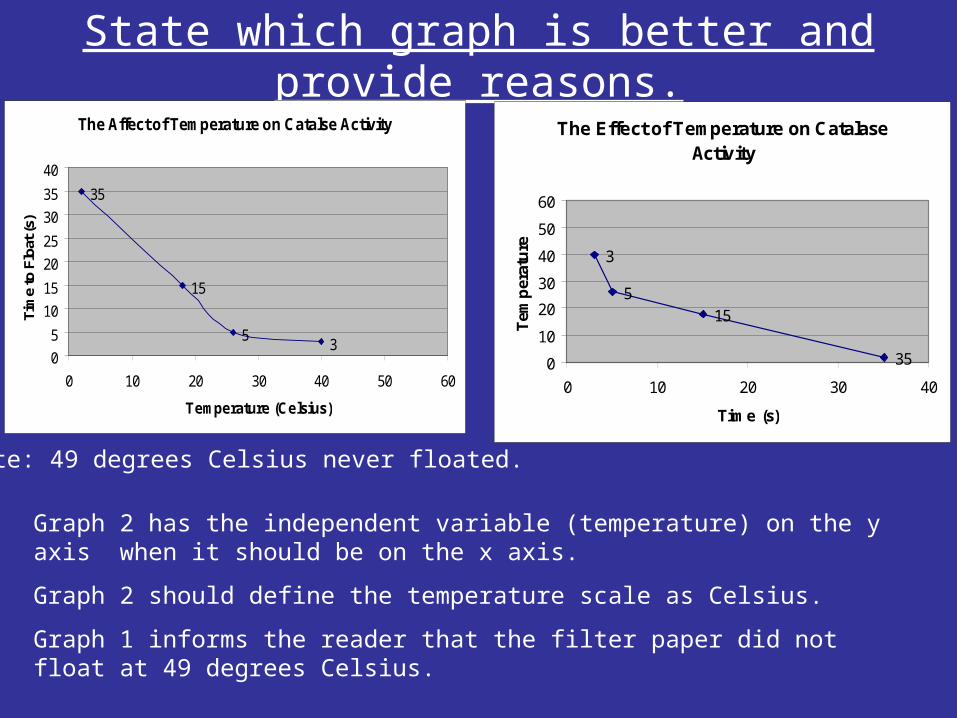
State which graph is better and provide reasons.The Affect of Temperature on Catalse Activity
35
15
53
0
5
10
15
20
25
30
35
40
0 10 20 30 40 50 60
Temperature (Celsius)
Tim
e to
Flo
at (s
)
The Effect of Temperature on Catalase Activity
35
155
3
0
10
20
30
40
50
60
0 10 20 30 40
Time (s)
Tem
per
atu
reGraph 2 has the independent variable (temperature) on the y axis when it should be on the x axis.
Graph 2 should define the temperature scale as Celsius.
Graph 1 informs the reader that the filter paper did not float at 49 degrees Celsius.
Note: 49 degrees Celsius never floated.
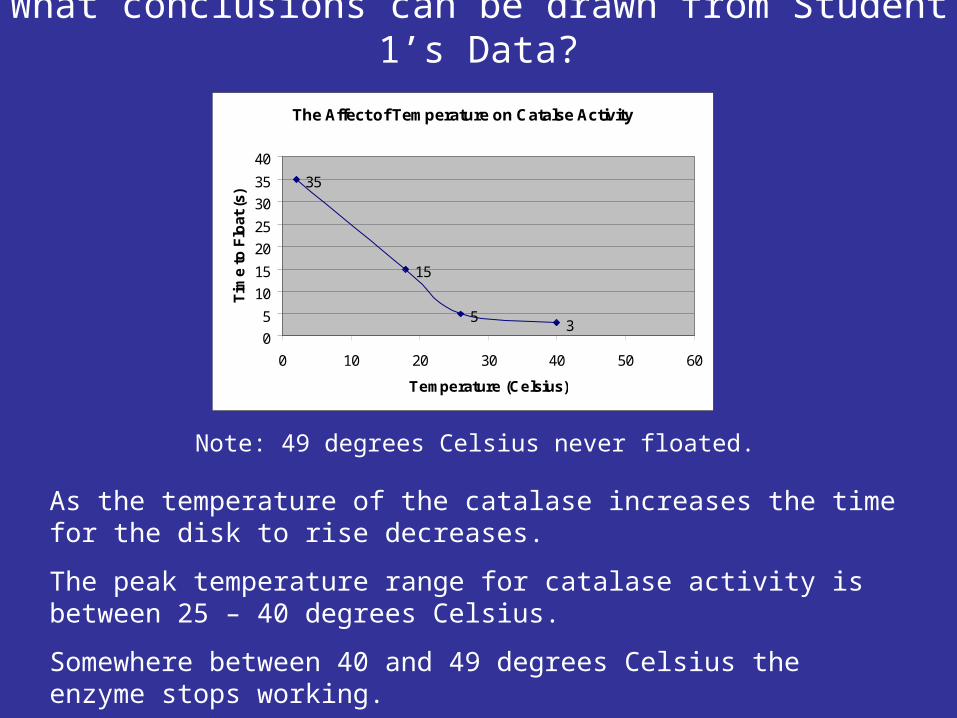
What conclusions can be drawn from Student 1’s Data?
The Affect of Temperature on Catalse Activity
35
15
53
0
5
10
15
20
25
30
35
40
0 10 20 30 40 50 60
Temperature (Celsius)
Tim
e to
Flo
at (
s)
As the temperature of the catalase increases the time for the disk to rise decreases.
The peak temperature range for catalase activity is between 25 – 40 degrees Celsius.
Somewhere between 40 and 49 degrees Celsius the enzyme stops working.
Note: 49 degrees Celsius never floated.
What could be done to improve the validity of the experiment?
• Increase the number of trials at each temperature.
What further investigations could be done?
• Investigate the affects of temperature at the 30 - 60 degree Celsius range.
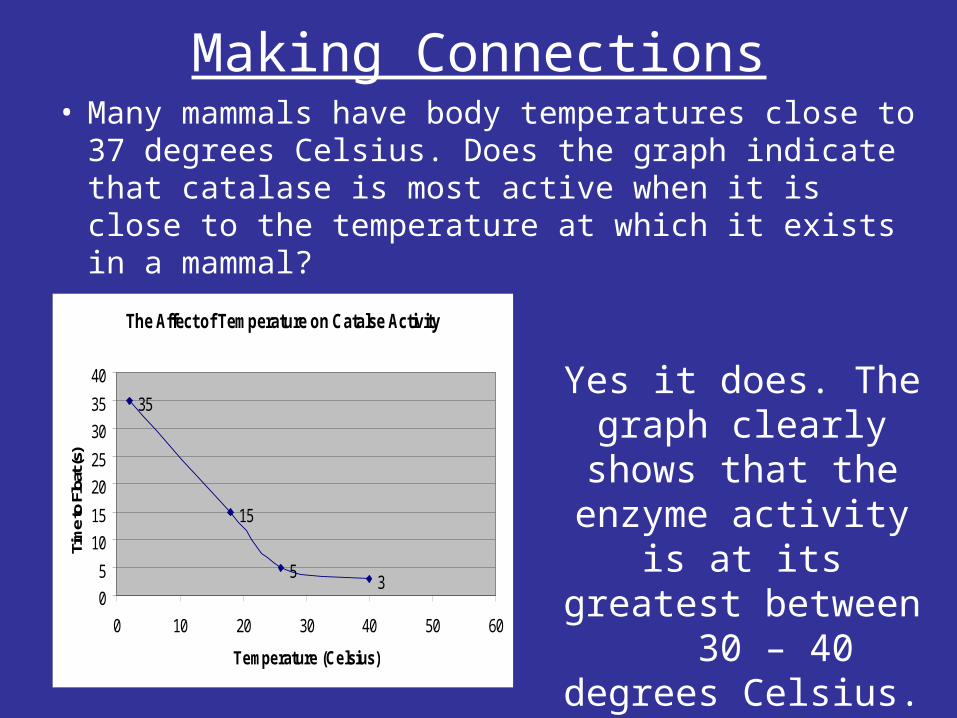
Making Connections• Many mammals have body temperatures close to
37 degrees Celsius. Does the graph indicate that catalase is most active when it is close to the temperature at which it exists in a mammal?
The Affect of Temperature on Catalse Activity
35
15
53
0
5
10
15
20
25
30
35
40
0 10 20 30 40 50 60
Temperature (Celsius)
Tim
e to
Flo
at (s
)
Yes it does. The graph clearly shows
that the enzyme activity is at its
greatest between 30 – 40 degrees
Celsius.


