BUSTING THE ‘PRINCELINGS’:THE CAMPAIGN AGAINST
CORRUPTION IN CHINA’S PRIMARYLAND MARKET∗
Ting CHEN† James Kai-sing KUNG‡
This version, October 2018
Abstract
Using data on over a million land transactions during 2004-2016 where local govern-
ments are the sole seller, we find that firms linked to members of China’s supreme
political elites—the Politburo—obtained a price discount ranging from 55.4% to 59.9%
compared to those without the same connections. These firms also purchased slightly
more land. In return, the provincial party secretaries who provided the discount to
these “princeling” firms are 23.4% more likely to be promoted to positions of national
leadership. To curb corruption, President Xi Jinping stepped up investigations and
strengthened personnel control at the province level. Using a spatially matched
sample (e.g., within a 500-meter radius), we find a reduction in corruption of between
50.1% and 43.6% in the provinces either targeted by the central inspection teams or
whose party secretary was replaced by one appointed by Xi himself. Accordingly, this
crackdown on corruption has also significantly reduced the promotional prospects of
those local officials who rely on supplying a discount to get ahead.
JEL Classification Nos.: D73, P26, H7, O17
∗Acknowledgements: We thank four anonymous referees, the editor Robert Barro, Ruixue Jia, AndreiShleifer, Noam Yuchtman, and participants at various seminars and conferences for helpful comments andsuggestions on earlier drafts. James Kung is especially grateful to the Yan Ai Foundation for its generousfinancial support. The remaining errors are ours.†Ting Chen, Department of Economics, Hong Kong Baptist University, Renfrew Road, Hong Kong.
Email: [email protected]. Phone: +852-34117546. Fax: +852-34115580.‡James Kai-sing KUNG (Corresponding Author), Faculty of Business and Economics, University of Hong
Kong, Pokfulam Road, Hong Kong. Email: [email protected]. Phone: +852-39177764. Fax: +852-28585614.
1 Introduction
It is no secret that the friends and relatives of national leaders around the globe are thriving
in business, thanks to cronyism (Haber, 2002, Kang, 2002, Thiessen and Schweizer, 2011).
However, just exactly how cronyism works remains little known. The stereotypical assump-
tion is that corrupt businessmen would bribe powerful government officials in exchange for
either cheap access to scarce national resources or preferential policy treatment, if not both
(Olken and Pande, 2012; Rose-Ackerman and Palifka, 2016; Shleifer and Vishny, 1993). Like
many other autocratic countries, China is one in which cronyism has arguably run rampant
(e.g., Bai, Hsieh, and Song, 2014; Gong, 2015; Pei, 2016; Wedeman, 2012). Unlike the other
autocratic countries (e.g., Indonesia), however, China is not ruled by a single dictator but
instead by a single political party comprising tight-knit political elites. Steeped in the tra-
dition of the nomenklatura in the former Soviet Union, members of the Politburo, which in
China amount to no more than 30 at any single national congress, wield disproportionate
power in setting economic and other policies including personnel appointment and control.
Sitting at the apex of the power pyramid, these elites are targeted by those hoping to seek
favors. The fact that family members—in particular the offspring of these top politicians
or the so-called “princelings” as they are popularly referred to in the media1—are found
extraordinarily wealthy suggests that political connections are very much active in China
(Brown, 2014; Shih, 2008; Witt and Redding, 2014). In fact, the international media has ex-
tensively reported on the family members and relatives of China’s top politicians benefiting
enormously from their businesses.2
1Princelings is a term first coined by the media. See, e.g., The Wall Street Journal, “Children of theRevolution” http://www.wsj.com/articles/SB10001424053111904491704576572552793150470.
2The former Prime Minister, Wen Jiabao, is a good case in point. Widely proclaimed as some-one coming from an “extremely poor” family, “(m)any relatives of Wen Jiabao, including his son,daughter, younger brother and brother-in-law, have become extraordinarily wealthy during his lead-ership”, according to the New York Times “Billions in Hidden Riches for Family of Chinese Lead-er” (http://www.nytimes.com/2012/10/26/business/global/family-of-wen-jiabao-holds-a-hidden-fortune-in-china.html). In the same year that this piece came out, the Financial Times reported the wealth andfortunes of the relatives of virtually all members of the Politburo Standing Committee of the 16th and 17th
national congresses—essentially the Chinese national leaders during 2002-2012. See “Off the charts: Bei-jing family fortunes”, https://www.ft.com/content/014c8fba-6808-32fa-9b04-35e9860cfacf; “China’s Power
1

If this is how cronyism works in China, then it suggests a very different mechanism from
presumably the one operating in other contexts. Instead of a private businessman providing
an official with a bribe, the bribe is actually furnished by a regional or local official endowed
with the (ill-defined) rights over certain state-owned resources and the power to practice
price discrimination, presumably in exchange for some not-readily observable benefits such
as promotion.3 Our hypothesis is premised on two institutional features of China’s political
economy. First, promotion within the party hierarchy is valued highly by members and is
typically determined by officials at the level immediately above (known as the “one-level-up”
policy); for example, promotion of the provincial-level officials is determined by members of
the Politburo. Second, beginning from the late 1990s land and other natural resources (e.g.,
coal mines) have been decentralized to the regional or local governments (from province
down to the county), who as a result have the discretion to exercise price discrimination for
different classes of buyers, with political connections being an important determinant.
Cronyism must have been so prevalent the very first significant task that the new par-
ty secretary, Xi Jinping, took on was to launch an anti-corruption campaign to weed out
corruption. Xi’s campaign differs distinctly from those of his predecessors in a number of
crucial respects. First, he strengthened the Central Commission for Discipline Inspection
(CCDI), an organization whose goal is to ferret out corrupt officials. Second, the campaign
continues to this day, and with greater intensity (of investigation and arrest). Third, having
recognized the land market as a hotbed of corruption Xi singled it out as a major target.
Fourth, he ignored the “diplomatic immunity” implicitly granted to the most powerful po-
litical figures within the Communist hierarchy and went after a member of the Politburo
Standing Committee, Zhou Yongkang.4
Families”, http://www.ft.com/intl/cms/s/2/6b983f7a-ca9e-11e1-8872-00144feabdc0.htmlaxzz3uvcCyhyy.3A caveat is in order here. Other types of corruption certainly also exist in China. For instance, bribery
for promotion is allegedly rampant in the government in general and in the military in particular, as is theexchange of favors between firms and local officials and among state-owned enterprises. We are thus in noway claiming that the kind of cronyism documented in this study represents the only type of corruptiontaking place in China, nor are we suggesting that it represents the most serious type of corruption.
4Some observers see Xi’s campaign as representing essentially an attempt to remove his political rivalsand consolidate his own power (e.g., Eisenman and Chung, 2015; Yuen, 2014); others are of the view that
2

To unveil the mechanism of cronyism in China, we first set out to identify those firms
linked to the Politburo members (i.e. the princeling firms) during 1997-2016 from among
the universe of firms involved in land purchase. The chosen period spans four national
congresses of the Chinese Communist Party (from the 15th to the 18th). We then merge
this data with the data on land transactions in China’s primary land market—a market
in which the local government is the sole seller. Doing so provides us with the crucial
information on the exact price paid by firms connected to a princeling vis-a-vis that paid
by firms without such connections for land parcels of similar quality; the difference between
the two—the price discount—represents essentially the rents. By this method we hope to go
beyond the innovative “market inference” approach pioneered by Fisman (2001), whereby
the value of political connections is estimated based on the market reactions to, for example,
the rapidly deteriorating health of a national leader as an exogenous shock.5 Moreover, this
direct approach enables us to estimate also whether or not local officials who have provided
a discount to the princeling firms are rewarded by these firms (by dint of their connection
to members of the Politburo) with better prospects of promotion.
Our analysis has yielded the following salient findings. Foremost is that the price discount
obtained by the princeling firms is a sizable 55.4%,6 when we compare the land parcels
purchased by the princeling firms with those located in the same district, designated for the
same usage and sold in the same month of the same year to non-princeling firms, and after
controlling for a number of transaction-level control variables ranging from the log of the
land area sold to the specific sales method employed. Moreover, to address the concern of a
downward bias (i.e., that the princeling firms may selectively purchase land of higher quality
or market value) we match and compare the land parcels purchased by the princeling firms
with those bought by their unconnected counterparts within a significantly smaller catchment
Xi’s anti-corruption campaign has gone beyond mere factional struggle (Lu and Lorentzen, 2016). We areprimarily concerned with the consequences of Xi’s campaign rather than his true intentions.
5Based on the analysis of 79 publicly listed firms allegedly connected to the children of the Indonesianpresident Suharto in 1995, Fisman (2001) finds that approximately 23% of the market value of these firmsis attributable to connections with the Suharto family. See also Faccio (2006) for a similar approach.
6All coefficients with a value greater than 0.5 will be transformed using the formula (exp(β)− 1).
3
area of a 500-meter radius and one of a 1500-meter radius and in the same year. Doing so
yields an even greater price discount—57.0% for the 500-meter radius and 59.5% for the
1500-meter radius. To check the robustness of our results we also regress the quantity of
land sold on princeling purchase and find that the princeling firms also bought more land
than their non-princeling counterparts.
Second, we further find that the more powerful the princeling, the larger the discount.
Firms connected to a member of the Politburo Standing Committee, for instance, obtains
an additional discount of 39.6-44.2% over and above that obtained by those connected to a
Politburo member.
Third, we find that those provincial party secretaries who have provided a discount to
princeling firms are 23.4% more likely to be promoted, with the likelihood of promotion
increasing with both the size of the price discount and the quantity (area) of land sold to
the princeling firms. But the same does not hold true for the governors—the number-two
person in a province.7 Put in charge of economic development, the promotion of governors
is intimately tied to how much they are able to drive GDP growth relative to all other
provinces. The findings are similar for the prefectures, albeit with smaller magnitudes.
Fourth, evidence suggests that Xi’s anti-corruption campaign is effective. For land trans-
actions that took place after 2012 the magnitude of the price discount has shrunk by 25.7-
31.8% depending on the estimate. In a more targeted fashion, inspection undertaken by the
CCDI has the larger effect of raising the transacted price by 55.9% in the full sample, or a
still substantial 50.1% in the matched 500-meter-radius sample. The same occurs as a result
of Xis effort to replace the party secretaries in 14 provinces; the corresponding magnitude is
45.9% in the full sample and 43.6% in the matched sample. Consistently, the effectiveness
of the campaign is also evident in the quantity of land sold.
Finally, to check the robustness of our results we undertake an event study based on the
7Although the provincial governor is the top government official (zheng) in a province, he/she is stillsubject to the authority and command of the party secretary (dang) the way power relations are structuredin China.
4
unexpected arrest of Zhou Yongkang; in the 60 days following his arrest the price discount
received by the princeling firms was reduced significantly, against an unchanging volume of
overall land transactions especially those involving the non-princeling firms, which were not
affected by Zhou’s arrest.
A final qualifying remark is in order. Although corruption among the political elites in
China is intimately tied to the unique institutional features of the political system, it is by no
means an inevitable outcome. Just as the tournament was designed to promote competition
among regional officials, the action of empowering regional governments by giving them
control rights over state assets was designed to facilitate urbanization. It is only when both
features are present that the odds of corruption become heightened.
Our findings are related to three bodies of literature. First, we can think of our study
as contributing to the sizeable literature on the political determinants of corruption. The
literature on corruption (Olken and Pande, 2012; Rose-Ackerman and Palifka, 2016; Shleifer
and Vishny, 1993) and the value of political connections as pioneered by Fisman (2001) and
others is a case in point. By focusing on the relatives of top leaders, we also contribute to the
small but growing literature relating to the dynastic political rents expropriated by politician
families (Cruz, Labonne, and Querubin, 2017; Folke, Persson, and Rickne, 2017; Gagliarducci
and Manacorda, 2016). In a similar vein, our work is also related to the literature examining
the monetary returns from holding political office (Eggers and Hainmueller, 2009; Fisman,
Schulz and Vig, 2014). But what sets our study apart from the above literature is that the
kind of cronyism that we analyze in our context is premised upon certain unique institutional
features of China’s political economy—the simultaneous decentralized control of state assets
and personnel.
Second, by identifying political exchange between family members of the political elites
and local officials within the Chinese context of cronyism, our study augments the literature
regarding the factors on which the promotion of regional leaders hinges beyond the usual
economic performance and factional ties (Jia, Kudamatsu and Seim, 2015; Li and Zhou,
5
2005; Shih, Adolph, and Liu, 2012). Moreover, against the literature regarding the effect of
clientelism or specifically vote buying on political selection in democratic regimes (Finan and
Schechter, 2012; Gans-Morse, Mazzuca, and Nichter, 2014 among many others), we examine
corruption hidden in the process of selecting national leaders in a non-democratic setting.
Finally, by empirically assessing the effectiveness of various anti-corruption instruments im-
plemented by Xi, our paper also contributes to a growing literature devoted to examining the
design of political institutions in curbing corruption (Avis, Ferraz and Finan, 2017; Bobonis
et al., 2016; Di Tella and Schargrodsky, 2003; Ferraz and Finan, 2008).
Our paper proceeds as follows. Section 2 begins by providing a conceptual framework
laying out the institutional features that give rise to cronyism in China, followed by an
explanation for why the primary land market offers an ideal case for examining corruption,
and the salient characteristics of Xi Jinping’s anti-corruption campaign. Section 3 provides
a detailed account of how we construct our unique data set of the princeling firms and land
transactions. Section 4 reports the magnitude of the rents associated with cronyism in the
primary land market, whereas Section 5 discusses how the provision of a price discount affects
one’s promotion chances. Section 6 examines the effects of Xi’s anti-corruption campaign,
and Section 7 concludes the study.
2 Background
2.1 Cronyism in China: A Conceptual Framework
By cronyism we refer to the exchange of favors between politicians and businessmen to
their mutual benefits (Olken and Pande, 2012; Rose-Ackerman and Palifka, 2016; Shleifer
and Vishny, 1993). Specifically, one may think of an instance where a politician provides
scarce, government-owned resources over which they have control rights to a businessman
to whom he or she is connected at a substantial discount to the market price, in exchange
for either certain direct pecuniary benefits (i.e., outright corruption), or indirectly enhanced
promotion prospects, or in some cases both. That cronyism assumes this particular form in
6

China is due to certain institutional features that evolved from the process of its economic
reforms. The first pertains to the decentralization of control rights over a wide range of
state-owned assets such as land and mines and industrial enterprises (Pei, 2016). Take land
for example. In order to facilitate urbanization without privatizing land rights, the state
passed a statutory bill in 1998 granting de jure ownership over land to local governments
in their geographical jurisdictions (Han and Kung, 2015; Lin and Ho, 2005; Kung, Xu, and
Zhou, 2013). Local governments, especially prefecture- and county-level governments, are
thus assigned exclusive statutory rights to the revenue obtained from selling land usufruct
rights (and the accompanying residual income rights), which typically carry a duration of
70 years. This placed local officials in a unique position to practice price discrimination by
providing steep discounts to certain classes of buyers in exchange for certain benefits. The
question is who would they provide the favor to?
This brings us to the second institutional feature facilitating cronyism—the “one-level-
up” policy. Our conjecture is that firms connected to the “princelings”—or firms specifically
run by the children and extended family of the Politburo members—are the likely benefi-
ciaries. The reason is straightforward. To invigorate economic growth China has since 1978
(the year when reform began) decentralized its economy, but as befits a Leninist state, its
political structure has remained to this day highly centralized. What this means is that the
state has relied on a “tournament” in which regional officials (province and below) are made
to compete with one another in growing the economies under their jurisdiction and those
who “win” are rewarded with promotion (Li and Zhou, 2005; Maskin, Qian, and Xu, 2000;
Xu, 2011, among others). In the case of province officials, for instance, promotion equates
to appointment in the Politburo. Given that appointment and promotion within the party-
state in China is decided by the personnel one level up, members of the Politburo are in a
unique position to wield influence over the promotion of the province chiefs—especially the
province party secretaries. Indeed, in our sample of provincial party secretaries, 52% have
been promoted to the Politburo. Consisting of no more than two dozen members (e.g. only
7
21 members were elected at the 19th National Congress which took place on October 2017),
the Politburo is essentially the pinnacle of one’s political career within the hierarchy of the
Chinese nomenklatura. The province chiefs thus have enormous incentives to provide favors
of any kind to firms intimately connected to the princelings.8 Together, the decentralization
of control rights over state-owned assets and the “one-level-up” policy have unwittingly en-
abled China’s crony capitalism to emerge.9 Thus, corruption of this nature may go beyond
rent seeking, to the extent that it undermines the tournament’s effectiveness.
2.2 Corruption in China’s Primary Land Market
In light of the reasons given in section 2.1, China’s primary land market, which includes oil
fields and coal mines (accounting for respectively less than 2% and 8% in our sample), is ideal
for examining the trading of favors between the princeling firms and local officials for two
additional reasons. First, since local governments have been made the sole statutory owner
and supplier of land in a regional context, they resemble essentially the monopolists modeled
in Shleifer and Vishny (1993)—a setting strongly prone to corruption. Related to that is
the monumental shift in China’s local fiscal system from one based primarily on enterprise
tax to one based on land tax resulting in the increasing reliance of local governments at
the prefectural level and below on revenues obtained from selling land use rights (Chen and
Kung, 2016; Han and Kung, 2015). To illustrate, in early 2000 land revenue accounted for
less than 2% of a county’s total revenue, but by 2011 it already represented 30% of the total
government revenue, amounting to approximately 6% of total GDP (Figure I). Inherent in
this singular reliance on selling land use rights for revenue lies the proclivity for seeking
rents.
8This is not to suggest that the Politburo members all have a penchant for seeking rents. However, beingcognizant of the unique set of rules of appointment and promotion in China, family members and relativesof China’s political elites may be inclined to take advantage of their influence to seek favors from high-levellocal officials.
9Indeed, back in the 1990s, political elites could only get ahead by placing their children in large state-owned enterprises as senior executives. For example, Li Xiaopeng, the son of the former Prime Minister LiPeng, served as executive manager of Huaneng Power International, one of the “big five” conglomerates inthe power industry worth trillions in assets in 1995, at the relatively young age of 36.
8
Figure I about here
Indeed, corruption in China’s primary land market is widespread. For example, nearly a
quarter (23%) of the 2,802 corruption cases reported in the Procuratorial Daily or Jiancha
Ribao between 2000 and 2009 are related to the primary land market (Gong and Wu, 2012).10
In line with this reasoning, the real estate sector has become a “hotbed of crony capitalism
in China”, as it is capable of generating “most of its profits from obtaining cheap land” (Pei,
2016, p. 50).
The extent to which corruption has run rampant in China’s market for land and other
natural resources (most notably coal mines) cannot be better illustrated than by the unex-
pected arrest of Zhou Yongkang, a former member of the Politburo Standing Committee, and
his son Zhou Bin, who apparently was running the family businesses. It was soon uncovered
after the father-and-son duo was arrested that the Zhou family had amassed a 90 billion
yuan fortune, primarily by purchasing state-owned land and coal mines from local govern-
ments in the provinces of Sichuan and Yunnan at prices substantially below the market.
The then provincial party secretary of Yunnan, Bai Enpei, subsequently confessed to the
crime and was also arrested.11 By the same token, Jiang Jiemin, the former vice governor of
Qinghai province, had similarly sold several land parcels and oil fields to Zhou Bin at a pit-
tance. Later on, Jiang was promoted to become the chairman of China National Petroleum
Corporation—a position commensurate with a ministerial appointment, presumably with
Zhou Yongkang’s help.
2.3 Xi’s Anti-Corruption Campaign
It is thus not fortuitous that the General Secretary of the Communist Party of China, Xi
Jinping, singled out land as one of his main targets in the anti-corruption campaign, which he
10As the mouthpiece of the Supreme People’s Procuratorate, the Procuratorial Daily contains a columnthat periodically reports major corruption cases uncovered by the CCDI.
11Bai confessed that the Zhou family only paid 150 million yuan for several land parcels and coalmines in Yunnan, assets which would have been worth more than a hundred billion at market price(http://news.ifeng.com/a/20150114/42925278.shtml). 1 Chinese yuan = 0.15 US dollars.
9

initiated soon after assuming office in November 2012.12 This campaign has several salient
features. Foremost is that Xi strengthened the CCDI—an organization set up to detect
corruption. Previously, the local or regional commission’s effort to detect misconduct had
been thwarted by their provincial superiors who were officials from the same province and
understandably wanted to cover up scams uncovered at the lower levels. To strengthen
the political independence of local operations, the new rule now requires the head of the
provincial commission to be filled by officials from a different province and who are therefore
“unlikely to be tied to local patronage networks” (Pei, 2016, p. 75; see also Manion, 2016).
As a result of this change, the reformed CCDI must now rely on their own intelligence
and may dispatch investigation teams to the targeted units without warning; this allegedly
renders the campaign more effective (Pei, 2016; Yuen, 2014).
Xi’s anti-corruption campaign has also been more intense and longer-lasting. Unlike
campaigns before him, Xi’s has been running for up to four calendar years and has busted
three times as many officials as in any one of the previous campaigns. For instance, in 2016
alone more than 100,000 low-ranking officials were indicted for corruption compared with a
mere 30,315 in 2012.
But the biggest breakthrough must be that, unlike any previous political campaigns,
Xi’s anticorruption campaign targeted even the top party officials. This time, even Zhou
Yongkang, one of the most powerful political figures, was bluntly taken down alongside his
son Zhou Bin on charges of corruption. At the same time Xi also brought down Ling Jihua,
chief of the General Office of the Chinese Communist Party between 2007 and 2012, another
powerful figure closely connected to the former General Secretary Hu Jintao. According to
some observers, Xi was trying to send a strong message to the princelings that he would not
tolerate corruption regardless of who is backing them (Manion, 2016).
12According to the speech he made to the Central Commission for Discipline Inspection (CCDI) onJanuary 23rd, 2013, Xi stressed that “we must concentrate our crackdown on corruption in critical sectorssuch as mining resources, land transfers, and real estate development”.
10

3 Data Construction
3.1 Firms Connected to the Princelings
For our purpose, princelings are the offspring and other extended family members of China’s
leaders—specifically members of the Politburo and its Standing Committee. Our definition
is thus slightly different from the one which defines princelings as “the children of veteran
communists who held high-ranking offices in China before 1966, the first year of the Cul-
tural Revolution” (Bo, 2015). A major reason for the difference is that corruption in the
present-day context in general, and that tied to transactions in the primary land market in
particular, involves primarily children and family members of the elite party members who
served between 1997 and 2016. There are two additional reasons for choosing this particular
period. First, the Politburo began to assume supreme power only after China’s paramount
leader Deng Xiaoping and other founding members of the Chinese Communist Party stepped
down in 1997. Prior to that, all important decisions pertaining to the party were essentially
made by Deng and these founding members. Second, it was not until 1998 that the state
devolved statutory rights over land to local governments; before then no regional government
was able to sell land usufruct rights for revenue. In China’s one-party rule system, the Polit-
buro is the apex of the power pyramid consisting of on average 25 members who are elected
from among the Central Committee members, who in turn are chosen from thousands of
National Congress delegates. Out of these 20 or so elites, seven to nine would be further
elected to become members of the Politburo Standing Committee, with one person assuming
the position of party General Secretary. Thus, the Politburo and its Standing Committee
wield most of the power within the Chinese Communist Party (refer to Figure II). In our
sample, there are altogether 64 Politburo members spanning four National Congresses (be-
tween the 15th and the 18th). Of these 64 political elites, 36 are Politburo members and 28
are Standing Committee members during the period 1997-2016.
Figure II about here
11

Upon identifying these political elites, we then searched online for their family members—
children and relatives. We relied on multiple sources including Western media (Bloomberg,
New York Times, The Washington Post, and Guardian), China’s news groups (China Digital
Times and Boxun.com), and the International Consortium of Investigative Journalists (ICIJ).
Altogether we have identified 134 family members related to 48 Politburo and Politburo
Standing Committee members.13 Table I reports the distribution of these 134 princelings in
terms of both their relationship with the Politburo and the Politburo Standing Committee
members and their reported occupation. For instance, about 58.21% of our sample are
either children or their spouses of the Politburo members, and nearly half of them (45.52%)
are affiliated with the private sector (either as owners or investors). The closeness of these
relationships gives us confidence in the reliability of our data.
Table I about here
The same sources provide us with information on the firms connected to these 134
princelings in the capacity of either founder or shareholder. For example, Zhou Bin, the
elder son of Zhou Yongkang, owned hundreds of firms in the provinces of Sichuan, Yunnan
and Beijing.14 It is not necessary for the princelings to run the business themselves in order
to benefit from dealing with the local officials. They can, for instance, invest in a private
business; doors would open as soon as it is revealed who the key investors are. Take for ex-
ample Dalian Wanda, a real estate firm owned by one of China’s richest businessman Wang
Jianlin. According to the New York Times, with business operations in 133 Chinese cities
this firm has connections to at least four families of the Politburo Standing Committee mem-
13Of the remaining 16 Politburo members, some are, like Premier Le Keqiang, corruption free. However,it remains to be seen whether this claim will stand the test of time, given that as many as 13 of thesePolitburo members were newly elected after 2012 and that it may take a while for any misconduct to cometo light. Also, we cannot rule out the possibility that these newly elected members are likely less corrupt tothe extent that Xi was able to influence decisions over who to select into the new Politburo.
14The relationship among the princelings may also be nebulous, as is demonstrated by the investmentthat Zhou Bin and his mother-in-law had in Chengdu Fantasia Property—a subsidiary of Fantasia Property,which is a real estate firm listed on the Hong Kong Stock Exchange and owned by Zeng Baobao, the niece ofanother Politburo Standing Committee member Zeng Qinghong. http://business.sohu.com/s2014/jrzj285/.
12
bers.15 Altogether we are able to identify 3,530 firms (including the subsidiaries) connected
to at least one princeling firm. While the princeling firms make up a mere 0.81% of all the
firms (437,776) that had ever purchased land in the primary market between 2004 and 2016,
the value of their transactions in the overall land revenue is twice as much (1.71%), involving
4.3 trillion yuan.
In terms of ownership, although private ownership predominates in both instances, state
ownership is proportionately lower in princeling firms (23.64%) than in their non-princeling
counterparts (34.66%), a pattern consistent with the observation that the private real estate
sector is where the princeling firms tend to operate. In terms of size, princeling firms are
typically larger; about 72.61% of them can be classified as large (0.3 billion or more in
annual business revenue),16 for instance, in comparison to 41.37% for the non-princeling
firms. Nearly two-thirds of the princeling firms chose to set up their headquarters in either
the national or provincial capital (65.3%), whereas only 25% of the non-princeling firms did
the same. Finally, in terms of sectoral distribution, the majority of princeling firms are
in real estate (36.67%), financial (18.7%) or real estate-related sectors such as leasing and
business service (5.20%) (Table II). The predominance of princeling firms in the real estate
sector suggests that the primary land market is an area where rents are up for grabs.
Table II about here
3.2 Matching Land Transactions with the Princeling Firms
To estimate the price discount obtained by firms connected to the princelings we rely on a
data set that covers all land transactions in China’s primary land market between 2004 and
15NYTimes.com, titled “Wang Jianlin, a Billionaire at the Intersection of Business and Power inChina”. https://www.nytimes.com/2015/04/29/world/asia/wang-jianlin-abillionaire-at-the-intersection-of-business-and-power-in-china.html
16Firms are classified as large, medium-sized, small, or micro if their annual business revenue in yuan isgreater than or equal to 0.3 billion, greater than or equal to 30 million but less than 0.3 billion, greater thanor equal to 3 million but less than 30 million, or less than 3 million, respectively.
13

2016.17 According to the Ministry of Land and Resources,18 there were altogether 1,628,635
transactions in this period, of which 1,151,358 land parcels, i.e. over 70%, were purchased
by firms (the rest were acquired by private individuals). For each transaction, the Ministry
provides detailed information on the size and location of the land parcel (with address and
postal code), total payment, date of transaction, names of seller and buyer, the specific
method of transaction,19 a two-digit code of land usage (e.g., industrial versus commercial),
land parcel quality (as subjectively evaluated by the official-in-charge on a 20-point scale),
and a three-digit industry code of the buyer’s firm, and so forth.
We then match the data on land transactions with those of the firms (including their
subsidiaries) connected to the princelings based on the firm’s name.20 Figure III shows the
geographic distribution of the land parcels purchased by these firms. In total, 16,454 (1.43%)
land parcels were purchased by the princeling firms during the period in question.
Figure III about here
3.3 A Spatially Matched Sample for Identification
The key challenge for us lies in causally identifying the economic rents obtained by the
princeling firms among a number of unobserved firm and transaction characteristics. To
17Although land rights were devolved to the local governments as early as 1998, transactions in theprimary land market were infrequent back then and did not pick up until the early-to-mid 2000s (Chen andKung, 2016).
18The land transaction data set is obtained from the website of the Land Transaction Monitoring System(http://www.landchina.com/). According to the Law of Land Management, the prefectural bureau of landand resources is required to report every single land transaction in their jurisdiction electronically on thiswebsite.
19Transactions can be carried out in one of four ways: bilateral agreement (xieyi), invited bidding (zhao-biao), listing auction (guapai), which is the most frequently used method (72%), and finally English auction(paimai). Cai, Henderson, and Zhang (2013) analyze the efficiency properties of these various land transac-tion methods as they are used in the Chinese context.
20We first obtained a list of full names of the princeling firms (including their subsidiaries) from variousmedia reports, followed by confirming their existence based on the information available from the StateAdministration of Industry and Commerce (where they registered for their business license). We thenconnected a firm with the land transaction(s) under its name using the database made available on theMinistry of Land and Resources’ website. One might be concerned about the reliability of media informationon the princelings’ connections. We will address this concern by checking the robustness of our estimatesin Section 4 using the likely more accurate information on firms connected to the convicted case of ZhouYongkang and on China’s publicly listed firms more generally.
14

achieve this goal, we utilize a spatial matching approach. Specifically, to ensure that we
are comparing like with like we generate a sample of transactions involving land parcels
purchased by firms unconnected to the princelings in the same year and within the same
distances, e.g., within a 500-meter radius or about three blocks and a 1,500-meter radius or
about eight blocks (refer to Figure III),21 under the assumption that land parcels of a similar
size and sold within the same area and in the same year are highly comparable in quality
and therefore price.22 In other words, we treat land parcels purchased by firms unconnected
to the princelings as the control group, and hence any price difference between the parcels
paid by these two types of firms can be attributed to the preferential treatment the local
governments provide to the princeling firms. Altogether we are able to identify 359,539 land
parcels within the 1500-meter radius and 207,564 land parcels within the 500-meter radius
purchased by the non-princeling firms. The summary statistics of all three types of land
parcels (overall, 500-meter radius, 1,500-meter radius) is summarized in Table IIIA.
Table IIIA about here
4 Price Discount Obtained by Princeling Firms
We begin with a simple comparison of the characteristics of the land parcels purchased by
firms connected and unconnected to the princelings, by highlighting the enormous difference
between the prices paid for commercial-cum-residential land and industrial land, and the
types of land purchased by the princeling and non-princeling firms. First, as Table IV
shows, a commercial-cum-residential land parcel was worth 1384 yuan per square meter on
average—5 times more expensive than an industrial land parcel (280 yuan). Second, while the
non-princeling firms purchased slightly more industrial land than commercial-cum-residential
land (52%), the princeling firms mostly purchased the latter (84%). But the princeling firms
did not pay the full price. In fact, they paid only 812 yuan for these land parcels; that is
21These calculations are based on the average size of the land parcel, which is about 3.53 hectares—approximately 188*188 square meters.
22The average size of a princeling parcel is 0.0267 mu (1 mu = 0.0667 hectare), strikingly similar to thatpurchased by a non-princeling firm within the 500-meter radius (0.0272 mu).
15

41% or precisely 572 yuan less than the average. This is hardly a fair comparison, however.
To compare like with like, we compare only those land parcels in the “matched sample”—
namely those purchased by both types of firms within the 500-meter radius and in the same
year. Doing so actually yields an even wider gap. The average per-square-meter price of 812
yuan as paid by the princeling firms is now 44% lower than that of the “matched” sample
(812 vs. 1457 yuan), suggesting that the princeling firms purchased land of higher quality
(as measured by market value) for a lower-than-market price. While the princeling firms also
obtained a discount for the land parcels designated for industrial use, it was much smaller—
the difference of 36 yuan amounts to a discount of a mere 12%. This suggests that the
discount enjoyed by the princeling firms mostly comes from the commercial-cum-residential
land.
Table IV about here
To estimate the price discount obtained by the princeling firms we employ the following
regression model:
Priceickst = β0 + β1PrincelingPurchaseikjt + γXi + Tcst + νickst (1)
The dependent variable Priceickst is the log of price (yuan per square meter) for land parcel
i sold by municipal government c to firm k for usage s in month-year t. The key explanatory
variable PrincelingPurchaseikjt is a dummy variable that is equal to 1 if a firm k is connected
to a princeling j, and 0 otherwise. In all specifications, we control for a number of transaction-
level variables including the log of the land area sold, land quality as evaluated by the officials
in charge of selling the land (rated on a 20-point scale), the specific sales method employed,
firm size and firm ownership. Moreover, in order to compare only those land parcels located
in the same city designated for the same usage and sold in the same month of the same year,
we employ a high-dimensional control of city-year-usage fixed effects, month fixed effects and
the three-digit industry fixed effects, and subjected our standard errors to two-way clustering
16

by province and by firm.
The results are reported in Table V. Column (1), which uses the full sample, shows
that the coefficient of PrincelingPurchaseikjt, -0.808, is statistically significant at the 0.1%
level and also very large. To deal with the selection bias arising from princeling firms
attempting to purchase land of a higher quality or market value (e.g. land that is closer
to the central business district or a mass transit railway station), we turn to the matched
samples within the two radii for more accurate estimates.23 The results are reported in
columns (2) to (3) of Table V. As predicted, removing the selection bias increases the size of
PrincelingPurchaseikjt substantially. For example, the price advantage for firms connected
to the princelings based on results for the 500-meter-radius sample is 57%—a magnitude
similar to the difference in Table IV.24 To ensure that our results are not driven by a few
outliers we plot Figure IV, which compares the prices paid by princeling firms vis-a-vis those
paid by their non-princeling counterparts within the 500-meter radius, and find that the
princelings paid less (to the left of the 45-degree line) in the great majority of cases (80%).25
Table V and Figure IV about here
In addition to examining the main effect of princeling connection we also examine whether
there may be additional effects due to differences in political power and status of the
princelings, and to retirement. First of all, given the supreme political status and power
of the Politburo Standing Committee, their influence over the price discount may be even
larger than that exerted by the ordinary members of the Politburo. Likewise, it is also widely
believed that after retirement top political elites in China continue to exert influence over
23To ensure that land parcels sold to the princeling firms and their non-princeling counterparts withinthe 500-meter radius are comparable, we provide information on distance to the nearest main road, subwaystation, hospital, bank, shopping mall, hotel, restaurant, etc., and find that there are no significant differencesbetween the two (refer to Table AI in the Appendix).
24The conservative estimate of a 57% price discount is translated into 2469.525 billion yuan(4,332.50*0.57), amounting to nearly 1% of the total land revenue for the period under analysis. Thismeans that on average a princeling firm gets to pocket a substantial 18.43 billion yuan (calculation based on134 princelings).
25This percentage rises to 85% when comparing plots within the 1,500-meter radius.
17

matters of personnel selection and appointment (Joseph, 2010; Li, 2012).26
By interacting PrincelingPurchaseikjt with PSCMjp, a dummy variable indicating whether
a national leader p to whom a princeling j is connected is a member of the Politburo Standing
Committee (the reference group consists of Politburo members), we find that the discount
on price is indeed significantly larger—between 39.6% and 44.2%, for those connected to a
member of the Politburo Standing Committee (columns (4) through (6)). We then interact
PrincelingPurchaseikjt with Retiredjpt, a dummy variable indicating whether a particular
transaction i took place after leader p—the patron to whom the transaction was connected—
retired. The result in columns (7) through (9) shows that the discount for the princeling
firms does not diminish even after their patron’s retirement.
How robust are our results? For instance, is that part of the data generated from the
media regarding the connections of the princeling firms truly reliable? To ensure that our
estimates are not driven by selection bias arising from either selective or inaccurate reporting,
we perform two robustness checks. First, to justify its arrest of Zhou Yongkang and his son
Zhou Bin, the central government has since revealed the connections they had established
with various business entities. We make use of this small but accurate subsample to verify
our main results. Second, we also employ a sample of the publicly listed firms that are
both connected to the princelings and have purchased land in the primary land market
as additional check. Given that the publicly listed firms are compelled by law to reveal
their transactions, information regarding these firms is more accurate. Reported in Table
AII in the Appendix, the results show that firms connected to Zhou obtained price discounts
comparable to those in the baseline estimates. The same is found for the princeling-connected
listed firms, albeit with a smaller magnitude.27 Both findings serve to allay concerns that
our earlier results may be caused by selection bias associated with data quality.
26For example, the “Eight Elders”, as they are venerably referred to, belong to a group of elderly membersof the Chinese Communist Party who continued to hold substantial and life-long power during the 1980s and1990s long after retiring from office (December 28, 2012, Bloomberg; December 27, 2012, The Telegraph).
27The conservative estimates (of using the transformation) put the price discount obtained by the listedfirms at 44-52%, and that obtained by firms connected to Zhou at 63-67%.
18

A natural question to ask at this point concerns whether princeling connections would
lead not just to steeper price discounts but perhaps also a larger volume of discounted
transactions. To answer this question, we regress the total annual quantity (area) of land
purchased by the 437,768 firms (including non-princeling firms) in the primary land market
between 2004 and 2016 on whether a firm is connected to a princeling. Reported in column
(1) of Table VI, the result suggests that the princeling-connected firms purchased 0.2% more
land each year than their non-princeling counterparts, with the quantity purchased being
larger among those princeling firms connected to the more powerful Politburo Standing
Committee members (3% in column (2)). Moreover, retirement does not have any significant
effect on the quantity of princeling purchase (column (3)). These results corroborate those
on price discounts.
Table VI about here
5 Effect of Business Favor on Promotion
Typically, a sustainable patron-client relationship requires an ongoing exchange of favors
(Hicken, 2011; Scott, 1972; Kitschelt and Wilkinson, 2007). To examine whether the
princelings reciprocate the favors extended to them by the local officials, we employ po-
litical turnover as the indicator variable based on the following specification:
Turnoverit = φ0 + φ1PrincelingPurchaseit + φ2FactionalT iesjt + φ3GDPGrowthit
+κXit + ωWj + λi + Tt + ϕj + τijt
(2)
The key dependent variable is the political turnover of the provincial officials measured on
a yearly basis and coded as follows: promotion = 3, lateral transfer or staying in office = 2,
retirement = 1, and termination for wrongdoing such as corruption or natural death = 0.
As before the key independent variable PrincelingPurchaseit is a dummy that is equal to
1 where a provincial official provides a discount to firms connected to the princelings, and 0
19

otherwise.28 As we are examining the political turnover of the provincial officials, we use a
province-year panel data from 2004 to 2016 for analysis. And, following Li and Zhou (2005),
we employ an ordered probit model to analyze these ordinal measures and check robustness
by using a binary variable of promotion versus a combination of all other outcomes. To
avoid other confounding effects we control for economic performance using GDP and tax
revenue growth rate as proxies (Li and Zhou, 2005; Lu and Landry, 2014), factional ties as
defined by whether a provincial official has ties with his/her patron in the Politburo (Jia,
Kudamatsu and Seim, 2015; Shih, Adolph, and Liu, 2012), and other variables such as GDP
per capita and population size. We also control for the individual characteristics of the
provincial officials such as age, age squared, and years of education. Table IIIB provides the
summary statistics of all these variables.
To examine the link between price discount and quantity of land sold on the one hand and
promotion on the other more systematically, we regress the political turnover of provincial
officials on three different measures of princeling connections and report the results in Table
VII. Columns (1) to (5) and (6) to (10) contain results for the party secretaries and the
governors, respectively. In columns (1) and (6), we include only princeling purchase without
adding any controls (except for province and year fixed effects). The results confirm that the
business favor provided by the provincial party secretaries has a significantly positive effect
on their promotion, but the same effect does not apply to the governors. We then control
for factional ties and GDP growth in columns (2) and (7); the main effect of princeling
purchase on the party secretary’s promotion remains highly significant and with an even
larger magnitude of 23.4% (calculated based on the coefficient in the ordered probit model),
but it is still insignificant for the governor’s promotion.29 In columns (3) and (8) we replace
28We are patently aware of the concern that, as a predictor of promotion whether or not an official hasprovided a favorable land deal is far from randomly distributed. Unfortunately, there is no quick technicalfix to the issue of endogenous political connections as has been noted in the pertinent literature (Cinganoand Pinotti, 2013; Faccio, 2006; Ferguson and Voth, 2008; Khwaja and Mian, 2005).
29We are not ruling out the possibility that the party secretary who is rewarded by his patron withpromotion may in turn provide benefits of one kind or another to the governor, but we are unable to observethat.
20

the ordinal measures of political turnover with a binary measure that simply compares
promotion with no promotion and further confirms that the main effect of princeling purchase
remains similarly significant for the party secretary but insignificant for the governor.
Table VII about here
One may be concerned that provinces provide land at a discount to attract more invest-
ments and hopefully achieve higher growth rates. If that is the case, then provincial officials
are promoted not because they provide favors, but rather because they are able to generate
faster growth. To examine this alternative hypothesis, we control for a number of proxies
pertaining to investment growth such as size (level) and growth rates of fixed asset invest-
ments and real estate investments. We find that princeling purchase remains significant, and
with similar magnitudes (Tables AIII and AIV in the Appendix). Moreover, GDP growth
remains insignificant in accounting for the party secretaries’ promotion, a finding that rejects
the alternative hypothesis of growth inducing promotion.
One may also be concerned that the dummy variable of PrincelingPurchasept is too
crude a measure, as it lacks information on the steepness of the discount provided by the
regional official. To improve accuracy we construct a finer measure by taking the difference
between the price of a princeling transaction and that of a comparable non-princeling trans-
action within the 500-meter radius, and then aggregate the differences of all the matched
transactions in a given year up to the province level (denoted respectively by p and t in the
variable PrincelingDiscountspt).30 This way we are able to generate a measure that incor-
porates aggregate differences in the magnitude of discounts received by the princeling firms
vis-a-vis their non-princeling counterparts within the same province and for the same year.
Reporting the results in columns (4) and (9), we confirm that the magnitude of price dis-
counts significantly increases the likelihood of promotion for the provincial party secretary,
but it still does not have any significant effect for the governor.
30For the few cases where the princeling firms actually paid a higher price than the non-princeling firms,we replace the negative value of the price difference by zero. Likewise, price discount is similarly coded aszero for those province-year observations with no princeling transaction.
21

Finally, in light of an earlier result that princeling firms have bought more land, we
examine the effect of the quantity of land sold to the princeling firms on officials’ promotion,
similarly by aggregating the total area of land sold to the princeling firms by province and
year. To deal with the observations of zero we add one to the variable before taking log.
Reported in columns (5) and (10), we find that the quantity of land sold to the princeling
firms similarly has a significant effect on the party secretary’s promotion (column (5)). Still
unaffected by land sales (column (10)), the governor has to rely on himself for promotion,
specifically by improving economic performance or GDP growth in his jurisdiction (columns
(7) through (10)). In short, only the provincial party secretaries are being rewarded for their
wheeling and dealing.
Turning to the municipal officials, although they are not the princelings’ direct clients,
they are the custodians of land in the primary market, and hence their cooperation is re-
quired for the provincial party secretaries to sell land cheap to their patrons. This renders
the municipal officials part of the same patron-client network who are also expected to be
rewarded. To verify this, we regress the political turnover of municipal party secretaries
and mayors during the 2004-2014 period on princeling purchase using the same specification
as in Table VII. The only difference is that PrincelingPurchaseit is now defined as being
equal to 1 if the municipal official sold at least one parcel of land in their jurisdiction (mu-
nicipality) i to a princeling firm in year t. Accordingly, both PrincelingDiscountsit and
AreaofLandPurchasedit are constructed at the municipal level.
Table VIII reports the results. As predicted, princeling purchase is significantly positive
for the promotion of the municipal party secretaries but not so for the promotion of the
mayors (compare columns (1)-(3) with (6)-(8)). For instance, the municipal party secretaries
who sold land to the princeling firms enjoy a higher probability of promotion estimated at
14.2% and is significant at the 0.1% level (column (2)).31 Consistent with the provincial
31The substantially smaller effect at the municipal level supports the idea that the magnitude of thereward should be larger for the main client (the provincial party secretary) than for the client’s client (themunicipal party secretary).
22

results, the probability of promotion for the municipal party secretary increases significantly
with both the size of the price discount (column (4)) as well as the quantity of land sold
(column (5)).
Table VIII about here
6 Effect of Xi’s Anti-Corruption Campaign
6.1 Effect of Xi’s Anti-Corruption Campaign on Land Price
To examine the effect of Xi’s anti-corruption campaign, which began in earnest on December
4th, 2012, we construct three separate measures. The first measure, a dummy variable labeled
as “transactions after 2012”, is constructed to indicate whether a land transaction took place
after Xi came into office. Our second measure is “central inspection”, which is a dummy
with an assigned value of one if a central inspection took place in the particular province at
the time of sale. This variable is constructed based on the CCDI’s report of its inspection
activities. Between mid-2013 and early 2017, 11 waves of inspections took place. Each wave
targeted between four and 10 randomly selected provinces and lasted for approximately two
months.32 As of January 2017, all 31 provinces and directly controlled municipalities (whose
administrative status is equivalent to that of a province) have been inspected and 16 of them
twice. Table AV in the Appendix provides the inspection details.
Our third measure, “Xi-appointed officials”, is also a dummy variable constructed to
indicate whether a particular land transaction took place in a province in which the party
secretary was newly appointed by Xi after 2012. Perhaps with the intention of strengthening
the effectiveness of his anti-corruption campaign, Xi replaced a total of 14 provincial party
secretaries between 2013 and 2016.33 To the extent that these newly appointed officials
32Note however that the fifth through to the eighth waves were targeted specifically at the state-ownedenterprises.
33Of these 14 appointees, six were his previous subordinates in the provinces of Fujian and Zhejiang whenXi served respectively as governor and provincial party secretary. While the other eight newly appointedparty secretaries were not his former subordinates, they must be sufficiently trusted by Xi to have beenchosen.
23

are extremely loyal to Xi and thus more likely to enforce his anti-corruption campaign with
greater rigor than all other provincial party secretaries, price discounts would become smaller
and reciprocal promotions less frequent after 2012.
Table IX reports the results of the effectiveness of Xi’s anti-corruption campaign on
the price discount received by the princeling firms.34 In columns (1) and (2) we inter-
act PrincelingPurchaseit with “transactions after 2012” in both the full sample and the
matched 500-meter-radius sample, and find that the results are significantly positive and
large in magnitude. For instance, if the princeling firms were previously obtaining a price
discount of 60.1%, it has been significantly reduced by 25.7% after Xi’s anti-corruption cam-
paign was introduced (column (2)). We do the same with “central inspection” in columns
(3) and (4) and find an even stronger result. Using column (4) as an example, “central
inspection” has the effect of raising the land price by a hefty 50.1%. Not surprisingly, the
price discount on land in provinces in which Xi has replaced the party secretaries is also
reduced by more than 43.6% (columns (5) and (6)). To find out which of these measures
are more effective we perform a “horserace”, and find that both “central inspection” and
“Xi-appointed officials” significantly reduce the discount on price previously received by the
princeling firms, but “transactions after 2012” becomes insignificant (column (8)). This find-
ing echoes earlier studies that corruption can be effectively curtailed by closer monitoring,
replacing key figures, and so forth (Klitgaard, 1988).
Table IX about here
To further ascertain the effectiveness of Xi’s anti-corruption campaign we examine the
outcomes of previous similar campaigns. An example is the one launched by his prede-
cessor Hu Jintao (2002-2012). To this end we construct a dummy variable and assign
the value of 1 to anti-corruption inspections conducted prior to 2012 and interact it with
34In addition to the control variables, we also control for the interaction terms between each of thethree measures of the anti-corruption campaign and the control variables in the regressions to ensure thecampaign’s effect is not confounded with factors other than princeling purchase. We thank an anonymousreviewer for this suggestion.
24

PrincelingPurchaseit. Reported in columns (9) and (10) of Table IX, these earlier cam-
paigns have no significant effect whatsoever in reducing the price discount offered by local
officials.
To put the effect of the campaign in a broader perspective, we employ the coefficients
estimated on princeling purchase in Table IX, interact them with a series of year dummies,
and plot them in Figure V within the 95% confidence interval. Doing so provides an overview
of the average size of the discounts obtained by the princeling firms over time (between 2006
and 2016, against the benchmark year of 2005). What Figure V clearly shows is that,
before Xi’s anti-corruption campaign the estimated price discount hovered between 50% and
70%, with a growing trend over time (especially after 2007). Since the campaign, however,
the discount had shrunk noticeably, initially back to the level of 2007 (e.g. in 2014) but
had almost vanished by 2016. Although the price per square meter paid by the princeling
firms was still 7.5% lower than that paid by the non-princeling firms, the effect is no longer
significant; in any case the discount, even if it still existed, had vastly diminished.
Figure V about here
6.2 Effect of Xi’s Anti-Corruption Campaign on Quantity of Land
Sold to the Princeling Firms
To examine whether Xi’s anti-corruption campaign has generated downward pressure on both
the number of transactions and quantity of land sold to the princeling firms, we construct a
firm-province panel data by aggregating the area of land purchased by each princeling firm
annually in each province. Column (1) of Table X regresses the log of the land area purchased
on the princeling firms interacting with the dummy of “transactions after 2012”. The pos-
itive and significant coefficient of “princeling firm” suggests that before the anti-corruption
campaign commenced, these firms did purchase more land than their non-princeling coun-
terparts by a modest 7.8%. But this trend discontinued after 2012; since then their land
purchases dropped by 2.2% (or 28% of 0.078, column (1)). Land sold to the princeling
25

firms was significantly reduced by 5.3% (or 72.6% of 0.073) in the provinces inspected by
the CCDI (column (2)) and by an even larger 5.6% (or 74.7% of 0.075) in the provinces
whose party secretary was replaced by one appointed by Xi himself (column (3)). To find
out which of these measures had the strongest effect on curbing the quantity of land sold
once again we conduct a “horserace” among the three measures and find that “transactions
after 2012” becomes insignificant in the presence of “central inspection” and “Xi-appointed
officials” (column (4)). Moreover, given that the sum of the coefficients in column (4) is not
significantly different from zero, these two measures, taken together, effectively eliminate the
advantage of the princeling firms in purchasing a larger quantity of land. These results are
consistent with those on the price discounts.
Table X about here
Once again, to put the effect of the campaign in a broader perspective, we repeat what we
did in Figure V but this time extract the coefficients from the quantity of land purchased
by the princeling firms vis-a-vis the non-princeling firms over time. What Figure VI clearly
shows is that, before Xi’s anti-corruption campaign the estimated difference in quantity
between the two types of firms is substantial, and with a growing trend over time. Since the
campaign, however, the quantity difference had shrunk noticeably. Although the princeling
firms continued to purchase (slightly) more land, the effect is not significant in 2013 and
only marginally significant in 2016.
Figure VI about here
6.3 Effect of Anti-corruption on Political Turnover
In addition to having a significant effect on the price discounts, we would expect Xi’s anti-
corruption efforts to impact also on the promotional prospects of local officials. We examine
this hypothesis by interacting PrincelingPurchaseit first with “transactions after 2012” and
then with “central inspection” in the turnover regression and report the results in Panel A of
Table XI. Columns (1) to (2) and columns (3) and (4) contain results for the provincial party
26

secretaries and the municipal party secretaries, respectively. In line with our expectations,
the effect of princeling purchase on the promotion of party secretaries at both levels was
significantly reduced after 2012, and in provinces audited by the central inspection team.
In Panels B and C, we replace PrincelingPurchaseit with PrincelingDiscountsit (for mea-
suring the magnitude of price discounts) and AreaofLandPurchasedit (for measuring the
quantity of land purchased), and obtain similar results. In any case, these results provide
evidence that Xi’s campaign to crack down on corruption has also reduced the promotional
prospects of those local officials who rely on supplying a discount to get ahead.
Table XI about here
6.4 An Event Study of Zhou YongKang
To further confirm the effectiveness of Xi’s anti-corruption campaign, we make use of the
high-profile arrest of Zhou Yongkang and his son to motivate the hypothesis that, in order
to avoid arrest the local officials would likely have stopped providing favors to the princeling
firms to whom they are connected on the news of Zhou’s arrest. We test this hypothesis
by comparing the price and quantity of land transactions conducted by both princeling and
non-princeling firms in the primary land market after December 1st, 2013, one day after news
broke about Zhou being investigated for corruption charges.
In panel A of Figure VII we plot the average land prices paid by the princeling firms
(the darker line) and the non-princeling firms (the lighter gray line) who bought land parcels
within the 500-meter radius, and the price gaps between the two (the shaded gray area), a
few months before and after the news (the x-axis measures time on a daily basis, whereas the
y-axis measures the price per square meter of land in yuan). In line with previous findings,
prices paid by the princeling firms increased noticeably after the news, as shown by the
increasingly steep dark solid line to the right of the (red) reference line marking the date
of November 30, 2013. This trend is also reflected in the reduced price gap between the
two types of firms, which can be seen from the greatly diminished shaded area after that
27
date. Similarly, the quantity of land transacted by the princeling firms also fell after that
date, suggesting a cautious response on the part of the local officials (and arguably also the
princeling firms), although it was not as dramatic as response in price (panel B). Nevertheless,
compared to the reduction in the quantity of land sold to the princeling firms, land parcels
sold at the market price (presumably to the non-princeling firms) were undeterred by Zhou’s
expulsion.
Figure VII about here
7 Summary and Conclusion
We set out in this paper to quantify corruption among China’s top political elites, to in-
vestigate the mechanisms by which cronyism occurs, and not the least to estimate the ef-
fectiveness of the anti-corruption campaign that has been implemented in China since 2012.
Given that a major target of this campaign is the primary land market, whose peculiarities
render it a setting highly conducive to corruption, we choose to examine the extent to which
price discrimination was practiced in this particular setting. By merging the data on land
transactions with those on firms linked to members of the Politburo—the princeling firms, we
find that the provincial officials provided staggering discounts to these firms. In the matched
samples in particular, the princeling firms pay less than half of the price paid by their uncon-
nected counterparts to obtain lanfd of comparable quality. Moreover, corruption is further
substantiated by the evidence that the more powerful the Politburo member (member of the
Standing Committee vs. member of the Politburo), the larger the discount obtained. We
also find that, perhaps because of the price discounts provided to them, the princeling firms
also purchased more land. The local officials did not provide favors to the princeling firms
for nothing, however. Evidence is just as strong in substantiating the hypothesis that local
officials involved in cheap land deals stood a better chance of promotion.
All of these findings provide an informed background to, and help make sense of, the
rigor of the anti-corruption campaign launched by Xi. Specifically, by strengthening the
28
CCDI and appointing his own trusted subordinates to govern in as many as 14 provinces,
China’s new leader has halved the rents up for grabs in China’s primary land market. But
while the anti-corruption campaign has thus far produced positive results, whether or not
corruption can be fundamentally weeded out without overhauling the existing institutional
arrangements causing them in the first place remains an issue of fundamental importance
and one that deserves investigation in the near future.
HONG KONG BAPTIST UNIVERSITY
THE UNIVERSITY OF HONG KONG
29

Appendix
Table AI
Balance Tests on Land Purchased by Princeling
and Non-Princeling Firms within 500-meter Radius
Distance (km) to the nearest: Princeling Non-
Princeling
Difference
Main Road 3.186 3.083 0.103
(0.023) (0.046) (0.092)
Subway Station 13.021 13.300 -0.278
(0.829) (0.757) (0.315)
Hospital 3.543 3.748 -0.206
(0.061) (0.064) (0.341)
Bank 3.670 3.758 -0.088
(0.065) (0.066) (0.245)
Shopping Mall 6.369 6.762 -0.393
(0.113) (0.127) (0.412)
Hotel 6.772 6.673 0.099
(0.083) (0.079) (0.133)
Restaurant 4.191 4.030 0.161
(0.036) (0.045) (0.210)
30

Tab
leA
II
Pri
nce
lin
gP
urc
has
ean
dL
and
Pri
ce,
2004
-201
6,R
obu
stn
ess
Ch
ecks
Log
ofL
and
Pri
ce
All
<=
1500
<=
500
All
<=
1500
<=
500
met
ers
met
ers
met
ers
met
ers
(1)
(2)
(3)
(4)
(5)
(6)
Pri
nce
lin
gP
urc
hase
Con
nec
ted
toZ
hou
-0.9
93**
*-1
.114
***
-0.9
95**
*
(0.0
50)
(0.1
48)
(0.1
07)
Pri
nce
lin
gP
urc
hase
by
Lis
ted
Fir
ms
-0.5
84**
*-0
.733
***
-0.6
78**
*
(0.0
52)
(0.0
55)
(0.0
46)
Con
trol
Vari
able
sY
esY
esY
esY
esY
esY
es
Tw
o-w
ayC
lust
erin
g
by
Fir
man
dby
Pro
vin
ceY
esY
esY
esY
esY
esY
es
Cit
y-Y
ear-
Usa
geF
ixed
Eff
ects
Yes
Yes
Yes
Yes
Yes
Yes
Mon
thF
ixed
Eff
ects
Yes
Yes
Yes
Yes
Yes
Yes
Ind
ust
ryF
ixed
Eff
ects
Yes
Yes
Yes
Yes
Yes
Yes
Nu
mb
erof
Obse
rvati
on
s11
2885
511
444
7277
1133
029
1632
4885
946
Ad
j.R
-squ
are
d0.
688
0.78
10.
811
0.68
80.
742
0.77
2
Con
trol
vari
able
sin
clu
de:
Lan
dqu
alit
y,la
nd
are
a,
sale
sm
eth
od
du
mm
ies,
firm
size
(cla
ssifi
edas
larg
e,m
ediu
m-s
ized
,sm
all
,or
mic
roif
its
reven
ue
inyu
an
is0.
3b
illi
onor
mor
e,30
mil
lion
orm
ore
bu
tb
elow
0.3
bil
lion
,3
mil
lion
or
more
bu
tb
elow
30
mil
lion
,or
un
der
3m
illi
on
,re
spec
tive
ly),
an
d
own
ersh
ipty
pe;
rob
ust
stan
dar
der
rors
inp
aren
thes
es;
*p<
0.0
5,
**
p<
0.0
1,
***
p<
0.0
01;
con
stant
term
sare
not
rep
ort
ed.
31

Tab
leA
III
Pri
nce
lin
gP
urc
has
ean
dP
rovin
cial
Lea
der
s’P
rom
otio
n,
2004
-201
6,R
obu
stn
ess
Ch
eck
Pol
itic
alT
urn
over
of:
Pro
vin
cial
Par
tyS
ecre
tari
esP
rovin
cial
Gov
ern
ors
Ord
ered
Pro
bit
Bin
ary
Ord
ered
Pro
bit
Ord
ered
Pro
bit
Bin
ary
Ord
ered
Pro
bit
(1)
(2)
(3)
(4)
(5)
(6)
(7)
(8)
(9)
(10)
Pri
nce
lin
gP
urc
hase
(=1)
0.6
62***
0.73
6***
0.11
4***
0.01
6-0
.013
0.07
1(0
.233)
(0.2
66)
(0.0
40)
(0.2
92)
(0.3
17)
(0.0
68)
Pri
nce
lin
gD
isco
unts
0.82
2***
0.16
1(0
.177
)(0
.178
)A
rea
ofL
an
dP
urc
has
ed0.
334*
**-0
.070
(0.0
87)
(0.0
66)
Fact
ion
al
Tie
s0.
244
0.01
40.
133
0.33
1-0
.021
-0.0
01-0
.021
-0.0
39(0
.212
)(0
.033
)(0
.214
)(0
.218
)(0
.210
)(0
.046
)(0
.207
)(0
.207
)G
DP
Gro
wth
-1.3
67-0
.039
-0.2
20-0
.573
6.57
5***
1.22
9**
6.74
7***
6.46
1***
(2.6
90)
(0.4
15)
(2.7
86)
(2.7
28)
(2.1
68)
(0.4
85)
(2.1
73)
(2.1
73)
Tax
Rev
enu
eG
row
th1.9
370.
047
1.53
32.
236*
0.38
30.
021
0.33
10.
379
(1.2
57)
(0.1
98)
(1.2
68)
(1.2
97)
(1.0
87)
(0.2
33)
(1.0
73)
(1.0
73)
Log
ofF
ixed
Ass
et-0
.363
0.28
00.
046
-0.1
820.
537
0.64
90.
677
0.04
70.
609
0.62
8In
vest
men
t(0
.531)
(0.7
63)
(0.1
17)
(0.7
92)
(0.7
72)
(0.4
84)
(0.6
15)
(0.1
34)
(0.6
21)
(0.6
17)
Fix
edA
sset
Inve
stm
ent
0.2
16-0
.195
-0.0
780.
482
-0.1
76-0
.050
-0.5
56-0
.009
-0.5
04-0
.490
Gro
wth
(0.7
06)
(0.8
79)
(0.1
32)
(0.9
30)
(0.9
01)
(0.6
31)
(0.6
92)
(0.1
53)
(0.6
94)
(0.6
95)
Log
ofR
eal
Est
ate
0.22
90.0
340.
059
0.35
1-0
.084
0.03
50.
154
0.03
10.
182
0.17
2In
vest
men
t(0
.446)
(0.5
35)
(0.0
79)
(0.5
51)
(0.5
41)
(0.3
95)
(0.4
36)
(0.0
94)
(0.4
35)
(0.4
34)
Rea
lE
stat
eIn
vest
men
t-0
.434
-0.1
50-0
.119
-0.4
220.
371
0.36
0-0
.448
0.03
0-0
.401
-0.5
42G
row
th(0
.681
)(0
.899
)(0
.138
)(0
.896
)(0
.925
)(0
.624
)(0
.784
)(0
.166
)(0
.779
)(0
.784
)
Con
trol
Vari
able
sY
esY
esY
esY
esY
esY
esY
esY
esY
esY
esP
rovin
ceF
ixed
Eff
ects
Yes
Yes
Yes
Yes
Yes
Yes
Yes
Yes
Yes
Yes
Yea
rF
ixed
Eff
ects
Yes
Yes
Yes
Yes
Yes
Yes
Yes
Yes
Yes
Yes
Ob
serv
ati
on
s39
9380
380
382
382
399
388
388
390
390
Ad
just
edR
-squ
ared
0.26
70.
091
Th
eor
din
alm
easu
reof
pol
itic
altu
rnov
erco
nsi
sts
of
fou
rca
tegori
es:
Ter
min
ati
on
=0,
Ret
irem
ent=
1,
Late
ral
Tra
nsf
eror
Sta
yin
gin
Offi
ce=
2,
an
d
Pro
mot
ion
=3.
An
dth
eb
inar
ym
easu
reis
ad
um
my
vari
ab
lew
hic
heq
uals
toon
eif
the
offi
cial
was
pro
mote
dat
yeart,
oth
erw
ise
equ
als
toze
ro.
Con
trol
vari
able
sin
clu
de
tax
reven
ue
grow
th,
log
of
GD
Pp
erca
pit
a,
log
of
pop
ula
tion
size
,age
an
dage
squ
are
d,
yea
rsof
edu
cati
on
.R
ob
ust
Sta
nd
ard
erro
rsar
ere
por
ted
inp
aren
thes
es;
*p<
0.10
,**
p<
0.0
5,
***
p<
0.0
1;
con
stant
term
sare
not
rep
ort
ed.
32

Tab
leA
IVP
rin
celi
ng
Pu
rch
ase
and
Mu
nic
ipal
Lea
der
s’P
rom
otio
n,
2004
-201
4,R
obu
stn
ess
Ch
eck
Pol
itic
alT
urn
over
of:
Mu
nic
ipal
Par
tyS
ecre
tari
esM
un
icip
alM
ayor
sO
rder
edP
rob
itB
inar
yO
rder
edP
rob
itO
rder
edP
rob
itB
inar
yO
rder
edP
rob
it(1
)(2
)(3
)(4
)(5
)(6
)(7
)(8
)(9
)(1
0)
Pri
nce
lin
gP
urc
hase
(=1)
0.4
02***
0.42
8***
0.08
7***
0.03
90.
082
-0.0
09(0
.073)
(0.0
77)
(0.0
12)
(0.1
04)
(0.1
09)
(0.0
11)
Pri
nce
lin
gD
isco
unts
0.10
0***
0.01
2(0
.006
)(0
.008
)A
rea
ofL
an
dP
urc
has
ed0.
928*
**0.
012
(0.0
66)
(0.0
47)
Fact
ion
al
Tie
s0.
170*
*0.
013
0.19
2**
0.12
9-0
.018
-0.0
15-0
.013
-0.0
16(0
.074
)(0
.011
)(0
.080
)(0
.082
)(0
.102
)(0
.010
)(0
.102
)(0
.102
)G
DP
Gro
wth
-0.3
70-0
.100
-0.7
97-0
.757
2.82
6***
0.36
9***
2.75
6***
2.77
1***
(0.5
66)
(0.0
88)
(0.6
25)
(0.6
57)
(0.7
67)
(0.0
76)
(0.7
67)
(0.7
76)
Tax
Rev
enu
eG
row
th-0
.419
0.00
5-0
.519
-0.2
891.
242*
*0.
080
1.23
1**
1.23
1**
(0.4
07)
(0.0
63)
(0.4
39)
(0.4
53)
(0.5
34)
(0.0
53)
(0.5
33)
(0.5
35)
Log
ofR
eal
Est
ate
0.10
40.1
270.
045*
**0.
085
-0.0
51-0
.077
-0.0
44-0
.015
-0.0
41-0
.036
Inve
stm
ent
(0.1
09)
(0.1
16)
(0.0
17)
(0.1
27)
(0.1
28)
(0.1
55)
(0.1
66)
(0.0
15)
(0.1
66)
(0.1
66)
Rea
lE
stat
eIn
vest
men
t0.
152
0.17
8-0
.008
0.23
8*0.
190
-0.2
72*
-0.3
16*
-0.0
10-0
.322
*-0
.326
*G
row
th(0
.114
)(0
.120
)(0
.018
)(0
.132
)(0
.132
)(0
.163
)(0
.176
)(0
.015
)(0
.176
)(0
.176
)L
og
ofF
ixed
Ass
et-0
.183
-0.2
82-0
.049
*-0
.331
-0.0
14-0
.132
-0.0
530.
008
-0.0
51-0
.063
Inve
stm
ent
(0.1
61)
(0.1
90)
(0.0
28)
(0.2
08)
(0.2
14)
(0.1
96)
(0.2
31)
(0.0
19)
(0.2
31)
(0.2
31)
Fix
edA
sset
Inve
stm
ent
-0.0
21
0.05
80.
022
0.10
2-0
.032
0.35
4**
0.28
80.
013
0.29
20.
298
Gro
wth
(0.1
77)
(0.2
03)
(0.0
30)
(0.2
23)
(0.2
31)
(0.1
71)
(0.2
07)
(0.0
17)
(0.2
06)
(0.2
07)
Con
trol
Vari
able
sY
esY
esY
esY
esY
esY
esY
esY
esY
esY
esP
rovin
ceF
ixed
Eff
ects
Yes
Yes
Yes
Yes
Yes
Yes
Yes
Yes
Yes
Yes
Yea
rF
ixed
Eff
ects
Yes
Yes
Yes
Yes
Yes
Yes
Yes
Yes
Yes
Yes
Ob
serv
ati
on
s39
9380
380
382
382
399
388
388
390
390
Ob
serv
ati
on
s27
69
273
827
3827
3727
3825
9125
5125
5125
5025
50A
dju
sted
R-s
qu
ared
0.05
00.
378
Th
eor
din
alm
easu
reof
pol
itic
altu
rnov
erco
nsi
sts
of
fou
rca
tegori
es:
Ter
min
ati
on
=0,
Ret
irem
ent=
1,
Late
ral
Tra
nsf
eror
Sta
yin
gin
Offi
ce=
2,
an
d
Pro
mot
ion
=3.
An
dth
eb
inar
ym
easu
reis
ad
um
my
vari
ab
lew
hic
heq
uals
toon
eif
the
offi
cial
was
pro
mote
dat
yeart,
oth
erw
ise
equ
als
toze
ro.
Con
trol
vari
able
sin
clu
de
tax
reven
ue
grow
th,
log
of
GD
Pp
erca
pit
a,
log
of
pop
ula
tion
size
,age
an
dage
squ
are
d,
yea
rsof
edu
cati
on
.R
ob
ust
Sta
nd
ard
erro
rsar
ere
por
ted
inp
aren
thes
es;
*p<
0.10
,**
p<
0.0
5,
***
p<
0.0
1;
con
stant
term
sare
not
rep
ort
ed.
33
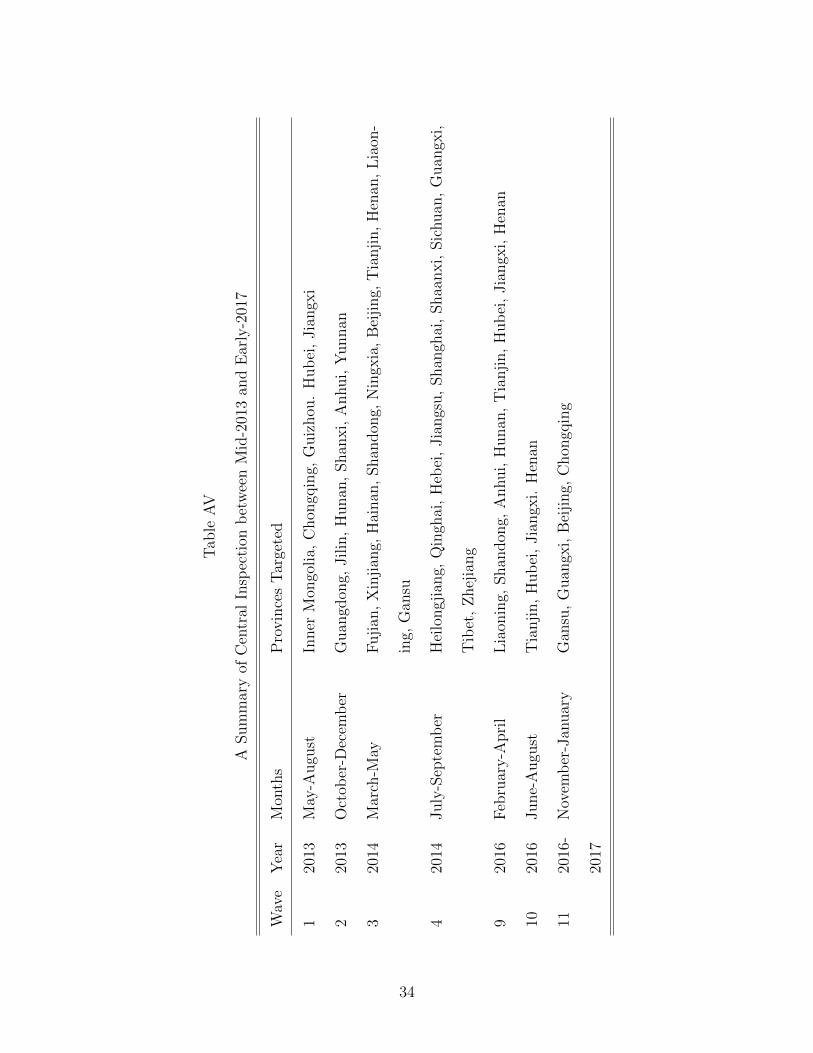
Tab
leA
V
ASum
mar
yof
Cen
tral
Insp
ecti
onb
etw
een
Mid
-201
3an
dE
arly
-201
7
Wav
eY
ear
Mon
ths
Pro
vin
ces
Tar
gete
d
120
13M
ay-A
ugu
stIn
ner
Mon
golia,
Chon
gqin
g,G
uiz
hou
.H
ub
ei,
Jia
ngx
i
220
13O
ctob
er-D
ecem
ber
Guan
gdon
g,Jilin
,H
unan
,Shan
xi,
Anhui,
Yunnan
320
14M
arch
-May
Fuji
an,
Xin
jian
g,H
ainan
,Shan
don
g,N
ingx
ia,
Bei
jing,
Tia
nji
n,
Hen
an,
Lia
on-
ing,
Gan
su
420
14July
-Sep
tem
ber
Hei
longji
ang,
Qin
ghai
,H
ebei
,Jia
ngs
u,
Shan
ghai
,Shaa
nxi,
Sic
huan
,G
uan
gxi,
Tib
et,
Zhej
iang
920
16F
ebru
ary-A
pri
lL
iaon
ing,
Shan
don
g,A
nhui,
Hunan
,T
ianji
n,
Hub
ei,
Jia
ngx
i,H
enan
1020
16June-
Augu
stT
ianji
n,
Hub
ei,
Jia
ngx
i.H
enan
1120
16-
2017
Nov
emb
er-J
anuar
yG
ansu
,G
uan
gxi,
Bei
jing,
Chon
gqin
g
34

References[1] Avis, Eric, Claudio Ferraz and Frederico Finan, “Do Government Audits Reduce Cor-
ruption? Estimating the Impacts of Exposing Corrupt Politicians,” Journal of PoliticalEconomy, forthcoming, 2017.
[2] Bai, Chong-En, Chang-Tai Hsieh, and Zheng Michael Song, “Crony Capitalism withChinese Characteristics,” working paper, University of Chicago, 2014.
[3] Barboza, David, “Billions in Hidden Riches for Family of Chinese Leader,” The NewYork Times, October 25, 2012,https://www.nytimes.com/2012/10/26/business/global/family-of-wen-jiabao-holds-a-hidden-fortune-in-china.html.
[4] Bo, Zhiyue, “Who Are China’s ‘Princelings’?” November 24, 2015, The Diplomat.[5] Bobonis, Gustavo J, Luis R Camara Fuertes, and Rainer Schwabe, “Monitoring Cor-
ruptible Politicians,” American Economic Review, 106(2016): 2371-2405.[6] Brown, Kerry, The New Emperors: Power and the Princelings in China (London, UK:
I.B.Tauris, 2014).[7] Cai, Hongbin, J. Vernon Henderson, and Qinghua Zhang, China’s Land Market Auc-
tions: Evidence of Corruption? The Rand Journal of Economics, 44(2013): 488-521.[8] Chen, Ting, and James Kai-sing, Kung, “Do Land Revenue Windfalls Create a Po-
litical Resource Curse? Evidence from China,” Journal of Development Economics,123(2016): 86-106.
[9] Cingano, Federico, and Paolo Pinotti. “Politicians at Work: The Private Returns andSocial Costs of Political Connections,” Journal of the European Economic Association,11(2013): 433-465.
[10] Cruz, Cesi, Julien Labonne, and Pablo Querubin, “Politician Family Networks andElectoral Outcomes: Evidence from the Philippines,” American Economic Review,107(2017): 3006-3037.
[11] Di Tella, Rafael and Ernesto Schargrodsky, “The Role of Wages and Auditing during aCrackdown on Corruption in the City of Buenos Aires,” Journal of Law and Economics,46(2003):269-92.
[12] Eggers, Andrew C., and Jens Hainmueller, “MPs for Sale? Returns to Office in PostwarBritish Politics,” American Political Science Review, 103(2009): 513-533.
[13] Eisenman, Joshua and Ozzie Chung, “China’s Linked Struggles for Power,” The WallStreet Journal, June 4, 2015, http://www.wsj.com/articles/chinas-linked-struggles-for-power-1433433648.
[14] Faccio, Mara, “Politically Connected Firms,” American Economic Review, 96(2006):369-386.
[15] Ferguson, Thomas, and Hans-Joachim Voth, “Betting on Hitler—the value of politicalconnections in Nazi Germany,” The Quarterly Journal of Economics, 123(2008): 101-137.
[16] Ferraz, Claudio and Frederico Finan. “Exposing Corrupt Politicians: The Effects ofBrazil’s Publicly Released Audits on Electoral Outcomes,” The Quarterly Journal ofEconomics, 123 (2008):703-745.
[17] Finan, Frederico and Laura Schechter, “Vote-Buying and Reciprocity,” Econometrica,80(2012): 863-881.
35
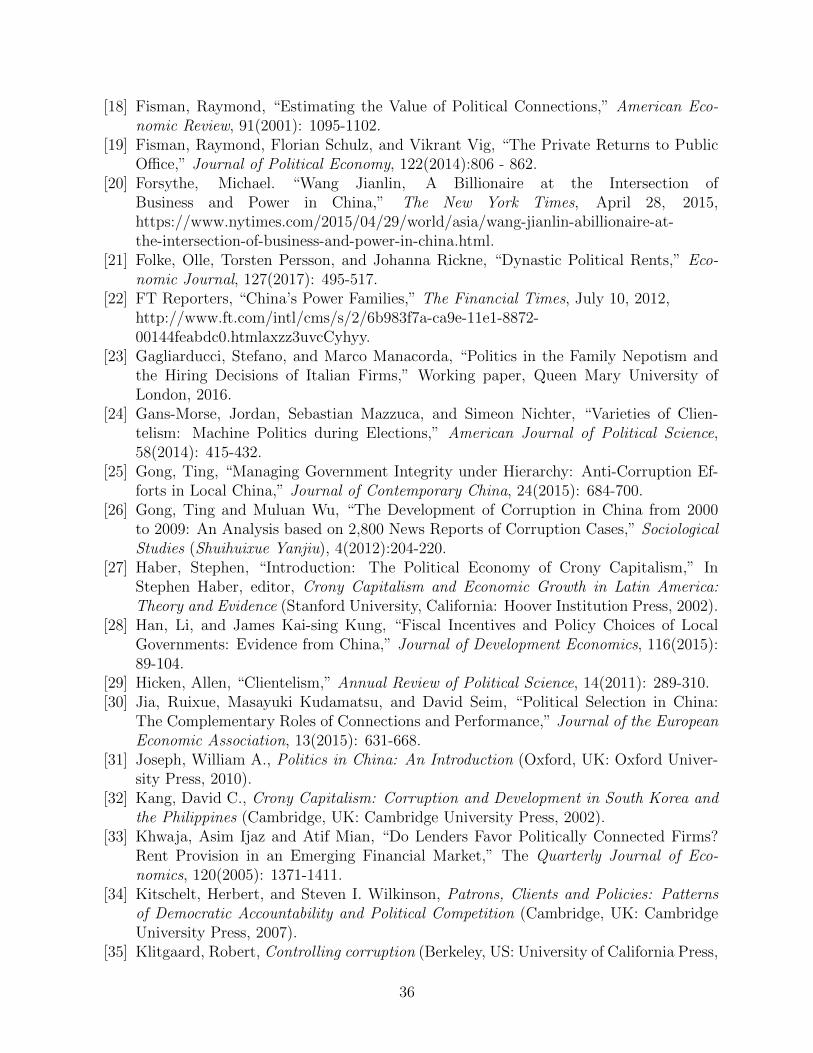
[18] Fisman, Raymond, “Estimating the Value of Political Connections,” American Eco-nomic Review, 91(2001): 1095-1102.
[19] Fisman, Raymond, Florian Schulz, and Vikrant Vig, “The Private Returns to PublicOffice,” Journal of Political Economy, 122(2014):806 - 862.
[20] Forsythe, Michael. “Wang Jianlin, A Billionaire at the Intersection ofBusiness and Power in China,” The New York Times, April 28, 2015,https://www.nytimes.com/2015/04/29/world/asia/wang-jianlin-abillionaire-at-the-intersection-of-business-and-power-in-china.html.
[21] Folke, Olle, Torsten Persson, and Johanna Rickne, “Dynastic Political Rents,” Eco-nomic Journal, 127(2017): 495-517.
[22] FT Reporters, “China’s Power Families,” The Financial Times, July 10, 2012,http://www.ft.com/intl/cms/s/2/6b983f7a-ca9e-11e1-8872-00144feabdc0.htmlaxzz3uvcCyhyy.
[23] Gagliarducci, Stefano, and Marco Manacorda, “Politics in the Family Nepotism andthe Hiring Decisions of Italian Firms,” Working paper, Queen Mary University ofLondon, 2016.
[24] Gans-Morse, Jordan, Sebastian Mazzuca, and Simeon Nichter, “Varieties of Clien-telism: Machine Politics during Elections,” American Journal of Political Science,58(2014): 415-432.
[25] Gong, Ting, “Managing Government Integrity under Hierarchy: Anti-Corruption Ef-forts in Local China,” Journal of Contemporary China, 24(2015): 684-700.
[26] Gong, Ting and Muluan Wu, “The Development of Corruption in China from 2000to 2009: An Analysis based on 2,800 News Reports of Corruption Cases,” SociologicalStudies (Shuihuixue Yanjiu), 4(2012):204-220.
[27] Haber, Stephen, “Introduction: The Political Economy of Crony Capitalism,” InStephen Haber, editor, Crony Capitalism and Economic Growth in Latin America:Theory and Evidence (Stanford University, California: Hoover Institution Press, 2002).
[28] Han, Li, and James Kai-sing Kung, “Fiscal Incentives and Policy Choices of LocalGovernments: Evidence from China,” Journal of Development Economics, 116(2015):89-104.
[29] Hicken, Allen, “Clientelism,” Annual Review of Political Science, 14(2011): 289-310.[30] Jia, Ruixue, Masayuki Kudamatsu, and David Seim, “Political Selection in China:
The Complementary Roles of Connections and Performance,” Journal of the EuropeanEconomic Association, 13(2015): 631-668.
[31] Joseph, William A., Politics in China: An Introduction (Oxford, UK: Oxford Univer-sity Press, 2010).
[32] Kang, David C., Crony Capitalism: Corruption and Development in South Korea andthe Philippines (Cambridge, UK: Cambridge University Press, 2002).
[33] Khwaja, Asim Ijaz and Atif Mian, “Do Lenders Favor Politically Connected Firms?Rent Provision in an Emerging Financial Market,” The Quarterly Journal of Eco-nomics, 120(2005): 1371-1411.
[34] Kitschelt, Herbert, and Steven I. Wilkinson, Patrons, Clients and Policies: Patternsof Democratic Accountability and Political Competition (Cambridge, UK: CambridgeUniversity Press, 2007).
[35] Klitgaard, Robert, Controlling corruption (Berkeley, US: University of California Press,
36
1988).[36] Kung, James Kai-sing, Chenggang Xu and Feizhou Zhou, “From Industrialization
to Urbanization: The Social Consequences of Changing Fiscal Incentives on LocalGovernments’ Behavior.“ In Kennedy, D. and Stiglitz, Joseph E., editors, Law andEconomic Development with Chinese Characteristics: Institutions for the 21st Century(Oxford, UK: Oxford University Press, 2013).
[37] Li, Cheng, “The Battle for China’s Top Nine Leadership Posts,” The WashingtonQuarterly, 35(2012): 131-145.
[38] Li, Hongbin, and Li-An Zhou, “Political Turnover and Economic Performance: TheIncentive Role of Personnel Control in China,” Journal of Public Economics, 89(2005):1743-1762.
[39] Lin, George CS, and Samuel PS Ho, “The State, Land System, and Land DevelopmentProcesses in Contemporary China,” Annals of the Association of American Geogra-phers, 95(2005): 411-436.
[40] L‘u, Xiaobo, and Pierre F. Landry, “Show me the money: Interjurisdiction politi-cal competition and fiscal extraction in China,” American Political Science Review,108(2014): 706-722.
[41] Lu, Xi, and Peter L. Lorentzen, “Rescuing Autocracy from Itself: China’s Anti-Corruption Campaign,” Working paper, University of San Francisco, 2016.
[42] Manion, Melanie, “Taking Chinas Anti-Corruption Campaign Seriously,” Economicand Political Studies, 4(2016): 3-18.
[43] Maskin, Eric, Yingyi Qian, and Chenggang Xu, “Incentives, Information, and Organi-zational Form,” Review of Economic Studies, 67(2000): 359-378.
[44] Olken, Benjamin A., and Rohini Pande, “Corruption in Developing Countries,” AnnualReview of Economics, 4(2012): 479-509.
[45] Page, Jeremy, “Children of the Revolution,” The Wall Street Journal, November 26,2011, https://www.wsj.com/articles/SB10001424053111904491704576572552793150470.
[46] Pei, Minxin, China’s Crony Capitalism (Cambridge, Massachusetts, US: Harvard Uni-versity Press, 2016).
[47] Rose-Ackerman, Susan, and Bonnie J. Palifka, Corruption and Government: Causes,Consequences, and Reform (Cambridge, UK: Cambridge University Press, 2016).
[48] Scott, James C., “Patron-Client Politics and Political Change in Southeast Asia,”American Political Science Review, 66(1972): 91-113.
[49] Shih, Victor C, Factions and Finance in China (Cambridge, UK: Cambridge UniversityPress, 2008).
[50] Shih, Victor C, Christopher Adolph, and Mingxing Liu, “Getting Ahead in the Com-munist Party: Explaining the Advancement of Central Committee Members in China,”American Political Science Review, 106(2012): 166-187.
[51] Shleifer, Andrei, and Robert W. Vishny, “Corruption,” The Quarterly Journal of E-conomics, 108(1993): 599-617.
[52] Thiessen, Marc A., and Peter Schweizer, “Crony Capitalism Exposed,” American En-terprise Institute, 2011.
[53] Tsang, Amie, “Off the Charts: Beijing Family Fortunes,” The Financial Times, July11, 2012, https://www.ft.com/content/014c8fba-6808-32fa-9b04-35e9860cfacf.
[54] Wedeman, Andrew, Double Paradox: Rapid Growth and Rising Corruption in China
37

(Ithaca, US: Cornell University Press, 2012).[55] Witt, Michael A. and Redding, Gordon, “China: Authoritarian Capitalism.“ In
Michael A. Witt and Gordon Redding, editors, The Oxford Handbook of Asian BusinessSystems (Oxford, UK: Oxford University Press, 2014).
[56] Xu, Chenggang, “The Fundamental Institutions of China’s Reforms and Develop-ment,” Journal of Economic Literature, 49(2011): 1076-1151.
[57] Yuen, Samson, “Disciplining the Party: Xi Jinping’s Anti-Corruption Campaign andIts Limits,” China Perspective, 3(2014): 41-47.
38

Table I
Characteristics of Princelings
Total 134
by Relation to the Politburo and Politburo Standing Committee Members
Son/Daughter and Son/Daughter in Law 78 58.21%
Wife and Other In-laws 31 23.13%
Brother and Sister 18 13.43%
Nephew and Niece 7 5.22%
by Occupation
SOE High Executives 39 29.10%
Private Firm Owners or Investors 61 45.52%
Government Officials 13 9.70%
Army Officials 8 5.97%
Others 13 9.70%
39
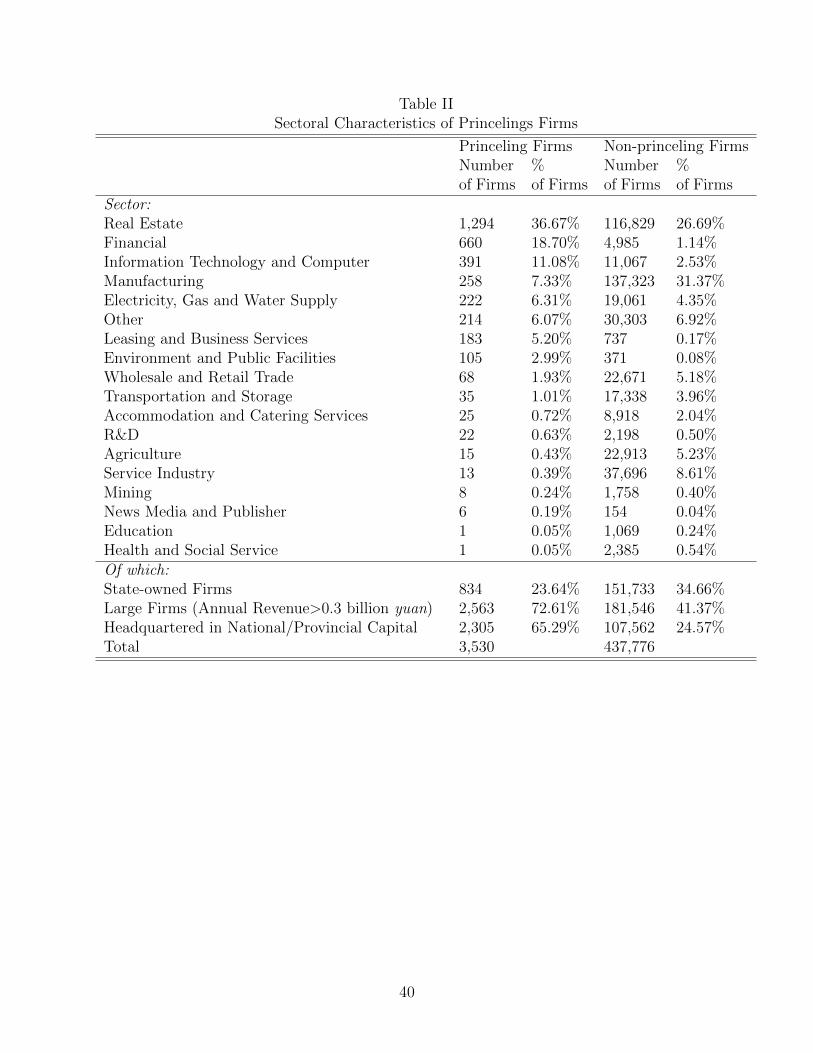
Table IISectoral Characteristics of Princelings Firms
Princeling Firms Non-princeling FirmsNumber % Number %of Firms of Firms of Firms of Firms
Sector:Real Estate 1,294 36.67% 116,829 26.69%Financial 660 18.70% 4,985 1.14%Information Technology and Computer 391 11.08% 11,067 2.53%Manufacturing 258 7.33% 137,323 31.37%Electricity, Gas and Water Supply 222 6.31% 19,061 4.35%Other 214 6.07% 30,303 6.92%Leasing and Business Services 183 5.20% 737 0.17%Environment and Public Facilities 105 2.99% 371 0.08%Wholesale and Retail Trade 68 1.93% 22,671 5.18%Transportation and Storage 35 1.01% 17,338 3.96%Accommodation and Catering Services 25 0.72% 8,918 2.04%R&D 22 0.63% 2,198 0.50%Agriculture 15 0.43% 22,913 5.23%Service Industry 13 0.39% 37,696 8.61%Mining 8 0.24% 1,758 0.40%News Media and Publisher 6 0.19% 154 0.04%Education 1 0.05% 1,069 0.24%Health and Social Service 1 0.05% 2,385 0.54%Of which:State-owned Firms 834 23.64% 151,733 34.66%Large Firms (Annual Revenue>0.3 billion yuan) 2,563 72.61% 181,546 41.37%Headquartered in National/Provincial Capital 2,305 65.29% 107,562 24.57%Total 3,530 437,776
40
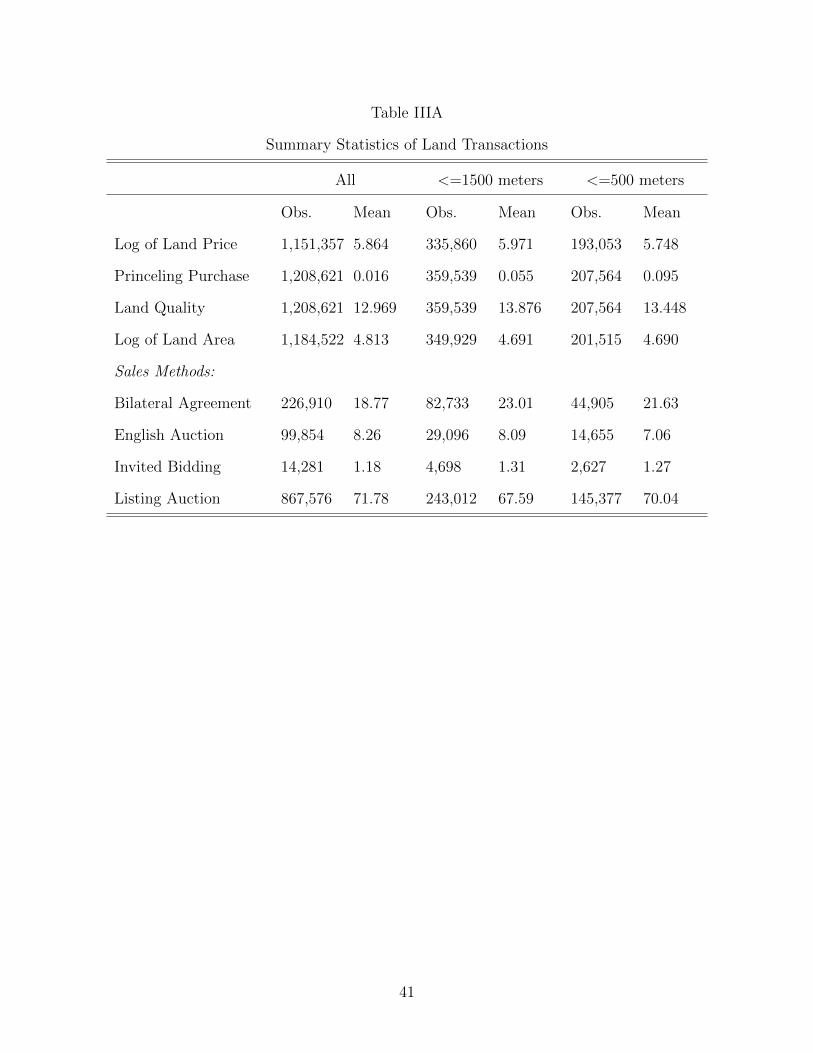
Table IIIA
Summary Statistics of Land Transactions
All <=1500 meters <=500 meters
Obs. Mean Obs. Mean Obs. Mean
Log of Land Price 1,151,357 5.864 335,860 5.971 193,053 5.748
Princeling Purchase 1,208,621 0.016 359,539 0.055 207,564 0.095
Land Quality 1,208,621 12.969 359,539 13.876 207,564 13.448
Log of Land Area 1,184,522 4.813 349,929 4.691 201,515 4.690
Sales Methods:
Bilateral Agreement 226,910 18.77 82,733 23.01 44,905 21.63
English Auction 99,854 8.26 29,096 8.09 14,655 7.06
Invited Bidding 14,281 1.18 4,698 1.31 2,627 1.27
Listing Auction 867,576 71.78 243,012 67.59 145,377 70.04
41

Table IIIBSummary Statistics of Political Turnover
Variables Number Mean Std. Number Mean Std.of Obs. Dev. of Obs. Dev.Provincial Party Secretaries Provincial Governors
Political Turnover 403 100% 403 100%-Promotion 35 8.68% 42 10.42%-Lateral Transfer orStaying in Office
328 81.39% 324 80.40%
-Retirement 35 8.68% 33 8.19%-Termination 5 1.24% 4 0.99%Princeling Purchase 399 0.596 0.491 399 0.654 0.476Princeling Discounts 403 0.685 0.686 403 0.617 0.576Area of Land Purchased 401 0.904 1.286 401 0.895 1.285Factional Ties 395 0.686 0.465 403 0.591 0.492GDP Growth 403 0.137 0.064 403 0.137 0.064Log of GDP per capita 403 7.936 0.664 403 7.936 0.664Log of Population 403 8.085 0.857 403 8.085 0.857Tax Revenue Growth 390 0.172 0.102 390 0.175 0.103Age 403 59.859 4.258 403 58.134 3.864Age Squared 403 3601.129 495.371 403 3394.457 439.508Years of Schoolings 403 17.938 1.918 403 18.007 1.818
Municipal Party Secretaries Municipal GovernorsPolitical Turnover 3,237 100% 3,048 100%-Promotion 209 6.46% 204 6.69%-Lateral Transfer orStaying in Office
2,836 87.61% 2,655 87.11%
-Retirement 177 5.47% 166 5.45%-Termination 15 0.46% 23 0.75%Princeling Purchase 3,663 0.497 0.500 3,663 0.480 0.500Princeling Discounts 3,597 3.232 5.322 3,605 3.224 5.318Area of Land Purchased 3,657 1.704 1.468 3,661 1.579 1.287Factional Ties 3,663 0.616 0.486 3,663 0.616 0.486GDP Growth 3,511 0.151 0.076 3,511 0.151 0.076Log of GDP per capita 3,556 9.968 0.840 3,556 9.968 0.840Log of Population 3,656 5.641 0.850 3,656 5.641 0.850Tax Revenue Growth 3,090 0.150 0.105 3,090 0.150 0.105Age 3,564 53.049 3.621 3,577 51.098 3.939Age Squared 3,564 2827.256 381.029 3,577 2626.469 400.419Years of Schoolings 3,582 17.555 2.156 3,603 17.279 2.107
42

Tab
leIV
Lan
dP
arce
lsP
urc
has
edby
Pri
nce
ling
and
Non
-Pri
nce
ling
Fir
ms,
2004
-201
6
Num
ber
ofT
ransa
ctio
ns
Ave
rage
Pri
ce
Com
mer
cial
Indust
rial
Com
mer
cial
Indust
rial
and
Lan
dan
dL
and
Res
iden
tial
Res
iden
tial
Lan
dL
and
All
586,
974
621,
647
1383
.99
280.
28
(48.
57%
)(5
1.43
%)
Pri
nce
lings
’L
and
16,7
173,
095
812.
127
0.42
(84.
38%
)(1
5.62
%)
Non
-Pri
nce
lings
’L
and
in50
0-M
eter
Rad
ius
90,5
6897
,184
1457
.191
306.
15
(48.
24%
)(5
1.76
%)
Diff
eren
ce-6
45.0
9-3
5.73
43

Tab
leV
Pri
nce
lin
gP
urc
has
ean
dL
and
Pri
ce,
2004
-201
6
Log
ofL
and
Pri
ceA
ll<
=15
00m
eter
s<
=50
0m
eter
sA
ll<
=15
00m
eter
s<
=50
0m
eter
sA
ll<
=15
00m
eter
s<
=50
0m
eter
s(1
)(2
)(3
)(4
)(5
)(6
)(7
)(8
)(9
)
Pri
nce
lin
gF
irm
s-0
.808*
**
-0.9
04**
*-0
.844
***
-0.5
45**
*-0
.666
***
-0.6
20**
*-0
.808
***
-0.8
94**
*-0
.835
***
(0.0
25)
(0.0
34)
(0.0
33)
(0.0
35)
(0.0
43)
(0.0
43)
(0.0
30)
(0.0
40)
(0.0
38)
Pri
nce
lin
gF
irm
s*P
SC
M-0
.442
***
-0.4
20**
*-0
.396
***
(0.0
37)
(0.0
48)
(0.0
49)
Pri
nce
lin
gF
irm
s*R
etir
ed-0
.001
-0.0
51-0
.044
(0.0
56)
(0.0
63)
(0.0
58)
Con
trol
Vari
able
sY
esY
esY
esY
esY
esY
esY
esY
esY
esT
wo-
way
Clu
ster
ing
Yes
Yes
Yes
Yes
Yes
Yes
Yes
Yes
Yes
by
Fir
man
dP
rovin
ceC
ity-Y
ear-
Usa
geF
Es
Yes
Yes
Yes
Yes
Yes
Yes
Yes
Yes
Yes
Mon
thF
ixed
Eff
ect
Yes
Yes
Yes
Yes
Yes
Yes
Yes
Yes
Yes
Ind
ust
ryF
ixed
Eff
ects
Yes
Yes
Yes
Yes
Yes
Yes
Yes
Yes
Yes
Nu
mb
erof
Obse
rvati
on
s1144
507
3342
3219
1896
1144
507
3342
3219
1896
1144
507
3342
3219
1896
Ad
just
edR
-squ
ared
0.69
20.
727
0.75
50.
692
0.72
80.
756
0.69
20.
727
0.75
5
Con
trol
vari
able
sin
clu
de:
Lan
dqu
alit
y,la
nd
are
a,
sale
sm
eth
od
du
mm
ies,
firm
size
(cla
ssifi
edas
larg
e,m
ediu
m-s
ized
,sm
all
,or
mic
roif
its
reven
ue
inyu
an
is0.
3b
illi
onor
mor
e,30
mil
lion
orm
ore
bu
tb
elow
0.3
bil
lion
,3
mil
lion
or
more
bu
tb
elow
30
mil
lion
,or
un
der
3m
illi
on
,re
spec
tive
ly),
an
d
own
ersh
ipty
pe;
rob
ust
stan
dar
der
rors
inp
aren
thes
es;
*p<
0.0
5,
**
p<
0.0
1,
***
p<
0.0
01;
con
stant
term
sare
not
rep
ort
ed.
44

Table VI
Quantity of Land Purchased by Princeling Firms, 2004-2016
Log of Quantity of Land Purchased
(1) (2) (3)
Princeling Firms 0.002*** 0.001* 0.002***
(0.000) (0.000) (0.000)
Princeling Firms*PSCM 0.031***
(0.004)
Princeling Firms*Retired -0.001
(0.001)
Clustering by Firm Yes Yes Yes
Industry Fixed Effects Yes Yes Yes
Year Fixed Effects Yes Yes Yes
Number of Observations 5690984 5690984 5690984
Adj. R-squared 0.015 0.016 0.015
Control variables include: firm size (classified as large, medium-sized, small, or micro if its revenue in yuan
is greater than or equal to 0.3 billion, greater than or equal to 30 million but less than 0.3 billion, greater
than or equal to 3 million but less than 30 million, or less than 3 million, respectively), and ownership type;
robust standard errors in parentheses; * p<0.05, ** p<0.01, *** p<0.001; constant terms are not reported.
45

Tab
leV
IIP
rin
celi
ng
Pu
rch
ase
and
Pro
vin
cial
Lea
der
s’P
rom
otio
n,
2004
-201
6
Pol
itic
alT
urn
over
of:
Pro
vin
cial
Par
tyS
ecre
tari
esP
rovin
cial
Gov
ern
ors
Ord
ered
Pro
bit
Bin
ary
Ord
ered
Pro
bit
Ord
ered
Pro
bit
Bin
ary
Ord
ered
Pro
bit
(1)
(2)
(3)
(4)
(5)
(6)
(7)
(8)
(9)
(10)
Pri
nce
lin
gP
urc
hase
(=1)
0.6
52***
0.74
2***
0.11
4***
0.01
8-0
.016
0.07
0(0
.229)
(0.2
62)
(0.0
40)
(0.2
88)
(0.3
14)
(0.0
67)
Pri
nce
lin
gD
isco
unts
0.81
4***
0.18
1(0
.175
)(0
.175
)A
rea
ofL
an
dP
urc
has
ed0.
324*
**-0
.068
(0.0
84)
(0.0
65)
Fact
ion
al
Tie
s0.
232
0.01
10.
118
0.30
2-0
.034
-0.0
03-0
.031
-0.0
52(0
.209
)(0
.033
)(0
.212
)(0
.213
)(0
.208
)(0
.045
)(0
.205
)(0
.206
)G
DP
Gro
wth
-1.4
38-0
.195
-0.4
44-0
.032
6.18
8***
1.25
0***
6.37
4***
6.06
1***
(2.4
84)
(0.3
81)
(2.5
54)
(2.5
30)
(1.9
77)
(0.4
43)
(1.9
81)
(1.9
83)
Tax
Rev
enu
eG
row
th1.9
540.
029
1.56
12.
403*
0.26
20.
031
0.20
70.
232
(1.2
30)
(0.1
95)
(1.2
41)
(1.2
62)
(1.0
70)
(0.2
29)
(1.0
58)
(1.0
59)
Con
trol
Vari
able
sY
esY
esY
esY
esY
esY
esY
esY
esY
esY
esP
rovin
ceF
ixed
Eff
ects
Yes
Yes
Yes
Yes
Yes
Yes
Yes
Yes
Yes
Yes
Yea
rF
ixed
Eff
ects
Yes
Yes
Yes
Yes
Yes
Yes
Yes
Yes
Yes
Yes
Nu
mb
erof
Obse
rvati
on
s399
380
380
382
382
399
388
388
390
390
Ad
just
edR
-squ
ared
0.27
20.
100
Th
eor
din
alm
easu
reof
pol
itic
altu
rnov
erco
nsi
sts
of
fou
rca
tegori
es:
Ter
min
ati
on
=0,
Ret
irem
ent=
1,
Late
ral
Tra
nsf
eror
Sta
yin
gin
Offi
ce=
2,
an
d
Pro
mot
ion
=3.
An
dth
eb
inar
ym
easu
reis
ad
um
my
vari
ab
lew
hic
heq
uals
toon
eif
the
offi
cial
was
pro
mote
dat
yeart,
oth
erw
ise
equ
als
toze
ro.
Con
trol
vari
able
sin
clu
de
tax
reven
ue
grow
th,
log
of
GD
Pp
erca
pit
a,
log
of
pop
ula
tion
size
,age
an
dage
squ
are
d,
yea
rsof
edu
cati
on
.R
ob
ust
Sta
nd
ard
erro
rsar
ere
por
ted
inp
aren
thes
es;
*p<
0.10
,**
p<
0.0
5,
***
p<
0.0
1;
con
stant
term
sare
not
rep
ort
ed.
46

Tab
leV
III
Pri
nce
lin
gP
urc
has
ean
dM
un
icip
alL
ead
ers’
Pro
mot
ion
,20
04-2
014
Pol
itic
alT
urn
over
of:
Mu
nic
ipal
Par
tyS
ecre
tari
esM
un
icip
alM
ayor
sO
rder
edP
rob
itB
inar
yO
rder
edP
rob
itO
rder
edP
rob
itB
inar
yO
rder
edP
rob
it(1
)(2
)(3
)(4
)(5
)(6
)(7
)(8
)(9
)(1
0)
Pri
nce
lin
gP
urc
hase
(=1)
0.4
69***
0.43
2***
0.08
8***
0.07
90.
093
-0.0
08(0
.070)
(0.0
77)
(0.0
12)
(0.0
94)
(0.1
08)
(0.0
11)
Pri
nce
lin
gD
isco
unts
0.10
0***
0.01
2(0
.006
)(0
.008
)A
rea
ofL
an
dP
urc
has
ed0.
927*
**0.
000
(0.0
66)
(0.0
47)
Fact
ion
al
Tie
s0.
169*
*0.
012
0.19
1**
0.12
9-0
.027
-0.0
14-0
.021
-0.0
26(0
.073
)(0
.011
)(0
.080
)(0
.082
)(0
.101
)(0
.010
)(0
.101
)(0
.101
)G
DP
Gro
wth
-0.3
16-0
.099
-0.6
99-0
.686
2.79
8***
0.36
5***
2.72
6***
2.77
1***
(0.5
59)
(0.0
87)
(0.6
16)
(0.6
50)
(0.7
61)
(0.0
76)
(0.7
61)
(0.7
70)
Tax
Rev
enu
eG
row
th-0
.455
0.00
3-0
.588
-0.2
981.
097*
*0.
064
1.08
7**
1.07
4**
(0.3
98)
(0.0
61)
(0.4
29)
(0.4
44)
(0.5
23)
(0.0
52)
(0.5
23)
(0.5
24)
Con
trol
Vari
able
sY
esY
esY
esY
esY
esY
esY
esY
esY
esY
esP
rovin
ceF
ixed
Eff
ects
Yes
Yes
Yes
Yes
Yes
Yes
Yes
Yes
Yes
Yes
Yea
rF
ixed
Eff
ects
Yes
Yes
Yes
Yes
Yes
Yes
Yes
Yes
Yes
Yes
Nu
mb
erof
Obse
rvati
on
s3237
275
627
5627
5527
5630
4825
6925
6925
6825
68A
dju
sted
R-s
qu
ared
0.04
90.
374
Th
eor
din
alm
easu
reof
pol
itic
altu
rnov
erco
nsi
sts
of
fou
rca
tegori
es:
Ter
min
ati
on
=0,
Ret
irem
ent=
1,
Late
ral
Tra
nsf
eror
Sta
yin
gin
Offi
ce=
2,
an
d
Pro
mot
ion
=3.
An
dth
eb
inar
ym
easu
reis
ad
um
my
vari
ab
lew
hic
heq
uals
toon
eif
the
offi
cial
was
pro
mote
dat
yeart,
oth
erw
ise
equ
als
toze
ro.
Con
trol
vari
able
sin
clu
de
tax
reven
ue
grow
th,
log
of
GD
Pp
erca
pit
a,
log
of
pop
ula
tion
size
,age
an
dage
squ
are
d,
yea
rsof
edu
cati
on
.R
ob
ust
Sta
nd
ard
erro
rsar
ere
por
ted
inp
aren
thes
es;
*p<
0.10
,**
p<
0.0
5,
***
p<
0.0
1;
con
stant
term
sare
not
rep
ort
ed.
47

Tab
leIX
Pri
nce
lin
gP
urc
hase
an
dL
an
dP
rice
aft
erX
iT
ook
Offi
ce
Log
of
Lan
dP
rice
All
<=
500
All
<=
500
All
<=
500
All
<=
500
All
<=
500
met
ers
met
ers
met
ers
met
ers
met
ers
(1)
(2)
(3)
(4)
(5)
(6)
(7)
(8)
(9)
(10)
Pri
nce
lin
gF
irm
s-0
.907
***
-0.9
20***
-0.8
25***
-0.8
58***
-0.8
70***
-0.8
96***
-0.9
07***
-0.9
20***
-0.8
18***
-0.8
47***
(0.0
29)
(0.0
40)
(0.0
24)
(0.0
32)
(0.0
28)
(0.0
35)
(0.0
29)
(0.0
40)
(0.0
23)
(0.0
28)
Pri
nce
lin
gF
irm
0.31
8***
0.25
7***
0.1
40*
0.0
93
*Tra
nsa
ctio
naf
ter
2012
(0.0
47)
(0.0
58)
(0.0
52)
(0.0
54)
Pri
nce
lin
gF
irm
0.8
19***
0.6
95***
0.5
04***
0.4
20***
*Cen
tral
Insp
ecti
on(0
.124)
(0.1
39)
(0.0
79)
(0.0
96)
Pri
nce
lin
gF
irm
0.6
14***
0.5
72***
0.4
49***
0.4
47***
*Xi
Ap
poi
nte
dO
ffici
als
(0.0
55)
(0.0
51)
(0.0
64)
(0.0
59)
pri
nce
lin
gF
irm
s0.1
09
0.0
37
*Pre
-201
2In
spec
tion
(0.0
74)
(0.0
70)
Con
trol
Var
iab
les
Yes
Yes
Yes
Yes
Yes
Yes
Yes
Yes
Yes
Yes
Tw
o-w
ayC
lust
erin
gY
esY
esY
esY
esY
esY
esY
esY
esY
esY
esby
Fir
man
dP
rovin
ceC
ity-Y
ear-
Usa
geF
Es
Yes
Yes
Yes
Yes
Yes
Yes
Yes
Yes
Yes
Yes
Mon
thF
ixed
Eff
ect
Yes
Yes
Yes
Yes
Yes
Yes
Yes
Yes
Yes
Yes
Ind
ust
ryF
ixed
Eff
ects
Yes
Yes
Yes
Yes
Yes
Yes
Yes
Yes
Yes
Yes
Nu
mb
erof
Ob
serv
atio
ns
1144
507
1918
96
1144507
191896
1144507
191896
1144507
191896
1144507
191896
Ad
just
edR
-squ
ared
0.69
20.
755
0.6
92
0.7
55
0.6
92
0.7
55
0.6
92
0.7
56
0.6
92
0.7
55
Con
trol
vari
able
sin
clu
de:
lan
dqu
alit
y,la
nd
area
,sa
les
met
hod
du
mm
ies,
firm
size
(cla
ssifi
edas
larg
e,m
ediu
m-s
ized
,sm
all
,or
mic
roif
its
reve
nu
ein
yuan
isgr
eate
rth
anor
equ
alto
0.3
bil
lion
,gr
eate
rth
an
or
equ
al
to30
mil
lion
bu
tle
ssth
an
0.3
bil
lion
,gre
ate
rth
an
or
equ
al
to3
mil
lion
bu
tle
ssth
an
30m
illi
on,
and
less
than
3m
illi
on,
resp
ecti
vely
),an
dow
ner
ship
typ
ean
dit
sin
tera
ctio
nw
ith
tran
sact
ion
saft
er2012,
centr
al
insp
ecti
on
,X
i-ap
poin
ted
offici
als
and
pre
-201
2in
spec
tion
;ro
bu
stst
and
ard
erro
rsin
pare
nth
eses
;*
p<
0.0
5,
**
p<
0.0
1,
***
p<
0.0
01;
con
stant
term
sare
not
rep
ort
ed.
48

Tab
leX
Qu
anti
tyof
Lan
dP
urc
has
edby
Pri
nce
lin
gF
irm
saf
ter
Xi
Took
Offi
ce
Log
ofQ
uan
tity
ofL
and
Pu
rch
ased
(1)
(2)
(3)
(4)
Pri
nce
lin
gF
irm
s0.
078*
**0.
073*
**0.
075*
**0.
078*
**(0
.008
)(0
.007
)(0
.007
)(0
.008
)P
P*T
ransa
ctio
ns
afte
r2012
-0.0
22**
-0.0
15(0
.006
)(0
.007
)C
entr
alIn
spec
tion
0.03
8***
0.02
5***
(0.0
02)
(0.0
04)
PP
*C
entr
al
Insp
ecti
on-0
.053
***
-0.0
25**
*(0
.007
)(0
.007
)X
iA
pp
oin
ted
Offi
cial
s0.
036*
**0.
028*
**(0
.002
)(0
.002
)P
P*X
iA
pp
oin
ted
Offi
cial
s-0
.056
***
-0.0
36**
*(0
.006
)(0
.006
)
Con
trol
Vari
able
sY
esY
esY
esY
esT
wo-
way
Clu
ster
ing
by
Fir
mby
atP
rovin
ceY
esY
esY
esY
esP
rovin
ceF
ixed
Eff
ects
Yes
Yes
Yes
Yes
Yea
rF
ixed
Eff
ects
Yes
Yes
Yes
Yes
Nu
mb
erof
Obse
rvati
on
s11
5166
2211
5166
2211
5166
2211
5166
22A
dju
sted
R-s
qu
ared
0.03
20.
047
0.05
20.
057
Ad
just
edR
-squ
ared
0.03
20.
047
0.05
20.
057
Con
trol
vari
able
sin
clu
de:
firm
size
(cla
ssifi
edas
larg
e,m
ediu
m-s
ized
,sm
all
,or
mic
roif
its
reve
nu
ein
yuan
isgre
ate
rth
an
or
equ
al
to0.3
bil
lion
,
grea
ter
than
oreq
ual
to30
mil
lion
bu
tle
ssth
an
0.3
bil
lion
,gre
ate
rth
an
or
equ
al
to3
mil
lion
bu
tle
ssth
an
30
mil
lion
,or
less
than
3m
illi
on
,
resp
ecti
vely
),an
dow
ner
ship
typ
e;ro
bu
stst
and
ard
erro
rsin
pare
nth
eses
;*
p<
0.0
5,
**
p<
0.0
1,
***
p<
0.0
01;
con
stant
term
sare
not
rep
ort
ed.
49

Table XIPrinceling Purchase and Promotion after Xi Took Office
Political Turnover of:Provincial Party Secretaries Municipal Party Secretaries
Ordered Probit Estimates
Panel A (1) (2) (3) (4)Princeling Purchase (=1) 1.085*** 1.084*** 0.503*** 0.457***
(0.313) (0.300) (0.080) (0.078)PP*Transactions after 2012 -1.165** -0.802***
(0.560) (0.257)PP*Central Inspection -2.769*** -0.701*
(0.767) (0.406)Number of Observations 380 380 2756 2756Panel B (5) (6) (7) (8)Princeling Discounts 1.246*** 1.202*** 0.102*** 0.101***
(0.224) (0.212) (0.006) (0.006)PD*Transactions after 2012 -1.556*** -0.131***
(0.394) (0.042)PD*Central Inspection -2.344*** -0.101
(0.530) (0.075)Number of Observations 382 382 2755 2755Panel C (9) (10) (11) (12)Area of Land Purchased 0.406*** 0.372*** 1.014*** 0.928***
(0.091) (0.088) (0.069) (0.066)ALP*Transactions after 2012 -0.772*** -0.880***
(0.255) (0.155)ALP*Central Inspection -1.822*** 0.044
(0.619) (0.095)Number of Observations 382 382 2756 2756
Control Variables Yes Yes Yes YesProvince Fixed Effects Yes Yes No NoMunicipality Fixed Effects No No Yes YesYear Fixed Effects Yes Yes Yes Yes
The ordinal measure of political turnover consists of four categories: Termination=0, Retirement=1, Lateral
Transfer or Staying in Office=2, and Promotion=3. Control variables include tax revenue growth, log of
GDP per capita, log of population size, age and age squared, years of education. Robust Standard errors
are reported in parentheses; * p<0.10, ** p<0.05, *** p<0.01; Constant terms are not reported.
50

Figure I
Size of Land Revenue, 2000-2016
010
0020
0030
0040
00La
nd R
even
ue (B
illion
, Yua
n)
020
4060
8010
0Sh
are
(%)
2000
2001
2002
2003
2004
2005
2006
2007
2008
2009
2010
2011
2012
2013
2014
2015
2016
Land Revenue to Total RevenueLand Revenue to GDPLand Revenue
51

Figure II
The Power Pyramid of the 18th National Congress of the Communist Party of China(2012-2017)
Source: http://cpc.people.com.cn/18/
52
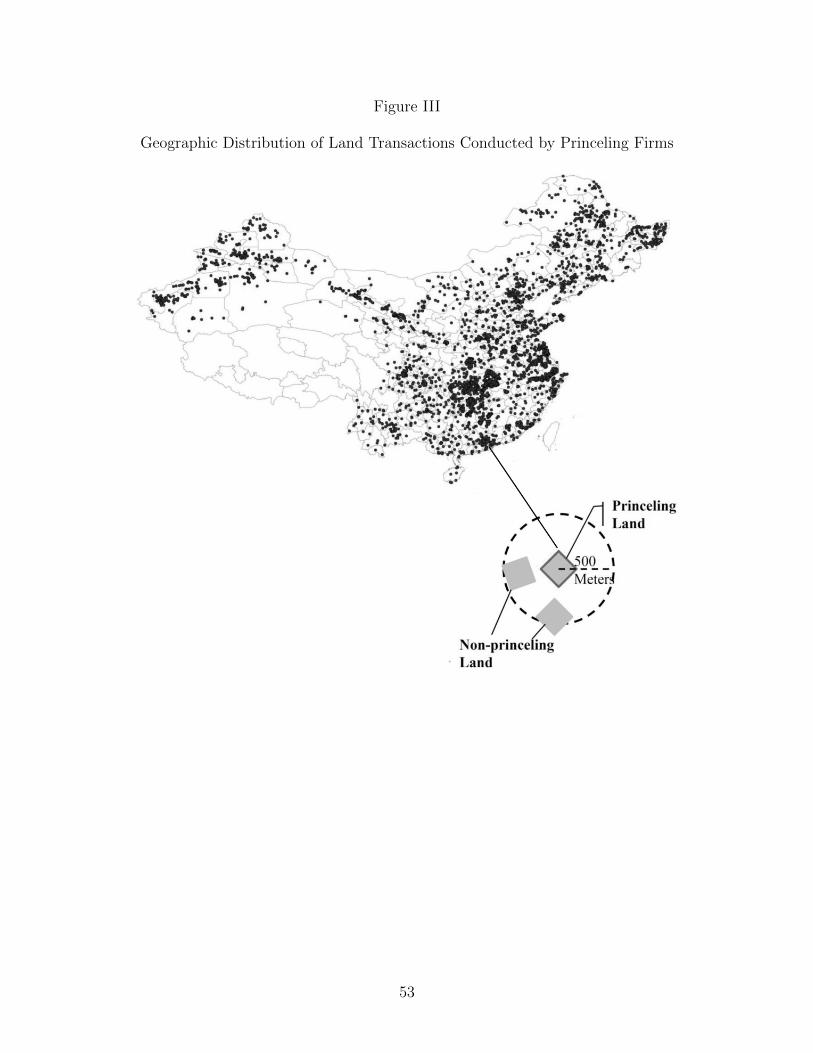
Figure III
Geographic Distribution of Land Transactions Conducted by Princeling Firms
53

Figure IV
Land Prices within the 500-Meter Radius, Princeling and (Average) Non-Princeling PricesCompared
24
68
10Av
erag
e La
nd P
rice
with
in 5
00-M
eter
Rad
ius
2 4 6 8 10Princeling Land Price
Princeling Land Transaction 45 Degree Line
54

Figure V
Average Size of Princeling Discounts over Time
-1.2
-1-.8
-.6-.4
-.20
.2
Pric
e D
iffer
ence
s be
twee
n Pr
ince
ling
vs. N
on-P
rince
ling
Land
Tra
nsac
tions
2006 2007 2008 2009 2010 2011 2012 2013 2014 2015 2016
Coefficient/95% Confidence Interval
55

Figure VI
Quantity Difference of Land Purchase over Time
0.0
02.0
04.0
06.0
08.0
1
Qua
ntity
Diff
eren
ces
betw
een
Prin
celin
g vs
. Non
-Prin
celin
gFi
rms'
Lan
d Pu
rcha
se
2006 2007 2008 2009 2010 2011 2012 2013 2014 2015 2016
Coefficient/95% Confidence Interval
56
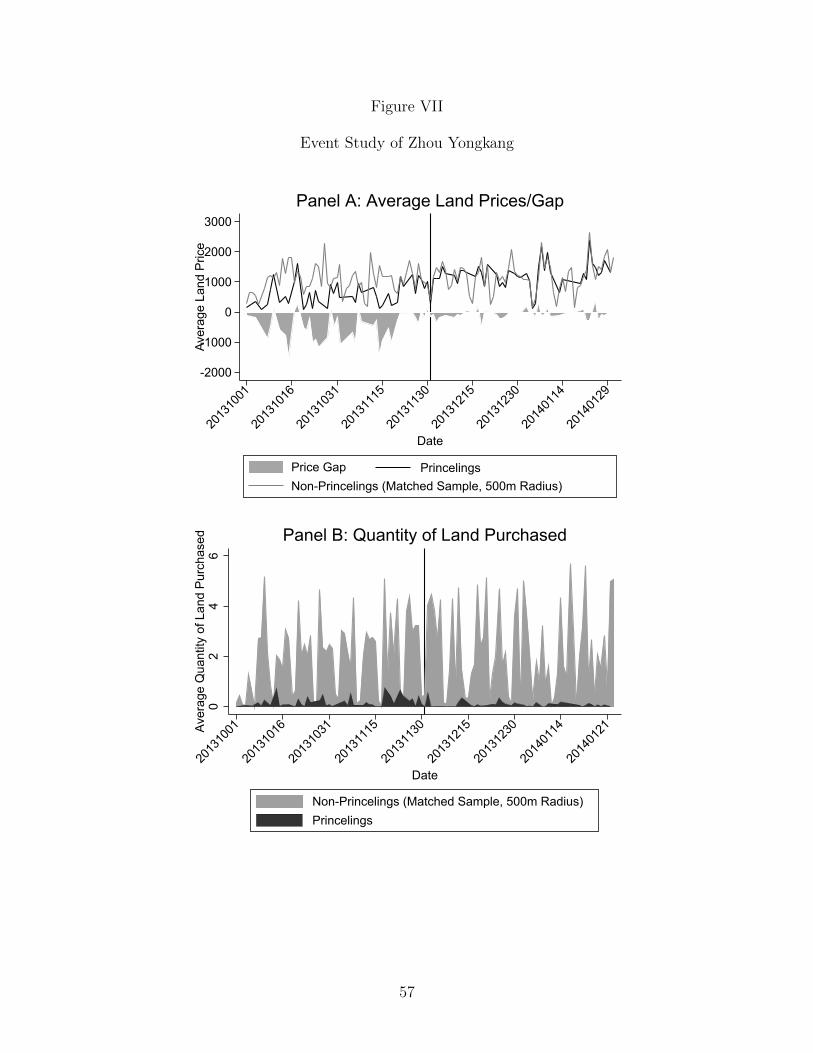
Figure VII
Event Study of Zhou Yongkang
-2000
-1000
0
1000
2000
3000
Aver
age
Land
Pric
e
2013
1001
2013
1016
2013
1031
2013
1115
2013
1130
2013
1215
2013
1230
2014
0114
2014
0129
Date
Price Gap PrincelingsNon-Princelings (Matched Sample, 500m Radius)
Panel A: Average Land Prices/Gap0
24
6Av
erag
e Q
uant
ity o
f Lan
d Pu
rcha
sed
2013
1001
2013
1016
2013
1031
2013
1115
2013
1130
2013
1215
2013
1230
2014
0114
2014
0121
Date
Non-Princelings (Matched Sample, 500m Radius)Princelings
Panel B: Quantity of Land Purchased
57


