Bringing Data to LifeDavid Sanderson!Founder and CEO, Nugit3 December, 2014


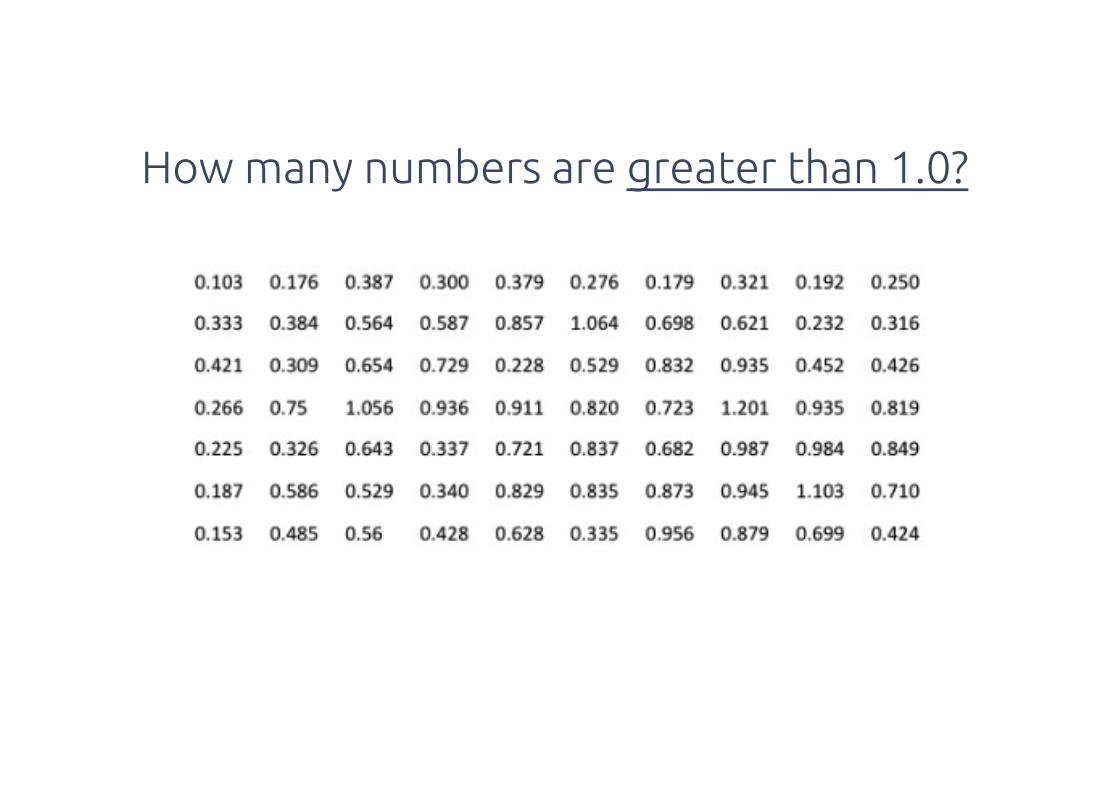
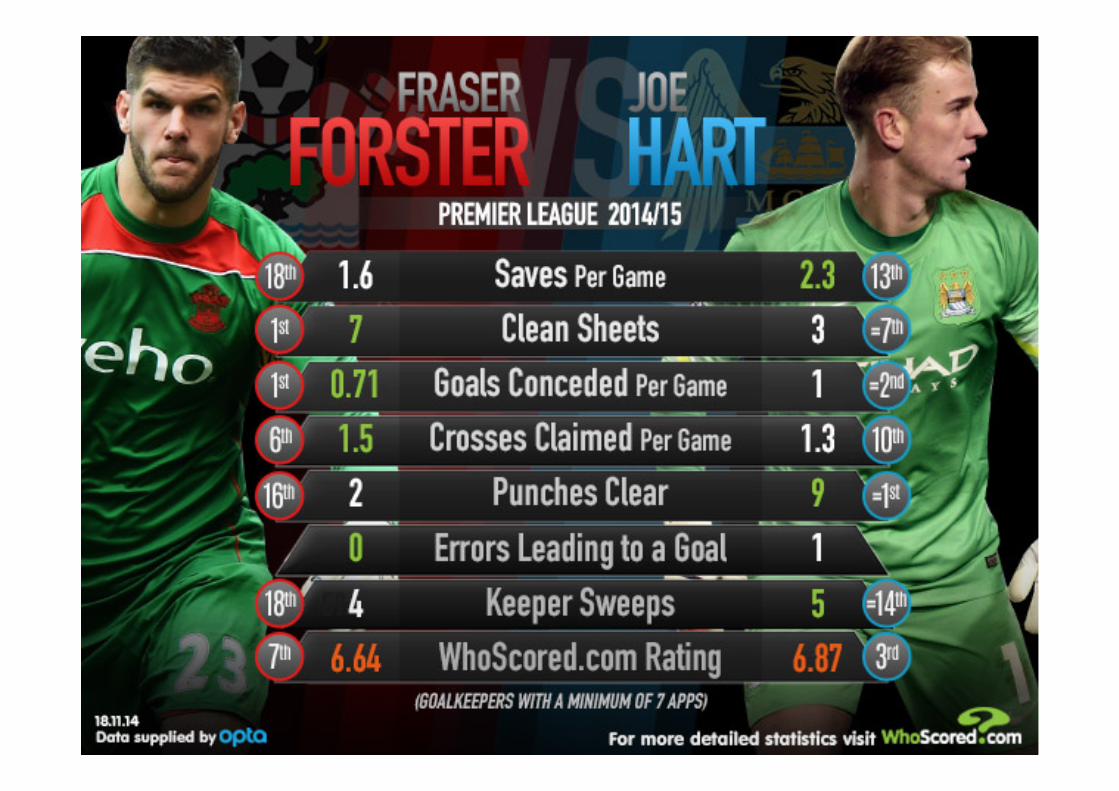
How many numbers are greater than 1.0?

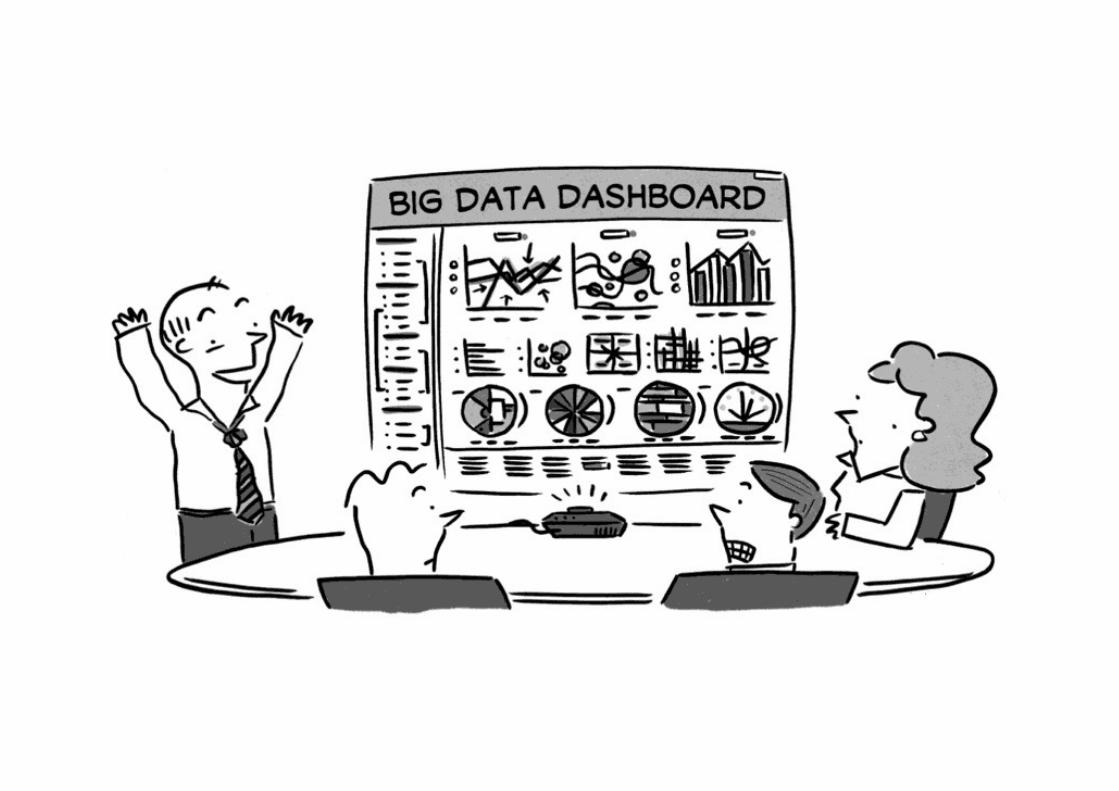
The consequences of confusion
We are shooting ourselves in the foot

Flu! & Pu! Brevity
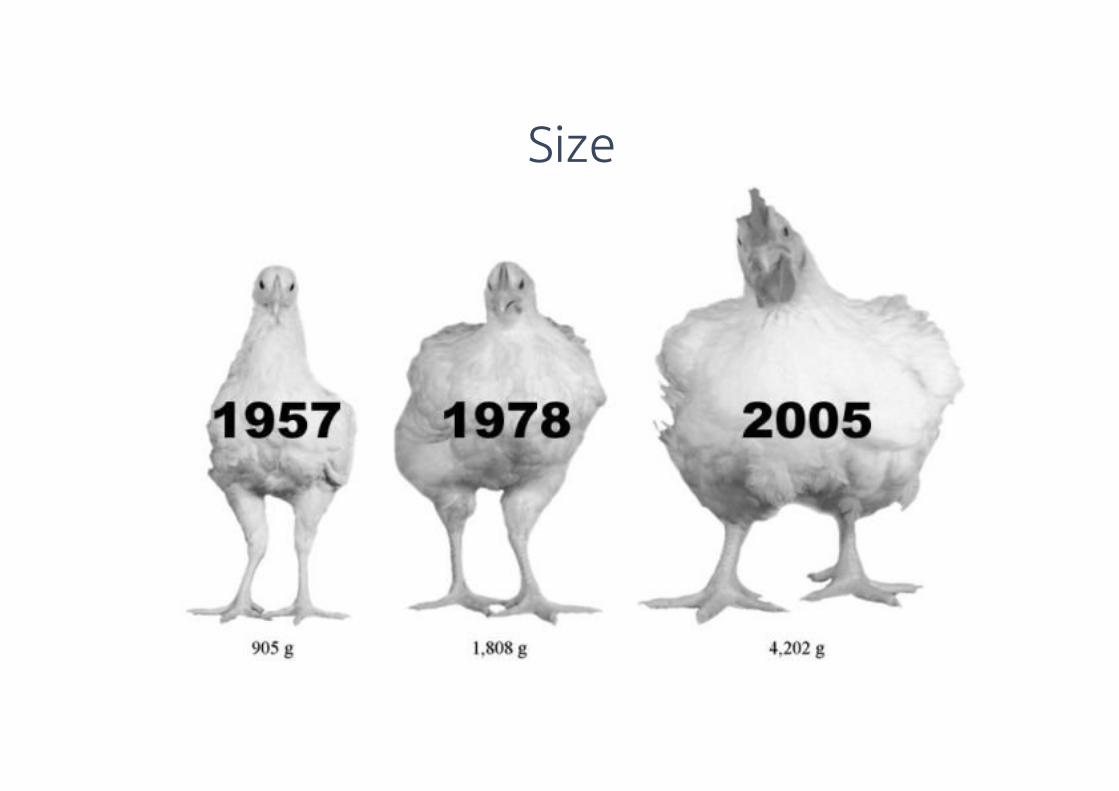
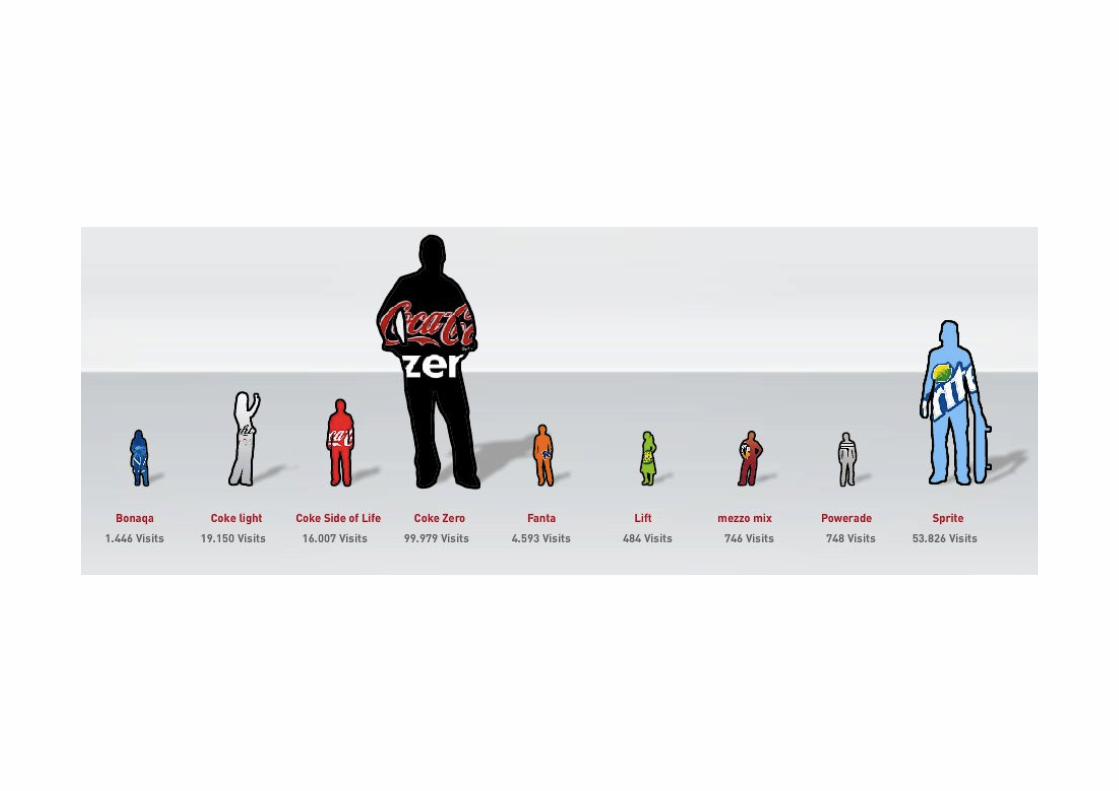
Size
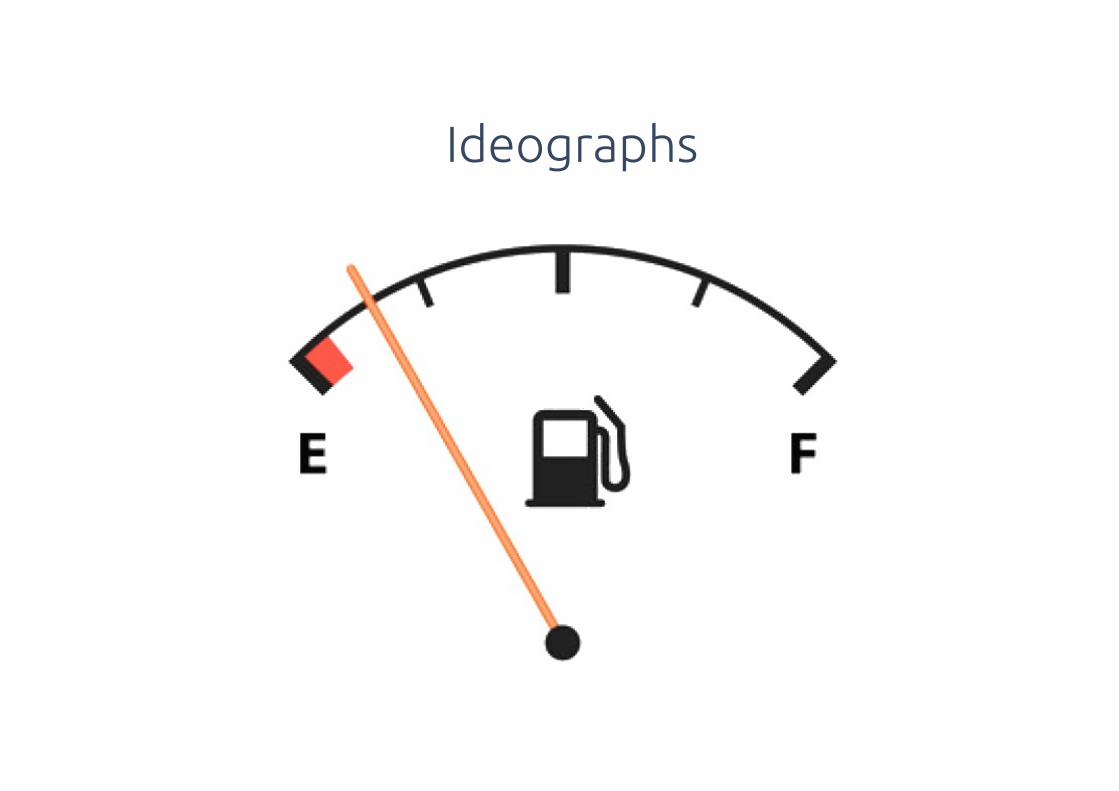
Ideographs
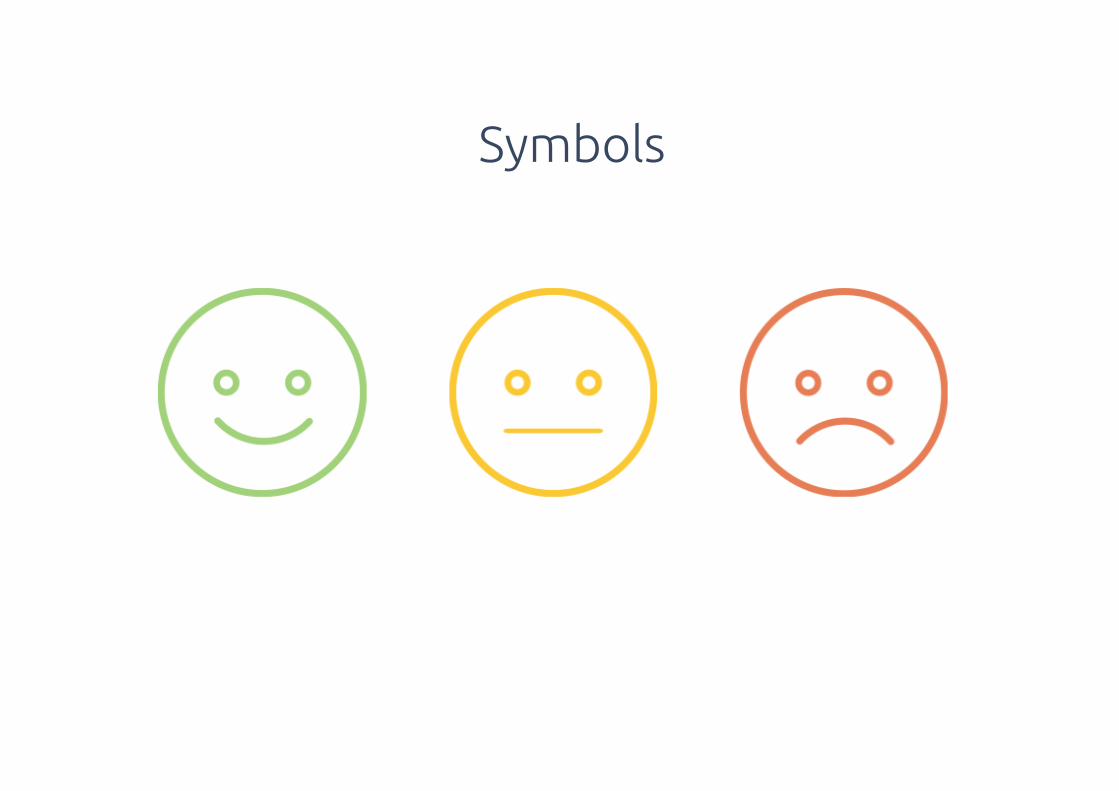
Symbols
Best week this year
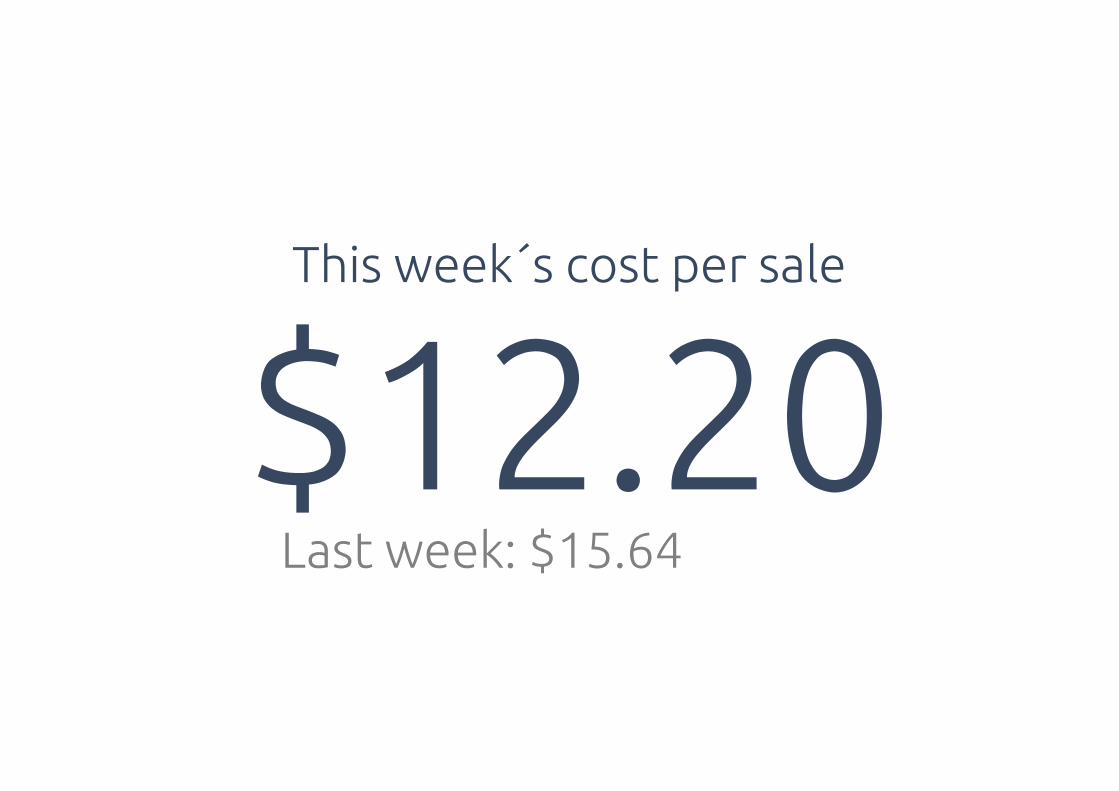
Context

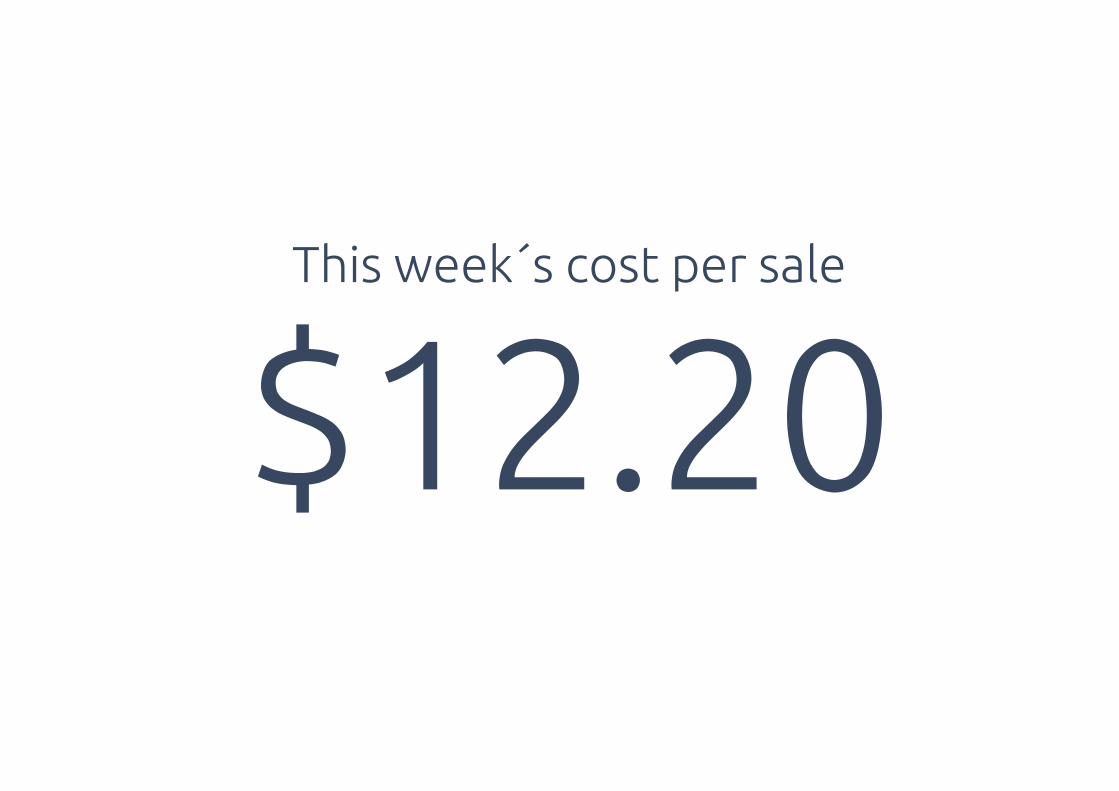
$12.20This week´s cost per sale
$12.20This week´s cost per sale
Last week: $15.64
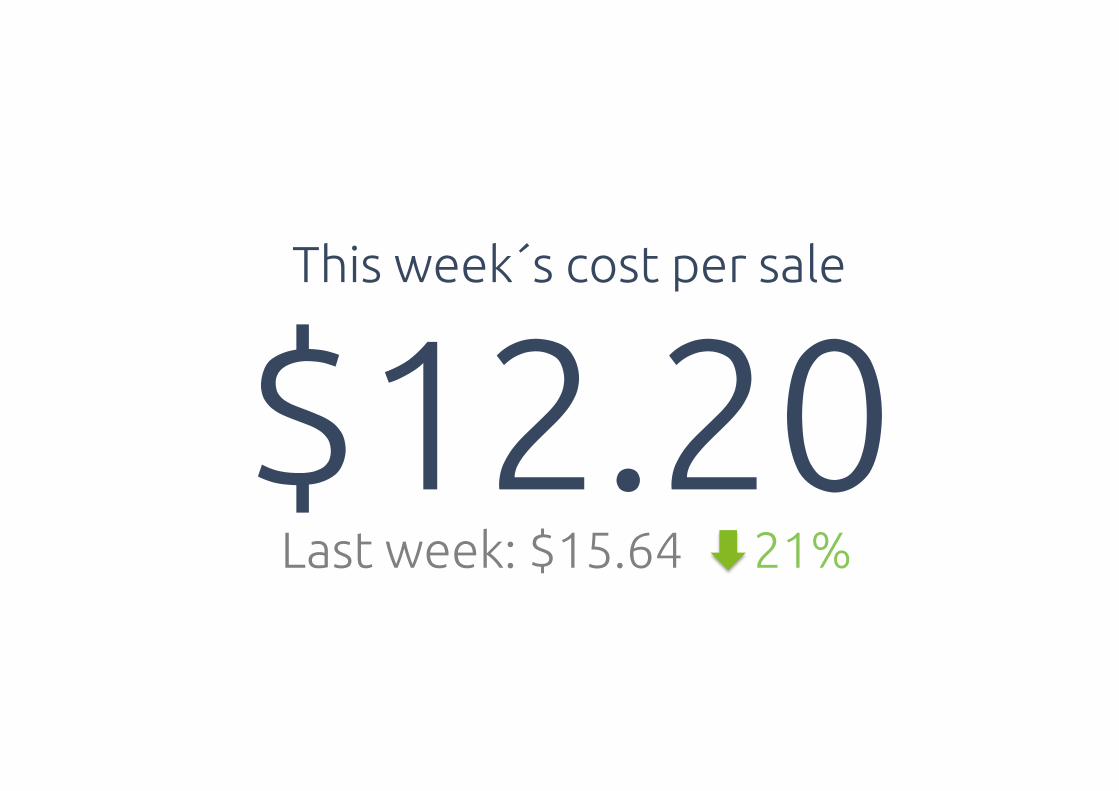
$12.20Last week: $15.64 21%
This week´s cost per sale
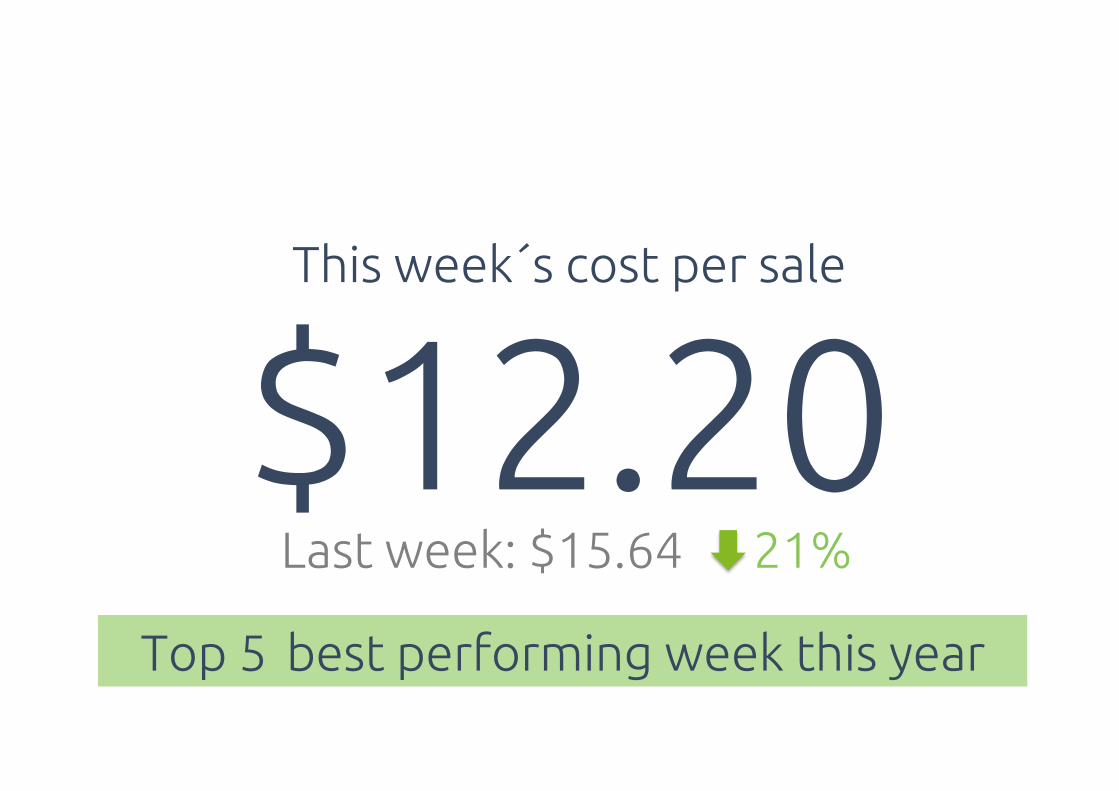
$12.20Top 5 best performing week this year
Last week: $15.64 21%
This week´s cost per sale
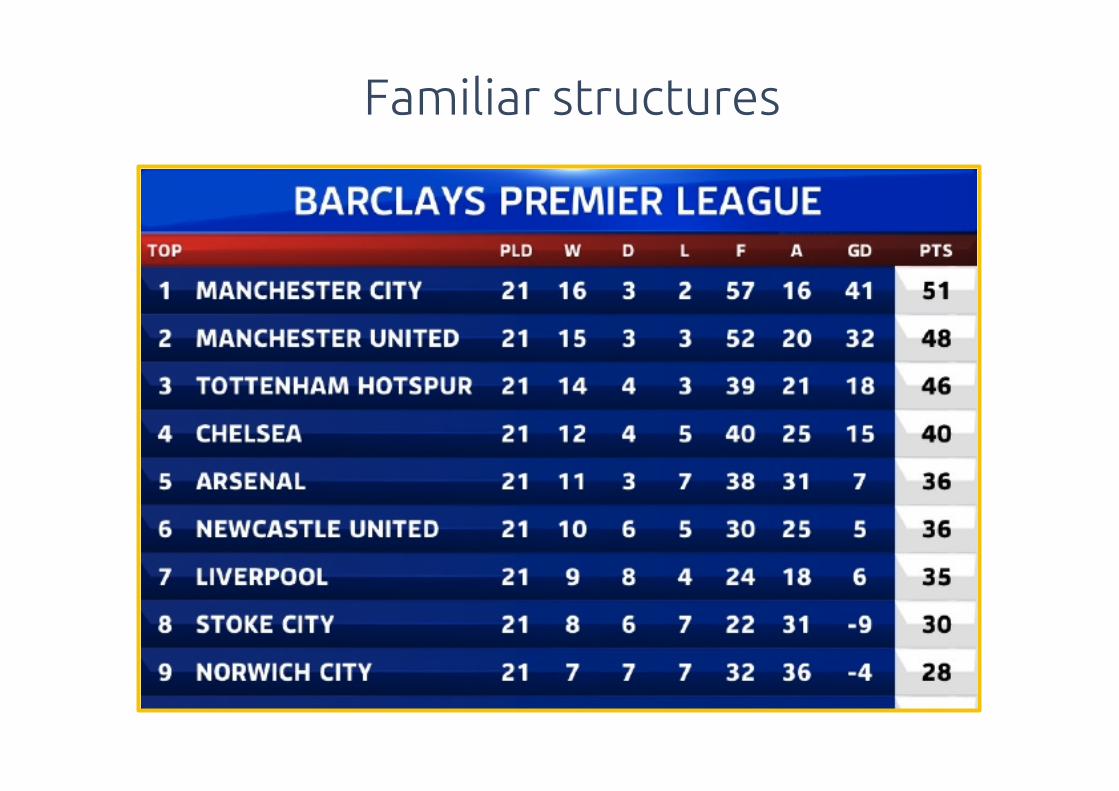
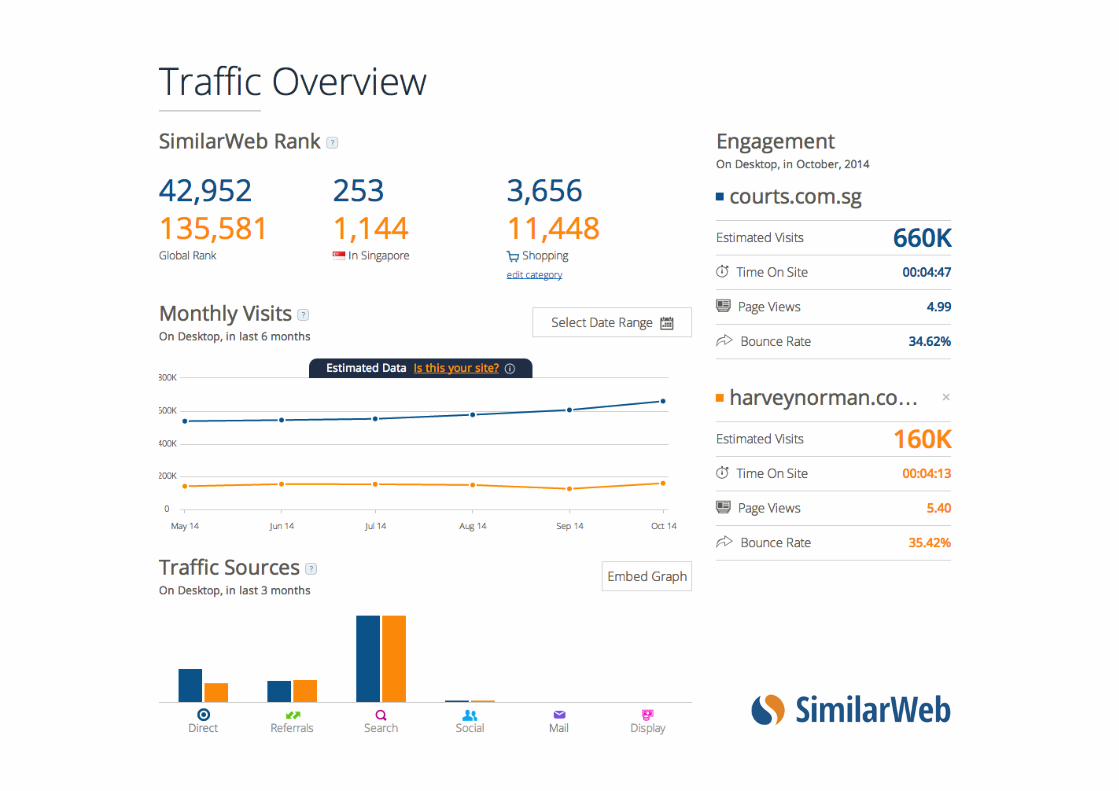
Familiar structures

Advertising AdWords
$0.74 Cost Per Click $1.20
1,032 Visits 1,443
65% Bounce Rate 42%
2.4 Avg. Page Views 5.3
157 Checkouts 244
42 Online Sales 85
$18 Cost Per Sale 20
Performance Advertising August 2014
Facebook Google

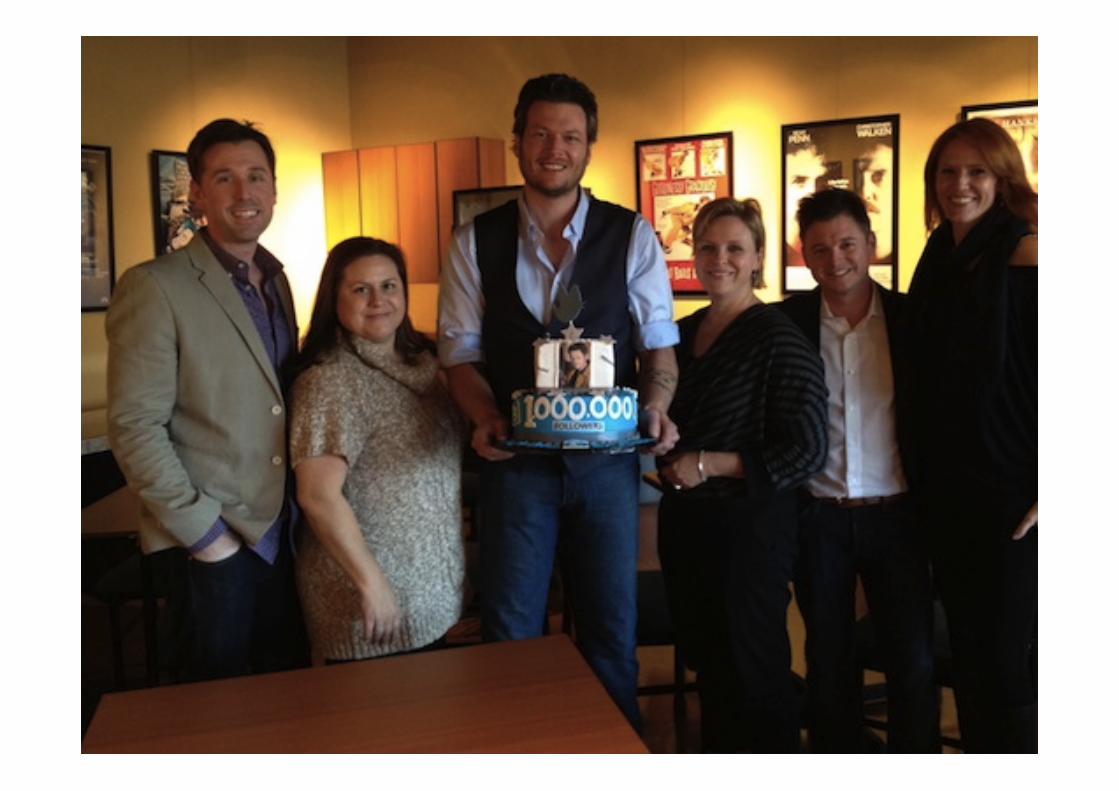
Celebrate little wins
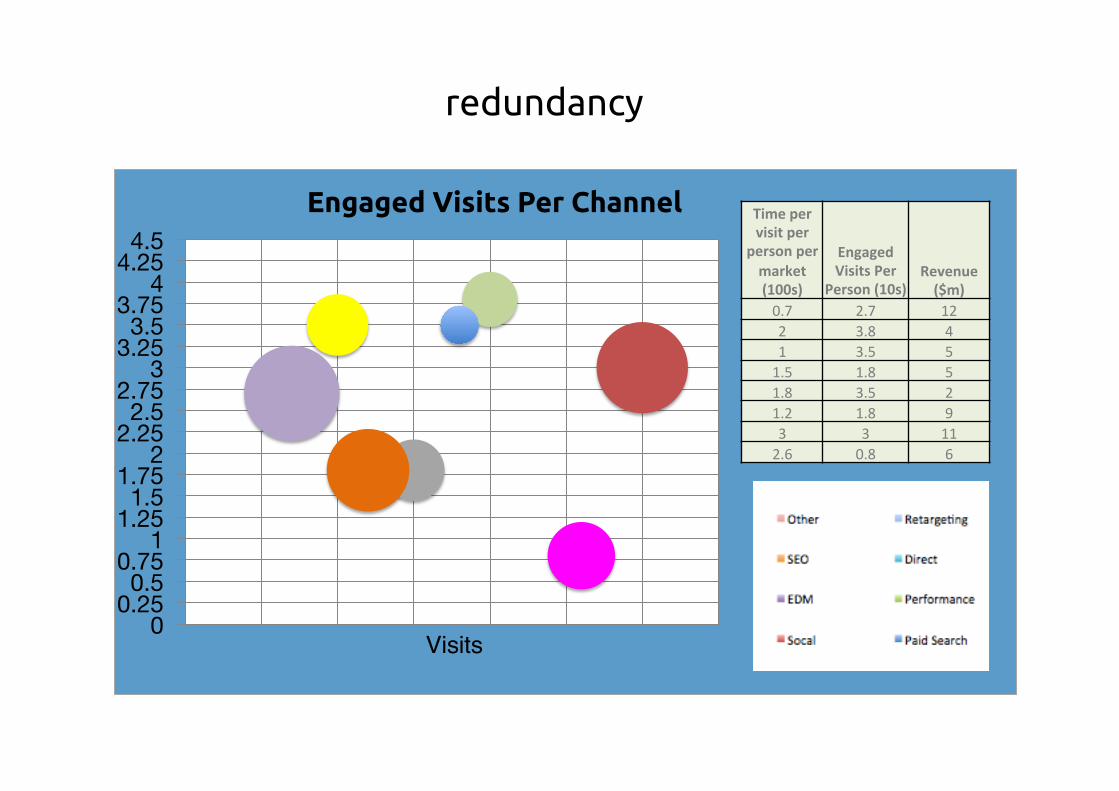
redundancy
0 0.25 0.5
0.75 1
1.25 1.5
1.75 2
2.25 2.5
2.75 3
3.25 3.5
3.75 4
4.25 4.5
Engaged Visits Per Channel Time%per%visit%per%
person%per%market%(100s)%
Engaged%Visits%Per%
Person%(10s)%Revenue%($m)%
0.7! 2.7! 12!2! 3.8! 4!1! 3.5! 5!1.5! 1.8! 5!1.8! 3.5! 2!1.2! 1.8! 9!3! 3! 11!2.6! 0.8! 6!
Visits
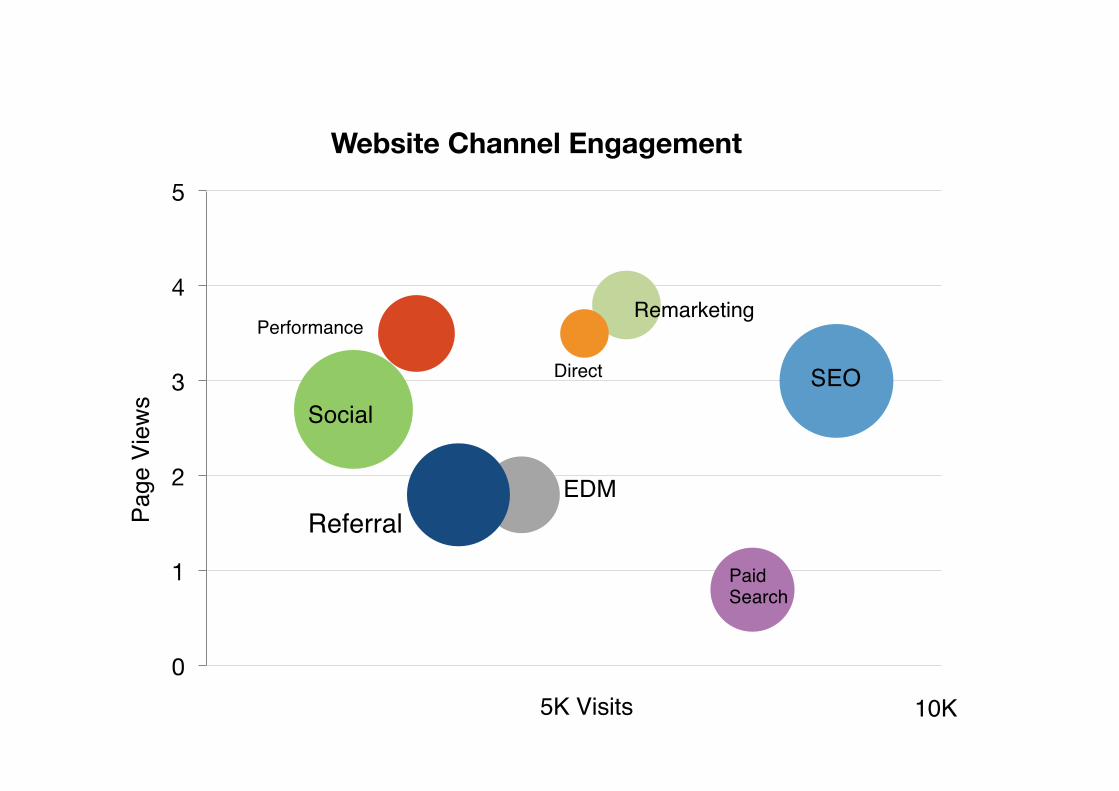
0
1
2
3
4
5
Website Channel Engagement
SEO
Paid Search
Direct
Remarketing
Social
Referral
Performance
10K5K Visits
Page
Vie
ws
EDM
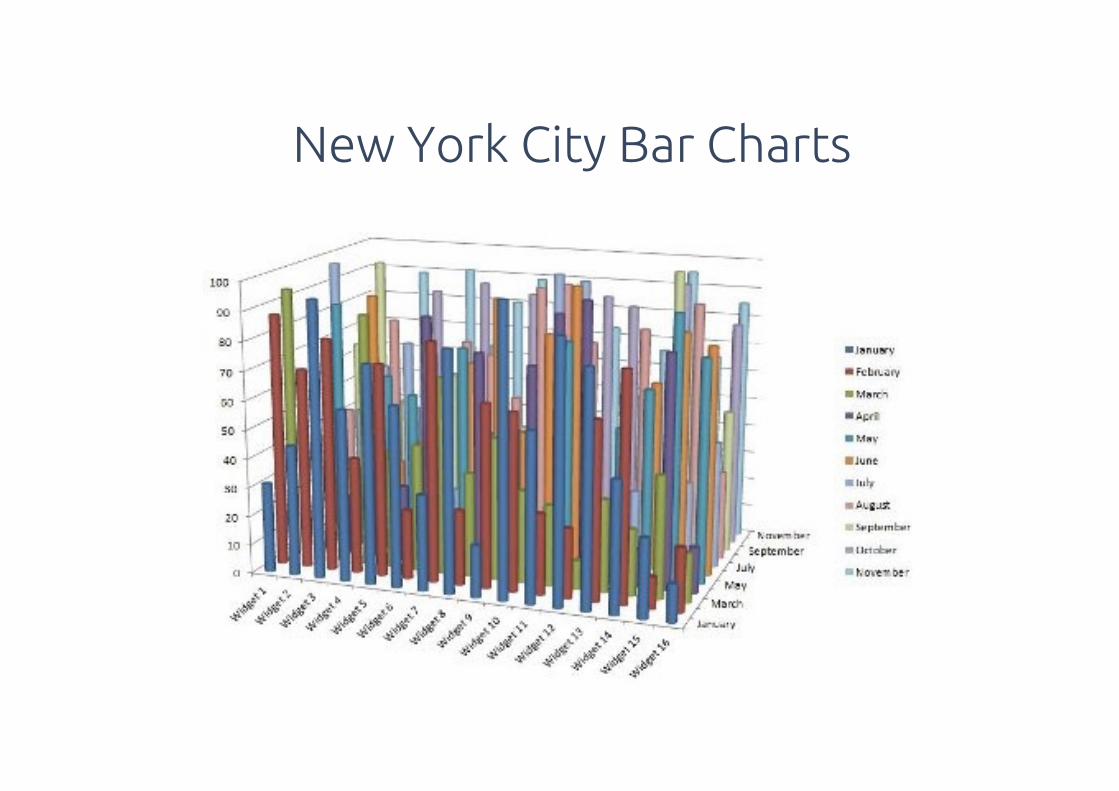
New York City Bar Charts
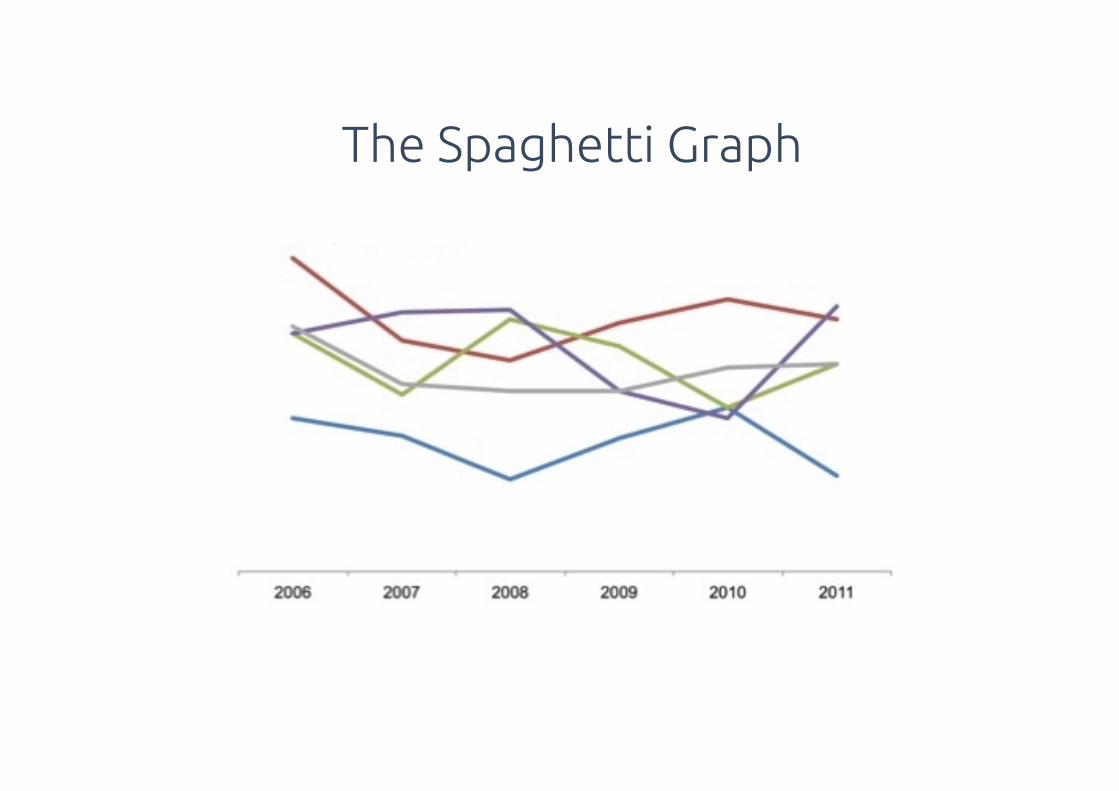
The Spaghetti Graph
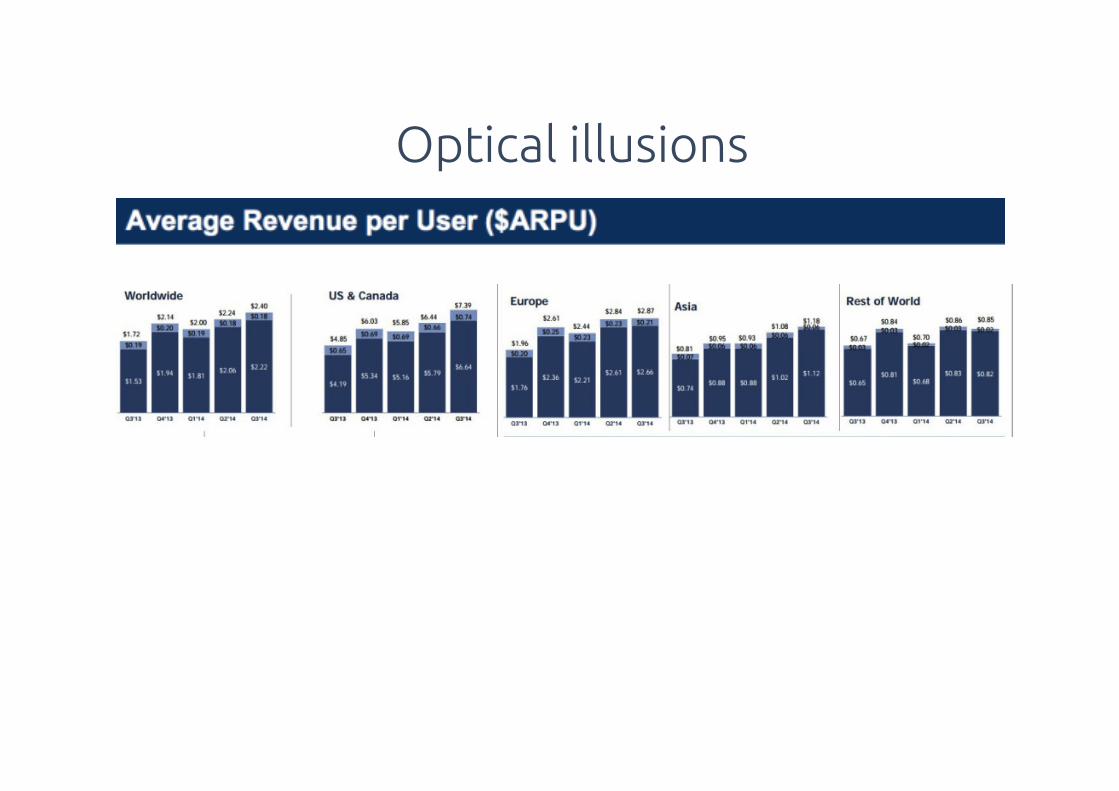
Optical illusions
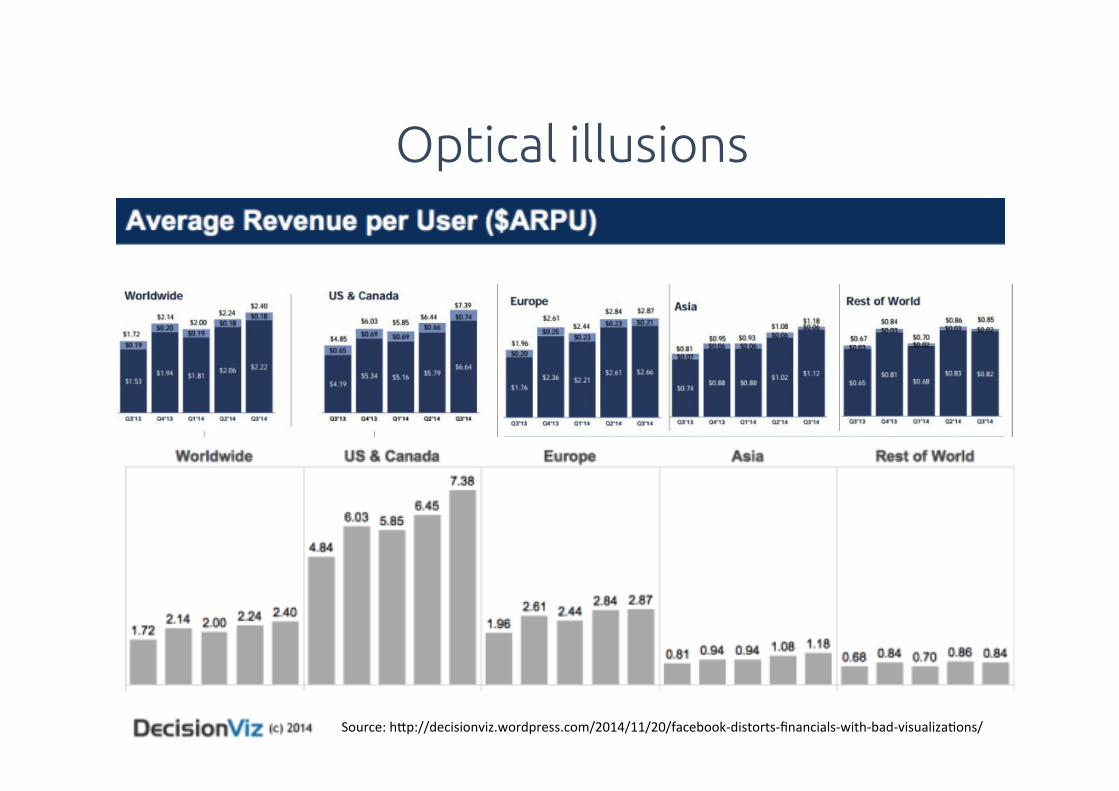
Source:!h5p://decisionviz.wordpress.com/2014/11/20/facebookDdistortsDfinancialsDwithDbadDvisualizaHons/!
Optical illusions
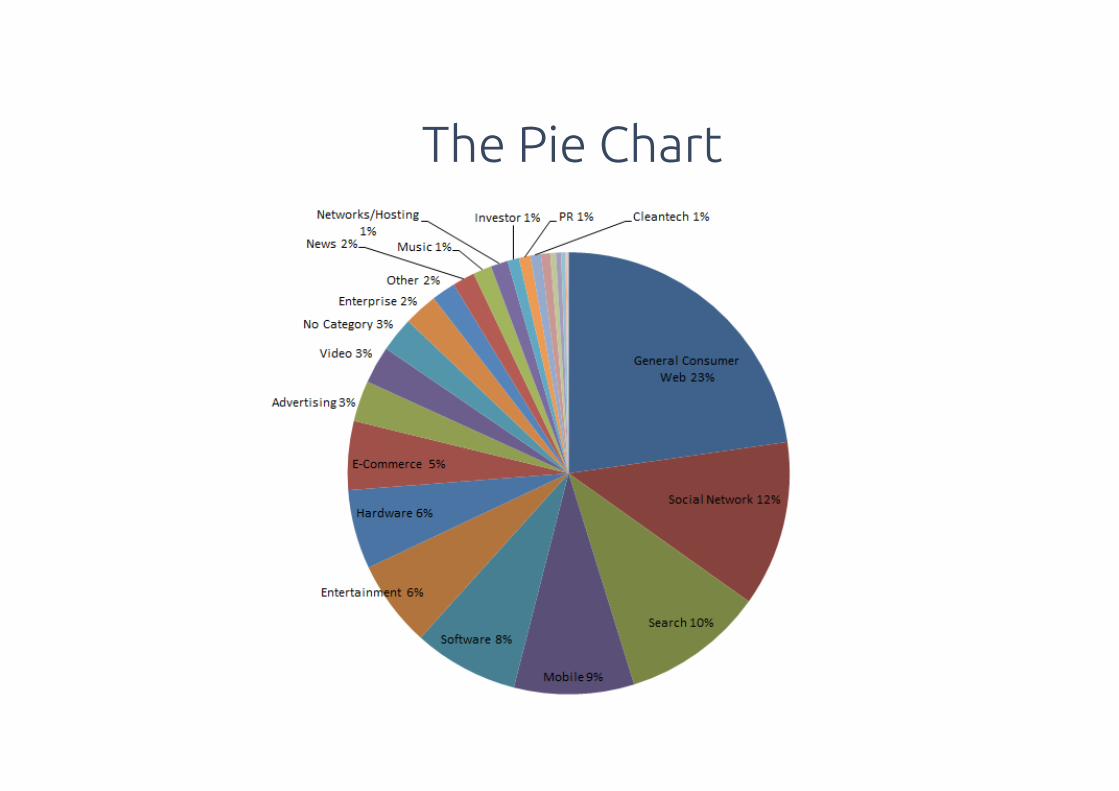
The Pie Chart
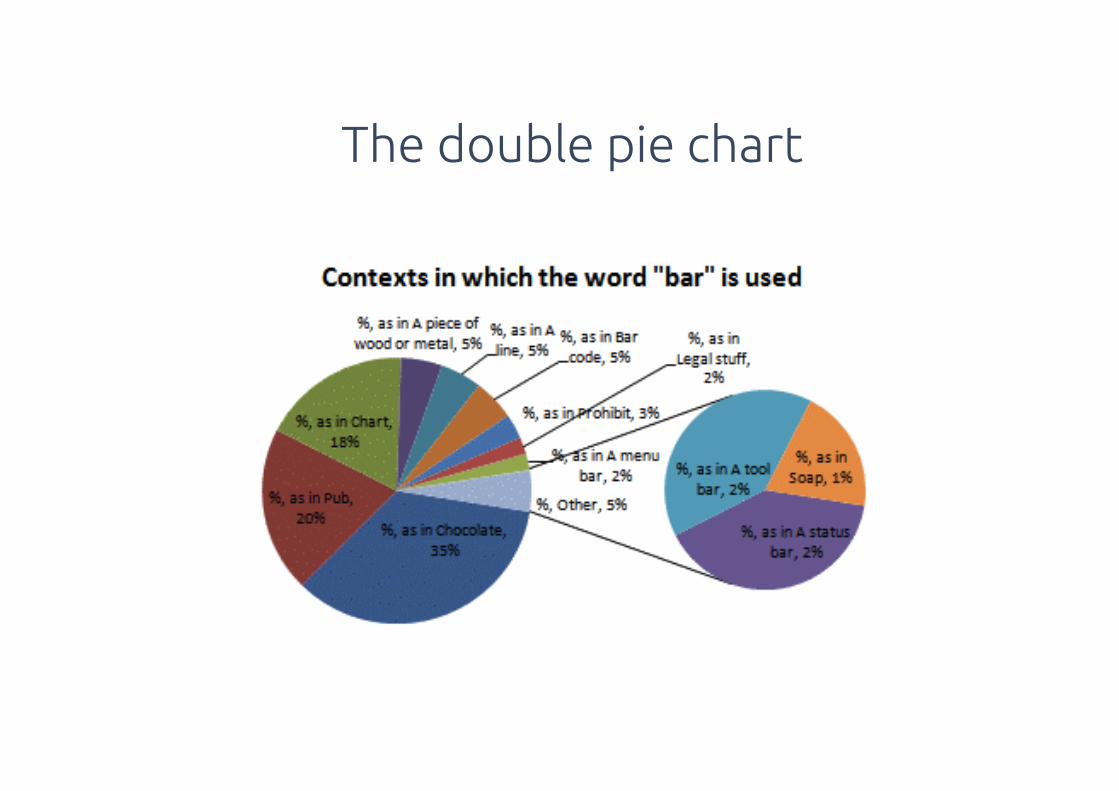
The double pie chart
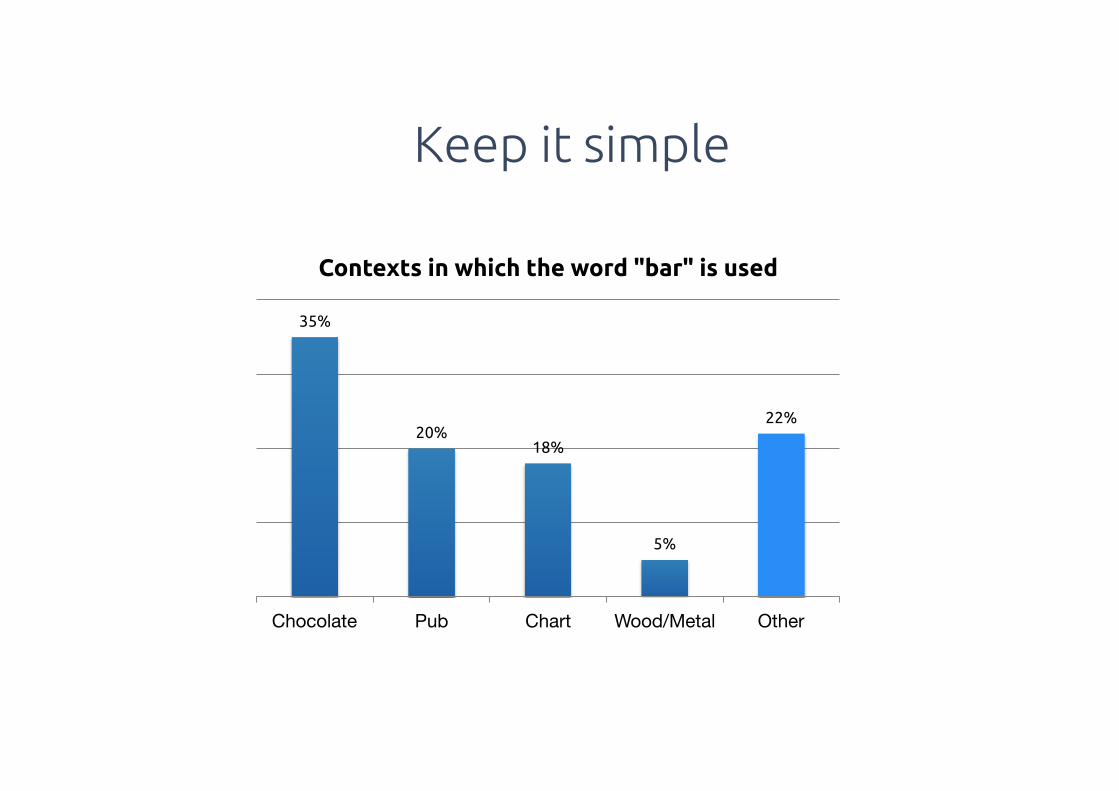
Keep it simple
35%
20%18%
5%
22%
Chocolate Pub Chart Wood/Metal Other
Contexts in which the word "bar" is used
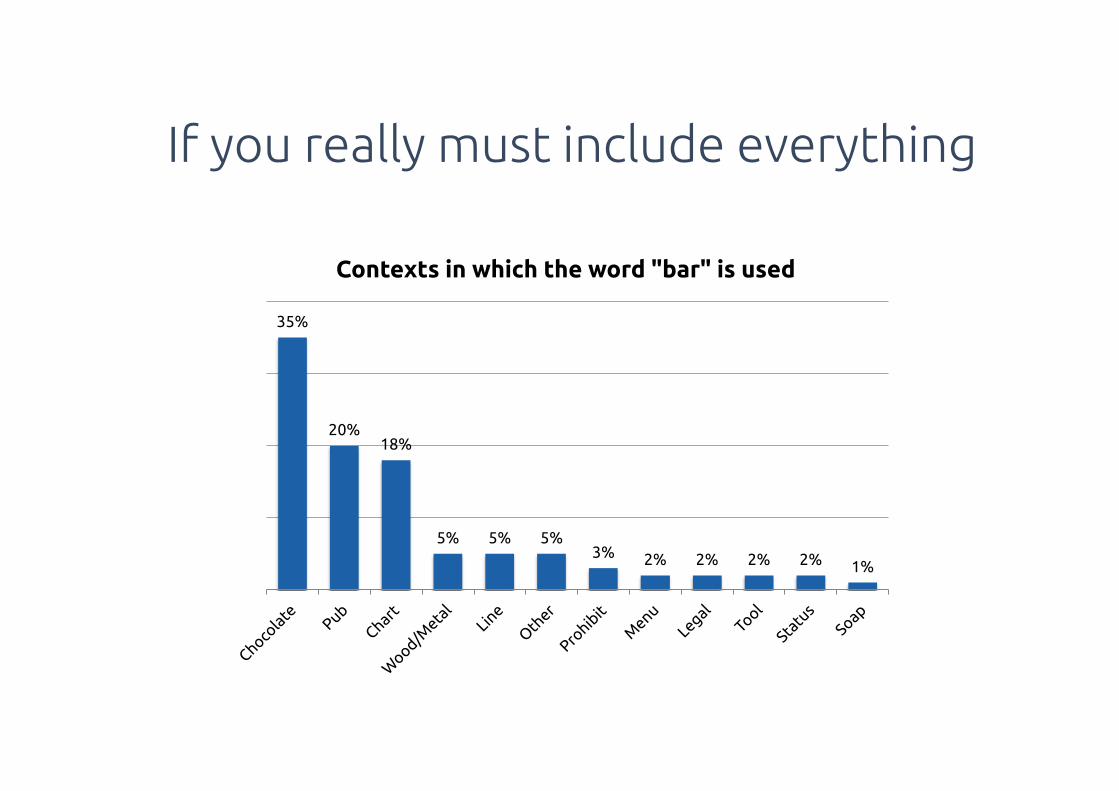
If you really must include everything
35%
20%18%
5% 5% 5%3% 2% 2% 2% 2% 1%
Contexts in which the word "bar" is used

There’s simple ways to do it
35%
20%
18%
5%
5%
5%
3%
2%
2%
2%
2%
1%
Chocolate
Pub
Chart
Wood/Metal
Line
Other
Prohibit
Menu
Legal
Tool
Status
Soap
Contexts in which the word "bar" is used
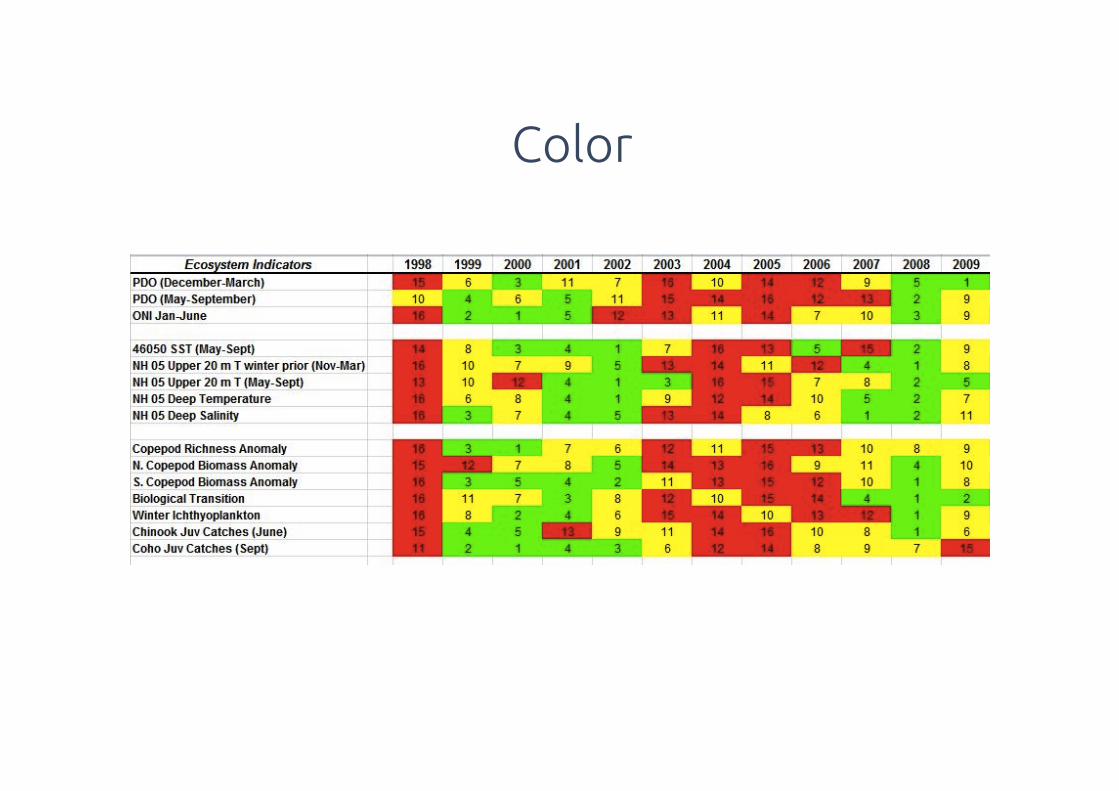
Color
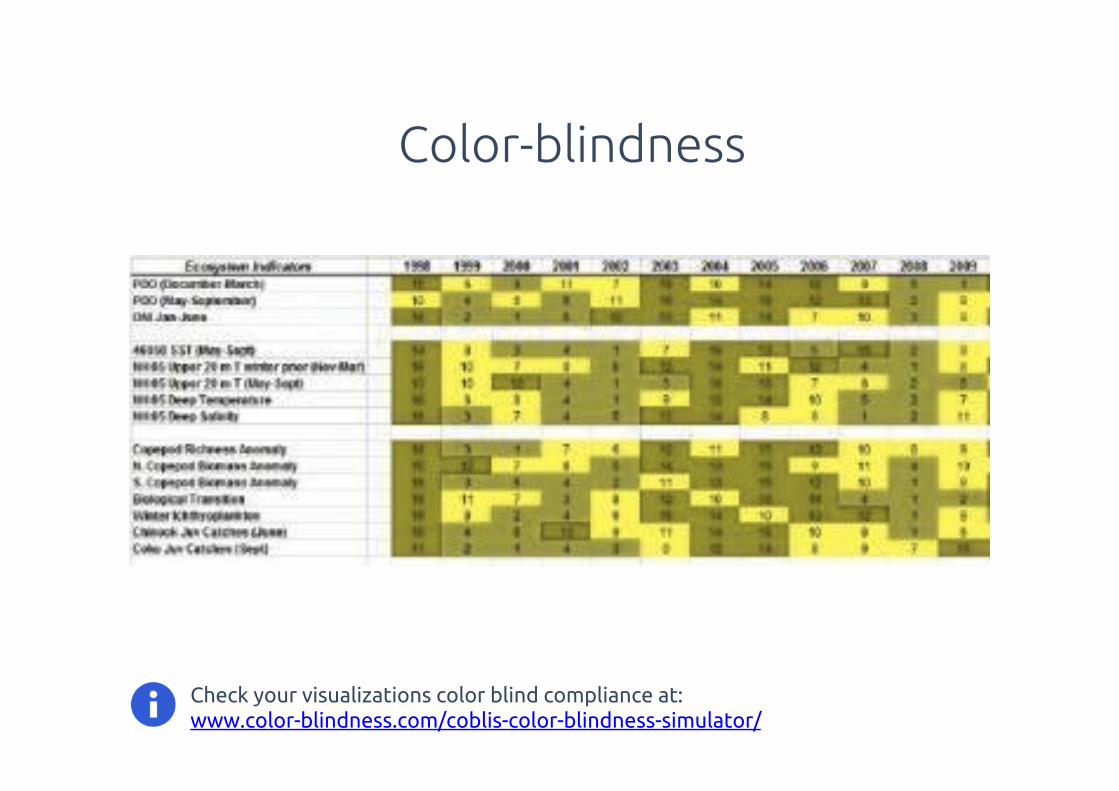
Check your visualizations color blind compliance at: www.color-blindness.com/coblis-color-blindness-simulator/
Color-blindness
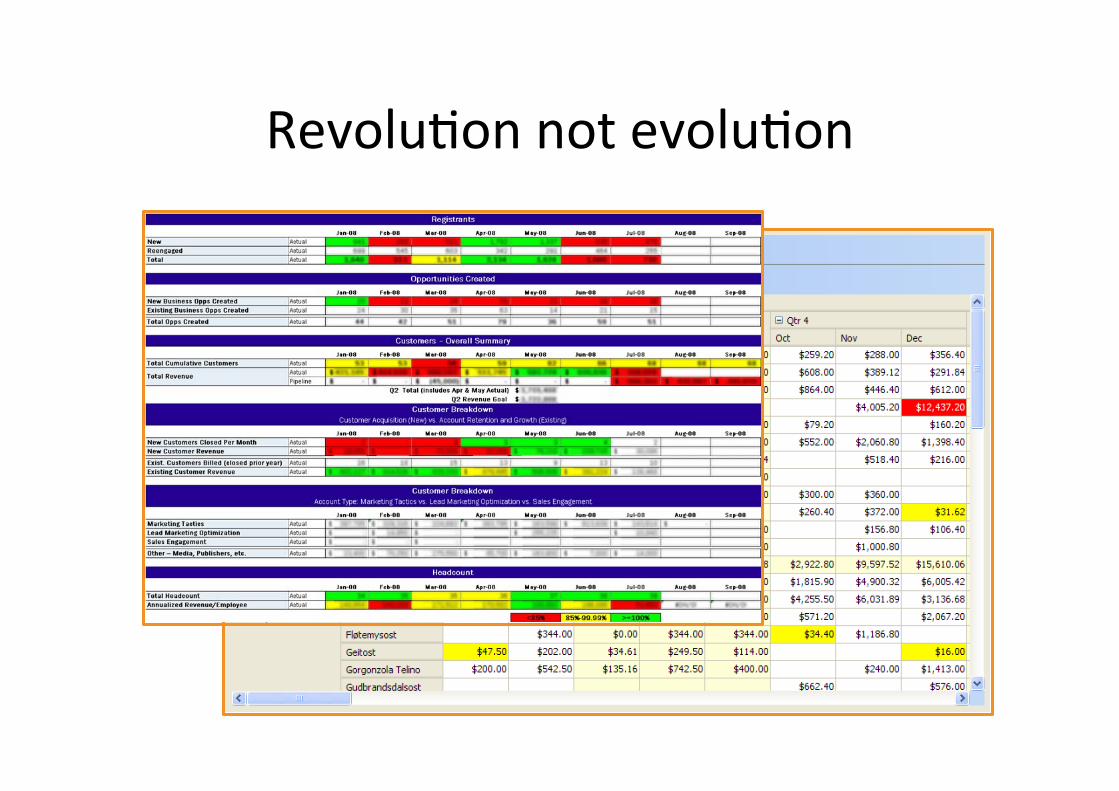
RevoluHon!not!evoluHon!

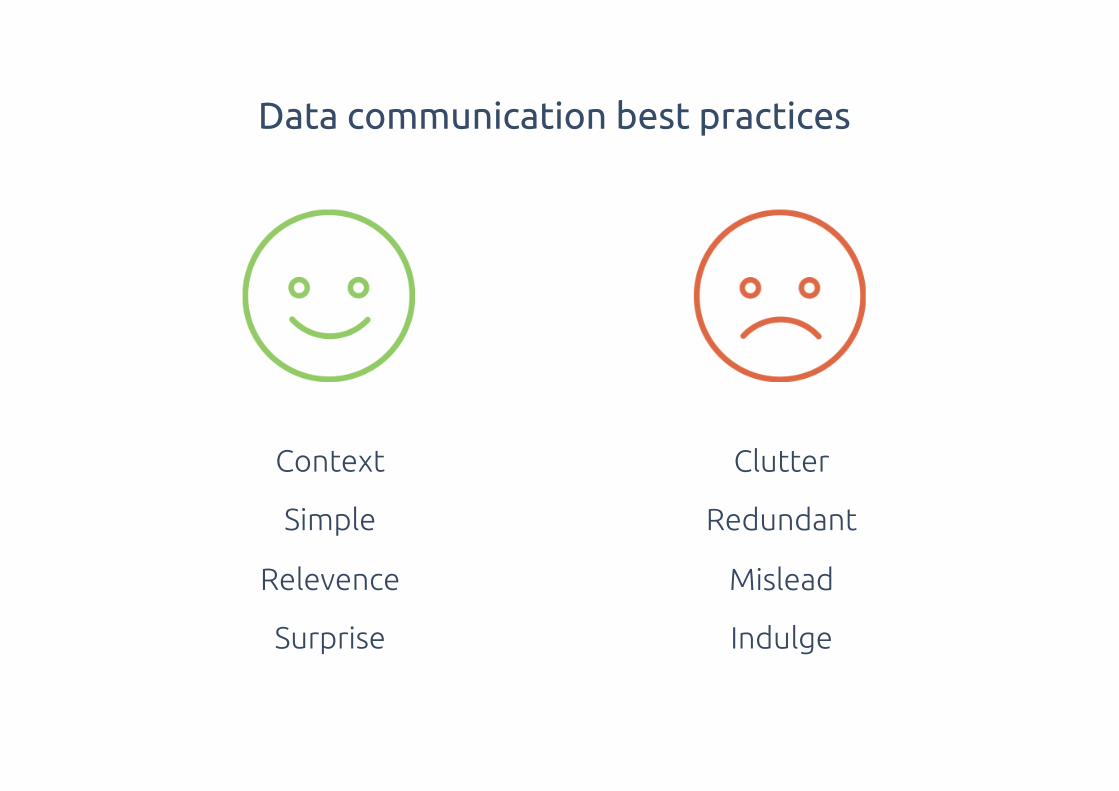
Context
Simple
Relevence
Surprise
Clutter
Redundant
Mislead
Indulge
Data communication best practices
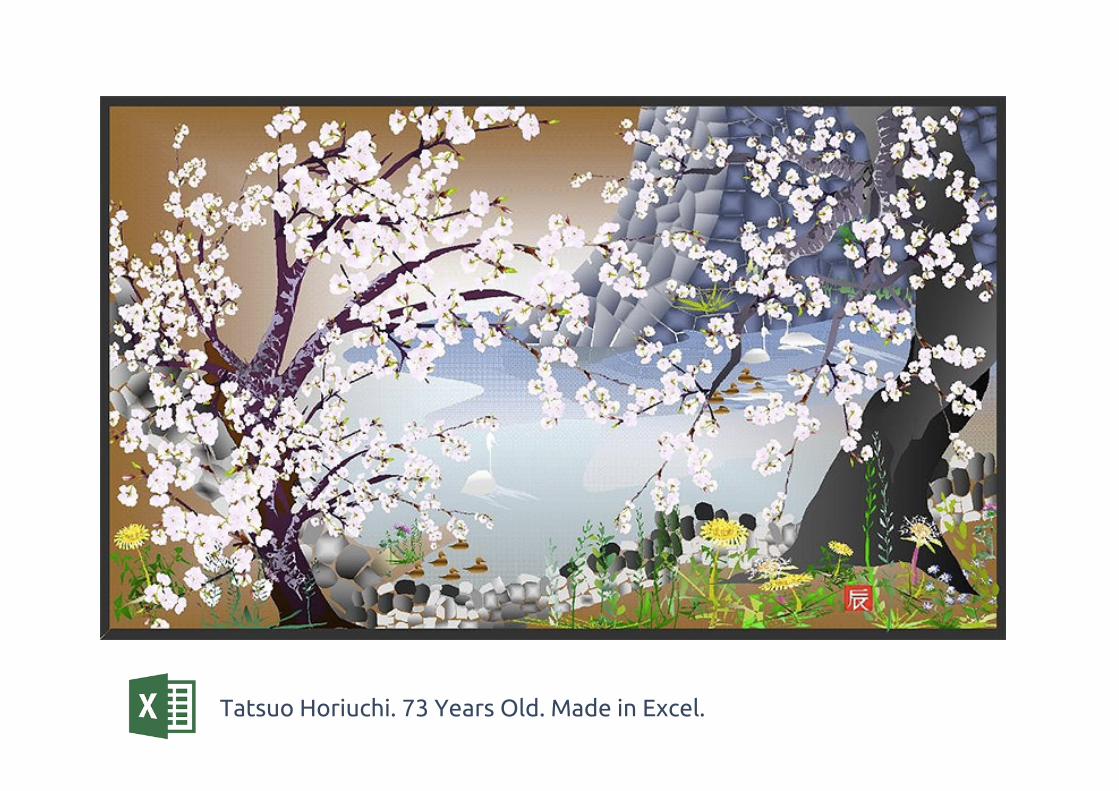
Tatsuo Horiuchi. 73 Years Old. Made in Excel.
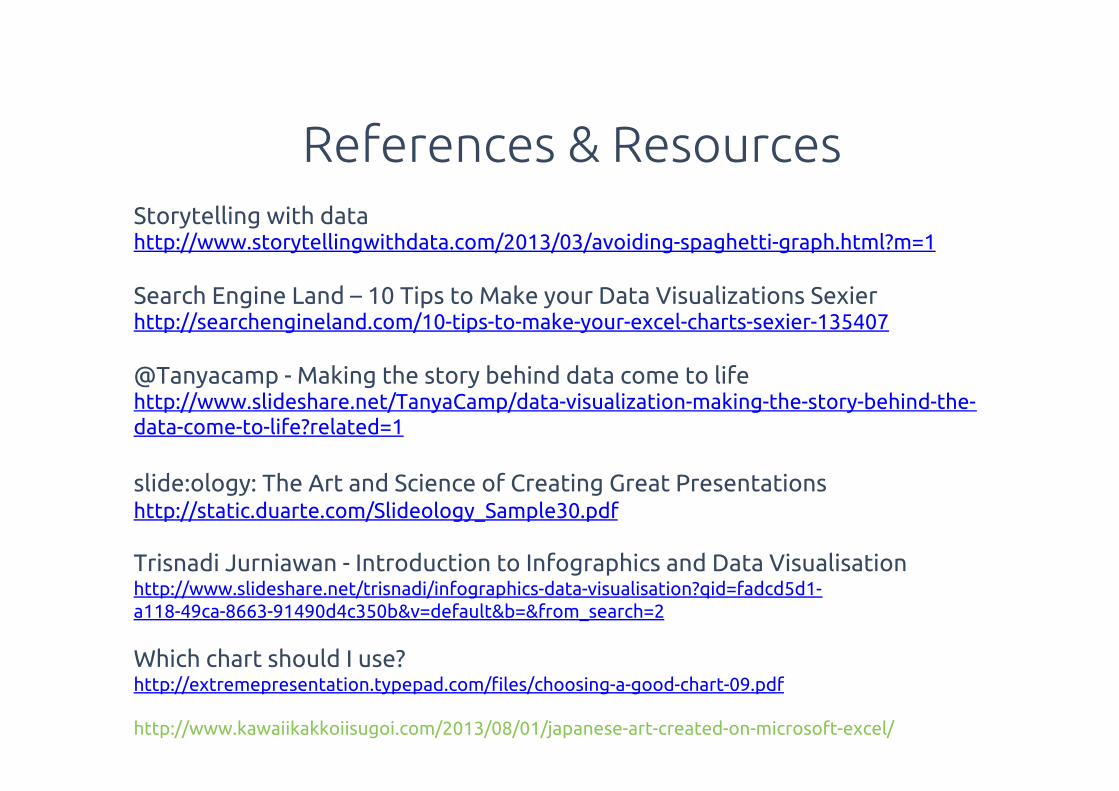
Storytelling with data http://www.storytellingwithdata.com/2013/03/avoiding-spaghetti-graph.html?m=1
Search Engine Land – 10 Tips to Make your Data Visualizations Sexierhttp://searchengineland.com/10-tips-to-make-your-excel-charts-sexier-135407
@Tanyacamp - Making the story behind data come to life http://www.slideshare.net/TanyaCamp/data-visualization-making-the-story-behind-the-data-come-to-life?related=1
slide:ology: The Art and Science of Creating Great Presentationshttp://static.duarte.com/Slideology_Sample30.pdf
Trisnadi Jurniawan - Introduction to Infographics and Data Visualisationhttp://www.slideshare.net/trisnadi/infographics-data-visualisation?qid=fadcd5d1-a118-49ca-8663-91490d4c350b&v=default&b=&from_search=2
Which chart should I use? http://extremepresentation.typepad.com/!les/choosing-a-good-chart-09.pdf
http://www.kawaiikakkoiisugoi.com/2013/08/01/japanese-art-created-on-microsoft-excel/
References & Resources


