ER&L 2015:
Best UX Practices of Libraries
with Exceptionally High Mobile Usage
February 23, 2015
Megan Hurst, MLIS
Director, EBSCO SaaS Product Management
Research Workflow / EDS + EBSCOhost Platforms
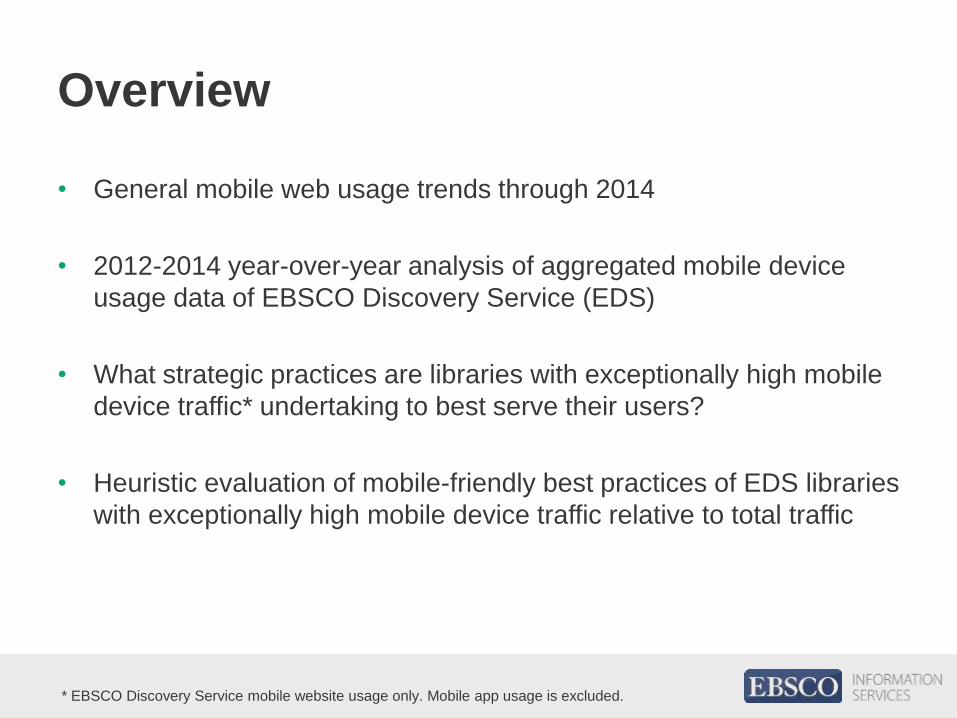
Overview
• General mobile web usage trends through 2014
• 2012-2014 year-over-year analysis of aggregated mobile device
usage data of EBSCO Discovery Service (EDS)
• What strategic practices are libraries with exceptionally high mobile
device traffic* undertaking to best serve their users?
• Heuristic evaluation of mobile-friendly best practices of EDS libraries
with exceptionally high mobile device traffic relative to total traffic
* EBSCO Discovery Service mobile website usage only. Mobile app usage is excluded.
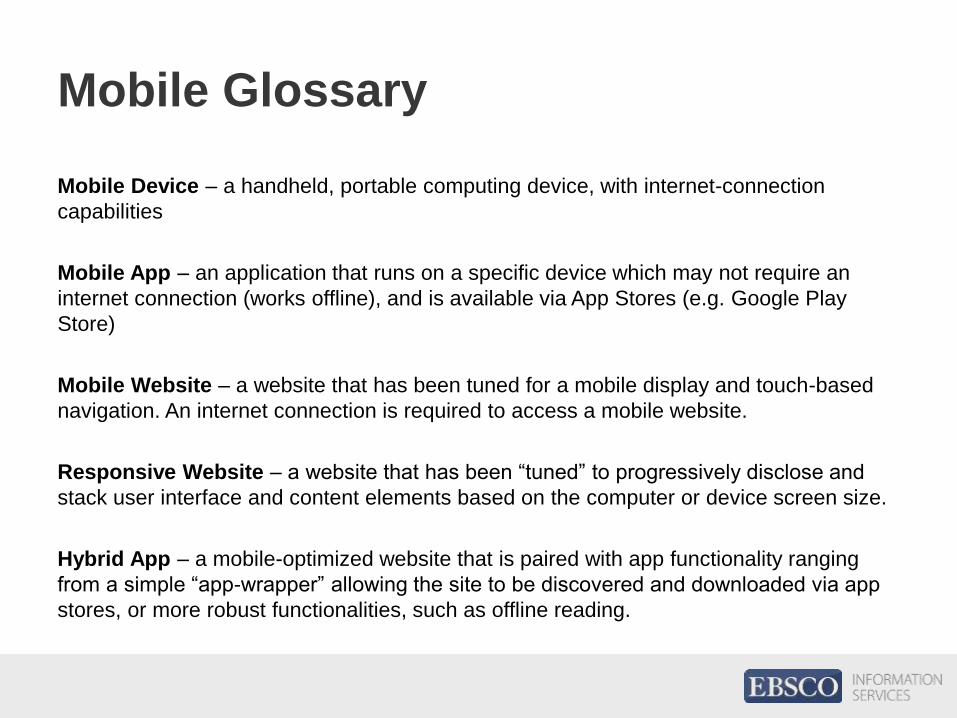
Mobile Glossary
Mobile Device – a handheld, portable computing device, with internet-connection
capabilities
Mobile App – an application that runs on a specific device which may not require an
internet connection (works offline), and is available via App Stores (e.g. Google Play
Store)
Mobile Website – a website that has been tuned for a mobile display and touch-based
navigation. An internet connection is required to access a mobile website.
Responsive Website – a website that has been “tuned” to progressively disclose and
stack user interface and content elements based on the computer or device screen size.
Hybrid App – a mobile-optimized website that is paired with app functionality ranging
from a simple “app-wrapper” allowing the site to be discovered and downloaded via app
stores, or more robust functionalities, such as offline reading.
Mobile Experience Influences
Mobile Usage
How many devices
do you have with you
right now?
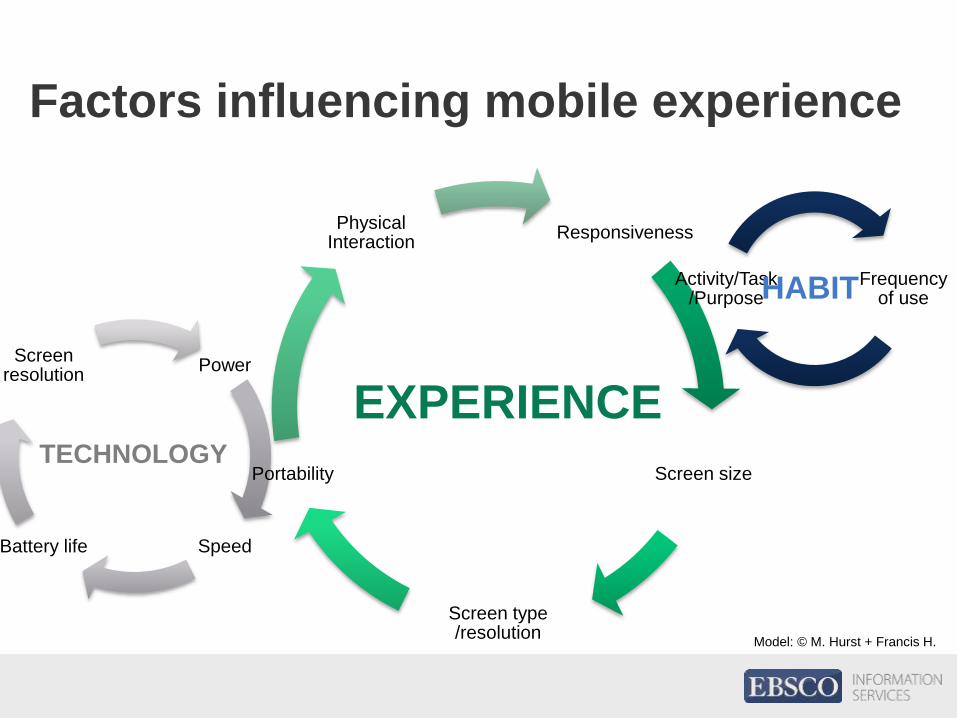
Power
SpeedBattery life
Screen resolution
Responsiveness
Screen size
Screen type /resolution
Portability
Physical Interaction
Factors influencing mobile experience
Frequency of use
Activity/Task/PurposeHABIT
EXPERIENCETECHNOLOGY
Model: © M. Hurst + Francis H.
General mobile web usage trends
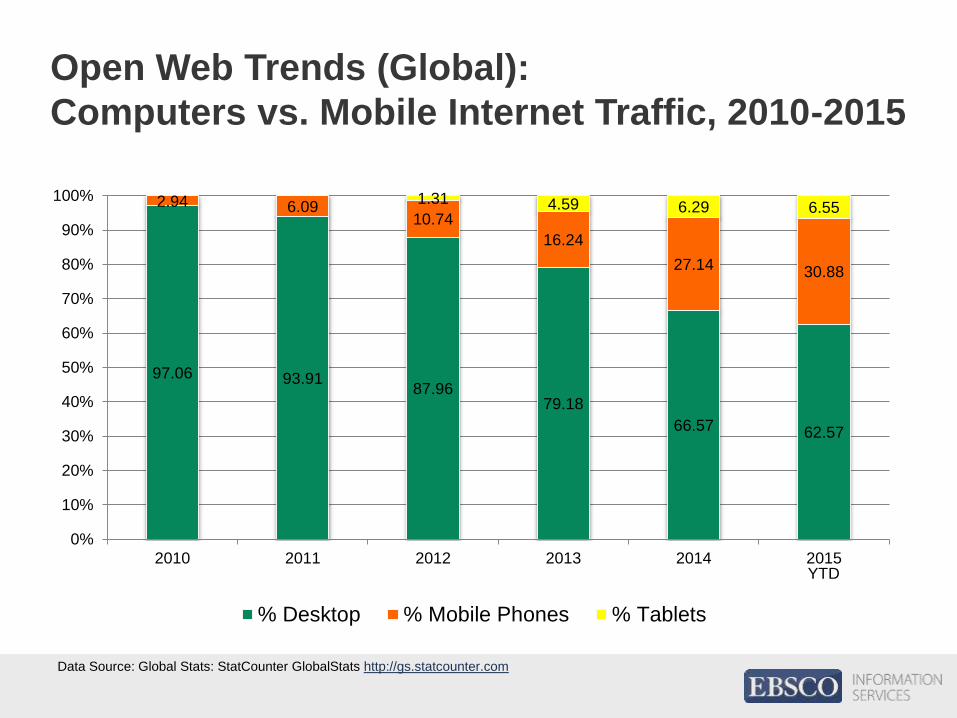
Open Web Trends (Global):
Computers vs. Mobile Internet Traffic, 2010-2015
Data Source: Global Stats: StatCounter GlobalStats http://gs.statcounter.com
97.06 93.9187.96
79.18
66.57 62.57
2.94 6.0910.74
16.24
27.14 30.88
1.31 4.59 6.29 6.55
0%
10%
20%
30%
40%
50%
60%
70%
80%
90%
100%
2010 2011 2012 2013 2014 2015
% Desktop % Mobile Phones % Tablets
YTD
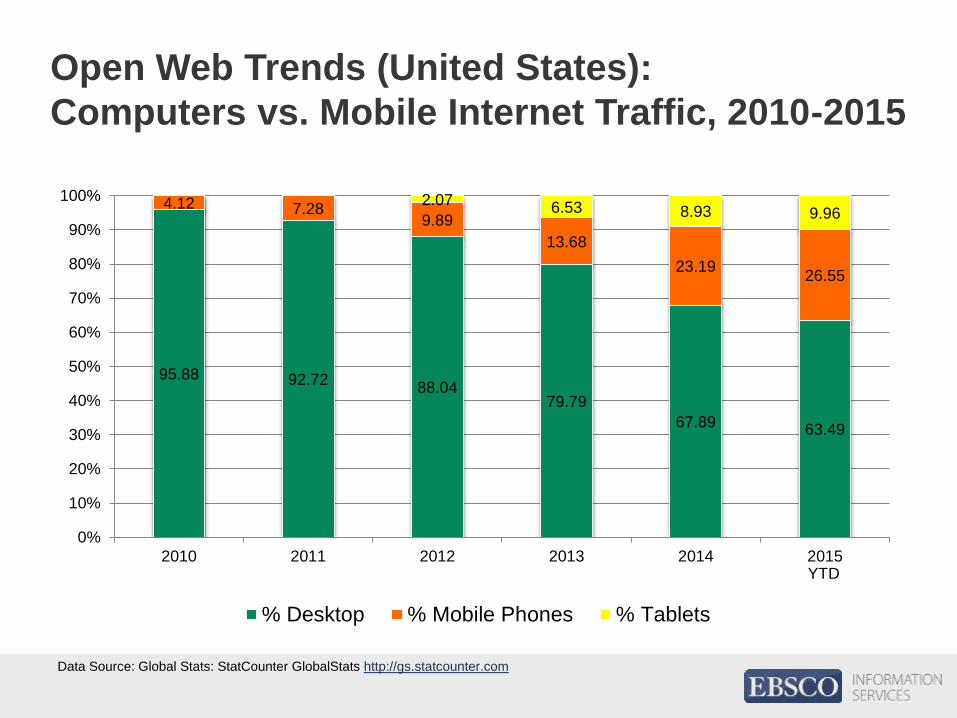
Open Web Trends (United States):
Computers vs. Mobile Internet Traffic, 2010-2015
Data Source: Global Stats: StatCounter GlobalStats http://gs.statcounter.com
95.88 92.7288.04
79.79
67.8963.49
4.12 7.289.89
13.68
23.1926.55
2.076.53 8.93 9.96
0%
10%
20%
30%
40%
50%
60%
70%
80%
90%
100%
2010 2011 2012 2013 2014 2015
% Desktop % Mobile Phones % Tablets
YTD
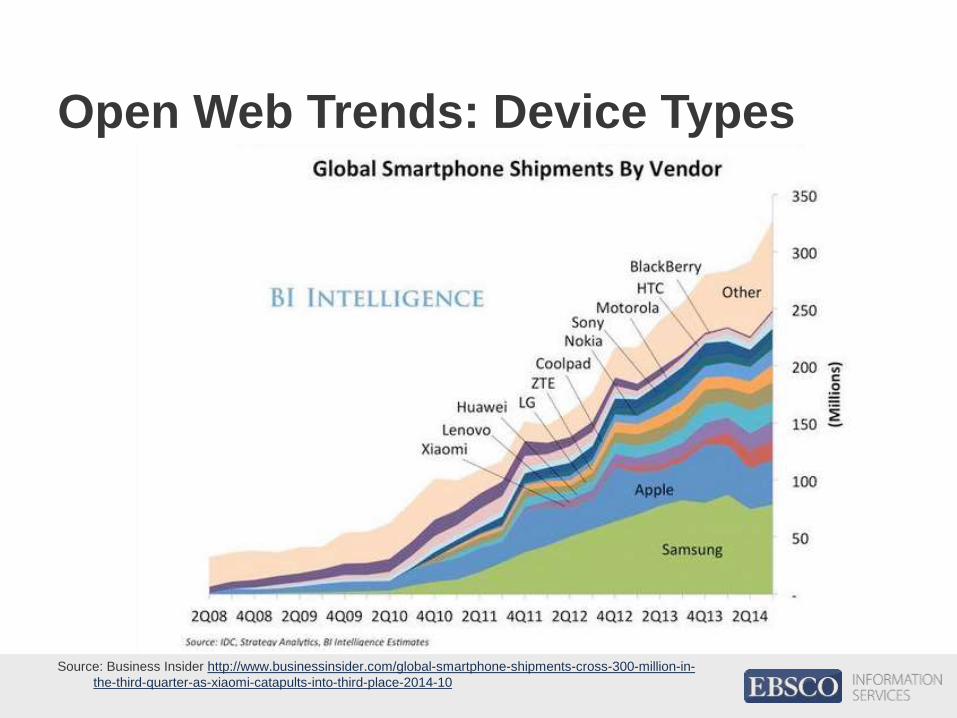
Open Web Trends: Device Types
Source: Business Insider http://www.businessinsider.com/global-smartphone-shipments-cross-300-million-in-
the-third-quarter-as-xiaomi-catapults-into-third-place-2014-10
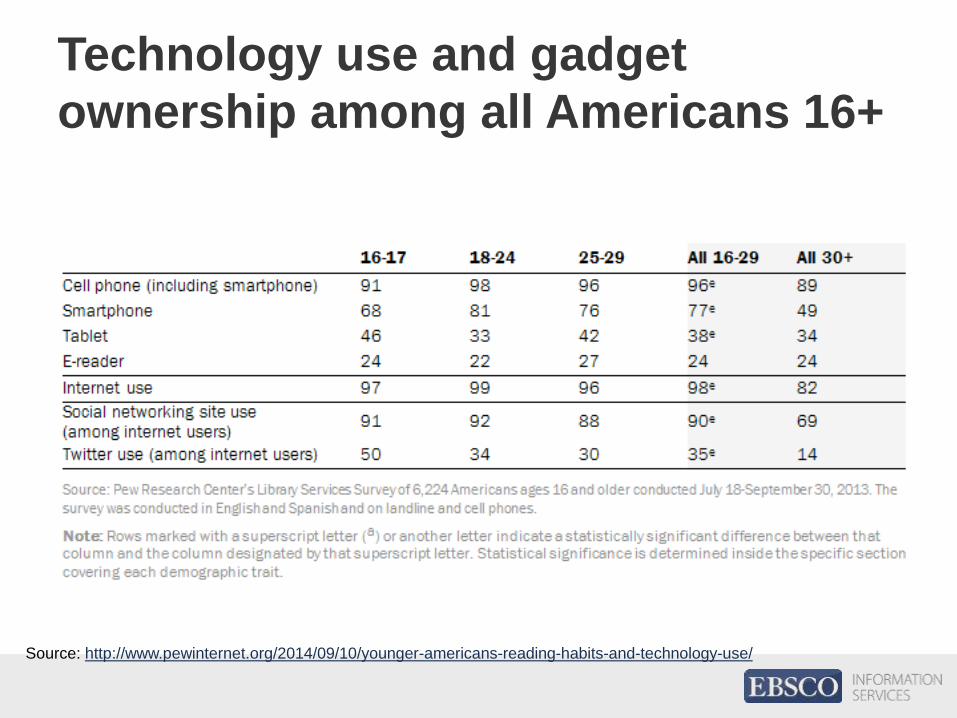
Technology use and gadget
ownership among all Americans 16+
Source: http://www.pewinternet.org/2014/09/10/younger-americans-reading-habits-and-technology-use/
EBSCO Discovery Service
mobile website statistics
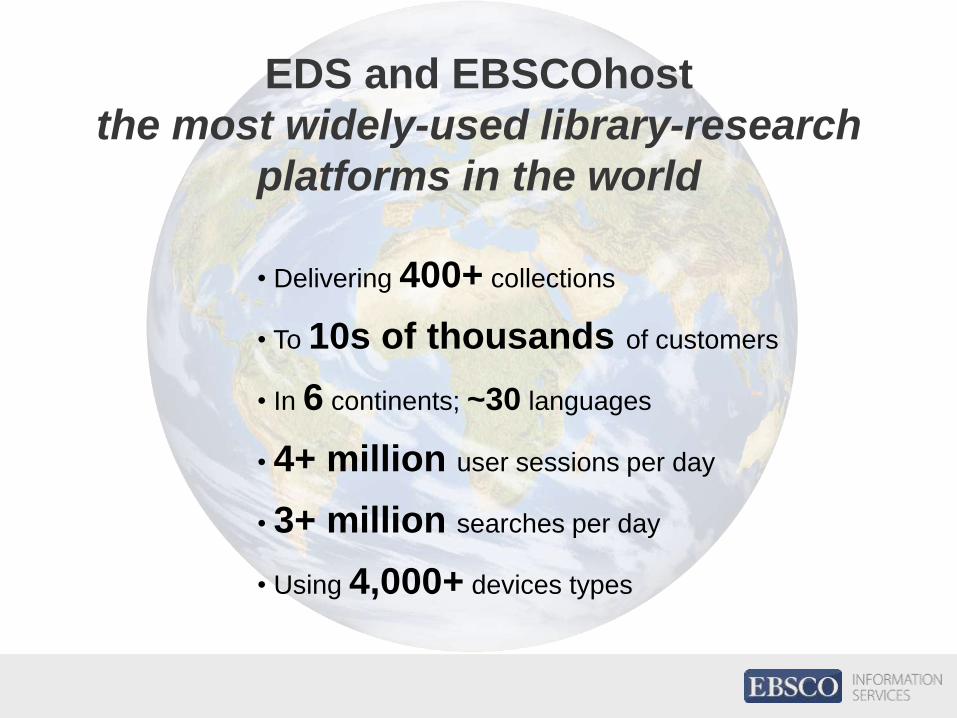
EDS and EBSCOhost
the most widely-used library-research
platforms in the world
• Delivering 400+ collections
• To 10s of thousands of customers
• In 6 continents; ~30 languages
• 4+ million user sessions per day
• 3+ million searches per day
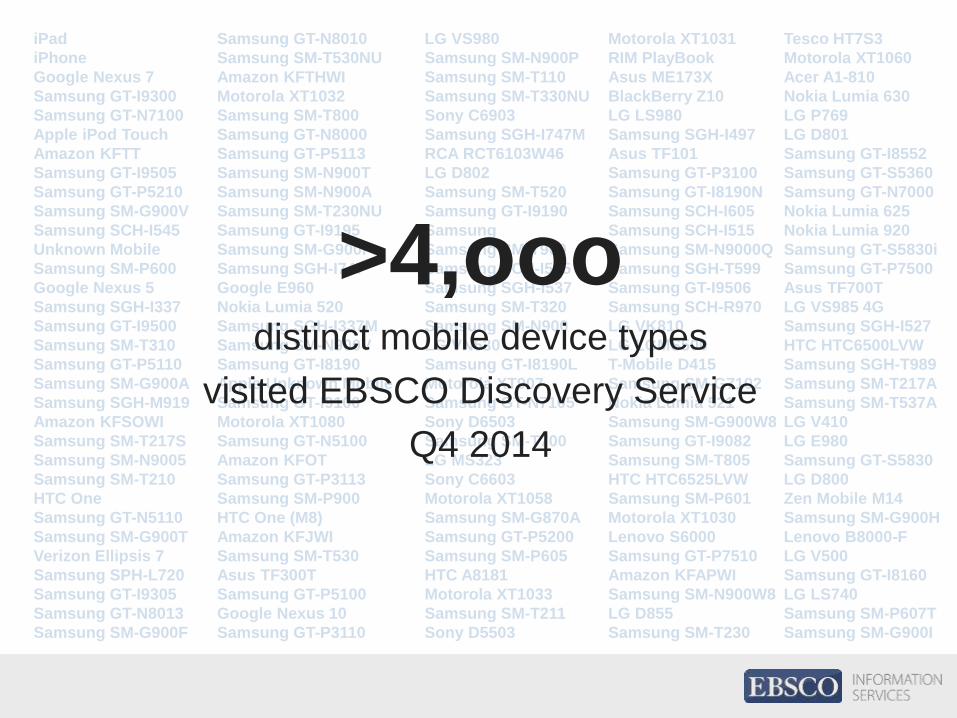
• Using 4,000+ devices types
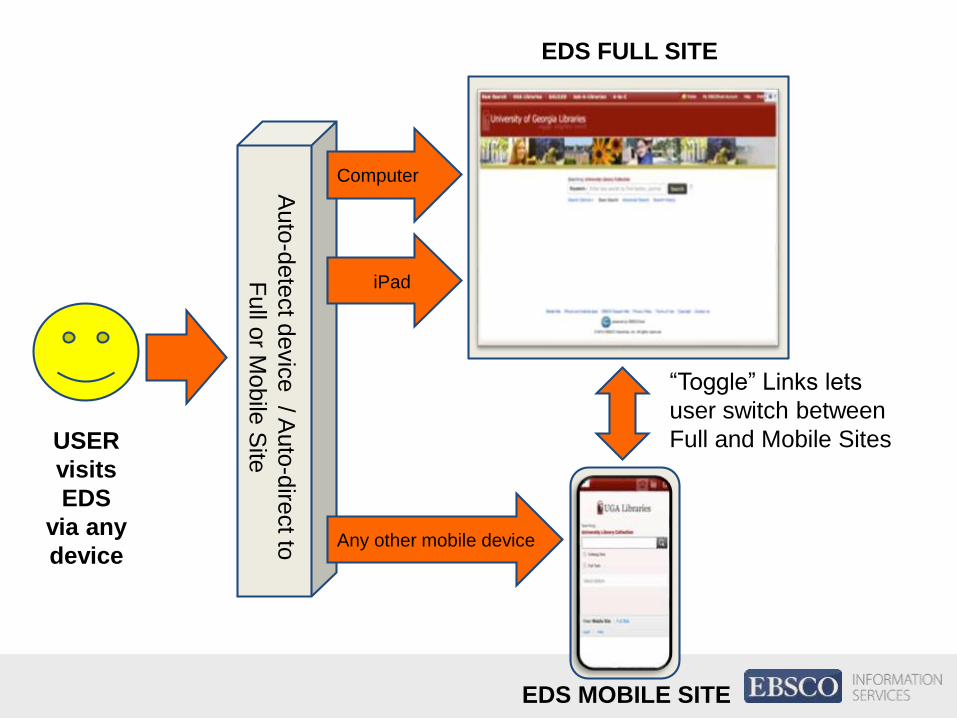
Computer
EBSCO
Discovery Service
(EDS)
FULL SITE
EDS MOBILE SITE
iPad
Any other mobile device
Auto
-dete
ct d
evic
e / A
uto
-dire
ct
to
Fu
ll or M
obile
Site
“Toggle” Links lets
user switch between
Full and Mobile Sites
EDS FULL SITE
USER
visits
EDS
via any
device
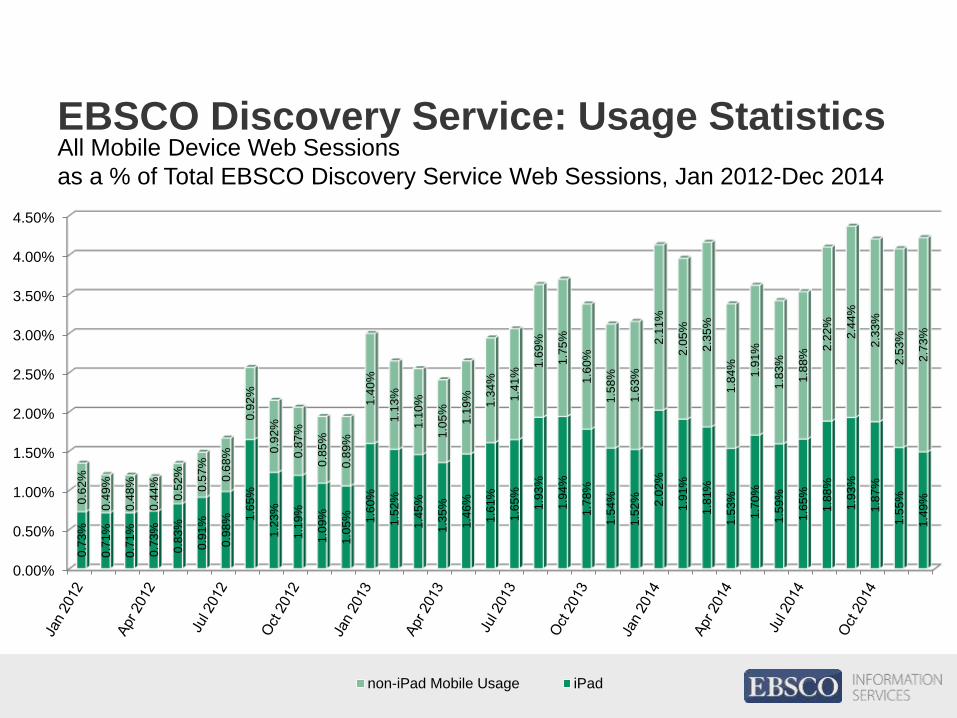
EBSCO Discovery Service: Usage StatisticsAll Mobile Device Web Sessions
as a % of Total EBSCO Discovery Service Web Sessions, Jan 2012-Dec 2014
0.00%
0.50%
1.00%
1.50%
2.00%
2.50%
3.00%
3.50%
4.00%
4.50%
0.7
3%
0.7
1%
0.7
1%
0.7
3%
0.8
3%
0.9
1%
0.9
8% 1
.65
%
1.2
3%
1.1
9%
1.0
9%
1.0
5% 1.6
0%
1.5
2%
1.4
5%
1.3
5%
1.4
6%
1.6
1%
1.6
5%
1.9
3%
1.9
4%
1.7
8%
1.5
4%
1.5
2% 2.0
2%
1.9
1%
1.8
1%
1.5
3%
1.7
0%
1.5
9%
1.6
5%
1.8
8%
1.9
3%
1.8
7%
1.5
5%
1.4
9%0.6
2%
0.4
9%
0.4
8%
0.4
4%
0.5
2%
0.5
7%
0.6
8%
0.9
2%
0.9
2%
0.8
7%
0.8
5%
0.8
9%
1.4
0%
1.1
3%
1.1
0%
1.0
5%
1.1
9%
1.3
4%
1.4
1%
1.6
9%
1.7
5%
1.6
0%
1.5
8%
1.6
3%
2.1
1%
2.0
5%
2.3
5%
1.8
4%
1.9
1%
1.8
3%
1.8
8%
2.2
2%
2.4
4%
2.3
3%
2.5
3%
2.7
3%
non-iPad Mobile Usage iPad
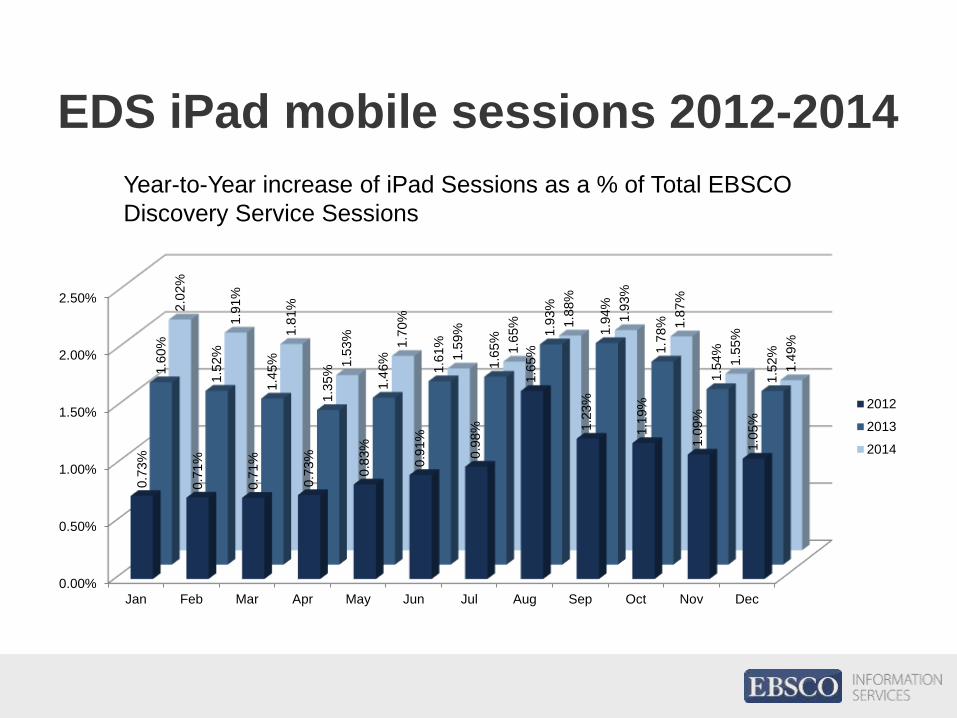
EDS iPad mobile sessions 2012-2014
0.00%
0.50%
1.00%
1.50%
2.00%
2.50%
Jan Feb Mar Apr May Jun Jul Aug Sep Oct Nov Dec
0.7
3%
0.7
1%
0.7
1%
0.7
3%
0.8
3%
0.9
1%
0.9
8%
1.6
5%
1.2
3%
1.1
9%
1.0
9%
1.0
5%
1.6
0%
1.5
2%
1.4
5%
1.3
5%
1.4
6%
1.6
1%
1.6
5%
1.9
3%
1.9
4%
1.7
8%
1.5
4%
1.5
2%
2.0
2%
1.9
1%
1.8
1%
1.5
3%
1.7
0%
1.5
9%
1.6
5% 1
.88%
1.9
3%
1.8
7%
1.5
5%
1.4
9%
2012
2013
2014
Year-to-Year increase of iPad Sessions as a % of Total EBSCO
Discovery Service Sessions
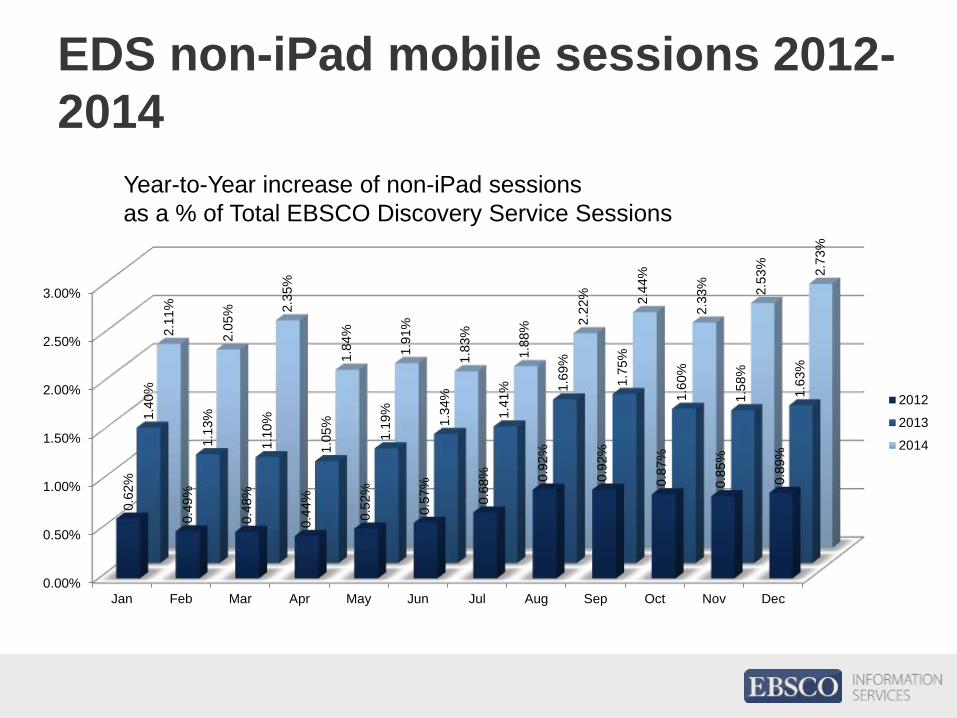
EDS non-iPad mobile sessions 2012-
2014
Year-to-Year increase of non-iPad sessions
as a % of Total EBSCO Discovery Service Sessions
0.00%
0.50%
1.00%
1.50%
2.00%
2.50%
3.00%
Jan Feb Mar Apr May Jun Jul Aug Sep Oct Nov Dec
0.6
2%
0.4
9%
0.4
8%
0.4
4%
0.5
2%
0.5
7%
0.6
8% 0.9
2%
0.9
2%
0.8
7%
0.8
5%
0.8
9%
1.4
0%
1.1
3%
1.1
0%
1.0
5%
1.1
9%
1.3
4%
1.4
1% 1
.69%
1.7
5%
1.6
0%
1.5
8%
1.6
3%
2.1
1%
2.0
5% 2
.35%
1.8
4%
1.9
1%
1.8
3%
1.8
8%
2.2
2% 2.4
4%
2.3
3% 2.5
3%
2.7
3%
2012
2013
2014
iPad
iPhone
Google Nexus 7
Samsung GT-I9300
Samsung GT-N7100
Apple iPod Touch
Amazon KFTT
Samsung GT-I9505
Samsung GT-P5210
Samsung SM-G900V
Samsung SCH-I545
Unknown Mobile
Samsung SM-P600
Google Nexus 5
Samsung SGH-I337
Samsung GT-I9500
Samsung SM-T310
Samsung GT-P5110
Samsung SM-G900A
Samsung SGH-M919
Amazon KFSOWI
Samsung SM-T217S
Samsung SM-N9005
Samsung SM-T210
HTC One
Samsung GT-N5110
Samsung SM-G900T
Verizon Ellipsis 7
Samsung SPH-L720
Samsung GT-I9305
Samsung GT-N8013
Samsung SM-G900F
Samsung GT-N8010
Samsung SM-T530NU
Amazon KFTHWI
Motorola XT1032
Samsung SM-T800
Samsung GT-N8000
Samsung GT-P5113
Samsung SM-N900T
Samsung SM-N900A
Samsung SM-T230NU
Samsung GT-I9195
Samsung SM-G900P
Samsung SGH-I747
Google E960
Nokia Lumia 520
Samsung SGH-I337M
Samsung SM-N900V
Samsung GT-I8190
Apple Unknown Mobile
Samsung GT-I9100
Motorola XT1080
Samsung GT-N5100
Amazon KFOT
Samsung GT-P3113
Samsung SM-P900
HTC One (M8)
Amazon KFJWI
Samsung SM-T530
Asus TF300T
Samsung GT-P5100
Google Nexus 10
Samsung GT-P3110
LG VS980
Samsung SM-N900P
Samsung SM-T110
Samsung SM-T330NU
Sony C6903
Samsung SGH-I747M
RCA RCT6103W46
LG D802
Samsung SM-T520
Samsung GT-I9190
Samsung
Samsung SM-T900
Samsung SCH-I535
Samsung SGH-I537
Samsung SM-T320
Samsung SM-N900
LG VN530
Samsung GT-I8190L
Motorola XT907
Samsung GT-N7105
Sony D6503
Samsung SM-T700
LG MS323
Sony C6603
Motorola XT1058
Samsung SM-G870A
Samsung GT-P5200
Samsung SM-P605
HTC A8181
Motorola XT1033
Samsung SM-T211
Sony D5503
Motorola XT1031
RIM PlayBook
Asus ME173X
BlackBerry Z10
LG LS980
Samsung SGH-I497
Asus TF101
Samsung GT-P3100
Samsung GT-I8190N
Samsung SCH-I605
Samsung SCH-I515
Samsung SM-N9000Q
Samsung SGH-T599
Samsung GT-I9506
Samsung SCH-R970
LG VK810
LG LGMS500
T-Mobile D415
Samsung SM-G7102
Nokia Lumia 521
Samsung SM-G900W8
Samsung GT-I9082
Samsung SM-T805
HTC HTC6525LVW
Samsung SM-P601
Motorola XT1030
Lenovo S6000
Samsung GT-P7510
Amazon KFAPWI
Samsung SM-N900W8
LG D855
Samsung SM-T230
>4,ooodistinct mobile device types
visited EBSCO Discovery Service
Q4 2014
Tesco HT7S3
Motorola XT1060
Acer A1-810
Nokia Lumia 630
LG P769
LG D801
Samsung GT-I8552
Samsung GT-S5360
Samsung GT-N7000
Nokia Lumia 625
Nokia Lumia 920
Samsung GT-S5830i
Samsung GT-P7500
Asus TF700T
LG VS985 4G
Samsung SGH-I527
HTC HTC6500LVW
Samsung SGH-T989
Samsung SM-T217A
Samsung SM-T537A
LG V410
LG E980
Samsung GT-S5830
LG D800
Zen Mobile M14
Samsung SM-G900H
Lenovo B8000-F
LG V500
Samsung GT-I8160
LG LS740
Samsung SM-P607T
Samsung SM-G900I
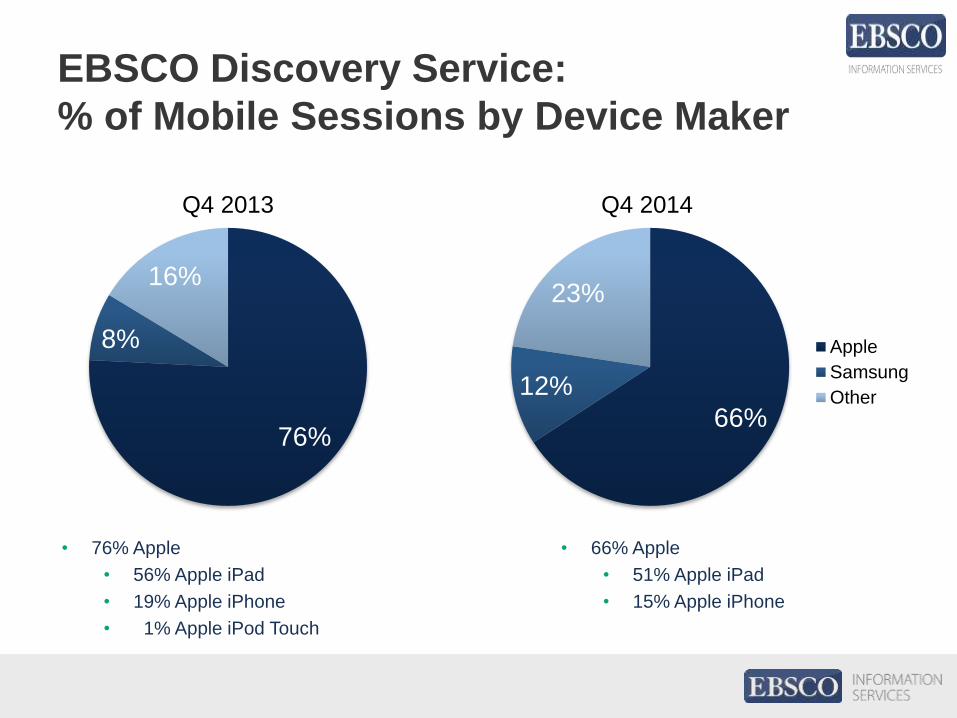
EBSCO Discovery Service:
% of Mobile Sessions by Device Maker
• 76% Apple
• 56% Apple iPad
• 19% Apple iPhone
• 1% Apple iPod Touch
76%
8%
16%
66%
12%
23%
Apple
Samsung
Other
Q4 2013 Q4 2014
• 66% Apple
• 51% Apple iPad
• 15% Apple iPhone

What does all this mean
for libraries?

Power
SpeedBattery life
Screen resolution
Responsiveness
Screen size
Screen type /resolution
Portability
Physical Interaction
Factors influencing mobile experience
Frequency of use
Activity/Task/PurposeHABIT
EXPERIENCETECHNOLOGY
Model: © M. Hurst + Francis H.
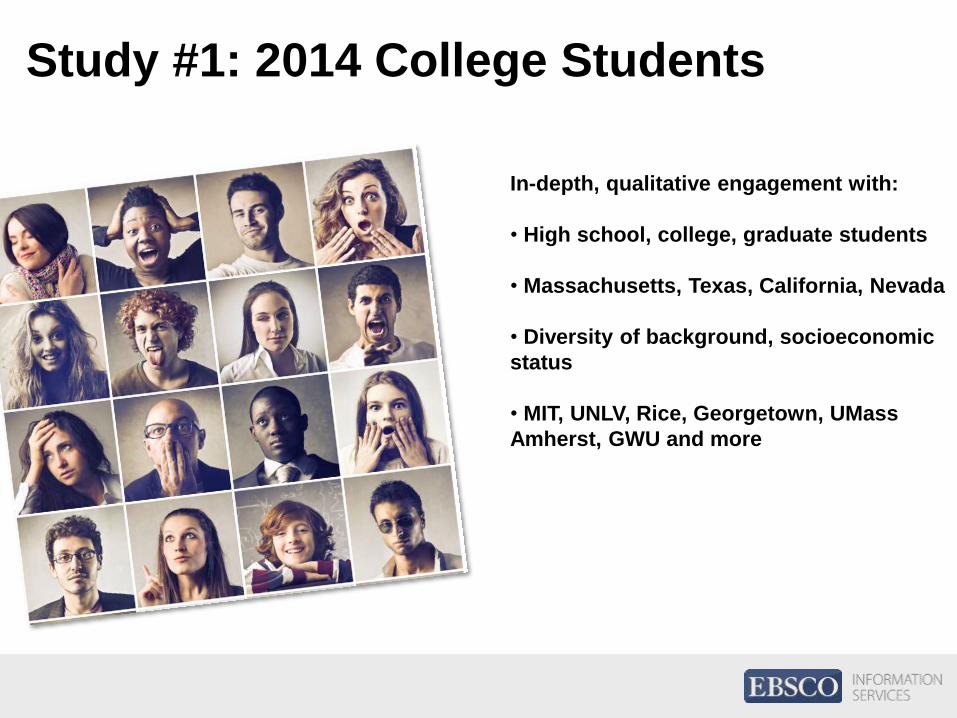
In-depth, qualitative engagement with:
• High school, college, graduate students
• Massachusetts, Texas, California, Nevada
• Diversity of background, socioeconomic
status
• MIT, UNLV, Rice, Georgetown, UMass
Amherst, GWU and more
Study #1: 2014 College Students
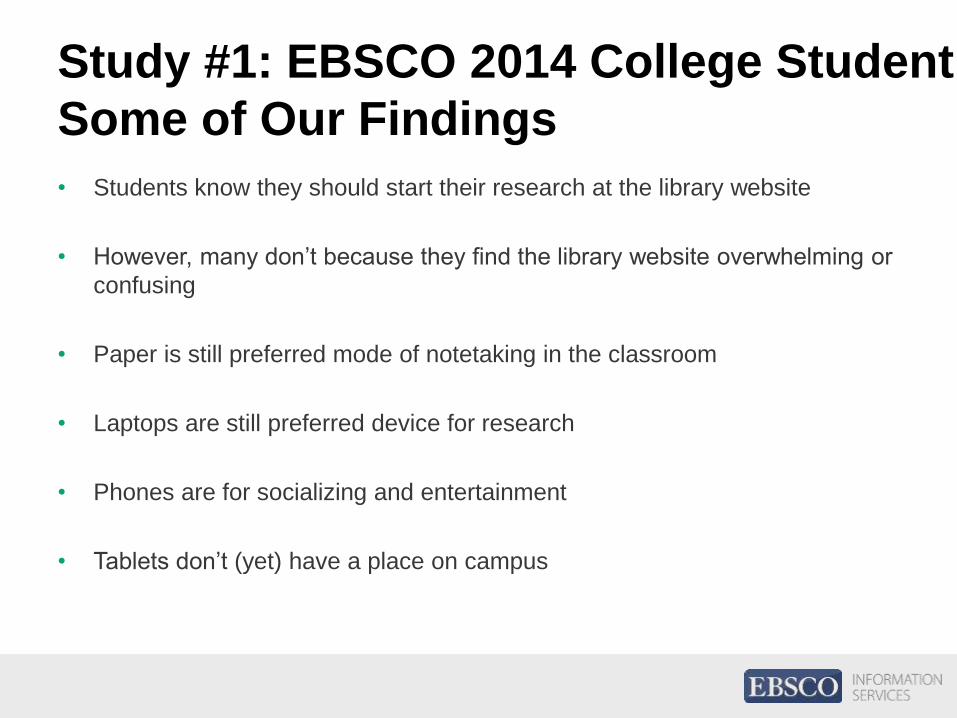
Study #1: EBSCO 2014 College Student
Some of Our Findings
• Students know they should start their research at the library website
• However, many don’t because they find the library website overwhelming or
confusing
• Paper is still preferred mode of notetaking in the classroom
• Laptops are still preferred device for research
• Phones are for socializing and entertainment
• Tablets don’t (yet) have a place on campus
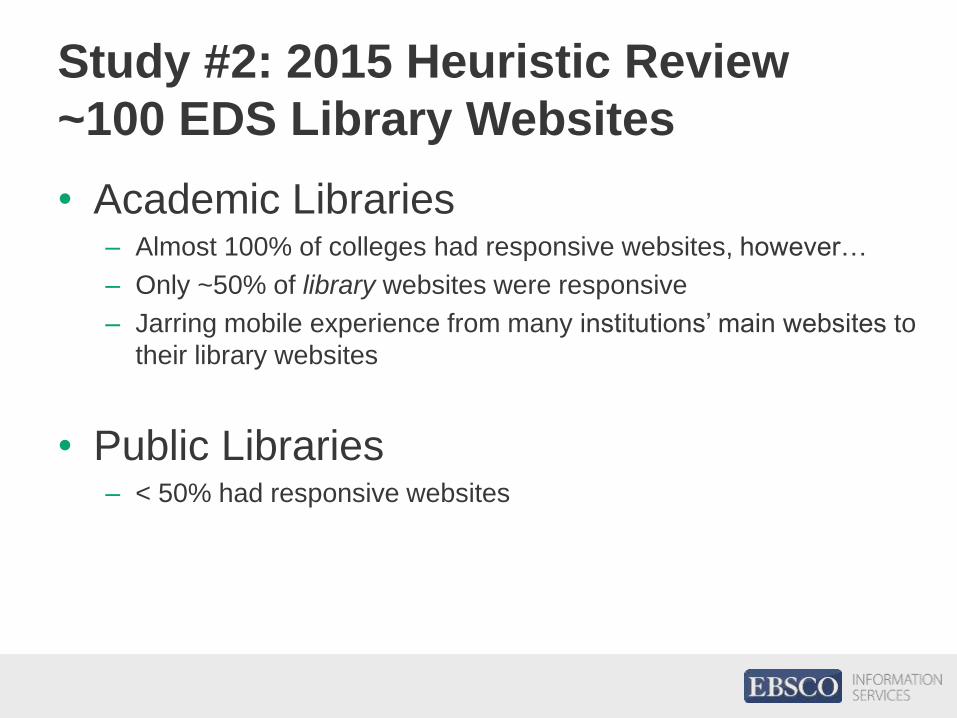
Study #2: 2015 Heuristic Review
~100 EDS Library Websites
• Academic Libraries– Almost 100% of colleges had responsive websites, however…
– Only ~50% of library websites were responsive
– Jarring mobile experience from many institutions’ main websites to
their library websites
• Public Libraries– < 50% had responsive websites
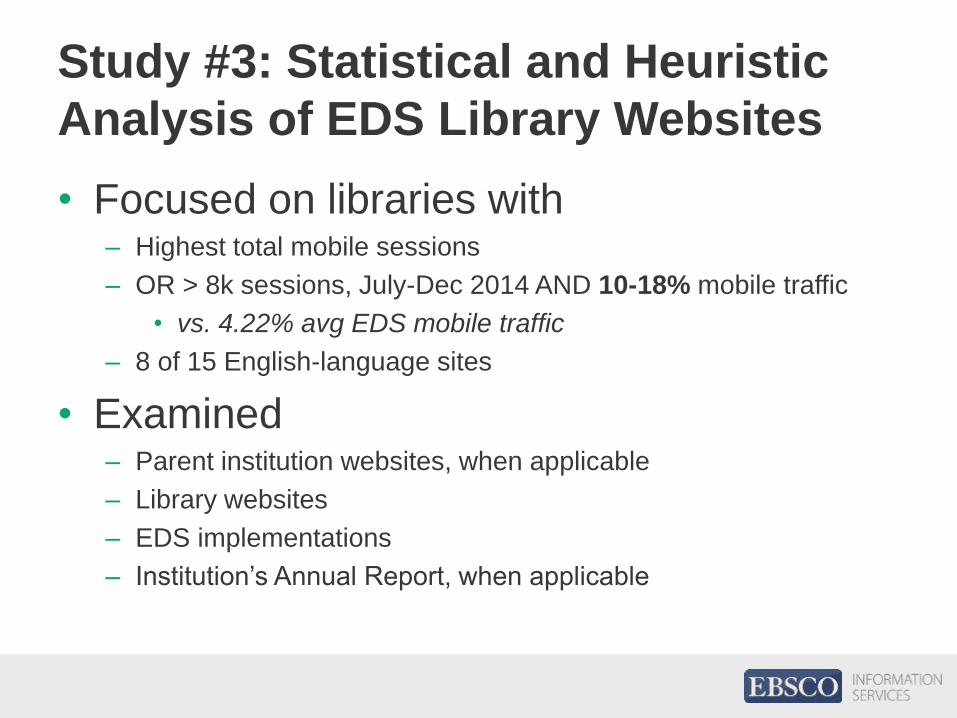
Study #3: Statistical and Heuristic
Analysis of EDS Library Websites
• Focused on libraries with– Highest total mobile sessions
– OR > 8k sessions, July-Dec 2014 AND 10-18% mobile traffic
• vs. 4.22% avg EDS mobile traffic
– 8 of 15 English-language sites
• Examined– Parent institution websites, when applicable
– Library websites
– EDS implementations
– Institution’s Annual Report, when applicable
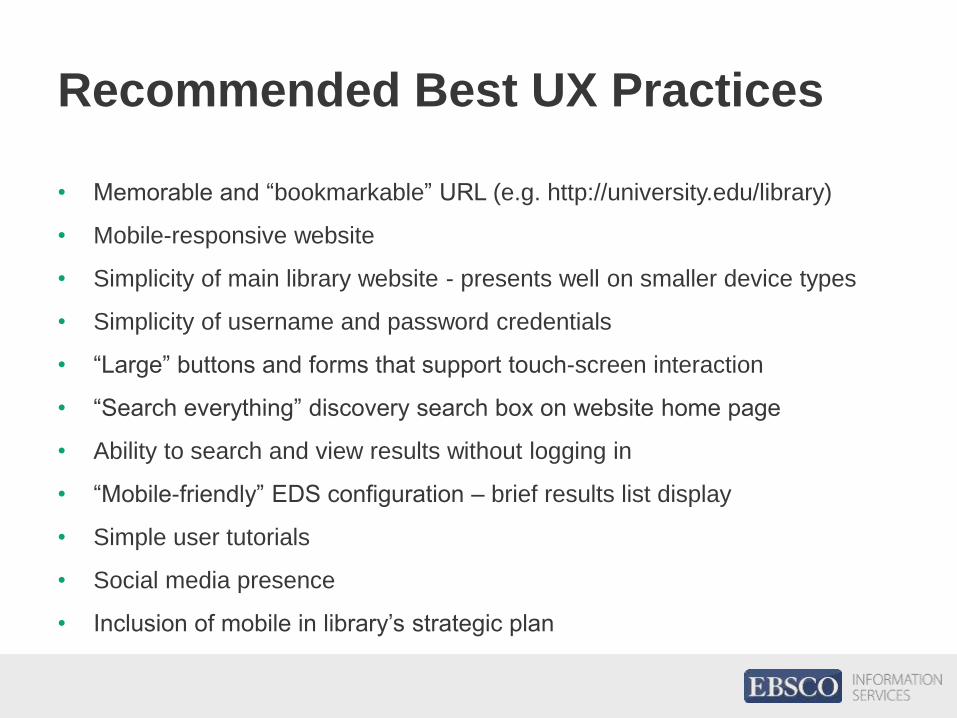
Recommended Best UX Practices
• Memorable and “bookmarkable” URL (e.g. http://university.edu/library)
• Mobile-responsive website
• Simplicity of main library website - presents well on smaller device types
• Simplicity of username and password credentials
• “Large” buttons and forms that support touch-screen interaction
• “Search everything” discovery search box on website home page
• Ability to search and view results without logging in
• “Mobile-friendly” EDS configuration – brief results list display
• Simple user tutorials
• Social media presence
• Inclusion of mobile in library’s strategic plan

Simplicity
Is Key
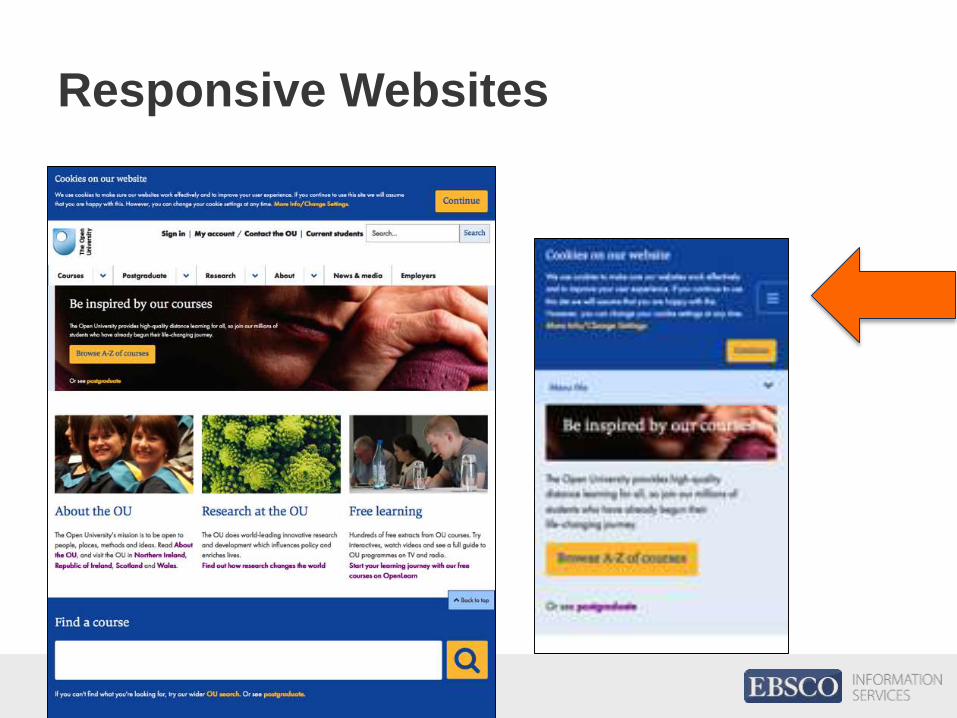
Responsive Websites
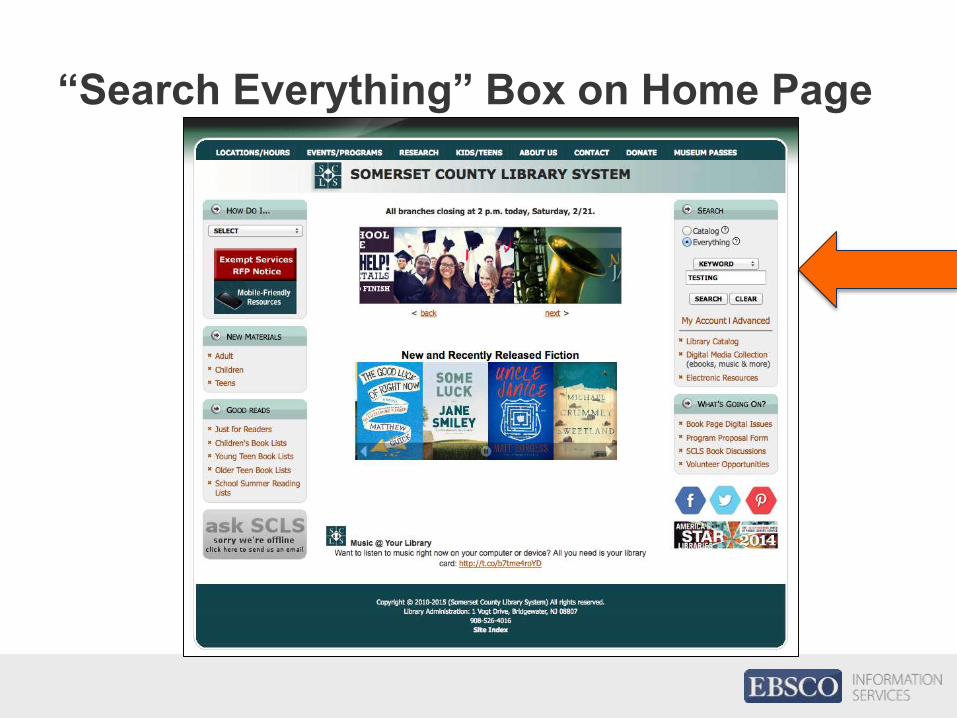
“Search Everything” Box on Home Page
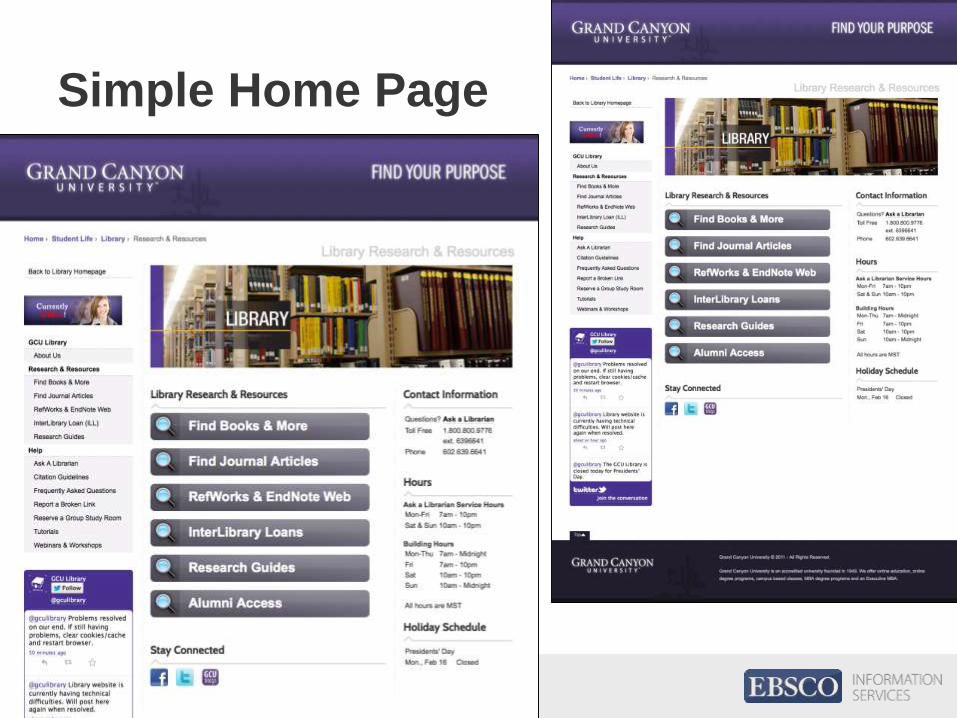
Simple Home Page
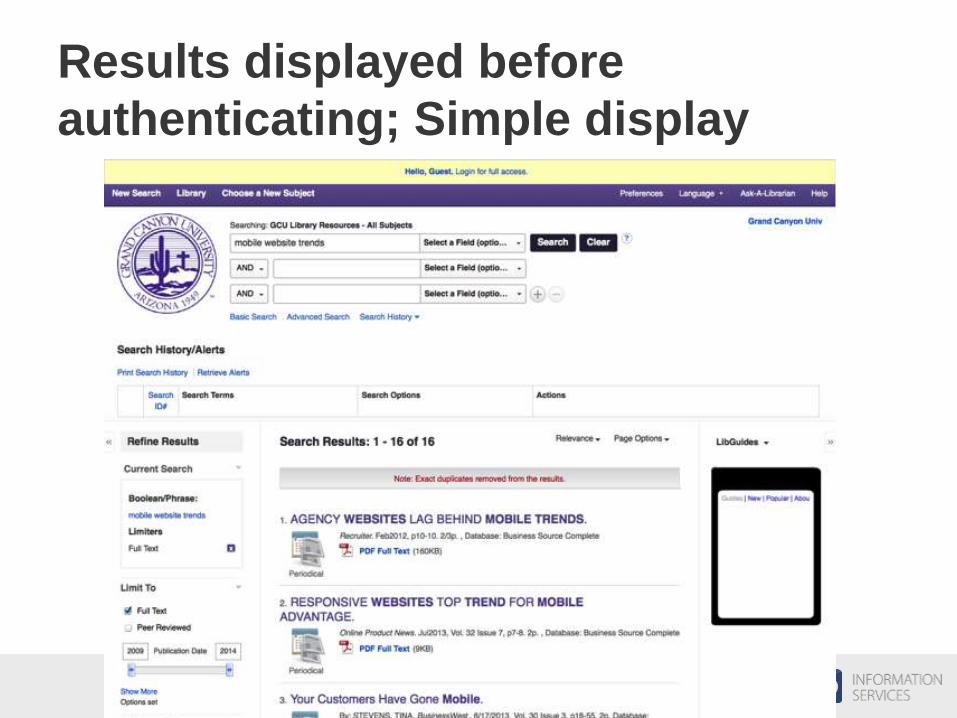
Results displayed before
authenticating; Simple display
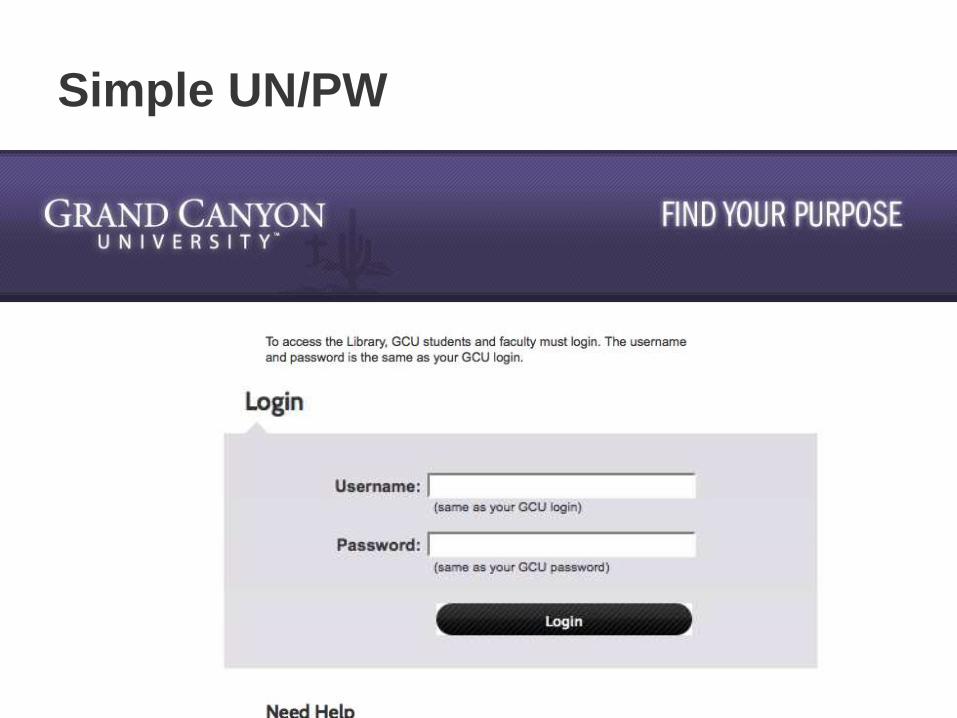
Simple UN/PW
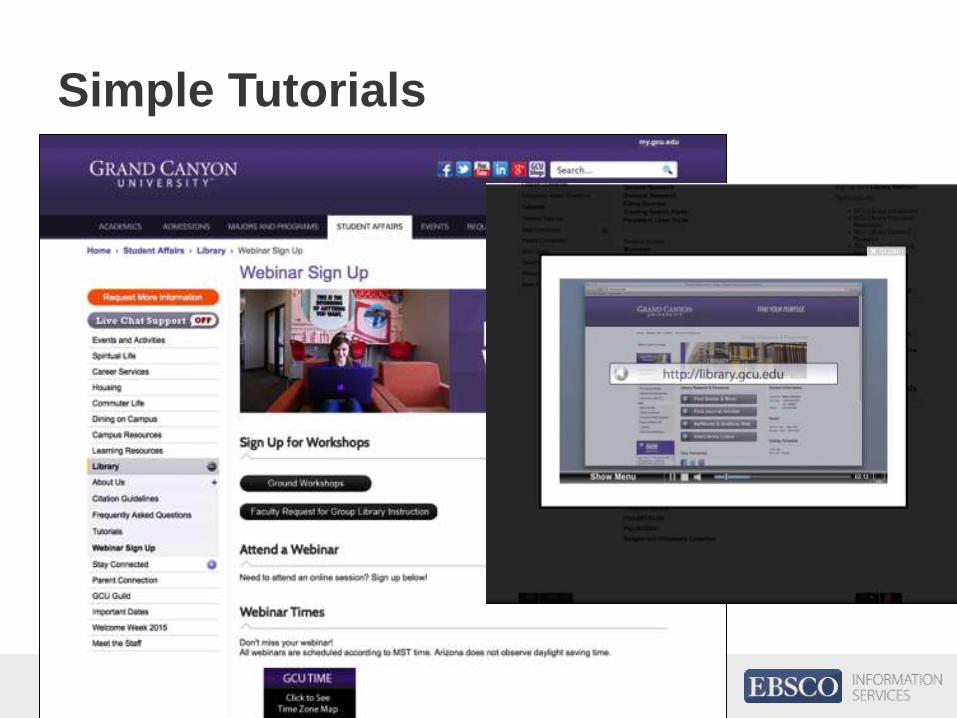
Simple Tutorials
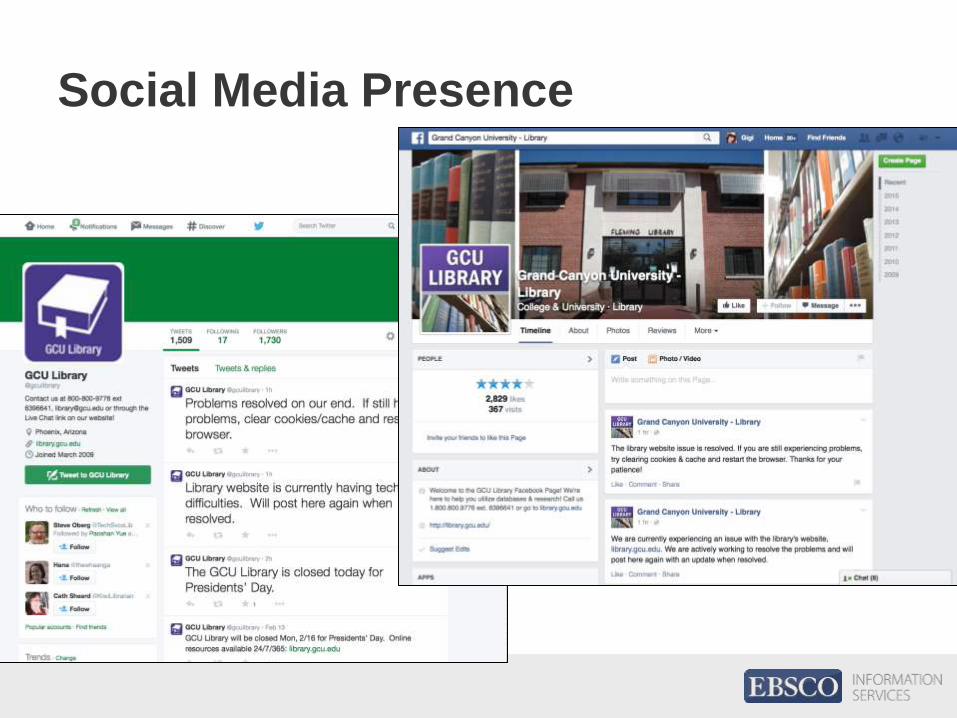
Social Media Presence

Food for Thought
From the e-Commerce/
Retail Industry
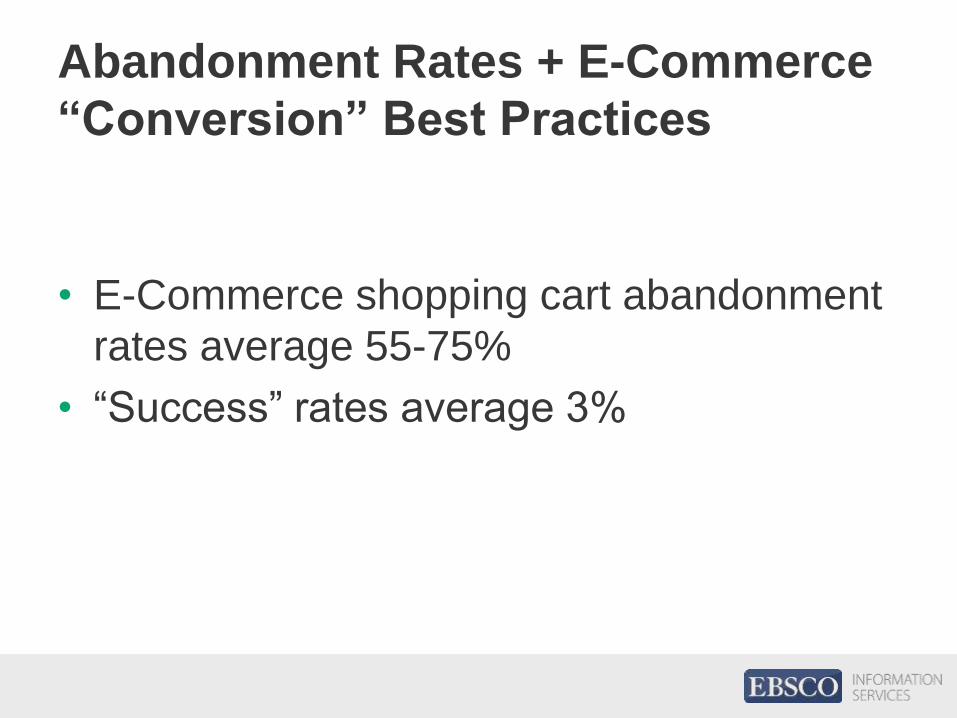
Abandonment Rates + E-Commerce
“Conversion” Best Practices
• E-Commerce shopping cart abandonment
rates average 55-75%
• “Success” rates average 3%
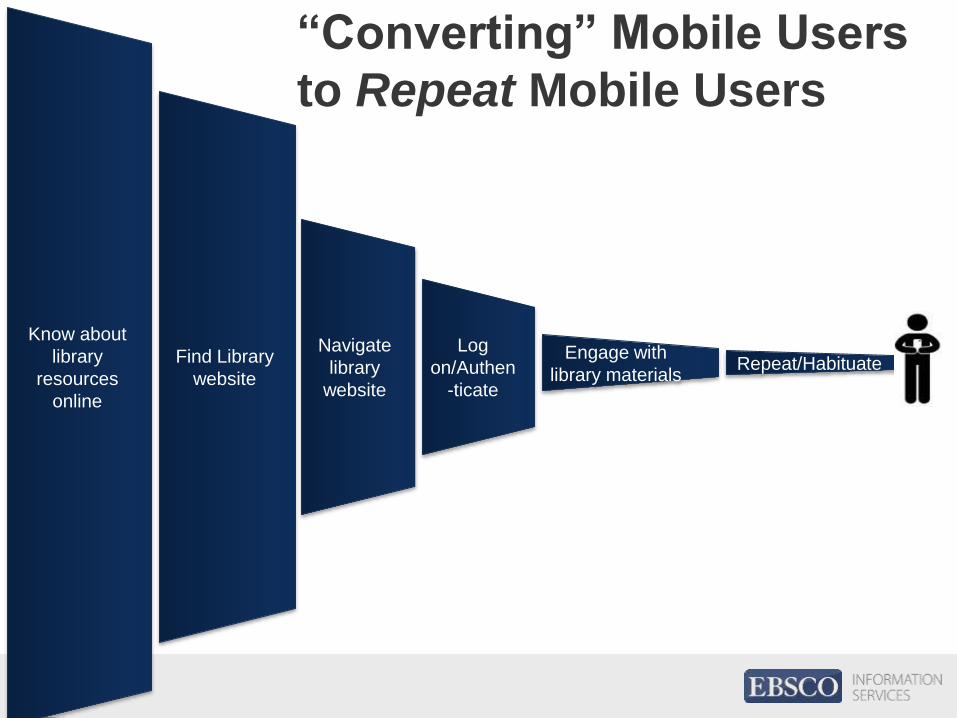
“Converting” Mobile Users
to Repeat Mobile Users
Find Library
website
Navigate
library
website
Log
on/Authen
-ticate
Know about
library
resources
online
Engage with
library materialsRepeat/Habituate

Questions?
Discussion!
Questions for Librarians
• % mobile vs. total traffic at your library?
• % off-campus vs. on-campus students?
• % digital vs. print usage?
• Special considerations / programs /
trainings for mobile users?
• Trends/observations of mobile usage?
Thank you!
Megan Hurst, MLIS
Director, SaaS Product Management
Researcher Workflow / EDS + EBSCOhost Platforms
@MHzUX
RESEARCH TEAM
Chad Movalli, Product Analyst
Statistics Research
Lis Riba, Sr. Product Analyst
Statistics Research + Heuristic Evaluation
Pradeep Deshpande, Technical Product Manager
Heuristic Evaluation
Will Norris, Business Development & Strategy Analyst
Heuristic Evaluation


