
ASX50 financial reporting insights30 June 2018 reporting season
November 2018
KPMG.com.au

Introduction KPMG's Audit, Assurance and Risk Consulting practice (AARC) has analysed the financial reports of the ASX50 through the latest reporting season (1 July 2017 to 30 June 2018) with a focus on:
– Considering the financial performance of the ASX50 group of companies as an indicator of the economy in general;
– Analysing trends by industry sector;
– Comparing and analysing profits reported under statutory and non-statutory (underlying) measures; and
– Providing insights and observations on Key Audit Matters communicated in the independent auditor's reports.
All amounts are in Australian dollars, unless otherwise stated.

© 2018 KPMG, an Australian partnership and a member firm of the KPMG network of independent member firms affiliated with KPMG International Cooperative (“KPMG International”), a Swiss entity. All rights reserved.The KPMG name and logo are registered trademarks or trademarks of KPMG International. Liability limited by a scheme approved under Professional Standards Legislation.3 ASX50 financial
reporting insights
Executive summary
Key findings in reported financial results – 12 months to 30 June 2018Revenue has increased for 76 percent of the ASX50 companies and by 4 percent overall. The five miners reported a combined 7 percent revenue increase as both commodity prices and production increased.
Statutory PBT increased by 15 percent or $18 billion to $138 billion. This increase was driven mainly by a $10 billion increase in profits for the miners and a $5 billion increase in profits for the Energy and Utilities sector. Performance was otherwise mixed but generally positive.
Statutory PBT exceeded underlying PBT for the first time in our survey period, being 6 percent higher. This was driven by:
– Only $2 billion of impairment charges being reported outside of non-statutory PBT (compared to $8 billion in 2017)
– Upward revaluations of property fair values of $6 billion being excluded from non-statutory PBT
– Gains from one off significant items, namely the gain on sale of assets, being excluded from non-statutory measures
– Favourable movements in financial instrument fair values being excluded from non-statutory PBT
Impairment charges continue to reduce, with a 45 percent decline on the comparative period to $8 billion.
Auditor's reporting on Key Audit Matters (KAMs)
External auditors' top three focus areas for Key Audit Matters (KAMs) as reported in the independent auditor's reports of the ASX50 continues to be taxation, asset carrying values and revenue.
MethodologyFinancial results and key audit matter insights have been sourced from company Annual Report, ASX Appendix 4D and ASX Appendix 4E disclosures. The constituents of the ASX50 as at 30 June 2018 are set out in Appendix 1.
The comparative periods of the survey have been restated to reflect the financial results and key audit matters of the ASX50 constituents as at 30 June 2018. All results reported in other currencies have been translated to Australian dollars using the average rate for each six-month period.
Percentage movements quoted have been calculated based on actual balances. Figures shown in charts have been rounded to the nearest billion.
Impairment charges Statutory profit before tax Underlying profits Revenue
0
20
40
60
80
100
120
140
160
Jun-18Jun-17Jun-16Jun-15Jun-14Jun-13Jun-12Jun-11Jun-10Jun-090
100
200
300
400
500
600
700
Profi
t, o
pera
ting
cash
flow
and
impa
irmen
tch
arge
s $
billi
on
Rev
enue
$ b
illio
n
Annual reported financial results – ASX50

© 2018 KPMG, an Australian partnership and a member firm of the KPMG network of independent member firms affiliated with KPMG International Cooperative (“KPMG International”), a Swiss entity. All rights reserved.The KPMG name and logo are registered trademarks or trademarks of KPMG International. Liability limited by a scheme approved under Professional Standards Legislation.4 ASX50 financial
reporting insights
‘Big 4’ banks (Australia & New Zealand Banking Group, Commonwealth Bank of Australia, National Australia Bank, Westpac Banking Corporation)
The major banks reported a 3 percent increase in annual revenue and a 2 percent increase annual statutory profit before tax (PBT).
"The Australian major banks’ results highlight that the profit growth of previous years has continued to slow. This reflects a combination of factors impacting the banking industry - the high cost of regulatory compliance and remediation efforts, increasing capital requirements and continued margin pressure – against a backdrop of a low growth, low interest rate environment."
– Ian Pollari, National Sector Leader, Banking.
KPMG’s Major Australian Banks Full Year Results 2018 provides a detailed analysis.
Key Audit Matters
All of the Big 4 banks include a KAM on Receivables and allowances. Auditors stated that increased audit effort is due to subjective and complex judgements required to challenge the necessity for and estimation of the size of the impairment provision for loans and advances.
75 percent communicated a KAM on Regulation, litigation and claims. Auditors' reports issued for September reporters subsequent to the survey period brings this to 100 percent. Exposure to conduct risk related matters, legal cases and regulatory actions, and investigations in various jurisdictions is driving the greater auditor attention. Significant judgement is applied by auditors in assessing and challenging the measurement basis of such provisions.
0
10
20
30
40
50
2017 2018
43 44
$ b
illio
n
Executive summary Sector summary
12 month PBT Miners (BHP Billiton, Fortescue, Rio Tinto, Newcrest Mining, South32)
Of the five miners, the two largest, BHP and Rio Tinto account for 82 percent and 90 percent respectively of annual revenue and annual statutory profit before tax, and are highlighted separately. The miners reported a 10 percent increase in annual revenue (two majors only: 13 percent) and a 28 percent increase in annual statutory PBT (two majors only: 44 percent).
“Overall, industry financial performance has been helped by stronger prices from continued strong global commodities markets. Other factors vary between the miners and include increased production volumes, benefit from asset divestments, and increased quality discounts."
– Ted Surette, Industry Leader, Energy & Natural Resources
Key Audit Matters
All miners report a KAM on remediation provisions. Challenging the estimations of remediation and restoration obligations, which may be many years into the future, is cited most often by auditors. These obligations are governed by a combination of environmental, regulatory and legislative requirements, and entity-specific responsive activities.
The challenge of auditing these provisions mainly relate to the level of auditor judgement required to evaluate the quantum and timing of activities, associated economic assumptions and estimated cost of future activities.
Four of the five miners report a taxation KAM. Auditors of these miners involve tax specialists to assist them addressing the taxation KAM. Auditors report operating in multiple countries, each with its own taxation legislation, as the main reason driving their taxation KAM. Half of the miners with taxation KAMs also refer to the complexity of transfer pricing in their taxation KAM.
05
1015202530354045
2017 2018
43
33
$ b
illio
n
12 month PBT

© 2018 KPMG, an Australian partnership and a member firm of the KPMG network of independent member firms affiliated with KPMG International Cooperative (“KPMG International”), a Swiss entity. All rights reserved.The KPMG name and logo are registered trademarks or trademarks of KPMG International. Liability limited by a scheme approved under Professional Standards Legislation.5 ASX50 financial
reporting insights
Real Estate (Dexus Property, Vicinity Centres Trust, Goodman, GPT, Lend Lease, Mirvac, Stockland, Scentre)
These nine companies reported a 1 percent decrease in annual revenue and a 13 percent increase in annual statutory PBT.
Five of the eight companies reported an increase in profit before tax from the 12 months to 30 June 2018, however only four of the companies reported an increase in revenue during the same period.
The change in revenue varied from a 4 percent increase to a 5 percent decrease while the sector excluded a net $5.6 billion of upward revaluations of investment property from underlying profits reflecting the price growth of Australia's property market.
Key Audit Matters
All real estate entities in the ASX50 include at least one KAM on property investment. Property investment comprises investments in property either directly or indirectly by the entity.
Common reasons cited as driving the greater auditor attention include: sheer quantum of the assets, the judgement associated with selecting the most appropriate valuation methodology, the sensitivity of key valuation assumptions, such as capitalisation rate, discount rate, future rental income, occupancy levels and the presence of unique property attributes.
Entities in the real estate sector were more likely than any other sector to include a KAM on revenue. Real Estate contractor revenue KAMs result from the audit effort applied to assessing forecast revenue and total costs to complete estimates inherent in the contractor’s stage-of-completion revenue recognition policies. The effort applied by auditors is even greater for Real Estate entities offering bespoke contract terms and accepting differing project risk profiles. Judgement is commonly challenged over revenue recognition of variations and claims that may not have been formally approved by the customer.
Real Estate developer revenue KAMs focus on the audit effort associated with assessing contractual terms of sale and settlement risk.
0
2
4
6
8
10
12
14
2017 2018
1213
$ b
illio
n
Executive summary Sector summary
12 month PBT Insurance (AMP, Medibank Private, Insurance Australia, QBE Insurance, Suncorp)
There has been a mix of results for the insurers, with annual revenue for the 5 companies increasing 1 percent and annual statutory PBT decreasing 25 percent. Two of the five companies reported a lower annual revenue and one company largely accounted for the overall reduced profit.
"The reduced profit reflected the impacts of catastrophes from global weather events and wildfires along with impairment charges impacting the international operations of one international insurer. This was in contrast to domestic general insurers who again benefited from another relatively benign year in terms of natural hazards along with prior period reserve releases in CTP classes, as the insurers have benefited from continuing low levels of wage inflation.
A key feature of the current operating environment for insurers is the challenge to strike the right balance between growth and innovation while dealing with wide ranging regulatory and reporting reforms and the outworkings of the Royal Commission. The next 12 months are likely to see significant regulatory changes as the Royal Commission concludes and the industry looks to respond to the final recommendations."
– David Kells, National Sector Leader, Insurance
Key Audit Matters
All insurers include at least one KAM on the valuation of insurance policy liabilities and outstanding claims liabilities.
A third of all insurance KAMs relate to valuation of life insurance policies and another third relate to reinsurance arrangements designed to protect the insurer’s exposure to life insurance and catastrophe claims.
Auditors focus on these liabilities as their assessments involve complex modelling using subjective judgements about future events which are inherently uncertain. Given these complexities, almost 70 percent of these KAMs communicate involving Actuarial specialists.
0
1
2
3
4
5
6
2017 2018
5
4
$ b
illio
n
12 month PBT

© 2018 KPMG, an Australian partnership and a member firm of the KPMG network of independent member firms affiliated with KPMG International Cooperative (“KPMG International”), a Swiss entity. All rights reserved.The KPMG name and logo are registered trademarks or trademarks of KPMG International. Liability limited by a scheme approved under Professional Standards Legislation.6 ASX50 financial
reporting insights
Energy & Utilities (AGL Energy, APA, Oil Search, Origin Energy, Santos, Caltex Australia, Woodside Petroleum)
These seven companies reported a 7 percent increase in annual revenue and a 359 percent increase in annual statutory profit before tax.
“ The main drivers for stronger financial performance include significant reduction in impairment and other expenses. The earnings of Oil & Gas companies have benefitted from a 28 percent YoY improvement in the oil price, increased demand for gas, and the commissioning of assets that have increased production volumes. Notwithstanding this, the industry has been affected by natural disasters and is tackling cost pressures, social licence to operate expectations as well as a challenging east coast gas environment. Overall, the energy industry remains plagued with a lack of a stable energy and climate change policy since the National Energy Guarantee was shelved. Energy price affordability and security remains a critical national priority”.
– Ted Surette, Industry Leader, Energy & Natural Resources
Consumer Staples (Aristocrat, Treasury Wine Estates, Wesfarmers, Woolworths)
The Consumer Staples sector reported an increase of 2 percent in annual revenues. Annual statutory combined PBT of $7.8 billion compares to a result of $7.3 billion in 2017. Aristocrat Leisure Limited, had an increase in revenue of 19 percent and a PBT increase of 21 percent, whilst TWE reported a 23 percent increase in profit on flat revenues driven by its premiumisation strategy.
"Both Woolworths and Wesfarmers revenues were impacted by ongoing deflationary pressures in the grocery sector. Woolworth's revenues from continuing operations (excluding Petrol and Home Improvement) grew 3.4 percent. Reported statutory profit before tax from continuing operations grew 9.5 percent. Wesfarmers profit from continuing operations was up 5.2 percent (after excluding a $300m impairment at Target and discontinued operations loss at Bunnings UK of $1,407m). Revenues in Coles were up 0.4 percent on prior year driven by 1.6 percent increase in food & liquor offset by declines in Convenience channel. Revenues increased in Bunnings Aust, Kmart and Officeworks."
– Trent Duvall, National Sector Leader, Consumer Products
0
1
2
3
4
5
6
78
2017 2018
2
7
$ b
illio
n
0123456789
2017 2018
8
7
$ b
illio
n
Other (ASX, Brambles, Cochlear, Computershare, CSL, Macquarie, Ramsay Health Care, Sonic Healthcare, Telstra)
Eight of the nine companies reported increase in revenue of which seven of these eight reported increase in profit before tax. This indicates a generally strong performance. Overall, the nine companies reported a 5 percent increase in revenues and an 8 percent increase in PBT.
02
4
6
8
10
12
14
16
2017 2018
1415
$ b
illio
n
Executive summary Sector summary12 month PBT 12 month PBT
12 month PBT
Materials (Amcor, James Hardie Industries, Orica) and Transportation (Aurizon, Sydney Airport, Transurban, Qantas)
These seven companies reported a 5 percent annual revenue decrease and a 33 percent increase in annual statutory profit before tax. The main driver was impairments and significant items recognised in one of the seven companies in the previous year.
"The strong statutory profit improvement across this diverse portfolio reflects continued improvement in market conditions and a lower level of impairments in FY18 compared to FY17. Higher revenue in six of the seven companies, combined with various restructuring and cost–out programs in recent years, is also having a positive impact on operating results. Focus in this sector is increasingly on automation to help drive down costs and offset increases in energy costs. Continued opportunities for price increases as economic conditions improve have also helped drive a strong 6 month profit performance to 30 June 2018 for the majority of these companies.”
– Cameron Slapp, National Sector Leader, Industrial Manufacturing
0
1
2
3
4
5
6
2017 2018
3
5
$ b
illio
n
12 month PBT

© 2018 KPMG, an Australian partnership and a member firm of the KPMG network of independent member firms affiliated with KPMG International Cooperative (“KPMG International”), a Swiss entity. All rights reserved.The KPMG name and logo are registered trademarks or trademarks of KPMG International. Liability limited by a scheme approved under Professional Standards Legislation.7 ASX50 financial
reporting insights
Non-statutory measures of earningsKey findingsPrevalence of non-statutory reportingForty of the 50 companies chose to report results using an alternative measure of financial performance in addition to statutory profit before tax (PBT). In most cases these are the measures reported internally for decision making purposes with the inclusion in the half-year or annual results under the accounting standards requirement to provide information on the performance of operating segments using the measure reported internally. These non-statutory measures are also used in communicating performance to investors on a basis that management consider useful in addition to statutory information.
Measures used include underlying profits, cash earnings, and profits before significant, non-recurring, distributable income or material items. For the ASX50 group as a whole statutory PBT exceeded non-statutory profits (pre-tax) by 6 percent for the first time since our survey commenced in 2008.
ImpairmentsImpairments have decreased considerably in the 12 month period ended 30 June 2018 with $2.2 billion being excluded from non-statutory PBT versus $7.8 billion in the prior year.
Changes in financial instrument fair valuesSome companies exclude unrealised fair value changes in financial instruments from non-statutory PBT measures and include realised amounts. Typically this occurs where hedge accounting has not been applied.
Changes in property fair valuesThe Real Estate Sector has excluded a net $5.6 billion of upward revaluations of investment property from underlying profits reflecting the price growth of Australia's property market.
Significant and separately disclosed items and other itemsThirty-six companies disclosed significant items or other forms of adjustment in accordance with their respective alternative methodology to exclude a net $2.5 billion of income from their alternative measures of financial performance. This category continues to include cost saving strategies and transformation programs with the inclusion of significant one off events (e.g. gain on disposal of assets) being identified.
Forty companies (80 percent) in the ASX50 group reported an alternative measure of financial performance in addition to statutory profit.
Statutory PBT exceeded underlying profit for the first time in our survey period, being $7.3 billion or 6 percent higher.
Annual statutory profit before tax compared to alternative profit before tax measures
Reconciliation between underlying and statutory profit before tax
($billion) 12 month period ended
June 2017 June 2018
Underlying profit before tax 129 131
Impairments (8) (2)
Changes in financial instrument fair values (1) 2
Changes in property fair values 3 6
Significant items separately disclosed (2) 2
Other items (1) (1)
Statutory profit before tax 120 138
Statutory PBTAlternative measure PBT
0
40
80
120
160
$ bi
llion
Jun-
10
Jun-
11
Jun-
12
Jun-
13
Jun-
14
Jun-
15
Jun-
16
Jun-
17
Jun-
18
Jun-
08
Jun-
09
-8%+6%
© 2018 KPMG, an Australian partnership and a member firm of the KPMG network of independent member firms affiliated with KPMG International Cooperative (“KPMG International”), a Swiss entity. All rights reserved.The KPMG name and logo are registered trademarks or trademarks of KPMG International. Liability limited by a scheme approved under Professional Standards Legislation.8 ASX50 financial
reporting insights
Impairment analysis
0
10
20
30
40
Jun-
08
Jun-
09
Jun-
10
Jun-
11
Jun-
12
Jun-
13
Jun-
14
Jun-
15
Jun-
16
Jun-
17
Jun-
18
$ bi
llion
Mining non-current assets (tangible and intangible)Non-mining non-current assets (tangible and intangible)Receivables ('Big 4' banks and non-bank, non-miners)
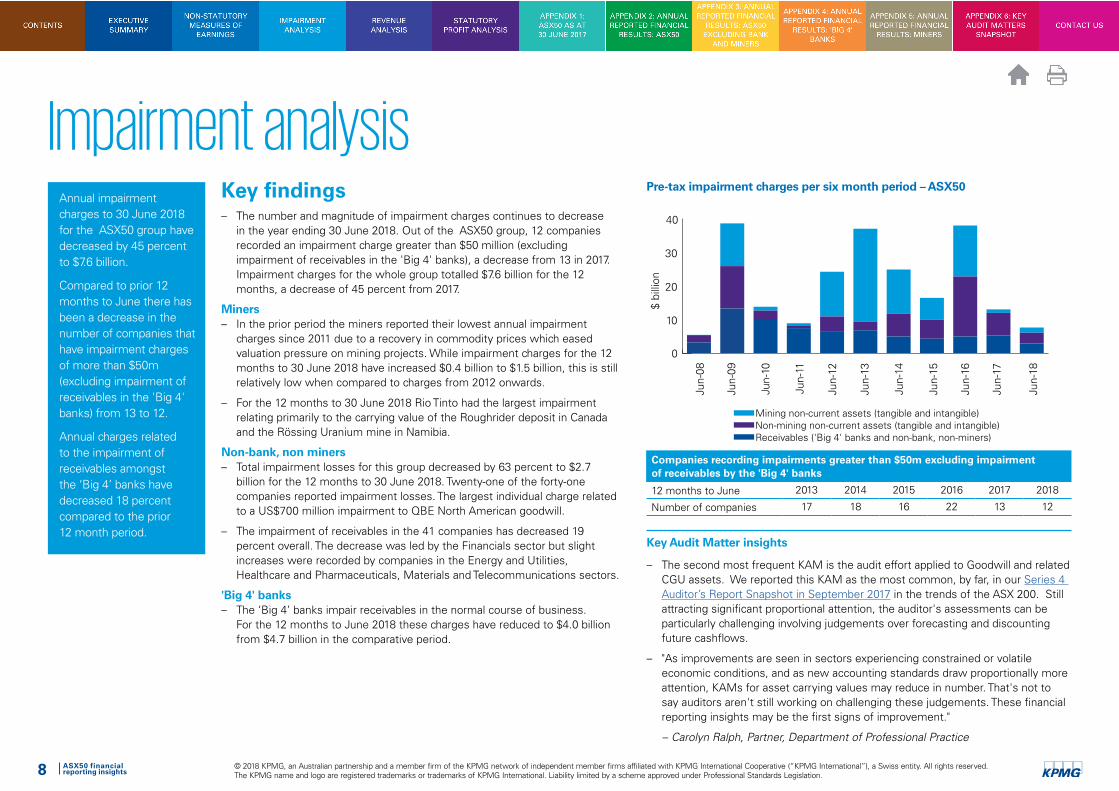
Annual impairment charges to 30 June 2018 for the ASX50 group have decreased by 45 percent to $7.6 billion.
Compared to prior 12 months to June there has been a decrease in the number of companies that have impairment charges of more than $50m (excluding impairment of receivables in the 'Big 4' banks) from 13 to 12.
Annual charges related to the impairment of receivables amongst the ‘Big 4’ banks have decreased 18 percent compared to the prior 12 month period.
Pre-tax impairment charges per six month period – ASX50
Companies recording impairments greater than $50m excluding impairment of receivables by the 'Big 4' banks
12 months to June 2013 2014 2015 2016 2017 2018
Number of companies 17 18 16 22 13 12
Key findings– The number and magnitude of impairment charges continues to decrease
in the year ending 30 June 2018. Out of the ASX50 group, 12 companies recorded an impairment charge greater than $50 million (excluding impairment of receivables in the 'Big 4' banks), a decrease from 13 in 2017. Impairment charges for the whole group totalled $7.6 billion for the 12 months, a decrease of 45 percent from 2017.
Miners – In the prior period the miners reported their lowest annual impairment
charges since 2011 due to a recovery in commodity prices which eased valuation pressure on mining projects. While impairment charges for the 12 months to 30 June 2018 have increased $0.4 billion to $1.5 billion, this is still relatively low when compared to charges from 2012 onwards.
– For the 12 months to 30 June 2018 Rio Tinto had the largest impairment relating primarily to the carrying value of the Roughrider deposit in Canada and the Rössing Uranium mine in Namibia.
Non-bank, non miners– Total impairment losses for this group decreased by 63 percent to $2.7
billion for the 12 months to 30 June 2018. Twenty-one of the forty-one companies reported impairment losses. The largest individual charge related to a US$700 million impairment to QBE North American goodwill.
– The impairment of receivables in the 41 companies has decreased 19 percent overall. The decrease was led by the Financials sector but slight increases were recorded by companies in the Energy and Utilities, Healthcare and Pharmaceuticals, Materials and Telecommunications sectors.
'Big 4' banks– The ‘Big 4’ banks impair receivables in the normal course of business.
For the 12 months to June 2018 these charges have reduced to $4.0 billion from $4.7 billion in the comparative period.
Key Audit Matter insights
– The second most frequent KAM is the audit effort applied to Goodwill and related CGU assets. We reported this KAM as the most common, by far, in our Series 4 Auditor’s Report Snapshot in September 2017 in the trends of the ASX 200. Still attracting significant proportional attention, the auditor's assessments can be particularly challenging involving judgements over forecasting and discounting future cashflows.
– "As improvements are seen in sectors experiencing constrained or volatile economic conditions, and as new accounting standards draw proportionally more attention, KAMs for asset carrying values may reduce in number. That's not to say auditors aren't still working on challenging these judgements. These financial reporting insights may be the first signs of improvement."
– Carolyn Ralph, Partner, Department of Professional Practice

© 2018 KPMG, an Australian partnership and a member firm of the KPMG network of independent member firms affiliated with KPMG International Cooperative (“KPMG International”), a Swiss entity. All rights reserved.The KPMG name and logo are registered trademarks or trademarks of KPMG International. Liability limited by a scheme approved under Professional Standards Legislation.9 ASX50 financial
reporting insights
Revenue analysisKey findings– Revenue has increased for 76 percent of the ASX50 companies and by 4 percent
overall. The Miners and Energy and Utilities companies continued to perform strongly due to increased prices and volumes. The Materials and Transportation sector also reported revenue growth.
Non-bank, non-miners (41 companies)– Revenue for the 12 month period ended 30 June 2018 increased by 3 percent on
the comparative period.– In Consumer Markets both Woolworths and Wesfarmers revenues were impacted
by ongoing deflationary pressures in the grocery sector. Woolworths' revenues from continuing operations grew 3.4 percent while Wesfamrers reported a 3.0 percent increase in revenues from continuing operations. Wesfarmers has the largest total revenue in the ASX50 followed by Woolworths.
– In Energy and Utilities Santos increased revenue by 20 percent driven by higher oil and LNG prices and higher LNG sales volumes.
– The overall non-bank, non-miner conversion of revenue into profit before tax has increased on average from 16 percent to 18 percent with the greatest improvement observed within the Energy and Utilities sector (3 percent to 11 percent) and the largest decline noted in Materials (11 percent to 9 percent) and Tel Co Services (22 percent to 20 percent).
The non-bank, non-miners reported a 3 percent increase in revenue for the 12 month period ended 30 June 2018.
The mining sector has reported a 10 percent increase in revenue driven by increased pricing.
The ‘Big 4’ banks have recorded an increase of 3 percent following a 2 percent decrease in the prior period. Conversion to PBT remains strong.
Revenue per six month period – ASX50
Jun-09 Jun-10 Jun-11 Jun-12 Jun-13 Jun-14 Jun-15 Jun-16 Jun-17 Jun-18
$ bi
llion
Total banks (Big 4 Banks) Revenue
Total mining (4 Minings) Revenue
Top 41 Revenue
0
100
200
300
400
500
Profit Margin Analysis (PBT/Revenue)
Sector Companies June 2017 June 2018
Banks 4 41% 43%
Consumer Markets 4 6% 6%
Energy and Utilities 7 3% 11%
Financials 2 33% 34%Health Care and Pharmaceuticals
3 16% 17%
Insurance 5 6% 5%
Materials 3 11% 9%
Mining 5 27% 32%
Real Estate 9 45% 46%
Services 2 10% 16%
Tel Co Services 1 22% 20%
Transportation 4 6% 11%
Miners– The Miners reported a 10 percent revenue increase for the 12-month period ended 30 June 2018 of $8.3 billion. All
but Fortescue Metals Group recorded an increase with the largest being BHP Billiton up 21 percent. This was the result of higher average realised prices across most commodities.
'Big 4' banks– Revenue for the 12 month period to 30 June 2018 has increased by 3 percent for the Big 4 Banks.– The profit margin ratio has increased by 2 percent when compared to the previous period.
Key Audit Matter insights
– Entities across 6 sectors report a KAM on revenue. The key reasons driving the attention of the auditor to focus on an entity's revenue include:
– significant judgements relating to estimation and percentage of completion;
– complexity;
– volume of transactions;
– heavy reliance on IT systems, processes and controls; and
– significance to the financial statements.

© 2018 KPMG, an Australian partnership and a member firm of the KPMG network of independent member firms affiliated with KPMG International Cooperative (“KPMG International”), a Swiss entity. All rights reserved.The KPMG name and logo are registered trademarks or trademarks of KPMG International. Liability limited by a scheme approved under Professional Standards Legislation.10 ASX50 financial
reporting insights
Statutory profit before tax analysisKey findings– The ASX50 group has experienced an increase in statutory profit before
tax since the last report 12 months ago primarily due to the increased profitability of the Miners and the Energy and Utilites sector. This has resulted in a 15 percent or $18 billion overall increase in statutory profit before tax for the 12 months to June 2018.
Non-bank, non-miners (41 companies)– Overall there was a 19 percent increase in PBT in the 12 month period
compared to June 2017.
– The Energy and Utilities sector has reported the greatest percentage increase in year on year results largely due to a significant reduction in impairments and other expenses.
– Against the overall trend, declines have been experienced for the Insurance sector (25 percent), demonstrating a challenging trading environment due to global weather events and wildfires.
Miners– Modest decreases in three of the companies were offset by significant
increases from Rio Tinto and BHP, with an overall increase in profit before tax of $10 billion for the sector. This was the result of lower impairment charges and higher average realised prices across most commodities.
Big 4’ banks– The ‘Big 4’ banks posted a record combined annual statutory profit before
tax ($44 billion) for the period ended 30 June 2018. Two of the four banks recorded an increase in profit in the period.
Jun-09 Jun-10 Jun-11 Jun-12 Jun-13 Jun-14 Jun-15 Jun-16 Jun-17 Jun-18
$ bi
llion
0
20
40
60
80
100
120
140
Jun-09 Jun-10 Jun-11 Jun-12 Jun-13 Jun-14 Jun-15 Jun-16 Jun-17 Jun-18$
billi
on
Total banks (Big 4 Banks) Total mining (4 Minings) Top 41
-10
0
10
20
3040
50
60
Annual statutory profit before tax for the 12 month period ended 30 June 2018 has increased by 15 percent from the previous period.
The ‘Big 4’ banks have posted a record statutory PBT result.
The non bankers, non-miners have reported an increase in statutory PBT of 19 percent to a record result.
Profit Before Taxation (PBT) per twelve-month period – ASX50
Profit Before Taxation (PBT) per twelve-month period – ASX50 – break down

© 2018 KPMG, an Australian partnership and a member firm of the KPMG network of independent member firms affiliated with KPMG International Cooperative (“KPMG International”), a Swiss entity. All rights reserved.The KPMG name and logo are registered trademarks or trademarks of KPMG International. Liability limited by a scheme approved under Professional Standards Legislation.11 ASX50 financial
reporting insights
Appendix 1: ASX50 as at 30 June 2018S&P ASX50 as at 30 June 2018
Symbol Company Sector
AGL AGL Energy Limited Energy and Utilities AMC Amcor Limited Materials
AMP AMP Limited Insurance
APA APA Group Energy and Utilities
ALL Aristocrat Leisure Limited Consumer Markets
ASX ASX Limited Financials
AZJ Aurizon Holdings Limited Transportation
ANZ Australia And New Zealand Banking Group Limited Banks
BHP BHP Billiton Limited Mining
BXB Brambles Industries Limited Services
CTX Caltex Australia Limited Energy and Utilities
COH Cochlear Limited Health Care and Pharmaceuticals
CBA Commonwealth Bank Australia Banks
CPU Computershare Limited Services
CSL CSL Limited Health Care and Pharmaceuticals
DXS Dexus Property Group Real Estate
FMG Fortescue Metals Group Limited Mining
GMG Goodman Group Real Estate
GPT GPT Group Real Estate
IAG Insurance Australia Group Limited Insurance
JHX James Hardie Industries PLC Materials
LLC Lend Lease Group Real Estate
MQG Macquarie Group Limited Financials
MPL Medibank Private Limited Insurance
MGR Mirvac Group Real Estate
S&P ASX50 as at 30 June 2018
Symbol Company Sector
NAB National Australia Bank Limited Banks
NCM Newcrest Mining Limited Mining
OSH Oil Search Limited Energy and Utilities
ORI Orica Limited Materials
ORG Origin Energy Limited Energy and Utilities
QAN Qantas Airways Limited Transportation
QBE QBE Insurance Group Limited Insurance
RHC Ramsay Health Care Limited Health Care and Pharmaceuticals
RIO Rio Tinto Limited Mining
STO Santos Limited Energy and Utilities
SCG Scentre Group Real Estate
SHL Sonic Healthcare Limited Health Care and Pharmaceuticals
S32 South32 Limited Mining
SGP Stockland Real Estate
SUN Suncorp Group Limited Insurance
SYD Sydney Airport Transportation
TLS Telstra Corp Limited Tel Co Services
TCL Transurban Group TransportationTWE Treasury Wine Estates Consumer Markets
VCX Vicinity Centres Trust Real Estate
WES Wesfarmers Limited Consumer Markets
URW Unibail-Rodamco-Westfield* Real Estate
WBC Westpac Banking Corp Banks
WPL Woodside Petroleum Limited Energy and Utilities
WOW Woolworths Limted Consumer Markets
Allocation of results to six monthly periodsYear end Six months to June Six months to December
June or December January to June July to December
September or March October to March April to September
Company has been in the ASX50 for all periods presented. These represent approximately 91 percent of ASX50 revenue and 96 percent of ASX50 statutory PBT for the year ended 30 June 2018.
Entered into the ASX50 during the survey period. The comparative information in this survey has been adjusted to reflect historical financials and key audit matters of these companies whilst outside the ASX50.
*The company formed following the takeover of Westfield Group by Unibail-Rodamco (Unibail-Rodamco-Westfield) was admitted to the official list of ASX Limited as an ASX Foreign Exempt Listing on 30 May 2018 and as such, has been excluded from our survey.

© 2018 KPMG, an Australian partnership and a member firm of the KPMG network of independent member firms affiliated with KPMG International Cooperative (“KPMG International”), a Swiss entity. All rights reserved.The KPMG name and logo are registered trademarks or trademarks of KPMG International. Liability limited by a scheme approved under Professional Standards Legislation.12 ASX50 financial
reporting insights
Appendix 2: Annual reported financial results: ASX50
Impairment charges Statutory profit before tax Underlying profits Revenue
0
20
40
60
80
100
120
140
160
Jun-18Jun-17Jun-16Jun-15Jun-14Jun-13Jun-12Jun-11Jun-10Jun-090
100
200
300
400
500
600
700
Profi
t, o
pera
ting
cash
flow
and
impa
irmen
t ch
arge
s $
billi
on
Rev
enue
($ b
illio
n)
Note: Foreign denominated results translated at constant exchange rates to eliminate impact of FX volatility Comparatives have been restated such that the ASX50 reported for prior periods is comprised of the ASX50 as at 30 June 2018Source: 4Ds, 4Es and Annual Financial Reports

© 2018 KPMG, an Australian partnership and a member firm of the KPMG network of independent member firms affiliated with KPMG International Cooperative (“KPMG International”), a Swiss entity. All rights reserved.The KPMG name and logo are registered trademarks or trademarks of KPMG International. Liability limited by a scheme approved under Professional Standards Legislation.13 ASX50 financial
reporting insights
Appendix 3: Annual reported financial results: ASX50 excluding banks and miners
Impairment charges Statutory profit before tax Underlying profits Revenue
0
10
20
30
40
50
60
70
80
Jun-18Jun-17Jun-16Jun-15Jun-14Jun-13Jun-12Jun-11Jun-10Jun-090
50
100
150
200
250
300
350
400
450
Profi
t, o
pera
ting
cash
flow
and
impa
irmen
t ch
arge
s $
billi
on
Rev
enue
($ b
illio
n)
Note: Foreign denominated results translated at constant exchange rates to eliminate impact of FX volatility Comparatives have been restated such that the ASX50 reported for prior periods is comprised of the ASX50 as at 30 June 2018Source: 4Ds, 4Es and Annual Financial Reports

© 2018 KPMG, an Australian partnership and a member firm of the KPMG network of independent member firms affiliated with KPMG International Cooperative (“KPMG International”), a Swiss entity. All rights reserved.The KPMG name and logo are registered trademarks or trademarks of KPMG International. Liability limited by a scheme approved under Professional Standards Legislation.14 ASX50 financial
reporting insights
Appendix 4: Annual reported financial results: ‘Big 4’ banks
Impairment charges Statutory profit before tax Underlying profits Revenue
0
10
20
30
40
50
60
70
80
90
100
110
120
Jun-18Jun-17Jun-16Jun-15Jun-14Jun-13Jun-12Jun-11Jun-10Jun-09
Rev
enu
e, p
rofit
an
d im
pai
rmen
t ch
arg
es
$ m
illio
n
Note: Foreign denominated results translated at constant exchange rates to eliminate impact of FX volatility Comparatives have been restated such that the ASX50 reported for prior periods is comprised of the ASX50 as at 30 June 2018Source: 4Ds, 4Es and Annual Financial Report

© 2018 KPMG, an Australian partnership and a member firm of the KPMG network of independent member firms affiliated with KPMG International Cooperative (“KPMG International”), a Swiss entity. All rights reserved.The KPMG name and logo are registered trademarks or trademarks of KPMG International. Liability limited by a scheme approved under Professional Standards Legislation.15 ASX50 financial
reporting insights
Appendix 5: Annual reported financial results: Miners
Impairment charges Statutory profit before tax Underlying profits Revenue
-20
-10
10
20
30
40
50
0
60
Jun-18Jun-17Jun-16Jun-15Jun-14Jun-13Jun-12Jun-11Jun-10Jun-09Jun-08
Profi
t, o
pera
ting
cash
flow
and
impa
irmen
t ch
arge
s $
billi
on
Rev
enue
($ b
illio
n)
60
40
20
0
80
100
120
140
160
Note: Foreign denominated results translated at constant exchange rates to eliminate impact of FX volatility Comparatives have been restated such that the ASX50 reported for prior periods is comprised of the ASX50 as at 30 June 2018Source: 4Ds, 4Es and Annual Financial Report

© 2018 KPMG, an Australian partnership and a member firm of the KPMG network of independent member firms affiliated with KPMG International Cooperative (“KPMG International”), a Swiss entity. All rights reserved.The KPMG name and logo are registered trademarks or trademarks of KPMG International. Liability limited by a scheme approved under Professional Standards Legislation.16 ASX50 financial
reporting insights
Appendix 6: Key Audit Matters snapshot
Ban
ks
Co
nsu
mer
M
arke
ts
En
ergy
&
Uti
litie
s
Fin
anci
als
Hea
lth
Car
e &
P
har
mac
euti
cals
Insu
ran
ce
Mat
eria
ls1
Min
ing
Rea
l Est
ate2
Ser
vice
s
Tel C
o
Ser
vice
s
Tran
spo
rtat
ion
Tota
l AS
X50
Taxation 1 4 1 2 1 3 4 2 2 1 21
Goodwill (and related CGU assets) 2 1 2 4 1 1 2 2 1 2 18
Revenue 1 1 5 1 1 4 13
Receivables & allowances 4 2 3 1 1 1 12
PPE & finite life intangibles 1 3 1 1 3 1 1 1 12
Financial instruments 3 3 1 2 2 11
Property investment 10 10
Insurance policy liabilities & outstanding claims liabilities 1 1 8 10
IT systems 4 1 1 2 1 9
Provisions 2 1 1 5 9
Inventory 1 1 4 6
Exploration & Evaluation 4 1 5
Regulation, litigation & claims 3 1 4
New accounting standards impact 1 1 2
Others 3 4 2 1 2 1 1 1 2 17
Total 15 12 23 9 10 18 6 17 26 6 5 12 159
Number of reports 4 4 7 2 4 5 2 5 8 2 1 4 48
¹ Excludes James Hardie Industries PLC as it does not apply Australian auditing standards.2 Excludes Unibail-Rodamco-Westfield as the company formed following the takeover of
Westfield Group by Unibail-Rodamco (Unibail-Rodamco-Westfield) was admitted to the official list of ASX Limited as an ASX Foreign Exempt Listing on 30 May 2018 and as such, has been excluded from our survey.
17 ASX50 financial reporting insights
Contact us
The information contained in this document is of a general nature and is not intended to address the objectives, financial situation or needs of any particular individual or entity. It is provided for information purposes only and does not constitute, nor should it be regarded in any manner whatsoever, as advice and is not intended to influence a person in making a decision, including, if applicable, in relation to any financial product or an interest in a financial product. Although we endeavour to provide accurate and timely information, there can be no guarantee that such information is accurate as of the date it is received or that it will continue to be accurate in the future. No one should act on such information without appropriate professional advice after a thorough examination of the particular situation. To the extent permissible by law, KPMG and its associated entities shall not be liable for any errors, omissions, defects or misrepresentations in the information or for any loss or damage suffered by persons who use or rely on such information (including for reasons of negligence, negligent misstatement or otherwise).
© 2018 KPMG, an Australian partnership and a member firm of the KPMG network of independent member firms affiliated with KPMG International Cooperative (“KPMG International”), a Swiss entity. All rights reserved. The KPMG name and logo are registered trademarks or trademarks of KPMG International. Liability limited by a scheme approved under Professional Standards Legislation. November 2018. 75771606AARC.
The contacts at KPMG in connection with this report are:
Julian McPhersonPartner in Charge, Sydney AuditAudit, Assurance & Risk Consulting
T: +61 2 9335 8802 E: [email protected]
David RichardsDirector, Sydney AuditAudit, Assurance & Risk Consulting
T: +61 2 9455 9014 E: [email protected]
Thomas BangsManager,Sydney AuditAudit, Assurance & Risk Consulting
T: +61 2 9335 7769 E: [email protected]
Audit, Assurance and Risk Consulting (AARC) is a division of KPMG. AARC professionals work with clients to create and maintain investor confidence whilst unlocking valuable business insights. AARC services include: financial statement audit, assurance beyond the financial statements and value creation through viewing risk management as a lever for enhancing innovation, building credibility and achieving sustainable growth. We work with clients to address conduct risk, the call for greater transparency over non-financial performance and ethical behaviours, technological disruption, cyber security, the power of social media and more.
Carolyn RalphPartner, Department of Professional PracticeAudit, Assurance & Risk Consulting
T: +61 2 9455 9030 E: [email protected]
Karen TannerDirector, Department of Professional PracticeAudit, Assurance & Risk Consulting
T: +61 2 9335 7290 E: [email protected]
Benedict SiuManager,Department of Professional PracticeAudit, Assurance & Risk Consulting
T: +61 3 9838 4247 E: [email protected]
KPMG.com.au


