Download - Assessing the Service-Proï¬t Chain

Assessing the Service-Profit Chain
Wagner A. Kamakura � Vikas Mittal � Fernando de Rosa � Jose Afonso MazzonDuke University, Box 90120, Durham, North Carolina 27708
Katz Graduate School of Business, 360 Mervis Hall,
University of Pittsburgh, Pittsburgh, Pennsylvania 15260
University of Brasilia, SQSW 304 Bloco I, Apto. 507, Brasilia-DF-Brazil 70673-409
Universidade de Sao Paulo, Faculdade de Economia e Administracao, Ave. Prof. Luciano Gualberto,
908 CEP 0558-900, Sao Paulo-SP-Brasil
[email protected] � [email protected] � [email protected] � [email protected]
AbstractThe service-profit chain (SPC) is a framework for linkingservice operations, employee assessments, and customerassessments to a firm’s profitability (Heskett et al. 1994).The SPC provides an integrative framework for under-standing how a firm’s operational investments into serviceoperations are related to customer perceptions and behav-iors, and how these translate into profits. For a firm, itprovides much needed guidance about the complex inter-relationships among operational investments, customerperceptions, and the bottom line.
Implementing the SPC is a pervasive problem amongmost service firms, and several attempts have been madeto model various aspects of the SPC. However, compre-hensive approaches to model the SPC are lacking, as moststudies have only focused on discrete aspects of the SPC.There is a need for approaches that combine data such asmeasures of operational inputs, customer perceptions andbehaviors, and financial outcomes from multiple sources,providing the firm with not only comprehensive diagnosisand assessment but also with implementation guidelines.Importantly, an approach that is sensitive to and can ac-commodate the strengths and weaknesses of such datasets is required. We outline and illustrate such an ap-proach in this paper. Our approach has the potential toboth identify and quantify the benefits of implementing aservice strategy, especially for firms having multiple units(e.g., banks with branches, retail outlets, and so forth).
The implementation approach is illustrated using datafrom a national bank in Brazil. We used customer surveysfrom more than 500 branches of the bank. Each individualcustomer’s marketing survey data was linked to a numberof operational metrics. First, behavioral measures of reten-tion, such as the length of the customer’s relation with thebank, the deposit amount, and number of transactionswith the bank, were obtained and merged with the surveydata. Second, the main branch used by each customer wasidentified and operational inputs (e.g., number of employ-
ees, number of available automated teller machines(ATMs)) used at that branch were obtained and mergedwith the data set. This data set was used to model theSPC at a strategic and operational level.
The strategic analysis consisted of a structural-equationmodel that identified the critical conceptual relationshipsthat parsimoniously articulate the SPC for this bank. Forinstance, from among a variety of attribute-level percep-tions, the bank was able to identify those perceptions thatwere critical determinants of behavioral intentions. Simi-larly, from a variety of available behavioral metrics, thebank was able to identify those behaviors most relevant toprofitability. The operational analysis utilized Data Envelop-ment Analysis (DEA) and provides customized feedbackto each branch in implementing the strategic model. Itprovides each branch with a metric of its relative effi-ciency in translating inputs such as employees and ATMsinto relevant strategic outcomes such as customer inten-tions and behaviors. Our illustration shows how top man-agement can use the strategic and operational analysis intandem. Whereas the strategic model provides the key re-lationships and metrics that are needed to ensure that allsubunits of the firm follow a consistent strategy, the oper-ational analysis enables each branch to benchmark itsunique position so that the branch can implement the stra-tegic model in the most efficient way. Thus, simultaneouslyimplementing the strategic and operational model enables a firmto have a centralized focus with decentralized implementation.For this bank, the operational analysis shows that for abranch to achieve superior profitability, it is important thatthe branch manager not only be efficient in achievingsuperior satisfaction (as indicated in positive behavioralintentions) but also be efficient in translating such atti-tudes and intentions into relevant behaviors. In otherwords, superior satisfaction alone is not an unconditionalguarantee of profitability.(Service; Profitability; Service-Profit Chain; Retention; Satisfac-tion; Banking; Financial Services)
MARKETING SCIENCE � 2002 INFORMSVol. 21, No. 3, Summer 2002, pp. 294–317
0732-2399/02/2103/0294/$05.001526-548X electronic ISSN

Prior to the 1990s, most firms oriented their oper-
ations toward maximizing service quality. Today, the
focus is on linking service quality to concrete busi-
ness outcomes such as retention and profitability (cf.
Rust et al. 1995). In essence, the strategic focus has
been on maximizing profitability by optimizing oper-
ational resources allocated toward service quality
efforts.
However, for most firms, linking operational re-
sources to marketing outcomes has not been easy.
As remarked by Bolton and Drew (1994, p. 197):
There is a critical need for comprehensive models of custom-
er assessments, service operations, and outcomes, that is,
models with multiple, structural equations that recognize
potentially simultaneous relationships. By necessity, these
models must be operationalized with measures of service
operations and outcomes from within the organization.
Unfortunately, many organizations do not systematically
collect relevant internal measures. If they do, it can be very
difficult to retrieve and match them at the individual level.
The SPC is a framework for linking service oper-
ations, employee assessments, and customer assess-
ments to the bottom line (Heskett et al. 1994). As
detailed in Figure 1, the SPC provides an integrative
framework for understanding how a firm’s opera-
tional investments into service quality are related to
customer perceptions and behaviors and how these
translate into profits. Thus, it provides much needed
Figure 1 The Service-Profit Chain
Note. Employee perceptions, attitudes, and satisfaction are included as a form of operational input because we view both technological andhuman factors as operational inputs.
MARKETING SCIENCE/Vol. 21, No. 3, Summer 2002 295
ASSESSING THE SERVICE-PROFIT CHAIN

guidance about the complex interrelationships
among operational investments, customer percep-
tions, and the bottom line.
Implementing the SPC is a pervasive problem
among most service firms, as it provides a clear
opportunity for operational improvement. Therefore,
several attempts have been made to model various
aspects of the SPC. As discussed later, comprehen-
sive approaches to model the SPC are lacking, as
most studies have only focused on discrete aspects
of the SPC (cf. Zeithaml 2000). As such, approaches
and studies that can provide a firm with not only
comprehensive diagnosis and assessment but also
with implementation guidelines are needed. To ac-
complish this, data from multiple sources must be
melded, including measures of operational inputs,
customer perceptions and behaviors, and financial
outcomes. Importantly, an analysis approach that is
sensitive to and can accommodate the strengths and
weaknesses of such data sets is required. We outline
and illustrate such an approach in this paper. As
shown, the results have the potential to both identify
and quantify the benefits of implementing a service
strategy, especially for firms having multiple units
(e.g., banks with branches, retail outlets, and so
forth). By undertaking such an exercise, a clearer
picture of the strategic and operational blueprint of
the firm’s service strategy emerges. This can be used
to set action priorities for top management as well
as front-line managers. Such an effort has an illustra-
tion and implementation focus and is in sharp con-
trast with studies aimed at examining specific and
isolated pieces of the SPC. Whereas the purpose of
these focused studies is to theoretically examine the
nature of each link, the purpose of this effort is to
illustrate a comprehensive modeling approach from an
implementation perspective.
We utilize data from 5055 customers of a national
bank in Brazil to illustrate our approach. We also
discuss the broader applicability of the approach to
other service environments and highlight some inter-
esting conceptual insights that emerge from this
analysis. To undertake this issue, we first review the
SPC framework by highlighting conceptual and em-
pirical research related to it. We also discuss the ap-
plication of the SPC framework at a strategic and
operational level (Soteriou and Zenios 1999). Next,
we develop a testable model emanating from the
SPC framework and describe the empirical applica-
tion in the context of the bank. In doing so, this pa-
per articulates a measurement and modeling
approach to this problem area with an illustrative
application. Thus, we believe that the contribution of
this paper is not the development of a new method-
ology or modeling technique or the generality of the
specific findings. Rather, the contribution is in pre-
senting a comprehensive approach that service firms
can use as a blue print for action. In the process, we
gain several qualitative insights that shed light on
important questions such as: Why are some firms
unprofitable despite high-service quality and what is
the role of implementation efficiency in moderating
profitability?
The Service-Profit ChainThe original SPC framework was proposed by He-
skett et al. (1994), who posit that revenues are driven
by service quality perceptions, which in turn are
driven by operational inputs and employee efforts.
The popularity of the SPC framework is evident in
the numerous case studies reported by practitioners,
the most notable being its application at Sears (Rucci
et al. 1998). Another framework proposed by Rust et
al. (1995), known as the ‘‘Return on Quality’’ frame-
work, is similar, although it differentiates itself by
explicitly modeling the cost and benefits of quality-
related investments. Note that in the SPC frame-
work, the cost of quality is not explicitly considered
and the focus is on revenue rather than profitability,
the focus of the return on quality (ROQ) framework.
However, both the SPC and ROQ have several com-
monalities, the most notable being an emphasis on
driving the firm’s operations based on statistical
analyses of customer surveys. Thus, customer sur-
veys are used to identify key service attributes that
impact overall quality and retention, which in turn
drive financial outcomes. In this respect, they can
provide actionable guidance to management. Both
KAMAKURA, MITTAL, DE ROSA, AND MAZZON
Assessing the Service-Profit Chain
296 MARKETING SCIENCE/Vol. 21, No. 3, Summer 2002

these frameworks, however, are different from the
recently emerging customer equity framework,
where the focus is on identifying profitable custom-
ers. At the basic level, all of these frameworks are
aimed at linking service quality and marketing
activities to financial metrics. However, the cus-
tomer equity framework is more focused in customer
identification, whereas the ROQ and SPC frame-
works are more focused on improving the firm’s
operations. Thus, while the former may be useful to
manage a firm’s customer base, the latter two are
more useful to manage the firm’s internal operations
to service the customer base so identified.
Following Heskett et al. (1994), early SPC concep-
tualizations and tests were focused on retention and
revenue maximization with no explicit consideration
of the cost of service quality efforts. Thus, in the
SPC application at Sears, the objective was to in-
crease sales and revenues with no explicit regard for
profitability (Rucci et al. 1998). At PNC bank, the
SPC application was aimed at linking satisfaction
ratings to bank balance and not profitability (cf. Carr
1999). Similarly, at Holiday Inn, service quality was
explicitly linked to revenue available per room
(Kimes 1999). Similar in spirit were academic studies
seeking to link consumer perceptions to behavioral
outcomes such as patronage duration (Bolton 1998)
and repurchase behavior (Mittal and Kamakura
2001). To our knowledge, Loveman (1998) presents
the most comprehensive application of the SPC in
examining both customer behavior (duration of stay,
cross-purchasing) and revenue implications (average
balance) of service quality. However, in all of these
applications, the implicit goal was to maximize reten-
tion or revenues, and as such the cost of engaging in
such strategic objectives is not explicitly modeled.
To be sure, some studies have linked satisfaction
or service quality to profitability and not just reve-
nues. Even results from such studies have been in-
conclusive. For instance, Ittner and Larcker (1998)
found that satisfaction is positively related to reten-
tion and revenues but not to margins. Specifically,
they found that bank branches ranking in the lowest
customer satisfaction quartile had no different return
on sales (margins/sales) than those ranking in the
highest quartile. This was despite the fact that the
lower quartile branches had lower revenue than
the higher quartile branches. Although they do not
address this issue, we believe that this could have
occurred because the high-satisfaction branches were
overspending to satisfy customers and gain sales.
Thus, simply having profits or margins as the de-
pendent variable or objective function is not enough,
unless the simultaneous positive and negative impact of
service quality expenditures and investments on profit-
ability is explicitly included in the analysis. The ROQ
framework proposed by Rust et al. (1995) squarely
addresses this important point. Here, operational re-
sources directed toward service improvements are
posited to simultaneously have a positive and nega-
tive effect on profitability. The positive impact occurs
because such investments (e.g., more tellers at a
bank) in operational resources lead to positive per-
formance perceptions on corresponding attributes
(e.g., higher performance perceptions of waiting
time), which in turn lead to more favorable behav-
ioral intention toward the service provider, retention,
and revenues. The negative impact is directly due to
the outlays made toward operational inputs aimed
at improving attribute performance perceptions and,
eventually, service quality and corresponding con-
sumer behaviors. It is in this regard that we modify
the SPC framework proposed by Heskett et al.
(1994). By explicitly including their negative impact
on profitability, management can make its invest-
ments in service quality financially accountable.
Thus, the approach we take blends elements of the
ROQ framework in the SPC framework.
An additional distinction of our application is its
simultaneous strategic and operational focus. The dis-
tinction between strategic and operational focus was
first made by Soteriou and Zenios (1999). Accord-
ingly, the strategic model is more of a conceptual,
analytical model that identifies the key linkages and
parameters for management. The operational model,
on the other hand, has an implementation focus,
and the goal is to provide efficiency benchmarks
and evaluations to the multiple subunits of a firm
in their ability to implement the core elements of the
strategic model. As Soteriou and Zenios (1999,
KAMAKURA, MITTAL, DE ROSA, AND MAZZON
Assessing the Service-Profit Chain
MARKETING SCIENCE/Vol. 21, No. 3, Summer 2002 297

p. 1222) remark, ‘‘Strategic benchmarking focuses on
the things that really matter and efficiency bench-
marks focus on how to do these things well.’’
Consider, for example, the linkage between opera-
tional inputs and service quality perceptions among
customers. For this link, an attempt to correlate oper-
ational inputs to customer perceptions of service
quality would constitute a strategic-level analysis.
The strategic-level analysis would enable manage-
ment to identify, from a variety of inputs, that subset
of inputs that has the largest impact on customer
quality perceptions. Operational analysis, on the
other hand, would compare the performance of vari-
ous subunits (e.g., bank branches) on their efficiency
in translating the operational inputs into consumer
perceptions. Thus, both strategic and operational
analysis is needed to execute and implement the
SPC in a firm. In a typical application, the strategic
model may first be estimated from aggregate data,
and then a subunit level operational analysis may be
conducted to compare each subunit on its ability to
execute the strategic model.
In implementing the SPC at a firm, several choices
must be made, each representing a constraint spe-
cific to the firm’s unique situation. First, depending
on data availability, the SPC may be implemented at
the customer level or the subunit level. While some
firms collect sufficient customer-level information
from each subunit, others do not. Ideally, the cus-
tomer-level analysis can be used to produce a strate-
gic model that can be implemented at the subunit
level to produce an operational model. A second
issue concerns the use of cross-sectional or time-
series data. Although time-series data provide superi-
or capability in terms of statistical analysis, matching
wave-to-wave satisfaction data for each individual
customer may be impossible, especially in industries
facing low retention rates (e.g., telecommunication).
If data for enough time periods are available at the
subunit level, causal analysis incorporating heteroge-
neity may be conducted. In the study we report,
data for a single-time period were available. Third,
firms must explicitly articulate the time horizon for
the application and conclusions. Typically, firms im-
plementing the SPC for the first time will focus on the
short term, although over time, additional analysis
can be undertaken. However, it may be useful to con-
sider the present value of financial variables, includ-
ing customer profitability and service quality
investments. The point is that every application of the
SPC is unique to the specific situation faced by the
firm and the data available to model the SPC. Choices
made in this regard typically represent data con-
straints and these should be delineated up front so
that management can understand the limitations of
the analysis. Interpretation of the results and imple-
mentation of the SPC should then proceed with cau-
tion, bearing in mind the limitations of the data
available.
The SPC: Gaps in Empirical Literature
Systematic empirical investigations of the SPC have
emerged only recently. As data needed to empiri-
cally test the SPC have started to become available,
empirical research assessing the SPC has emerged.
Noteworthy is the fact that most studies have been
done only within the last 2 to 3 years. Soteriou and
Zenios (1999) note that no study has comprehen-
sively modeled the SPC and that most empirical
studies have studied specific links in isolation. Thus,
there is extensive research linking attribute-level per-
formance perceptions to service quality (Parasura-
man et al. 1988), service quality perceptions to
customer behaviors (Bolton 1998), and customer be-
haviors to revenues (Carr 1999). However, these
studies tested each link separately rather than as a
simultaneous-equation model, leaving three critical
gaps in the application of SPC at a firm. First, these
studies have been unable to identify the causal and
mediating mechanisms that managers need to
understand to implement the SPC. Second, an exclu-
sive focus on isolated links has led to mixed and in-
consistent findings. Third, unless all of the pieces of
the puzzle can be put together in the context of a
single firm, it is hard to find acceptance for the SPC
framework, thus impeding its application among
firms. Regarding the first point, consider a study by
Loveman (1998), who sought to examine each of the
KAMAKURA, MITTAL, DE ROSA, AND MAZZON
Assessing the Service-Profit Chain
298 MARKETING SCIENCE/Vol. 21, No. 3, Summer 2002
SPC links separately. Loveman (1998, p. 30) found
results that were equivocal and concluded:
This simple analysis offers no way to exclude other inter-
pretations, including the claim that mediating links render
the more distant relationships invalid. Future research will
employ more sophisticated multi-equation methods to im-
prove tests of the service profit chain model and better dis-
criminate among competing explanations of equivocal
results.
Thus, explicating the various mediating mecha-
nisms, although complicated due to the use of multi-
equation models, can resolve issues about causal
mechanisms underlying the relationships between
more distal constructs in the SPC. Regarding the sec-
ond point, a comprehensive approach can poten-
tially resolve seemingly inconsistent findings, such
as the one found by Ittner and Larcker (1998, Study
2) and discussed earlier. Finally, a common barrier
to implementing research findings is their contextual
variance. Consider that literature finds a strong link
(theoretically and empirically) between overall satis-
faction perceptions and customer behavior (Bolton
1998, Mittal and Kamakura 2001). Yet, management
at a specific firm needs to put that finding in its own
context (i.e., observe it in its own data) and then sta-
tistically link it to other pieces of the SPC framework
to make meaningful decisions. In other words, de-
spite strong support for isolated links, a comprehen-
sive, ‘‘big picture’’ approach is needed at the firm
level to provide management with action priorities.
Past empirical studies tended to have either a stra-
tegic focus or an operational focus but never both.
Notably, the focus is driven by the discipline with
which the authors of a study are affiliated. Whereas
authors in marketing tended to test the SPC at the
strategic level, authors in operations management
have taken an operational focus. Studies with a strate-
gic focus identify key links and variables needed to
model the SPC at a firm, whereas studies with an
operational focus seek to identify the most efficient
ways in which the link identified in the strategic
model can be implemented. As highlighted by Soter-
iou and Zenios (1999), the interplay between these
two levels of analysis has not been formalized. Yet,
for managers implementing the SPC, simultaneous
guidance is needed at both levels. Managers need to
be told not only which links of the SPC to focus on
(strategic model) but also need to be guided in
terms of efficiently implementing each link (opera-
tional model).
Thus, from a research perspective, a comprehen-
sive empirical application that simultaneously as-
sesses all of the links of SPC and examines these
links both at the strategic and operational levels is
missing. Such an empirical application can illustrate
for most firms how to simultaneously assess all of the
links of SPC at the strategic and operational levels.
More importantly, this application focuses on man-
aging profitability, rather than on only maximizing
revenues or retention. In doing so, we gain several
qualitative insights. At the strategic level, we dem-
onstrate that operational investments designed to
improve service quality perceptions have a positive,
indirect effect on profitability, although this positive,
indirect effect is offset by their direct negative effect
on profitability. Operationally, our results show that
superior profitability accrues to those subunits of the
firm that are not only efficient in generating the de-
sired level of services but also in translating the
service perceptions into customer retention.
We estimate the strategic model using data from
5055 customers of the bank. In addition to the large
sample size, the data are unique in three respects.
First, customer survey data about quality perceptions
and behavioral intentions toward the bank were
available. Second, behavioral data on customer reten-
tion and profitability were collected at the customer
level and merged with the survey data. Finally, data
on operational inputs at branch level were also avail-
able. We present the results of the study cautioning
the reader that the results reported here are based on
customized measures available from the database of a
single firm. We are well aware that the application of
the SPC framework is likely to vary from firm-to-firm,
depending on the specific measures and metrics
available. We do not claim that ours is the best opera-
tionalization, nor do we claim to have provided the
definitive test of the SPC. Rather, we view our work
to be illustrative in nature, one that demonstrates
how the SPC can be comprehensively implemented at
KAMAKURA, MITTAL, DE ROSA, AND MAZZON
Assessing the Service-Profit Chain
MARKETING SCIENCE/Vol. 21, No. 3, Summer 2002 299

a firm, and in the process, also provide qualitative in-
sights that advance the satisfaction literature. Thus,
our work is closer in spirit to that of Simester et al.
(2000), who illustrate an implementation approach to
cross-cultural, customer satisfaction enhancement.
The SPC: Strategic Model
Our conceptualization of the SPC is shown in Figure
1. Although we follow models previously proposed
in the literature (see Bolton and Drew 1994, Heskett
et al. 1994), we also incorporate a direct negative
link from operational inputs to profitability. This is
in line with Rust et al. (1995), such that operational
resources directed toward service improvements are
posited to simultaneously have a positive and nega-
tive effect on profitability. Equations 1–4 posit a gen-
eral specification of the system described above:
Link A Attribute performance perceptions¼ fðresource investments in operational inputsÞ;
ð1Þ
Link B Behavioral intentions¼ fðattribute performance perceptionsÞ; ð2Þ
Link C Customer retention¼ fðbehavioral intentions; competitionÞ; ð3Þ
Links D and E Profit¼ g½fðcustomer retentionÞ;fðresource investmentsÞ�
ð4Þ
Each equation represents specific testable hypothe-
ses for an individual firm. Except for Link E (should
be negative), all of the relationships are expected to
be positive. As specified in Equation (1), the firm’s
interest is to allocate resources to operations that ex-
plicitly affect customer perceptions about perfor-
mance on specific attributes. At a bank, performance
perceptions of an attribute such as ‘‘waiting time in
line’’ can be affected by operational inputs such as
increasing tellers, modifying the lobby layout, or in-
creasing automation to provide faster service. It is
also critical for a firm to allocate resources to inputs
that explicitly affect customer perceptions. Unless
customers perceive the consequences of the opera-
tional inputs, investments in operational inputs are
unlikely to have an impact on overall satisfaction.
Although seemingly obvious, empirically linking op-
erational processes and attribute perceptions has not
been easy. Bolton and Drew (1994, p. 179) remark
that ‘‘Most companies are (as yet) unable to link en-
gineering/operations attributes to customers percep-
tions of service through statistical models.’’ Without
an explicit link between the two, firms cannot be
sure of their resource allocation strategy for service
quality improvements. The goal of a strategic model
is to statistically identify, from among the variety of
operational inputs, those that affect key attribute
perceptions.
As specified in Equation (2), attribute performance
perceptions affect global consumer evaluations.
These global evaluations1 can take the form of an
overall service quality rating (Bolton and Drew
1994), overall satisfaction rating (Anderson and Mit-
tal 2000), or an overall behavioral intent rating (Rust
et al. 2000). The theoretical basis for this link is lo-
cated in a multiattribute conceptualization of cus-
tomer satisfaction and service quality (Anderson
and Mittal 2000, Parasuraman et al. 1988). In such a
conceptualization, the global customer evaluation is
a function of attribute-level perceptions and the ex-
tent to which a change in attribute performance per-
ceptions leads to a change in the global evaluation
determines the importance of that attribute (Ander-
son and Mittal 2000). Resource allocation to various
attributes is based on their relative importance.
Thus, the goal in estimating this link in the strategic
model is to isolate the ‘‘key driver’’ attributes, or at-
tributes that have the highest importance in deter-
mining overall evaluations.
Per Equation (3), global consumer evaluations pre-
dict a variety of customer retention behaviors. The
theoretical basis for this link is the idea of attitude
intention behavior consistency (Morwitz and Schmit-
1In this paper, we do not address the debate about which of these
constructs is an appropriate global evaluation. Our position is that
the choice and appropriateness of the construct is dependent on
the specific situation faced by a firm.
KAMAKURA, MITTAL, DE ROSA, AND MAZZON
Assessing the Service-Profit Chain
300 MARKETING SCIENCE/Vol. 21, No. 3, Summer 2002

tlein 1992), whereby consumer behavior, on average,
follows attitudes and intentions. Empirically, it
has been demonstrated that global evaluations such
as satisfaction and intentions affect behaviors
(e.g., Bolton 1998, Mittal and Kamakura 2001). Note
that in any SPC application, the global evaluation
used—satisfaction, service quality rating, or behav-
ioral intent—may be specific to the firm. Similarly, the
behavioral outcomes and their metrics are expected to
vary from firm to firm. For instance, a telephone serv-
ice provider may be interested in measuring the dura-
tion of a customer’s stay with it (Bolton 1998). For
durable goods such as cars, the actual repurchase of
the same brand may be the behavior of interest. How-
ever, in the financial services industry where a single
customer can have multiple accounts with different
providers, firms find it useful to monitor ‘‘share of
wallet’’ and duration of the customer’s relationship
with the firm. The key is to ensure that behaviors
monitored should be related to revenues and/or prof-
itability. Furthermore, factors such as industry com-
petitiveness (Anderson and Mittal 2000) can
moderate the extent to which global evaluations of
service are related to desirable customer behaviors.
Thus, instead of assuming that higher global evalua-
tions will translate into more desirable behaviors, a
firm must specifically test for the existence, magni-
tude, and functional form of the underlying relation-
ship. Links D and E in Figure 1 are captured in
Equation (4). Accordingly, customer retention behav-
iors have a positive impact on profitability (Link D),
and investments made in operational inputs have a
direct negative impact on profitability (Link E).
Implementing the SPC: Operational Model and
Assessment
Once the strategic model has been estimated and
evaluated, a firm can then proceed to examine the
relative efficiency with which each subunit is imple-
menting the strategic model. This constitutes the
operational analysis. For this, researchers and man-
agers jointly decide on the key links (identified in
the strategic model) that must be emphasized and on
the basis on which the subunits are to be compared.
Typically, the subunit comparison is based on their
efficiency in translating inputs to desired outputs using
operations management techniques such as Data En-
velopment Analysis (DEA). This technique, detailed
later, measures the efficiency (ratio of output to in-
puts) of a bank branch in relation to a virtual branch
that represents the ‘‘best practice’’ or benchmark at
the same scale of operations In other words, rather
than comparing each branch to the best of all
branches within the firm, DEA defines a ‘‘virtual’’
branch as a convex combination of efficient branches
that operate at similar scale levels (in terms of in-
puts utilized and outputs produced), which would be
directly comparable to the branch under evaluation.
Thus, this efficiency analysis is not focused on output
maximization alone and is fully consistent with the
SPC and ROQ approaches that focus on maximizing
profitability rather than on service quality. Moreover, this
analysis takes into account potential differences in
economies of scale across the multiple units, produc-
ing more equitable efficiency assessments.
Empirical research on operational-level assess-
ments of the SPC has been sparse, although some re-
cent studies are relevant (cf. Kimes 1999, Frei and
Harker 1999, Simester et al. 2000). Kimes (1999) used
an output maximization approach to compare vari-
ous hotels in the Holiday Inn chain on their quality
performance and revenues. Frei and Harker (1999)
compared the efficiency of service delivery process
but focused only on service design issues. Finally,
Simester et al. (2000) compared several units of an
international firm using a quasi-experiment. Their
assessment only focused on the operational inputs,
perceptions of attribute performance, and satisfac-
tion. As such, no assessment of retention or profit-
ability was made. We address all of these issues by
comparing different subunits on (1) resource alloca-
tion, (2) customer perceptions, and (3) customer re-
tention. We then demonstrate the profit implications
of such comparisons.
Strategic and Operational Assessment of SPC
Before discussing the empirical results, it is impor-
tant to understand how the strategic and operational
models fit together. These two models form a two-
KAMAKURA, MITTAL, DE ROSA, AND MAZZON
Assessing the Service-Profit Chain
MARKETING SCIENCE/Vol. 21, No. 3, Summer 2002 301

step process and should not be treated as substi-
tutes. The focus of the strategic model is on extract-
ing, from a large set of data and variables, key
conceptual relationships that can parsimoniously ar-
ticulate the SPC. For instance, management may ask:
Among the 15 attribute performance perceptions
measured in our customer survey, which should we
focus on? Among the several customer behavior
measures available in the accounting database,
which should we consider? These questions are an-
swered in the process of estimating the strategic
model. In our experience, overly complex models
can stymie implementation.
Although the strategic model provides a blue print
to top management, it alone is not useful to guide im-
plementation considerations, especially at individual
subunits. For instance, think of a bank where manage-
ment has identified that ATMs positively affect ser-
vice quality perceptions and retention. However, the
extent to which an individual branch can change
service quality perceptions and retention in response
to installing additional ATMs will vary from branch-
to-branch. A branch that caters primarily to college
students may witness a stronger relationship than a
branch that caters primarily to senior citizens. Thus,
each branch needs guidance for implementing the
strategic model in an efficient manner. The operation-
al model provides such guidance.
In effect, the operational model ‘‘customizes’’ the
strategic model for specific subunits by incorporat-
ing the unique situation faced by the particular sub-
unit. Another way of thinking about this is that the
strategic model provides the key relationships and
metrics that are needed to ensure that all subunits of
the firm follow a consistent strategy. In tandem, the
operational analysis provides each branch with a
snapshot of its unique position so that the branch
can implement the strategic model in the most effi-
cient way. Thus, simultaneously implementing the stra-
tegic and operational model enables a firm to have a
centralized focus with decentralized implementation. In
summary, the strategic model and operational model
are complements rather than substitutes, and both
are needed for successfully implementing the SPC at
a service firm with multiple subunits.
Research SettingThe research was conducted in conjunction with a
leading national bank in Brazil whose identity has
been disguised for confidentiality reasons. Survey
data was compiled as part of a customer satisfaction
initiative. A total of 5,055 customers from more than
500 branches were interviewed based on a propor-
tionate sampling plan, such that more customers
were interviewed from the larger branches. Each in-
dividual customer’s marketing survey data was
linked to a number of operational metrics. First, be-
havioral measures of retention such as the length of
the customer’s relation with the bank, the deposit
amount, and number of transactions were obtained
and merged with the survey data. Second, the main
branch used by each customer was identified, and
operational inputs used at that branch were obtained
and merged with the data set. For instance, variables
such as the number of employees and the number of
available ATMs at the branch were merged with
each customer’s record.
As mentioned earlier, our analysis is somewhat
unique, as the variables and their measures are spe-
cific to the sponsoring organization. However, the
measures used are considered most actionable by this
bank’s management. For instance, the two perceptual
dimensions on which attributes were measured in
these data—equipment and personnel—are unique to
this bank, and other banks or organizations may very
well focus on other attributes. Similarly, even though
retention and profit measures were taken at a later
time period than when satisfaction measures were
taken, we only had access to single-period data.
Thus, although we have a time lag between customer
perceptions and measures of retention and profitabil-
ity, issues such as persistence and unobserved hetero-
geneity cannot be directly addressed.
Strategic Model(Customer-Level Analysis)The customer-level analysis used four types of mea-
sures: operational inputs to attribute-level percep-
KAMAKURA, MITTAL, DE ROSA, AND MAZZON
Assessing the Service-Profit Chain
302 MARKETING SCIENCE/Vol. 21, No. 3, Summer 2002

tions, survey measures on attribute performance per-
ceptions and overall satisfaction, behavioral meas-
ures of retention, and financial measures of
profitability. Equations (1)–(4) and Figure 1 provided
the framework that guided the empirical testing.
Model Specification
The model specification shown in Figure 2 can be
expressed using the following structural equations:
PERPRCi ¼ wo1 þ w11PEREFFi þ ei1; ð5ÞEQUPRCi ¼ wo2 þ w12EQUEFFi þ ei2; ð6ÞINTENTi ¼ wo3 þ w13PERPRCi þ w23EQUPRCi þ ei3; ð7Þ
CUSTBEHi ¼ wo4 þ w14INTENTi þ ei4; ð8ÞPROFITi ¼ wo5 þ w15PEREFFi þ w25EQUEFFi
þ w35RETENi þ ei5: ð9Þ
The construct and variable definitions along with
the measures corresponding to these equations are
shown in Appendix 1. Note that the specific variable
definitions and measures are unique to this applica-
tion and each firm may need to adapt them to its
particular situation.
Analysis Plan
The expected weight for each structural path testing
the SPC links is summarized below.� The bank invests operational resources in two
main areas: equipment (EQUEFF) and personnel
(PEREFF). These two constructs are measured
based on operational inputs. For instance, PER-
EFF, is measured as a latent construct compris-
ing of number of customers per manager,
number of customers per teller, and number of
customers per employee (with inverted signs).
Figure 2 Service-Profit Chain: Strategic Model
Notes. All estimates are significant at p , 0.05. Thick lines indicate structural relationships.
KAMAKURA, MITTAL, DE ROSA, AND MAZZON
Assessing the Service-Profit Chain
MARKETING SCIENCE/Vol. 21, No. 3, Summer 2002 303

� Link A: w11.0; w12.0. For this bank, the two
key areas of performance evaluations measured
in the survey pertain to customer perceptions of
personnel (PERPRC) and equipment (EQUPRC).
For instance, performance ratings of various
front-line employees (e.g., CLERK, TELLER, etc.)
constitute the latent variable PERPRC. Similarly,
consumers’ assessments of equipment (EQUIP)
and facilities (FACIL) constitute the latent con-
struct perceptions of equipment (EQUPRC).
� Link B: w13 . 0; w23 . 0. According to this link,
perceptions of personnel (PERPRC) and equip-
ment (EQUPRC) affect consumers’ behavioral
intentions (INTENT).
� Link C: w14 . 0. According to this link, custom-
er’s overall evaluation affects retention. For this
bank, customer behavior is a latent construct
(CUSTBEH) comprising three outcomes. These
were a percentage of their funds that a customer
keeps at this bank or share of wallet
(BNKSHARE), number of transactions per
month (TRANSACT), and customer’s tenure
with the bank (YEARS).
� Link D: w35 . 0. This hypothesis specifies a pos-
itive effect of retention on profitability. Profit-
ability (PROFIT) is measured as the monthly
average profits generated by customers.
� Link E: w15 , 0; w16 , 0. Finally, a direct nega-
tive impact of investments in operational inputs
on profitability is hypothesized. For this bank,
operational efforts in personnel (PEREFF) and
equipment (EQUEFF) have a direct negative ef-
fect on profitability.
The analytical plan consisted of specifying the
structural equation model and testing the structural
path pertaining to each hypothesis.
Results
Due to missing data, an effective sample of 3489 cus-
tomers was used to compute rank order correlations
among the variables. This reduction in sample
occurred due to listwise deletion (when data for a
single variable are missing, the entire observation is
deleted). To ascertain the extent of bias in the
sample with missing data, we compare the mean for
each variable for the 3489 observations with the
mean from the original sample using a t-test. For all
of the variables, the means are statistically identical
(all ps . 0.10). Table 1 provides some demographic
information on the sample which, when examined
by the bank’s management, was considered repre-
sentative of its customer base.
The correlations were used to estimate the model
shown in Figure 2. The model is estimated using the
AMOS module in SPSS software and it uses a maxi-
mum likelihood estimation procedure. A key benefit
of this software is its ease of use in applied settings
due to its graphical interface. All estimates shown in
Figure 2 are standardized estimates and are statisti-
cally significant at the 0.05 level. The model-v2(df585)
is 4244.28 and is significant at p , 0.001. However,
chi-square is not an appropriate-fit statistic due to
Table 1 Key Sample Characteristics
Sample Characteristics Percent/Average (%/avg)
Age30 years or less 1431–50 years 5051–60 years 19More than 60 years 17
EducationElementary or less 13High school 32College or more 55
GenderFemale 35Male 65
Phone OwnershipYes 83No 17
Average number of years usingthis bank
13.5 years
Average percentage of funds atthis bank
44.4
Number of branches representedin the sample
521
Average number of respondentsper branch
9.9
KAMAKURA, MITTAL, DE ROSA, AND MAZZON
Assessing the Service-Profit Chain
304 MARKETING SCIENCE/Vol. 21, No. 3, Summer 2002

the unusually large sample size. The Goodness-of-
Fit Index (GFI index) for the model is 0.904 with a
root-mean-square residual (RMSR) of 0.14, indicating
that the model fits well with the data. Furthermore,
the AIC criterion for the estimated model was
4,344.28, compared to 12,359.49 for the naıve (inde-
pendence) model.
All of the links in the SPC framework are sup-
ported. Supporting Link A, resource investments in
terms of personnel have a positive effect on custom-
er perceptions of personnel (w11 5 0.22, t 5 9.28,
p , 0.01) and resource investments in terms of
equipment have a positive effect on customer per-
ceptions of equipment (w12 5 0.08, t 5 4.89, p ,
0.01). In support of Link B, customer perceptions of
personnel (w13 5 0.62, t 5 49.01, p , 0.0001) and
equipment (w23 5 0.19, t 5 16.19, p , 0.001) have a
positive impact on customer’s overall behavioral in-
tentions. In support of Link C, we find that customer
intent to recommend the bank to others has positive
impact on consumer behaviors (w14 5 0.27, t 5 9.33,
p , 0.01), and in support of Link D, we find a posi-
tive relationship between customer retention and
profitability (w35 5 0.13, t 5 6.74, p , 0.01). Most
importantly, as postulated in Link E, profitability of
the customer to the firm is directly and negatively
influenced by resource investments in the area of
equipment (w25 5 20.04, t 5 22.77, p , 0.05) and
personnel (w15 5 20.12, t 5 26.11, p , 0.01).
The results of this strategic model show top manage-
ment the key linkages on which to focus their effort.
However, one might ask: Would it not be more parsi-
monious to directly link customer attribute percep-
tions to customer behaviors? Stated differently: Is
there any value added by including customer inten-
tions in the model? Theoretically, it can be argued that
it is only through intentions (or other such global eval-
uations) that attribute perceptions affect behaviors.
Statistically, we tested an alternative model in which
attribute performance perceptions (EQUPRC and
PERPRC) also had a direct impact on customer behav-
ior (CUSTBEH). This model was rejected in favor of the
proposed model (AIC 5 5,762.19 compared to 4,244.28
for the proposed model). Thus, for this firm, inclusion
of intention is warranted. Moreover, from a continuous
tracking perspective, intention data are useful to the
firm.
This strategic model confirms that, with respect to
profitability, managers at this bank must carefully bal-
ance the positive indirect effect of resources invested to
increase service quality and retention with their nega-
tive direct effect. The results also reveal unique in-
sights for the bank providing the data. At the
strategic level, the bank wanted to decide the relative
emphasis it would put in technology versus human
factors. The results suggest that, perceptions related
to personnel are more consequential than equipment
for behavioral intentions. However, resources allo-
cated to personnel are more consequential for profit-
ability than resources allocated to equipment. At an
overall level, this suggests that management should
carefully evaluate the extent to which it emphasizes
human versus technology factors in its service and
profitability strategy. Still, these results are specific to
this bank and are unlikely to be universally applica-
ble. For instance, it could be that customers of this
Brazilian bank are not as technologically oriented,
hence the higher importance given to human factors.
More importantly, when deciding whether to empha-
size human factors or technology at a particular
branch, top management needs to be sensitive to the
specific conditions and need for the branch. Informa-
tion regarding branch-level decisions can be gleaned
from the operational analysis described next.
Operational Model(Branch-Level Efficiency Analysis)The strategic model formalizes a conceptual model
for top management that can be followed through-
out the bank at all its branches. However, the rela-
tive efficiency with which each branch is able to
translate the inputs for each link to its outputs is
likely to vary. Thus, each branch manager needs to
understand how well the branch is doing relative to
others. This question is answered using Data Envel-
opment Analysis (DEA) (Charnes et al. 1994).
DEA has been applied in a variety of contexts,
such as evaluation of school districts (Grosskopf
et al. 1999), university departments (Post and Spronk
KAMAKURA, MITTAL, DE ROSA, AND MAZZON
Assessing the Service-Profit Chain
MARKETING SCIENCE/Vol. 21, No. 3, Summer 2002 305

1999), power plants (Athanassopoulos et al. 1999),
and bank branches (Sherman and Gold 1985, Schaff-
nit et al. 1997, Soteriou and Stavrinides 1997, Tha-
nassoulis 1999, Zenios et al. 1999). DEA measures
the relative efficiency of multiple decision-making
units (DMUs) (bank branches in this case) producing
multiple outputs from multiple inputs. Efficiency for
a DMU is measured by comparing the inputs it
needs to those needed by a combination of the most
efficient units operating under similar conditions to
produce the same levels of outputs. Rather than
evaluating a DMU in relation to all other DMUs,
DEA identifies a set of efficient units operating simi-
larly to the unit under analysis. These efficient units
(or branches) operating under similar conditions com-
prise one facet of the production efficiency frontier.
DEA compares the inputs and outputs of all DMUs,
identifies the most efficient set of DMUs to which a
particular one will be compared, and creates a ‘‘vir-
tual’’ production unit as a convex combination of
the units in the efficiency frontier. This ‘‘virtual’’
production unit serves as a benchmark against
which the relative efficiency of a unit can be deter-
mined. An advantage of DEA is that it accommo-
dates economies, as well as diseconomies, of scale
by only comparing units operating at similar levels,
identifying a piecewise linear efficiency frontier.
With this piecewise linear frontier relating inputs to
outputs at the branch level, the DEA model accom-
modates the nonlinearities in the relationships be-
tween service perceptions, intentions, and actual
behavior (Anderson and Mittal 2000).
These concepts are illustrated in Figure 3, which
depicts the inputs utilized and outputs produced by
six DMUs. A simple comparison of outputs and in-
puts ratios would indicate B as the only efficient
DMU. In contrast, DEA identifies the Pareto frontier
across all units and evaluates each unit in relation to
the relevant facet of the frontier. Unit Z in this illus-
tration would be deemed inefficient because a con-
vex combination of DMU’s B and C could produce
more outputs than Z, using the same level of inputs
or the same level of outputs and utilizing less inputs.
For this bank we chose an approach similar to the
multistage DEA proposed by Soteriou and Zenios
(1999). These authors conceptualize a service firm
(e.g., a bank) as consisting of systems of operations,
service quality, and profits. They propose a three-
stage model for assessing the operations, quality,
and profit efficiency of bank branches. Their three-
stage model includes the following:
� ‘‘Operational Efficiency’’ DEA Model. This uses the
resources (labor and equipment) available to the
branch manager, as well as the number of ac-
counts serviced by the branch, as inputs of the
production process and the workload (number
of transaction hours at various accounts) as out-
puts.
� ‘‘Service Quality’’ DEA Model. This model uses
essentially the same inputs as the ‘‘Operational
Efficiency’’ model (labor, equipment, and num-
ber of accounts serviced). However, the output
consists of perceptions of service quality by em-
ployees (as proxies for customer perceptions) of
the bank.
� ‘‘Profitability Efficiency’’ DEA Model. This stage of
the Soteriou and Zenios (1999) model uses simi-
lar inputs to the other two models, but profits
as outputs.
For our purposes, a different formulation is
needed. First, we combine the operational and ser-
Figure 3 Data Envelopment Analysis
KAMAKURA, MITTAL, DE ROSA, AND MAZZON
Assessing the Service-Profit Chain
306 MARKETING SCIENCE/Vol. 21, No. 3, Summer 2002

vice quality stages into a single model. We do this to
consider service quality (as perceived by customers)
as a direct output from the production process and
to use the volume of transactions and customers
served as outputs from the process, rather than in-
puts. We label this first stage as the ‘‘Operational
Efficiency Model,’’ because it measures the efficiency
of the branch in producing service quantity and
quality. Next, we use a second-stage process that has
measures of customer behavior as outputs, instead
of profits. This second-stage model is called the
‘‘Customer Behavior Model.’’
Our choice of customer retention (as opposed to
profitability) as the final output in our two-stage
model is motivated by an interest in marketing-
related outcomes and by a concern that a focus on
profits alone will lead to a short-term orientation in
the assessment of branch managers. Second, as an
output, profit already embeds the impact of all in-
puts, in the form of costs, which might render a
measure of profit efficiency invalid. Third, as argued
by Bolton and Drew (1994, pp. 176–177) service
quality and retention are better ‘‘output’’ measures
than profitability for comparing subunits, as they are
less likely to be volatile. Profitability alone could be
more sensitive to factors such as accounting changes
and competitive situation. However, to the extent
that profitability is the ultimate goal of increasing
service quality and retention, it is imperative to vali-
date the model by relating the efficiency classifica-
tion of different branches to profitability. For
instance, is it indeed the case that more efficient
branches are more profitable? If such is the case,
then management has been able to identify the
‘‘right’’ strategic model to guide branch-level imple-
mentation efforts. Thus, we use profits as an external
criterion to validate the efficiency assessments ob-
tained through our two-stage model.
Operational Efficiency Model
In this first stage, we consider a process in which
the branch manager uses the firm’s resources to
serve customers, producing service transactions and
favorable overall customer evaluations (behavioral
intentions in this data set). We want to assess the
branch manager’s efficiency in allocating the firm’s
resources, relative to other branches within the bank,
operating at similar levels. This first stage of our
model is similar to the model previously used to as-
sess the productivity of bank branches (Sherman
and Gold 1985, Berger et al. 1997, Zenios et al. 1999).
A key distinction of our formulation, however, is
that we include overall evaluations as one of the
outcomes in the production of services. We consider
the following production factors in this process:
Inputs
TELLERSn 5 number of full-time-equivalent tellers
working in branch n during the planning period.
MANAGERSn 5 number of managers working in
branch n during the planning period.
EMPLOYEESn 5 number of full-time equivalent
hourly employees in branch n.
ATMSn 5 number of ATM units located within
branch n. The allocation of ATMs is not under di-
rect control by the branch manager. Therefore, this
factor is taken as an allocative input.
Outputs
CUSTOMERSn 5 number of customers using branch
n as their primary branch.
TRANSACTn 5 number of transactions produced by
branch n during the planning period.
INTENTn 5 proportion of respondents (to the cus-
tomer satisfaction survey) from branch n who
would ‘‘highly recommend’’ the branch to friends.
This ‘‘top-box’’ measurement of behavioral inten-
tions is needed because the DEA model requires
ratio-scaled measurements.
Operational efficiency is measured by solving the
following linear programming problem:
min so þXi¼1;3
eaio þXj¼1;3
ebjo þXk¼1;3
edko
( )
s:t:
KAMAKURA, MITTAL, DE ROSA, AND MAZZON
Assessing the Service-Profit Chain
MARKETING SCIENCE/Vol. 21, No. 3, Summer 2002 307

Input Constraints
� TELLERSoso þ a1o þXn
knTELLERSn ¼ 0;
�MANAGERSoso þ a2o þXn
knMANAGERSn ¼ 0;
� EMPLOYEESoso þ a3o þXn
knEMPLOYEESn ¼ 0:
Allocative Input Constraints
�ATMSo þ do þXn
knATMSn ¼ 0:
Output Constraints
� CUSTOMERSo � b1o þXn
knCUSTOMERSn ¼ 0;
� TRANSACTo � b2o þXn
knTRANSACTn ¼ 0;
� INTENTo � b3o þXn
knINTENTn ¼ 0;
Xn
kn ¼ 1;
kn > 0; n ¼ 1; 2; . . . ;N;
aio > 0; i ¼ 1; 2; 3;
bjo > 0; j ¼ 1; 2; 3;
dko > 0; k ¼ 1; 2; 3;
where
aio ¼ input slack for factor i; indicating the amount
of overutilization of input i
bjo ¼ output slack for factor j; indicating the under-
production of output j
do ¼ allocative input slack indicating the amount of
overutilization of the allocative input.
Customer Behavior Model
This second DEA model evaluates the branch man-
ager’s efficiency in transforming customers’ behav-
ioral intentions into retention-related behavioral
metrics for customers who use the bank as their
main provider of financial services. The following
production factors are considered in this model:
Inputs
INTENTn 5 proportion of respondents (to the cus-
tomer satisfaction survey) from branch n who
would ‘‘highly recommend’’ the branch to friends.
Outputs
SHAREn 5 average share of respondent’s funds at
the bank. This is the average reported proportion
of funds kept in this particular bank among re-
spondents using branch n as their main branch.
YEARSn 5 average number of years among respond-
ents using branch n as their main branch.
FUNDSn 5 average volume of funds kept in the
bank among respondents using branch n as their
main branch.
Customer retention efficiency is measured by solv-
ing the following linear programming problem:
min so þ ea þXk¼1;3
edko
( )
s.t.
Input Constraints
�INTENToso þ ao þXn
knINTENTn ¼ 0;
Output Constraints
� SHAREo � b1o þXn
knSHAREn ¼ 0;
� YEARSo � b2o þXn
knYEARSn ¼ 0;
� FUNDSo � b3o þXn
knFUNDSn ¼ 0;
Xn
kn ¼ 1;
kn > 0 n ¼ 1; 2; . . . ;N;
ao > 0;
dko > 0; k ¼ 1; 2; 3;
KAMAKURA, MITTAL, DE ROSA, AND MAZZON
Assessing the Service-Profit Chain
308 MARKETING SCIENCE/Vol. 21, No. 3, Summer 2002

where
ao ¼ input slack indicating the amount of over-
utilization of the input.
bjo ¼ output slack for factor j; indicating the under-
production of output j
Results
We apply the two-stage DEA model to a sample of
162 branches for which we had at least 10 complete
customer satisfaction surveys. For confidentiality
reasons, each variable from internal banking records
is disguised by a constant factor. Aside from the
measurement of efficiency at each stage, the DEA
model also provides diagnostics to the branch man-
ager, indicating the degree of underproduction for
each output and overutilization of each input. A cus-
tomized implementation plan can be devised for
each branch as these efficiency metrics are produced
for each branch. A detailed discussion of results for
each branch would be beyond the scope of this
study, so we discuss the results for a single branch
in detail for illustrative purposes. Table 2 shows the
results for branch #154, a relatively inefficient branch.
DEA1 for Branch #154 (Operational Efficiency
Model). Branch #154 is inefficient in its utilization of
labor and equipment in the production of positive
behavioral intentions and services transactions (its
efficiency index is 0.495). According to the results in
Table 2, a ‘‘virtual’’ branch formed by combining
branches #564, 56, 331, and 29 with weights 0.431,
0.013, 0.243, and 0.314, respectively, would produce
the same levels of outputs, utilizing only a fraction
of the inputs required by branch #154. This virtual
branch would produce the same volume of transac-
tions, serve the same number of customers, and pro-
duce 21.5% more customer giving the ‘‘top-box
score’’ on the behavioral intention scale (43.6% top-
box score as opposed to the observed 22.1%). This
would be accomplished while consuming only 0.495
Table 2 DEA Evaluations of Branch #154
DEA1: Service Operations (Efficiency 5 0.495)Inputs Outputs
DMU Frontier Tellers ATMs Managers Employees Transact Customers Intent
564 0.431 52.5 13.5 6.0 148.5 1,577.3 30,238.5 13.356 0.013 42.0 9.0 9.0 24.0 458.8 15,403.5 51.2331 0.243 22.5 6.0 6.0 78.0 906.3 16,930.5 37.029 0.314 22.5 4.5 6.0 73.5 905.9 7,365.0 90.0
Virtual#154Slacks
35.7 8.8 6.0 106.3 1,189.3 19,639.5 43.672.0 19.5 19.5 214.5 1,189.3 19,639.5 22.10.0 10.7 3.6 0.0 0.0 0.0 21.5
DEA2: Customer Retention (Efficiency 5 0.783)
Input Outputs
DMU Frontier (Intent) Share Years Funds
123 0.464 8.8 51.0 22.4 4,980.2136 0.355 21.4 72.1 28.5 5,736.9568 0.181 30.8 51.2 29.2 43,581.2
Virtual#154Slacks
17.3 58.5 25.8 12,229.622.1 49.3 25.8 12,229.60.0 9.2 0.0 0.0
KAMAKURA, MITTAL, DE ROSA, AND MAZZON
Assessing the Service-Profit Chain
MARKETING SCIENCE/Vol. 21, No. 3, Summer 2002 309

of the TELLERS, MANAGERS, and EMPLOYEES
utilized by branch #154. For instance, regarding
MANAGERS, the virtual branch would use only
0.495 of the levels utilized by branch #154 and still
have a ‘‘slack’’ to spare. Even if the ‘‘virtual branch’’
used only 9.6 MANANGERS or 49.5% of 19.5 manag-
ers that branch #154 uses, it would still have a slack
of 3.6 MANAGERS to spare. Thus, branch #154
has room for improvement in utilizing managers.
Finally, with respect to EMPLOYEES, branch #154
uses 214.5 employees, whereas the virtual branch
would need 49.5% fewer, or 106.3 employees.
Finally, this virtual branch would also need 10.7
fewer ATMs than branch #154. Note that, because
ATMs is an allocative input, not under direct control
of the branch manager, it does not directly affect the
efficiency index of the branch.
DEA2 for Branch #154 (Customer Behavior
Model). With an efficiency index of 0.783, branch
#154 is also inefficient in the second stage though to
a lesser extent than the first stage. This inefficiency
is compared to the virtual branch comprised of
branches #123, 136, and 568 with respective weights
of 0.464, 0.355, and 0.181. With only 78.3% of the
top-box score (17.3%, as opposed to 22.1%), the ‘‘vir-
tual’’ branch is able to generate the same level of
customer tenure (YEARS 5 25.8) and deposit levels
(FUNDS 5 12, 229.6) as branch #154. With regard to
share-of-wallet, the virtual branch would use only
78.3% of the resources used by branch #154 and pro-
duce 9.2 units more shares-of-wallet.
Overall Results. Similar to branch #154, custom-
ized results are obtained for each branch. These re-
sults are coupled with a qualitative assessment of the
unique situation in which the branch operates—a cus-
tomer, capabilities, and competition audit—to identi-
fy reasons that may be inhibiting the branch from
reaching a high level of efficiency. Thus, a decision-
calculus type approach where the branch managers
work in close cooperation with top management is re-
quired to ensure that the strategic model is being fully
implemented. A key advantage of this approach is
that while the core strategic model is common across
all branches, branch managers retain the flexibility of
adapting it to their unique situation.
From top management’s perspective, it is also in-
structive to validate the operational implementation.
The logic is as follows: If, indeed, the operational
model is able to classify branches based on their effi-
ciency in implementing the strategic model, and if
Table 3a Analysis of Variance for Branch-Level Profitability
Model Mean Square Error (df) F-Statistic P-Value
DEA1: (Efficient versus Inefficient) 72,833.9 (1) 23.70 0.001DEA2: (Efficient versus Inefficient) 81,368.7 (1) 26.48 0.001DEA1 x DEA2 68,531.9 (1) 22.30 0.001Error 3,072.9 (158)
Note. Branch profit is average profits per customer, measured in local currency after a linear transformation (for confidentiality reasons).
Table 3b Profitability Comparison Between Efficient and Inefficient Branches
DEA1 Levels DEA2: Inefficient DEA2: Efficient Total
DEA1: Inefficient 115.81 (122) 123.60 (5) 116.11 (127)DEA1: Efficient 118.49 (30) 300.24 (5) 144.45 (35)Total 117.11 (152) 211.92 (10) 122.24 (162)
Note. Parentheses include number of branches in each cell.
KAMAKURA, MITTAL, DE ROSA, AND MAZZON
Assessing the Service-Profit Chain
310 MARKETING SCIENCE/Vol. 21, No. 3, Summer 2002

efficiency matters for profitability, then efficient
branches should be more profitable. To test this idea,
the branches are compared based on their profitabil-
ity. Table 3 summarizes the two-stage model across
all 162 branches: 35 were at the efficiency frontier
for ‘‘operational efficiency’’ and 10 were at the effi-
ciency frontier for ‘‘customer behavior.’’ A cross-clas-
sification of the branches shows that 5 branches are
efficient in both respects, whereas 122 branches are
inefficient in both respects. Next, we compared the
branches to test if efficiency, indeed, moderates the
relationship between implementation and profitabil-
ity. This comparison of profitability among efficient
and inefficient branches identified by the two-stage
DEA model provides an additional test of the exter-
nal validity of the DEA analysis.
A 2 3 2 analysis of variance with profitability as
the dependent variable and efficiency on DEA1 and
DEA2 as independent variables was conducted. Re-
sults are summarized in Tables 3a and b. In this
analysis, efficiency for the DEA is coded as a two-
level factor. Thus, DEA1 is a two-level factor (effi-
cient, inefficient) as is DEA2 (efficient, inefficient).
The overall model is significant (F3,158 5 17.78, p ,
0.0001, adjusted R2 5 24%), and there is a main ef-
fect for efficiency at DEA1 (F1,158 5 23.70, p ,
0.0001) and DEA2 (F1,158 5 26.48, p , 0.0001). More
interestingly, there is a significant interaction (F1,158
5 22.3, p , 0.0001) between DEA1 and DEA2 (see
Figure 4). Branches that are efficient at both stages
produce higher average profits per customer than
branches that are efficient on one stage alone. Also,
branches that are inefficient in both stages are no
worse than branches that are efficient in only one
stage. This implies that units focusing on operational
efficiency or customer retention alone are less effective in
terms of profitability. Branch managers who focus on
operational efficiency alone may drive costs down
and, therefore, have higher profitability. However, if
they combine such efforts with retention manage-
ment, profitability almost doubles. For the bank’s
management this is a key test of the success of the
strategic model and also indicates that additional
profitability gains are possible via proper implemen-
tation. This also indicates that branch managers have
substantial leverage in affecting profitability,
although some of that may be related to the unique
situation in which the branch operates. Top manage-
ment can take that into account and reward branch
managers accordingly (e.g., based on their efficiency
in translating certain inputs into outputs rather than
on raw satisfaction scores alone).
Note that this analysis does not discern why some
branches are more efficient than others. To shed light
on such issues, additional data on the context (cus-
tomer, capabilities, competition) may be gathered,
which may explain some of the variability in the rel-
ative efficiency of the branches. For now, only quali-
tative assessments can be made to determine
reasons for relative performance differences. For in-
stance, management at branch #154 may conduct a
situation analysis and find that the lower level of re-
tention in response to behavioral intent is driven by
the fact that its customer base consists of younger
college students and/or because there are many
other banks operating in that area. Based on such a
decision calculus-type approach (combining manage-
rial judgment and statistical modeling), better deci-
sions can be made. Note that if this bank had only
relied on the strategic model, it may simply have
concluded that all branches having a certain level of
global evaluation must have the corresponding level
Figure 4 Profit Comparison Across Groups with DifferentEfficiency
KAMAKURA, MITTAL, DE ROSA, AND MAZZON
Assessing the Service-Profit Chain
MARKETING SCIENCE/Vol. 21, No. 3, Summer 2002 311

of customer behaviors without paying attention to
the branch’s ability to translate intent into corre-
sponding behaviors.
DiscussionThe strategic-level analysis reported here advances
the growing body of empirical research investigating
the viability of the SPC framework to managing
profitability. First, at the strategic level, we simultane-
ously investigate all of the key links in the SPC. This
simultaneous investigation not only clarifies the
mediated nature of relationships among distal con-
structs but also explicates the dual mechanism by
which investments in operational inputs affect prof-
itability. Thus, the strategic model reported here ad-
vances past research documenting only a positive
relationship between satisfaction quality and finan-
cial outcomes. Managers may keep making opera-
tional expenses to increase satisfaction and service
quality, believing that it will positively affect finan-
cial outcomes. Our formulation of the SPC shows
that, for an individual firm, higher service quality is not
an unconditional guarantee of profitability and explains
why some firms remain unprofitable despite high
levels of quality. Conceptually, then our contribution
lies in linking the SPC to the ROQ framework pro-
posed by Rust et al. (1995).
Second, the operational-level analysis using DEA
provides specific implementation guidance to indi-
vidual subunits of a firm. The ‘‘input-output’’ focus
of the DEA approach explicitly forces management
to classify its subunits based on their efficiency in
specific stages of the SPC. Firms that restrict them-
selves to only the strategic-level analysis may
mistakenly take an output-maximization approach
when comparing its subunits. For instance, as yet
employee compensation in many firms is based only
on the overall satisfaction score achieved (cf. Hauser
et al. 1994) without regard to the level of resources
utilized to achieve the score. As such, employees
may focus only on satisfaction or service quality
maximization with no regard to the operational ex-
penses made toward achieving the high scores. Such
an output-oriented approach may be one additional
reason why many firms remain unprofitable despite
high scores on perceived satisfaction and quality.
Qualitatively, the operational-level analysis of the
branches shows that unless firms are efficient on
both frontiers—operational efficiency and customer
retention—higher gains in profitability are unlikely
to emerge. A firm that is only focused on the inputs
of service quality (e.g., how to increase attribute per-
formance) or on its outputs (e.g., how to increase
quality perceptions or retention) is unlikely to be as
profitable as a firm that manages both. This is evi-
dent in the interactive effect of efficiency on both
stages of the DEA model on profitability.
Finally, this research addresses a larger concern
about the extended role of marketing in a firm. Our
study points to the important and expanding role of
the marketing manager in the knowledge manage-
ment domain of a firm. However, significant resour-
ces in terms of technology and personnel must be
invested to enable marketing to accomplish this role.
These investments, to some degree, may contain the
knowledge and technological leadership components
that Roth and Jackson (1995) found to be significant
predictors of service quality.
Research and Application IssuesThe results reported here are based on data pro-
vided by a single firm and, therefore, we do not
claim to have provided a universally applicable test
of the SPC framework. Rather, the claimed contribu-
tion is in demonstrating a comprehensive approach
that can provide strategic guidance to top manage-
ment, and specific operational guidance to each
branch manager in implementing the service-profit
chain. From an empirical perspective, the results re-
flect data limitations and subjective choices made by
the bank’s management and the research team in-
volved. All of these are avenues for improving fur-
ther empirical tests of the SPC framework. We
discuss some aspects of the SPC evaluation that re-
quire further elaboration in empirical research.
KAMAKURA, MITTAL, DE ROSA, AND MAZZON
Assessing the Service-Profit Chain
312 MARKETING SCIENCE/Vol. 21, No. 3, Summer 2002

Nonlinear Nature of the Links. Many authors
have documented the nonlinear nature of the links
of the SPC (Anderson and Mittal 2000, Soteriou and
Zenios 1999). In our work, we incorporated nonline-
arities in two ways. In the strategic-level analysis,
we used the rank correlation to compute the correla-
tion matrix that was input in the structural equation
model. However, for this bank, explicit inclusion of
asymmetries and nonlinearities, although statistically
feasible, is not recommended for the strategic analy-
sis. The reason is that the nonlinearities and asym-
metries are likely to vary from branch-to-branch and
any overall average in this regard can be misleading.
It is for this specific reason that we do not advocate
using the strategic model to conduct ‘‘what if’’ anal-
yses. Because of their localized nature, such com-
plexities are best accommodated and understood at
the branch level in the operational model. In our
application, we do this by accommodating variable
returns to scale in the DEA analysis.
Even so, specific nonlinearities had to be high-
lighted to management. Consider, for instance, the
relationship between overall behavioral intention
and behavioral outcomes among customers. The key
outcomes for each level of stated behavioral inten-
tion are shown in Figure 5. For instance, while the
relationship between overall behavioral intention
and customer’s share of deposit at the bank is linear,
Figure 5 Nonlinear Relationship Between Behavioral Intent and Its Consequences
KAMAKURA, MITTAL, DE ROSA, AND MAZZON
Assessing the Service-Profit Chain
MARKETING SCIENCE/Vol. 21, No. 3, Summer 2002 313

the other relationships are not. The number of trans-
actions at a bank increases sharply when a customer
moves from a rating of 1 to 2 but remains virtually
unchanged from a movement in rating from 2 to 3.
They increase sharply for a rating change between
3 and 4. Thus, for this metric of retention there
seems to be a ‘‘zone of indifference’’ where customer
behavior does not change much in response to a
change in overall evaluation. For customer’s tenure
with the bank (Panel C) a different pattern of non-
linearity ensues with this behavioral metric only
changing for the rating change from 3 to 4. In sum-
mary, issues related to incorporating nonlinearities
and asymmetries in the SPC need further research.
Measurement Issues. The measures used are spe-
cific to the bank providing us with the data. First,
the attributes on which consumer perceptions are
measured (human versus technology factors) are
the ones that this bank’s management decided to
evaluate as part of its strategic initiative. Other firms
may choose different attributes. Second, the overall
measure of customer perceptions, ‘‘intention to rec-
ommend,’’ is one that this bank’s management has
been using. Other firms may utilize different mea-
sures. Third, and similarly, the behavioral measures
of retention are firm specific. Perhaps in the future,
when enough studies are available, a meta-analysis
can resolve measurement issues and help sort out
which measures provide the best construct specifica-
tion for the SPC framework. Finally, if available, it
would be useful to explore the SPC in context of
both short-term and long-term profitability data.
Multiperiod Analysis. Recognizing that SPC links
entail lag effects and persistence, it would be desir-
able to test the SPC using multiperiod data at the
branch level. Such a modeling approach is also
needed to make stronger causal inferences about the
links entailed in the SPC. Addressing these meth-
odological concerns is a natural and immediate re-
search avenue, and firms should capture longitudinal
data to address this concern. Moreover, a multi-peri-
od analysis can also alleviate concerns about capital
budgeting issues. The long-term effects of SPC-
related decisions and changes in key dependent
measures can be investigated to separate the impact
of recurring from that of one-time ‘‘investments’’ in
service quality. Naturally, this sort of analysis is con-
tingent on the firm’s ability to capture and retain
data to construct a data panel.
Depending on the type of data available, a firm
can add refinements to the SPC framework. First,
factors that systematically moderate the links in the
SPC could be incorporated in the strategic model,
although only those that are relevant to a majority of
the subunits are appropriate. For instance, factors
such as level of competition and branch size may
moderate the extent to which a branch can translate
operational investments into service quality per-
ceptions and profitability. Second, this bank only
considered the cost of operational investments as
affecting firm profitability. Recently, firms have been
also advised to consider customer acquisition costs
as antecedents to profitability (Rust et al. 2000). If
there is a way to allocate them, SPC tests should in-
corporate customer acquisition costs such as adver-
tising and promotion in the model. Related to this,
research is needed to develop analytical models for
optimizing customer acquisition and operational
costs. For instance, in industries where there is little
differentiation among brands, acquisition costs are
likely to be high. In industries with a high level of
automation, the service costs may be low. The ana-
lytical model of the ‘‘cost of quality’’ could be used
in reverse for setting customer acquisition and ser-
vice budgets. Thus, developing allocative resource
models is an additional area of research.
Firms should also capture detailed data on the char-
acteristics of the subunits to run explanatory models
explaining their relative efficiency for each step of the
SPC. For instance, for each branch, the bank could have
collected data on the degree of competition faced, the
characteristics of customers it serves, and so forth. This
could then be used to better understand the efficiency
score attained by each branch.
KAMAKURA, MITTAL, DE ROSA, AND MAZZON
Assessing the Service-Profit Chain
314 MARKETING SCIENCE/Vol. 21, No. 3, Summer 2002

Links to Other Conceptual Models. The model
used in this application was based on the service-
profit chain and ROQ approaches. However, several
other models of customer profitability, most notably
the customer equity (Blattberg and Deighton 1996),
customer asset management (Bolton et al. 2001, Rust
et al. 2000), and customer lifetime value approach
(Berger and Nasr 1998, Keane and Wang 1995) have
gained popularity amongst academics and practi-
tioners. It is important to understand that these
emergent approaches are complementary, rather
than competing approaches to linking customers,
customer satisfaction, service quality, and profitabil-
ity. Research should bridge the conceptual gaps in
the customer-based approaches (customer equity,
customer lifetime value, and customer asset man-
agement) and the operational quality and service
satisfaction-based approach used here. Although the
end goal is the same—linking marketing actions to
profitability—there are important differences. First,
the customer-based approaches emphasize customer
identification, that is, the acquisition and retention
of the ‘‘right’’ customers for the firms. Second, the
emphasis is on allocating financial resources among
a heterogeneous base of customers with the most re-
sources being devoted to the most profitable custom-
ers. Third, depending on industry and customer
characteristics, the time horizon for such allocations
may be rather long. In summary, the spotlight in our
approach is on the firm’s operations and satisfac-
tion/service-quality drivers, whereas the spotlight in
the customer-based approaches is on identification
of the ‘‘right’’ customers. It will be important to
meld these two foci to develop comprehensive mod-
els that enable managers not only to identify the
right customers but also to configure the service-
profit chain to serve them. Thus, it can be envi-
sioned that different service-profit chains exist and
can be optimized (the SPC approach) for different
customer groups identified via the customer equity
and customer asset management approaches. The
challenge for researchers is to develop such models,
and for firms it is to lay the groundwork—strategic
and tactical—for implementing such models.
In summary, we have highlighted a comprehen-
sive approach to examining the SPC at a firm. Our
hope is that this documentation will encourage more
firms to assess their SPC comprehensively and share
the results with others. Such sharing, eventually, is
likely to lead to demonstrable improvement in si-
multaneously enhancing service quality and profit-
ability at firms.
Appendix 1
Constructs and Measures
PERPRCi is a latent variable measuring customer i’s perception
of the bank’s personnel at her branch.
Indicator Variables
MANAGERi 5 average perceptual ratings of managers given by
customer i.
CLERKi 5 average perceptual ratings of clerks given by customer i.
TELLERi 5 average perceptual ratings of tellers given by customer
i.
PERSONi 5 number of problems (out of five possibilities) with
personnel indicated by customer i (with inverted sign). Higher
scores indicate higher customer perceptions.
EQUPRCi is a latent variable measuring customer i’s perception
of the bank’s equipment at her branch.
Indicator Variables
EQUIPi 5 number of problems (out of 28) with equipment indi-
cated by customer i (with inverted sign). Higher scores indicate
higher customer perceptions.
FACILi 5 number of problems (out of six) with facilities indicated
by customer i (with inverted sign). Higher scores indicate high-
er customer perceptions.
PEREFFi is a latent variable measuring allocation of personnel
at customer i’s branch.
Indicator Variables
CUSTELi 5 number of customers per teller (with inverted sign to
reflect effort) in the branch patronized by customer i. Higher
scores indicate more tellers per customer.
CUSTMGRi 5 number of customers per manager (with inverted
sign). Higher scores indicate more managers per customer.
CUSTEMPi 5 number of customers per employee (with inverted
sign). Higher scores indicate more employees per customer.
CUSTBEHi is a latent variable measuring customer i’s level of
retention with the bank.
Indicator Variables
TRANSACTi 5 number of transactions per month by customer i
in the past year.
KAMAKURA, MITTAL, DE ROSA, AND MAZZON
Assessing the Service-Profit Chain
MARKETING SCIENCE/Vol. 21, No. 3, Summer 2002 315
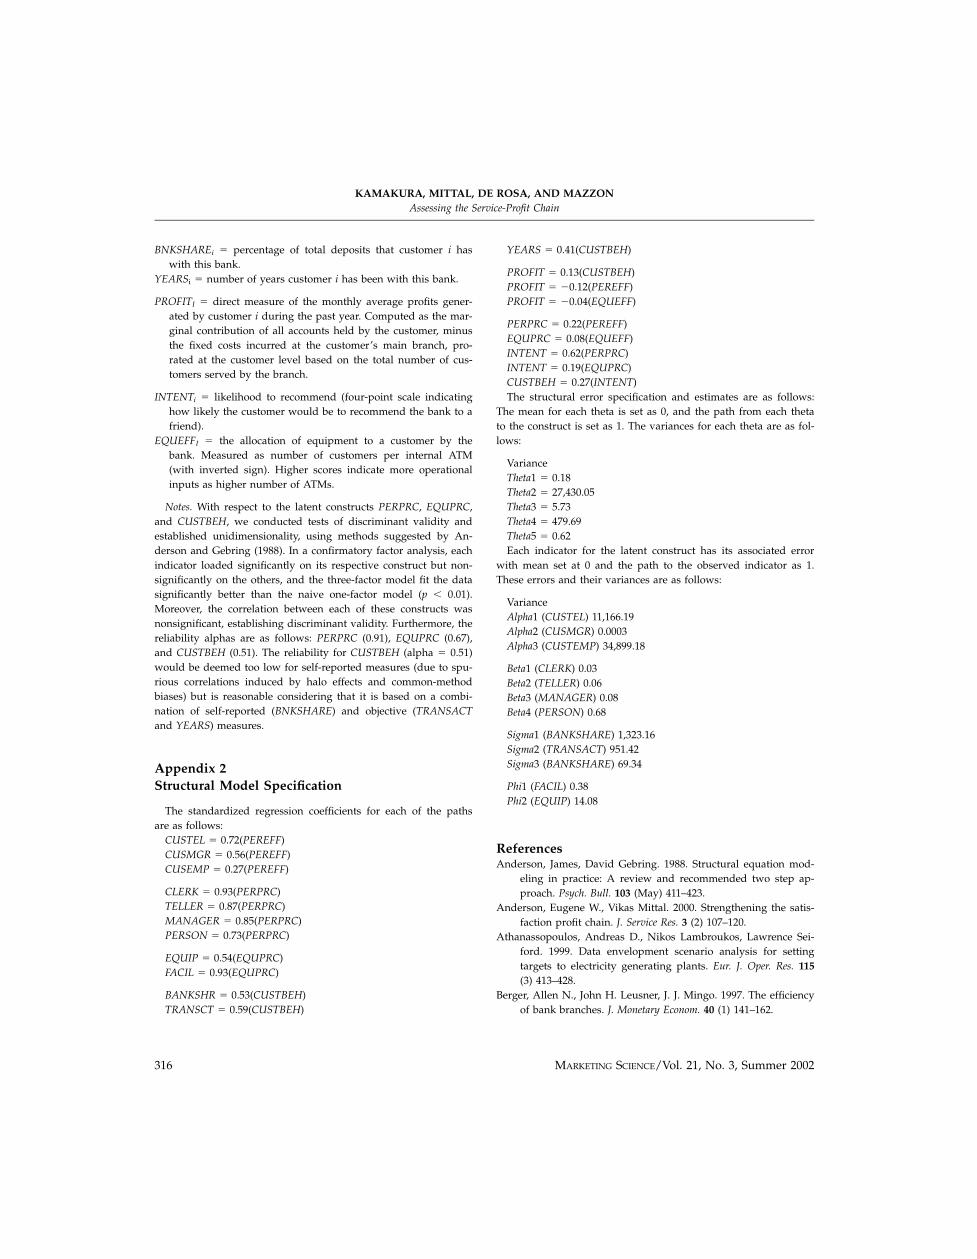
BNKSHAREi 5 percentage of total deposits that customer i has
with this bank.
YEARSi 5 number of years customer i has been with this bank.
PROFITI 5 direct measure of the monthly average profits gener-
ated by customer i during the past year. Computed as the mar-
ginal contribution of all accounts held by the customer, minus
the fixed costs incurred at the customer’s main branch, pro-
rated at the customer level based on the total number of cus-
tomers served by the branch.
INTENTi 5 likelihood to recommend (four-point scale indicating
how likely the customer would be to recommend the bank to a
friend).
EQUEFFI 5 the allocation of equipment to a customer by the
bank. Measured as number of customers per internal ATM
(with inverted sign). Higher scores indicate more operational
inputs as higher number of ATMs.
Notes. With respect to the latent constructs PERPRC, EQUPRC,
and CUSTBEH, we conducted tests of discriminant validity and
established unidimensionality, using methods suggested by An-
derson and Gebring (1988). In a confirmatory factor analysis, each
indicator loaded significantly on its respective construct but non-
significantly on the others, and the three-factor model fit the data
significantly better than the naive one-factor model (p , 0.01).
Moreover, the correlation between each of these constructs was
nonsignificant, establishing discriminant validity. Furthermore, the
reliability alphas are as follows: PERPRC (0.91), EQUPRC (0.67),
and CUSTBEH (0.51). The reliability for CUSTBEH (alpha 5 0.51)
would be deemed too low for self-reported measures (due to spu-
rious correlations induced by halo effects and common-method
biases) but is reasonable considering that it is based on a combi-
nation of self-reported (BNKSHARE) and objective (TRANSACT
and YEARS) measures.
Appendix 2
Structural Model Specification
The standardized regression coefficients for each of the paths
are as follows:
CUSTEL 5 0.72(PEREFF)
CUSMGR 5 0.56(PEREFF)
CUSEMP 5 0.27(PEREFF)
CLERK 5 0.93(PERPRC)
TELLER 5 0.87(PERPRC)
MANAGER 5 0.85(PERPRC)
PERSON 5 0.73(PERPRC)
EQUIP 5 0.54(EQUPRC)
FACIL 5 0.93(EQUPRC)
BANKSHR 5 0.53(CUSTBEH)
TRANSCT 5 0.59(CUSTBEH)
YEARS 5 0.41(CUSTBEH)
PROFIT 5 0.13(CUSTBEH)
PROFIT 5 20.12(PEREFF)
PROFIT 5 20.04(EQUEFF)
PERPRC 5 0.22(PEREFF)
EQUPRC 5 0.08(EQUEFF)
INTENT 5 0.62(PERPRC)
INTENT 5 0.19(EQUPRC)
CUSTBEH 5 0.27(INTENT)
The structural error specification and estimates are as follows:
The mean for each theta is set as 0, and the path from each theta
to the construct is set as 1. The variances for each theta are as fol-
lows:
Variance
Theta1 5 0.18
Theta2 5 27,430.05
Theta3 5 5.73
Theta4 5 479.69
Theta5 5 0.62
Each indicator for the latent construct has its associated error
with mean set at 0 and the path to the observed indicator as 1.
These errors and their variances are as follows:
Variance
Alpha1 (CUSTEL) 11,166.19
Alpha2 (CUSMGR) 0.0003
Alpha3 (CUSTEMP) 34,899.18
Beta1 (CLERK) 0.03
Beta2 (TELLER) 0.06
Beta3 (MANAGER) 0.08
Beta4 (PERSON) 0.68
Sigma1 (BANKSHARE) 1,323.16
Sigma2 (TRANSACT) 951.42
Sigma3 (BANKSHARE) 69.34
Phi1 (FACIL) 0.38
Phi2 (EQUIP) 14.08
ReferencesAnderson, James, David Gebring. 1988. Structural equation mod-
eling in practice: A review and recommended two step ap-
proach. Psych. Bull. 103 (May) 411–423.
Anderson, Eugene W., Vikas Mittal. 2000. Strengthening the satis-
faction profit chain. J. Service Res. 3 (2) 107–120.
Athanassopoulos, Andreas D., Nikos Lambroukos, Lawrence Sei-
ford. 1999. Data envelopment scenario analysis for setting
targets to electricity generating plants. Eur. J. Oper. Res. 115
(3) 413–428.
Berger, Allen N., John H. Leusner, J. J. Mingo. 1997. The efficiency
of bank branches. J. Monetary Econom. 40 (1) 141–162.
KAMAKURA, MITTAL, DE ROSA, AND MAZZON
Assessing the Service-Profit Chain
316 MARKETING SCIENCE/Vol. 21, No. 3, Summer 2002

Berger, Paul. D., Nada I. Nasr. 1998. Customer lifetime value: Mar-
keting models and applications. J. Interactive Marketing 12 (1)
17–30.
Blattberg, Robert C., John Deighton. 1996. Managing marketing by
the customer equity test. Harvard Bus. Rev. 74 (July–Aug)
136–144.
Bolton, Ruth N. 1998. A dynamic model of the duration of the
customer’s relationship with a continuous service provider:
The role of satisfaction. Marketing Sci. 17 (1) 45–65.
——, James H. Drew. 1994. Linking customer satisfaction to serv-
ice operations and outcomes. Roland T. Rust, Richard L.
Oliver eds., Service Quality: New Directions in Theory and Prac-
tice. Sage Publications, Thousand Oaks, CA, 173–200.
——, Katherine N. Lemon, Peter Verhoef. 2001. CUSAMS: A deci-
sion support model for customer asset management in serv-
ice industries. Marketing Sci. Inst. Working Paper Ser.
Forthcoming.
Carr, Nicholas G. 1999. Marketing: The economics of customer sat-
isfaction. Harvard Bus. Rev. (March–Apr). 15–18.
Charnes, A., W. W. Cooper, A. Y. Lewin, L. M. Seiford. 1994. Data
Envelopment Analysis: Theory, Methodology and Applications.
Kluwer Academic Publishers, Norwell, MA.
Frei, Frances X., Patrick T. Harker. 1999. Measuring the efficiency
of service delivery process: An application to retail banking.
J. Service Res. 1 (4) 300–312.
Grosskopf, Shawna, Kathy J. Hayes, Lori L. Taylor, William L.
Weber. 1999. Anticipating the consequences of school reform:
A new use of DEA. Management Sci. 45 (4) 608–620.
Hauser, John R., Duncan I. Simester, Birger Wernerfelt. 1994. Cus-
tomer satisfaction incentives. Marketing Sci. 13 (Fall) 327–350.
Heskett, James L., Thomas O. Jones, Gary W. Loveman, W. Earl
Sasser, Jr., Leonard Schlesinger. 1994. Putting the service-prof-
it chain to work. Harvard Bus. Rev. 72 (2) 164–174.
Ittner, Christopher, David F. Larcker. 1998. Are nonfinancial meas-
ures leading indicators of financial performance? An analysis
of customer satisfaction. J. Accounting Res. 36 (Suppl.) 1–35.
Keane, Timothy J., Paul Wang. 1995. Applications for the lifetime
value model in modern newspaper publishing. J. Direct Mar-
keting 9 (2) 59–66.
Kimes, Sheryl E. 1999. The relationship between product quality
and revenue per available room at Holiday Inn. J. Service Res.
2 (2) 138–144.
Loveman, Gary W. 1998. Employee satisfaction, customer loyalty,
and financial performance: An empirical examination of
the service profit chain in retail banking. J. Service Res. 1 (1)
18–31.
Mittal, Vikas, Wagner A. Kamakura. 2001. Satisfaction and re-
purchase behavior: The moderating influence of customer
and market characteristics. J. Marketing Res. 38 (1) 131–142.
Morwitz, Vicki G., David Schmittlein. 1992. Using segmentation to
improve sales forecasts based on purchase intent: Which
‘‘Intenders’’ actually buy? J. Marketing Res. 9 (Nov) 391–405.
Parasuraman, A., Valarie Zeithaml, Leonard L. Berry. 1988.
SERVQUAL: A multiple-item scale for measuring consumer
perceptions of service quality. J. Retailing 64 (Spring) 12–40.
Post, Thierry, Jaap Spronk. 1999. Performance benchmarking using
interactive data envelopment analysis. Eur. J. Oper. Res. 115
(3) 472–487.
Roth, Aleda V., William E. Jackson III. 1995. Strategic determinants
of service quality and performance: Evidence from the bank-
ing industry. Management Sci. 41 (11) 1720–1733.
Rucci, Anthony J., Steven P. Kirn, Richard T. Quinn. 1998. The em-
ployee-customer-profit chain at Sears. Harvard Bus. Rev. (Jan–
Feb) 83–97.
Rust, Roland T., Anthony J. Zahorik, Timothy L. Keiningham.
1995. Return on quality (ROQ): Making service quality finan-
cially accountable. J. Marketing 59 (Apr) 58–70.
Rust, Roland T., Valerie Zeithaml, Katherine Lemon. 2000. Driving
Customer Equity: How Customer Lifetime Value Is Reshaping Cor-
porate Strategy. Free Press, New York.
Schaffnit, Claire, Dan Rosen, Joseph C. Paradi. 1997. Best practice
analysis of bank branches: An application of DEA in a large
Canadian bank. Eur. J. Oper. Res. 98 (2) 269–289.
Sherman, H. David, Franklin Gold. 1985. Bank branch operating
efficiency. J. Banking Finance 9 (2) 297–315.
Simester, Duncan I., John R. Hauser, Birger Wernerfelt, Roland T.
Rust. 2000. Implementing quality improvement programs de-
signed to enhance customer satisfaction: Quasi-experiments
in the United States and Spain. J. Marketing Res. 37 (Feb) 102–
112.
Soteriou, Andreas C., Stavros A. Zenios. 1999. Operations, quality,
and profitability in the provision of banking services. Man-
agement Sci. 45 (9) 1221–1238.
——, Yiannos Stavrinides. 1997. An internal customer service
quality data envelopment analysis model for bank branches.
Internat. J. Oper. Productions Management 17 (8) 780–789.
Thanassoulis, Emmanuel 1999. Data envelopment analysis and its
use in banking. Interfaces 29 (3) 1–13.
Zeithaml, Valarie A. 2000. Service quality, profitability and the
economic worth of customers: What we know and what we
need to learn. J. Acad. Marketing Sci. 28 (1) 67–85.
Zenios, Christiana V., Stavros A. Zenios, Kostas Agathocleous, An-
dreas C. Soteriou. 1999. Benchmarks of the efficiency of bank
branches. Interfaces 29 (3) 37–51.
This paper was received February 16, 2001, and was with the authors 6 months for 2 revisions
KAMAKURA, MITTAL, DE ROSA, AND MAZZON
Assessing the Service-Profit Chain
MARKETING SCIENCE/Vol. 21, No. 3, Summer 2002 317


