soil-to-plant concentration ratios for assessing food-chain
TRANSCRIPT

NUREG/CR-6941 PNNL-16741 Soil-to-Plant Concentration Ratios for Assessing Food-Chain Pathways in Biosphere Models Pacific Northwest National Laboratory U.S. Nuclear Regulatory Commission Office of Nuclear Regulatory Research Washington, DC 20555-0001

NUREG/CR-6941 PNNL-16741
Soil-to-Plant Concentration Ratios for Assessing Food-Chain Pathways in Biosphere Models Manuscript Completed: July 2007 Date Published: August 2007 Prepared by B.A. Napier, R.J. Fellows, K.M. Krupka Pacific Northwest National Laboratory P.O. Box 999 Richland, WA 99352 P.R. Reed, NRC Project Manager Prepared for Division of Fuel, Engineering and Radiological Research Office of Nuclear Regulatory Research U.S. Nuclear Regulatory Commission Washington, DC 20555-0001 NRC Job Code Y6469

iii
Abstract
This report describes work performed for the U.S. Nuclear Regulatory Commission’s
project Assessment of Food Chain Pathway Parameters in Biosphere Models, which was established to assess and evaluate a number of key parameters used in the food-chain models used in performance assessments of radioactive waste disposal facilities. Section 2 of this report summarizes characteristics of samples of soils and groundwater from three geographical regions of the United States, the Southeast, Northwest, and Southwest, and analyses performed to characterize their physical and chemical properties. Because the uptake and behavior of radionuclides in plant roots, plant leaves, and animal products depends on the chemistry of the water and soil coming in contact with plants and animals, water and soil samples collected from these regions of the United States were used in experiments at Pacific Northwest National Laboratory to determine radionuclide soil-to-plant concentration ratios. Crops and forage used in the experiments were grown in the soils, and long-lived radionuclides introduced into the groundwater provide the contaminated water used to water the grown plants. The radionuclides evaluated include 99Tc, 238Pu, and 241Am. Plant varieties include alfalfa, corn, onion, and potato. The radionuclide uptake results from this research study show how regional variations in water quality and soil chemistry affect radionuclide uptake. Section 3 summarizes the procedures and results of the uptake experiments, and relates the soil-to-plant uptake factors derived. In Section 4, the results found in this study are compared with similar values found in the biosphere modeling literature; the study’s results are generally in line with current literature, but soil- and plant-specific differences are noticeable. This food-chain pathway data may be used by the NRC staff to assess dose to persons in the reference biosphere (e.g., persons who live and work in an area potentially affected by radionuclide releases) of waste disposal facilities and decommissioning sites.

iv

FOREWORD The food-chain pathway contributes to the potential dose received by members of the public as a result of the potential release of radionuclides to the environment from various facilities licensed by the U.S. Nuclear Regulatory Commission (NRC). To quantify the contribution from this pathway, the NRC developed performance assessment strategies involving biosphere computer modeling codes to evaluate the potential dose to humans. These biosphere codes incorporate parameters for radionuclide uptake in plant roots and leaves, as well as animal products, to aid in predicting the radionuclide concentrations that humans would ingest in the event of an environmental release from the NRC=s existing and planned licensed nuclear facilities. This report provides soil-to-plant concentration ratios for long-lived radionuclides derived from experiments performed at Pacific Northwest National Laboratory (PNNL). These experiments used water and soil samples collected from three geographical regions of the United States to determine soil-to-plant radionuclide concentration ratios. Crops and forage used in these experiments were grown in the collected soils, and long-lived radionuclides were introduced into the groundwater to prepare the contaminated water that was used to irrigate the plants. Radionuclides studied were technetium (99Tc), plutonium (238Pu), and americium (241Am). Plant types included alfalfa, corn, onion, and potato. This report contains four sections: • Section 1 introduces the report. • Section 2 describes activities undertaken to collect samples of soils and groundwater
from three regions of the United States (i.e., the Southeast, Northwest, and Southwest), and to perform analyses to characterize their physical and chemical properties.
• Section 3 details the procedures and results of the uptake experiments, and summarizes the methods used to prepare the soils, grow the plants, and analyze the data obtained regarding the soil-to-plant transfer factors for the crops grown in each of the three geographical regions.
• Section 4 discusses the soil-to-plant concentration ratios for the soils and crops studied and, where possible, compare the results with values found in the biosphere modeling literature.
The radionuclide uptake results from this study show that soil- and plant-specific differences are noticeable. In addition, these results should be more realistic than those of past experiments because they show how regional variations in soil and water chemistry affect soil-to-plant radionuclide concentration ratios. The NRC expects to use the data presented in this report to reduce uncertainties in modeling radionuclide behavior in food-chain pathways as part of the dose calculation in performance assessments for nuclear facilities. The results of the biosphere research program should improve the staff=s understanding of the features and processes that affect estimates of dose from important long-lived radionuclides in the food-chain pathway.
Brian W. Sheron, Director Office of Nuclear Regulatory Research U.S. Nuclear Regulatory Commission
v

vi

vii
Contents Abstract .............................................................................................................................. iii Foreword ............................................................................................................................. v List of Figures .................................................................................................................. viii List of Tables ..................................................................................................................... ix Acknowledgements ........................................................................................................... xi Acronyms ......................................................................................................................... xii Units of Measure ............................................................................................................. xiii 1.0 Introduction.......................................................................................................... 1-1 2.0 Sampling and Analysis of Groundwater and Soil Samples ................................. 2-1
2.1 Sampling Sites for Groundwater and Soil Samples .............................................. 2-1 2.1.1 Hanford Site, Washington........................................................................ 2-2 2.1.2 Nye County, Nevada................................................................................ 2-3 2.1.3 Savannah River Site, South Carolina....................................................... 2-4 2.1.4 Clemson University Site, South Carolina ................................................ 2-6
2.2 Methods for Analysis and Characterization of Groundwater and Soil Samples... 2-7 2.2.1 Analysis of Groundwater Samples........................................................... 2-7 2.2.2 Characterization and Analysis of Bulk Soil Samples .............................. 2-9
2.3 Results of Analyses and Characterization of Groundwater and Soil Samples.... 2-11 2.4 References for Section 2 ..................................................................................... 2-30
3.0 Soil-to-Plant Uptake............................................................................................. 3-1 3.1 Materials and Methods.......................................................................................... 3-2
3.1.1 Soils.......................................................................................................... 3-2 3.1.2 Plant Material........................................................................................... 3-2 3.1.3 Label Amendment.................................................................................... 3-4 3.1.4 Sample Processing ................................................................................... 3-7
3.2 Experimental Results ............................................................................................ 3-9 3.2.1 Soils.......................................................................................................... 3-9 3.2.2 Technetium ............................................................................................ 3-11 3.2.3 241Am and 238Pu...................................................................................... 3-17
3.3 References for Section 3 ..................................................................................... 3-22 4.0 Discussion............................................................................................................ 4-1
4.1 Soils and Groundwater Analyses .......................................................................... 4-1 4.2 Soil-to-Plant Concentration Ratios for the Soils and Crops Studied .................... 4-2 4.3 Uncertainties in the Results .................................................................................. 4-3 4.4 Comparison of CR Results to Current Literature.................................................. 4-3 4.5 References for Section 4 ....................................................................................... 4-8

viii
List of Figures
Figure 2.1. Locations of Groundwater and Soil Samples from the Hanford Site........... 2-2 Figure 2.2. Location in Nye County, Nevada, Where Groundwater and Soil
Samples were Collected................................................................................ 2-3 Figure 2.3 Well Used for Groundwater Sample from Savannah River Site................... 2-4 Figure 2.4. Location Where Soil Sample was Collected from Savannah River Site...... 2-5 Figure 2.5. Research Field at the Edisto Research and Education Center Used for
Soil from Clemson University Site............................................................... 2-7 Figure 2.6. Background-Subtracted XRD Pattern for Hanford Site Soil Sample......... 2-17 Figure 2.7. Background-Subtracted XRD Pattern for Nye County Soil Sample.......... 2-18 Figure 2.8. Background-Subtracted XRD Pattern for Savannah River Site Soil
Sample ........................................................................................................ 2-19 Figure 2.9. Background-Subtracted XRD Pattern for Clemson University Site Soil
Sample ........................................................................................................ 2-20 Figure 3.1. Hanford soil pot with germinating alfalfa showing secondary
containment and plastic lined pot with polyethelene beads on top of soil and water sensor wire going into soil. ................................................... 3-3
Figure 3.2. Diagram of pot showing drip irrigation line added just below the soil surface to avoid the potential for resuspension of the label from the surface of the soil.......................................................................................... 3-4
Figure 3.3. Diagram of Growth Chamber Configuration for the Actinide Experiment.................................................................................................... 3-5
Figure 3.4. (A) Interior View of Growth Chamber During Actinide Experiment Showing Positioning of Water Sensor Wiring and Irrigation Tubing. (B) Cameras at either end of the growth chamber monitor the status of the plants. ...................................................................................................... 3-5
Figure 3.5. Harvested Alfalfa (A) and Onion (B) prior to drying................................... 3-8 Figure 3.6. Harvested potato showing root, tubers, leaves, and stem samples............... 3-8 Figure 3.7. Photograph of petri dishes containing germinating radish seedlings
after 4-days imbibition................................................................................ 3-10 Figure 3.8. Seedling length (root tip to shoot tip) in cm for radish seedlings
exposed to increasing amounts of Savannah River (SR) Soil water extracts. ....................................................................................................... 3-10
Figure 3.9. Hanford soil grown Control (A) and 99Tc amended (B) onion plants....... 3-12 Figure 3.10. Hanford (A) and Nevada (B) soil-grown potatoes. Both were amended
with 99Tc. .................................................................................................... 3-12 Figure 3.11. Photograph of 3-week-old potato plants growing in Hanford soil and
amended with 241Am................................................................................... 3-18 Figure 3.12. Photograph of 10-week-old plants following application of fertilizer. ..... 3-19

ix
List of Tables
Table 2.1. Tables and Figures Containing the Results of the Analyses and Characterization Studies of the Groundwater, Soil, and 1:1 Soil:Water Extract Samples from the Hanford Site, Nye County, Savannah River Site, and Clemson University locations...................................................... 2-13
Table 2.2. pH and Conductivity Values for the Groundwater Samples ...................... 2-14 Table 2.3. Alkalinity Values for the Groundwater Samples........................................ 2-14 Table 2.4. Concentrations of Dissolved Anions in the Groundwater Samples............ 2-14 Table 2.5. Concentrations of Total Dissolved Carbon in the Groundwater
Samples....................................................................................................... 2-15 Table 2.6. Concentrations of Dissolved Macro and Trace Metals in the
Groundwater Samples as Determined by ICP-OES ................................... 2-15 Table 2.7. Concentrations of Dissolved Trace Metals in the Groundwater
Samples as Determined by ICP-MS ........................................................... 2-16 Table 2.8. Concentrations of Dissolved Trace Metals in the Groundwater
Samples as Determined by ICP-MS (Continued)....................................... 2-16 Table 2.9. Concentrations of Major Elements in Bulk Soil Samples as
Determined by XRF.................................................................................... 2-21 Table 2.10. Concentrations of Trace Elements in Bulk Soil Samples as Determined
by XRF........................................................................................................ 2-21 Table 2.11. Particle Size Analysis of the Bulk Soil Samples ........................................ 2-22 Table 2.12. Moisture Contents of the Bulk Soil Samples.............................................. 2-22 Table 2.13. Cation Exchange Capacity (CEC) Values for the Soil Samples................. 2-22 Table 2.14. Carbon Contents of the Soil Samples ......................................................... 2-23 Table 2.15. pH and Conductivity Values for the 1:1 Soil:Water Extracts..................... 2-23 Table 2.16. Alkalinity Values for the 1:1 Soil:Water Extracts ...................................... 2-24 Table 2.17. Concentrations of Dissolved Anions in 1:1 Soil:Water Extract ................. 2-25 Table 2.18. Concentrations (µg/g soil) of Dissolved Macro and Trace Metals in the
1:1 Water Extracts as Determined by ICP-OES......................................... 2-26 Table 2.19. Concentrations (µg/L pore water) of Dissolved Macro and Trace
Metals in the 1:1 Water Extracts as Determined by ICP-OES ................... 2-27 Table 2.20. Concentrations of Dissolved Macro and Trace Metals in 1:1 Water
Extracts as Determined by ICP-MS............................................................ 2-28 Table 2.21. Concentrations of Dissolved Trace Elements in 1:1 Water Extracts as
Determined by ICP-MS (Continued).......................................................... 2-29 Table 3.1. Summarized soil properties. ......................................................................... 3-2 Table 3.2 Chemical form, specific activity (mCi/g) and activity (µCi/pot) of soil
for 99Tc.......................................................................................................... 3-6 Table 3.3. Source origin and activity of stock 241Am and 238Pu used in plant
growth experiments. ..................................................................................... 3-7 Table 3.4 Chemical form, specific activity (mCi/g), and activity (µCi)/pot of soil
for 241Am and 238Pu in test pots. ................................................................... 3-7 Table 3.5. Average plant dry weight (g) ± S.D. (N=5) for alfalfa, onions, corn,
and potatoes grown to maturity in the different soil types employed in the study...................................................................................................... 3-11

x
Table 3.6. Percentage of soil applied 99Tc present in the plant shoots, potato tubers, and onion bulbs. .............................................................................. 3-13
Table 3.7. Mature tissue specific activity of crop plants (N=5) grown in either 1.0 µCi 99Tc-ammended Hanford, Nevada, Savannah River Pine Forest, or Savannah River Field soil....................................................................... 3-14
Table 3.8. Percent distribution of total 99Tc recovered in the plant species grown in either Hanford, Nevada, or Savannah River Pine Forest soil. ................ 3-15
Table 3.9. Technetium-99 concentration ratios (shoot pCi 99Tc/g dry wt./soil pCi 99Tc/g dry wt.) for the above-ground foliage for the four plant species and the four soil types tested. ..................................................................... 3-16
Table 3.10. Technetium-99 concentration ratios (pCi 99Tc/g dry wt./soil pCi 99Tc/g dry wt.) for portions commonly consumed by humans. ............................. 3-17
Table 3.11. Comparison of isotope activity per pot....................................................... 3-17 Table 3.12. Average dry weights of above ground alfalfa shoot and potato plant
(shoot and tubers). Data are expressed in grams ....................................... 3-19 Table 3.13. Percentage of total label applied to the soil contained in above ground
alfalfa (shoots) and potato (shoots and tubers). .......................................... 3-20 Table 3.14. Average specific activity (cpm/g dry wt. of plant) contained in above
ground alfalfa shoots and potato plants (shoot and tubers). ....................... 3-21 Table 3.15. Average percent of total label distribution found in below-ground
potato tubers................................................................................................ 3-21 Table 3.16. Americium-241 concentration ratios [(shoot pCi 241Am/g dry wt.)/(soil
pCi 241Am/g dry wt.)] for the above-ground foliage for two plant species and the three soil types tested......................................................... 3-22
Table 3.17. Plutonium-238 concentration ratios [(shoot pCi 238Pu/g dry wt.)/(soil pCi 239Pu/g dry wt.)] for the above-ground foliage for two plant species and the three soil types tested......................................................... 3-22
Table 4.1. Soil-to-Plant Concentration Ratios commonly used in environmental assessments .................................................................................................. 4-7

xi
Acknowledgements The authors are particularly grateful for the technical guidance, review, and encouragement provided by Phillip R. Reed of the U.S. Nuclear Regulatory Commission. The authors thank K.R. Krupka, S.R. Baum, K.M. Geiszler, I.V. Kutnyakov, V.L. LeGore, M.J. Lindberg, H.T. Schaef, and T.S Vickerman (all of PNNL) for assisting with various aspects of the analyses and characterization of the groundwater and soil samples. We also thank R.J. Serne, W.J. Deutsch, and their PNNL coworkers for providing written descriptions of the methods used for analysis and characterization of the groundwater and soil samples. We particularly thank J. Rossabi (Savannah River Technology Center) and J. Mueller (Edisto Research and Education Center) for their assistance in sample collection. We also wish to thank those who assisted at PNNL with the sample plant growth and evaluation: Rick Herrington, Danielle Saunders, and Brad Barfus.

xii
Acronyms APHIS Animal Plant Health Inspection Service ASA American Society of Agronomy ASTM American Society for Testing and Materials CBP Columbia Basin Project CEC cation exchange capacity cps counts per second CR Concentration Ratio CY Calendar Year DOE U.S. Department of Energy EPA U.S. Environmental Protection Agency ICP-MS inductively coupled plasma-mass spectroscopy (spectrometer) ICP-OES inductively coupled plasma-optical emission spectroscopy ICDD International Center for Diffraction Data, Newtown Square, Pennsylvania JCPDS Joint Committee on Powder Diffraction Standards LLW Low level waste LOI loss on ignition N Normality ND not detected NRC Nuclear Regulatory Commission N-P-K Nitrogen – Phosphorous – Potassium PDF™ powder diffraction file PNNL Pacific Northwest National Laboratory QA quality assurance RCP Radioactive Control Policy SBMS Standards in Business Management SRF Savannah River Field soil SRS Savannah River Site USDA United States Department of Agriculture USEPA United States Environmental Protection Agency USGS U.S. Geological Survey XRD X-ray powder diffractometry analysis (commonly called X-ray diffraction) XRF X-ray fluorescence analysis

xiii
Units of Measure
Å angstrom g gram kV kilovolt L liter M molarity, mol/L mA milliampere mg milligram mL milliliter MPa megapascal mS millisiemens N Normality (of a solution), in number of gram equivalent weights of solute
per liter of solution I/Io relative intensity of an XRD peak to the most intense peak wt% weight percent ºC temperature in degrees Celsius [T(ºC) = T(K) – 273.15)] λ wavelength µ micro (prefix, 10-6) µEinstein microEinstein (a measure of irradiance – about 6.02x10¹⁷ photons) µeq microequivalent µg microgram µm micrometer θ angle of incidence (Bragg angle)

xiv

1-1
1.0 Introduction The U.S. Nuclear Regulatory Commission’s project Assessment of Food Chain Pathway Parameters in Biosphere Models was established to assess and evaluate a number of key parameters used in the food-chain models used in performance assessments of radioactive waste disposal facilities. The objectives of the research program include:
• Provide data and information for the important features, events, and processes of the pathway models for use in biosphere computer codes. These codes calculate the total effective dose equivalent (TEDE) to the average member of the critical group and maximally exposed individual, for example, from radionuclides in the contaminated ground water release scenarios in NRC's performance assessments of waste disposal facilities and decommissioning sites;
• Reduce uncertainties in food-chain pathway analysis from the agriculture scenarios of biosphere models in performance assessment calculations;
• Provide better data and information for food-chain pathway analyses by: o Performing laboratory and field experiments, including integral and
separate effect experiments, to evaluate the potential pathways and uptake mechanisms of plants and animals contaminated by long-lived radionuclides;
o Presenting food-chain pathway data and information by regional and local geographical locations;
o Quantifying uncertainties in the radioactive contamination of food crops and long-term build up of radionuclides in soils with contaminated ground water from water irrigation systems;
o Determining data on factors affecting radionuclide uptake of food crops including irrigation water processes, soil physical and chemical properties, soil leaching and retention properties near crop roots, soil resuspension factors and other soil and plant characteristics.
The results of this research program provide needed food-chain pathway data and information for important radionuclides that may be used by the NRC staff to assess dose to persons who live and work in areas potentially affected by radionuclide releases from waste disposal facilities and decommissioning sites. Section 2 of this report describes activities undertaken to collect samples of soils and groundwater from three regions of the United States, the Southeast, Northwest, and Southwest, and perform analyses to characterize their physical and chemical properties. This Section of the report is largely the same as that presented in an earlier project report (Napier et al. 2005) so that the soil and plant data could be conveniently located in a single report. Because the uptake and behavior of radionuclides in plant roots, plant leaves, and animal products depends on the chemistry of the water and soil coming in contact with plants and animals, water and soil samples collected from these regions on the United States

1-2
were used in experiments at Pacific Northwest National Laboratory to determine radionuclide soil-to-plant concentration ratios. Crops and forage used in the experiments were grown in the soils, and long-lived radionuclides introduced into the groundwater provide the contaminated water used to water the grown plants. Radionuclides evaluated include 99Tc, 238Pu, and 241Am. Plant types include alfalfa, corn, onion, and potato. The radionuclide uptake results from this research study show how regional variations in water quality and soil chemistry affect radionuclide uptake. Section 3 summarizes the methods used in preparing the soils, growing the plants, and analyzing the information gathered regarding soil-to-plant transfer factors for the crops grown in each of these three soil types. In Section 4, the results found in this study are compared with comparable values found in the biosphere modeling literature. Data from this research program are expected to be used in biosphere models to calculate the dose from groundwater release scenarios in performance assessment computer codes.

2-1
2.0 Sampling and Analysis of Groundwater and Soil Samples Uncontaminated soil and groundwater samples were collected from four and three sites, respectively, that are in the vicinity of waste disposal facilities and unaffected by disposal activities at those sites. The soil and groundwater samples were collected for use in plant radionuclide uptake studies. The areas for sampling included agricultural sites and currently operating and proposed waste disposal facilities and decommissioning sites, including the commercial low-level radioactive waste (LLW) sites in the states of Washington and South Carolina. The information in this section is a replication of that originally reported in Napier et al. (2005) so that the soil and transfer factor information could be easily found within a single reference. 2.1 Sampling Sites for Groundwater and Soil Samples Three areas for soil and water samples were identified that met the objectives identified in the work plan for the “Assessment of Food Chain Pathway Parameters in Biosphere Models” project. These sites include the Hanford Site, Washington; Savannah River, South Carolina; and Nye County, Nevada. Together they provide a range of soil characteristics for radionuclide plant uptake studies. After the plant uptake experiments were started, it was discovered that soil from the Savannah River Site in South Carolina would not support plant growth because the soil was allelopathic – that is, it contained natural toxins to plant growth as a result of its association with pine trees. A different nearby location was then identified to obtain a new soil sample for the plant studies. This soil sample (Section 2.1.3) was obtained from a research field operated by Clemson University in Blackville, South Carolina, in Barnwell County, located 15 mi. east-northeast of the Savannah River Plant. The Hanford location is about 15 km (9 miles) west of the U.S. Ecology low-level waste disposal site; the South Carolina location is about 22 km (14 miles) northeast of the Barnwell low-level waste disposal site (the original Savannah River Site location was about 5 miles west), and the Nevada location is about 80 km (50 miles) southeast of the Beatty low-level waste site and about 37 km (23 miles) downgradient from the proposed Yucca Mountain high-level waste repository. The experimental design of the uptake experiments requires approximately 300 liters of water and 0.2 cubic meters of soil from each site. The latitude and longitude position of each sampling location was recorded by using a global positioning system (GPS) unit to provide traceability and the opportunity to provide duplicate samples if required. No measurements were made at the well of parameters such as Eh, temperature, dissolved oxygen, etc., because in the anticipated use of spray irrigation, these parameters would rapidly change to match the terrestrial conditions.

2-2
2.1.1 Hanford Site, Washington The sampling site for the Hanford soil and groundwater samples is located off Washington highway 240 near the area referred to as the “Yakima Barricade” at the western entrance to the U.S. Department of Energy Hanford Site in southeastern Washington State. Logistically, the sample site is easily accessible by road, and a pump is installed in the well used for groundwater sampling (Figure 2.1). The Hanford Site designation for the well is 699-49-100C, and the coordinates are North 46.577°, West 119.726°. The well has been used in the past for providing water to the guard shack at the Yakima Barricade (see structure in background at top of right photograph in Figure 2.1), and is still used to provide “up-gradient background” groundwater samples (i.e., water not affected by Hanford disposal activities) to the Hanford Site environmental programs. The water chemistry of the well has been extensively characterized, and the analytical results are available through the Hanford Environmental Information System (HEIS 1994) data base. The Hanford soil1 sample was collected within 100 m of the well used for the groundwater sample, and the coordinates for the location of the soil sample are North 46.576°, West 119.726°. The soil sample is a silty, very fine sand that is referred to as the McGee Ranch soil. The soil in this area has been extensively characterized, because there are plans to use this sediment as a soil covering for surface barriers on waste-disposal areas at the Hanford Site (DOE 1999) (Figure 2.1).
Groundwater Sampling Soil Sampling
Figure 2.1. Locations of Groundwater and Soil Samples from the Hanford Site
1 Because of its depositional history, the unconsolidated surface and near-surface geologic material at the Hanford Site is referred to as “sediment” in Hanford Site literature.

2-3
2.1.2 Nye County, Nevada The sampling site (Figure 2.2) in Nye County is located in a desert valley approximately 175 km (110 miles) miles west of Las Vegas in the Amargosa Valley in Nye County, Nevada. The soil and groundwater samples were collected by agreement with the owner from private land. The site is located west of Las Vegas approximately 175 km (110 miles) on Nevada highway 95. The groundwater was collected from an irrigation well that is used to flood irrigate pastureland. The coordinates for the well used for the groundwater sample are North 36 29' 24.4", West 116 30' 51.5". The pasture was used to grow alfalfa for about 14 years up until about 1996, when it was allowed to turn to pasture. According to the land owner, the soil was originally conditioned using approximately 0.225 kg/m2 (10 tons/acre) of gypsum. No commercial fertilizer was used on the pasture. The soil was approximately 75 cm (2.5 feet) thick at the sample site, and consists of a light brown silty sand. The coordinates for the site of the soil sample are North 36° 29' 23.7", West 116° 30' 52.0". Near the base, the occurrence of white streaks in the soil increased until the soil transitioned into broken-up calcrete.
Figure 2.2. Location in Nye County, Nevada, Where Groundwater and Soil Samples were Collected

2-4
2.1.3 Savannah River Site, South Carolina This site was selected because this soil provides a good representation of forest soil from the southeastern United States. PNNL staff also had contacts at the U.S. Department of Energy Savannah River Site who could cost-effectively provide uncontaminated groundwater and soil samples from this location. This site receives considerably more infiltration from rainfall and snowmelt, and has a soil that was expected to have a higher organic carbon content than the soil samples from Hanford and Nye County. The water samples are from well HSB-85A (Figure 2.3) at coordinates North 33° 17' 6.548", West 81° 39' 17.7448". The soil samples were collected near well MSB 21 TA (Figure 2.4) at coordinates North 33° 19' 58.31", West 81° 44' 39.2". The groundwater and soil samples were provided by the Savannah River Technology Center in Aiken, South Carolina. The locations selected for the groundwater and soil samples represent “clean” groundwater and soil, which do not contain any radionuclide contamination at concentrations above natural background levels. Also, each sampling location has background data associated with it that was collected as part of the environmental monitoring program at the Savannah River Site. The soil from this site falls under the Restricted Shipping Regulations of the United States Department of Agriculture Animal Plant Health Inspection Service (USDA-APHIS). The reason given for this restriction is the potential for fire-ant contamination. Prior to be being distributed for characterization and use in the plant uptake experiments, the soil sample was therefore processed as follows:
Figure 2.3 Well Used for Groundwater Sample from Savannah River Site

2-5
Figure 2.4. Location Where Soil Sample was Collected from Savannah River Site [Soil was sampled from surface (bottom photograph) near the feet of the person standing in the trees in the top photograph.]

2-6
• The soil was considered contaminated until heat-treated and therefore handled using sterile technique. This meant that it was opened and handled only in an appropriate biosafety cabinet. These are within locked, negative air-pressure laboratories, with controlled access to authorized personnel only. At the minimum, safety apparel included a lab coat and two (2) pairs of disposable gloves that could be subsequently autoclaved.
• All soil residues were treated by either heating in a forced air oven at 110°-125°C for 16 h or autoclaving at temperatures ≥ 110°C and 15 pounds pressure for a minimum of 30 minutes.
2.1.4 Clemson University Site, South Carolina This site was selected because this soil provides a good representation of an agricultural soil from the southeastern United States, and because it has been under cultivation for over 25 years, it is unlikely to suffer from the allelopathic nature of the forested Savannah River Site soil. Like the soil from the Savannah River Site, this site receives considerably more infiltration from rainfall and snowmelt than the soil samples from Hanford and Nye County. The soil sample was provided by a Professor of plant pathology and physiology at the Edisto Research and Education Center (664 Research Road, Blackville, South Carolina) at Clemson University. Blackville is 16 km (10 mi.) northeast of Barnwell on the junction of US 78 and US 321, and is approximately 50 km (30 mi.) east of Augusta, 25 km (15 mi.) east-northeast of the Savannah River Plant, and 70 km (45 mi.) south-southwest of Columbia, South Carolina. Based on GPS, the soil sample was taken at coordinates North 33.2124°, West 81.18446°. Published soils maps indicate the soil is described as a Dothan Loamy Sand with a slope of 0 to 2% or less. The soil sample is from a research field at The Edisto Research and Education Center. The field has been in agricultural production, primarily cotton and soybean, continuously for the last 25 years. The field was planted in soybeans in CY 2004, in cotton for one or two years before that, and then primarily in soybeans for the previous 10 or 12 years. Except for cleaning off plant debris, the location of the soil sample was undisturbed before digging of the soil sample. The soil was collected by scraping off the top 2 to 8 cm (1 to 3 inches) and collecting the sample at the 5 to 20 cm (2 to 8 inch) depth. The soil from the Clemson University Site also falls under USDA-APHIS because of the potential for fire-ant contamination. Therefore, prior to distribution for characterization and use in the plant uptake experiments, this soil sample was considered contaminated until heat-treated and handled using sterile technique as described in Section 2.1.3. A separate groundwater sample was not taken at this site. Because of the similarities of the surface soils and general vicinity, the groundwater sample from the Savannah River location was considered to be representative of this location as well.

2-7
Figure 2.5. Research Field at the Edisto Research and Education Center Used for Soil from Clemson University Site 2.2 Methods for Analysis and Characterization of Groundwater and
Soil Samples The following method descriptions were taken, with the permission of the lead authors, from reports published by the PNNL Applied Geology and Geochemistry Group, such as Deutsch et al. (2004) and Serne et al. (2004). 2.2.1 Analysis of Groundwater Samples 2.2.1.1 pH and Conductivity The pH values of the groundwater samples from the Hanford Site, Nye County, and Savannah River Site were measured using a solid-state pH electrode and a pH meter calibrated with buffers bracketing the expected range. This measurement is similar to Test Methods for Evaluating Solid Wastes: Physical/Chemical Methods SW-846 9040B (EPA 1995). Electrical conductivity was measured and compared to potassium chloride standards with a range of 0.001 M to 1.0 M. The pH and conductivity subsamples were

2-8
filtered prior to analysis. The basic unit of conductivity is the siemens (S), formerly called the mho. 2.2.1.2 Alkalinity The alkalinity of the groundwater samples from the Hanford Site, Nye County, and Savannah River Site were measured using standard titration. A volume of standardized sulfuric acid (H2SO4) was added to the sample to an endpoint of pH 8.3 and then an endpoint of pH 4.5. The volume of H2SO4 needed to achieve each endpoint is used to calculate the phenolphthalein (OH- + CO3
2-) and total (OH- + HCO3- + CO3
2-) alkalinity as calcium carbonate (CaCO3). The alkalinity procedure is similar to Standard Method 2320 B (Clesceri et al. 1998). 2.2.1.3 Anions Analyses of dissolved anions in groundwater samples from the Hanford Site, Nye County, and Savannah River Site were measured using an ion chromatograph. Bromide, carbonate, chloride, fluoride, nitrate, phosphate, and sulfate were separated on a Dionex AS17 column with a gradient elution technique from 1 mM to 35 mM KOH and measured using a conductivity detector. This methodology is similar to Method 9056 in Test Methods for Evaluating Solid Wastes: Physical/Chemical Methods EPA SW-846 (1994b) with the exception of using gradient elution with NaOH. 2.2.1.4 Total Carbon Total carbon contents of the groundwater samples from the Hanford Site, Nye County, and Savannah River Site were measured using a Shimadzu Carbon analyzer Model TOC-V csn that is equipped with an autosampler. The method used of measuring the carbon content of the groundwater samples is described in PNNL Technical Procedure AGG-TOC-001 (PNNL 2004),2 and is similar to EPA Method 9060 (Total Organic Carbon) in Test Methods for Evaluating Solid Wastes: Physical/Chemical Methods EPA SW-846 (EPA 1986). The adequacy of the system performance was confirmed by analyzing for known quantities of a liquid carbon standard. 2.2.1.5 Cations and Trace Metals Analyses of major cations, such as Al, Ca, Fe, K, Mg, Mn, Na, and Si, dissolved in the groundwater samples from the Hanford Site, Nye County, and Savannah River Site were completed by inductively coupled plasma-optical emission spectroscopy (ICP-OES) (EPA Method 6010B, EPA 1996). Trace metals analyses, including Ag, As, Cd, Cr, Mo, Pb, Ru, Se, and U, were completed by inductively coupled plasma-mass spectroscopy (ICP-MS) using a method that is similar to EPA Method 6020 (EPA 1994a). For both 2 PNL. 2004. “PNNL Technical Procedure AGG-TOC-001 [Operating of Carbon
Analyzer (TOC-V + SSM-5000A + ASI (Shimadzu))].” Pacific Northwest National Laboratory, Richland, Washington.

2-9
ICP-OES and ICP-MS, high-purity calibration standards were used to generate calibration curves and to verify continuing calibration during the analysis. Multiple dilutions of selected samples were made and analyzed to investigate and correct for matrix interferences. The ICP-MS results are reported as total element concentration in terms of the specific isotope measured. The instrument software converts the concentration of an isotope of an element to the total concentration of the element based on the distribution of isotopes in the natural environment. For example, the total Cr concentration is reported from the raw count rates for both 52Cr and 53Cr isotopes based on taking the raw counts and dividing by the fraction of 52Cr and 53Cr found in nature to yield estimates of total Cr in the sample. (Note that these are stable isotopes of the elements). 2.2.2 Characterization and Analysis of Bulk Soil Samples 2.2.2.1 X-ray Diffraction The primary crystalline minerals present in each bulk soil sample were identified using a Scintag X-ray powder diffraction (XRD) unit equipped with a Pelter thermoelectrically cooled detector and a copper X‑ray tube. The diffractometer was operated at 45 kV and 40 mA. Individual scans were obtained from 2 to 65° 2θ with a dwell time of 2 seconds. Scans were collected electronically and processed using the JADE® XRD pattern-processing software. Identification of the mineral phases in the background-subtracted patterns was based on a comparison of the XRD patterns measured for the sludge samples with the mineral powder diffraction files (PDF™) published by the Joint Committee on Powder Diffraction Standards (JCPDS) International Center for Diffraction Data (ICDD). 2.2.2.2 Elemental Analysis by X-ray Fluorescence Elemental analysis of the bulk soil samples was determined by X-ray fluorescence (XRF). The XRF analyses were completed for PNNL by staff at the GeoAnalytical Laboratory in the Department of Geology at Washington State University (1228 Webster Physical Sciences Building, Pullman, Washington 99164-2812) using a Thermo-ARL Advant'XP+ automated spectrometer. The sequential, wavelength dispersive spectrometer contains a Rh-target X-ray tube operated at 60 kV, 60 mA. Samples were prepared for XRF analysis using a lithium tetraborate flux fusion method which includes double fusing (for homogeneity) in carbon crucibles at 1000°C. Preparation time and analytical time were both approximately one hour per sample. Except for now using diamond-impregnated metal disks to improve the lapping of specimen surfaces to flatness, the details of sample preparation are essentially those described in Johnson et al. (1999). 2.2.2.3 Particle Size Distribution American Society for Testing and Materials (ASTM) procedures ASTM D1140-00 (ASTM 2000) (Standard Test Methods for Amount of Material in Soils Finer Than the No. 200 [75 µm] Sieve) and D422-63 (ASTM 2003) (Standard Test Method for Particle-

2-10
Size Analysis of Soils) were used for particle size analysis of the soil samples from the Hanford Site, Nye County, Savannah River Site, and Clemson University locations. In ASTM D422-63, a sedimentation process using a hydrometer is used to determine the distribution of particle sizes smaller than 75 µm, while sieving was used to measure the distribution of particle sizes larger than 53 µm (retained on a No. 270 sieve). A No. 10 sieve, which has sieve size openings of 2.00 mm, was first used to remove the fraction larger than “very coarse” prior to particle size analysis. 2.2.2.4 Moisture Content Gravimetric water contents of the soil samples from the Hanford Site, Nye County, Savannah River Site, and Clemson University locations were determined using PNNL procedure PNL-MA-567-DO-1 (PNL 1990).3 This procedure is based on the ASTM Method D2216-98 (Test Method for Laboratory Determination of Water (Moisture) Content of Soil and Rock by Mass) (ASTM 1998). One representative subsample of each soil sample was placed in tared containers, weighed, and dried in an oven at 105°C (221°C) until constant weight was achieved, which took at least 24 hours. The containers then were removed from the oven, sealed, cooled, and weighed. At least two weighings, each after a 24-hour heating, were performed to ensure that all moisture was removed. The gravimetric water content was computed as the percentage change in soil weight before and after oven drying. 2.2.2.5 Cation Exchange Capacity The cation exchange capacity (CEC) of the soil samples from the Hanford Site, Nye County, Savannah River Site, and Clemson University locations were determined using the method described in ASA (1982). This method is particularly suited to arid land soils, including those containing carbonate, gypsum, and zeolites. This procedure involves two steps. The first step consists of saturation of the cation exchange sites with Na by reaction of the soil with pH 8.2, 60% ethanol solution of 0.4-N NaOAc–0.1 N NaCl. This is then followed by extraction of 0.5 N MgNO3. The concentrations of dissolved Na and Cl are then measured in the extracted solution so that the dissolved Na from the excess saturation solution, carried over from the saturation step to the extraction step, is deducted from the total Na. This provides amount of exchangeable Na, which is equivalent to the CEC. 2.2.2.6 Carbon Content The total carbon and the inorganic carbon contents of the soil samples from the Hanford Site, Nye County, Savannah River Site, and Clemson University locations were measured using a Shimadzu Carbon Analyzer Model TOC-V csn. The method used to measure the carbon contents of the soil samples is similar to ASTM Method E1915-01 (Test Methods 3 PNL. 2000. “PNNL Technical Procedure SA-7. Water Content.” Procedure
approved in May 2000, in Procedures for Ground-Water Investigations, PNL-MA-567, Pacific Northwest National Laboratory, Richland, Washington.

2-11
for Analysis of Metal Bearing Ores and Related Materials by Combustion Infrared Absorption Spectrometry) (ASTM 2001). Known quantities of calcium carbonate standards were analyzed to verify that the instrumentation was operating properly. Inorganic carbon content was determined through calculations performed using the microgram per-sample output data and sample weights. The organic carbon content of the soil samples was calculated by subtracting the inorganic carbon contents from the respective total carbon contents for each sample. 2.2.2.7 1:1 Soil:Water Extracts The water-soluble inorganic constituents in the soil samples from the Hanford Site, Nye County, Savannah River Site, and Clemson University locations were determined using a 1:1 soil:deionized-water extract method. The extracts were prepared by adding an exact weight of deionized water to approximately 60 to 80 g of soil subsample. The weight of deionized water needed was calculated based on the weight of the field-moist samples and their previously determined moisture contents. The sum of the existing moisture (porewater) and the deionized water was fixed at the mass of the dry soil. The appropriate amount of deionized water was added to screw cap jars containing the soil samples. The jars were sealed and briefly shaken by hand, then placed on a mechanical orbital shaker for one hour. The samples were allowed to settle until the supernatant liquid was fairly clear. The supernatant was carefully decanted and filtered (passed through 0.45 µm membranes) for conductivity, pH, anion, carbon, and cation analyses. More details can be found in Rhoades (1996) and within Methods of Soils Analysis - Part 3 (ASA 1996). The methods used for the pH, conductivity, anion, carbon, and cation analyses are the same as those described above for the analysis of the groundwater samples. The results for the analyses of the 1:1 soil:water extracts for the three soil samples are reported in terms of both units per gram of soil and units per milliliter of pore water. This conversion is based on a soil-to-water ratio of 1.0. 2.3 Results of Analyses and Characterization of Groundwater and Soil
Samples Table 2.1 lists the tables and figures that contain the results of the analyses and characterization studies of the groundwater, soil, and 1:1 soil:water extract samples from the Hanford Site, Nye County, Savannah River Site, and Clemson University locations. In the following tables, analyses are listed for primary and duplicate samples of one of the three groundwater, soil, and 1:1 soil:water extract samples. A duplicate sample is selected at random when a set of samples is submitted for analyses as part of the standard laboratory quality-assurance operating procedures used by the analytical laboratories in the PNNL Applied Geology and Geochemistry Group.

2-12
The background-subtracted XRD patterns for the soil samples from the Hanford Site, Nye County, Savannah River Site, and Clemson University Site are shown in Figure 2.6, Figure 2.7, Figure 2.8, and Figure 2.9, respectively. Each XRD pattern is shown as a function of degrees 2θ based on Cu Kα radiation (λ=1.5406 Å). The vertical axis in each pattern represents the intensity in counts per second (cps) of the XRD peaks. In order to conveniently scale the XRD patterns on the vertical axes and visualize the minor XRD peaks, it was necessary to cutoff the intensity of the most intense XRD peak in each pattern. These intensity cutoffs are labeled on each XRD pattern, and correspond to the largest XRD peak for feldspar for the Hanford Site soil sample, and for quartz for the Nye County, Savannah River Site, and Clemson University Site soil samples. At the bottom of each XRD pattern, one or more schematic database (PDF) patterns considered for phase identification are also shown for comparison purposes. The height of each line in the schematic PDF patterns represents the relative intensity of an XRD peak (i.e., the most intense [the highest] peak has a relative intensity [I/Io] of 100%). As noted previously, a crystalline phase typically must be present at greater than 5 wt% of the total sample mass (greater than 1 wt% under optimum conditions) to be readily detected by XRD. The following minerals were identified in the soil samples (see Figure 2.6, Figure 2.7, Figure 2.8, and Figure 2.9):
• Hanford Site soil – quartz, plagioclase feldspar, microcline feldspar, amphibole, chlorite, and mica
• Nye County soil – quartz, plagioclase feldspar, microcline feldspar, amphibole, zeolite, and mica
• Savannah River Site soil – quartz • Clemson University Site soil – quartz
More detailed analyses would be required to refine the identities of the general mineral identifications (e.g., plagioclase, amphibole, zeolite, mica, etc.) to specific compositions. The soil sample from Nye County appears to contain a zeolite mineral. Although the pattern for this soil sample (Figure 2.7) was a good match to the database pattern for clinoptilolite (PDF 47-1870), other compositions of zeolites may also match this pattern. Several reflections in the XRD patterns for soil samples from the Savannah River Site (i.e., 16.62, 25.50, and 33.44 °2θ) and Clemson University Site (i.e., 19.96, 23.99, 25.48, 25.67, 34.95, 37.74, 38.54 °2θ) could not be identified. Additional XRD patterns measured at slower scanning rates would be needed to identify the minerals associated with these reflections. Some of the unassigned reflections in the XRD pattern for the Clemson University soil appear to match anthropogenic organic compounds, but this identification is problematic. To test this possibility, a sample of the Clemson University soil was heated for approximately 5 hours at 500°C in an attempt to decompose any organic solids present in the sample, and then re-analyzed by X-ray diffraction. The results however were inconclusive because there were no differences in the XRD patterns for the Clemson University soil before and after heating at 500°C.

2-13
Table 2.1. Tables and Figures Containing the Results of the Analyses and
Characterization Studies of the Groundwater, Soil, and 1:1 Soil:Water Extract Samples from the Hanford Site, Nye County, Savannah River Site, and Clemson University locations.
Type of Sample Table or Figure Numbers Results Reported
Table 2.2 pH and Conductivity
Table 2.3 Alkalinity at pH 8.3 and 4.5 Endpoints
Table 2.4 Dissolved Anions by IC
Table 2.5 Total Dissolved Carbon
Table 2.6 Dissolved Macro and Trace Elements by ICP-OES
Groundwater Samples
Table 2.7 and Table 2.8 Dissolved Trace Metals by ICP-MS
Figure 2.6, Figure 2.7, Figure 2.8, and
Figure 2.9
XRD patterns for soil samples from Hanford, Nye County, Savannah River, and Clemson University Sites, respectively
Table 2.9 and Table 2.10
Elemental analyses of bulk soil samples by XRF
Table 2.11 Particle Size of Bulk Solid
Table 2.12 Moisture Content
Table 2.13 Cation Exchange Capacity (CEC)
Soil Samples
Table 2.14 Contents of Total, Inorganic, and Organic Carbon
Table 2.15 pH and Conductivity
Table 2.16 Alkalinity at pH 8.3 and 4.5 Endpoints
Table 2.17 Dissolved Anions by IC Table 2.18 and Table
2.19 Dissolved Macro and Trace Elements by ICP-OES
1:1 Soil:Water Extracts
Table 2.20 and Table 2.21 Dissolved Trace Metals by ICP-MS

2-14
Table 2.2. pH and Conductivity Values for the Groundwater Samples
Groundwater Samples pH Conductivity* (mS/cm)
Hanford Site 8.43 0.544 Hanford Site (duplicate) 8.35 0.543 Nye County 8.42 0.197 Savannah River Site 8.75 1.052 * The basic unit of conductivity is the siemens (S),
formerly called the mho.
Table 2.3. Alkalinity Values for the Groundwater Samples
Alkalinity at pH 8.3 Endpoint
Total Alkalinity at pH 4.5 Endpoint Groundwater Samples
(mg CaCO3/L) Hanford Site 0.0* 168.36 Hanford Site (duplicate) 0.0 167.63 Nye County 15.372 290.60 Savannah River Site 0.0 81.984 * Alkalinity values of 0.0 mg CaCO3/L at the pH 8.3 endpoint indicate that
the starting pH values of the respective groundwater samples were near or less than pH 8.3.
Table 2.4. Concentrations of Dissolved Anions in the Groundwater Samples
Br- CO32- Cl- F- NO3
- PO43- SO4
2- Groundwater Samples
(µg/mL) Hanford Site <0.48 222.7 20.07 0.42 13.76 <0.51 79.75 Hanford Site (duplicate)
<0.48 220.9 20.00 0.42 13.66 <0.51 79.49
Nye County <0.48 389.1 44.96 5.91 2.47 <0.51 187.0
Savannah River Site <0.48 59.38 2.60 0.09 <0.43 <0.51 5.29

2-15
Table 2.5. Concentrations of Total Dissolved Carbon in the Groundwater Samples
Total Dissolved Carbon Groundwater Samples
#1 #2 Average (mg/L) Hanford Site 39.85 40.14 40.00 Nye County 68.40 68.33 68.37 Savannah River Site 17.83 17.74 17.79
Table 2.6. Concentrations of Dissolved Macro and Trace Metals in the Groundwater
Samples as Determined by ICP-OES
Al As B Ba Be Bi Ca Cd Co Cr Groundwater Samples
(µg/L)
Hanford Site ND <1.3E+02 <1.3E+02 1.8E+02 <6.3E+01 ND 5.8E+04 ND <2.5E+01 <6.3E+01Hanford Site (duplicate) ND <1.3E+02 <1.3E+02 1.5E+02 <6.3E+01 ND 5.9E+04 ND <2.5E+01 <6.3E+01
Nye County ND <1.3E+02 8.8E+02 8.1E+01 <6.3E+01 ND 1.9E+04 ND <2.5E+01 <6.3E+01Savannah River Site ND <1.3E+02 <1.3E+02 6.3E+01 <6.3E+01 ND 3.3E+04 ND ND <6.3E+01
Cu Fe K Li Mg Mn Mo Na Ni P
(µg/L)
Hanford Site <2.5E+02 <2.5E+01 7.6E+03 <2.5E+03 2.2E+04 ND <2.5E+01 2.4E+04 <2.5E+01 <3.1E+02Hanford Site (duplicate) <2.5E+02 <2.5E+01 7.7E+03 <2.5E+03 2.2E+04 ND ND 2.4E+04 <2.5E+01 <3.1E+02
Nye County <2.5E+02 <2.5E+01 1.4E+04 <2.5E+03 1.7E+04 ND <2.5E+01 2.1E+05 <2.5E+01 <3.1E+02Savannah River Site <2.5E+02 <2.5E+01 <1.3E+03 <2.5E+03 8.2E+02 ND <2.5E+01 1.7E+03 <2.5E+01 <3.1E+02
Pb S Se Si Sr Ti Tl V Zn Zr
(µg/L)
Hanford Site ND ND <5.0E+02 2.9E+04 2.3E+02 ND ND <2.5E+02 3.7E+02 <2.5E+01Hanford Site (duplicate) ND ND <5.0E+02 2.9E+04 2.3E+02 ND ND <2.5E+02 3.5E+02 ND
Nye County ND ND <5.0E+02 2.2E+04 5.3E+02 ND ND ND <6.3E+01 ND Savannah River Site ND ND <5.0E+02 1.3E+04 8.5E+01 ND ND <2.5E+02 <6.3E+01 <2.5E+01

2-16
Table 2.7. Concentrations of Dissolved Trace Metals in the Groundwater Samples as Determined by ICP-MS
Ag – total based on As – total based on Cd – total based on Cr – total based on
107Ag* 109Ag 75As 111Cd 114Cd 52Cr 53Cr Groundwater
Samples
(µg/L)
Hanford Site <1.25E-01 <1.25E-01 2.51E+00 <5.00E-01 <5.00E-02 2.05E+00 2.24E+00 Hanford Site (duplicate) <1.25E-01 <1.25E-01 2.85E+00 <5.00E-01 <5.00E-02 1.99E+00 2.55E+00
Nye County <1.25E-01 <1.25E-01 4.02E+01 <5.00E-01 <5.00E-02 <1.25E+00 1.53E+00
Savannah River Site <1.25E-01 <1.25E-01 <2.50E+00 <5.00E-01 <5.00E-02 <1.25E+00 1.28E+00
* Note that all isotopes indicated are non-radioactive.
Table 2.8. Concentrations of Dissolved Trace Metals in the Groundwater Samples as
Determined by ICP-MS (Continued)
Mo – total based on Pb – total based on Ru – total based on Se – total based on
U – total based on
95Mo** 98Mo 206Pb 208Pb 101Ru 102Ru 82Se 238U Groundwater
Samples
(µg/L)
Hanford Site <2.50E+00 1.26E+00 <1.25E+00 <1.25E+00 <1.25E+00 <1.25E+00 <2.50E+01 2.32E+00 Hanford Site (duplicate) <2.50E+00 <1.25E+00 <1.25E+00 <1.25E+00 <1.25E+00 <1.25E+00 <2.50E+01 2.30E+00
Nye County 1.34E+01 1.24E+01 <1.25E+00 <1.25E+00 <1.25E+00 <1.25E+00 <2.50E+01 3.78E+00
Savannah River Site <2.50E+00 <1.25E+00 <1.25E+00 1.32E+00 <1.25E+00 <1.25E+00 <2.50E+01 <5.00E-02
* Note that all isotopes indicated are non-radioactive.

2-17
Figure 2.6. Background-Subtracted XRD Pattern for Hanford Site Soil Sample
°2θ
5 10 15 20 25 30 35 40 45 50 55 60 65
Rel
ativ
e In
tens
ity (c
ps) Hanford Site
Soil Sample
QuartzPlagioclase
MicroclineAmphibole
MicaChlorite
Intensity Cutoff

2-18
Figure 2.7. Background-Subtracted XRD Pattern for Nye County Soil Sample
°2θ
5 10 15 20 25 30 35 40 45 50 55 60 65
Rel
ativ
e In
tens
ity (c
ps)
Nye CountySoil Sample
QuartzPlagioclase
MicroclineAmphibole
MicaZeolite
Intensity Cutoff

2-19
Figure 2.8. Background-Subtracted XRD Pattern for Savannah River Site Soil Sample
°2θ
5 10 15 20 25 30 35 40 45 50 55 60 65
Rel
ativ
e In
tens
ity (c
ps) Savannah River Site
Soil Sample
Quartz
Intensity Cutoff

2-20
Figure 2.9. Background-Subtracted XRD Pattern for Clemson University Site Soil Sample
5 10 15 20 25 30 35 40 45 50 55 60 65
Rel
ativ
e In
tens
ity (c
ps) Clemson University Site
Soil Sample
Quartz
Intensity Cutoff
°2θ

2-21
Table 2.9. Concentrations of Major Elements in Bulk Soil Samples as Determined by XRF
Al2O3 CaO FeO* K2O MgO MnO** Na2O P2O5 SiO2 TiO2 Total
(wt% – dry basis, normalized to 100%)
Hanford Site 13.91 3.78 6.40 2.13 2.24 0.108 2.40 0.182 67.70 1.147 100.00
Nye County 13.44 6.23 2.04 4.31 1.55 0.064 3.00 0.071 68.95 0.347 100.00
Savannah River Site 1.79 0.03 0.43 0.07 0.06 0.026 0.02 0.037 97.05 0.495 100.00Clemson University Site 0.90 0.02 0.28 0.04 0.03 0.007 0.00 0.047 98.27 0.328 99.93
LOI*** Al2O3 CaO FeO* K2O MgO MnO** Na2O P2O5 SiO2 TiO2 Total
(%) (wt% – normalized to 100% minus LOI) Hanford Site 4.82 13.21 3.59 6.08 2.03 2.12 0.103 2.28 0.173 64.32 1.090 95.00
Nye County 7.91 12.35 5.73 1.88 3.97 1.42 0.059 2.75 0.065 63.37 0.319 91.91Savannah River Site 1.79 1.76 0.03 0.42 0.07 0.06 0.026 0.02 0.036 95.22 0.486 98.12
Clemson University 1.04 0.89 0.02 0.27 0.04 0.03 0.007 0.00 0.047 97.19 0.325 98.90* Concentrations of total iron are normalized to FeO. XRF determines the concentrations of total iron and manganese, but does not provide any data regarding the oxidation states of such redox sensitive elements present in the sample. ** Concentrations of total manganese are normalized to MnO. *** LOI = Loss on ignition
Table 2.10. Concentrations of Trace Elements in Bulk Soil Samples as Determined by XRF
Ba Ce Cr Cu Ga La Nb Nd Ni
(ppm)
Hanford Site 648 70 44 20 17 35 13 31 23
Nye County 694 95 13 9 17 53 19 36 10
Savannah River Site 45 86 17 7 1 25 10 28 11 Clemson University Site 24 46 17 4 2 18 6 15 3
Pb Rb Sc Sr Th V Y Zn Zr
(ppm)
Hanford Site 16 69 15 311 10 138 30 70 254
Nye County 24 136 6 413 19 24 27 53 256
Savannah River Site 8 10 2 6 8 16 24 13 675 Clemson University Site 7 4 0 3 7 10 13 21 445

2-22
Table 2.11. Particle Size Analysis of the Bulk Soil Samples
Gravel
(x > 2 mm) Sand
(2 > x > 0.050 mm) Silt/Clay
(x < 0.050 mm) Soil Samples (wt%)
Hanford Site 0.0 82.92 17.08 Nye County 0.0 98.99 1.01 Savannah River Site 0.0 97.01 2.99 Clemson University Site 0.0 97.50 2.50
Table 2.12. Moisture Contents of the Bulk Soil Samples
Moisture (wt%) Soils First
Weighing Second
Weighing Hanford Site 2.49 2.39 Nye County 2.51 2.30 Nye County (duplicate) 2.57 2.38 Savannah River Site 0.25* 0.21* Clemson University Site 0.16* 0.13* * Soils from these two sites fall under USDA-APHIS because of the
potential for fire-ant contamination. Prior to distribution for characterization, these soils had therefore been heat treated by either heating in a forced air oven at 110°-125°C for 16 to 48 h, or autoclaving at temperatures 110°C and 15 pounds pressure for a minimum of 30 min.
Table 2.13. Cation Exchange Capacity (CEC) Values for the Soil Samples
CEC (meq/100 g) Soils #1 #2 #3 Average
Hanford Site 38.2 35.1 ND* 36.7 Nye County 27.3 28.5 29.3 28.4 Savannah River Site 26.8 22.4 ND* 24.6 Clemson University Site 27.8 23.6 ND* 25.7 * ND – Third analysis of CEC not determined for these soil samples.

2-23
Table 2.14. Carbon Contents of the Soil Samples
Total Carbon Total Inorganic Carbon
Total Inorganic Carbon As
CaCO3
Total Organic Carbon
(by difference)
#1 #2 Ave #1 #2 Ave Ave Ave
Soil
(wt%) Hanford Site 0.36 0.36 0.36 0.09 0.09 0.09 0.72 0.27 Nye County 1.10 1.08 1.09 0.97 0.98 0.97 8.11 0.12 Nye County (duplicate) 1.38 1.38 1.38 1.26 1.22 1.24 10.31 0.14
Savannah River Site 0.63 0.63 0.63 0.0 0.0 0.0 0.0 0.63 Clemson University Site 0.38 0.38 0.38 0.0 0.0 0.0 0.0 0.38
Table 2.15. pH and Conductivity Values for the 1:1 Soil:Water Extracts
1:1 Soil:Water Extracts pH Conductivity (mS/cm)
Conductivity (mS/cm) Dilution Corrected (in
Pore Water)
Hanford Site 7.48 0.184 7.38
Nye County 8.07 0.400 15.94
Nye County (duplicate) 8.14 0.407 15.85
Savannah River Site 4.46 0.303 120.90
Clemson University Site 4.92 0.158 96.51
Clemson University Site (duplicate) 4.87 0.149 91.06

2-24
Table 2.16. Alkalinity Values for the 1:1 Soil:Water Extracts
Akalinity at pH 8.3 Endpoint
Total Alkalinity at pH 4.5 Endpoint
Porewater Total Alkalinity at pH 4.5 Endpoint Dilution Corrected
(in Pore Water) 1:1 Soil:Water
Extracts
(mg CaCO3/L)
Hanford Site 0.0* 85.644 3,436.0
Nye County 6.588 137.61 5,485.7
Nye County (duplicate) 5.124 142.74 5,557.3
Savannah River Site 0.0* 10.248 4,088.9**
Clemson University Site 0.0* 19.764 12,070**
Clemson University Site (duplicate) 0.0* 19.032 11,630**
* Alkalinity values of 0.0 mg CaCO3/L at the pH 8.3 endpoint indicate that the starting pH values of the respective extract samples were near or less than pH 8.3.
** Indicated dilution-corrected, porewater alkalinity values are likely in error by a considerable, but unknown, amount. Because these soil samples fell under USDA-APHIS and had been heat treated before submission characterization and analysis, calculations based on their low (essentially zero) moisture contents resulted in error in the calculated, dilution-corrected, porewater alkalinity values.

2-25
Table 2.17. Concentrations of Dissolved Anions in 1:1 Soil:Water Extract
Br- CO32- Cl- F- NO3
- PO43- SO4
2- 1:1 Soil:Water Extracts*
(µg/g soil)
Hanford Site <0.48 70.36 <0.236 0.16 2.50 NR** 1.36
Nye County <0.48 161.8 6.86 7.03 5.57 NR** 30.81
Nye County (duplicate) <0.48 162.0 6.92 7.07 5.20 NR** 30.69
Savannah River Site <0.48 <50.00 2.85 5.53 2.22 NR** 29.22
Clemson University Site <0.46 <48.19 0.39 1.05 1.68 7.37 18.11
Clemson University Site (duplicate) <0.46 <48.21 0.40 2.65 1.76 7.90 19.04
(µg/mL pore water)
Hanford Site <19.30 2,823 <9.452 6.62 100.3 NR** 54.63
Nye County <19.17 6,446 273.5 280.4 222.0 NR** 1,228
Nye County (duplicate) <18.73 6,307 269.5 275.2 202.3 NR** 1,195
Savannah River Site <191.9 <19,950 1,136 2,205 886.8 NR** 11,660
Clemson University Site <293.8 <30,540 246.5 665.0 1,066 4,671 11,480
Clemson University Site (duplicate) <294.0 <30,560 254.5 1678 1,115 5,006 12,070 * Pore water dilution factors were 40.12, 39.86, 38.93, 399.00, 610.81, and 611.12, respectively. Dilution factor corrected - µg in water extract per mL pore water. ** NR = Values not reported because analyses of PO4
3- standard were outside the control limits. *** NA = Not applicable. Values could be calculated based on the measured values of 0.0 µg/g soil.

2-26
Table 2.18. Concentrations (µg/g soil) of Dissolved Macro and Trace Metals in the 1:1
Water Extracts as Determined by ICP-OES
Al As B Ba Be Bi Ca Cd Co Cr 1:1 Soil:Water
Extracts (µg/g soil)
Hanford Site ND ND <2.5E+02 <1.2E-01 <2.5E-01 <1.2E+00 2.10E+01 ND <6.2E-01 <1.2E-01
Nye County <5.0E-01 ND <2.5E+02 <1.3E-01 <2.5E-01 <1.3E+00 5.40E+00 ND <6.3E-01 <1.3E-01Nye County (duplicate) <5.0E-01 <5.0E+00 <2.5E+02 <1.3E-01 <2.5E-01 <1.3E+00 5.64E+00 ND <6.3E-01 <1.3E-01
Savannah River Site 1.23E+01 ND <2.5E+02 4.20E-01 <2.5E-01 <1.2E+00 1.98E+01 ND <6.2E-01 <1.2E-01
Clemson University Site 2.95E+00 ND <9.6E-02 9.51E-02 <9.6E-03 <1.9E-01 1.29E+01 <9.6E-03 <1.9E-02 <9.6E-03
Clemson Univ Site (duplicate) 3.20E+00 ND <9.6E-02 7.40E-02 <9.6E-03 ND 1.38E+01 <9.6E-03 <1.9E-02 <9.6E-03
Cu Fe K Li Mg Mn Mo Na Ni P
(µg/g soil)
Hanford Site <2.5E+00 <5.0E-01 <6.2E+01 <1.2E+00 5.19E+00 ND <2.5E-01 <2.5E+00 <1.2E+00 <6.2E+00
Nye County <2.5E+00 <5.0E-01 <6.3E+01 <1.3E+00 2.44E+00 ND ND 8.20E+01 <1.3E+00 <6.3E+00Nye County (duplicate) <2.5E+00 <5.0E-01 <6.3E+01 <1.3E+00 2.38E+00 ND <2.5E-01 8.36E+01 <1.3E+00 <6.3E+00
Savannah River Site <2.5E+00 1.70E+00 <6.2E+01 <1.2E+00 3.31E+00 2.71E+01 ND <2.5E+00 <1.2E+00 <6.2E+00
Clemson University Site <9.6E-02 6.85E-01 9.24E+00 <9.6E-02 4.74E+00 2.76E+00 <3.8E-02 5.09E-01 <1.9E-02 3.69E+00
Clemson Univ Site (duplicate) <9.6E-02 7.26E-01 9.78E+00 <9.6E-02 5.04E+00 2.92E+00 ND 5.53E-01 <1.9E-02 3.91E+00
Pb S Se Si Sr Ti Tl V Zn Zr
(µg/g soil)
Hanford Site ND <1.0E+01 ND <2.5E+01 7.89E-02 <2.5E-01 ND ND <1.2E-01 ND
Nye County <1.3E+00 1.15E+01 ND <2.5E+01 5.79E-02 <2.5E-01 ND <2.5E+00 1.65E-01 <2.5E-01Nye County (duplicate) ND 1.11E+01 ND <2.5E+01 5.99E-02 ND ND <2.5E+00 <1.3E-01 ND
Savannah River Site <1.2E+00 1.26E+01 <5.0E+00 <2.5E+01 1.23E-01 <2.5E-01 ND <2.5E+00 2.68E-01 <2.5E-01
Clemson University Site <9.6E-02 8.36E+00 <3.9E-01 <1.9E+00 <1.9E-02 <4.8E-02 <1.9E-01 <9.6E-02 9.57E-02 <1.9E-02
Clemson Univ Site (duplicate) <9.6E-02 8.89E+00 <3.9E-01 <1.9E+00 <1.9E-02 <4.8E-02 <1.9E-01 <9.6E-02 7.87E-02 <1.9E-02

2-27
Table 2.19. Concentrations (µg/L pore water) of Dissolved Macro and Trace Metals in
the 1:1 Water Extracts as Determined by ICP-OES
Al As B Ba Be Bi Ca Cd Co Cr 1:1 Soil:Water
Extracts (µg/L pore water)
Hanford Site ND ND <1.0E+07 <5.0E+03 <1.0E+04 <5.0E+04 8.44E+05 ND <2.5E+04 <5.0E+03
Nye County <2.0E+04 ND <1.0E+07 <5.0E+03 <1.0E+04 <5.0E+04 2.15E+05 ND <2.5E+04 <5.0E+03Nye County (duplicate) <1.9E+04 <1.9E+05 <9.7E+06 <4.9E+03 <9.7E+03 <4.9E+04 2.20E+05 ND <2.4E+04 <4.9E+03
Savannah River Site 4.92E+06 ND <1.0E+08 1.68E+05 <1.0E+05 <5.0E+05 7.91E+06 ND <2.5E+05 <5.0E+04
Clemson University Site 1.87E+06 ND <6.1E+04 6.03E+04 <6.1E+03 <1.2E+05 8.17E+06 <6.1E+03 <1.2E+04 <6.1E+03
Clemson Univ Site (duplicate) 2.03E+06 ND <6.1E+04 4.69E+04 <6.1E+03 ND 8.74E+06 <6.1E+03 <1.2E+04 <6.1E+03
Cu Fe K Li Mg Mn Mo Na Ni P
(µg/L pore water)
Hanford Site <1.0E+05 <2.0E+04 <2.5E+06 <5.0E+04 2.08E+05 ND <1.0E+04 <1.0E+05 <5.0E+04 <2.5E+05
Nye County <1.0E+05 <2.0E+04 <2.5E+06 <5.0E+04 9.74E+04 ND ND 3.27E+06 <5.0E+04 <2.5E+05Nye County (duplicate) <9.7E+04 <1.9E+04 <2.4E+06 <4.9E+04 9.25E+04 ND <9.7E+03 3.26E+06 <4.9E+04 <2.4E+05
Savannah River Site <1.0E+06 6.78E+05 <2.5E+07 <5.0E+05 1.32E+06 1.08E+07 ND <1.0E+06 <5.0E+05 <2.5E+06
Clemson University Site <6.1E+04 4.34E+05 5.85E+06 <6.1E+04 3.00E+06 1.75E+06 <2.4E+04 3.22E+05 <1.2E+04 2.34E+06
Clemson Univ Site (duplicate) <6.1E+04 4.60E+05 6.20E+06 <6.1E+04 3.19E+06 1.85E+06 ND 3.51E+05 <1.2E+04 2.48E+06
Pb S Se Si Sr Ti Tl V Zn Zr
(µg/L pore water)
Hanford Site ND <4.0E+05 ND <1.0E+06 3.17E+03 <1.0E+04 ND ND <5.0E+03 ND
Nye County <5.0E+04 4.56E+05 ND <1.0E+06 2.31E+03 <1.0E+04 ND <1.0E+05 6.57E+03 <1.0E+04Nye County (duplicate) ND 4.34E+05 ND <9.7E+05 2.33E+03 ND ND <9.7E+04 <4.9E+03 ND
Savannah River Site <5.0E+05 5.03E+06 <2.0E+06 <1.0E+07 4.90E+04 <1.0E+05 ND <1.0E+06 1.07E+05 <1.0E+05
Clemson University Site <6.1E+04 5.30E+06 <2.4E+05 <1.2E+06 <1.2E+04 <3.1E+04 <1.2E+05 <6.1E+04 6.06E+04 <1.2E+04
Clemson Univ Site (duplicate) <6.1E+04 5.63E+06 <2.4E+05 <1.2E+06 <1.2E+04 <3.1E+04 <1.2E+05 <6.1E+04 4.99E+04 <1.2E+04

2-28
Table 2.20. Concentrations of Dissolved Macro and Trace Metals in 1:1 Water Extracts
as Determined by ICP-MS
Ag – total based on
As – total based on Cd – total based on Cr – total based on Mo – total based on
109Ag** 75As 111Cd 114Cd 52Cr 53Cr 97Mo 98Mo 1:1 Soil:Water
Extracts
(µg/g soil)
Hanford Site 2.09E-04 7.02E-03 <1.25E-04 <1.25E-04 <2.50E-03 <5.00E-03 2.35E-03 2.35E-03
Nye County 8.07E-05 3.94E-02 1.63E-04* 1.41E-04* <2.50E-03 <5.00E-03 1.31E-02 1.33E-02 Nye County (duplicate) 6.12E-05 3.89E-02 <1.25E-04* <1.25E-04* <2.50E-03 <5.00E-03 1.37E-02 1.39E-02
Savannah River Site <5.00E-05 1.21E-03 5.98E-04 5.41E-04 <2.50E-03 <5.00E-03 <5.00E-04 <5.00E-04 Clemson University Site <1.20E-04 5.88E-03 3.14E-04 3.16E-04 7.43E-03 6.80E-03 <1.20E-03 <1.20E-03
Clemson University Site (duplicate) <1.21E-04 6.30E-03 3.33E-04 3.57E-04 8.32E-03 7.48E-03 <1.21E-03 <1.21E-03
(µg/L pore water)
Hanford Site 8.40E+00 2.82E+02 <5.01E+00 <5.01E+00 <1.00E+02 <2.01E+02 9.42E+01 9.42E+01
Nye County 3.22E+00 1.57E+03 6.50E+00* 5.62E+00* <9.97E+01 <1.99E+02 5.24E+02 5.31E+02
Nye County (duplicate) 2.38E+00 1.51E+03 <4.87E+00* <4.87E+00* <9.73E+01 <1.95E+02 5.34E+02 5.43E+02
Savannah River Site <1.99E+01 4.84E+02 2.39E+02 2.16E+02 <9.97E+02 <1.99E+03 <1.99E+02 <1.99E+02 Clemson University Site <7.64E+01 3.72E+03 1.99E+02 2.00E+02 4.71E+03 4.31E+03 <7.64E+02 <7.64E+02
Clemson University Site (duplicate) <7.64E+01 4.00E+03 2.11E+02 2.26E+02 5.27E+03 4.74E+03 <7.64E+02 <7.64E+02
* Indicated values for each respective cadmium isotope are suspect because the values for the primary and duplicate extract samples are too dissimilar.
** Note that all isotopes indicated are non-radioactive.

2-29
Table 2.21. Concentrations of Dissolved Trace Elements in 1:1 Water Extracts as
Determined by ICP-MS (Continued)
Pb – total based on Ru – total based on Se – total based on
U – total based on
206Pb** 208Pb 101Ru 102Ru 82Se 238U 1:1 Soil:Water
Extracts
(µg/g soil)
Hanford Site <1.25E-03 <2.50E-03 <5.00E-05 <5.00E-05 <5.00E-03 1.93E-04
Nye County <1.25E-03 <2.50E-03 <5.00E-05 <5.00E-05 <5.00E-03 1.92E-03 Nye County (duplicate) <1.25E-03 <2.50E-03 <5.00E-05 <5.00E-05 <5.00E-03 2.07E-03
Savannah River Site 5.66E-03 6.07E-03 <5.00E-05 <5.00E-05 <5.00E-03 4.27E-03 Clemson University Site 5.43E-03 5.32E-03 <2.41E-04 <2.41E-04 1.29E-03 2.97E-03
Clemson University Site (duplicate) 6.16E-03 6.06E-03 <2.41E-04 <2.41E-04 1.41E-03 3.10E-03
(µg/L pore water)
Hanford Site <5.01E+01 <1.00E+02 <2.01E+00 <2.01E+00 <2.01E+02 7.73E+00
Nye County <4.98E+01 <9.97E+01 <1.99E+00 <1.99E+00 <1.99E+02 7.65E+01 Nye County (duplicate) <4.87E+01 <9.73E+01 <1.95E+00 <1.95E+00 <1.95E+02 8.05E+01
Savannah River Site 2.26E+03 2.42E+03 <1.99E+01 <1.99E+01 <1.99E+03 1.70E+03 Clemson University Site 3.44E+03 3.37E+03 <1.53E+02 <1.53E+02 8.20E+02 1.88E+03
Clemson University Site (duplicate) 3.90E+03 3.84E+03 <1.53E+02 <1.53E+02 8.96E+02 1.96E+03
* Note that all isotopes indicated are non-radioactive.

2-30
2.4 References for Section 2 ASA (American Society of Agronomy). 1982. Methods of Soil Analysis. Part 2, Chemical and Microbiological Properties. SSSA Book Series 9 (Part 2), AL Page (eds.), Soil Science Society of America, Madison, Wisconsin. ASA (American Society of Agronomy). 1996. Methods of Soil Analysis. Part 3, Chemical Methods. SSSA Book Series 5, DL Sparks (eds.), Soil Science Society of America, Madison, Wisconsin. ASTM (American Society for Testing and Materials). 1998. Method D2216-98. Standard Test Method for Laboratory Determination of Water (Moisture) Content of Soil and Rock by Mass. American Society for Testing and Materials, West Conshohocken, Pennsylvania. ASTM (American Society for Testing and Materials). 2000. Method D1140-00. Standard Test Methods for Amount of Material in Soils Finer Than the No. 200 (75 µm) Sieve. American Society for Testing and Materials, West Conshohocken, Pennsylvania. ASTM (American Society for Testing and Materials). 2001. Method E1915-01. Test Methods for Analysis of Metal Bearing Ores and Related Materials by Combustion Infrared Absorption Spectrometry. American Society for Testing and Materials, West Conshohocken, Pennsylvania. ASTM (American Society for Testing and Materials). 2003. Method D422-63. Standard Test Method for Particle-Size Analysis of Soils (Revised 1998). American Society for Testing and Materials, West Conshohocken, Pennsylvania. Clesceri LS, AE Greenberg, and AD Eaton. 1998. Standard Methods for the Examination of Water and Wastewater, 20th Edition. American Public Health Association, American Water Works Association, and Water Environment Federation, Washington, DC. DOE. 1999. Final Hanford Comprehensive Land-Use Plan Environmental Impact Statement. DOE/EIS-0222-F, U.S. Department of Energy, Washington, D.C. Online at: http://www.hanford.gov/eis/hraeis/maintoc.htm Deutsch WJ, KM Krupka, MJ Lindberg, KJ Cantrell, CF Brown, and HT Schaef. 2004. Hanford Tanks 241-C-203 and 241-C-204: Residual Waste Contaminant Release Model and Supporting Data. PNNL-14903, Pacific Northwest National Laboratory, Richland, Washington.

2-31
EPA (U.S. Environmental Protection Agency). 1986. “Method 9060. Total Organic Carbon.” Test Methods for Evaluating Solid Wastes: Physical/Chemical Methods, EPA SW-846, Third Ed., Vol. I, Section C, Chapter 5 (Miscellaneous Test Methods), pp. 9060-1 to 9060-5, U.S. Environmental Protection Agency, Office of Solid Waste and Emergency Response, Washington, DC. Available at: http://www.epa.gov/epaoswer/hazwaste/test/pdfs/9060.pdf EPA (U.S. Environmental Protection Agency). 1994a. “Method 6020. Inductively Coupled Plasma-Mass Spectrometry.” Test Methods for Evaluating Solid Wastes: Physical/Chemical Methods, EPA SW-846, Third Ed., Vol. I, Section A, Chapter 3 (Inorganic Analytes), pp. 6020-1 to 6020-18, U.S. Environmental Protection Agency, Office of Solid Waste and Emergency Response, Washington, DC. Available at: http://www.epa.gov/epaoswer/hazwaste/test/pdfs/6020.pdf EPA (U.S. Environmental Protection Agency). 1994b. “Method 9056. Determination of Inorganic Anions by Ion Chromatography.” Test Methods for Evaluating Solid Wastes: Physical/Chemical Methods, EPA SW-846, Third Ed., Vol. I, Section C, Chapter 5 (Miscellaneous Test Methods), pp. 9056-1 to 9056-16, U.S. Environmental Protection Agency, Office of Solid Waste and Emergency Response, Washington, DC. Available at: http://www.epa.gov/epaoswer/hazwaste/test/pdfs/9056.pdf EPA (U.S. Environmental Protection Agency). 1995. “Method 9040B. pH Electrometric Measurement.” Test Methods for Evaluating Solid Wastes: Physical/Chemical Methods, EPA SW-846, Third Ed., Vol. I, Section C, Chapter 8 (Methods for Determining Characteristics), pp. 9040B-1 to 9040B-5, U.S. Environmental Protection Agency, Office of Solid Waste and Emergency Response, Washington, DC. Available at: http://www.epa.gov/epaoswer/hazwaste/test/pdfs/9040b.pdf EPA (U.S. Environmental Protection Agency). 1996. “Method 6010B. Inductively Coupled Plasma-Atomic Emission Spectrometry.” Test Methods for Evaluating Solid Wastes: Physical/Chemical Methods, EPA SW-846, Third Ed., Vol. I, Section A, Chapter 3 (Inorganic Analytes), pp. 6010B-1 to 6010B-25, U.S. Environmental Protection Agency, Office of Solid Waste and Emergency Response, Washington, DC. Available at: http://www.epa.gov/epaoswer/hazwaste/test/pdfs/6010b.pdf HEIS. 1994. Hanford Environmental Information System. Environmental Information Systems Department, Fluor Hanford, Inc., Richland, Washington. Johnson, DM, PR Hooper, and RM Conrey. 1999. “XRF Analysis of Rocks and Minerals for Major and Trace Elements on a Single Low Dilution Li-tetraborate Fused Bead. Advances in X-ray Analysis, Vol. 41, JV Gilfrich TC Huang, CR Hubbard, IC Noyan, PK Predecki, DK Smith, and RL Snyder (eds.), p. 843-867. International Centre for Diffraction Data (ICDD), Newtown Square, Pennsylvania.

2-32
Napier BA, KM Krupka, MM Valenta, and TJ Gilmore. 2005. Soil and Groundwater Sample Characterization and Agricultural Practices for Assessing Food Chain Pathways in Biosphere Models . NUREG/CR-6881, PNNL-15244, Pacific Northwest National Laboratory, Richland, WA.
Rhoades JD. 1996. “Salinity: Electrical Conductivity and Total Dissolved Solids.” Methods of Soil Analysis, Part 3, JM Bigham (ed.), pp. 417-435. American Society of Agronomy, Madison, Wisconsin. Serne RJ, BN Bjornstad, DG Horton, DC Lanigan, CW Lindenmeier, MJ Lindberg, RE Clayton, VL LeGore, RD Orr, IV Kutnyakov, SR Baum, KN Geiszler, MM Valenta, and TS Vickerman. 2004. Characterization of Vadose Zone Sediments Below the TX Tank Farm: Boreholes C3830, C3831, C3832 and RCRA Borehole 299 W10-27. PNNL-14594, Pacific Northwest National Laboratory, Richland, Washington.

3-1
3.0 Soil-to-Plant Uptake The Nuclear Regulatory Commission (NRC) is tasked with the determination of risks associated with long-term storage of nuclear waste, and processing by-products, at various locations within the United States. Current models for the calculation of such risks to humans and the environment assess the potential for transfer and (bio)concentration of contaminant radionuclides. The models depend on factors in soil or water which have significant spatial physical and chemical heterogeneity. These calculations are entirely dependent on experimentally derived factors obtained from laboratory and field studies. The numbers and types of these studies, however, are frequently limited in scope, or otherwise constrained in the environmental conditions under which they are performed thus limiting the accuracy of the final estimation. The study described in this section sought to provide additional data on some of the isotopes of concern determined in a previous review (Robertson et al. 2003) The isotopes of concern were selected based on conflicting data currently present in the literature on transfer factors. This is particularly true for conditions like those to be encountered at present and future nuclear waste storage/processing facilities where material may enter the groundwater and subsequently be present in irrigation water to human crop plants.
Three geographical regions were chosen for study; these regions have had, or currently have, operating commercial nuclear waste disposal sites. The three sites selected are in South Carolina near the Barnwell facility, in eastern Washington state near the LLW disposal facility located on the Hanford Site, and in southern Nevada near the closed Beatty disposal facility. South Carolina depends primarily on rainfall to directly recharge soil moisture and the shallow aquifers. In eastern Washington, the primary source of water to crop plants is through irrigation from aerial sprayers - the water being derived from large rivers. In southern Nevada, water is also supplied through irrigation both aerial and also delivered as flood irrigation directly to the surface of the soil, with the water coming from large underground aquifers accumulated over thousands of years. The soil to plant pathway for transfer of radionuclides is dependent on a number of factors. These may include:
a) the chemical nature and reactivity of the isotope as it may affect the availability of the isotope within the soil pore water within the rhizosphere of the plant root;
b) the route of exposure (e.g. root versus foliar exposure); c) the plant species itself (physical stature, root-shoot ratio); and, d) the nutrient requirements of the plant (chemical similarity of the isotope to a
nutrient). The efforts reported in this document address the uptake and distribution of Technetium-99 (99Tc), Plutonium-238 (238Pu), and Americium-241 (241Am) in three differing soil types and various crop types. In all instances, the label was surface applied to the soil as irrigation water and allowed to be flushed down into the soil profile to the plant roots.

3-2
3.1 Materials and Methods 3.1.1 Soils The effort was to accurately determine realistic transfer factors of selected isotopes (99Tc, 241Am, 238Pu) from soils selected from differing regions of the United States to crop plants (e.g. alfalfa, onions, corn, and potatoes). The soils were amended through surface irrigation to reflect the potential contamination of groundwater aquifers. The basic properties of the soil type used are given in Table 3.1 (CEC is cation exchange capacity, OM is organic matter).
3.1.1.1 Soil Types
Following consultation with our sponsor, four soils were employed during the study: • Hanford Sandy Loam Soil – Hanford Site 200-Area, WA • Nevada Nye County Sandy Clay Soil – Amargosa, NV • Savannah River Pine Forest Soil – Savanna River Site, SC • South Carolina Field Soil – Clemson University Research Station at Blackville,
South Carolina (approximately 15 km [10 mi.] north-east of Barnwell, SC)
Table 3.1. Summarized soil properties.
Soil Type pH CEC %OM %Sand %Silt/ClayHanford 7.48 37 0.27 83 17 Nevada 8.07 28 0.12 99 1
Savannah River Pine Forest 4.46 25 0.63 97 3
Savannah River Field Soil 4.87 25.7 0.38 97.5 2.5
All soils were received from the various sites in sealed 19 L (5-gallon) plastic buckets. The Washington State Hanford soil and the Nevada Nye County soil were: 1) air dried in the green house in soil bins for at least 7 days with frequent turnover; 2) sieved through 2 mm standard soil sieves (No. 10) and stored in sealed plastic lined cans at room temperature until used. The soil from South Carolina (Savannah River Forest and Field) now falls under the Post-9/11 Restricted Shipping Regulations of USDA-APHIS because of the potential for fire-ant contamination. Following a lengthy approval period by APHIS the Savannah River soils were therefore processed as described in Section 2.1.3. Prior to use in the experiment all soils were tested for soil water holding capacity and per cent moisture remaining in air dried/sieved soil. 3.1.2 Plant Material Four plant species were chosen to represent a root, forage, and seed and grain crop:
Onion (Alium cepa) as starter plants

3-3
Potato (Solanum tuberosum) var. Pasco Gold Alfalfa (Medicago sativa) var. Corn (Zea mays) var. Sugar Dot.
All seed were obtained locally (Columbia Basin Feed and Grain, Pasco, WA). To prevent root binding that might stunt plant growth, all species were grown in 1-gallon pots each containing 5 kg of soil for the 99Tc experiments, or 3 kg of soil for the actinide experiments. The number of plants in each pot varied: Onion – 5 plants/pot; Alfalfa - 4 plants/pot; Potato - 2 plants/pot; and Corn - 3 plants/pot. Those derived from seed (alfalfa and corn) were seeded at a minimum 10/pot and later thinned to the number above. The plants were grown for a minimum of 45 to 60 days, or until flowering and seed set or tuber development. Plants were grown in two growth chambers (inside and outside of the radiation buffer zone) of identical make and model. Growth chamber conditions included a light intensity of ~400 µEinsteins/m-2/sec at soil level from a combination of fluorescent and incandescent lamps, a 12/12 h light/dark cycle with a18°C night and 27°C day temperature and 80% relative humidity. The soils in the pots were maintained at ~60% to 80% field capacity (-2 bars or -0.2 MPa) as measured by a soil moisture meter and sensors (Cole-Parmer Co., Vernon Hills, Illinois) placed 1/3 of the distance from the top to bottom of the soil column. The plants were watered with de-ionized water as needed and once weekly with a 1/10th strength Hoagland’s solution if nutrient stress became evident. The upper surface of the soil was covered (5mm-deep) with black polyethylene beads to minimize water evaporation from the soil surface and prevent splashing when watering and amending with label (Fig 2.1). Moisture sensors were monitored every other day.
Figure 3.1. Hanford soil pot with germinating alfalfa showing secondary containment and plastic lined pot with polyethelene beads on top of soil and water sensor wire going into soil.

3-4
For experiments employing actinides (241Am and 238Pu), we were required to keep the growth chamber doors closed except for labeling and harvesting. To accomplish this, the leads from the water sensors were threaded through a small hole in the side of the chamber which was sealed around the wires as shown in Figs. 3.2, 3.3, and 3.4, so that the water status of each pot could be monitored from outside. Water, or fertilizer if required, was supplied through irrigation tubing from outside the chamber as well. Air-flow out of the chamber was modified to maintain a negative pressure within the chamber. Air vents were covered with certified HEPA filters. 3.1.3 Label Amendment
3.1.3.1 Technetium
Technetium-99 (99Tc), a group VII element, was the first isotope tested. The stock solutions were obtained from New England Nuclear (Boston, Massachusetts). Technetium most closely resembles rhenium and, to a lesser extent, manganese. The pertechnetate ion, TcO4
-, is a weaker oxidant than permanganate, but stronger than perrhenate (Wildung et al. 1979). In aqueous solutions, the pertechnetate ion is highly stable over a broad pH range and at concentrations of 1.1 x 10⁻⁵ to 0.18 M. Given the conditions in most aerobic agricultural soils and natural waters of the world, pertechnetate would be the predominant form of Tc present. This is also the case for the soluble species of Tc in the alkaline wastes from Hanford (Wildung et al. 1979).
Figure 3.2. Diagram of pot showing drip irrigation line added just below the soil surface to avoid the potential for resuspension of the label from the surface of the soil. The plastic beads were used to prevent disturbance of the soil and reduce evapotranspiration from the soil surface.

3-5
Figure 3.3. Diagram of Growth Chamber Configuration for the Actinide Experiment. Two Isotopes, 241Am and 238Pu, and three soils, Hanford (H), Nevada (N), and Savannah River Field (SRF) and two plant species, Alfalfa (Medicago sativa) and potato (Solanum tuberosa) were employed.
Figure 3.4. (A) Interior View of Growth Chamber During Actinide Experiment Showing Positioning of Water Sensor Wiring and Irrigation Tubing. (B) Cameras at either end of the growth chamber monitor the status of the plants.
H-4 H-1
N-1
SRF-1
H-5 H-2
N-2H-6
N-5
N-4
SRF-5
SRF-2
SRF-4
SRF-6
SRF-3
N-3
N-6
Sensor - 3
Sensor - 2Sensor - 1 Water - 1
Water - 2
SRF-8
H-12
H-10
H-9
H-11
H-8 SRF-12
N-9
N-8
SRF-9
SRF-11
SRF-10
SRF-7
N-12
N-7
N-11
N-10
H-7
Am 241
Pu 239
Alfalfa Potato
Door
Camera
Camera
H-3
Camera
Watering TubeWatering Tubes
Water Sensors
A B
Water Sensors

3-6
The exposure scenario followed was an irrigation route. Therefore, the isotope was applied in each pot to the surface of the soil in 100-mL aliquots (as small droplets) at four separate times: 1) immediately following planting; 2) 1-week post-emergence; 3) onset of flowering; and 4) initiation of seed development. Subsequent watering as described above was non-radioactive to promote movement of the isotope into the root zone. The rate of isotope application is given in Table 3.2 below.
Table 3.2 Chemical form, specific activity (mCi/g) and activity (µCi/pot) of soil for 99Tc.
Attributes Technetium-99 Chemical Form Ammonium Pertechnetate
Solvent 0.01N NH4OH Sp. Activity 17.05 mCi/g
Final Activity/Pot 1.0 µCi Activity/100 mL Aliquot 0.25 µCi
Aliquot Chemical Composition 0.001N Ammonium Pertechnetate,
pH=~8.0
3.1.3.2 Actinides (241Am and 238Pu) Americium-241 and 238Pu were obtained through the PNNL Radiochemical Processing Laboratory from standards used to calibrate instruments monitoring the cleanup activities associated with the Hanford 200-Area Tank Waste Program. The amounts and descriptions are provided below in Table 3.3. Activities of each of the isotopes used in the experiments were defined by bench top limits permitted in the growth chamber under the PNNL Radioactive Control Policy (RCP) stated in the Standards Based Management System (SBMS). Bench Top Limits for Non-Dispersible Actinides as set by SBMS (RCP-3.1.01) were 12.0 µCi for 241Am, and 14.0 µCi for 238Pu. The growth chamber is considered a single bench top. The experimental design was therefore set for 18 pots of 241Am and 18 pots of 238Pu. To maximize the activity per pot and not compromise the amount of soil, the pots contained 3 kg of soil as opposed to the 5 kg for the 99Tc. Therefore the total activity for the 241Am was 0.66 µCi/pot (1,465,200 dpm/pot or 366 dpm/g soil of 241Am) while the 238Pu activity was 0.75 µCi/pot of 238Pu (1,665,000 dpm/pot or 416 dpm/g soil of 238Pu) as given in Table 3.4 below. The isotopes were prepared in 0.01 N HNO3 and injected 2 cm under the plastic pellet layer and below the soil surface (ten injections spaced evenly over the surface for 100 mL/pot) in order to minimize the potential for resuspension from the pots. Only one injection was made. The irrigation flow would then drive the material into the soil profile.

3-7
Table 3.3. Source origin and activity of stock 241Am and 238Pu used in plant growth experiments.
Source Vendor
Source ID # Isotope Approx. source wt.
(mg) t ½ (yrs)
Specific Activity
(mCi / mg) PNNL AWE-
Am-241 Am-241 2.900E-01 432 3.43E+00
PNNL PNNL-003 Pu-238 5.800E-02 87.7 1.71E+01
ID # of Dilution Isotope Gamma
Verif. Date
Gamma Verification Result
(mCi / sample)
Dilution Matrix
Final Volume
(mL)
Volume Calculated Activity
(mCi / mL) R-469-Am Am-241 9-Mar-05 1.192 1M HNO3 10.00 1.19E-01
R-469-Pu Pu-238 9-Mar-05 0.930 1M HNO3 10.00 9.30E-02
Source Dose Rates: Am-241 ~1mCi source reading 8 mR/hr @ contact and <1 mR/hr @ 30cm Pu-238 ~1mCi source reading <0.5 mR/hr @ contact and <0.5 mR/hr @ 30cm Table 3.4 Chemical form, specific activity (mCi/g), and activity (µCi)/pot of soil for
241Am and 238Pu in test pots.
Attributes Americium-241 Plutonium-238 Chemical Form Americium Nitrate Plutonium Nitrate
Solvent 0.1N HNO3 0.1N HNO3 Sp. Activity 3.430 mCi/g 17.10 mCi/g
Final Activity/Pot 0.66 µCi 0.75 µCi Activity/100 mL Aliquot 0.66 µCi 0.75 µCi
Aliquot Chemical Composition 0.01N HNO3, pH=~4.0
0.01N HNO3, pH=~4.0
3.1.4 Sample Processing
When the plants were mature, water was withheld for three days to dry out the soil prior to harvest. The plants were then transferred to the hood and the soil loosened around the plant. The tissue samples (stem, leaves, fruit/seed, tubers) were removed from the plants, placed in tared glass containers (see Figs. 3.5 and 3.6), and a fresh weight taken. All samples were then placed in an 80°C forced air oven for 24- to 48-h to dry. The containers were allowed to cool in a dessicator and a dry weight taken. The dried samples were then ground with a Wiley Mill (Sargent Welch, Inc. Philadelphia, Pennsylvania) to a 20 mesh size. The samples were then stored at room temperature.

3-8
Figure 3.5. Harvested Alfalfa (A) and Onion (B) prior to drying.
Figure 3.6. Harvested potato showing root, tubers, leaves, and stem samples.
3.1.4.1 Technetium-99 Analytical Procedures For isotope analysis, three samples of each tissue (0.1-, 0.25-,or 0.5 g depending on availability) were transferred to pre-weighed and labeled 15-mL scintillation vials. The vials were marked with sample name and date. The tissues were then wet digested according to the method of Cataldo et al. (1983). Briefly, the dried tissues were wetted with 10 mL of 3 N NH4OH, covered and digested for 12- to 20-h on low heat (~60°C) in
B
A

3-9
the hood. They were then brought to dryness in a forced air oven at 110°C. The vials were then placed in a muffle furnace at 200°C for 2-h, then at 450°C for 20-h. The ashed samples were then cooled, wetted with 1-mL of 0.1 N NH4OH, evaporated to dryness, and again placed in the muffle furnace at 450°C for 20-h. The samples were then cooled and suspended in 10-mL of 0.01 N NH4OH and allowed to settle overnight. A 0.5 ml aliquot was then taken for liquid scintillation analysis (dpm) using a Beckman 6500 Liquid Scintillation Spectrometer (Beckman-Coulter Instruments, Fullerton, California) with previously constructed quench curves. Soil samples (3 from each pot – composited and sub-sampled 3x for each pot) taken at the finish of the experiment were processed in a similar fashion.
3.1.4.2 Americium-241 and Plutonium-238 Analytical Procedures For isotope analysis of both radionuclides, three samples of 1.0 g from each of the ground tissues were transferred to plastic sample vials. The vials were marked with sample name and date. They were counted with appropriate standards in a 1480 Wallac Wizard Gamma Counter (Perkin-Elmer Instruments, Waltham, Massachusetts) at defined windows for each isotope. Data were expressed as counts per minute (cpm) minus background determined from control tissue counted at the same time. Counting uncertainties were determined. 3.2 Experimental Results 3.2.1 Soils Significant plant growth inhibition was observed in plants seeded into the Savannah River Soil which was collected within a stand of White Pines on the site. This prompted us to test the soil using a germination/seedling growth test modified from the standard USEPA toxicity tests (USEPA 1996). The results indicated that there was no difference in the percent germination for radish seeds exposed to increasing amounts of soil-water extract (see Fig. 3.7). The average germination percentage after 96-h was 93±2.9% between all concentrations tested. This shows that no soil-leachate contaminant had penetrated into and damaged the seed during this time. This was not unexpected, since the germination process is very hardy and is stopped only by extremely toxic substances. The critical factor was found in seedling growth. Here the plant was in a situation of actively assimilating water from its surroundings along with whatever water-soluble material might have been in the water. As is evident in Fig. 3.8, there is obviously a concentration of the soil extract between 2 and 5 mL that was sufficient to inhibit growth by almost 50% after 1-week exposure. While we did not carry this out further it can be assumed that this is also the level at which we would begin to observe seedling death. Therefore, an allelopathic effect was occurring since the soil came from the middle of a pine grove where there were elevated levels of pine toxins (Kil and Yim 1983). It was also evident that this material is water soluble, and toxic to all of the plant species tested. Given this evidence, we decided to eliminate the Savannah River Pine Forest Soil from the study and substitute another site’s soil near to the SRS with similar characteristics.

3-10
Figure 3.7. Photograph of petri dishes containing germinating radish seedlings after 4-
days imbibition
0
1
2
3
4
5
6
7
8Average Seven Day Seedling Length ± S.D. (N=500)
0 1 2 5 10 20
Seed
ling
Leng
th (c
m)
mL of SR Soil Extract Figure 3.8. Seedling length (root tip to shoot tip) in cm for radish seedlings exposed to
increasing amounts of Savannah River (SR) Soil water extracts. The new South Carolina soil, the Savannah River Field (SRF) soil, was collected from an active test field at the Clemson University Research Station at Blackville, South Carolina This site, approximately 10 miles north-east of Barnwell, SC, has similar characteristics to the soil at Barnwell Waste Facility and the SRS. The field at Blackwell had been sown with soybeans and corn over the last 10 years and was being prepared for another soybean planting prior to sampling.

3-11
3.2.2 Technetium
3.2.2.1 Plant Growth in Differing Soil Types All plants were maintained under the same conditions and held to the same percent moisture. There were no significant differences but varying means in the dry matter accumulation (final dry weight) of the same plant species in the Hanford, Nevada, and Savannah River Field (SRF) soils either with or without the presence of 99Tc. Therefore the lower concentration of 99Tc used obviated any potential for toxicity from the metal. This is shown in Table 3.5 of the harvested plant dry weight. In this and subsequent tables, “shoot” includes leaves, stems, and flowers if present, but excludes roots. The variation in means is particularly evident for the alfalfa and corn plants. Both species are high nitrogen requiring plants and although nutrient solution was added to both soils at the same rates this somehow may not have been available to the Nevada plants. In the case of the alfalfa, a legume which may fix its own nitrogen, nodules were not found on the roots in either soil type. The Hanford soils are deficient in molybdenum (Marschner 1995), an essential element for nodule formation. The molybdenum content of the Nevada soil is not known at this time. There were no significant differences evident between the onions (Fig. 3.9) and potatoes (Fig. 3.10) in either the Nevada and Hanford soil types. The root structures of these plants are storage organs and are morphologically and functionally different from either the alfalfa or corn. There was also no toxicological effect on dry matter accumulation for either the onions or alfalfa from 99Tc-amendment as evident in the control dry weights. Table 3.5. Average plant dry weight (g) ± S.D. (N=5) for alfalfa, onions, corn, and
potatoes grown to maturity in the different soil types employed in the study. Soil
Type Alfalfa Shoot1
Onion Plant2
Corn Shoot3
Potato Plant4
Potato Tuber
Potato Shoot
Hanford –
99Tc-Amended
32.96 ± 0.92
25.15 ± 7.53
12.06 ± 5.75
28.27 ± 9.20
19.41±5.11
8.07±4.05 Hanford –
Control
34.33 ± 12.72
24.44 ± 1.44
DNA5
DNA
DNA
DNA Nevada –
99Tc-Amended
4.93 ± 0.75
17.00 ± 3.19
5.48 ± 0.85
20.64 ± 6.8
13.56±3.24
5.64±3.06 Savannah River – Pine Forest - 99Tc-Amended
0.75±0.19
1.43±0.19
DNA
DNA
DNA
DNA
Savannah River Agricultural Test Field -
99Tc-Amended
3.10±0.65
0.19±0.27
11.54±1.94
9.60±1.21
7.96±1.05
1.56±0.35
1. Shoot includes leaves, stems and flowers if present. 2. Plant includes leaves and onion bulbs if present. 3. Shoot includes leaves, stem, cobs with seed, tassels. 4. Plant includes leaves and stems, and potato tuber (flesh and peel). 5. Data not available.

3-12
In general, with the exception of the corn, the shoot portions of the plants were reduced in mass in the Savanna River Field Soil plants compared to the harvested shoots from the other soils. In the Hanford and Nevada soils, the alfalfa and potato, although mature, were still green when harvested. In the case of the SRF soil, the final dry weight was generally less than either of the other two soils tested for all four plant species. These plants, as mentioned in the Materials and Methods section, had desiccated slower and over a longer period than those growing in the other two soils. As such, when harvested all of the leaves had browned and, for the alfalfa, some had abscised and fallen onto the soil, and were not collected for fear of soil contamination affecting the results. As a means of further comparison between the differing soil types, we have combined portions of the data into total above-ground shoot activity and have included this in the subsequent tables.
Figure 3.9. Hanford soil grown Control (A) and 99Tc amended (B) onion plants.
Figure 3.10. Hanford (A) and Nevada (B) soil-grown potatoes. Both were amended with 99Tc.
BA
BA

3-13
3.2.2.2 Plant Uptake, Distribution, Specific Activity, and Concentration Ratios
for 99Tc
Marked differences between plant species as well as soil types were evident in the amount of applied label taken up by the plant and transported into the shoots. As seen in Table 3.6, onions growing in the Hanford soil demonstrated higher, although not significant activity, accumulated by the shoot when compared to the Nevada soil. The onions planted in the Savanna River soil showed little growth both for the pine forest and the field types (Table 3.5) and therefore had a much lower uptake percentage from the pot (Table 3.6). Table 3.6. Percentage of soil applied 99Tc present in the plant shoots, potato tubers, and
onion bulbs. Data are averages ± S.D. (N=5).
Soil Type Avg. Percentage of Shoot Recovery From Pot1
(Shoot pCi /Soil pCi)
Onion Alfalfa Corn Potato
Hanford 35.75±12.8 30.54±8.26 1.91±0.20 1.70±0.16
Nevada 21.21±5.98 10.13±3.06 2.17±0.48 1.95±0,86
Savannah River Pine Forest
4.00±0.41 6.68±2.30 -2 -2
Savannah River Agricultural
Field3 - 47.93±10.50 53.70±10.87 61.81±4.35
1. Includes all above ground foliage. 2. Experiment not performed because of soil allelopathy. 3. Clemson University research field, grown in corn and soybeans for last 20 years.
The specific activity (pCi 99Tc/g dry weight) for the entire above-ground portion (shoot) of alfalfa, corn, and potatoes, was significantly higher in those plants grown in the SRF soil compared to the Hanford and Nevada soils as shown in Table 3.7. The SRF alfalfa shoot tissue contained six times the activity found in the Nevada plants and fourteen times that found in the Hanford soil plants. This disparity continued in the corn where the activity of the SRF soil plant shoots was almost nine times that of the Nevada plants and about twenty-seven times more concentrated than the Hanford plants. Perhaps more significantly, in the SRF corn plants there was a marked increase in the partitioning of label to the stem and ears (cob and silk) as compared to the other soil type-grown corn (Table 3.8). The trend of transfer to the shoot was greatest in the case of the potatoes. Here the activity of the potato shoot grown in the SRF soil was twelve times that of the Nevada plants and sixteen times that of the Hanford grown plants.

3-14
Table 3.7. Mature tissue specific activity of crop plants (N=5) grown in either 1.0 µCi 99Tc-ammended Hanford, Nevada, Savannah River Pine Forest, or Savannah River Field soil.
Plant
Segment
Hanford Soil Avg. Specific
Activity (pCi/g Dry Wt.) ± S.D.
Nevada Soil Avg. Specific
Activity (pCi/g Dry Wt.) ± S.D.
Savannah River Pine Forest Soil Avg. Specific
Activity (pCi/g Dry Wt.) ± S.D
Savannah River Field Soil
Avg. Specific Activity (pCi/g Dry
Wt.) ± S.D Onion Leaves 48215
±24989 46673
±15793 30875 ±30784
68336 ±21847
Bulb1 147 ±60
315 ±139
5827 ±8844
-
Flower2 60 1340
- -
Alfalfa Leaves 20612
±3439 37138 ±3459
101075 ±401304
-
Stem 1400 ±310
6289 ±2553
47543 ±123164
-
Flowers 1922 ±427
4630 ±1465
- -
Total Shoot 10609 ±3446
24288 ±6228
76266 ±27576
1558845
±34202
Corn Leaves 59214 ±27410
110967 ±12893
- 95650 ±3150
Stem 1104 ±376
2799 ±524
- 12826 ±4123
Ear 0 0 - 13925 ±5494
Tassels - - - 22871 ±5175
Total Shoot 1844 ±280
5737 ±3961
- 49201 ±17965
Potato Leaves 68114
±35751 75453 ±2318
- -
Stem 7536 ±4819
4626 ±1253
- -
Root3 3926 ±1707
378 ±129
- -
Potato tuber 69 ±33
12 ±17
- 1573 ±292
Potato Tuber Skin
549 ±301
697 ±600
- 8694 ±3671
Total Shoot 2667 ±615
2956 ±184
- 258088 ±220666
1. Bulb peeled of outer layer prior to processing. 2. Only a single plant flowered during growth period 3. May contain some adhering soil 4. Plants were severely stunted and stressed – no flower or bulb development 5. Stems, leaves, and any flowers data combined to give above-ground shoot.
The only possible treatment difference between the soil types was the soil drying that the SRF plants underwent at the end of the experiment. The increased partitioning of the label into the storage organs/future seed (corn stem and ears, potato tuber) seen in Table

3-15
3.8 may be a response to the slower drying cycle where the plant would attempt to move material such as carbohydrate and protein (possibly S-, or now Tc-containing protein) into the next generation tissue (Fait et al. 2006). The reasons for this may be more evident following experiments with the other isotopes which are not nutritional analogs. Critical to any estimation of risk is the potential for transfer of the contaminant from one trophic level to the next. For transfer from plants one would usually consider the next level to be a herbivore. This can further depend on the amount of the contaminant contained in those organs or tissues actually consumed by the herbivore. These vary between plant species, for the onion it may be the bulb, for alfalfa, the shoot, for corn both the grain and the shoot, and for the potato, since the above ground shoot is poisonous, the tubers growing off of the roots. Table 3.8. Percent distribution of total 99Tc recovered in the plant species grown in
either Hanford, Nevada, or Savannah River Pine Forest soil.
Plant
Segment
Hanford Soil Avg. Percent Total Label Recovered±
S.D.
Nevada Soil Avg. Percent Total Label Recovered±
S.D.
Savannah River Pine Forest Soil
Avg. Percent Total Label Recovered±
S.D
Savannah River Field Soil. Avg.
Percent Total Label
Recovered± S.D
Onion Leaves 99.38 ± 0.35 98.62 ± 0.49 98.05±1.09 91.3±10.8 Bulb1 0.61 ± 0.371 1.29 ± 0.431 1.95±1.09 8.7±10.3 Flower2 0.07 - -
Alfalfa Leaves 91.31 ± 5.12 85.01± 2.73 84.70±6.4 1004 Stem 6.47 ± 4.00 15.78 ± 2.93 15.30±6.7 Flowers 2.23 ± 1.45 0.272 -
Corn Leaves 98.90 ± 0.12 98.98 ± 0.37 88.3±2.0 Stem 1.10 ± 0.12 1.02 ± 0.37 4.5±2.1 Ear 0 0 7.8±3.2
Potato Leaves 94.58±1.4 96.99±0.57 95.4±1.55
Stem 3.64±1.5 1.76±0.19 Root3 0.76±0.8 0.62±0.33 - Potato
tuber 0.26±0.1 0.04±0.06 2.3±1.7
Potato Tuber Skin
0.76±0.2 0.62±0.66 2.3±1.0
1. Bulb peeled of outer layer prior to processing. 2. Only a single plant flowered during growth period. 3. May contain some adhering soil. 4. Leaves and stems were combined for analysis = 100%. 5. Leaves and stems were combined for analysis.

3-16
In Table 3.8, it is evident that the distribution patterns between the roots and shoots are similar for each species no matter which soil it was grown in. Again the SRF soil differed slightly in the amount of 99Tc actually partitioned into the ear of the corn where as much as eight percent of the total above ground label was found. This may again be related to the slower desiccation permitting mobilization and transport under stress to the seed. Finally, as the result of the trends shown above in Tables 3.6 and 3.7, higher activity in the SRF grown plants was evident in plant/soil concentration ratios (Tables 3.9 and 3.10). Table 3.9 provides concentration ratios (CR) values for above-ground portions of plants, such as might be consumed by grazing animals. Table 3.10 provides CRs that would apply to human foodstuffs. The SRF alfalfa and potato had significantly higher CR than the other species as well as the other soil types. The Hanford alfalfa and potato were also significantly lower than the others even though the total percent of 99Tc extracted from the pot was higher (Table 3.6). This may therefore be a factor of the higher yield of the alfalfa growing in the Hanford soil (Table 3.5) which in turn may have produced the lower specific activity (Table 3.7). It is evident that there are significantly differing CR’s between species and also between soil type. Further, that the manner in which the plants are grown or harvested will also have an effect on the CR observed. Table 3.9. Technetium-99 concentration ratios (shoot pCi 99Tc/g dry wt./soil pCi 99Tc/g
dry wt.) for the above-ground foliage for the four plant species and the four soil types tested. Data are averages ± S.D. (N=5).
Soil
Type Avg. 99Tc Shoot Concentration Ratio1
(Shoot pCi/gdw /Soil pCi/gdw)
Onion Alfalfa Corn Potato
Hanford 231±78 52±17 264±117 172±4
Nevada 105±36 113±11 397±82 271±40
Savannah River Pine Forest
154±15 581±145 -2 -2
Savannah River Agricultural Field
339±108 776±111 244±89 1977±475
1. Includes all above ground foliage. 2. Experiment not performed because of soil allelopathy.
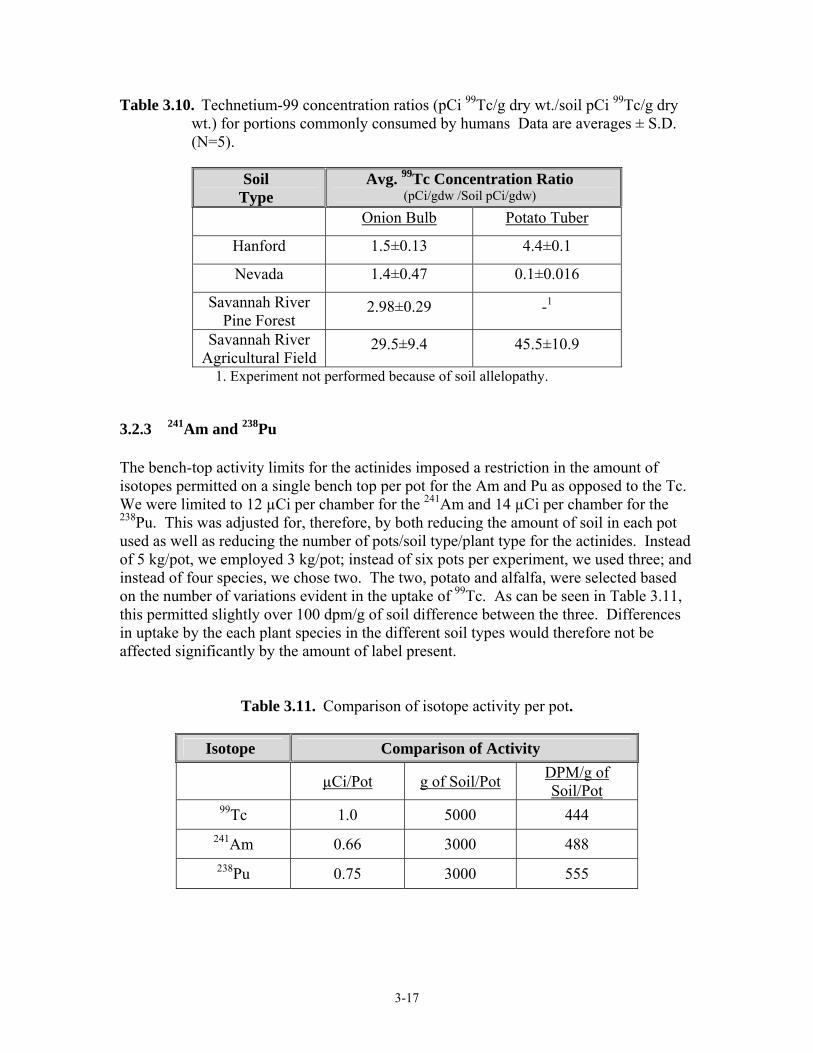
3-17
Table 3.10. Technetium-99 concentration ratios (pCi 99Tc/g dry wt./soil pCi 99Tc/g dry wt.) for portions commonly consumed by humans Data are averages ± S.D. (N=5).
Soil
Type Avg. 99Tc Concentration Ratio
(pCi/gdw /Soil pCi/gdw)
Onion Bulb Potato Tuber
Hanford 1.5±0.13 4.4±0.1
Nevada 1.4±0.47 0.1±0.016
Savannah River Pine Forest
2.98±0.29 -1
Savannah River Agricultural Field
29.5±9.4 45.5±10.9
1. Experiment not performed because of soil allelopathy. 3.2.3 241Am and 238Pu The bench-top activity limits for the actinides imposed a restriction in the amount of isotopes permitted on a single bench top per pot for the Am and Pu as opposed to the Tc. We were limited to 12 µCi per chamber for the 241Am and 14 µCi per chamber for the 238Pu. This was adjusted for, therefore, by both reducing the amount of soil in each pot used as well as reducing the number of pots/soil type/plant type for the actinides. Instead of 5 kg/pot, we employed 3 kg/pot; instead of six pots per experiment, we used three; and instead of four species, we chose two. The two, potato and alfalfa, were selected based on the number of variations evident in the uptake of 99Tc. As can be seen in Table 3.11, this permitted slightly over 100 dpm/g of soil difference between the three. Differences in uptake by the each plant species in the different soil types would therefore not be affected significantly by the amount of label present.
Table 3.11. Comparison of isotope activity per pot.
Isotope Comparison of Activity
µCi/Pot g of Soil/Pot DPM/g of Soil/Pot
99Tc 1.0 5000 444 241Am 0.66 3000 488 238Pu 0.75 3000 555

3-18
3.2.3.1 Plant Growth with Amended Actinides One month after successful germination, the plants developed signs of mineral nutrition stress (stunted growth, chlorosis, Fig. 3.11) and so a fertilizer was added. It was important to match the fertilizer to those normally given to these crops in the field to optimize the nutritional balance of the soil type and not interfere with the potential natural exchange of the actinide ions with the soil solution. The fertilizer chosen was general-purpose industry standard, 20-20-20 (N-P-K), manufactured by the J.R. Peters Company of Allentown, PA. It was applied every two weeks at a rate of 0.45 kg/hectare. The improvement of the plants was immediate and dramatic as is evident in Fig. 3.12. Following harvest, the dry weights of the plants were compared to those grown in the 99Tc amended soil (Table 3.7). There were significant variations between the plants (Table 3.12). In the plants grown in Hanford soil, there was a significant decline in weight of both the potatoes and the alfalfa in the actinide plants. Further, there was a greater dry matter accumulation in the SRF potatoes. These observations were probably a factor of the slow start from the nutrient stress and so are not considered significant. It is also important to note that there are no significant dry weight differences between the two actinides with the exception of the Nevada alfalfa.
Figure 3.11. Photograph of 3-week-old potato plants growing in Hanford soil and
amended with 241Am. Stunted growth indicates mineral stress.

3-19
Figure 3.12. Photograph of 10-week-old plants following application of fertilizer. Table 3.12. Average dry weights of above ground alfalfa shoot and potato plant (shoot
and tubers). Data are expressed in grams. (Avg. ± S.D., N=3)
Soil Type
Avg. Plant Dry Weight ± S.D. (g; N=3)
241Am - Potato 238Pu - Potato 241Am - Alfalfa
Shoot2 238Pu - Alfalfa
Shoot Hanford 18.1±1.1 24.9±5.9 8.1±1.8 10.3±1.5 Nevada 13.8±11.4 16.7±6.9 4.7±0.8 8.5±0.3
Savannah River
Agricultural Field
28.0±13.6 23.2±3.6 8.0±1.6 7.9±1.9

3-20
3.2.3.2 Plant Uptake, Distribution, Specific Activity, and Concentration Ratios for 241Am and 238Pu
Based upon information in the literature (Popplewell et al. 1984), it was fully anticipated that the amount of 241Am or 238Pu the plants would accumulate would be much less than that seen for the 99Tc. The actual percentages of the radionuclides present in the pot accumulated by the plants were low and varied between species as well as between soil types (Table 3.13). The potatoes assimilated greater amounts of both radionuclides than alfalfa in all three soil types under these conditions. Between the soil types, the plants grown in the Nevada soil appeared to have the lowest uptake. Finally, also anticipated (Brown 2002), between the isotopes, the 241Am demonstrated higher uptake in all soil types and in both plant species. Table 3.13. Percentage of total label applied to the soil contained in above ground alfalfa
(shoots) and potato (shoots and tubers). Data are averages ± S.D., N=3.
Soil Type
Avg. Percent Plant Uptake of Label From Pot ± S.D. (% Total Amended Label; N=3)
241Am - Potato 238Pu - Potato 241Am - Alfalfa
Shoot2 238Pu - Alfalfa
Shoot Hanford 0.297±0.164 0.047±0.037 0.015±0.011 0.008±0.003 Nevada 0.108±0.036 0.022±0.005 0.013±0.012 0.002±0.001
Savannah River
Agricultural Field
0.424±0.304 0.042±0.013 0.033±0.021 0.011±0.014
The specific activity (cpm/g dry wt.) did not significantly differ for each of the plants for all three soil types (Table 3.14) and seemed to be a species related issue not dependent on the type of soil the plant was growing in. The activity, however, did vary between isotopes and between plant species. The 241Am demonstrated higher activity per g of tissue than the 238Pu in both the potatoes and the alfalfa. The potatoes, however, had a higher specific activity than the alfalfa for both isotopes, although it was not statistically significant for the 238Pu plants because of the low activity present in the tissue, and the variability between the plants themselves. The potato tuber, itself a food directly consumed by humans, showed differences between the skin and the flesh of the tuber (Table 3.15). In the 241Am grown plants, the skin always had the higher of the two tissues, particularly in the Hanford and SRF soils. We made a concerted effort to wash all of the soil off of the tuber but some may have remained giving the Nevada soils a higher variance. The low activity in the tuber itself suggests that the isotope demonstrated little or no transport into the tuber from the roots during this study. For the 238Pu, the activity was so low it was again statistically impossible to differentiate which was higher in all of the soil types tested and so the label appears to be evenly divided between the skin and the tuber flesh.

3-21
Table 3.14. Average specific activity (cpm/g dry wt. of plant) contained in above ground alfalfa shoots and potato plants (shoot and tubers). Data are averages ± S.D., N=3.
Soil Type
Avg. Specific Activity ± S.D. (cpm/g Dry Wt. Plant) ± S.D. N=3)
241Am - Potato 239Pu - Potato 241Am - Alfalfa
Shoot2 239Pu - Alfalfa
Shoot Hanford 236.0±122.8 28.7±18.1 26.0±13.0 7.7±7.1 Nevada 281.7±329.4 23.0±6.9 43.7±44.4 2.7±3.1
Savannah River
Agricultural Field
214.3±117.5 29.7±7.2 39.3±36.2 18.7±22.9
The concentration ratios (CRs) of both actinides (Tables 3.16 and 3.17) were significantly lower than that seen for the 99Tc (Tables 3.9 and 3.10). This was anticipated based on previous studies (Popplewell et al. 1984). The CRs for all of the plants grown in 241Am amended soil (Table 3.16) were an order of magnitude higher than those grown in the 239Pu soil for both plant species (Table 3.17). Table 3.16 provides CR values for above-ground portions of plants, such as might be consumed by grazing animals. Table 3.17 provides CRs that would apply to human foodstuffs. For the 241Am plants, there were again no significant differences between the different soils, however, the potato CRs were an order of magnitude higher than those of the alfalfa. For the 238Pu-grown plants, the difference between the CRs of the two species was smaller (Table 3.17) but the means of the potatoes were still greater. Again, there were no apparent CR differences between the three soil types. Table 3.15. Average percent of total label distribution found in below-ground potato
tubers. Data are averages ± S.D., N=3.
Soil Type
Avg. Percent Label Distribution in Potato ± S.D. (% Total Recovered Label; N=3)
241Am - Potato 238Pu - Potato 241Am – Potato
Skin 238Pu – Potato
Skin Hanford 8.3±13.3 50.0±50.0 91.8±13.3 50.0±50.0 Nevada 26.74±34.38 42.3±59.8 73.26±34.38 57.7±59.8
Savannah River
Agricultural Field
20.8±9.1 33.3±57.7 79.2±9.1 66.7±57.7

3-22
Table 3.16. Americium-241 concentration ratios [(shoot pCi 241Am/g dry wt.)/(soil pCi
241Am/g dry wt.)] for the above-ground foliage for two plant species and the three soil types tested. Data are averages ± S.D. (N=3).
Soil
Type Avg. 241Am Concentration Ratio
(Shoot pCi/gdw /Soil pCi/gdw)
Potato Shoot1 Potato Tuber Alfalfa Shoot Hanford 0.262 ± 0.138 0.016 ± 0.024 0.0533 ± 0.0266 Nevada 0.456 ± 0.574 0.055 ± 0.087 0.072 ± 0.051
Savannah River Agricultural
Field 0.269 ± 0.191 0.032 ± 0.004 0.081 ± 0.074
1. Includes all above ground foliage. Table 3.17. Plutonium-238 concentration ratios [(shoot pCi 238Pu/g dry wt.)/(soil pCi
239Pu/g dry wt.)] for the above-ground foliage for two plant species and the three soil types tested. Data are averages ± S.D. (N=3).
Soil
Type Avg. 238Pu Concentration Ratio
(Shoot pCi/gdw /Soil pCi/gdw)
Potato Shoot1 Potato Tuber Alfalfa Shoot Hanford 0.045 ± 0.031 0.005 ± 0.005 0.014 ± 0.013 Nevada 0.031 ± 0.023 0.007 ± 0.004 0.005 ± 0.006
Savannah River Agricultural
Field 0.034 ± 0.013 0.006 ± 0.010 0.034 ± 0.041
1 Includes all above ground foliage. 3.3 References for Section 3 Bennett R, and N Willey. 2003. “Soil Availability, Plant Uptake and Soil To Plant Transfer of 99Tc – A Review.” J. Environ. Radioactvity. 65:215-231. Brown K. 2002. Plutonium-239 and Americium-241 Uptake by Plants From Soil. US Environmental Protection Agency, Washington DC. EPA/600/3-79/026 (NTIS PB298241).

3-23
Bunzi K, W Kracke, and W Schimmack. 1992. “Vertical Migration of Plutonium-239+240, Americium-241 and Caesium-137 Fallout in a Forest Under Spruce.” Analyst. 117:469-474. Cataldo, DA, RE Wildung, and TR Garland. 1983. "Root Absorption and Transport Behavior of Technetium in Plants." Plant Physiol. 73:849-852. Cataldo DA, TR Garland, RE Wildung, and RJ Fellows. 1989. “Comparrative Metabolic Behavior and Interrelationships of Tc and S in Soybean Plants. Health Physics. 57(2):281-287. Copplestone D, MS Johnson, and SR Jones. 1991. “Behavior and Transport of Radionuclides in Soil and Vegetation of a Sand Dune Ecosystem.” J. Environ. Radioactivity. 55(1): 93-108. Echevarria G, PC Vong, and JL Morel. 1998. “Effect of NO3 on the Fate of (TcO4-)-Tc-99 System in the Soil-Plant System. J. Environ. Radioactivity. 38(2):163-171. Fait A, R Angelovici, H Less, I Ohad, E Urbanczyk-Wochniak, AR Fernie, and G Galele. 2006 “Arabidopsis Seed Development and Germination Is Associated With Temporally Distinct Metabolic Switches.” Plant Physiol. 142(3):839-854. Fellows RJ, Z Wang, and CC Ainsworth. 2003. “Europium Uptake and Partitioning in Oat (Avena sativa) Roots as studied By Laser-Induced Fluorescence Spectroscopy and Confocal Microscopy Profiling Technique.” Environ. Sci. and Technol. 37: 5247-5253. Fuhrmann M and A Lanzirotti. 2005. “241Am, 137Cs, Sr, and Pb Uptake by Tobacco as Influenced by Application of Fe Chelators to Soil.” J. Environ. Radioactivity. 82:33-50. Garland TR, DA Cataldo, and RW Wildung. 1981. “Absorption, Transport, and Chemical Fate of Pu in Soybean Plants.” Agric. Food Chem. 29:915-920. Garland TR, DA Cataldo. KM McFadden, RG Schreckhise, and RE Wildung. 1983. "Comparative Behavior of 99Tc, 129I, 127I and 137Cs in the Environment Adjacent to a Fuels Reprocessing Facility." Health Physics. 44:658-662. Garland TR, DA Cataldo, KM McFadden, and RE Wildung. 1987. “Factors Affecting Absorption, Transport, and Form of Plutonium in Plants.” p. 83-95. In eds. Pinder, JE, JJ Alberts, KW McLeod, and RG. Schreckhise, Environmental Research on Actinide Elements. USDOE CONF-841142, NTIS DE86008713, Springfield, Virginia. Gee GW, D Rai, and RJ Serne. 1983. “Mobility of Radionuclides in Soil.” In Chemical Mobility and Reactivity in Soil Systems, ed. DW Nelson. p. 203-227. Agronomy Society of America, Soil Science Society of America, Madison, Wisconsin.

3-24
Goins GD, NC Yorio, and RM Wheeler. 2004. “Influence of Nitrogen Nutrition Management on Biomass Partitioning and Nitrogen Use Efficiency Indices in Hydroponically Grown Potato.” J. Amer. Soc. Hort. Sci. 129(1):134-140. Harms AV, GC Krijger, JT van Elteren, and JJM de Goeij. 1999. “Characterization of Technetium Species Induced in Spinach.” J. Environ. Qual. 28:1188-1194. Hoffman FO, CT Garten, DW Lucas, and JW Huckabee. 1982. “Environmental Behavior of Tc in Soil and Vegetation: Implications for Radiological Assessment.” Enviorn. Sci. Technol. 16:214-217. Kil BS, and YJ Yim. 1983. “Allelopathic effects of Pinus densiflora on undergrowth of red pine forest.” J. of Chem. Ecol. 9:1135-1151. Klikocka H, S Haneklaus, E Bloem, and E Schnug. 2005. “Influence of Sulfur Fertilization on Infection of Potato Tubers With Rhizoctonia solani and Streptomyces scabies.” J. Plant Nutrition. 28(5):819-833. Klikocka H, S Haneklaus, E Bloem, and E Schnug. 2005. “Influence of Sulfur Fertilization on Infection of Potato Tubers With Rhizoctonia solani and Streptomyces scabies.” J. Plant Nutrition. 28(5):819-833. Krijger GC, AV Harms, R Leen, TG Verburg, and B Wolterbeek. 1999. “Chemical Forms of Technetium in Tomato Plants; TcO4, Tc-Cysteine, Tc-Glutathione, and Tc-Proteins.” Environ. Exptl. Bot. 42(1):69-81. Krijger GC, C Kollöffel, and HT Wolterbeek. 2000. “Effect of Nitrate on Uptake of Pertechnetate by Tomato Plants.” J. Environ. Qual. 29:866-870. Livens FR, MS Baxter, and SE Allen. 1987. “Association of Plutonium with Soil Organic Matter.” Soil Sci. 144(1):24-28. Marschner H. Mineral Nutrition in Higher Plants, New York, New York: Academic Press. 1995. Mousney JM, P Roucoux, and C. Mytennaere. 1979. “Absorption and Translocation of Technetium in Pea Plants.” Environ. Exptl. Bot. 19:263-268. Napier BA, KM Krupka, MM Valenta, and TJ Gilmore. Soil and Groundwater Sample Characterization and Agricultural Practices for Assessing Food Chain Pathways in Biosphere Models. NUREG/CR-6881, Prepared by the Pacific Northwest National Laboratory, Richland, Washington. August, 2005. Nisbet AF, B Salbu, and S Shaw. 1993. “Association of Radio nuclides with Different Molecular Size Fractions in Soil Solution: Implications for Plant Uptake.” J. Environ. Radioactivity. 18:71-84.

3-25
Popplewell DS, GJ Ham, TE Johnson, JW Strather, and SA Sumner. 1984. “The Uptake of Plutonium-238, Plutonium-239, Plutonium-240, Americium-241, Strontium-90, and Ceasium-137 Into Potatoes.” Sci. Tot. Environ. 38:173-182. Robertson DE, DA Cataldo, BA Napier, KM Krupka, and LB Sasser. Literature Review and Assessment of Plant and Animal Transfer Factors Used in Performance Assessment Modeling. NUREG/CR-6825, Prepared by the Pacific Northwest National Laboratory, Richland, Washington. August 2003. Romney EM, A Wallace, RK Schulz, J Kinnear, and RA Wood. 1981. “Plant Uptake of 239,240PPu, 241Am, and 244Cm From Soils Representing Major Food Production Areas of the United States.” Soil Sci. 132(1):40-59. Sokolik GA, SV Ovsiannikova, TG Ivanova, and SL Leinova. 2003. “Soil-Plant Transfer of Plutonium and Americium in Contaminated Regions of Belarus After the Chernobyl Catastrophe.” Environ. International.” 30:939-947. U.S. Environmental Protection Agency (EPA). 1996. Ecological Effects Test Guidelines: OPPTS 850.4200, Seed Germination/Root Elongation Toxicity Test. EPA 712-C-96-154. U.S. Environmental Protection Agency, Washington, D.C. Vyas BN and KB Mistry. 1978. “Studies on the Uptake of Plutonium from Major Indian Soils and Its Distribution in Plants.” J. Environ. Qual. 7(4):533-536. Vyas BN and KB Mistry. 1981a. “Influence of Clay Mineral Type and Organic Matter Content on the Uptake of 239Pu and 241Am by Plants.” Plant and Soil. 59(1):75-82 Vyas BN and KB Mistry. 1981b. “Uptake of Am-241 From Major Indian Soils and Its Distribution in Plants.” Environ. Exptl. Bot. 21(1):75-81. Vyas BN and KB Mistry. 1983. “Comparative Uptake and Translocation of Plutonium and Americium in 6 Plant Species.” J. Nuclear Agricul. Biol. 12(4):89-92.

4-1
4.0 Discussion Because the uptake and behavior of radionuclides in plant roots, plant leaves, and animal products depends on the chemistry of the water and soil coming in contact with plants and animals, water and soil samples collected from these regions of the United States were used in experiments at Pacific Northwest National Laboratory to determine radionuclide soil-to-plant concentration ratios. Crops and forage used in the experiments were grown in the soils, and long-lived radionuclides introduced into the groundwater provide the contaminated water used to water the grown plants. Radionuclides under consideration included 99Tc, 238Pu, and 241Am. Plant types include alfalfa, corn, onion, and potato. The radionuclide uptake results from this research study are expected to show how regional variations in water quality and soil chemistry affect radionuclide uptake.
Some summary observations are provided for the soil and groundwater analyses and the plant uptake studies. The results are compared with concentration ratio values currently common in the radiological assessment literature. 4.1 Soils and Groundwater Analyses Physical and chemical characteristics are presented for four samples of soil and three associated groundwaters (the two South Carolina soils significantly differ only in allelopathy, and the one South Carolina groundwater sample is assumed to be applicable to either sampling location). These soil/groundwater combinations were used in radionuclide uptake studies within the U.S. Nuclear Regulatory Commission’s project Assessment of Food Chain Pathway Parameters in Biosphere Models. The differences in composition of the soils and waters from the three locations were expected to result in measurable differences in soil-to-plant transfer of the investigated radionuclides. The groundwater samples showed some differences. The groundwater from Nevada was the most alkaline. The waters from both western sites, Nevada and Washington, had more carbonates than the eastern sample. The Nevada groundwater sample had somewhat lower nitrate concentrations than might be expected from the literature, but the sample location is at the edge of an agricultural area.
Differences are apparent in the soils from the three geographic locations. The major difference is prevalence of silica (quartz) sand in both of the South Carolina samples. Soils from this region were originally anticipated to be rich in organic materials, but both were lower in organic carbon and most other minerals than either of the western soil samples. All sites were low in organic carbon. The Hanford location soil has the highest concentrations of silt and clay, possibly because of the history of glacial flooding in the Hanford region. The Nevada soil was lowest in clay, although the South Carolina samples were only slightly higher. Differences were also noted in the soil pore water concentrations of dissolved minerals; these differences may be the most predictive in determining plant uptake.

4-2
Agricultural practices in the three locations also differ. Agriculture in the two Western locations is dependent upon irrigation, although the sources of irrigation water in Nevada are essentially entirely derived from groundwater while the sources of irrigation water in Southeastern Washington State are primarily derived from surface water, with groundwater only used in areas where surface water canals are not economically available. Irrigation is used to a much lesser extent in South Carolina, and only for supplementing rainfall for brief periods. The types of crops, their growing periods, and overall yields also differ among the three locations.
4.2 Soil-to-Plant Concentration Ratios for the Soils and Crops Studied The various plants grew in generally the same manner in all three soil types, representative of regional variations in soils. There were no significant differences evident between the onions and potatoes in either the Nevada or Hanford soil types. The root structures of these plants are storage organs and are morphologically and functionally different from either the alfalfa or corn. In general, with the exception of the corn, the shoot portions of the plants were reduced in mass in the Savanna River Field Soil plants compared to the harvested shoots from the other soils. In the Hanford and Nevada soils, the alfalfa and potato, although mature, were still green when harvested. In the case of the SRF soil, the final dry weight was generally less than either of the other two soils tested for all four plant species. These plants, as mentioned in the Materials and Methods section, had desiccated slower and over a longer period than those growing in the other two soils. As such, when harvested all of the leaves had browned and, for the alfalfa, some had abscised and fallen onto the soil, and were not collected for fear of soil contamination affecting the results. Marked differences between plant species as well as soil types were evident in the amount of applied 99Tc taken up by the plants. The soil types are indicative of regional variations in CR. The distribution patterns between the roots and shoots are similar for each species no matter which soil it was grown in. Higher activity in the Savannah River field-grown plants was evident in plant/soil concentration ratios. The SRF alfalfa and potato had significantly higher concentration ratios than the other species as well as the other soil types. The Hanford alfalfa and potato were also significantly lower than the others even though the total percent of 99Tc extracted from the pot was higher. It is evident that there are significantly differing CR’s between species and also between soil type. Further, that the manner in which the plants are grown or harvested will also have an effect on the 99Tc CR observed. The fractions of the actinides accumulated by the plants were low and varied between species as well as between soil types. The soil types are indicative of regional variations in CR. The potatoes assimilated greater amounts of both radionuclides than alfalfa in all three soil types under these conditions. Between the soil types, the plants grown in the Nevada soil appeared to have the lowest uptake. The 241Am demonstrated higher uptake in all soil types and in both plant species. The CRs for all of the plants grown in 241Am amended soil were an order of magnitude higher than those grown in the 239Pu soil for both plant species. For the 241Am plants, there were no significant differences between

4-3
the different soils, however, the potato CRs were an order of magnitude higher than those of the alfalfa. For the 238Pu-grown plants, the difference between the CRs of the two species was smaller but the means of the potatoes were still greater. There were no apparent CR differences between the three soil types for Pu. 4.3 Uncertainties in the Results The soil-to-plant uptake experiments were conducted with three soil types (four, if the two Savannah River soils are considered), up to four plant types, and three radionuclides. In order to have a reasonably reliable estimate of the mean and variance of each of these combinations, we attempted to have at least five replicate plants in each group. Within each soil/plant/radionuclide combination, the plant-to-plant variability, as represented by the ratio of the standard deviation of the measurements to the mean, ranged up to about 50% for the 99Tc and up to about 100% for the 238Pu and 241Am. Thus, for a single plant/soil/radionuclide combination, variations of over a factor of 2 are not unusual. The plants were grown under standardized conditions; in actual field conditions, where the soil characteristics, sunlight, temperature, and moisture conditions would not be expected to remain constant, the individual measurement variability will be higher. However, when averaged over an entire field or an entire harvest, the variability may be reduced. Factors that we have observed that impact on the value of the transfer factor, besides soil characteristics and plant species, include stress on the growing plant (heat, watering), nutritional value of the soil for the plant (fertilization), maturity of the plant (influencing transport into edible portions), chemical form of the contaminant (materials deposited with irrigation from groundwater water may be more soluble than those that fall out from the atmosphere), and amount of available light (the corn did not grow well in the growth chambers because the light was less intense than natural sunlight). Concentrations of contaminants may also have an effect which is not included in the current model of linear uptake. The assumption of linearity may be appropriate for elements that are not essential to biological function, are not analogues of such elements, or are not absorbed by organisms via nutrient pathways. Linearity may not apply for contaminants that are nutrients or are chemical analogues for them. Thus, for the radionuclides evaluated here, linearity is likely for americium and plutonium, but may not apply to technetium because of its chemical similarities to sulfur. 4.4 Comparison of CR Results to Current Literature Soil-to-plant concentration ratios are used in most radioecological assessment models. A selection of concentration ratios for the types of crops and radionuclides assessed in this report are shown in Table 4.1. These are excerpted from the popular computer codes GENII (Napier et al. 2006) and RESRAD (Yu et al. 2001), from the compendium prepared by the International Union of Radioecologists published by the International Atomic Energy Agency (IAEA 1994), and from the biosphere model of Wasiolek (2004). The RESRAD (Biwer et al. 2000) values are take from NCRP (1996), using the conservative value from NCRP and adding a geometric standard deviation (GSD) of

4-4
either 2.5 or 3.0, which indicates a log-normal distribution with possible values ranging from about one-tenth to ten times the nominal value. Rather than a true distribution of the full range of uncertainty, this tends to greatly over-weight the larger values. The RESRAD values are for wet produce, and should be increased to be equivalent to the others for dry produce. It is interesting to notice that the various sources use different classifications of plant types (the Wasiolek (2004) biosphere code is derived from an earlier version of the GENII model (Napier et al. 1988) and has the same internal structure). The RESRAD code lumps all types of vegetation into one compartment. The IAEA provides summaries of multiple investigations by individual crop type; many modelers use the IAEA values as a basis, but the way in which the crops are aggregated may vary. Because of the wide range of results found in the current literature shown in Table 4.1, generic concentration ratios are of limited use in site-specific dose analyses. The work performed for this report shows that there can be regional variations in soil-to-plant uptake. Within a single regional soil type, uncertainties in the soil-to-plant concentration ratio can be significantly reduced by site-specific investigations. For technetium, the results of this study confirm that soil-to-plant concentration ratios can be very high – up to factors of several hundred, depending on the plant/soil combination. Concentration ratios of this magnitude result in the near-total transfer of radionuclide from soil into food crops in a period of only a few years for a single application, and in continuing equilibrium transfers for scenarios of continuous application. The lowest transfer to foods eaten directly by humans is into potato tubers; the CR range of 0.1 – 50 is somewhat higher than the value recommended by the IAEA in TRS-364 (IAEA 1994). The transfer to the edible bulb of onions of 1 – 30 is similar to the value selected by Wasiolek (2004) for “other vegetables”. The alfalfa CR result range of about 50 – 800 is similar to the full range reported in IAEA (1994) for grasses, and somewhat higher than used by Napier et al. (2006), Staven et al. (2003), or Wasiolek (2004) for “forages”. The result for corn, including the leaves and cobs, is higher than the common references for “grain” – however, because the vegetative portions of the corn plant are included, the actual “grain” value is probably lower. All values are essentially greater than the generic best estimate of 5 for all vegetation used in RESRAD (Biwer et al. 2000), based on the NCRP recommendations, even when the GSD of 2.5 is included. For technetium, the distribution patterns between roots, shoots, and edible portions was similar for each species no matter which soil it was grown in. This indicates that total uptake is a function of location/soil, but partitioning within the plant depends on the biology of each species. Similarly, the results of this study for plutonium confirm that soil-to-plant concentration ratios are very small. The plutonium CRs from this study range from about 0.005 to 0.05. These values are within the ranges suggested by both IAEA (1994) and Wasiolek (2004) for forage and fodder. However, the results are somewhat higher than those used in either GENII (Napier et al. 2006; Staven et al. 2003) or RESRAD (Biwer et al. 2000). These are very low values; the common environmental exposure models frequently include a contribution from soil adherence to foods (or direct soil ingestion) which overwhelms the soil-to-plant pathway (Napier 2006). Because the CRs measured in this

4-5
study are relatively independent of the soil type, it seems that biological discrimination (or at least, lack of active transport) is sufficient to make this part of the ingestion pathway relatively small. The literature values for soil-to-plant uptake of americium tend to be about one order-of-magnitude greater than those for plutonium. Again, the americium demonstrated greater CR values than the plutonium in all three soil types and two plant species in this study. The americium CRs in this study ranged from about 0.01 to a high of 0.3 (for potato shoots). The uptake in potato tubers is similar to the upper range reported by IAEA (1994). The uptake in alfalfa is in the ranges for forage/fodder reported by IAEA and Wasiolek (2004). Both are higher than used in GENII (Napier et al. 2006; Staven et al. 2003) or RESRAD (Biwer et al. 2000), by substantial multiples. The CRs measured are still relatively small, but are large enough to contribute more to human food ingestion dose than the soil adherence/soil ingestion approach. There were small differences within each species depending on the soil type; the Nevada soil seemed to have lower CR values than the others, but this was not a general conclusion. The results of this study indicate that use of generic CR values adds an unpredictable degree of bias to performance assessments. Radionuclides such as 99Tc, that are generally considered to have high uptakes, are more influenced by varying environmental conditions. The actinides, which have no nutrient analogues, have very low uptakes and variations of CR should be of less importance in determining critical pathways and crop types in performance assessments. The scenario of radionuclide application used in this study was one of input with irrigation water. The 99Tc is essentially unsorbed, and distributed relatively uniformly throughout the pot. However, the actinide radionuclides tend to be highly sorbed and concentrate near the top of the pot. Performance assessment models generally average radionuclides over a “plow layer” of between 10 – 30 cm thickness. For irrigation deposition of sorbed radionuclides, this is actually not representative, even after many years of deposition and plowing. In this respect, the somewhat higher effective CR values found in this study may actually be more representative of the modeled conditions. One of the incidental results of this study was the observation that harvest practices may also have an influence on the uptake of radionuclides. Plant stress has a tendency to increase the concentration ratio. Water stress in plants increases the osmotic pressure acting to transport the radionuclide into the plant. If it continues, the plant will attempt to maintain the moisture in the xylem. Water stress may lead to root damage, which could lead to a breakdown in the discrimination processes leading to more intake. (Also, soil desiccation may lead to higher concentrations of the contaminant in the remaining soil water.) This is seen in laboratory and field conditions; unevenly irrigated lands may have stressed areas and overall increased average uptake. All of these considerations increase the variability of and uncertainty in the overall concentration ratios in actual application. This type of information is directly useful in formulating inputs to radioecological and food-chain models used in performance assessments and other kinds of environmental

4-6
assessment. This food-chain pathway data may be used by the NRC staff to assess dose to persons who live and work in areas potentially affected by radionuclide releases from waste disposal facilities and decommissioning sites. These data are expected to be used in biosphere models to calculate the dose from ground water release scenarios in performance assessment computer codes.

4-7
Table 4.1. Soil-to-Plant Concentration Ratios commonly used in environmental assessments (plant pCi/g dry wt.)/(soil pCi/g dry wt.) Staven et al.
(GENII V.2) Biwer et al. (RESRAD V.6)
IAEA (TRS-364)
Wasiolek 2004
Element Crop Best Estimate Best Estimate
GSD Best Estimate
Range Best Estimate
GSD Range
Technetium All Plants 5* 2.5 Leafy Vegetables 210 46 3.7 3.8 - 550 Other Vegetables 0.24 4.4 2.6 0.15 - 120 Grain 0.7 0.73 0.073 - 3.7 1.6 4.3 0.038 - 68 Forage 210 8.1 0.81 - 81 27 2.7 2.1 - 350 Lettuce 200 20 - 2000 Potato 0.24 0.024 - 2.4 Onion Grass 76 10 - 760 Plutonium All Plants 0.001* 2.5 Leafy Vegetables 0.00006 0.00029 2 0.000049 - 0.0017 Other Vegetables 0.0011 0.00019 2 0.000033 - 0.0011 Grain 8.6E-06 8.6E-06 0.00000035 - 0.42 0.000019 4.2 0.00000048 - 0.00078 Forage/Maize 0.00006 0.000075 0.000002 - 0.0029 0.001 10 0.0000027 - 0.39 Fodder 0.0008 0.00011 - 0.051 Potato 0.00015 0.0000038 - 0.056 Onion 0.000087 Americium All Plants 0.001* 2.5 Leafy Vegetables 0.00047 0.0012 2.5 0.00012 - 0.013 Other Vegetables 0.00035 0.0004 2.6 0.000035 - 0.0046 Grain 0.000022 0.000022 0.00000015 - 0.77 0.000075 3.2 0.000038 - 0.0015 Forage/Maize 0.00047 0.00027 0.000011 - 0.012 0.0021 10 0.0000055 - 0.79 Fodder Potato 0.0002 0.000011 - 0.17 Onion 0.00016 *The RESRAD values are reported in wet weight of plant and should be increased by a factor of about 5 to be comparable with the others.
4-8
4.5 References for Section 4 Biwer BM, S Kamboj, JJ Cheng, E Gnanapragasam, C Yu, J Arnish, D LePoire, YY Wang, JP Butler, H Hartmann, SY Chen. 2000. “Parameter Distributions for Use in RESRAD and RESRAD-BUILD Computer Codes,” Attachment C to Yu C, D LePoire, E Gnanapragasam, J Arnish, S Kamboj, BM Biwer, JJ Cheng, A Zielen, SY Chen. 2000. Development of Probabilistic RESRAD 6.0 and RESRAD-BUILD 3.0 Computer Codes. NUREG/CR-6697, U.S. Nuclear Regulatory Commission, Washington, D.C. International Atomic Energy Agency (IAEA). 1994. Handbook of Parameter Values for the Prediction of Radionuclide Transfer in Temperate Environments, Technical Report Series #364, IAEA, Vienna, Austria. Napier BA, DL Strenge, JV Ramsdell, Jr, PW Eslinger, and CJ Fosmire. 2006. GENII Version 2 Software Design Document. PNNL-14584 Rev.1, Pacific Northwest National Laboratory, Richland, WA. Napier BA. 2006. Alternative Conceptual Models for Assessing Food Chain Pathways in Biosphere Models, NUREG/CR-6910, PNNL-15872, US Nuclear Regulatory Commission, Washington, DC. National Council on Ionizing Radiation and Protection (NCRP). 1996. Screening Models for Releases of Radionuclides to Atmosphere, Surface Water and Ground. NCRP Report No. 123, Vol. I., Bethesda, MD. Staven LH, BA Napier, K Rhoads, DL Strenge. 2003. A Compendium of Transfer Factors for Agricultural and Animal Products. PNNL-13421.Pacific Northwest National Laboratory, Richland, Washington. Wasiolek M. 2004. Environmental Transport Input Parameters for the Biosphere Model, ANL-MGR-MD-000007, Rev. 2. Bechtel SAIC Company, Las Vegas, NV. Yu C, AJ Zielen, J-J Cheng, DJ Lepoire, E Gnanapragasam, S Kambof, J Arnish, A Wallo III, WA Williams and H Peterson. 2001. User’s Manual for RESRAD Version 6, ANL/EAD-4. Argonne National Laboratory, Argonne, Illinois.
