
Classification: Confidential
A.P. Møller - Mærsk A/S
Q2 2021 Interim Results
Date: 6 August 2021
Webcast: investor.maersk.com
Conference Call: 11:00 CET

Classification: Confidential
Forward-looking
statements
Q2 20212
This presentation contains forward-looking statements. Such statements are subject to risks and uncertainties as various factors, many of which are beyond the control of A.P. Møller - Mærsk A/S (APMM), may cause actual developments and results to differ materially from the expectations contained in this presentation.
Comparative figuresUnless otherwise stated, all comparisons refer to y/y changes.
Interim report Q2 2021
Key statements
Q2 20213
Classification: Confidential
Key statements
Highlights for Q2 2021
Q2 20214
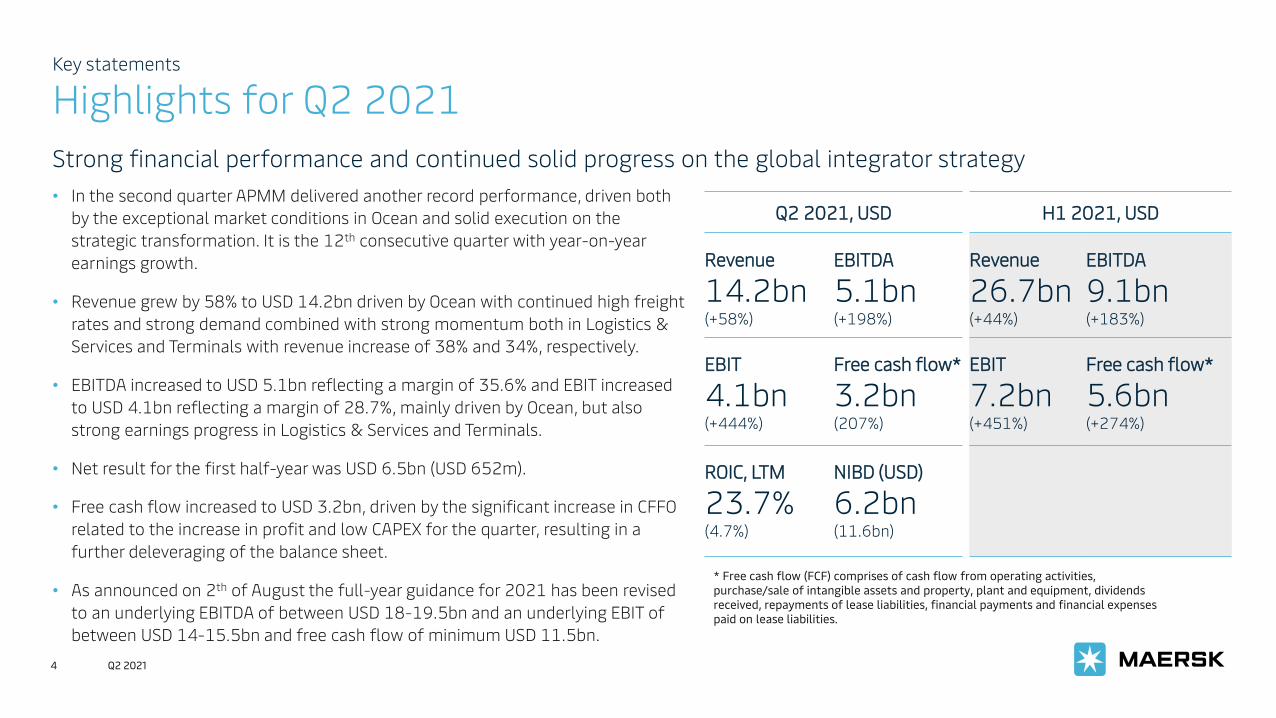
Strong financial performance and continued solid progress on the global integrator strategy
• In the second quarter APMM delivered another record performance, driven both
by the exceptional market conditions in Ocean and solid execution on the
strategic transformation. It is the 12th consecutive quarter with year-on-year
earnings growth.
• Revenue grew by 58% to USD 14.2bn driven by Ocean with continued high freight
rates and strong demand combined with strong momentum both in Logistics &
Services and Terminals with revenue increase of 38% and 34%, respectively.
• EBITDA increased to USD 5.1bn reflecting a margin of 35.6% and EBIT increased
to USD 4.1bn reflecting a margin of 28.7%, mainly driven by Ocean, but also
strong earnings progress in Logistics & Services and Terminals.
• Net result for the first half-year was USD 6.5bn (USD 652m).
• Free cash flow increased to USD 3.2bn, driven by the significant increase in CFFO
related to the increase in profit and low CAPEX for the quarter, resulting in a
further deleveraging of the balance sheet.
• As announced on 2th of August the full-year guidance for 2021 has been revised
to an underlying EBITDA of between USD 18-19.5bn and an underlying EBIT of
between USD 14-15.5bn and free cash flow of minimum USD 11.5bn.
* Free cash flow (FCF) comprises of cash flow from operating activities,
purchase/sale of intangible assets and property, plant and equipment, dividends
received, repayments of lease liabilities, financial payments and financial expenses
paid on lease liabilities.
Q2 2021, USD H1 2021, USD
Revenue
14.2bn(+58%)
EBITDA
5.1bn(+198%)
Revenue
26.7bn(+44%)
EBITDA
9.1bn(+183%)
EBIT
4.1bn (+444%)
Free cash flow*
3.2bn(207%)
EBIT
7.2bn (+451%)
Free cash flow*
5.6bn (+274%)
ROIC, LTM
23.7% (4.7%)
NIBD (USD)
6.2bn (11.6bn)

Classification: Confidential
Key statements
On track to deliver on the mid-term targets for 2021-2025
5
• APMM in the second quarter delivered higher ROIC at 23.7% (LTM)
significantly above the mid-term targets due to the current market
conditions leading to an EBIT margin in Ocean of 32.3% significantly
above the expected normalised level. Underlying strategic progress
was delivered across the segments.
• Continuing to build a strong and resilient Ocean business and tracking
the digital progress, the Maersk SPOT volume share of total short-term
volumes was 35% in Q2, impacted by the constrained capacity situation
and focus on servicing long term contracted volumes.
• Organic revenue growth and profitability in Logistics & Services in Q2
2021 continue to trend positively towards the mid-term targets with
Top 200 Ocean customers accounting for 58% of the organic revenue
growth and USD 857m of the total revenue. Profitability tripled with
EBITA of USD 164m, driven by higher profitability driven by Lead
Logistics, Contract Logistics and Landside Transportation.
• Terminals continue to deliver progress towards the value creation
target with a ROIC of 8.7% end of Q2 (LTM).
TargetsLTM
Q2 2021
APMM:
Return on invested capital (ROIC)Every year >7.5%
Average 2021-25 >12.0% 23.7%
Ocean:
EBIT margin – under normalised conditions Above 6% 23.9%
Execute with the existing fleet size 4.1-4.3m TEU 4.1m
Logistics & Services:
Organic revenue growth Above 10% *) 33%
- hereof from top 200 Ocean customers Min. 50% *) 59%
EBIT margin Above 6% 5.9%
Terminals:
Return on invested capital (ROIC) Above 9% 8.7%
Q2 2021
Mid-term targets were introduced at the CMD in May 2021
*) Based on half-year figures for 2021.
Progressing well on the strategic transformation and realising synergies across the businesses.
Classification: Confidential
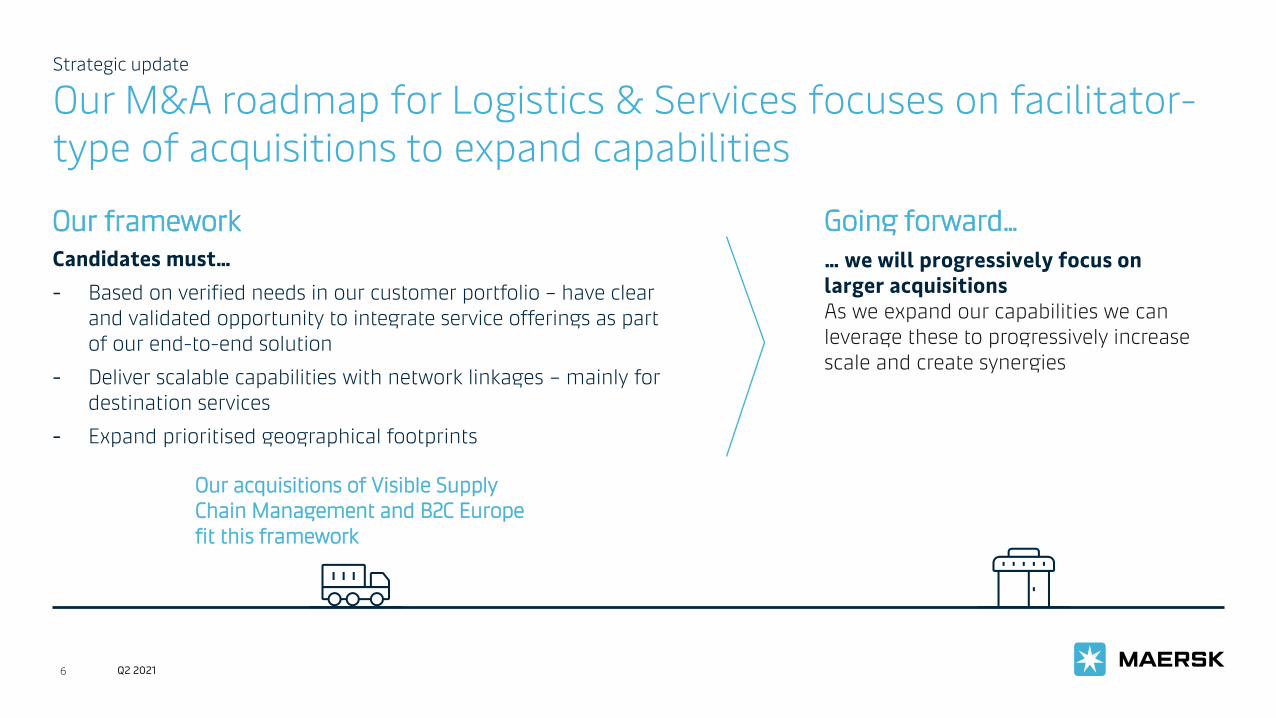
Our framework
Candidates must…
- Based on verified needs in our customer portfolio – have clear
and validated opportunity to integrate service offerings as part
of our end-to-end solution
- Deliver scalable capabilities with network linkages – mainly for
destination services
- Expand prioritised geographical footprints
Going forward…
… we will progressively focus on
larger acquisitions
As we expand our capabilities we can
leverage these to progressively increase
scale and create synergies
Our acquisitions of Visible Supply
Chain Management and B2C Europe
fit this framework
6 Q2 2021
Strategic update
Our M&A roadmap for Logistics & Services focuses on facilitator-
type of acquisitions to expand capabilities
Classification: Confidential
Strategic update
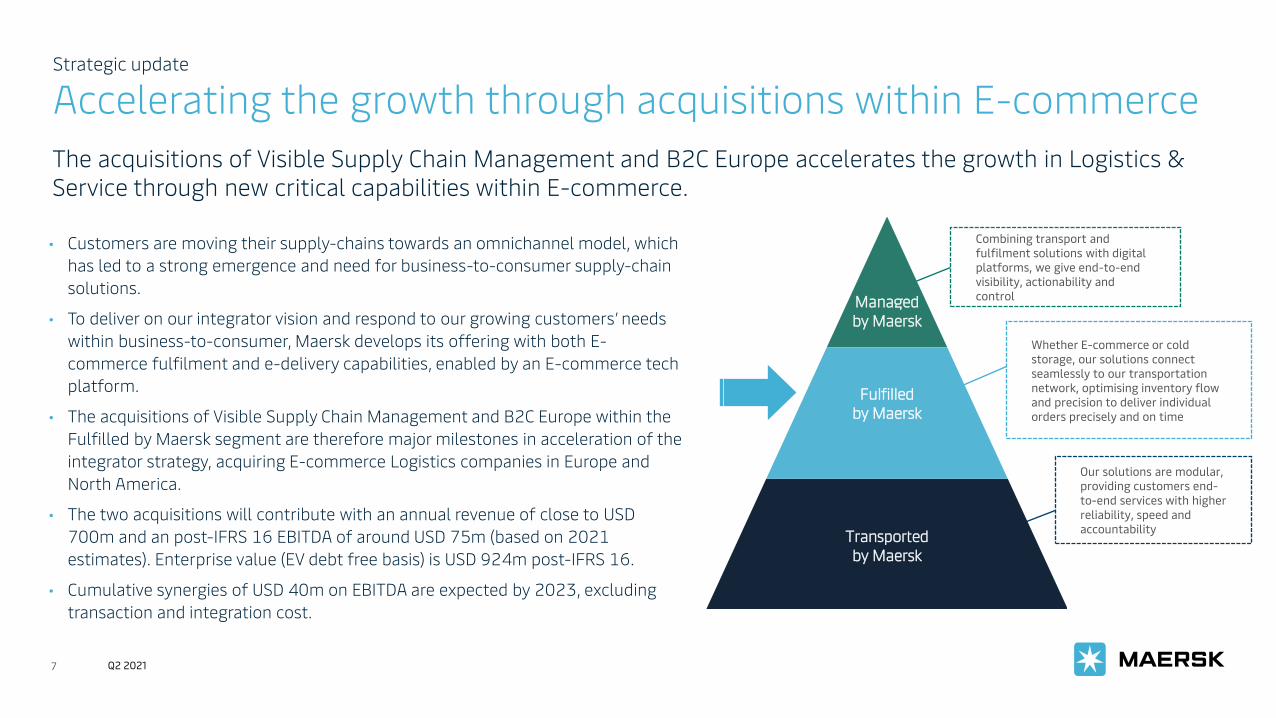
Accelerating the growth through acquisitions within E-commerce
7
The acquisitions of Visible Supply Chain Management and B2C Europe accelerates the growth in Logistics &
Service through new critical capabilities within E-commerce.
Q2 2021
Combining transport and
fulfilment solutions with digital
platforms, we give end-to-end
visibility, actionability and
control
Whether E-commerce or cold
storage, our solutions connect
seamlessly to our transportation
network, optimising inventory flow
and precision to deliver individual
orders precisely and on time
Our solutions are modular,
providing customers end-
to-end services with higher
reliability, speed and
accountability
• Customers are moving their supply-chains towards an omnichannel model, which
has led to a strong emergence and need for business-to-consumer supply-chain
solutions.
• To deliver on our integrator vision and respond to our growing customers’ needs
within business-to-consumer, Maersk develops its offering with both E-
commerce fulfilment and e-delivery capabilities, enabled by an E-commerce tech
platform.
• The acquisitions of Visible Supply Chain Management and B2C Europe within the
Fulfilled by Maersk segment are therefore major milestones in acceleration of the
integrator strategy, acquiring E-commerce Logistics companies in Europe and
North America.
• The two acquisitions will contribute with an annual revenue of close to USD
700m and an post-IFRS 16 EBITDA of around USD 75m (based on 2021
estimates). Enterprise value (EV debt free basis) is USD 924m post-IFRS 16.
• Cumulative synergies of USD 40m on EBITDA are expected by 2023, excluding
transaction and integration cost.
Transported
by Maersk
Fulfilled
by Maersk
Managed
by Maersk

Classification: Confidential
Strategic update
Acquisition of Visible Supply Chain Management
8
The acquisition of Visible Supply Chain Management brings strong E-commerce capabilities in North America
Visible Supply Chain Management a leading E-commerce logistics company in North America
Q2 2021
Inbound Logistics
(Ocean, Air, LCL, Rail, etc.)
B2B & B2C
Warehousing
Outbound Logistics
(B2C Delivery & Returns)
Integrated end-to-end supply chain
(NAM)
• Visible Supply Chain Management was founded in 1992 and has 20
years of experience in fulfilment services to its customers. Since
2010 it became an industry leader in parcel shipping in the US and
is an authorised reseller for United States Postal Service (USPS).
• At present the company enables more than 200m packages per year
through its proprietary tech solutions.
• The company has a network capacity to reach 95% of the US direct-
to-consumer market within 48 hours.
• Acquiring Visible Supply Chain Management will contribute further
to our digital transformation by leveraging technical E-commerce
logistics excellence to support Maersk customers take control of
their growing E-commerce momentum.
• Based on 2021-forecast the revenue is estimated to be around USD
550m and with an post-IFRS 16 EBITDA of around USD 65m,
reflecting a margin of 11.8%.
• Enterprise value of USD 838m post-IFRS 16 corresponding to
EV/EBITDA multiple of 13x (21E) reflecting the strong growth
outlook and synergies. Transaction was closed on the 2th of August.

Classification: Confidential
Strategic update
Acquisition of B2C Europe
9
The acquisition of B2C Europe brings strong E-commerce capabilities to Maersk in Europe
Q2 2021
Inbound Logistics
(Ocean, Air, LCL, Rail, etc.)
B2B & B2C
Warehousing
Outbound Logistics
(B2C Delivery & Returns)
Integrated end-to-end supply chain
(EUR)
B2C Europe is the facilitator for the strategic integration with business-to-consumer business
• B2C Europe was established 20 years ago and the key activity is
the management of cross-border last mile parcel deliveries.
• The company’s offers business-to-consumer parcel delivery
solutions within Europe and the US and China to Europe.
• Operationally, B2C Europe covers labelling services, pick-ups,
parcel sortation, linehaul and injection into the last mile delivery
network of 100+ carriers across Europe.
• At present the company enables more than 35m parcels per year
through five sorting hubs.
• Based on 2021-forecast the revenue is estimated to around USD
140m and with an post-IFRS 16 EBITDA of around 8m, reflecting
a margin of 5.7%.
• Enterprise value of USD 86m post-IFRS 16 which corresponds to
an EV/EBITDA of 11x (21E) is reflecting the strong growth
outlook and synergies. The transaction is subject to closing
conditions including regulatory approvals and is expected to
close Q4 2021.
Interim report Q2 2021
Financial highlights
Q2 202110

Classification: Confidential
Financial highlights Q2 2021
Record high profit driven by the exceptional market in Ocean
Q2 202111
EBITDA effect
Profitability increased as
EBITDA improved to USD
5.1bn (USD 1.7bn), particularly
in Ocean driven by the
continuation of the
exceptional market conditions.
For the first half of the year
EBITDA was USD 9.1bn (USD
3.2bn).
Net financial expenses was
positively impacted by lower
gross debt and lower negative
foreign exchange rate impacts.
Tax increased primarily as a
consequence of higher
earnings.
Underlying profit increased to
USD 3.7bn up from USD 359m
in Q2 2020.Profit
Q2 2020
Ocean Logistics
&
Services
Terminals
& Towage
Manufac-
turing &
Others
Profit
Q2 2021
TaxNet
financials
expenses
Unallocated
activities
& elimi-
nations
Depreciations,
amortisations,
impairments
Disposals JV’s and
associated
companies
Profit/loss result bridge for Q2 2021, USDm

Classification: Confidential
Financial highlights Q2 2021
Strong free cash flow adding to a strong balance sheet
Cash flow bridge for Q2 2021, USDm
Cash flow
from
operations
Free cash flow was
USD 3.2bn (USD 1.1bn)
for Q2 2021 and USD
5.6bn (USD 1.5bn) for
the first half-year
Cash conversion was
82% (110%), impacted
by higher receivables.
Net interest-bearing
debt decreased by
USD 3.0bn from Q4
2020 to USD 6.2bn
(USD 9.2bn) after
paying USD 1.8n (USD
1bn) in dividends and
share buy-backs in the
first half year
Excluding lease
liabilities, the net cash
position was USD
3.2bn.
Net financial
expenses, incl.
lease liabilities
CapexCapitalised
lease
instalments
Sale proceeds
and dividend
received
Free cash flow Share buy-
backs and
dividends
Repayment/
proceeds from
borrowings, net
and Others
Net cash flow
12
Financial
investments,
dividends to
minorities and
others, net
Q2 2021
-982
Acquisitions,
incl sales
Classification: Confidential
Highlights Q2 2021
Ocean
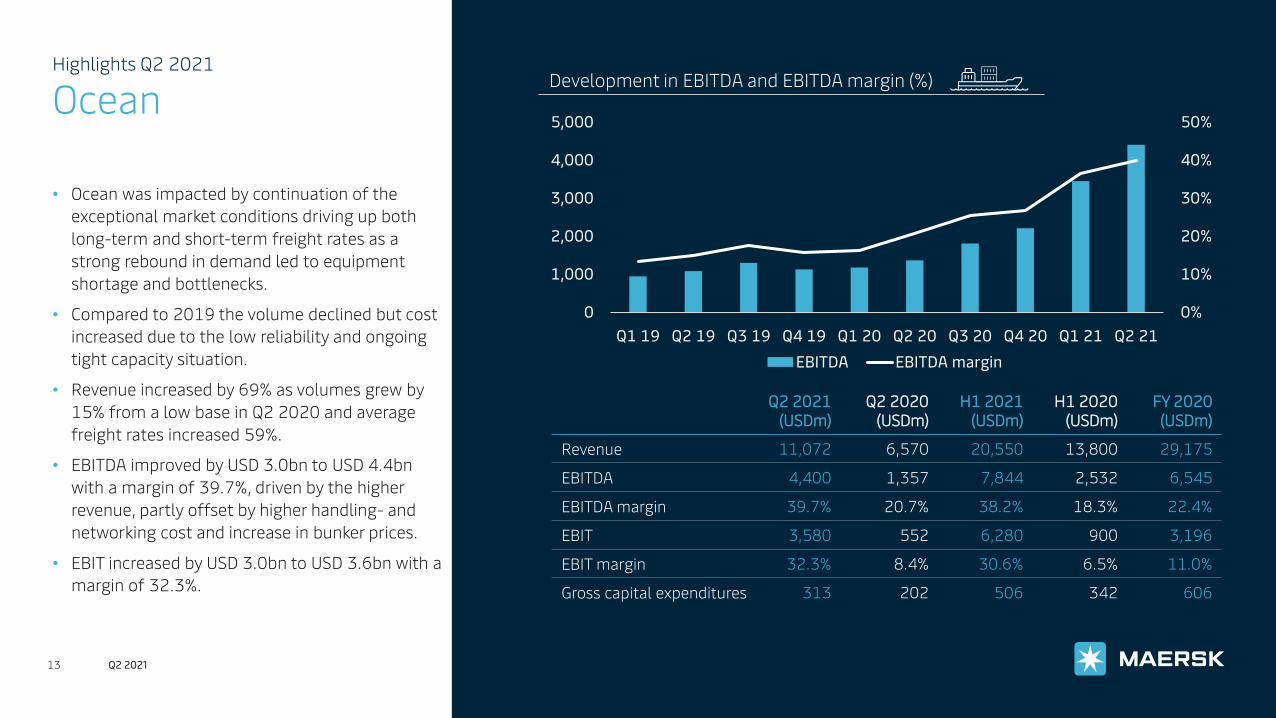
• Ocean was impacted by continuation of the
exceptional market conditions driving up both
long-term and short-term freight rates as a
strong rebound in demand led to equipment
shortage and bottlenecks.
• Compared to 2019 the volume declined but cost
increased due to the low reliability and ongoing
tight capacity situation.
• Revenue increased by 69% as volumes grew by
15% from a low base in Q2 2020 and average
freight rates increased 59%.
• EBITDA improved by USD 3.0bn to USD 4.4bn
with a margin of 39.7%, driven by the higher
revenue, partly offset by higher handling- and
networking cost and increase in bunker prices.
• EBIT increased by USD 3.0bn to USD 3.6bn with a
margin of 32.3%.
Q2 2021
(USDm)
Q2 2020
(USDm)
H1 2021
(USDm)
H1 2020
(USDm)
FY 2020
(USDm)
Revenue 11,072 6,570 20,550 13,800 29,175
EBITDA 4,400 1,357 7,844 2,532 6,545
EBITDA margin 39.7% 20.7% 38.2% 18.3% 22.4%
EBIT 3,580 552 6,280 900 3,196
EBIT margin 32.3% 8.4% 30.6% 6.5% 11.0%
Gross capital expenditures 313 202 506 342 606
Development in EBITDA and EBITDA margin (%)
13
0%
10%
20%
30%
40%
50%
0
1,000
2,000
3,000
4,000
5,000
Q1 19 Q2 19 Q3 19 Q4 19 Q1 20 Q2 20 Q3 20 Q4 20 Q1 21 Q2 21
EBITDA EBITDA margin
Q2 2021

Classification: Confidential
Ocean - highlights Q2 2021
Significant higher EBITDA, mitigating cost inflation
14
EBITDA
Q2 2020
Freight rates
effect
Container
handling cost,
excl. volume
effect
Network cost
and bunker
consumption
SG&A, net FX
impacts and
Others*
Unrealised
derivative
gain/losses on
inventory hedges
EBITDA
Q2 2021
Volume
effect
Bunker price
USDm
Q2 2021
*Includes revenue recognition
EBITDA bridge for Ocean for Q2 2021, USDm

Classification: Confidential
Ocean - highlights Q2 2021
Freight rates and volumes increased significantly
• Average freight rates increased by 59% (49% adjusted for bunker prices), driven
by long-term contracts renewing and short-term freight rates due to higher
demand combined with bottlenecks and congestions.
• The total volume increase of 15% mainly driven by higher headhaul volumes.
Comparing to Q2 2019 the loaded volumes were down 3.1%.
• Unit cost at fixed bunker increased despite higher volumes and impact from
lower depreciation related to the lifetime of the containers, due to higher
handling and network cost affected by the low reliability and tight capacity
situation.
• Total bunker cost increased 69.1% with the average bunker price increased
45% to USD 475 per ton.
Average freight rates
(USD/FFE)Q2 2021 Q2 2020 Change %
FY
2020
East-West 3,148 1,879 67.5 2,008
North-South 3,764 2,449 53.7 2,529
Intra-regional 1,841 1,292 42.5 1,345
Total 3,038 1,915 58.6 2,000
Loaded volumes
(‘000 FFE)Q2 2021 Q2 2020 Change %
FY
2020
East-West 1,548 1,390 11.4 5,948
North-South 1,034 894 15.7 3,900
Intra-regional 759 619 22.6 2,786
Total 3,341 2,903 15.1 12,634
15 Q2 2021
Unit cost at fixed bunker* increased by 0.9% to 2,039 USD/FFE and 7.1% to
USD 2,060 USD/FFE on a floating
bunker price
Average nominal capacity increased by
2.0% to 4,113k TEU, of which 79k TEU
were idle.
Bunker cost increased to USD 1.3bn
(USD 766m)
Utilisation on deployed capacity
remained at 95.9%
*USD 450 per FFE

Classification: Confidential
Ocean - highlights Q2 2021
Building on our long-term contract commitment
• We continued in Q2 2021 to focus on supporting our long-term
customers’ supply chains by alleviating bottlenecks through investing in
additional equipment and increasing the capacity for long-term
contracted volumes.
• As by end of Q2 2021 we have increased the long-term contract volume
by 30% to around 6.3m FFE for 2021 in line with our integrator strategy
and thus keep increasing our share of long-term contracts.
• This will lead to a positive financial impact of approx. USD 800 per FFE on
long-term contracts for Maersk for 2021.
• Currently we have signed up more than 1m FFE at multi-year contracts,
ensuring predictability and stability of our earnings and the service to
customers.
16 Q2 2021
0
2,000,000
4,000,000
6,000,000
8,000,000
10,000,000
12,000,000
2017 2018 2019 2020 2021e
Volume split, long haul trades
LT volume ST volume
60%50%
46%48%48%
40%50%
54%52%
52%
FFE

Classification: Confidential
Highlights Q2 2021
Logistics & Services
• The positive momentum seen in the past
quarters continued in Q2, with revenue
growth of 38% to USD 2.2bn, driven by
growth across all three segments,
Managed, Fulfilled and Transported by
Maersk.
• In combination with the revenue growth,
profitability increased significantly with
56% higher gross profit to USD 563m and
EBITDA more than doubled reflecting a
margin of 10.0%.
• We see the strong growth in the business as
clear proof points for our strategy to grow
and create synergies with our Ocean
customers and increase our capabilities to
cover a higher percentage of our customer’s
logistics wallet, confirmed by 58% of the
organic revenue growth came from top 200
Ocean customers.
Development in gross profit and gross profit margin (%)
17
0%
5%
10%
15%
20%
25%
30%
0
100
200
300
400
500
600
Q1 19 Q2 19 Q3 19 Q4 19 Q1 20 Q2 20 Q3 20 Q4 20 Q1 21 Q2 21
Gross profit Gross profit margin
Q2 2021
Q2 2021
(USDm)
Q2 2020
(USDm)
H1 2021
(USDm)
H1 2020
(USDm)
FY 2020
(USDm)
Revenue 2,168 1,569 4,213 3,011 6,963
Gross Profit 563 361 1,074 667 1,635
EBITDA 216 97 421 165 454
EBITDA margin 10.0% 6.2% 10.0% 5.5% 6.5%
EBIT 153 42 292 71 264
EBIT margin 7.1% 2.7% 6.9% 2.4% 3.8%
Gross capital expenditures 36 41 57 99 156

Classification: Confidential
Logistics & Services - highlights Q2 2021
Managed, Fulfilled and Transported by Maersk
• From Q1 a new reporting structure was introduced with products and
services split into Managed by Maersk, Fulfilled by Maersk and
Transported by Maersk to reflect our progress on the integrator
strategy.
• EBITA for Logistics & Services increased by USD 116m to USD 164m
reflecting a margin of 7.6% (3.1%), driven by the higher revenue
growth and improved margins.
• Managed by Maersk revenue was driven by an increase in Lead
Logistics Supply Chain Management volumes of 31%, reflecting the
lower base line in Q2 2020 due to COVID-19, the increase in volumes
and new business wins. EBITA margin was around 13.9% (6.1%).
• The Fulfilled by Maersk revenue was up 51% driven by Contract
Logistics and the turnaround of facilities in North America combined
with higher volumes and strong footprint from the integration of
Performance Team. EBITA margin was around 6.2% (-0.3%).
• The Transported by Maersk revenue grew by 30% driven by higher
Landside Transportation via higher penetration ratio into existing
Ocean customers. EBITA margin was around 6.6% (3.6%).
18 Q2 2021
Revenue, USDm Q2 2021 Q2 2020
Managed by Maersk 317 201
- growth % 58%
Fulfilled by Maersk 480 317
- growth % 51%
Transported by Maersk 1,371 1,051
- growth % 30%
Total 2,168 1,569
- growth % 38%
Classification: Confidential
Logistics & Services - highlights Q2 2021
Significant organic growth and profitability improvement
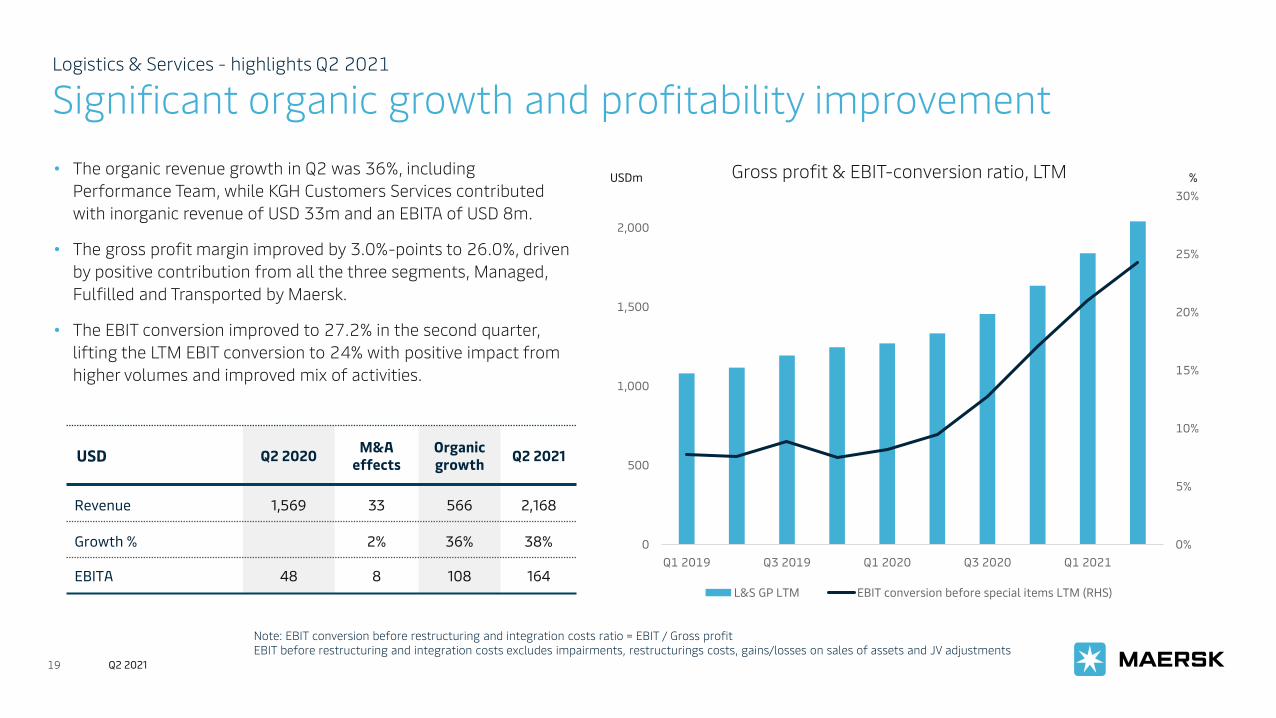
• The organic revenue growth in Q2 was 36%, including
Performance Team, while KGH Customers Services contributed
with inorganic revenue of USD 33m and an EBITA of USD 8m.
• The gross profit margin improved by 3.0%-points to 26.0%, driven
by positive contribution from all the three segments, Managed,
Fulfilled and Transported by Maersk.
• The EBIT conversion improved to 27.2% in the second quarter,
lifting the LTM EBIT conversion to 24% with positive impact from
higher volumes and improved mix of activities.
19
Note: EBIT conversion before restructuring and integration costs ratio = EBIT / Gross profit
EBIT before restructuring and integration costs excludes impairments, restructurings costs, gains/losses on sales of assets and JV adjustments
USDm %Gross profit & EBIT-conversion ratio, LTM
0%
5%
10%
15%
20%
25%
30%
0
500
1,000
1,500
2,000
Q1 2019 Q3 2019 Q1 2020 Q3 2020 Q1 2021
L&S GP LTM EBIT conversion before special items LTM (RHS)
Q2 2021
USD Q2 2020M&A
effects
Organic
growthQ2 2021
Revenue 1,569 33 566 2,168
Growth % 2% 36% 38%
EBITA 48 8 108 164

Classification: Confidential
Highlights Q2 2021
Terminals & Towage
• Terminals & Towage continued the strong
momentum seen in the past quarters with
EBITDA increasing 78.5% to USD 423m, driven
by Terminals.
• Terminals reported 34% higher revenue of USD
969m, and EBITDA increased to USD 370m
(USD 186m).
• The EBITDA margin in Terminals increased by
12.4%-points to 38.1% as a result of higher
volumes and increase in storage income. ROIC
in Terminals was 8.7% in Q2 2021 up 3%-
points.
• Revenue in Towage increased to USD 184m
(USD 160m) positively impacted by higher
harbour towage activity. EBITDA increased to
USD 53m (USD 51m).
Development in EBITDA and EBITDA margin (%)
20
0%
5%
10%
15%
20%
25%
30%
35%
40%
0
100
200
300
400
500
Q1 19 Q2 19 Q3 19 Q4 19 Q1 20 Q2 20 Q3 20 Q4 20 Q1 21 Q2 21
EBITDA EBITDA margin
Q2 2021
Q2 2021
(USDm)
Q2 2020
(USDm)
H1 2021
(USDm)
H1 2020
(USDm)
FY 2020
(USDm)
Revenue 1,148 878 2,237 1,789 3,807
EBITDA 423 237 803 513 1,205
EBITDA margin 36.8% 27.0% 35.9% 28.7% 31.7%
EBIT 334 200 606 397 828
EBIT margin 29.1% 22.8% 27.1% 22.2% 21.7%
Gross capital expenditures 96 112 187 215 457
Classification: Confidential
Terminals & Towage - highlights Q2 2021
Margin improvements from volume growth and storage income
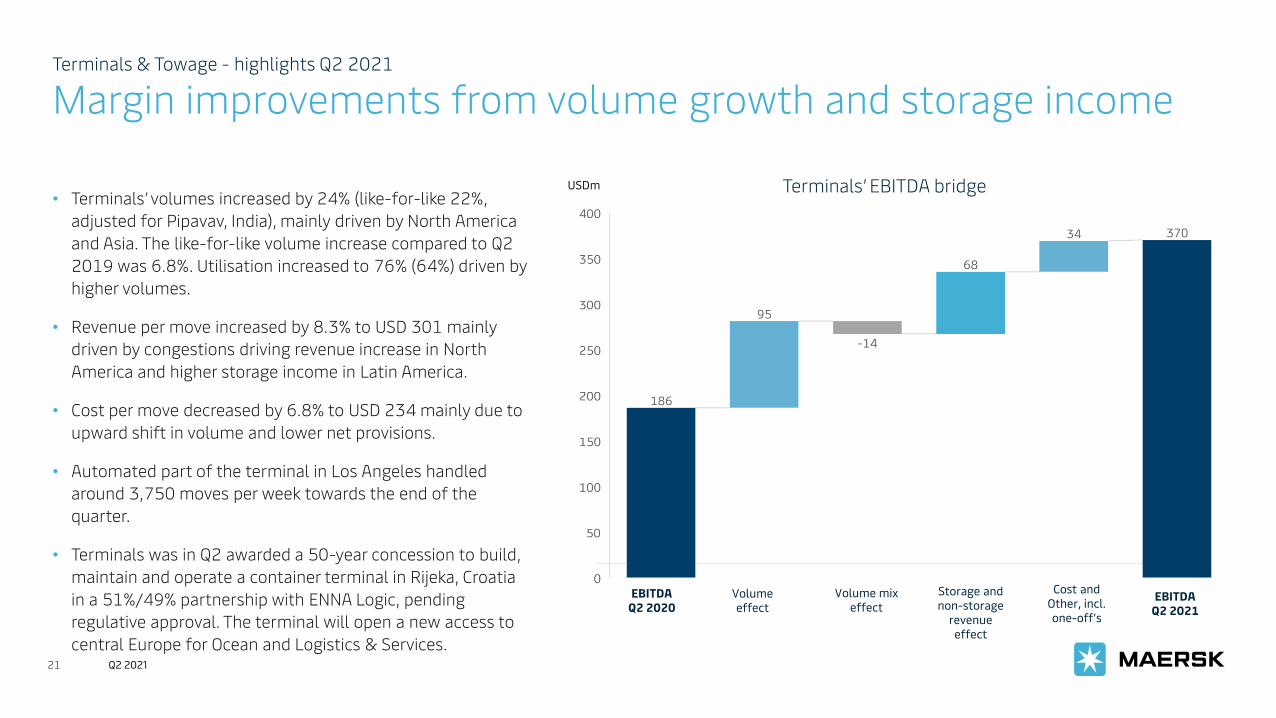
• Terminals’ volumes increased by 24% (like-for-like 22%,
adjusted for Pipavav, India), mainly driven by North America
and Asia. The like-for-like volume increase compared to Q2
2019 was 6.8%. Utilisation increased to 76% (64%) driven by
higher volumes.
• Revenue per move increased by 8.3% to USD 301 mainly
driven by congestions driving revenue increase in North
America and higher storage income in Latin America.
• Cost per move decreased by 6.8% to USD 234 mainly due to
upward shift in volume and lower net provisions.
• Automated part of the terminal in Los Angeles handled
around 3,750 moves per week towards the end of the
quarter.
• Terminals was in Q2 awarded a 50-year concession to build,
maintain and operate a container terminal in Rijeka, Croatia
in a 51%/49% partnership with ENNA Logic, pending
regulative approval. The terminal will open a new access to
central Europe for Ocean and Logistics & Services.21
EBITDA
Q2 2020
Volume
effect
Volume mix
effect
Storage and
non-storage
revenue
effect
Cost and
Other, incl.
one-off’s
EBITDA
Q2 2021
Terminals’ EBITDA bridgeUSDm
Q2 2021

Classification: Confidential
Highlights Q2 2021
Manufacturing
& Others
• Revenue in Maersk Container Industry
increased to USD 179m (USD 154m) driven by
the strong market demand, while EBITDA
decreased by USD 7m to USD 21m due to
increase in direct material cost.
• As communicated at the CMD in May, a
strategic review of Maersk Container Industry
has been initiated.
• Maersk Supply Service reported an increase in
revenue at USD 75m (USD 56m), mainly driven
by higher activity and higher rates. EBITDA was
USD 9m (USD -4m), reflecting the improved
market conditions and only partly offset by
higher operating cost.
Development in EBITDA and EBITDA margin (%)
22
0%
5%
10%
15%
20%
0
10
20
30
40
50
60
Q1 19 Q2 19 Q3 19 Q4 19 Q1 20 Q2 20 Q3 20 Q4 20 Q1 21 Q2 21
EBITDA EBITDA margin
Q2 2021
Q2 2021
(USDm)
Q2 2020
(USDm)
H1 2021
(USDm)
H1 2020
(USDm)
FY 2020
(USDm)
Revenue 344 316 686 611 1,254
EBITDA 41 49 73 92 165
EBITDA margin 11.9% 15.5% 10.6% 15.1% 13.2%
EBIT 33 0 40 18 69
EBIT margin 9.6% 0.0% 5.8% 2.9% 5.5%
Gross capital expenditures 0 7 27 15 33

2021
Full-year guidance
Q2 202123
Classification: Confidential
Guidance
Full-year guidance for 2021
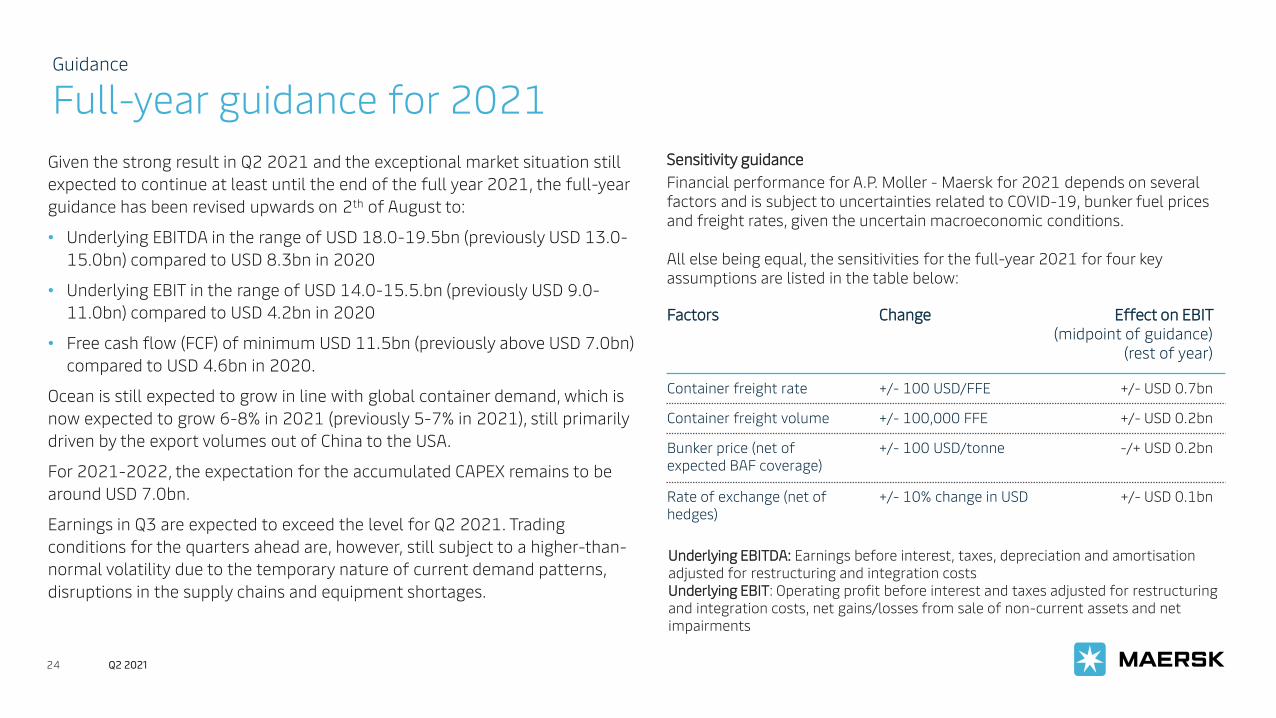
Given the strong result in Q2 2021 and the exceptional market situation still
expected to continue at least until the end of the full year 2021, the full-year
guidance has been revised upwards on 2th of August to:
• Underlying EBITDA in the range of USD 18.0-19.5bn (previously USD 13.0-
15.0bn) compared to USD 8.3bn in 2020
• Underlying EBIT in the range of USD 14.0-15.5.bn (previously USD 9.0-
11.0bn) compared to USD 4.2bn in 2020
• Free cash flow (FCF) of minimum USD 11.5bn (previously above USD 7.0bn)
compared to USD 4.6bn in 2020.
Ocean is still expected to grow in line with global container demand, which is
now expected to grow 6-8% in 2021 (previously 5-7% in 2021), still primarily
driven by the export volumes out of China to the USA.
For 2021-2022, the expectation for the accumulated CAPEX remains to be
around USD 7.0bn.
Earnings in Q3 are expected to exceed the level for Q2 2021. Trading
conditions for the quarters ahead are, however, still subject to a higher-than-
normal volatility due to the temporary nature of current demand patterns,
disruptions in the supply chains and equipment shortages.
Sensitivity guidance
Financial performance for A.P. Moller - Maersk for 2021 depends on several
factors and is subject to uncertainties related to COVID-19, bunker fuel prices
and freight rates, given the uncertain macroeconomic conditions.
All else being equal, the sensitivities for the full-year 2021 for four key
assumptions are listed in the table below:
Factors Change Effect on EBIT
(midpoint of guidance)
(rest of year)
Container freight rate +/- 100 USD/FFE +/- USD 0.7bn
Container freight volume +/- 100,000 FFE +/- USD 0.2bn
Bunker price (net of
expected BAF coverage)
+/- 100 USD/tonne -/+ USD 0.2bn
Rate of exchange (net of
hedges)
+/- 10% change in USD +/- USD 0.1bn
24
Underlying EBITDA: Earnings before interest, taxes, depreciation and amortisation
adjusted for restructuring and integration costs
Underlying EBIT: Operating profit before interest and taxes adjusted for restructuring
and integration costs, net gains/losses from sale of non-current assets and net
impairments
Q2 2021

Questions and answers
To ask a question, please press 01
Q2 202125

Final remarks
Q2 202126
• Continued strong progress and momentum in our strategy
• Expanding and accelerating our end-to-end service offerings through
the acquistion of companies with strong E-commerce capabilities
• Record high profit in Q2, continously driven both by exceptional market
conditions in Ocean and commercial synergies derived by the solid
strategic mometum across the businesses
• Continued strong improvement in Logistics & Services with organic
revenue growth of 36% - above our 2025-target of 10% per year
• ROIC in Terminals is moving closer to our 2025-target of above 9%

Appendix
Q2 202127

Classification: Confidential
Financial highlights
Consolidated financial information
28
Income statement (USDm) Q2 2021Q2
2020
H1
2021
H1
2020
FY
2020
Revenue 14,230 8,997 26,669 18,568 39,740
Underlying EBITDA 5,064 1,697 9,103 3,218 8,324
EBITDA margin (underlying) 35.6% 18.9% 34.1% 17.3% 20.7%
Depreciation, impairments etc. 1,087 1,149 2,112 2,222 4,541
Gain on sale of non-current assets, etc.,
net12 145 19 164 202
Share of profit in joint ventures and
associates95 58 171 143 299
Underlying EBIT 4,070 642 7,162 1,182 4,231
EBIT margin (underlying) 28.6% 7.1% 26.9% 6.4% 10.6%
Financial items, net -186 -232 -416 -447 -879
Profit/loss before tax 3,898 519 6,765 856 3,307
Tax 152 76 302 204 407
Profit/loss for the period 3,746 443 6,463 652 2,900
Key figures and financials (USDm) Q2 2021 Q2 2020 H1 2021 H1 2020FY
2020
Profit/loss for the period 3,746 443 6,463 652 2,900
Gain/loss on sale of non-current
assets etc., net-12 -145 -19 -164 -202
Impairment losses, net. -2 35 0 42 149
Transaction and integration cost 0 0 0 0 98
Tax on adjustments 0 26 0 26 15
Underlying profit/loss –
continuing operations3,732 359 6,444 556 2,960
Earnings per share (USD) 194 21 333 31 145
Lease liabilities (IFRS 16) 9,464 8,489 9,464 8,489 8,747
Net interest-bearing debt 6,216 11,564 6,216 11,564 9,232
Invested capital 41,481 40,186 41,481 40,186 40,121
Total Equity (APMM total) 35,282 28,569 35,282 28,569 30,854
Total market capitalisation, 54,076 21,827 54,076 21,827 41,957
Q2 2021

Classification: Confidential
Financial highlights
Consolidated financial information
29
Cash flow statement (USDm) Q2 2021 Q2 2020 H1 2021 H1 2020 FY 2020
Profit/loss before financial items 4,084 751 7,181 1,303 4,186
Non-cash items, etc. 1,075 1,157 1,958 2,059 4,305
Change in working capital -886 58 -1,345 -104 -239
Taxes paid -136 -99 -224 -175 -424
Cash flow from operating activities (CFFO) 4,137 1,867 7,570 3,083 7,828
CAPEX -452 -362 -781 -672 -1,322
Capital lease instalments – repayments of lease liabilities -453 -396 -1,082 -738 -1,710
Financial expenses paid on lease liabilities -114 -118 -228 -231 -468
Financial payments, net -13 -96 -96 -170 -292
Sale proceeds and dividends received 125 156 218 224 612
Free cash flow (FCF) 3,230 1,051 5,602 1,496 4,648
Acquisitions, net (incl. sales) -39 -207 -38 -233 -475
Dividends and share buy-backs -604 -379 -1,838 -1,063 -1,327
Repayments of/proceeds from borrowings, net -982 897 -1,465 512 -1,860
Q2 2021

Classification: Confidential
Financial highlights Q2 2021
Continued reduction in net interest-bearing debt, despite higher
capital leases related to charters
Development in net interest-bearing debt Q2-2021
USDbn
Liquidity reserve1 of
USD 13.0bn by end
Q2 2021.
Investment grade
credit rating of BBB
(positive) from S&P
and Baa2 (stable)
from Moody’s.
USD 6.2bn of net
interest bearing
debt (NIBD) of which
USD 9.5bn is
capitalised leases.
1) Defined as cash and securities, time deposits, and undrawn committed facilities longer than 12 months less restricted cash and securities.30
7.7
6.2
5.1
0.9
0.3
0.5
0.6
1.6
2
3
4
5
6
7
8
Gross capexNIBD Q1 2021
0.1
EBITDA Dividends and share buybacks
Net new capitalised
leases
Change in working capital
Financial items and tax paid
OtherSales proceeds
and dividends received
0.1
NIBD Q2 2021
8.4
9.5
1.6
0.5
Capitalised leases Q1
2021
Net new captialised
leases
Lease repayments
Capitalised leases Q2
2021
Q2 2021

Classification: Confidential
Logistics & Services - highlights Q2 2021
Product and service segmentation
31
Product
families
Details Strategic rational
Managed by
Maersk
Lead Logistics
(SCM and 4PL)
Cold Chain logistics
Customs Services
Tradelens
Integrated management solutions enable
customers to control or outsource part or
their entire supply chain.
Combining transport and fulfilment solutions
with digital platforms, we give end to end
visibility, actionability and control.
Fulfilled by Maersk Contract logistics
(WND and depot)
E-commerce
Integrated fulfillment solutions improve
customer consolidation and storage down to
order level.
Whether E-commerce or cold storage, our
solutions connect seamlessly to our
transportation network, optimizing inventory
flow and precision to deliver individual orders
precisely and on time.
Transported by
Maersk
Insurance
Landside
transportation
(intermodal and
intercontinental
train)
Air & LCL
Star Air
FCL
FFW Others
Integrated transportation solutions facilitate
supply chain control across our assets.
Our solutions are modular, providing
customers end to end services with higher
reliability, speed and accountability.
Q2 2021
Revenue, USDmQ2
2020
Q3
2020
Q4
2020
Q1
2021
Q2
2021
Managed by Maersk 201 292 301 348 317
- growth % 58%
Fulfilled by Maersk 317 434 485 457 480
- growth % 51%
Transported by Maersk 1,051 1,165 1,275 1,240 1,371
- growth % 30%
Total 1,569 1,891 2,061 2,045 2,168
- growth % 38%


