
ANNUAL REPORT 2016
010_0594001372808.indd 2 2016/08/12 9:34:22

Nifco Inc. is the principal manufacturer of industrial
plastic parts and components in Japan with a major
share of the market. Nifco produces more than 20,000
types of fasteners, plastic components, electrical and
electronic parts which it supplies largely to the automo-
bile industry, home electric appliance and white goods
manufacturers.
The company was founded in 1967 and was first listed
on the Tokyo Stock Exchange in 1979 where its shares
are now traded on the First Section of the Exchange.
Nifco’s domestic operations include five production facili-
ties, twelve sales offices, and four subsidiaries, including
Simmons Co. Ltd. and The Japan Times, Ltd. Overseas,
Nifco has subsidiaries in China, Germany, Hong Kong,
India, Indonesia, Malaysia, Mexico, Poland, Singapore,
South Korea, Spain, Taiwan, Thailand, the United
Kingdom, the United States, and Vietnam. Nifco also has
an affiliated company in Japan.
Company Profile
01 Financial Highlights
02 Message from the President
04 Financial Review
06 Topics / Introducing a Subsidiary
07 Five-Year Summary
08 Segment Information on a Consolidated Basis
09 Corporate Governance
09 Nifco Product Trivia
10 Consolidated Balance Sheets
12 Consolidated Statements of Income and Comprehensive Income
13 Consolidated Statements of Changes in Net Assets
14 Consolidated Statements of Cash Flows
15 Notes to Consolidated Financial Statements
27 Independent Auditor’s Report
28 Corporate Data
Disclaimer Regarding Forward-Looking StatementsThis Annual Report contains forward-looking statements that are statements that do not relate to historical or current facts. These statements are based on the assumptions and beliefs of Nifco Inc. in the light of current information available to it and involve known and unknown risks and uncertainties. Such risks, uncertainties and other factors may cause Nifco Inc.’s actual results to differ from these forward-looking statements. Accordingly, investors are requested to bear this in mind when reading such forward-looking statements.The actual results will depend on the economic conditions in which the Company finds itself, the changes in the market, the exchange rate movement, etc. As such they may materially differ from the forward-looking statements contained in this Annual Report.
1967 Nippon Industrial Fastener Corporation was formed as a joint venture between Nichiei Bussan Co. Ltd. and Illinois Tool Works Inc.
1972 Technical licence agreements were entered into with General Motors, Chrysler, and Ford Motors of the USA.
1977 Nifco and Nichiei Bussan were merged and Nifco’s company head office was moved to Maioka, Totsuka, Yokohama.
The company’s name was changed to Nifco Inc.
1979 Nifco was listed on the Second Section of the Tokyo Stock Exchange.
1980 Nifco’s revenues exceeded ¥10 billion for the first time.
1983 Nifco’s first overseas factory was established in Taiwan.
1984 Nifco’s shares were transferred to the First Section of the Tokyo Stock Exchange.
1985 Nifco established a factory in South Korea.
1986 Nifco established a factory in the USA.
1987 Nifco established a factory in Hong Kong.
1988 Nifco established a factory in Thailand.
1990 Nifco Yamagata Inc. (former name: JT Nifco Co. Ltd.) was established as a joint venture with Japan Tobacco Inc.
Nifco acquired a factory in the United Kingdom.
1991 Nifco established a factory in Malaysia.
1992 Nifco’s consolidated sales exceeded ¥50 billion for the first time.
1995 Nifco established a sales office in Singapore.
1996 Nifco established a factory in Shanghai, China.
Simmons Co. Ltd. and The Japan Times, Co. Ltd. joined the Nifco Group.
2001 Nifco acquired a factory in Spain.
Nifco’s consolidated sales exceeded ¥100 billion for the first time.
2002 Nifco Group established a factory in Guangdong Province, China.
2005 Nifco Group established a factory in Vietnam.
2006 Nifco established a factory in Poland.
2007 Nifco established a sales office in Germany.
Nifco established a factory in Kentucky, in the USA.
2008 Nifco Group established Nifco Korea USA Inc.
2010 Nifco established an administrative company, Nifco Enterprise Management (Shanghai) Co. Ltd. in Shanghai, China.
Nifco established factories in Tianjin and Hubei, China.
Nifco established a factory in Gurgaon, India.
Nifco Group established Nifco South India Manufacturing Private Ltd.
2011 Nifco established a factory in Jiangsu and Yancheng, China
Nifco established PT. Nifco Indonesia.
2012 Nifco established Nifco Central Mexico S. de R. L. de C.V.
2013 Nifco opened Nifco Technology Development Centre.
Nifco acquired KTS group in Germany.
2014 Nifco acquired KTW group in Germany.
2015 Nifco Head Quarters moved to Yokosuka.
Nifco established Nifco KTW America Corporation in USA.
Nifco established Nifco Chongqing in China.
Company History
Contents
010_0594001372808.indd 3 2016/08/12 9:34:23

Japanese Yen (millions)(except per share amounts)
US Dollars (thousands)(except per share amounts)
2016 2015 2016
FOR THE YEAR
Net sales ¥265,684 ¥225,416 $2,357,863
Operating income 27,574 20,975 244,711
Profit attributable to owners of parent 17,742 12,902 157,455
Profit attributable to owners of parent per share 346.49 244.04 3.08
Dividend per share 105.00 80.00 0.93
AT YEAR-END
Number of outstanding shares (thousands) 50,703 52,896 50,703
Net assets 124,365 128,308 1,103,701
US dollar amounts represent translation of Japanese yen, for convenience only, at the rate of ¥112.68 to US$1.00. In calculating net income per share, net income is adjusted by the interest expenses on the convertible bonds when such bonds are dilutive. The number of outstanding shares shown is adjusted for shares which the Company holds as treasury stock.
Financial Highlights
2013 2014 2015 2016
Net Sales (100 million yen)
1,399
1,851
2,254
2,656
2013 2014 2015 2016
Operating Income and Operating Profit Ratio(100 million yen)(%)
105
157
209
7.58.5
9.3
2013 2014 2015 2016
Profit Attributableto Owners of Parent (100 million yen)
53
97
129
177
2013 2014 2015 2016
Total Assets/Net Assets(100 million yen)
8951,077
1,787
2,184
2,657
1,283
2,788
1,243
275
10.4
ANNUAL REPORT 2016
01
010_0594001372808.indd 1 2016/08/12 9:34:23
Message from the President
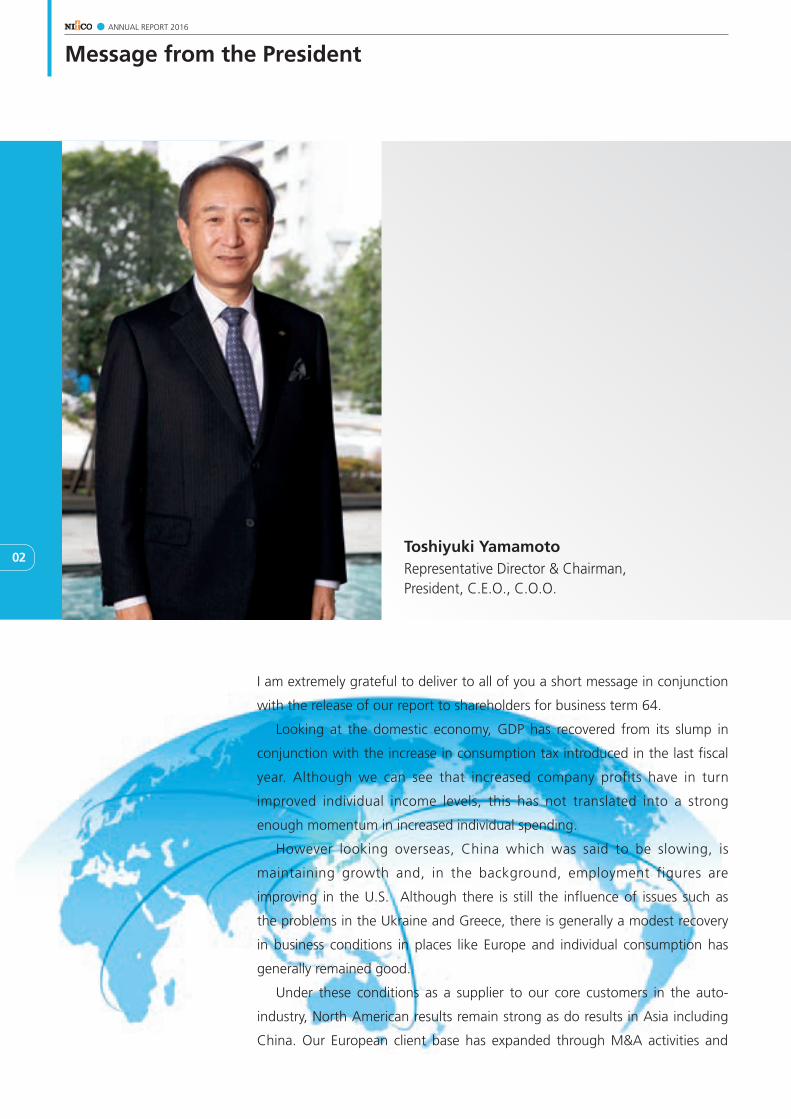
Toshiyuki YamamotoRepresentative Director & Chairman,President, C.E.O., C.O.O.
I am extremely grateful to deliver to all of you a short message in conjunction
with the release of our report to shareholders for business term 64.
Looking at the domestic economy, GDP has recovered from its slump in
conjunction with the increase in consumption tax introduced in the last fiscal
year. Although we can see that increased company profits have in turn
improved individual income levels, this has not translated into a strong
enough momentum in increased individual spending.
However looking overseas, China which was said to be slowing, is
maintaining growth and, in the background, employment figures are
improving in the U.S. Although there is still the influence of issues such as
the problems in the Ukraine and Greece, there is generally a modest recovery
in business conditions in places like Europe and individual consumption has
generally remained good.
Under these conditions as a supplier to our core customers in the auto-
industry, North American results remain strong as do results in Asia including
China. Our European client base has expanded through M&A activities and
ANNUAL REPORT 2016
02
010_0594001372808.indd 2 2016/08/12 9:34:24

has also brought increased business results. As such Nifco Group as a whole
has maintained a robust business performance.
In the midst of domestic automakers’ production output levels in FY2015
of 95.8 % which was a drop on 2014, Nifco has managed to increase the
product loading for new vehicles and as a result has maintained a slightly
stronger business pace on the previous year.
As a result, consolidated net sales were 265, 684 million yen (up 17.9%
year on year). Although there was an increase in our costs to expand our
production capacity, we increased our marginal profit through increased sales
and continued with various cost reduction activities. As such we achieved an
operating income of 27, 574 million yen (up 31.5% year on year). Ordinary
income was 26,374 million yen (up 27.9% year on year) and profit attributable
to owners of parent was 17,742 million yen (up 37.5%) year on year.
I thank all shareholders for their continued understanding and support to
Nifco Group.
About Nifco’s Global Expansion
Nifco first started its global expansion in 1983 advancing to Taiwan. Currently
it has operations throughout Asia, North America and Europe totaling 16
countries. This is in order to be able to supply to our main clients developing
overseas’ operations and to be a direct on-location-parts-provider for them.
In addition Nifco has recently been expanding its client base beyond
Japanese auto-makers. To this end Nifco’s German and Korean subsidiaries
have established new plants in the U.S. and China respectively.
Return to Shareholders
It is one of Nifco’s basic policies to give a return to shareholders in the form of
dividends. As of the end of March 2016 the mid-term dividend result was 45
yen and the end term result was 60 yen giving a total dividend return of 105
yen for the fiscal period. Furthermore, Nifco shareholders with more than
1,000 shares as of March 31st 2016 received Inaniwa wheat noodles.
In addition, to further encourage continued stable shareholder investment,
a new shareholder benefit has been added. Shareholders who have held 1,000
shares and more for 3 years or more will also receive a 500 yen Quo card.
03
010_0594001372808.indd 3 2016/08/12 9:34:27
Financial Review
1. Business Results
(1) Analysis of Business Results
Taking an overview of economic conditions during the fiscal year under review,
Japan’s economy returned to a recovery track against the backdrop of a decline
in GDP, which resulted from a consumption tax hike last fiscal year. Individual
income increased on the back of an improved profit in the corporate sector,
although there was insufficient momentum to boost consumer spending.
Overseas, although economies in resource-rich countries stalled, affected
by falling crude oil prices, consumer spending was generally steady in China as
the economy continued to expand, although the rate of growth slowed; an
improvement in employment conditions continued to boost the U.S. economy;
and, the economy of Europe overcame the Ukrainian and Greek crises.
Under these circumstances, the performance of automobile manufacturers,
the Nifco Group’s major customers, was generally robust overseas, including
ongoing strong performance in North America, growth in Asia and China, and
expansion in Europe, where the customer base expanded due to the impacts of
M&As. In Japan’s market, meanwhile, domestic production of automobiles by
Japanese automobile manufacturers, the Nifco Group’s major customers, fell to
below the previous year’s level in 2015 (95.8% of the previous year), but Nifco
was able to achieve a performance slightly exceeding that of the previous fiscal
year because it succeeded in raising the delivery prices of products mounted in
new model vehicles.
As a result, the consolidated net sales of the Nifco Group during the fiscal
year under review increased by 17.9% year on year to 265,684 million yen. On
the profit front, although there was an increase in costs to boost production
capacity, operating income for the period under review grew 31.5% year on
year to 27,574 million yen, as a result of an increase in marginal profit with
growth in sales and cost-reduction activities. Ordinary income rose 27.9% year
on year to 26,374 million yen because net non-operating expenses increased
due to exchange losses on foreign currency-denominated assets affected by an
appreciation of yen from January to March 2016. Profit attributable to owners
of parent surged 37.5% year on year to 17,742 million yen, due to an increase
in operating income, although the Company posted an impairment loss on
domestic idle assets of 470 million yen under extraordinary losses.
Business results by main business segment are as follows.
(i) Industrial Plastic Parts and Components Business
[For domestic automobile industry]
Domestic automobile production declined significantly from the previous
fiscal year, due to a temporary suspension of production by certain Japanese
automobile manufacturers and a slump in sales of light vehicles. Accordingly,
the Company’s domestic sales to automobile manufacturers struggled, but
overall sales increased as the Company succeeded in raising delivery prices
of products per vehicle mounted in new model vehicles and sales of parts
for automobiles for export increased.
[For overseas automobile industry]
Regarding earnings of Nifco’s overseas consolidated subsidiaries, sales were
robust at Japanese and Korean automobile manufacturers and continued
to grow significantly in North America and China. In Europe, due to syner-
gies from the acquisition of KTS and KTW German-based automobile parts
companies, which started to have some impact in the previous year and
contributed fully during the fiscal year under review, the Nifco Group
succeeded in supplying products globally through an expanded customer
base and product portfolio, and expand new products outside Europe
through its sales channels.
Consequently, sales grew sharply and profits also increased significantly
as the impacts of performance improvements at our major production bases
absorbed the negative impact of the yen’s appreciation from the beginning
of 2016.
In the U.S., the Company established a third subsidiary in response to
the expansion of overseas production by customers, aimed at expanding
the global production system.
[For other industries]
In other industries, anticipating the advent of an full-blown aged society,
the Nifco Group particularly strives to develop products that can contribute
to reducing the difficulties the elderly face in their homes and to create a
comfortable living environment, in order to offer and expand sales of those
products to builders and users.
As a result of the above, consolidated sales from the industrial plastic parts
and components business amounted to 239,185 million yen (up 18.5%
year on year). Segment income was 29,591 million yen (up 29.4% year on
year) due largely to the increase in marginal profits as a result of the increase
in sales and activities to reduce costs by enhancing production efficiency.
(ii) Bedding and Furniture Business
Nifco’s subsidiary, Simmons Co., Ltd., and Asian subsidiaries of Simmons
manufacture and sell high-quality beds in Japan and other parts of Asia.
The Nifco Group’s business brand strategy of pursuing high-quality beds
has succeeded and sales expanded in both Japan and Asia. As a result, sales
increased 12.9% year on year to 23,998 million yen and segment income
grew 9.3% year on year to 3,479 million yen.
(iii) Other Businesses
Nifco’s other business activities center on the newspapers and publishing
business that is operated by the Japan Times Ltd., its subsidiary. The news-
paper and publishing business has continued to face a challenging business
environment due to the diversification of media. Under the circumstances,
sales amounted to 2,501 million yen (up 4.8% year on year) and segment
loss was 19 million yen (segment loss of 167 million yen in the previous
fiscal year). Nifco will continue making group-wide efforts to reduce costs.
[Earnings outlook for FY2016]
Looking forward to the state of the economy, while it is generally expected
to continue a modest recovery due to the steady recovery of economies in
developed countries, focusing on the U.S., there are increasing concerns
over slowdowns of economies of emerging nations and uncertainty over
Japan’s economy.
Under such an economic environment, considering expected sales
growth and the latest foreign exchange quotations, Nifco projects net
sales of 250 billion yen, operating income of 27.6 billion yen, ordinary
income of 26.5 billion yen, and profit attributable to owners of parent of
16.5 billion yen.
Nifco assumed exchange rates of 105 yen to the US dollar and 125
yen to the euro when creating its earnings outlook for FY2016 ending
March 31, 2017.
*Cautions to be taken when utilizing earnings projections
Forward-looking statements or projections are based on the judgment of the
management of the Company based on currently available information, and
include latent risks and uncertainties. Please note that actual results may
differ greatly from the forecast figures depending on various factors.
ANNUAL REPORT 2016
04
010_0594001372808.indd 4 2016/08/12 9:34:27

(2) Analysis of Financial Status(Unit: Millions of yen)
FY2015 FY2014 ChangeTotal assets ¥278,871 ¥265,752 ¥13,119Shareholders’ equity 121,245 125,227 (3,982)Net assets ratio (%) 43.5 47.1 -3.6p
(Unit: Millions of yen)
FY2015 FY2014 ChangeCash flows from operating activities ¥ 33,845 ¥ 22,798 ¥11,047Cash flows from investing activities (32,500) (22,975) (9,525)Cash flows from financing activities 2,107 9,820 (7,713)Translation gains and losses (1,846) 2,238 (4,084)Increase/decrease in cash and cash
equivalents 1,606 11,881 (10,275)
Balance of cash and cash equivalents at the beginning of term 51,904 40,023 11,881
Balance of cash and cash equivalents at the end of term 53,510 51,904 1,606
Balance of borrowings and bonds payable at the end of term ¥100,028 ¥ 82,842 ¥17,186
Total assets increased by 13,119 million yen from the end of the previous fiscal
year to 278,871 million yen. This was mainly attributable to a growth in profit and
an increase in cash and cash equivalents and time deposits of 16,255 million yen
because funds raised of 20,076 million yen through issues of corporate bonds
absorbed all of the funds required for purchasing treasury stock of 10,487 million
yen and capital expenditures, which were partially offset by a decrease in invest-
ment securities of 2,583 million yen due to marked to market valuations of
foreign exchange translations.
Total liabilities rose by 17,062 million yen compared with the end of the
previous fiscal year to 154,506 million yen. This was mainly due to an increase of
20,082 million yen in new convertible bonds issued for the purchase of treasury
stocks and for investments, which were partially offset by decreases in long- and
short-term loans payable of 2,729 million yen and deferred tax liabilities of 1,375
million yen, resulting from mark to market valuations of investment securities.
Shareholders’ equity decreased 3,982 million yen from the end of the
previous term to 121,245 million yen. This decrease was chiefly due to the
purchase of treasury stock of 10,405 million yen and a decrease in foreign
currency translation adjustments of 5,047 million yen, mainly caused by the
yen’s appreciation against foreign local currencies, despite an increase in
retained earnings of 13,061 million yen.
As a result, the net assets ratio dropped 3.6 percentage points year-on-year
to 43.5%.
Cash flows from operating activities
Cash flows from operating activities increased 11,047 million yen compared
with the end of the previous term to 33,845 million yen. This was mainly due to
increased funds from profit before income taxes of 26,017 million yen and
depreciation of 14,950 million yen despite decreased funds from an increase in
trade receivables of 5,919 million yen with an increase in sales, and payment of
corporate taxes of 7,516 million yen.
Cash flows from investing activities
Cash flows used in investing activities decreased by 9,525 million yen in compar-
ison with the end of the previous fiscal year to 32,500 million yen. This was
primarily attributable to 21,858 million yen for capital expenditures in Japan
following consolidation of production and technologies and to acquire fixed
assets to enhance production facilities in North America, Hong Kong, and
China, and a net payment of 14,705 million yen from deposits and withdrawals
from term deposits.
Cash flows from financing activities
Cash flows from financing activities decreased by 7,713 million yen in compar-
ison with the end of the previous fiscal year to 2,107 million yen. This was
mainly due to the proceeds from short-term borrowings of 30,907 million yen,
although there were expenditures of 31,982 million yen for repayment of short-
term borrowings and of 4,677 million yen for dividend payment.
As a result of the above, the balance of cash and cash equivalents at the end of
this term increased by 1,606 million yen, compared to the end of the previous
term, to 53,510 million yen.
FY2015 FY2014 FY2013 FY2012 FY2011
Net assets ratio (%) 43.5 47.1 48.2 49.0 59.1
Net assets ratio based on market value (%) 98.4 82.5 70.5 65.7 88.8
Ratio of cash flows to interest-bearing liabilities (Year)
3.0 3.6 3.2 4.9 4.1
Interest coverage ratio (times) 37.1 29.1 33.7 21.6 20.9
Notes: Net assets ratio: shareholders’ equity / total assets
Net assets ratio based on capital value: market capitalization / total assets
Ratio of cash flows to interest-bearing liabilities: interest-bearing liabilities / cash flows
Interest coverage ratio: cash flows / interest payment
*All indicators are calculated based on consolidated financial figures.
* Market capitalization is obtained by multiplying the closing quotation at the end of the
term by the number of outstanding shares (after subtracting treasury stock) at the end of
the term.
* Cash flows from operating activities in the consolidated statement of cash flows are
used. Interest-bearing liabilities cover all liabilities which are posted in the consolidated
balance sheets and for which interest is paid. Interest paid posted in the consolidated
statement of cash flows are used as interest payment.
(3) Basic Policies for Profit Sharing and Dividends for this Term and the Following Terms
Nifco has set the payout ratio for the full year at a third (33%) of the consoli-
dated profit. Based on this basic policy, the Company decided to pay 60 yen per
share as the year-end ordinary dividend for the fiscal year ended March 31,
2016. As a result, the annual dividend per share including the interim dividend
of 45 yen per share will be 105 yen per share.
In the meantime, the dividend forecast for the next fiscal year, the interim
dividend is 50 yen, the year-end ordinary dividend is 55 yen, will be 105 yen
per share.
05
010_0594001372808.indd 5 2016/08/12 9:34:27
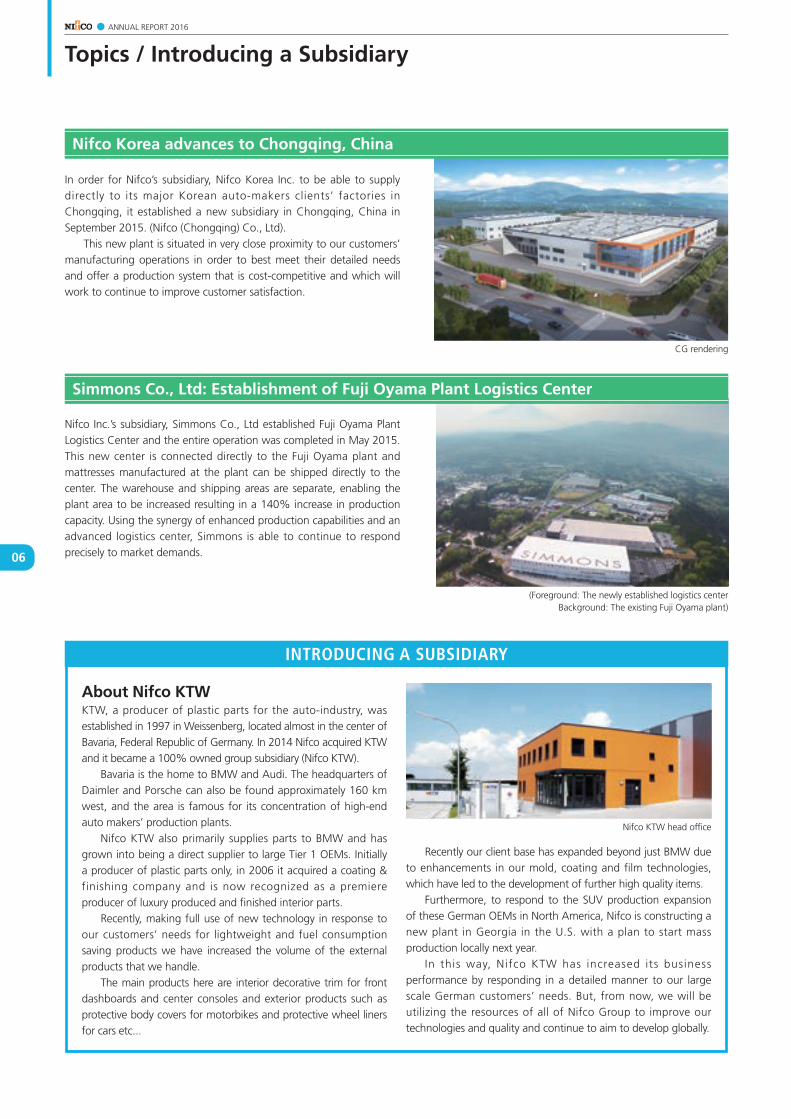
About Nifco KTWKTW, a producer of plastic parts for the auto-industry, was established in 1997 in Weissenberg, located almost in the center of Bavaria, Federal Republic of Germany. In 2014 Nifco acquired KTW and it became a 100% owned group subsidiary (Nifco KTW).
Bavaria is the home to BMW and Audi. The headquarters of Daimler and Porsche can also be found approximately 160 km west, and the area is famous for its concentration of high-end auto makers’ production plants.
Nifco KTW also primarily supplies parts to BMW and has grown into being a direct supplier to large Tier 1 OEMs. Initially a producer of plastic parts only, in 2006 it acquired a coating & finishing company and is now recognized as a premiere producer of luxury produced and finished interior parts.
Recently, making full use of new technology in response to our customers’ needs for lightweight and fuel consumption saving products we have increased the volume of the external products that we handle.
The main products here are interior decorative trim for front dashboards and center consoles and exterior products such as protective body covers for motorbikes and protective wheel liners for cars etc...
Recently our client base has expanded beyond just BMW due to enhancements in our mold, coating and film technologies, which have led to the development of further high quality items.
Furthermore, to respond to the SUV production expansion of these German OEMs in North America, Nifco is constructing a new plant in Georgia in the U.S. with a plan to start mass production locally next year.
In this way, Nifco KTW has increased its business performance by responding in a detailed manner to our large scale German customers’ needs. But, from now, we will be utilizing the resources of all of Nifco Group to improve our technologies and quality and continue to aim to develop globally.
In order for Nifco’s subsidiary, Nifco Korea Inc. to be able to supply directly to its major Korean auto-makers clients’ factories in Chongqing, it established a new subsidiary in Chongqing, China in September 2015. (Nifco (Chongqing) Co., Ltd).
This new plant is situated in very close proximity to our customers’ manufacturing operations in order to best meet their detailed needs and offer a production system that is cost-competitive and which will work to continue to improve customer satisfaction.
Nifco Inc.’s subsidiary, Simmons Co., Ltd established Fuji Oyama Plant Logistics Center and the entire operation was completed in May 2015. This new center is connected directly to the Fuji Oyama plant and mattresses manufactured at the plant can be shipped directly to the center. The warehouse and shipping areas are separate, enabling the plant area to be increased resulting in a 140% increase in production capacity. Using the synergy of enhanced production capabilities and an advanced logistics center, Simmons is able to continue to respond precisely to market demands.
Topics / Introducing a Subsidiary
CG rendering
Nifco KTW head office
(Foreground: The newly established logistics centerBackground: The existing Fuji Oyama plant)
Nifco Korea advances to Chongqing, China
Simmons Co., Ltd: Establishment of Fuji Oyama Plant Logistics Center
INTRODUCING A SUBSIDIARY
ANNUAL REPORT 2016
06
010_0594001372808.indd 6 2016/08/12 9:34:27

Five-Year SummaryFor the years ended March 31
(Japanese yen in millions/U.S. Dollars in thousands, except per share amounts)
2016 2015 2014 2013 2012
REVENUES AND EXPENSES:
Net sales ¥265,684 $2,357,863 ¥225,416 ¥185,167 ¥139,917 ¥122,880
Cost of sales 191,368 1,698,332 162,444 133,546 100,075 85,404
Selling, general and administrative expenses 46,742 414,820 41,997 35,902 29,292 27,235
Operating income 27,574 244,711 20,975 15,719 10,550 10,241
Other income (expenses), net (1,557) (13,818) (1,824) 1,071 107 (72)
Profit before income taxes 26,017 230,893 19,151 16,790 10,657 10,169
Income taxes 7,445 66,072 5,502 6,417 4,947 2,938
Non-controlling interests 830 7,366 747 602 361 377
Profit attributable to owners of parent 17,742 157,455 12,902 9,771 5,349 6,854
Comprehensive income 11,642 103,319 23,341 21,568 11,338 4,726
Profit attributable to owners of parent per share - basic 346.49 3.08 244.04 185.07 101.22 128.41
Profit attributable to owners of parent per share - diluted 325.08 2.88 - - - 128.41
FINANCIAL POSITION:
Working capital 104,771 929,811 90,347 72,139 58,655 51,108
Net property,plant and equipment 96,725 858,404 92,474 77,968 59,035 45,404
Total assets 278,871 2,474,894 265,752 218,428 178,776 134,887
Long-term indebtedness 86,793 770,261 68,371 48,650 32,825 21,968
Total net assets 124,365 1,103,701 128,308 107,783 89,539 81,202
OTHER DATA:
Cash dividends, applicable to the year 5,342 47,409 4,231 3,169 2,478 2,394
Cash dividends, per share 105.00 0.93 80.00 60.00 47.00 45.00
Net assets per share 2,391.26 21.22 2,367.40 1,993.72 1,661.36 1,504.22
Shares outstanding as of each balance sheet date 50,703,347 52,896,549 52,838,265 52,752,820 52,967,666
Capital expenditures 21,488 190,699 20,796 21,166 18,522 17,057
Depreciation 14,950 132,677 12,176 9,236 6,778 6,038
Number of employees as of each balance sheet date 10,591 10,069 9,041 7,979 6,437
ANNUAL REPORT 2016
07
010_0594001372808.indd 7 2016/08/12 9:34:27

Bedding and Furniture Business
Other Businesses
Nifco’s other business activities center on the newspapers and publishing business that is operated by the
Japan Times Ltd., its subsidiary. The newspaper and publishing business has continued to face a challenging
business environment due to the diversification of media. Under the circumstances, sales amounted to
2,501 million yen (up 4.8% year on year) and segment loss was 19 million yen (segment loss of 167 million
yen in the previous fiscal year). Nifco will continue making group-wide efforts to reduce costs.
Nifco’s subsidiary, Simmons Co., Ltd.,
and Asian subsidiaries of Simmons
manufacture and sell high-quality beds
in Japan and other parts of Asia. The
Nifco Group’s business brand strategy of
pursuing high-quality beds has succeed-
ed and sales expanded in both Japan
and Asia. As a result, sales increased
12.9% year on year to 23,998 million
yen and segment income grew 9.3%
year on year to 3,479 million yen.
Industrial Plastic Parts and Components Business
Nifco’s core business maintained a strong overseas performance in North America,
Asia and Europe, resulting in large gains in revenue and profit. Domestic automobile
production declined significantly from the previous fiscal year, due to a temporary
suspension of production by certain Japanese automobile manufacturers and a slump
in sales of light vehicles.
Accordingly consolidated sales amounted to 239,185 million yen (up 18.5%
year on year), and segment income was 29,591 million yen (up 29.4% year on
year).
Segment Information on a Consolidated Basis
Segment information on a consolidated basis Fasteners, Cup-holders, Dampers, Latches,Fuel-related components, Housing-related components, Buckles etc.
9.0% 1.0%90.0%
9.0% 1.0%90.0%
9.0% 1.0%90.0%
Bedding and Furniture Sales(100 million yen)
FY2013
FY2014
FY2015
Injection Molded Plastic Parts and Components Sales(100 million yen)
FY2013
FY2014
211
212
1,618
2,017
239
2,391FY2015
Bedding and Furniture Sales(100 million yen)
FY2013
FY2014
FY2015
Injection Molded Plastic Parts and Components Sales(100 million yen)
FY2013
FY2014
211
212
1,618
2,017
239
2,391FY2015
ANNUAL REPORT 2016
08
010_0594001372808.indd 8 2016/08/12 9:34:27

Corporate Governance
The Company adopts the statutory auditor system and has a board of auditors. Following the annual shareholders’ meeting held on June 24th 2016 in line with the submission date of the Company’s Listed Securities Report, there are currently 6 directors (including 2 external directors) and 4 auditors (including 2 external auditors).
The board of directors is a decision-making body and also serves to formulate subsidiary company management strategy with a view to enhance performance results and strengthen not only growth but corporate governance as well.
In particular, Nifco believes that the inclusion of 2 external directors helps to offer independent and useful perspectives and insights at the board meetings thus helping to enhance and reinforce the Group’s corporate governance.
The board of directors has one regular meeting each month and special meetings when necessary. In fiscal 2015 the board of directors convened 12 times and the board of auditors convened 14 times.
There are also regular meetings of senior managers at the Company consisting of directors, auditors, executive officers and other senior managers usually held once a week at which relatively important issues and proposals that need not be put to the board of directors are deliberated and reported.
Furthermore in order to ensure that the dealings and decisions of directors are in compliance with the law and the Company’s arti-cles of incorporation and that the business of the group companies is run properly the following committees have been established and organized under the board of directors since 2007. These are the Risk Management Committee, the Internal Controls Committee, and with regards to financial reporting, the Compliance Committee and the Information Security Committee.
These committees promote corporate governance through their careful activities. In fiscal 2015 they met the following number of times:Risk Management Committee: 4 timesInternal Controls Committee: 3 timesCompliance Committee: 3 timesInformation Security Committee: 3 times
The Company’s executive directors bear responsibility for executing the Company’s business but the executive officer system was also introduced in order to make sure of a speedy and efficient business execution by delegating part of these executive directors’ responsi-bilities to the executive officers. To this end the board of directors is responsible for scrutinizing the execution of the work of repre-sentative directors and executive directors and also for scrutinizing the work of the executive officers.
NIFCO PRODUCT TRIVIA
Camera CoverNifco products are also used in automobile crash-avoidance
systems. One of these systems is DAIHATSU’s “Smart Assist II”
which is built into their “Cast” and “Move” and so on. The
Smart Assist II system consists of a camera, laser radar, and a
sonar sensor which function to alert drivers of possible colli-
sions and lane departures. The cover for this camera is
manufactured by Nifco. This cover protects the camera and
because it is made of resin, it also helps subdue any unwant-
ed noise when travelling. Also, this product can be fixed into
place with one-touch, meaning it can easily be removed for
maintenance. In this way, our products meet multiple needs
while contributing to improved automobile safety.
Parts of camera cover
Camera and camera cover which was manufactured by Nifco.
Cast ACTIVA of DAIHATSU
NIFCO PRODUCT TRIVIA
ANNUAL REPORT 2016
09
010_0594001372808.indd 9 2016/08/12 9:34:28

Consolidated Balance Sheets
AS OF MARCH 31, 2016 AND 2015
ASSETS Japanese Yen(millions)
U.S. Dollars(thousands)
2016 2015 2016
CURRENT ASSETS:
Cash and cash equivalents (Note 12) ¥ 53,510 ¥ 51,904 $ 474,885
Time deposits (Note 12) 17,008 2,359 150,941
Securities (Note 12, 13) 2,026 5,910 17,980
Trade receivables: (Note 12)
Notes 4,868 2,911 43,202
Electronically recorded monetary claims 6,600 6,009 58,573
Accounts 41,331 40,171 366,800
Less—Allowance for doubtful accounts (274) (211) (2,432)
Inventories (Note 3) 29,603 29,933 262,717
Deferred income taxes and other (Note 18) 6,921 8,423 61,423
Total current assets 161,593 147,409 1,434,089
PROPERTY, PLANT AND EQUIPMENT:
Land (Note 4, 6) 20,671 20,432 183,449
Buildings and structures (Note 6) 55,273 50,548 490,531
Machinery and equipment (Note 6, 11) 67,343 64,308 597,648
Molds and dies 66,744 63,787 592,332
Leased assets 2,557 2,842 22,693
Other 7,944 7,144 70,500
220,532 209,061 1,957,153
Less—Accumulated depreciation (123,807) (116,587) (1,098,749)
Net property, plant and equipment 96,725 92,474 858,404
INVESTMENTS AND OTHER ASSETS:
Investment securities (Note 12, 13) 6,415 8,998 56,931
Asset for retirement benefits (Note 15) 511 150 4,535
Goodwill 3,673 4,870 32,597
Deferred income taxes and other (Note 18) 9,954 11,851 88,338
Total investments and other assets 20,553 25,869 182,401
Total assets ¥ 278,871 ¥ 265,752 $ 2,474,894
ANNUAL REPORT 2016
10
010_0594001372808.indd 10 2016/08/12 9:34:28

AS OF MARCH 31, 2016 AND 2015
LIABILITIES AND NET ASSETS Japanese Yen(millions)
U.S. Dollars(thousands)
2016 2015 2016
CURRENT LIABILITIES:
Short-term borrowings (Note 12, 16) ¥ 10,345 ¥ 12,340 $ 91,809
Current portion of long-term indebtedness (Note 12, 17) 1,783 1,905 15,824
Current portion of bonds 1,107 226 9,824
Trade payables: (Note 12)
Notes 2,757 2,402 24,468
Accounts 19,871 19,290 176,349
Other payables (Note 12) 5,954 6,373 52,840
Accrued bonuses 1,445 1,474 12,824
Accrued income taxes (Note 12, 18) 2,901 2,373 25,745
Other 10,659 10,679 94,595
Total current liabilities 56,822 57,062 504,278
LONG-TERM LIABILITIES:
Long-term indebtedness (Note 12, 17) 86,793 68,371 770,261
Liability for retirement benefits (Note 15) 3,667 2,669 32,543
Deferred income taxes and other (Note 18) 7,224 9,342 64,111
Total long-term liabilities 97,684 80,382 866,915
NET ASSETS: (Note 19)
Shareholders’ equity
Common stock
Authorized—233,000,000 shares
Issued—53,754,477 shares 7,290 7,290 64,696
Capital surplus 11,868 11,758 105,325
Retained earnings 107,939 94,878 957,925
Treasury stock, at cost—3,051,130 shares in 2016 and
857,928 shares in 2015 (12,215) (1,810) (108,404)
Total shareholders’ equity 114,882 112,116 1,019,542
Accumulated other comprehensive income
Net unrealized gains on securities 797 2,354 7,073
Deferred gains on hedges 101 61 896
Land revaluation difference (Note 4) (93) (91) (825)
Foreign currency translation adjustments 6,542 11,589 58,058
Accumulated adjustments for retirement benefits (984) (802) (8,732)
Total accumulated other comprehensive income 6,363 13,111 56,470
Non-controlling interests 3,120 3,081 27,689
Total net assets 124,365 128,308 1,103,701
Total liabilities and net assets ¥278,871 ¥265,752 $2,474,894
The accompanying notes to consolidated financial statements are an integral part of these balance sheets.
11
010_0594001372808.indd 11 2016/08/12 9:34:28

FOR THE YEARS ENDED MARCH 31, 2016 AND 2015
Japanese Yen(millions)
U.S. Dollars(thousands)
2016 2015 2016
NET SALES ¥265,684 ¥ 225,416 $2,357,863COST OF SALES 191,368 162,444 1,698,332
GROSS PROFIT 74,316 62,972 659,531
SELLING, GENERAL AND ADMINISTRATIVE EXPENSES 46,742 41,997 414,820 OPERATING INCOME 27,574 20,975 244,711
OTHER INCOME (EXPENSES):Interest and dividends income 392 328 3,479 Gain (loss) on valuation of derivatives 473 (185) 4,198Exchange gain (loss) on foreign currency transactions (1,281) 356 (11,368) Interest expense (880) (899) (7,810)Gain on sales of property, plant and equipment 32 438 284 Gain on sales of investment securities 115 — 1,021Gain on liquidation of subsidiaries (Note 5) 50 — 444Loss on disposal of property, plant and equipment (80) (58) (710)Impairment loss of fixed assets (Note 6) (470) (87) (4,171)Loss on disaster (Note 7) — (736) —Business structure improvement expenses (Note 8) — (1,028) —Other income, net 92 47 815
PROFIT BEFORE INCOME TAXES 26,017 19,151 230,893
PROVISION FOR INCOME TAXES: (Note 18)Current 7,905 6,062 70,154 Income taxes for prior periods (Note 9) — (758) —Deferred (460) 198 (4,082)
PROFIT 18,572 13,649 164,821 PROFIT ATTRIBUTABLE TO NON-CONTROLLING INTERESTS (830) (747) (7,366)PROFIT ATTRIBUTABLE TO OWNERS OF PARENT 17,742 12,902 157,455 PROFIT ATTRIBUTABLE TO NON-CONTROLLING INTERESTS 830 747 7,366PROFIT 18,572 13,649 164,821
OTHER COMPREHENSIVE INCOME: (Note 10)Net unrealized gains on securities (1,557) 1,572 (13,818)Deferred gains on hedges 40 61 355Revaluation reserve for land (2) (5) (18)Foreign currency translation adjustments (5,242) 8,240 (46,521)Adjustments for retirement benefits (169) (176) (1,500)
COMPREHENSIVE INCOME ¥ 11,642 ¥ 23,341 $ 103,319
TOTAL COMPREHENSIVE INCOME ATTRIBUTABLE TO:Comprehensive income attribute to owners of the parent ¥ 10,994 ¥ 22,423 $ 97,568Comprehensive income attribute to non-controlling interests 648 918 5,751
Japanese Yen U.S. Dollars
PER SHARE AMOUNTS: (Note 20) 2016 2015 2016Profit attributable to owners of parent:
Basic ¥ 346.49 ¥ 244.04 $ 3.08Diluted 325.08 — 2.88
Cash dividends, applicable to the year 105.00 80.00 0.93
The accompanying notes to consolidated financial statements are an integral part of these statements
Consolidated Statements of Income and Comprehensive IncomeANNUAL REPORT 2016
12
010_0594001372808.indd 12 2016/08/12 9:34:28

FOR THE YEARS ENDED MARCH 31, 2016 AND 2015
Japanese Yen (millions)
Shareholders’ equityAccumulated other comprehensive
income
Non-controlling interests Total
Common stock
Capital surplus
Retained earnings
Treasury stock
Net unrealized gains on securities
Deferred gains on hedges
Land revaluation difference
Foreign currency
translation adjustments
Adjustments for retirement
benefits
Balance as of April 1, 2014 ¥7,290 ¥11,675 ¥ 84,726 ¥ (1,937) ¥ 782 ¥ — ¥(86) ¥ 3,541 ¥(646) ¥2,438 ¥107,783
Cumulative effects of changes in accounting policies 1,002 1,002
Restated balance 7,290 11,675 85,728 (1,937) 782 — (86) 3,541 (646) 2,438 108,785
Profit attributable to owners of parent 12,902 12,902
Dividends paid (3,752) (3,752)
Acquisition of treasury stock (1) (1)
Disposal of treasury stock 83 128 211
Net changes of items other than shareholders’ equity 1,572 61 (5) 8,048 (156) 643 10,163
Balance as of April 1, 2015 ¥7,290 ¥11,758 ¥ 94,878 ¥ (1,810) ¥ 2,354 ¥ 61 ¥(91) ¥11,589 ¥(802) ¥3,081 ¥128,308
Profit attributable to owners of parent 17,742 17,742
Dividends paid (4,681) (4,681)
Acquisition of treasury stock (10,487) (10,487)
Disposal of treasury stock 110 82 192
Net changes of items other than shareholders’ equity (1,557) 40 (2) (5,047) (182) 39 (6,709)
Balance as of March 31, 2016 ¥7,290 ¥11,868 ¥107,939 ¥(12,215) ¥ 797 ¥101 ¥(93) ¥ 6,542 ¥(984) ¥3,120 ¥124,365
U.S. Dollars (thousands)
Shareholders’ equityAccumulated other comprehensive
income
Non-controlling interests Total
Common stock
Capital surplus
Retained earnings
Treasury stock
Net unrealized gains on securities
Deferred gains on hedges
Land revaluation difference
Foreign currency
translation adjustments
Adjustments for retirement
benefits
Balance as of April 1, 2015 $64,696 $104,349 $842,012 $ (16,063) $ 20,891 $541 $(807) $102,849 $(7,117) $27,342 $1,138,693
Profit attributable to owners of parent 157,455 157,455
Dividends paid (41,542) (41,542)
Acquisition of treasury stock (93,069) (93,069)
Disposal of treasury stock 976 728 1,704
Net changes of items other than shareholders’ equity
(13,818) 355 (18) (44,791) (1,615) 347 (59,540)
Balance as of March 31, 2016 $64,696 $105,325 $957,925 $(108,404) $ 7,073 $896 $(825) $58,058 $(8,732) $27,689 $1,103,701
The accompanying notes to consolidated financial statements are an integral part of these statements.
Consolidated Statements of Changes in Net AssetsANNUAL REPORT 2016
13
010_0594001372808.indd 13 2016/08/12 9:34:28

FOR THE YEARS ENDED MARCH 31, 2016 AND 2015
Japanese Yen(millions)
U.S. Dollars(thousands)
2016 2015 2016
CASH FLOWS FROM OPERATING ACTIVITIES:Profit before income taxes ¥ 26,017 ¥ 19,151 $ 230,893 Adjustments to reconcile profit before income taxes to
net cash provided by operating activities:Depreciation 14,950 12,176 132,677 Amortization of goodwill 723 592 6,416 Increase (decrease) in allowance for doubtful accounts 162 46 1,438Increase (decrease) in accrued bonuses (23) (18) (204)Increase (decrease) in liability for retirement benefits 433 575 3,843Interest and dividends income (392) (328) (3,479)Interest expense 880 899 7,810 Exchange (gain) loss on foreign currency transactions 1,589 52 14,102Impairment loss of fixed assets 470 87 4,171Gain on sale of property, plant and equipment (32) (438) (284)Loss on disposal of property, plant and equipment 80 58 710Gain on sales of investment securities (115) — (1,021)(Increase) decrease in trade receivables (5,919) (4,033) (52,529)(Increase) decrease in inventories (751) (3,039) (6,665)(Increase) decrease in other assets (94) 94 (834)Increase (decrease) in trade payables 1,781 958 15,806Increase (decrease) in other liabilities 1,076 1,537 9,549Increase (decrease) in accrued consumption taxes 435 238 3,860Other, net 601 832 5,333
Subtotal 41,871 29,439 371,592
Interest income and dividends received 401 308 3,559 Interest paid (911) (783) (8,085)Income taxes paid (7,516) (6,166) (66,702)
Net cash provided by operating activities 33,845 22,798 300,364
CASH FLOWS FROM INVESTING ACTIVITIES:Increase in time deposits (60,556) (15,170) (537,416)Decrease in time deposits 45,851 20,153 406,913 Purchase of securities — (5,700) —Proceeds from sale and redemption of securities 5,869 6,097 52,086Purchase of property, plant and equipment (21,858) (21,026) (193,983)Proceeds from sale of property, plant and equipment 189 852 1,677 Purchase of investment securities (2,138) (163) (18,974)Proceeds from sale and redemption of investment securities 505 39 4,482 Purchase of investments in subsidiaries — (7,608) —Other, net (362) (449) (3,212)
Net cash used in investing activities (32,500) (22,975) (288,427)
CASH FLOWS FROM FINANCING ACTIVITIES:Proceeds from short-term borrowings 30,907 39,877 274,290 Repayments of short-term borrowings (31,982) (40,606) (283,830)Repayments of finance lease obligations (410) (439) (3,639)Proceeds from long-term indebtedness 1,928 19,986 17,110Proceeds from issuance of bonds 20,076 — 178,168Redemption of bonds (228) — (2,022)Repayments of long-term indebtedness (2,604) (4,928) (23,110)Proceeds from sale of treasury stock 192 211 1,704Purchase of treasury stock (10,487) (2) (93,069)Cash dividends paid (4,677) (3,751) (41,507)Cash dividends paid for non-controlling interest (608) (528) (5,396)
Net cash provided by financing activities 2,107 9,820 18,699EFFECT OF EXCHANGE RATE CHANGES ON CASH AND CASH EQUIVALENTS (1,846) 2,238 (16,383)NET INCREASE (DECREASE) IN CASH AND CASH EQUIVALENTS 1,606 11,881 14,253CASH AND CASH EQUIVALENTS AT BEGINNING OF YEAR 51,904 40,023 460,632CASH AND CASH EQUIVALENTS AT END OF YEAR ¥ 53,510 ¥ 51,904 $ 474,885
The accompanying notes to consolidated financial statements are an integral part of these statements.
Consolidated Statements of Cash FlowsANNUAL REPORT 2016
14
010_0594001372808.indd 14 2016/08/12 9:34:28

Notes to Consolidated Financial Statements
Company is evaluated at the fair value as of the respective dates when such shares were acquired. The amounts of assets and liabilities attributable to non-controlling shareholders of the subsidiary are determined using the financial statements of the subsidiary.
The excess of cost over the underlying net assets at acquisition dates of investments in subsidiaries and affiliates is recognized as goodwill and, is being amortized using the straight-line method over the period when investment effect appears.
(b) Equity Method Investments in affiliated companies are accounted for under the equity
method. Affiliated companies are defined as the companies of which the Company owns 20% to 50% of the voting rights, and the companies of which the Company has at least 15% and less than 20% of the voting rights in the cases where the Company has the ability to exercise signifi-cant influence over operating and financial policies of the investees.
Although the Company has 2 affiliates , the Company has applied the equity method to investment in 1 major affiliate (NICHIEI SEIKI CO.,LTD.) for the purpose of the consolidated financial statements for the year then ended since the remaining affiliate was not material.
(c) Securities Securities are classified into: (1) debt securities intended to be held to
maturity (hereinafter, “held-to-maturity securities”) or (2) all other securi-ties that are not classified as trading securities or in any of the above categories (hereinafter, “available-for-sale securities”).
Held-to-maturity securities are stated at amortized cost. Available-for-sale securities with market values are stated at market values,
and the corresponding unrealized gains or losses, net of applicable income taxes, are reported as a component of net assets. Realized gains and losses on sale of such securities are computed using average cost or moving-average cost. Other available-for-sale securities with no available market value are stated at cost, as determined by the moving average method, after taking devaluation into consideration, if any, for permanent impairment.
(d) Derivatives The Company employs derivative financial instruments and basically
recognizes the derivative instruments as assets or liabilities in the consol-idated balance sheets. Derivative financial instruments are initially recognized at cost and subsequently measured at fair value at the balance sheet date with movements recorded in the consolidated state-ments of income and comprehensive income.
(e) Inventories Inventories, except for molds and dies, are stated at cost (balance sheet
amount is calculated by writing down to reflect decrease in profitability) mainly by the periodic average method. Molds and dies, included in finished goods and work-in-process, are stated at cost (balance sheet amount is calculated by writing down to reflect decrease in profitability) by specific identification method.
(f) Property, Plant and Equipment (except for leased properties) Depreciation of property, plant and equipment except for leased prop-
erties is computed primarily by using the declining-balance method over their estimated useful lives. However, buildings acquired on or after April 1, 1998 are depreciated by using the straight-line method for the company and its domestic subsidiaries.
The useful lives for the years ended March 31, 2016 and 2015 are as follows:
2016 2015Buildings and structures 2-50 years 2-50 yearsMachinery and equipment 2-16 years 2-16 yearsMolds and dies 2-11 years 2-11 years
Ordinary maintenance and repairs are charged to the consolidated state-ments of income and comprehensive income as incurred. Major replacements and improvements are capitalized. When properties are retired or otherwise disposed of, the property and related accumulated depreciation accounts are relieved of the applicable amounts and any differences are included in other income (expenses).
1. BASIS OF PRESENTATION OF THE CONSOLIDATED FINANCIAL STATEMENTS
The accompanying consolidated financial statements have been prepared in accordance with the provisions set forth in the Japanese Financial Instruments and Exchange Act and its related accounting regulations, and in conformity with accounting principles generally accepted in Japan (hereinafter ,“Japanese GAAP”), which are different in certain respects as to application and disclosure requirements of International Financial Reporting Standards. The accounts of consolidated foreign subsidiaries are prepared in accor-dance with either International Financial Reporting Standards or U.S. generally accepted accounting principles, with adjustments for the specified four items as applicable.The accompanying consolidated financial statements have been restructured and translated into English from the consolidated financial statements of Nifco Inc. (hereinafter , “the Company”) and its consolidated subsidiaries prepared in accordance with Japanese GAAP and filed with the appropriate Local Finance Bureau of the Ministry of Finance as required by the Financial Instruments and Exchange Act.Certain supplementary information included in the statutory Japanese language consolidated financial statements, but not required for fair presentation, is not presented in the accompanying consolidated financial statements. The translations of the Japanese yen amounts into U.S. dollars are included solely for the convenience of readers outside Japan, using the prevailing exchange rate at March 31, 2016, which was ¥112.68 to US$1.00.The convenience translations should not be construed as representations that the Japanese yen amounts have been, could have been, or could in the future be, converted into U.S. dollars at this or any other rate of exchange.
2. SUMMARY OF SIGNIFICANT ACCOUNTING POLICIES
(1) Changes in Accounting Policies(a) Application of Accounting Standard, etc. for Business Combination The Company and its domestic subsidiaries adopted “Revised Accounting
Standard for Business Combinations” (ASBJ Statement No.21, September 13, 2013 (hereinafter, “Statement No.21”)), “Revised Accounting Standard for Consolidated Financial Statements” (ASBJ Statement No.22, September 13, 2013 (hereinafter, “Statement No.22”)) and “Revised Accounting Standard for Business Divestitures” (ASBJ Statement No.7, September 13, 2013 (hereinafter, “Statement No.7”)) (together, the “Business Combination Accounting Standards”), from the current fiscal year. As a result, the Company changed its accounting policies to recognize in capital surplus the differences arising from the changes in the Company’s ownership interest of subsidiaries over which the Company continues to maintain control and to record acquisition related costs as expenses in the fiscal year in which the costs are incurred. In addition, the Company changed its accounting policy for the reallocation of acquisition costs due to the completion following provisional accounting to reflect such reallocation in the consolidated financial state-ments for the fiscal year in which the business combination took place. The Company also changed the presentation of net income and the term “non-controlling interests” is used instead of “minority interests”. Certain amounts in the prior year comparative information were reclassi-fied to conform to such changes in the current year presentation.
With regard to the application of the Business Combination Accounting Standards, the Company followed the provisional treatments in article 58-2 (4) of Statement No.21, article 44-5 (4) of Statement No.22 and article 57-4 (4) of Statement No.7 with application from the beginning of the current fiscal year prospectively.
There is no effect on the consolidated financial statements of the current fiscal year.
(2) Significant Accounting Policies(a) Principles of Consolidation The consolidated financial statements include the accounts of the Company
and those of its majority-owned subsidiary companies. All significant inter-company transactions and accounts are eliminated in consolidation.
In the elimination of investments in subsidiaries, the portion of assets and liabilities of a subsidiary attributable to the subsidiary’s shares acquired by the
ANNUAL REPORT 2016
15
010_0594001372808.indd 15 2016/08/12 9:34:28

Notes to Consolidated Financial Statements
(g) Software Costs (except for leased properties) The Company and its consolidated domestic subsidiaries amortize soft-
ware except for leased properties for internal use using the straight-line method over its estimated useful life (5 years).
(h) Leased properties Depreciation expense is computed using the straight-line method over
the lease term assuming no residual value.
(i) Allowance for doubtful accounts The Company and its consolidated subsidiaries provide an allowance for
doubtful accounts in an amount sufficient to cover possible losses on collection by estimating individually uncollectible amounts and applying a percentage based on collection experience to the remaining accounts.
(j) Accrued bonuses Accrued bonuses are provided at an expected payment amount of the
bonuses to employees attributable to the fiscal year.
(k) Severance and Retirement Benefits Under Japanese accounting standards, the liabilities and expenses for
employees’ severance and retirement benefits are determined based on the amounts actuarially calculated using certain assumptions.
The Company and its consolidated subsidiaries provided an allowance for employees’ severance and retirement benefits at March 31, 2016 and 2015 based on the estimated amounts of projected benefit obliga-tion and the fair value of the plan assets at that date.
Prior service cost is amortized by the straight-line method over a period of 5 years, which is less than the estimated average remaining service period of employees.
Actuarial gains and losses are amortized by the straight-line method from the year or the following year in which they occur over a period of 5-10 years, which is less than the estimated remaining service period of employees. Certain consolidated subsidiaries recognize actuarial gains or losses in the year in which they occur.
Some consolidated subsidiaries use a simplified method in calculating the retirement benefit obligations.
Unrecognized actuarial gains and losses and unrecognized prior service costs are recorded as accumulated adjustments for retirement benefits in total accumulated other comprehensive income within the net assets section of the consolidated balance sheets, after adjusting for tax effects.
(l) Foreign Currency Translation All short-term and long-term monetary receivables and payables denom-
inated in foreign currencies are translated into Japanese yen at the exchange rates at the balance sheet date. The foreign exchange gains and losses from translation are charged to income. The financial state-ments of the Company’s consolidated foreign subsidiaries are translated into Japanese yen at the current rates for assets and liabilities and histor-ical rates for shareholders’ equity accounts. The resulting foreign currency translation adjustments are included in “Foreign currency trans-lation adjustments” and “Non-controlling interests” in the net assets section of the accompanying consolidated balance sheets.
(m) Hedge Accounting If derivative financial instruments are used as hedges and meet certain
hedging criteria, the Company and its subsidiaries defer recognition of the gain or loss resulting from a change in fair value of the derivative financial instrument until the related loss or gain on the hedged item is recognized.
However, in cases where forward foreign exchange contracts are used as hedges and meet certain hedging criteria, forward foreign exchange contracts and hedged items are accounted for in the following manner:
(1) If a forward foreign exchange contract is executed to hedge an existing foreign currency receivable or payable, (a) the difference, if any, between the Japanese yen amount of the hedged foreign currency receivable or payable translated using the spot rate at the inception date of the contract and the book value of the receivable or payable is recognized in the consolidated statements of income
and comprehensive income in the period which includes the incep-tion date, and (b) the discount or premium on the contract (that is, the difference between the Japanese yen amount of the contract translated using the contracted forward rate and that translated using the spot rate at the inception date of the contract) is recog-nized over the term of the contract.
(2) If a forward foreign exchange contract is executed to hedge a future transaction denominated in a foreign currency, the future transaction will be recorded using the contracted forward rate, and no gain or loss on the forward foreign exchange contract will be recognized.
Also, if interest rate swap contracts are used as hedges and meet certain hedging criteria, the net amount to be paid or received under the interest rate swap contract is added to or deducted from the interest on the assets or liabilities for which the swap contract was executed.
(n) Cash and Cash Equivalents Cash and cash equivalents include cash on hand, readily available
deposits and short-term highly liquid investments with original maturi-ties of three months or less.
(o) Consolidated Tax Return System The Company and certain domestic subsidiaries have adopted the
consolidated tax return system in Japan.
(p) Income Taxes Deferred tax assets or liabilities are computed based on the differences
between the financial statement and income tax basis of assets and liabilities using the enacted marginal tax rate. The provision for income taxes is computed based on the pretax income for financial reporting purposes and included in the consolidated statements of income and comprehensive income.
(q) Research and Development Expenses relating to research and development activities have been
charged to consolidated statements of income and comprehensive income as incurred and amounted to ¥3,111 million ($27,609 thousand) and ¥2,733 million for the years ended March 31, 2016 and 2015, respectively.
(r) Reclassification Certain prior year amounts have been reclassified to conform to the
current year presentation. These changes had no impact on previously reported results of operations or retained earnings.
(s) Accounting Standards Issued but Not Yet Adopted (Revised Implementation Guidance on Recoverability of Deferred Tax Assets) • “Revised Implementation Guidance on Recoverability of Deferred Tax
Assets” (ASBJ Guidance No. 26, March 28, 2016 (hereinafter, “Guidance No.26”)
(1) OverviewFollowing the framework in Auditing Committee Report No. 66 “Audit Treatment regarding the Judgment of Recoverability of Deferred Tax Assets”, which prescribes estimation of deferred tax assets according to the classification of the entity by one of five types, the following treatments were changed as necessary:1. Treatment for an entity that does not meet any of the criteria in
types 1 to 5;2. Criteria for types 2 and 3;3. Treatment for deductible temporary differences which an entity
classified as type 2 is unable to schedule; 4. Treatment for the period which an entity classified as type 3 is
able to reasonably estimate with respect to future taxable income before consideration of taxable or deductible tempo-rary differences that exist at the end of the current fiscal year; and
5. Treatment when an entity classified as type 4 also meets the criteria for types 2 or 3.
ANNUAL REPORT 2016
16
010_0594001372808.indd 16 2016/08/12 9:34:28

(2) Effective date Effective from the beginning of the fiscal year ending March 31, 2017
(3) Effects of application of the Guidance The Company and its consolidated domestic subsidiaries are currently
in the process of determining the effects of these new standards on the consolidated financial statements.
(t) Additional Information The Company delivers the Company’s own stock to the employees’
stock holding association through the trusts for the purpose of employees’ benefit.
(1) Overview of the transaction The Company has introduced an “Employee Stock Ownership
Incentive Plan” (hereinafter the “Plan”). The purpose of this Plan is to improve benefits for the employees and give them incentives to increase corporate value by returning profit on stock price rises to all members of the “Nifco employees’ Stock Ownership” (herein-after “the Stock Ownership”).
Under the Plan, the Employee Stock Ownership Trust (hereinafter “the Trust”) was established for the purpose of securing the Company’s stocks for the Stock Ownership to purchase. The Trust acquires the same amounts of stocks at the start of the Plan as the Stock Ownership will purchase in the future several years and sell off the stocks to the Stock Ownership continually in accordance with a certain plan.
Additionally, as the Company grants a guarantee to the Trust on the bank loans for purchasing the Company’s stock, the Company is liable for repayment of such debt pursuant to the guarantee agreement. The guarantee agreement stipulates that the Company guarantees repay-ment of debt at the end of the term of the Trust, which, in case, is equivalent to an accumulated loss on sale of stock due to a decline in stock price.
(2) The Company adopted “Practical Solution on Transactions of Delivering the Company’s Own Stock to Employees etc. through Trusts” (Practice Issue Task Force No.30, March 26, 2015 (herein-after, “PITF No.30”)), from the fiscal year ended March 31, 2012. The Company continues to apply the accounting rules and proce-dures that were applied before adopting PITF No.30.
(3) Company’s own stock in the trusts 1. The carrying amount in the trusts for the fiscal years ended March
31, 2016 and 2015 is JPY 391 million and JPY 473 million, respec-tively. The Company’s own stock in the trusts is recognized as treasury stock in shareholders’ equity.
2. The number of shares at the end of the fiscal year ended March 31, 2016 and 2015 are 179,300 and 217,000, respectively. The average number of shares for the fiscal years ended March 31, 2016 and 2015 are 197,869 and 244,500, respectively. The number of shares at the end of the fiscal year and the average number of shares are included in treasury stock that is deducted in computing earnings per share.
3. INVENTORIESInventories as of March 31, 2016 and 2015 consist of the following:
Japanese Yen(millions)
U.S. Dollars(thousands)
2016 2015 2016Finished goods and merchandise ¥19,035 ¥18,948 $168,929 Work-in-process and raw materials 10,568 10,985 93,788
Total ¥29,603 ¥29,933 $262,717
4. LAND REVALUATION DIFFERENCEIn accordance with the Partial Revision to the Land Revaluation Law (Law No. 34, enacted on March 31, 1998, hereinafter, “the Law”), land owned by a certain consolidated subsidiary for business use was revaluated as of March 31, 2002. Unrealized losses on the revaluation of the land are included in net assets as “Land revaluation difference”. Deferred taxes of unrealized losses are included in “Deferred income taxes and other” under investments and other assets in the consolidated balance sheets as of March 31, 2016 and 2015. According to the Law, the Company and its consolidated subsidiaries are not permitted to revalue the land after April 1, 2002.
5. GAIN ON LIQUIDATION OF SUBSIDIARIESGain on liquidation of subsidiaries was due to the liquidation of Nifco
Enterprise Management (Shanghai) Co.,Ltd.
6. IMPAIRMENT LOSS OF FIXED ASSETSIn the fiscal year ended March 31, 2016, the Company recorded an impair-ment loss on the following asset.
Location Use Type of asset
Nifco Inc.Utsunomiya Plant Idle assets Buildings and structures
Land
The Company and consolidated subsidiaries’ business assets for internal use are grouped by the unit of office or consolidated subsidiary, and lease proper-ties and assets to be disposed (idle assets) are grouped by individual property.For certain asset groups whose book value considerably declined against fair value due to change of plan to use Utsunomiya Plant for fiscal year 2015, the Company reduced the book value of certain assets to the recoverable amount and recognized the decline as impairment loss.The recoverable amounts of idle assets were measured at the net selling price, estimated based on appraisal value and other items.The impairment loss by each category of property, plant and equipment is as follows:
Japanese Yen(millions)
U.S. Dollars(thousands)
2016Buildings and structures ¥ 91 $ 808Land 379 3,363
Total ¥470 $4,171
In the fiscal year ended March 31, 2015, the Company recorded an impair-ment loss on the following asset.
Location Use Type of asset
Nifco Inc. Utsunomiya Plant
Industrial plastic parts and components business
Buildings and structures
The Company and consolidated subsidiaries’ business assets for internal use are grouped by the unit of office or consolidated subsidiary, and lease proper-ties and assets to be disposed (idle assets) are grouped by individual property.The impairment loss by each category of property, plant and equipment is as follows:
Japanese Yen(millions)
2015Buildings and structures ¥87
Total ¥87
17
010_0594001372808.indd 17 2016/08/12 9:34:29
7. LOSS ON DISASTERLoss on disaster was due to fire breaking out at the plant of Nifco Korea Poland. Sp. z o.o., a consolidated subsidiary of the Company, and the cost of repairs from damage caused by the fire were recorded.
8. BUSINESS STRUCTURE IMPROVEMENT EXPENSES
Business structure improvement expenses were recorded in association with the cost of implementing the special career change assistance program targeting employees as part of measures of the structural improvement of domestic businesses.
9. INCOME TAXES FOR PRIOR PERIODSIncome taxes for prior periods for the year ended March 31, 2015 were primarily due to the refunds resulting from the reversal of taxation from the Tokyo Regional Taxation Bureau regarding the Anti-Tax Haven Rules.
10. COMPREHENSIVE INCOMEAmounts reclassified to profit attributable to owners of parent in the current period that were recognized in other comprehensive income in the current or previous periods and tax effects for each component of other comprehensive income for the years ended March 31, 2016 and 2015 are as follows:
Japanese Yen(millions)
U.S. Dollars(thousands)
2016 2015 2016Net unrealized gains on securities
Increase during the year ¥(2,211) ¥2,259 $(19,622)Reclassification adjustments (115) — (1,021)
Sub-total, before tax (2,326) 2,259 (20,643)Tax expense 769 (687) 6,825
Sub-total, net of tax (1,557) 1,572 (13,818)Deferred gains on hedges
Increase during the year ¥52 ¥78 $461Sub-total, before tax 52 78 461
Tax expense (12) (17) (106)Sub-total, net of tax 40 61 355
Land revaluation differenceTax expense ¥(2) ¥(5) $ (18)
Foreign currency translation adjustments
Increase during the year ¥(5,120) ¥8,260 $(45,438)Reclassification adjustment (50) — (444)
Sub-total, before tax (5,170) 8,260 (45,882)Tax expense (72) (20) (639)
Sub-total, net of tax (5,242) 8,240 (46,521)Adjustments for retirement benefits
Increase during the year ¥ (579) ¥ (362) $ (5,138)Reclassification adjustments 279 191 2,476
Sub-total, before tax (300) (171) (2,662)Tax expense 131 (5) 1,162
Sub-total, net of tax (169) (176) (1,500)Total other comprehensive income ¥(6,930) ¥9,692 $(61,502)
11. LEASESInformation as lesseeFuture non-cancelable operating leases payments for the years ended March 31, 2016 and 2015 are as follows:
Japanese Yen(millions)
U.S. Dollars(thousands)
2016 2015 2016Non-cancelable operating leases:
Due within one year or less ¥1,082 ¥ 668 $ 9,602Due after one year 2,078 1,841 18,442
¥3,160 ¥2,509 $28,044
12. FINANCIAL INSTRUMENTSA. Qualitative information on financial instruments (1) Policies for using financial instruments
The Company and its consolidated subsidiaries use bank borrowings and bond issuances mainly for the purpose of capital expenditures. Saving accounts are mainly used for the purpose of short-term working capital. Bonds and time deposits are mainly used for the long-term working capitals. The derivative transactions have the purpose of mitigating future risk shown in the following, and the speculative purposes are prohibited.
(2) Details of financial instruments used and the exposures to risk and how they ariseTrade receivables are exposed to credit risk in relation to customers. In addition, foreign currency trade receivables are exposed to the risk of fluctuation in foreign currency exchange rate.Securities, which mainly consist of held-to-maturity securities, bonds, shares relating to the business relationship and investments for partner-ship and so on, are exposed to the risk of fluctuation in market value.Most of trade and other payables have maturity for payment within one year. In addition, foreign currency payables are exposed to the risk of fluctuation in foreign currency exchange rates.Borrowings and long-term indebtedness are mainly for the purpose of capital expenditures. The longest maturity contract is 19 years as of March 31, 2016. In addition, the Company and its consolidated subsidiaries use derivative transactions (currency swap, interest rate swap) for the purpose of mitigating the risk of floating interest rates.Derivative transactions are currency option contracts and currency swap contracts for the purpose of mitigating future risk of fluctuation in foreign currency exchange rates related to foreign currency receiv-ables or payables, and interest rate swap contracts for the purpose of mitigating the risk of floating interest rates related to borrowings. The details of hedging transactions are as shown in Note 14.
(3) Policies and processes for managing the riskCredit risk
The Company and its consolidated subsidiaries manage the trade receivables periodically by monitoring the condition for main customers, and managing the term and balance sorted by customer for the purpose of controlling and mitigating the credit risk related to deterioration of the financial condition.The contracts of derivative transactions are limited to the contracts with high rating financial institutions for the purpose of mitigating credit risk.
Market riskThe Company and its consolidated subsidiaries use currency option contracts and currency swap contracts and so on, as derivative financial instruments only for the purpose of mitigating future risks of fluctuation in foreign currency exchange rates with respect to existing foreign currency trade receivables or payables. The Company and its consolidated subsidiaries also use interest rate swap contracts, only for the purpose of mitigating the risk of floating interest rate related to borrowings.Securities are periodically monitored considering the fair value or the financial condition of the issuers. In addition, securities except held-to-maturity securities are continually managed considering the market circumstance or relationship with counterparty.The derivative transactions are executed and managed by the person in charge authorized by the Company’s Finance Department.
Liquidity riskThe Company and its consolidated subsidiaries manage liquidity risks by creating and updating its financing plans on a timely basis.
(4) Supplemental information on fair valuesThe fair values of financial instruments include market prices or reason-ably estimated values if there are no market values. Because estimation of fair values incorporates variable factors, adopting different assump-tions can change the values. In addition, the amounts of the contract for derivative transactions in Note 14 do not indicate their market risks related to the derivative transactions.
Notes to Consolidated Financial Statements
ANNUAL REPORT 2016
18
010_0594001372808.indd 18 2016/08/12 9:34:29

B. Fair values of financial instrumentsBook values and fair values of the financial instruments on the consoli-dated balance sheets as of March 31, 2016 and 2015 are as follows:
Japanese Yen (millions)
2016 2015
Book value Fair value Difference Book value Fair value Difference
Cash and cash equivalents ¥ 53,510 ¥ 53,510 ¥ — ¥ 51,904 ¥ 51,904 ¥ —Time deposits 17,008 17,008 — 2,359 2,359 —Securities (Note 13)
Held-to-maturity securities 100 100 — 5,334 5,334 —
Available-for-sale securities 7,457 7,457 — 8,794 8,794 —
Trade receivables 52,799 52,799 — 49,091 49,091 —Total assets 130,874 130,874 — 117,482 117,482 —Short-term borrowings 10,345 10,345 — 12,340 12,340 —Current portion oflong-term indebtedness 1,783 1,783 — 1,905 1,905 —
Current portion of bonds 1,107 1,107 — 226 226 —Trade payables 22,628 22,628 — 21,692 21,692 —Other payables 5,954 5,954 — 6,373 6,373 —Accrued income taxes 2,901 2,901 — 2,373 2,373 —Long-term indebtedness 86,793 90,156 3,363 68,371 68,507 136Total liabilities 131,511 134,874 3,363 113,280 113,416 136Derivative transactions (Note 14) (*) ¥ 70 ¥ 70 ¥ — ¥ (400) ¥ (400) ¥ —
U.S. Dollars (thousands)2016
Book value Fair value Difference
Cash and cash equivalents $ 474,885 $ 474,885 $ —Time deposits 150,941 150,941 —Securities (Note 13)
Held-to-maturity securities 887 887 —
Available-for-sale securities 66,179 66,179 —
Trade receivables 468,574 468,574 —Total assets 1,161,466 1,161,466 —Short-term borrowings 91,809 91,809 —Current portion of long-term indebtedness 15,824 15,824 —
Current portion of bonds 9,824 9,824 —Trade payables 200,817 200,817 —Other payables 52,840 52,840 —Accrued income taxes 25,745 25,745 —Long-term indebtedness 770,261 800,106 29,845 Total liabilities 1,167,120 1,196,965 29,845 Derivative transactions (Note 14) (*) $ 621 $ 621 $ —
(*) Net credits and debts generated from derivatives trading are shown. Items generating net debts are enclosed in parentheses.
Methods of calculating the fair value of financial instruments, and items relating to securities and derivatives transactionsAssets
Cash and Cash equivalents, Time deposits and Trade receivablesThe fair values are equal to the book values because these items are settled in short term and fair values and book values are nearly equivalent.
SecuritiesFor the fair values of securities, the equity securities are measured at the prices on the relevant exchanges and the bond are measured at the prices provided by the relevant financial institutes. The details are as shown in Note 13.
LiabilitiesShort-term borrowings, Current portion of long-term indebtedness, Trade payables, Other payables and Accrued income taxes
The fair values are equal to the book values because these items are settled in short term and fair values and book values are nearly equivalent.
Long-term indebtednessThe fair value of the bond payable is based on the present value of principal and interest payments discounted using the interest rate which takes into account the Company’s own credit risk.The fair value of the Convertible bond-type bonds with subscription rights to shares are measured at the prices provided by the relevant financial institutes.The fair value of the floating rate loan payable subject to the special treatment for an interest rate swap is based on the present value of future cash flows associated with the loan payable and the interest rate swap discounted using the current borrowing rate for similar indebted-ness of comparable maturity.The book value of the other floating rate loans payable approximates fair value because their interest rates reflect market interest rates in the short term and no significant change has occurred in the creditworthiness of the Company and its consolidated subsidiaries after receiving borrowings.As a result, those fair values are equal to the book values.
Derivative transactionsThe details are as shown in Note 14.
13. SECURITIESA. The following tables summarize fair value, acquisition cost and book value
of securities with available fair value as of March 31, 2016 and 2015:
Held-to-maturity securitiesSecurities with fair value exceeding book value
Japanese Yen (millions)2016 2015
Book value
Fair value Difference Book
valueFair
value Difference
Government bonds ¥— ¥— ¥— ¥— ¥— ¥— Corporate bonds — — — — — —Other — — — — — —Total ¥— ¥— ¥— ¥— ¥— ¥—
Securities with fair value not exceeding book value
Japanese Yen (millions)2016 2015
Book value
Fair value Difference Book
valueFair
value Difference
Government bonds ¥100 ¥100 ¥— ¥ 254 ¥ 254 ¥—Corporate bonds — — — — — —Other — — — 5,080 5,080 —Total ¥100 ¥100 ¥— ¥5,334 ¥5,334 ¥—
Securities with fair value exceeding book value
U.S. Dollars (thousands)2016
Book value
Fair value Difference
Government bonds $— $— $—Corporate bonds — — —Other — — —Total $— $— $—
Securities with fair value not exceeding book value
U.S. Dollars (thousands)2016
Book value
Fair value Difference
Government bonds $887 $887 $—Corporate bonds — — —Other — — —Total $887 $887 $—
19
010_0594001372808.indd 19 2016/08/12 9:34:29

Available-for-sale securitiesSecurities with book value exceeding acquisition cost
Japanese Yen (millions)2016 2015
Acquisition cost
Book value Difference Acquisition
costBook value Difference
Equity securities ¥2,189 ¥3,331 ¥1,142 ¥2,643 ¥6,130 ¥3,487 Bonds 1,000 1,004 4 — — —Other — — — — — —Total ¥3,189 ¥4,335 ¥1,146 ¥2,643 ¥6,130 ¥3,487
Securities with book value not exceeding acquisition cost
Japanese Yen (millions)2016 2015
Acquisition cost
Book value Difference Acquisition
costBook value Difference
Equity securities ¥ 115 ¥ 107 ¥ (8) ¥ 15 ¥ 10 ¥ (5)Bonds 3,000 2,997 (3) 2,000 1,981 (19) Other 18 18 - 673 673 (0) Total ¥3,133 ¥3,122 ¥(11) ¥2,688 ¥2,664 ¥(24)
Securities with book value exceeding acquisition cost
U.S. Dollars (thousands)2016
Acquisition cost
Book value Difference
Equity securities $19,427 $29,562 $10,135 Bonds 8,875 8,910 35 Other — — — Total $28,302 $38,472 $10,170
Securities with book value not exceeding acquisition cost
U.S. Dollars (thousands)2016
Acquisition cost
Book value Difference
Equity securities $ 1,020 $ 950 $(71)Bonds 26,624 26,597 (27)Other 160 160 — Total $27,804 $27,707 $(98)
B. The following tables summarize book value of securities with no available fair value as of March 31, 2016 and 2015:
Japanese Yen(millions)
U.S. Dollars (thousands)
2016 2015 2016Available-for-sale securities:
Non-listed securities ¥ 91 ¥ 71 $ 807Investment Partnership 793 709 7,038
Total ¥884 ¥ 780 $7,845
C. Redemption schedule of securities with maturities is as follows:
Japanese Yen (millions)2016 2015
Within 1 year
1 to 5 years
Over 5 years Total Within
1 year1 to 5 years
Over 5 years Total
Held-to-maturity securitiesGovernment bonds ¥ 4 ¥ 96 ¥ — ¥ 100 ¥ 148 ¥ 106 ¥— ¥ 254Other — — — — 5,080 — — 5,080
Available-for-sale securitiesGovernment bonds — — — — — — — —Corporate bonds — — 1,000 1,000 — — — —Other 2,000 1,000 — 3,000 — 1,981 — 1,981
Total ¥2,004 ¥1,096 ¥1,000 ¥4,100 ¥5,228 ¥2,087 ¥— ¥7,315
U.S. Dollars (thousands)
2016
Within 1 year
1 to 5 years
Over 5 years Total
Held-to-maturity securitiesGovernment bonds $ 35 $ 852 $ — $ 887Other — — — —
Available-for-sale securitiesGovernment bonds — — — —Corporate bonds — — 8,875 8,875Other 17,749 8,875 — 26,624
Total $17,784 $9,727 $8,875 $36,386
D. Total sale of available-for-sale securities for the years ended March 31, 2016 and 2015.
Japanese Yen(millions)
U.S. Dollars (thousands)
2016 2015 2016Amount of securities sold ¥482 ¥ 1 $4,278Total gain on sale 115 0 1,021Total loss on sale 0 — 0
14. DERIVATIVE FINANCIAL INSTRUMENTS AND HEDGING TRANSACTIONS
The Company and its consolidated subsidiaries use currency option contracts and currency swap contracts, as derivative financial instruments only for the purpose of mitigating future risks of fluctuation in foreign currency exchange rates with respect to existing foreign currency trade receivables or payables, and use interest rate swap contracts for the purpose of mitigating the risk of floating interest rates related to borrowings.
The derivative transactions are executed and managed by the Company’s Finance Department in accordance with established policies and within the specified limits on the amounts of derivative transactions allowed. The following summarizes hedging derivative financial instruments used by the Company and its consolidated subsidiaries and the hedged items:Hedging instruments: Hedged items:
Currency swap contracts Loan receivable
Interest rate and currency swap transactions Loan payable
Interest rate swap transactions Loan payable
Notes to Consolidated Financial Statements
ANNUAL REPORT 2016
20
010_0594001372808.indd 20 2016/08/12 9:34:29

The summarized derivative financial instruments outstanding as of March 31, 2016 and 2015 are as follows:
A. Derivative transactions on which the hedge accounting is not applied
Currency related
Japanese Yen (millions)2016 2015
Type of transaction
Notional value
Notional value due
over 1 year
Fair value
Unrealized gain (loss)
Notional value
Notional value due
over 1 year
Fair value
Unrealized gain (loss)
Exchange reservation
SellingPoland zloty ¥ 727 ¥— ¥(14) ¥(14) ¥ — ¥— ¥ — ¥ —
Currency option contracts
Selling CallU.S. dollars 339 — (7) (7) 1,806 — (37) (37)Euro 3,709 — (98) (98) 3,925 — (103) (103)Mexico peso 886 — (36) (36) — — — —
Buying PutU.S. dollars 339 — 5 5 1,806 — 21 21Euro 3,709 — 66 66 3,925 — 65 65Mexico peso 443 — 14 14 — — — —
Total ¥10,152 ¥— ¥(70) ¥(70) ¥11,462 ¥— ¥ (54) ¥ (54)
U.S. Dollars (thousands)2016
Type of transaction
Notional value
Notional value due
over 1 year
Fair value
Unrealized gain (loss)
Exchange reservation
SellingPoland zloty $6,452 $— $(124) $(124)
Currency option contracts
Selling CallU.S. dollars 3,009 — (62) (62)Euro 32,916 — (870) (870)Mexico peso 7,863 — (319) (319)
Buying PutU.S. dollars 3,009 — 44 44 Euro 32,916 — 586 586 Mexico peso 3,931 — 124 124
Total $90,096 $— $(621) $(621)
Notes 1. Currency option contracts are zero cost options, and option premiums are not paid or received.
Interest rate related
Japanese Yen (millions)2016 2015
Type of transaction
Notional value
Notional value due
over 1 year
Fair value
Unrealized gain (loss)
Notional value
Notional value due
over 1 year
Fair value
Unrealized gain (loss)
Currency swap contracts
Variable receivable and fixed payment receipts in U.S. dollars payments in Korean Won
¥6,886 ¥6,886 ¥192 ¥192 ¥7,319 ¥7,319 ¥(280) ¥(280)
Total ¥6,886 ¥6,886 ¥192 ¥192 ¥7,319 ¥7,319 ¥(280) ¥(280)
U.S. Dollars (thousands)2016
Notional value
Notional value due
over 1 year
Fair value
Unrealized gain (loss)
Currency swap contracts
Variable receivable and fixed payment receipts in U.S. dollars payments in Korean Won
$61,111 $61,111 $1,703 $1,703
Total $61,111 $61,111 $1,703 $1,703
B. Derivative transactions subject to hedge accounting
Currency related
The way of hedge
accounting
Type of transaction
Hedged items
Japanese Yen (millions)2016 2015
Notional value
Notional value due
over 1 year
Fair value
Notional value
Notional value due
over 1 year
Fair value
Allocation method
Foreign exchange forward contracts
Sell US dollars
Held-to-maturity securities
¥ — ¥ — ¥ — ¥ — ¥ — ¥ —
Deferral method
Currency swap contracts
Receipts in Chinese YuanPayments in Korean Won
Loans receivable 1,868 1,868 (37) 1,985 1,985 (8)
Receipts in U.S. dollarsPayments in Korean Won
Loans receivable 105 105 (15) 112 112 (58)
Integration treatment for interest rate and currency swaps
Interest rate and currency swap transactions
Variablereceivableand fixed paymentReceipts in U.S. dollarsPayments in yen
Long-termloanpayable
9,198 9,198 (*2) 9,198 9,198 (*2)
Total ¥11,171 ¥11,171 ¥(52) ¥11,295 ¥11,295 ¥(66)
21
010_0594001372808.indd 21 2016/08/12 9:34:29

The way of hedge
accounting
Type of transaction
Hedged items
U.S. Dollars (thousands)2016
Notional value
Notional value due
over 1 year
Fair value
Allocation method
Foreign exchange forward contracts
Sell US dollars
Held-to-maturity securities
$ — $ — $ —
Deferral method
Currency swap contracts
Receipts in Chinese YuanPayments in Korean Won
Loans receivable 16,578 16,578 (328)
Receipts in U.S. dollarsPayments in Korean Won
Loans receivable 932 932 (133)
Integration treatment for interest rate and currency swaps
Interest rate and currency swap transactions
Variablereceivableand fixed paymentReceipts in U.S. dollarsPayments in yen
Long-termloanpayable
81,629 81,629 (*2)
Total $99,139 $99,139 $(461)
(*1) As foreign exchange forward contracts subject to the allocation method are accounted to be combined with held-to-maturity securities as hedged items, their fair values are included in those of held-to-maturity securities.
(*2) As interest rate and currency swap transactions subject to the integration treatment for interest rate and currency swaps are accounted to be combined with long-term loan payable as hedged items, their fair values are included in those of long-term loan payable.
Interest rate related
The way of hedge
accounting
Type of transaction
Hedged items
Japanese Yen (millions)2016 2015
Notional value
Notional value due
over 1 year
Fair value
Notional value
Notional value due
over 1 year
Fair value
Specialtreatmentfor interestrate swap
Interest rateswaptransactionsVariablereceivableand fixed payment
Long-termloanpayable
¥1,477 ¥1,477 (*) ¥1,477 ¥1,477 (*)
The way of hedge
accounting
Type of transaction
Hedged items
U.S. Dollars (thousands)2016
Notional value
Notional value due
over 1 year
Fair value
Specialtreatmentfor interestrate swap
Interest rateswaptransactionsVariablereceivableand fixed payment
Long-termloanpayable
$13,108 $13,108 (*)
(*) As interest rate swap transactions subject to the special treatment for interest rate swap are accounted to be combined with long-term loans payable as hedged items, their fair values are included in those of long-term loans.
15. RETIREMENT AND PENSION PLANSMovements in retirement benefit obligations as of March 31, 2016 and 2015 are as follows:
Japanese Yen (millions) U.S. Dollars (thousands)
2016 2015 2016Beginning balance ¥13,707 ¥13,106 $121,645
Cumulative effects of changes in accounting policies — (1,555) —
Restated balance 13,707 11,551 121,645Service cost 1,225 1,132 10,871Interest cost 256 263 2,272Actuarial gains and losses 680 717 6,035Benefits paid (639) (458) (5,671)Exchange translation differences (324) 472 (2,875)Other 122 30 1,083
Ending balance ¥15,027 ¥13,707 $133,360
Movements in plan assets as of March 31, 2016 and 2015 are as follows:
Japanese Yen (millions) U.S. Dollars (thousands)
2016 2015 2016Beginning balance ¥11,630 ¥10,069 $103,213
Expected return on plan assets 351 355 3,115Actuarial gains and losses 61 379 541Contributions by the employer 1,188 861 10,543Benefits paid (602) (417) (5,343)Exchange translation differences (267) 375 (2,369)Other 40 8 355
Ending balance ¥12,401 ¥11,630 $110,055
Movements in liability for retirement benefits for simplified method as of March 31, 2016 and 2015 are as follows:
Japanese Yen (millions) U.S. Dollars (thousands)
2016 2015 2016Beginning balance ¥442 ¥309 $3,923
Periodic benefit cost 138 185 1,225Benefits paid (30) (33) (266)Contributions (20) (19) (178)Other 0 (0) 0
Ending balance ¥530 ¥442 $4,704
Reconciliation from retirement benefit obligations and plan assets to liabilities and assets for retirement benefit as of March 31, 2016 and 2015 are as follows:
Japanese Yen (millions) U.S. Dollars (thousands)
2016 2015 2016Funded retirement benefit obligations ¥ 14,906 ¥ 13,622 $ 132,286 Plan assets (12,484) (11,700) (110,792)
2,422 1,922 21,494Unfunded retirement benefit obligations 734 597 6,514Net amount of liabilities and assets recognized
in consolidated balance sheet 3,156 2,519 28,008
Liability for retirement benefits 3,667 2,669 32,543Asset for retirement benefits (511) (150) (4,535)Net amount of liabilities and assets
recognized in consolidated balance sheet ¥ 3,156 ¥ 2,519 $ 28,008
The retirement benefit expenses for the years ended March 31, 2016 and 2015 are as follows:
Japanese Yen (millions) U.S. Dollars (thousands)
2016 2015 2016Service cost ¥1,225 ¥1,132 $10,871 Interest cost 256 263 2,272Expected return on plan assets (351) (355) (3,115)Recognition of actuarial gains and losses 279 218 2,476Recognition of prior service cost (2) (2) (18)Periodic benefit cost in simplified method 138 185 1,225Other (9) (4) (79)Periodic benefit costs of retirement benefit plan ¥1,536 ¥1,437 $13,632
Notes to Consolidated Financial Statements
ANNUAL REPORT 2016
22
010_0594001372808.indd 22 2016/08/12 9:34:29

The breakdown of adjustments for retirement benefits for the years ended March 31, 2016 and 2015 are as follows:
Japanese Yen (millions) U.S. Dollars (thousands)
2016 2015 2016Prior service cost ¥ 2 ¥ 3 $ 18 Actuarial losses 298 168 2,644Total ¥300 ¥171 $2,662
The breakdown of accumulated adjustments for retirement benefits for the years ended March 31, 2016 and 2015 are as follows:
Japanese Yen (millions) U.S. Dollars (thousands)
2016 2015 2016Unrecognized prior service cost ¥ — ¥ (2) $ — Unrecognized actuarial losses 1,425 1,127 12,646Total ¥1,425 ¥1,125 $12,646
The breakdown of plan assets as of March 31, 2016 and 2015 are as follows:
2016 2015Debt securities 32% 31%Equity securities 23 22General account 34 34Other 11 13Total 100% 100%
Note: 14% and 13% of the assets are contributed to the employee retirement benefit trust
respectively as of March 31, 2016 and 2015.
The items of actuarial assumptions for the years ended March 31, 2016 and 2015 are as follows:
2016 2015Discount rate 1.5% 1.8%Expected long-term return on plan assets 3.0 3.5
Note: Expected return rate on plan assets is determined by considering the current and anticipated future portfolio of plan assets and current and anticipated future long-term performance of individual asset classes that comprise the funds’ asset mix.
Payment to defined contribution plan for the years ended March 31, 2016 and 2015 are as follows:
Japanese Yen (millions) U.S. Dollars (thousands)
2016 2015 2016Payment to defined contribution plan ¥424 ¥390 $3,763
16. SHORT-TERM BORROWINGS Short-term borrowings represent principally notes payable to banks. Weighted average interest rates on the short-term borrowings excluding current portion of long-term indebtedness as of March 31, 2016 and 2015 are 0.76% and 1.95% respectively.
17. LONG-TERM INDEBTEDNESSLong-term indebtedness as of March 31, 2016 and 2015 consists of the following:
Japanese Yen(millions)
U.S. Dollars(thousands)
2016 2015 2016
Bonds payable—
Bond payable due 2016 through 2020 with average rate 0.99% ¥27,056 ¥27,223 $240,113
Convertible bond-type bonds with subscription rights to shares due 2020(*)
20,082 — 178,222
Loans payable—
Unsecured loans due 2016 through 2035 with average rate 0.71% 42,545 43,279 377,574
89,683 70,502 795,909
Less—
Current portion of long-term indebtedness (2,890) (2,131) (25,648)
Total ¥86,793 ¥68,371 $770,261
Annual maturities of long-term indebtedness as of March 31, 2016 are as follows;
Japanese Yen (millions)
U.S. Dollars (thousands)
2017 ¥ 2,873 $ 25,4972018 21,819 193,6372019 29,776 264,2532020 12,453 110,5172021 20,947 185,8982022 and thereafter 1,344 11,927
Total ¥89,212 $791,729
(*) The description of the above convertible bond-type bonds with subscrip-tion rights to shares were as follows:
Description of bonds First Zero Coupon Convertible Bonds due 2020
Class of shares to be issued Ordinary shares of common stock
Issue price for stock acquisition rights —
Exercise price of shares ¥5,520
Total amount of debt securities issued ¥20,100 millions
Total amount of shares issued by exercising stock acquisition rights —
Percentage of shares with stock acquisition rights 100%
Exercise period of stock acquisition rights
From May 7, 2015 to April 23, 2020
Note: Upon the request to exercise stock acquisition rights from the bond-holders, it shall be deemed as payment by the bondholders of the full amount required to be paid upon the exercise of stock acquisition rights, rather than as redemption of corporate bonds with stock acquisition rights at their total amount of issue. In addition, if the bondholders exer-cise the stock acquisition rights, it would be considered that such request has been made.
23
010_0594001372808.indd 23 2016/08/12 9:34:29

18. INCOME TAXESThe Company is subject to corporation, enterprise and inhabitants’ taxes, which resulted in an aggregate normal effective tax rate of approximately 33.0% for the years ended March 31, 2016. The following table summarizes the significant differences between the statutory tax rate and the effective tax rate for the years ended March 31, 2016 and 2015:
2016 2015
Statutory tax rate 33.0% 35.6%(Reconciliation) Non-deductible expenses, such as
entertainment expenses 2.3 2.4
Non-taxable income, such as dividends received (0.5) (0.4)
Tax rate differences between those applied in Japan and foreign subsidiaries’ countries (5.5) (7.4)
Undistributed profits of overseas subsidiaries 3.2 6.9Tax reduction for research and development
expense (3.0) (3.6)
Other (0.9) (4.8)
Effective tax rate 28.6% 28.7%
Significant components of deferred tax assets and liabilities as of March 31, 2016 and 2015 are as follows:
Japanese Yen(millions)
U.S. Dollars(thousands)
2016 2015 2016Deferred tax assets:
Enterprise taxes ¥ 69 ¥ 118 $ 613 Valuation loss of molds and dies 55 52 488 Accrued bonuses 397 425 3,523 Valuation loss of inventories 65 66 577 Liability for retirement benefits 956 752 8,484 Impairment losses of fixed assets 251 123 2,228 Net operating loss carry forwards
of subsidiaries 1,516 1,878 13,454
Loss on valuation of investment securities 35 144 311 Depreciation 724 457 6,425 Unrealized gains of inventories 383 319 3,399 Business structure improvement expenses — 339 — Other 820 1,210 7,277
Total 5,271 5,883 46,779 Offset with deferred tax liabilities
within each entity (2,075) (1,870) (18,415)
Sub-total deferred tax assets 3,196 4,013 28,364 Valuation allowance (794) (1,421) (7,047)
Total deferred tax assets 2,402 2,592 21,317 Deferred tax liabilities:
Net unrealized gains on securities (387) (1,160) (3,435)Reserves under Special Taxation
Measures Law (627) (673) (5,564)
Securities to retirement benefit trust (3,619) (245) (32,118)Undistributed profit of overseas
subsidiaries (1,553) (3,580) (13,782)
Depreciation (233) (1,636) (2,068)Other (564) (859) (5,005)
Total (6,983) (8,153) (61,972)Offset with deferred tax assets
within each entity 2,075 1,870 18,415
Total deferred tax liabilities (4,908) (6,283) (43,557)Net deferred tax assets (liabilities) ¥(2,506) ¥(3,691) $(22,240)
On March 29, 2016, amendments to the Japanese tax regulations were enacted into law. Based on the amendments, the statutory income tax rates utilized for the measurement of deferred tax assets and liabilities expected to be settled or realized from April 1, 2016 to March 31, 2018 changed from 32.2% to 30.8%, and after April 1, 2018 are changed to 30.6%.The adoption of these amendments does not have a significant impact on the
consolidated financial statements.
19. NET ASSETSUnder Japanese laws and regulations, the entire amount paid for new shares is basically required to be designated as common stock. However, a company may, by a resolution of the Board of Directors, designate an amount not exceeding one-half of the price of the new shares as additional paid-in capital, which is included in capital surplus.The Japanese Corporate Law (hereinafter, “the Law”) provides that an amount equal to 10% of cash dividends be appropriated as an additional paid-in capital or legal reserve. No further appropriation is required when the total amount of the additional paid-in capital and legal reserve equals to 25% of common stock. Legal earnings reserve is included in retained earnings in the accompanying consolidated balance sheets. The Law requires a company to obtain the approval of shareholders for transferring amount between common stock and additional paid-in capital. The Law also permits a company to transfer an amount of common stock or additional paid-in capital to retained earnings in principle upon approval of shareholders. Under the Law, all additional paid-in-capital and all legal earnings reserve may be transferred to other capital surplus and retained earnings, respectively, which are potentially available for dividends. The maximum amount that the Company can distribute as dividends is calcu-lated based on the non-consolidated financial statements of the Company in accordance with Japanese laws and regulations.At the annual shareholders’ meeting held on June 24, 2016, the shareholders approved cash dividends amounting to ¥3,042 million ($26,997 thousand). Such appropriations have not been accrued in the consolidated financial state-ments as of March 31, 2016. Such appropriations are recognized in the period
in which they are approved by the shareholders.
20. PER SHARE DATADividends per share shown in the consolidated statements of income and comprehensive income have been presented on the accrual basis and include, in each fiscal period, dividends approved after each balance sheet date, but applicable to the fiscal period then ended. Profit attributable to owners of parent per share is based on the weighted average number of shares of common stock outstanding and common stock equivalents. In the fiscal year ended March 31, 2015, there were no common stock equiv-alents that have a dilutive effect.In the fiscal year ended March 31, 2016, the Convertible bond-type bonds with subscription rights to shares were considered as potential common stock equivalents that have a dilutive effect. With computing profit attributable to owners of parent per share, profit attributable to owners of parent is adjusted by the interest expense on the Convertible bond-type bonds with subscription rights to shares when such bonds are dilutive.
21. SEGMENT INFORMATION<Segment Information>A. General information about reportable segments
The reportable segments of the Company are its constituent units on which separate financial information can be obtained, and the Board of Directors regularly examines them to determine the allocation of management resources and to evaluate earnings.The Company has two reportable segments: the “Industrial plastic parts and components business” and the “Bedding and furniture business.” The main products and services of each reportable segment are as follows:(1) Industrial plastic parts and components: Industrial plastic fasteners,
precision plastic injection molded components, etc.(2) Bedding and furniture: Various types of beds, reclining chairs, etc.
B. Basis of measurement about reported segment profit or loss, segment assets, segment liabilities and other material items
The accounting method for reportable segments is the same, for the most part, with descriptions in Note 2, “Summary of Significant Accounting Policies.”
Profit or loss in the reportable segments corresponds to operating income or operating loss.
Inter-segment sales is based on the current market price.
Notes to Consolidated Financial Statements
ANNUAL REPORT 2016
24
010_0594001372808.indd 24 2016/08/12 9:34:29

C. Information about reported segment profit or loss, segment assets, segment liabilities and other material items
Segment information as of and for the years ended March 31, 2016 and 2015 are as follows:
Japanese Yen (millions)
Reporting segments
Other Adjustments ConsolidatedIndustrial Plastic Parts
and Components
Bedding and
FurnitureTotal
2016 Net sales:Sales to customers ¥239,185 ¥23,998 ¥263,183 ¥ 2,501 ¥ — ¥265,684Inter-segment sales 45 0 45 193 (238) —
Total 239,230 23,998 263,228 2,694 (238) 265,684Segment income (loss) 29,591 3,479 33,070 (19) (5,477) 27,574Segment assets 200,442 22,585 223,027 10,281 45,563 278,871Other items
Depreciation 13,699 573 14,272 20 658 14,950Impairment loss of fixed assets 470 — 470 — — 470Capital expenditures 19,489 1,932 21,421 22 45 21,488
2015 Net sales:Sales to customers ¥201,769 ¥21,261 ¥223,030 ¥ 2,386 ¥ — ¥225,416 Inter-segment sales 3 0 3 183 (186) —
Total 201,772 21,261 223,033 2,569 (186) 225,416 Segment income (loss) 22,864 3,184 26,048 (167) (4,906) 20,975 Segment assets 194,545 21,646 216,191 10,074 39,487 265,752 Other items
Depreciation 10,990 373 11,363 16 797 12,176 Impairment loss of fixed assets 87 — 87 — — 87 Capital expenditures 18,381 2,366 20,747 27 22 20,796
U.S. Dollars (thousands)
Reporting segments
Other Adjustments ConsolidatedIndustrial Plastic Parts
and Components
Bedding and
FurnitureTotal
2016 Net sales:Sales to customers $2,122,692 $ 212,975 $2,335,667 $22,196 $ — $2,357,863 Inter-segment sales 399 0 399 1,713 (2,112) —
Total 2,123,091 212,975 2,336,066 23,909 (2,112) 2,357,863 Segment income (loss) 262,611 30,875 293,486 (168) (48,607) 244,711 Segment assets 1,778,860 200,435 1,979,295 91,242 404,357 2,474,894Other items
Depreciation 121,575 5,085 126,660 177 5,840 132,677 Impairment loss of fixed assets 4,171 — 4,171 — — 4,171 Capital expenditures 172,959 17,146 190,105 195 399 190,699
Notes 1. “Other” includes newspapers and publishing business, etc. 2. Adjustments to the segment loss of ¥5,477 million ($48,607 thousand),
¥4,906 million respectively as of March 31, 2016 and 2015 reflect company costs of ¥5,631 million ($49,973 thousand), ¥5,060 million respectively and transactions eliminated between segments totaling ¥ 154 million ($1,367 thousand), ¥154 million respectively. Company costs mainly refer to general and administrative expenses that do not belong to reportable segments.
3. Segment income (loss) is adjusted by taking into account operating income of consolidated financial statements.
4. Adjustments to segment assets of ¥45,563 million ($404,357 thousand), ¥39,487 million respectively as of March 31, 2016 and 2015 reflect company assets that are not allocated to each reportable segment of ¥59,476 million ($527,831 thousand), ¥53,318 million respectively and transactions eliminated between segments totaling ¥13,913 million ($123,474 thousand), ¥13,831 million respectively.
Amortization of goodwill and remaining amounts by reportable segment for the years ended March 31, 2016 and 2015 are as follows:
Goodwill
Japanese Yen (millions)2016 2015
Industrial Plastic Parts
andComponents
Bedding and
FurnitureOther Total
Industrial Plastic Parts
andComponents
Bedding and
FurnitureOther Total
Amortization ¥ 723 ¥— ¥— ¥ 723 ¥ 592 ¥— ¥— ¥ 592Remaining amounts 3,673 — — 3,673 4,870 — — 4,870
U.S. Dollars (thousands)2016
Industrial Plastic Parts
andComponents
Bedding and
FurnitureOther Total
Amortization $ 6,416 $— $— $ 6,416Remaining amounts 32,597 — — 32,597
Negative goodwill
Japanese Yen (millions)2016 2015
Industrial Plastic Parts
andComponents
Bedding and
FurnitureOther Total
Industrial Plastic Parts
andComponents
Bedding and
FurnitureOther Total
Amortization ¥— ¥— ¥— ¥— ¥— ¥0 ¥— ¥0Remaining amounts — — — — — — — —
U.S. Dollars (thousands)2016
Industrial Plastic Parts
andComponents
Bedding and
FurnitureOther Total
Amortization $— $— $— $—Remaining amounts — — — —
Operations by geographic areas for the years ended March 31, 2016 and 2015 are summarized as follows:
Japanese Yen (millions)
Japan Asia North America Europe Total
Eliminations and
CorporateConsolidated
2016 Net sales:Sales to customers ¥74,653 ¥107,740 ¥46,837 ¥36,454 ¥265,684 ¥ — ¥265,684Inter-segment sales 9,287 7,618 122 278 17,305 (17,305) —
Total 83,940 115,358 46,959 36,732 282,989 (17,305) 265,684Operating income (loss) 12,520 14,637 5,845 420 33,422 (5,848) 27,574
2015 Net sales:Sales to customers ¥73,286 ¥86,100 ¥38,071 ¥27,959 ¥ 225,416 ¥ — ¥225,416 Inter-segment sales 8,064 6,273 50 145 14,532 (14,532) —
Total 81,350 92,373 38,121 28,104 239,948 (14,532) 225,416 Operating income (loss) 12,498 10,290 2,266 926 25,980 (5,005) 20,975
U.S. Dollars (thousands)
Japan Asia North America Europe Total
Eliminations and
CorporateConsolidated
2016 Net sales: Sales to customers $662,522 $956,159 $415,664 $323,518 $2,357,863 $ — $2,357,863Inter-segment sales 82,419 67,607 1,083 2,467 153,576 (153,576) —
Total 744,941 1,023,766 416,747 325,985 2,511,439 (153,576) 2,357,863 Operating income (loss) 111,111 129,899 51,873 3,727 296,610 (51,899) 244,711
25
010_0594001372808.indd 25 2016/08/12 9:34:29

Notes to Consolidated Financial Statements
(Reclassifications for royalty income)
In prior years, royalty income was included in other income. Beginning with
current fiscal year, the royalty income is included in net sales.
Due to this change, compared with the previous method, there were increases
of 2,522 million yen in Inter-segment sales and Operating profit in Japan
respectively. To reflect this change, the geographic information of the previous
fiscal year has been revised.
< Related Information>
A. Information by product and service
Information is omitted since similar information is in the segment
information.
B. Information by geographic areas
The amount of sales by geographic areas for the years ended March 31,
2016 and 2015 are summarized as follows:
Japanese Yen (millions)
Japan China Korea Asia United States
North America Europe Other Total
2016 ¥75,105 ¥48,018 ¥37,721 ¥20,501 ¥39,632 ¥8,502 ¥35,233 ¥972 ¥265,6842015 ¥74,210 ¥34,501 ¥32,037 ¥18,536 ¥32,118 ¥7,182 ¥26,030 ¥802 ¥225,416
U.S. Dollars (thousands)
Japan China Korea Asia United States
North America Europe Other Total
2016 $666,534 $426,145 $334,762 $181,940 $351,722 $75,452 $312,682 $8,626 $2,357,863
Notes 1. Sales are classified by country or region which is based on customer location. 2. Sales in Asia do not include sales in China and Korea. 3. Sales in North America do not include sales in the United States.
The amount of tangible fixed assets by geographic areas for the year ended
March 31, 2016 and 2015 are summarized as follows:
Japanese Yen (millions)
Japan China Korea Asia North America Europe Total
2016 ¥35,827 ¥14,041 ¥9,438 ¥9,593 ¥12,187 ¥15,639 ¥96,7252015 ¥32,850 ¥11,866 ¥10,546 ¥10,799 ¥11,363 ¥15,050 ¥92,474
U.S. Dollars (thousands)
Japan China Korea Asia North America Europe Total
2016 $317,953 $124,610 $83,759 $85,135 $108,156 $138,791 $858,404
Notes 1. Tangible fixed assets of China and Korea are not included in Asia.
C. Information by major customerThere is no major unaffiliated customer which accounts for 10% or more of the net sales on the consolidated statements of income and comprehensive income.
ANNUAL REPORT 2016
26
010_0594001372808.indd 26 2016/08/12 9:34:29

To the Board of Directors of Nifco Inc.:
We have audited the accompanying consolidated financial statements of Nifco Inc. and its consolidated subsidiaries, which comprise the consolidated balance sheets as of March 31, 2016 and 2015, and the consolidated statements of income and comprehensive income, statements of changes in net assets and statements of cash flows for the years then ended, and a summary of significant accounting policies and other explanatory information.
Management’s Responsibility for the Consolidated Financial Statements
Management is responsible for the preparation and fair presentation of these consolidated financial statements in accordance with accounting principles generally accepted in Japan, and for such internal control as management determines is necessary to enable the preparation of consolidated financial statements that are free from material misstatements, whether due to fraud or error.
Auditor’s Responsibility
Our responsibility is to express an opinion on these consolidated financial statements based on our audits. We conducted our audits in accordance with auditing standards generally accepted in Japan. Those standards require that we comply with ethical requirements and plan and perform the audit to obtain reasonable assurance about whether the consolidated financial statements are free from material misstatement.
An audit involves performing procedures to obtain audit evidence about the amounts and disclosures in the consolidated financial statements. The procedures selected depend on our judgement, including the assessment of the risks of material misstatement of the consolidated financial statements, whether due to fraud or error. In making those risk assessments, we consider internal control relevant to the entity’s preparation and fair presentation of the consolidated financial statements in order to design audit procedures that are appropriate in the circumstances, while the objective of the financial statement audit is not for the purpose of expressing an opinion on the effectiveness of the entity’s internal control. An audit also includes evaluating the appropriateness of accounting policies used and the reasonableness of accounting estimates made by management, as well as evaluating the overall presentation of the consolidated financial statements.
We believe that the audit evidence we have obtained is sufficient and appropriate to provide a basis for our audit opinion.
Opinion
In our opinion, the consolidated financial statements present fairly, in all material respects, the financial position of Nifco Inc. and its consolidated subsidiaries as of March 31, 2016 and 2015, and their financial performance and cash flows for the years then ended in accordance with accounting principles generally accepted in Japan.
Convenience Translation
The U.S. dollar amounts in the accompanying consolidated financial statements with respect to the year ended March 31, 2016 are presented solely for convenience. Our audit also included the translation of yen amounts into U.S. dollar amounts and, in our opinion, such translation has been made on the basis described in Note 1 to the consolidated financial statements.
June 24, 2016
Tokyo, Japan
Independent Auditor’s ReportANNUAL REPORT 2016
27
010_0594001372808.indd 27 2016/08/12 9:34:29

Members of the Board (as of 24th June, 2016)
Representative Director & Chairman, President, C.E.O., C.O.O.
Toshiyuki YamamotoDirector (+) Senior Executive Managing Officer
Kiyohiko FukuwaDirector (+) Executive Managing Officer
Fukuo IwasakiMasaharu Shibao
Non Executive DirectorToyoo GyotenKeiji Tachikawa
Members of the Board of Auditors
Standing AuditorsKenji MatsukawaYoshiaki Notoya
AuditorsKagetoshi UchidaToshiyuki Arai
Executive Officers (as of 24th June, 2016)
Executive Managing OfficersJunji HondaKazumasa KuriharaAkinobu SuzukiMasanobu Kawamoto
Executive OfficersTakashi MorinagaYukiko YoshimaruMoritoshi FukudaMikio OtakeKotaro SuzukiToshiki YauchiToshiya AraiGorou AsamiHyundon ChoiNorihiko Murata
Corporate Outline (as of 31st March, 2016)
Registered Name Nifco Inc.Date of Establishment 13th February,1967Shareholders’ Capital ¥7,290 millionHead Office 5-3, Hikarinooka,
Yokosuka, Kanagawa Prefecture, 239-8560 Japan
Number of Employees 1,098 (non-consolidated)10,591 (consolidated)
Corporate DirectoryTokyo Headquarters
Japan Times-Nifco Building,4-5-4 Shibaura, Minato-ku, Tokyo 108-8522 JapanTel 03-5476-4850Fax 03-5476-4859
Head Office5-3, Hikarinooka, Yokosuka,Kanagawa Prefecture, 239-8560 JapanTel 046-839-0225Fax 046-839-0227
Other Domestic Operations (in alphabetical order) Hamamatsu Sales OfficeHiroshima Sales OfficeNagoya Plant and Sales OfficeNifco Technology Development CentreOsaka Sales OfficeOta Sales OfficeSagamihara Plant and Sales OfficeSaitama Sales OfficeSuzuka Sales OfficeUtsunomiya Sales OfficeTohoku Sales Office
Transfer Agent and RegistrarStocks & Shares Department,Mizuho Trust & Banking Co., Ltd.,1-2-1 Yaesu, Chuo-ku, Tokyo
Domestic Subsidiary CompaniesNifco Yamagata Inc.Nifco Kumamoto Inc.Simmons Co., Ltd.The Japan Times, Ltd.
Domestic Affiliated CompanyNichiei Seiki Co., Ltd.
Overseas Subsidiary Companies
North America Nifco America Corporation
8015 Dove Parkway, Canal Winchester, OH43110, U.S.A.Tel +1-614-920-6800Fax +1-614-836-3846
Nifco Korea USA Inc.4300 Alatex Road, Montgomery, AL36108, U.S.A.Tel +1-334-481-1647Fax +1-334-481-1670
Nifco Central Mexico, S. de R.L. de C.V. Avenida Rio San Lorenzo #1117,Parque Industrial Castro del Rio,Irapuato, Guanajuato CP 36810,Mexico
Nifco KTW America Corporation325 Hammerstone Drive, Toccoa, Georgia 30577, U.S.A.
EuropeNifco U.K. Ltd.
Durham Lane, Eaglescliffe, Stockton-on-Tees, TS16 0PS, U.K.Tel +44-1642-672299Fax +44-1642-611004
Nifco Products España, S. L. U.Bosch I Gimpera, 2-4 Pol. Ind. Santa Margarita II 08223,Terrassa (Barcelona), SpainTel +34-93-736-1800Fax +34-93-731-6265
Corporate DataANNUAL REPORT 2016
28
010_0594001372808.indd 28 2016/08/12 9:34:30

Nifco Poland Sp. z o. o.ul. Przemyslowa, 41-43, 58-100 Swidnica, PolandTel +48-74-649-5500Fax +48-74-649-5503
Nifco Korea Poland Sp. z o. o.ul. Wygoda 8, 44-240, Zory, PolandTel +48-32-6211-390Fax +48-32-6211-399
Nifco KTS GmbHLindgesfeld 9 D-42653,Solingen, GermanyTel +49-212-25830-10Fax +49-212-25830-30
Nifco KTW GmbH Dettenheimer Str. 34 D-91781Weissenburg, GermanyTel +49-9141-8529-0Fax +49-9141-8529-68
AsiaShanghai Nifco Plastic Manufacturer Co., Ltd.
305 Shen Xia Road, Ma Lu Town, Jiading District,Shanghai, 201818 ChinaTel +86-21-5990-3030Fax +86-21-5990-3966
Dongguan Nifco Co., Ltd.East Fangzheng Road, New City Center,Shilong Town, Dongguan,Guangdong, 523326 ChinaTel +86-769-8618-5767Fax +86-769-8618-5697
Tifco (Dongguan) Co., Ltd.No.8, Haiyi Road, Chongtou District,Changan Town, Dongguan City, Guangdong, 523855 China Tel +86-769-8539-1205Fax +86-769-8539-1203
Beijing Nifco Co., Ltd.No.7, Taihe First Street, He Xi District, Beijing Economic-Technological Development Area, 100176 ChinaTel +86-10-8712-6000Fax +86-10-8712-6050
Nifco (Tianjin) Co., Ltd.No.5, the 5th Haitaihuake Road, Huayuan Industry Zone, New Technology Industry Park, Tianjin, 300384 ChinaTel +86-22-5828-8288Fax +86-22-5828-8288
Nifco (Hubei) Co., Ltd.Baoye Industrial Park, ChuangYe Avenue, Gedian Economic and Technical Development Zone of Hubei Province, 436070 ChinaTel +86-711-370-0122
Nifco (Jiangsu) Co., Ltd.No.9, Chen Xin Road, Zhang Jia Gang Economy Development District, Jiangsu 215637 ChinaTel +86-512-5879-9588Fax +86-512-5818-8200
Nifco Yancheng Co., Ltd.Room 306, Merchants Bureau of Optoelectronics Industry, No.69 Donghuan Road, Yancheng Economic Development Zone, Jiangsu,215600 ChinaTel +86-515-6899-0293Fax +86-515-6899-0292
Nifco (Chongqing) Limited Liability CompanyNo.2, Longshan Road, Changshou Economic andTechnology Development Area, Chongqing, China
Nifco (HK) LimitedNo.5 Dai Wang Street, Tai Po Industrial Estate,New Territories, Hong KongTel +852-2665-8088Fax +852-2664-9330
Nifco Taiwan Corporation7F, No.3, Sec.1, Tun Hwa S. Road, Songshan District, Taipei 105, Taiwan, Republic of ChinaTel +886-2-2578-2952Fax +886-2-2577-8431
Nifco Korea Inc.#146, Asan Valley Nam-ro, Dunpo-myeon, Asan-si, Chungcheongnam-do, 336-871 KoreaTel +82-41-640-0100Fax +82-41-640-0198
Nifco (Thailand) Co., Ltd.Amata Nakorn Industrial Estate 700/420, Moo 7, Bangna-Trad Road (KM.57), Tambol Don-Hua-Roh, Amphur Muang, Chonburi, Chonburi 20000, ThailandTel +66-38-45-4165Fax +66-38-45-4173
Union Nifco Co., Ltd.99/11 Moo 5, Bangna-Trad Road (KM.38), Tambol Bangsamak, Amphur, Bangpakong, Chachoengsao 24180, ThailandTel +66-38-84-2130~5Fax +66-38-84-2129
Nifco Manufacturing (Malaysia) Sdn. Bhd.No.46, Jalan Keluli 2, Taman Perindustrian, Utama Bukit Raja, 41720 Klang, Selangor Darul Ehsan, MalaysiaTel +60-3-33412103Fax +60-3-33412107
Nifco (Singapore) Pte. Ltd.11 Woodlands Close, #05-38,Woodlands 11, Singapore 737853Tel +65-6273-9123Fax +65-6273-9150
Nifco Vietnam Ltd.Lot #90, Linh Trung Export Processing Zone & Industrial Park III, Trang Bang Dist., Tay Ninh Province, VietnamTel +84-663-89-7451Fax +84-663-89-7455
Nifco India Private Ltd.Plot No.122, Sector 8, Industrial Area, Imt-Manesar,Gurgaon-122050, Haryana, IndiaTel +91-124-4998225Fax +91-124-4998249
Nifco South India Manufacturing Private Ltd.New No. 50, Mannur Village, Valarpuram Post, Sriperumbudur Taluk,Kancheepuram Dist.,Tamilnadu 602 105, IndiaTel +91-44-3718-7003
PT. Nifco IndonesiaJL.Harapan II Lot KK-5b, Kawasan Industri KIIC,Desa Sirnabaya Kec. Telukjambe Timur,Karawang 41361, Jawa Barat, IndonesiaTel +62-21-8911-4296Fax +62-21-8911-4295
Simmons GroupSimmons Co., Ltd.
6&7F 4-5-4 Shibaura, Minato-ku, Tokyo 108-0023 Japan
AsiaChina, Hong Kong, Taiwan, Singapore, Thailand, India
29
010_0594001372808.indd 29 2016/08/12 9:34:30

Japan Times-Nifco Building
4-5-4 Shibaura, Minato-ku, Tokyo 108-8522 Japan
Telephone 03-5476-4850
Facsimile 03-5476-4859
http://www.nifco.co.jp (Japanese)
http://www.nifco.com (English)
010_0594001372808.indd 1 2016/08/12 9:34:18


