
Analyzing Alternatives for Sulfate Treatment in
Municipal Wastewater
Prepared for:
Minnesota Pollution Control Agency
May 1, 2018
Prepared by:
Bolton & Menk, Inc. and Barr Engineering Company
wq-rule4-15pp

P:\Mpls\23 MN\62\23621245 MPCA POTW Sulfate Treatment\WorkFiles\Report\Analyzing Alternatives for Sulfate Treatment in
Municipal Wastewater-Part 1 Final 05012018.docx
i
Certifications� � � � � � � � � � � � � � � � � � � � � � � � � � � � � � � � � � � � � � � � � � � � � � � � � � � � � � � � � � � � � � � � � � � � � � �� � � � � � � � � � � � � � � � � � � � � � � � � � � � � � � � � � � � � � � � � � � � � � � � � � � � � � � � � � � � � � � � � � � � � � � � � � � � � � � � � � � � � � � � � � � � � � � � � � � � � �� � � � � � � � � � � � � � �� � ! " # $ % & '( � � " � � � � ) * � %� � � � � � � � � � � � � � � � � � � � � � � � � � � � � � � � � � � � � � � � � � � � � � � � � � � � � � � � � � � � � � � � � � � � � � �� � � � � � � � � � � � � � � � � � � � � � � � � � � � � � � � � � � � � � � � � � � � � � � � � � � � � � � � � � � � � � � � � � � � � � � � � � � � � � � � � � � � � � � � � � � � � � � � � � � � � �( � � � � � � � � � �� � ! " ) � � + $( � � " � � � � ) * � %

H:\MNPCA_ST_MN\M21113135\3_Design\C_Reports\Final Draft\Part 2.docx i
Certifications I hereby certify that this plan, specification, or report was prepared by me or under my direct supervision and that I am a duly Licensed Professional Engineer under the laws of the State of Minnesota.
Responsible for Part 2 of this Report. Herman A. Dharmarajah PE #: 18256
Date: May 1, 2018
I hereby certify that this plan, specification, or report was prepared by me or under my direct supervision and that I am a duly Licensed Professional Engineer under the laws of the State of Minnesota.
Responsible for Part 2 of this Report. Adrian T. Hanson PE #: 16540
Date: May 1, 2018
H:\MNPCA_ST_MN\M21113135\3_Design\C_Reports\Final Draft\Abstract.docx
Abstract The current revision of Minnesota’s surface water quality standard for sulfate may result in some municipal wastewater treatment plants having to reduce the sulfate in their discharge. This two-part study evaluated options for sulfate treatment and examined the implications of those treatment options for typical municipal wastewater treatment plants in Minnesota. The first project activity reviewed and ranked 31 technologies for sulfate removal based on effectiveness, operability/maintainability, cost, complexity of pre- and post-treatment, and waste management requirements. The types of technologies reviewed included chemical precipitation, ion exchange, membrane separation, electrochemical, biological, and evaporative treatment. The technology review indicated that reverse osmosis (RO) and nanofiltration (NF) are the most well-developed and effective alternatives available for sulfate removal at this time, despite the complexity and cost associated with final waste management. The second part of the study examined the implementation of RO for sulfate removal at Minnesota’s municipal wastewater treatment plants in greater depth, using six hypothetical case studies covering a range of treatment plant sizes and sulfate treatment goals typical for the state. The case studies considered the technical, operational, and economic issues associated with integration of RO into conventional municipal treatment systems. Sulfate treatment using RO was found to be extremely expensive and operationally complex. The main driver of complexity and costs was membrane waste management, which in this study focused on mechanical evaporation and crystallization. Due to the complexity of the processes, which differ significantly from those currently employed for conventional municipal wastewater treatment, increased staffing levels and operator training would be needed for successful implementation. RO and NF are effective in removing sulfate from wastewater, but waste management challenges remain a barrier to implementation. Across all industries employing RO and NF, additional research and development are needed to create cost-effective, sustainable waste management alternatives.

1
Executive Summary
1.1 Introduction
The State of Minnesota is currently revising the surface water quality standard of 10 mg/L. A revised water
quality standard may result in some municipal wastewater treatment plants (WWTPs) needing to reduce
the concentration of sulfate in their discharges. Historically, municipal WWTPs have not been required to
treat sulfate to achieve compliance with a NPDES permit. This report presents the results of a study
commissioned by the Minnesota Pollution Control Agency through funding from the Minnesota
Environment and Natural Resources Trust Fund to assess the current technologies and tools available to
municipal WWTPs to reduce sulfate concentrations in their discharges and identifies the challenges of
meeting potential sulfate limits in the future.
In Part 1 of the study (2017), a wide range of established and emerging sulfate treatment technologies
from the municipal and industrial sectors and source control options were reviewed, screened, and ranked
to understand their advantages and disadvantages and to identify potentially feasible technologies
currently available for sulfate removal.
Of the technologies reviewed, reverse osmosis (RO) and nanofiltration (NF), both membrane technologies,
were identified as the most promising, well-established technologies for sulfate removal. Part 1 also
stated that further research and development on cost-effective means for managing the salt-laden, liquid
waste generated by these processes is needed. This liquid waste stream is called either concentrate or
reject. The process and cost of managing this waste stream became a major part of Part 2.
Part 2 (2018) examines the practical design, implementation considerations, and costs of select treatment
technologies for use in removing sulfate in typical municipal WWTPs. Six hypothetical case studies are
presented that cover a broad range of sulfate treatment scenarios and treatment plant types.. The case
studies include: biological wastewater treatment plant costs, membrane treatment costs, concentrate
management costs, and if required, intermediate water treatment with a second stage of membrane
treatment for concentrate minimization.
1.2 Technology Summary from Part 1
The screening process used in Part 1 was a three-step process that included:
1. Threshold screening based on the technology’s degree of development and commercialization,
and ability to achieve a threshold sulfate removal performance;
2. Technology screening based on performance, cost, and other factors; and
3. Screening based on removal performance for other parameters of concern, such as nutrients,
chloride, total dissolved solids, and mercury.
The goal of the screening process was to understand the advantages and limitations of each sulfate
treatment approach, and to identify the most feasible treatment technologies for reducing sulfate in
municipal wastewater effluent using a uniform scoring and ranking methodology.

2
Of the 31 technologies evaluated, 18 technologies were screened out, and 13 technologies were
successful in the first level of screening and were then screened using these second level criteria. Second
level assessment is based on: effectiveness, operability/maintainability, relative cost, degree/complexity of
pre and post treatment requirements, and management of treatment residuals.
The treatment technologies that received the top ratings were reverse osmosis, and nano-filtration. These
technologies scored highest in effectiveness and operability/maintainability, including cold weather
performance. They have a high potential for beneficial reuse of the treated wastewater. Both of the
membrane technologies will produce a very high quality effluent for a wide variety of water reuse
applications. However, the membrane technologies received the lowest overall scores under the residuals
management category. Residuals management for membrane processes is a known technical and
economic challenge associated with this class of treatment technologies and is an area of active
investigation across several industries.
1.3 Summary of Part 2
In Part 2, the two top ranked technologies were used to develop capital and operating and maintenance
(O&M) costs for POTW’s with flows from 0.5 to 10 MGD. Table ES-1 shows the various flow rates and
biological treatment processes considered for evaluation and percentage of influent flow needed to be
treated by RO membrane process to achieve the target effluent sulfate level.
Table ES-1 Analysis cases for cost evaluations
Case
Number
Flow
(MGD)
Type of Biological
Treatment
Influent
Sulfate (mg/L)
Required Effluent
Sulfate (mg/L)
% of Flow
Treated by RO to
Meet Effluent
Target
1 10 Activated Sludge 100 10 93%
2 2.5 Trickling Filter 25 10 63%
3 2.5 Activated Sludge 600 100 89%
4 0.5 Activated Sludge 300 10 99%
5 0.5 Activated Sludge 300 100 74%
6 0.5 Facultative Pond 600 250 68%
Depending on the influent and the required effluent level for sulfate, the percentage that had to be
treated by the RO membrane system ranged from 60 to 99 percent. The major disadvantage with the RO
treatment process is the difficulty and expense of concentrate disposal. In MN, the only viable concentrate
disposal when RO treatment is used at POTW is a mechanical thermal evaporation (MTE) process. MTE is
sometimes referred to as a zero liquid discharge (ZLD) process since all the liquid concentrate waste is
evaporated and a solid residue remains requiring disposal in a landfill. The MTE process is a very
expensive capital and energy intensive process.

3
Table ES-7 Estimated costs for biological treatment costs for liquid treatment and biosolids
Case
Study
Biological Liquids Treatment Biosolids Processing
Capital Costs
($)
O&M Costs
($)
Capital Costs
($)
O&M Costs
($)
1 24,578,000 2,651,000 10,054,000 7,006,000
2 18,721,000 631,000 5,714,000 1,810,000
3 22,791,000 903,000 6,052,000 1,940,000
4 10,514,000 569,000 1,946,000 534,000
5 10,497,000 570,000 1,946,000 535,000
6 14,000,000 96,000 N/A N/A
Table ES-8 presents the sulfate removal costs and the concentrate disposal costs for the six cases. For
Cases 1, 3 and 4 concentrate minimization or volume reduction was analyzed by treating RO reject by lime
softening or pellet softening and then processing through a secondary RO system and a proprietary VSEP
secondary membrane treatment process.
Table ES-8 Estimated costs for sulfate removal by ro membrane treatment process and
concentrate management
Case
Study
Sulfate Removal Concentrate Treatment
Capital Costs
($)
O&M Costs
($)
Capital Costs
($)
O&M Costs
($)
1 33,821,000 1,623,000
(1) 34,000,000
(2) 28,500,000
(3) 65,308,000
(1) 14,033,000
(2) 14,598,000
(3) 6,878,000
2 11,748,000 449,000 16,250,000 3,478,000
3 11,318,000 466,000
(1) 25,250,000
(2) 17,750,000
(3) 38,400,000
(1) 5,979,000
(2) 5,203,000
(3) 2,964,000
4 7,318,000 94,000
(1) 14,600,000
(2) 10,000,000
(3) 17,000,000
(1) 1,841,000
(2) 1,429,000
(3) 948,000
5 7,293,000 133,000 12,000,000 2,094,000
6 5,452,000 88,00 13,000,000 2,479,000
(1) Lime softening is used prior to secondary (concentrate reduction) RO treatment.
(2) Pellet softening is used prior to secondary (concentrate reduction) RO treatment.
(3) A VSEP concentrator process is used treat RO concentrate.
4
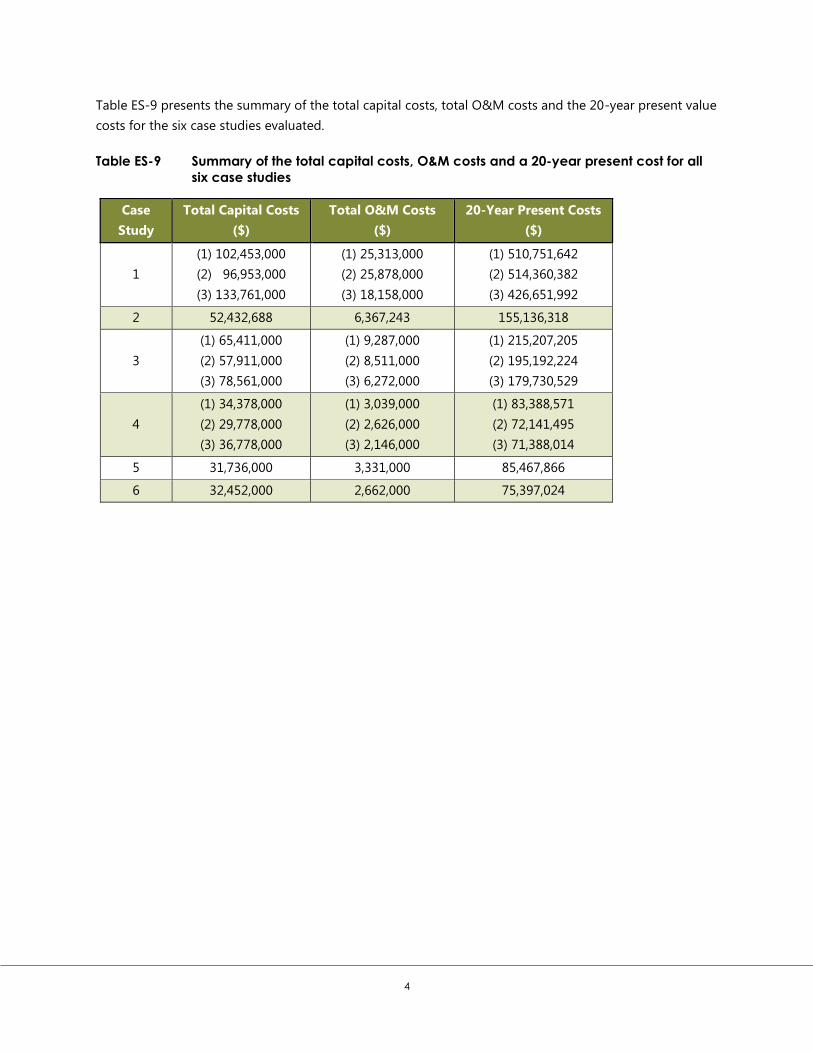
Table ES-9 presents the summary of the total capital costs, total O&M costs and the 20-year present value
costs for the six case studies evaluated.
Table ES-9 Summary of the total capital costs, O&M costs and a 20-year present cost for all
six case studies
Case
Study
Total Capital Costs
($)
Total O&M Costs
($)
20-Year Present Costs
($)
1
(1) 102,453,000
(2) 96,953,000
(3) 133,761,000
(1) 25,313,000
(2) 25,878,000
(3) 18,158,000
(1) 510,751,642
(2) 514,360,382
(3) 426,651,992
2 52,432,688 6,367,243 155,136,318
3
(1) 65,411,000
(2) 57,911,000
(3) 78,561,000
(1) 9,287,000
(2) 8,511,000
(3) 6,272,000
(1) 215,207,205
(2) 195,192,224
(3) 179,730,529
4
(1) 34,378,000
(2) 29,778,000
(3) 36,778,000
(1) 3,039,000
(2) 2,626,000
(3) 2,146,000
(1) 83,388,571
(2) 72,141,495
(3) 71,388,014
5 31,736,000 3,331,000 85,467,866
6 32,452,000 2,662,000 75,397,024
Barr Engineering Co. 4300 MarketPointe Drive, Suite 200 Minneapolis, MN 55435 952.832.2600 www.barr.com
Bolton & Menk, Inc. 1960 Premier Dr. Mankato, MN 56001 507.625.4171 www.bolton-menk.com
Analyzing Alternatives for Sulfate Treatment in Municipal Wastewater
Part 1: Feasibility Alternative Review
Prepared for Minnesota Pollution Control Agency
May 2018
P:\Mpls\23 MN\62\23621245 MPCA POTW Sulfate Treatment\WorkFiles\Report\Analyzing Alternatives for Sulfate Treatment in
Municipal Wastewater-Part 1 Final 05012018.docx
i
Certifications� � � � � � � � � � � � � � � � � � � � � � � � � � � � � � � � � � � � � � � � � � � � � � � � � � � � � � � � � � � � � � � � � � � � � � �� � � � � � � � � � � � � � � � � � � � � � � � � � � � � � � � � � � � � � � � � � � � � � � � � � � � � � � � � � � � � � � � � � � � � � � � � � � � � � � � � � � � � � � � � � � � � � � � � � � � � �� � � � � � � � � � � � � � �� � ! " # $ % & '( � � " � � � � ) * � %� � � � � � � � � � � � � � � � � � � � � � � � � � � � � � � � � � � � � � � � � � � � � � � � � � � � � � � � � � � � � � � � � � � � � � �� � � � � � � � � � � � � � � � � � � � � � � � � � � � � � � � � � � � � � � � � � � � � � � � � � � � � � � � � � � � � � � � � � � � � � � � � � � � � � � � � � � � � � � � � � � � � � � � � � � � � �( � � � � � � � � � �� � ! " ) � � + $( � � " � � � � ) * � %

ii
Acknowledgements The Project Team would like to acknowledge and thank the following individuals for their technical input and feedback, and for sharing their perspectives during the study:
• Andy Bradshaw – City of Moorhead, MN and Minnesota Environmental Science & Economic Review Board (MESERB)
• Al Parrella – Western Lake Superior Sanitary District (WLSSD) • Scott Kyser – MPCA • Bruce Henningsgaard – MPCA • Abram Peterson – MPCA • Brian Schweiss – MPCA
iii
Analyzing Alternatives for Sulfate Municipal Wastewater Treatment
May 2018
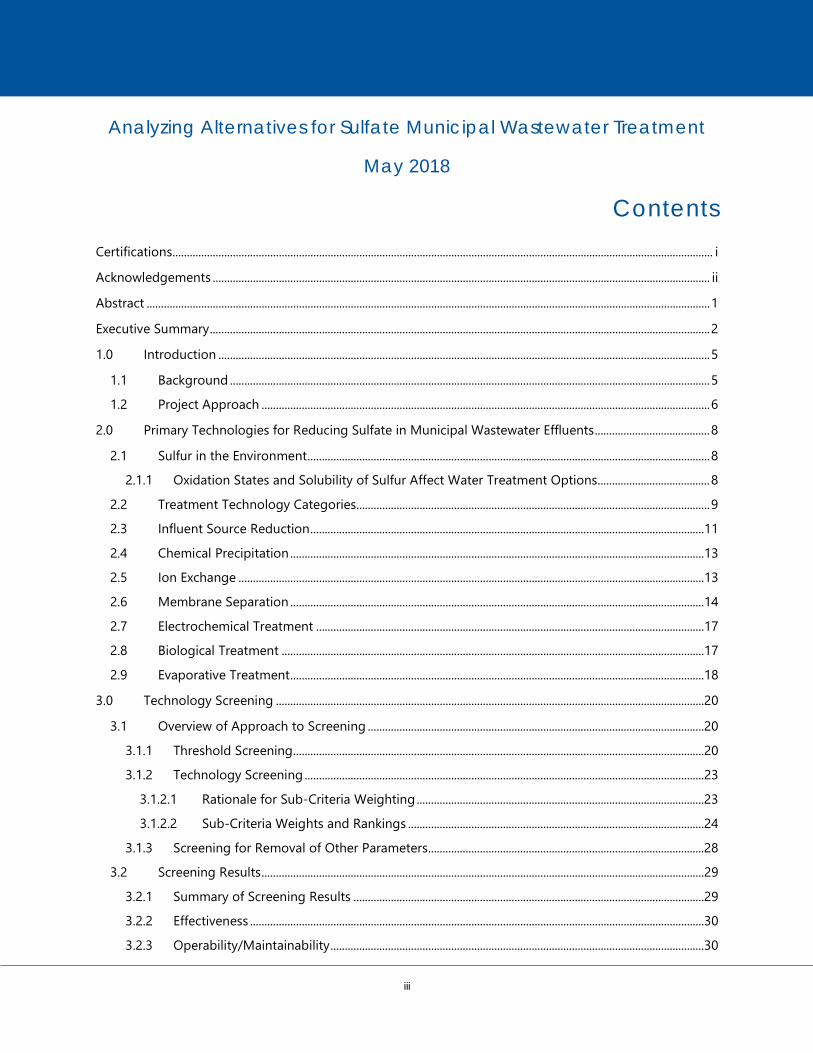
Contents Certifications............................................................................................................................................................................................ i
Acknowledgements ............................................................................................................................................................................. ii
Abstract .................................................................................................................................................................................................... 1
Executive Summary .............................................................................................................................................................................. 2
1.0 Introduction ........................................................................................................................................................................... 5
1.1 Background ....................................................................................................................................................................... 5
1.2 Project Approach ............................................................................................................................................................ 6
2.0 Primary Technologies for Reducing Sulfate in Municipal Wastewater Effluents ........................................ 8
2.1 Sulfur in the Environment ............................................................................................................................................ 8
2.1.1 Oxidation States and Solubility of Sulfur Affect Water Treatment Options ....................................... 8
2.2 Treatment Technology Categories........................................................................................................................... 9
2.3 Influent Source Reduction .........................................................................................................................................11
2.4 Chemical Precipitation ................................................................................................................................................13
2.5 Ion Exchange ..................................................................................................................................................................13
2.6 Membrane Separation ................................................................................................................................................14
2.7 Electrochemical Treatment .......................................................................................................................................17
2.8 Biological Treatment ...................................................................................................................................................17
2.9 Evaporative Treatment ................................................................................................................................................18
3.0 Technology Screening .....................................................................................................................................................20
3.1 Overview of Approach to Screening .....................................................................................................................20
3.1.1 Threshold Screening ...............................................................................................................................................20
3.1.2 Technology Screening ...........................................................................................................................................23
3.1.2.1 Rationale for Sub-Criteria Weighting ....................................................................................................23
3.1.2.2 Sub-Criteria Weights and Rankings .......................................................................................................24
3.1.3 Screening for Removal of Other Parameters ................................................................................................28
3.2 Screening Results ..........................................................................................................................................................29
3.2.1 Summary of Screening Results ..........................................................................................................................29
3.2.2 Effectiveness ..............................................................................................................................................................30
3.2.3 Operability/Maintainability ..................................................................................................................................30
iv
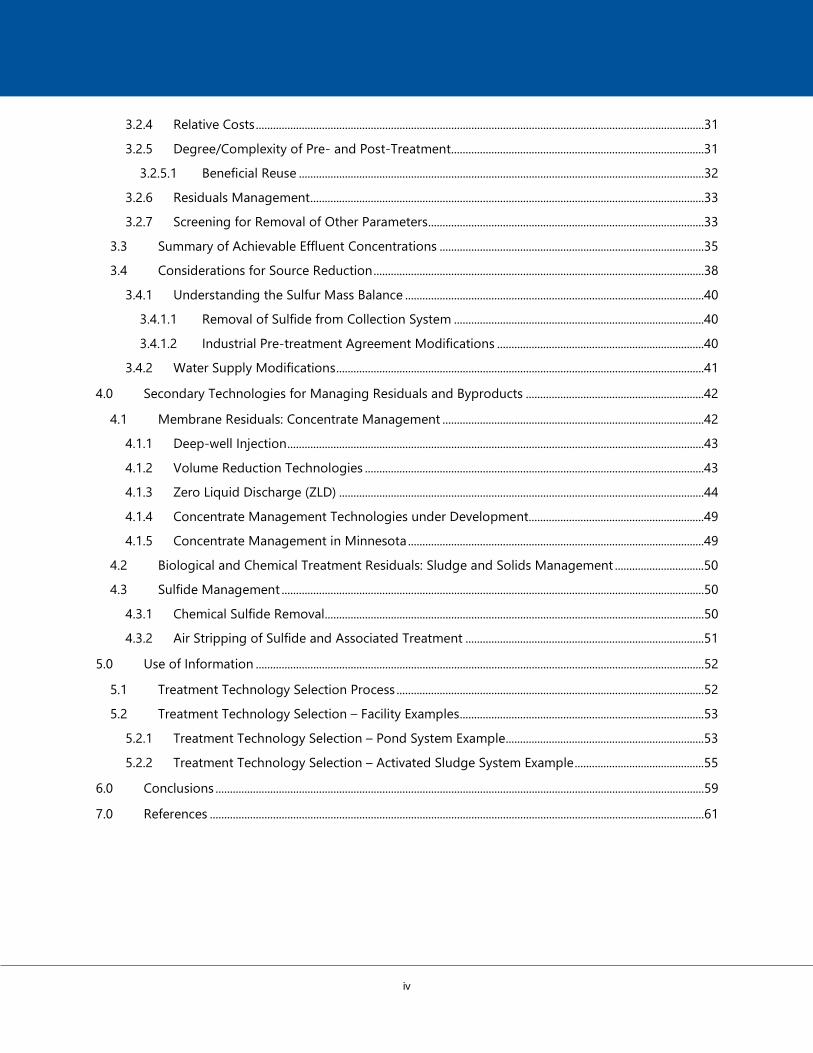
3.2.4 Relative Costs ............................................................................................................................................................31
3.2.5 Degree/Complexity of Pre- and Post-Treatment........................................................................................31
3.2.5.1 Beneficial Reuse .............................................................................................................................................32
3.2.6 Residuals Management .........................................................................................................................................33
3.2.7 Screening for Removal of Other Parameters ................................................................................................33
3.3 Summary of Achievable Effluent Concentrations ............................................................................................35
3.4 Considerations for Source Reduction ...................................................................................................................38
3.4.1 Understanding the Sulfur Mass Balance ........................................................................................................40
3.4.1.1 Removal of Sulfide from Collection System .......................................................................................40
3.4.1.2 Industrial Pre-treatment Agreement Modifications ........................................................................40
3.4.2 Water Supply Modifications ................................................................................................................................41
4.0 Secondary Technologies for Managing Residuals and Byproducts ..............................................................42
4.1 Membrane Residuals: Concentrate Management ...........................................................................................42
4.1.1 Deep-well Injection .................................................................................................................................................43
4.1.2 Volume Reduction Technologies ......................................................................................................................43
4.1.3 Zero Liquid Discharge (ZLD) ...............................................................................................................................44
4.1.4 Concentrate Management Technologies under Development.............................................................49
4.1.5 Concentrate Management in Minnesota .......................................................................................................49
4.2 Biological and Chemical Treatment Residuals: Sludge and Solids Management ...............................50
4.3 Sulfide Management ...................................................................................................................................................50
4.3.1 Chemical Sulfide Removal....................................................................................................................................50
4.3.2 Air Stripping of Sulfide and Associated Treatment ...................................................................................51
5.0 Use of Information ............................................................................................................................................................52
5.1 Treatment Technology Selection Process ...........................................................................................................52
5.2 Treatment Technology Selection – Facility Examples .....................................................................................53
5.2.1 Treatment Technology Selection – Pond System Example .....................................................................53
5.2.2 Treatment Technology Selection – Activated Sludge System Example .............................................55
6.0 Conclusions ..........................................................................................................................................................................59
7.0 References ............................................................................................................................................................................61
v
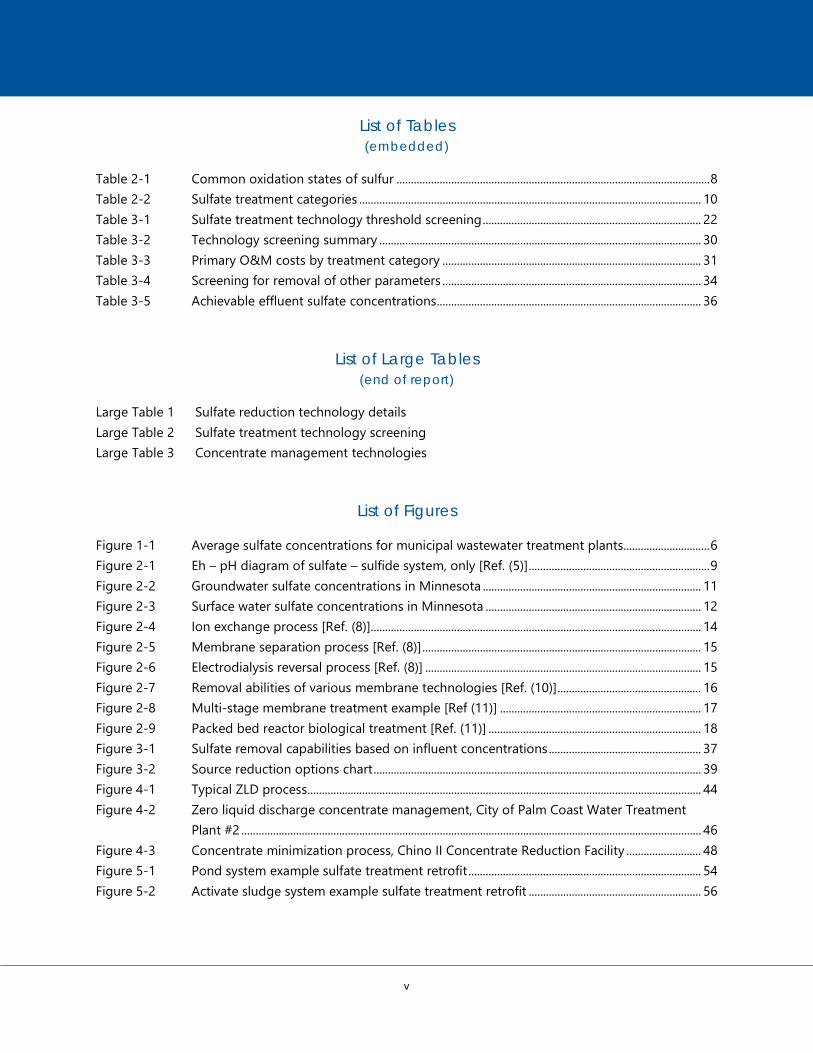
List of Tables (embedded)
Table 2-1 Common oxidation states of sulfur ............................................................................................................. 8 Table 2-2 Sulfate treatment categories ....................................................................................................................... 10 Table 3-1 Sulfate treatment technology threshold screening ............................................................................ 22 Table 3-2 Technology screening summary ................................................................................................................ 30 Table 3-3 Primary O&M costs by treatment category .......................................................................................... 31 Table 3-4 Screening for removal of other parameters .......................................................................................... 34 Table 3-5 Achievable effluent sulfate concentrations ............................................................................................ 36
List of Large Tables (end of report)
Large Table 1 Sulfate reduction technology details Large Table 2 Sulfate treatment technology screening Large Table 3 Concentrate management technologies
List of Figures
Figure 1-1 Average sulfate concentrations for municipal wastewater treatment plants.............................. 6 Figure 2-1 Eh – pH diagram of sulfate – sulfide system, only [Ref. (5)] ............................................................... 9 Figure 2-2 Groundwater sulfate concentrations in Minnesota ............................................................................ 11 Figure 2-3 Surface water sulfate concentrations in Minnesota ........................................................................... 12 Figure 2-4 Ion exchange process [Ref. (8)]................................................................................................................... 14 Figure 2-5 Membrane separation process [Ref. (8)] ................................................................................................. 15 Figure 2-6 Electrodialysis reversal process [Ref. (8)] ................................................................................................ 15 Figure 2-7 Removal abilities of various membrane technologies [Ref. (10)] .................................................. 16 Figure 2-8 Multi-stage membrane treatment example [Ref (11)] ...................................................................... 17 Figure 2-9 Packed bed reactor biological treatment [Ref. (11)] .......................................................................... 18 Figure 3-1 Sulfate removal capabilities based on influent concentrations ..................................................... 37 Figure 3-2 Source reduction options chart .................................................................................................................. 39 Figure 4-1 Typical ZLD process ......................................................................................................................................... 44 Figure 4-2 Zero liquid discharge concentrate management, City of Palm Coast Water Treatment
Plant #2 ................................................................................................................................................................ 46 Figure 4-3 Concentrate minimization process, Chino II Concentrate Reduction Facility .......................... 48 Figure 5-1 Pond system example sulfate treatment retrofit ................................................................................. 54 Figure 5-2 Activate sludge system example sulfate treatment retrofit ............................................................ 56

vi
Acronyms
Acronym Description ARROW Advanced reject recovery of water BOD Biochemical oxygen demand CCD RO Closed-circuit desalination reverse osmosis CESR Cost-effective sulfate removal CIP Clean-in-place CRF Concentrate reduction facility ED/EDR Electrodialysis/electrodialysis reversal EPWU El Paso Water Utilities EWM Enviro Water Minerals Company FO Forward osmosis GAC Granulated activated carbon HERO High efficiency reverse osmosis IX Ion exchange KBH Kay Bailey Hutchison Drinking Water Desalination Plant MDC Membrane distillation with crystallization MDH Minnesota Department of Health MGD Million gallons per day MPCA Minnesota Pollution Control Agency NF Nanofiltration NPDES National Pollutant Discharge Elimination System O&M Operation and maintenance RO Reverse osmosis SANI Sulfate reduction, autotrophic denitrification, and nitrification integrated SBR Sequencing batch reactor SDWA Safe Drinking Water Act SPARRO Slurry precipitation and reverse osmosis SRB Sulfate-reducing bacteria TCLP Toxicity characteristic leaching procedure TDS Total dissolved solids TOC Total organic carbon TSS Total suspended solids U of MN University of Minnesota UF Ultrafiltration UIC Underground Injection Control USBR United States Bureau of Reclamation UASB Upflow anaerobic sludge blanket USEPA United States Environmental Protection Agency VSEP Vibratory shear enhanced processing

vii
WWTP Wastewater treatment plant ZDD Zero discharge desalination ZLD Zero-liquid discharge
1
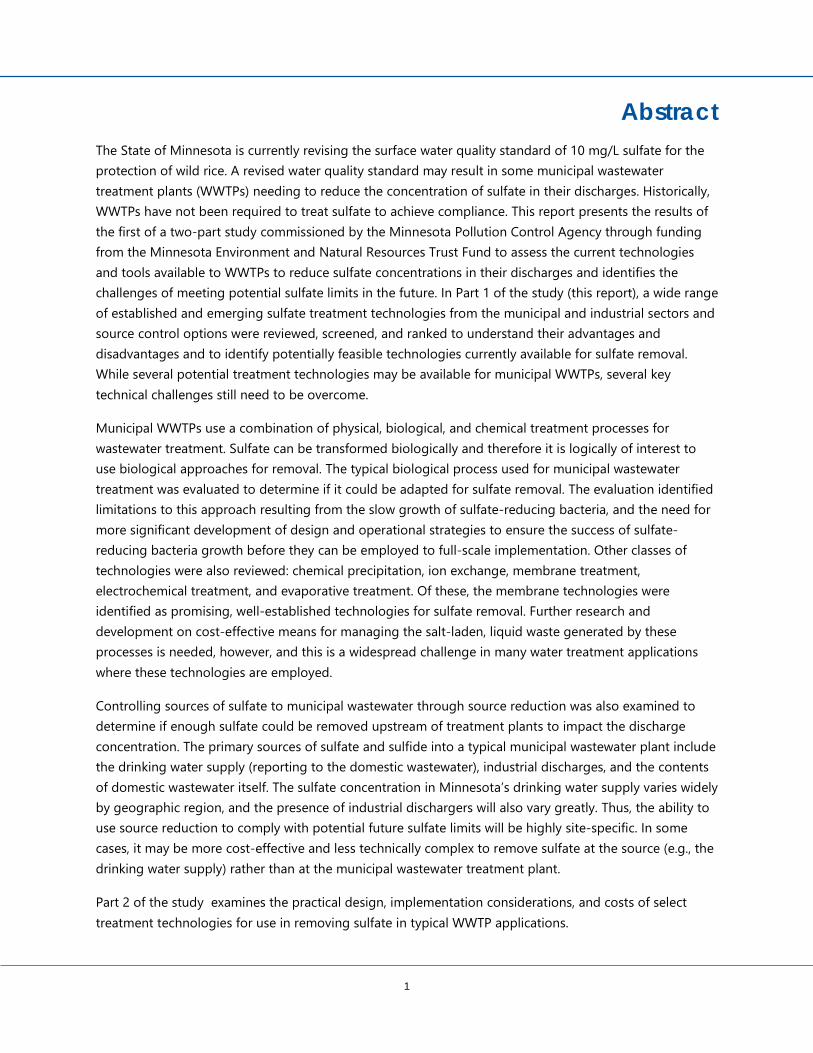
Abstract The State of Minnesota is currently revising the surface water quality standard of 10 mg/L sulfate for the protection of wild rice. A revised water quality standard may result in some municipal wastewater treatment plants (WWTPs) needing to reduce the concentration of sulfate in their discharges. Historically, WWTPs have not been required to treat sulfate to achieve compliance. This report presents the results of the first of a two-part study commissioned by the Minnesota Pollution Control Agency through funding from the Minnesota Environment and Natural Resources Trust Fund to assess the current technologies and tools available to WWTPs to reduce sulfate concentrations in their discharges and identifies the challenges of meeting potential sulfate limits in the future. In Part 1 of the study (this report), a wide range of established and emerging sulfate treatment technologies from the municipal and industrial sectors and source control options were reviewed, screened, and ranked to understand their advantages and disadvantages and to identify potentially feasible technologies currently available for sulfate removal. While several potential treatment technologies may be available for municipal WWTPs, several key technical challenges still need to be overcome.
Municipal WWTPs use a combination of physical, biological, and chemical treatment processes for wastewater treatment. Sulfate can be transformed biologically and therefore it is logically of interest to use biological approaches for removal. The typical biological process used for municipal wastewater treatment was evaluated to determine if it could be adapted for sulfate removal. The evaluation identified limitations to this approach resulting from the slow growth of sulfate-reducing bacteria, and the need for more significant development of design and operational strategies to ensure the success of sulfate-reducing bacteria growth before they can be employed to full-scale implementation. Other classes of technologies were also reviewed: chemical precipitation, ion exchange, membrane treatment, electrochemical treatment, and evaporative treatment. Of these, the membrane technologies were identified as promising, well-established technologies for sulfate removal. Further research and development on cost-effective means for managing the salt-laden, liquid waste generated by these processes is needed, however, and this is a widespread challenge in many water treatment applications where these technologies are employed.
Controlling sources of sulfate to municipal wastewater through source reduction was also examined to determine if enough sulfate could be removed upstream of treatment plants to impact the discharge concentration. The primary sources of sulfate and sulfide into a typical municipal wastewater plant include the drinking water supply (reporting to the domestic wastewater), industrial discharges, and the contents of domestic wastewater itself. The sulfate concentration in Minnesota’s drinking water supply varies widely by geographic region, and the presence of industrial dischargers will also vary greatly. Thus, the ability to use source reduction to comply with potential future sulfate limits will be highly site-specific. In some cases, it may be more cost-effective and less technically complex to remove sulfate at the source (e.g., the drinking water supply) rather than at the municipal wastewater treatment plant.
Part 2 of the study examines the practical design, implementation considerations, and costs of select treatment technologies for use in removing sulfate in typical WWTP applications.
2
Executive Summary The State of Minnesota is currently in the process of revising the surface water quality standards for sulfate applicable to wild rice. While many states have sulfate water quality standards, Minnesota is unique because it is the only state in the United States that has established a sulfate standard for the protection of wild rice, currently 10 mg/L. When the new water quality standard is implemented, some municipal wastewater treatment plants may be required to remove sulfate to comply with National Pollutant Discharge Elimination System (NPDES) permit limits protective of the surface water quality standard for sulfate applicable to wild rice. The proposed water quality standard is equation-based, site-specific, and has the potential to generate a wide range of protective sulfate concentrations from less than 1 mg/L to greater than 1,000 mg/L. Historically, municipal wastewater systems have not been required to consider sulfate treatment for discharge compliance purposes, so little information is available concerning the applicability of sulfate treatment technologies to municipal wastewater processes for this purpose. This study was designed to address the sulfate treatment requirements associated with a wide range of potential effluent concentration limits.
Sulfur in wastewater is most commonly present as sulfate or sulfide, which originates primarily from drinking water sources, human waste, and industrial discharges. More than 95% of municipalities in Minnesota use groundwater as the source for their drinking water. The concentrations of sulfate in the groundwater vary geographically across the state from less than 10 mg/L to over 500 mg/L. Untreated domestic wastewater constituents typically add another 20 to 50 mg/L of sulfate [Ref. (1)], and some municipalities may have additional industrial contributions. The form of sulfur is dependent on the condition of the wastewater, with sulfate present in oxygen-rich waters and sulfide present in oxygen-depleted water. The environmental conditions that help determine the state of sulfur in wastewater may be readily transformed, either biologically or chemically, by natural and engineered processes. Both sulfate and sulfide provide pathways for the removal of sulfur from wastewater. However, the technologies available to remove sulfate and sulfide from wastewater have mostly been developed and employed in applications other than municipal wastewater treatment, including drinking water treatment, mine water treatment, power generation, and others.
In this study, treatment technologies for sulfate removal were reviewed and screened for their applicability and potential use by municipal wastewater treatment plants needing to reduce sulfate from their discharge in the future. The screening criteria included effectiveness, operability and maintainability, relative costs, degree and complexity of additional pre- and post-treatment, residuals management, and ability to remove other parameters of concern. The technologies reviewed were grouped into six general categories: chemical precipitation, ion exchange, membrane separation, electrochemical, biological, and evaporative treatment. Because removal of sulfate from municipal wastewater has not previously been widely implemented, technologies still in early stages of testing and development were also included for completeness and future reference and to gauge the “state of the industry” at this time.
The technology screening process results indicate that reverse osmosis and nanofiltration are the most well-developed and effective alternatives for sulfate removal. This class of technologies is able to remove

3
sulfate from wastewater to low concentrations (e.g., <50 mg/L). However, membrane technologies generate a salty, liquid waste (concentrate) that is technically challenging and costly to manage. While membrane treatment is widely used and commercialized, concentrate management is an active area of research and development in the wastewater treatment industry due to the complexity and cost of final waste management and disposal. As a result, concentrate management must be carefully considered when planning for implementation of membrane technologies. Chemical precipitation and ion exchange scored slightly below reverse osmosis and nanofiltration (membrane technologies), primarily due to limited ability to remove sulfate to low concentrations (e.g., less than 50 mg/L), fewer commercial applications, and higher risks to operator and public health. However, depending upon the influent sulfate concentration, if a wastewater treatment plant effluent limit for sulfate is above 50 mg/L, a chemical precipitation or ion exchange treatment technology may be effective for the required sulfate removal. The screening results also reflect the state of the industry today in terms of municipal wastewater treatment for sulfate removal and provide an indication of additional technologies that may be viable in the future pending further commercialization, demonstration of reliable operation, and residuals management developments.
Because municipal wastewater treatment plants use biological treatment for removal of common pollutants from wastewater (e.g., biochemical oxygen demand, suspended solids, and nutrients), it is logical to consider biological treatment options for sulfate removal. The literature review identified numerous biological treatment processes that are under development for sulfate removal, but few that are commercialized and have demonstrated reliability in full-scale applications as would be required for sulfate removal from municipal WWTPs. Biological treatment of sulfate has primarily been applied to mine water treatment, where metals removal by converting sulfate to sulfide is the primary goal, not sulfate removal; so in those settings, low-efficiency biological treatment systems like constructed wetlands and mine pit reactors are practical. Fundamentally, due to the slow growth of sulfate-reducing bacteria, a much longer retention time is required in the biological reactor than is typically practical in municipal wastewater treatment. This class of treatment technologies, overall, requires significant development of design and operational strategies to ensure the success of sulfate-reducing bacteria growth before they can be employed to full-scale implementation for municipal wastewater treatment. These limitations resulted in biological treatment receiving technology screening scores on the lowest end of the range compared to the other treatment technologies.
The utility of controlling sources of sulfate to municipal wastewater through source reduction was also examined to determine if enough sulfate could be removed upstream of treatment plants to impact the discharge concentration. The primary sources of sulfate and sulfide into a typical municipal wastewater plant include the drinking water supply (reporting to the domestic wastewater), industrial discharges, and the contents of domestic wastewater itself. The sulfate concentration in Minnesota’s drinking water supply varies widely by geographic region, and the presence of industrial dischargers will also vary greatly. Thus, the ability to use source reduction to comply with potential future sulfate limits will be highly site-specific. Not all industrial discharges contain sulfate, but those that do may not be able to provide additional pre-treatment or process modifications to reduce the sulfate or sulfide in their discharges to the collection system. Municipalities faced with the need for compliance options for meeting a new sulfate limit,

4
however, should consider source reduction as part of their evaluations, starting with a basic mass balance of sources into their plant compared with the mass of sulfate that needs to be removed.
This report (Part 1 of the two-part study) provides an overview of the treatment technologies available and those currently under development for sulfate removal, and synthesizes the findings into guidance for municipalities and other interested parties to follow in their initial assessments of how to comply with potential future sulfate limits. Part 1 of the study also reviewed if and to what degree the sulfate removal technologies may provide added benefit for removal of other parameters of concern, such as chloride, mercury, nitrogen, phosphorus, and total dissolved solids. In Part 2 of the project, conceptual designs of select treatment approaches were developed to illustrate key technical considerations that are associated with technology implementation. Cost estimates for the conceptual designs were also developed.

5
1.0 Introduction 1.1 Background The Minnesota Pollution Control Agency (MPCA) is in the process of revising the existing sulfate surface water quality standard. Minnesota is unique in that it is the only state in the United States with a sulfate standard for the protection of wild rice, currently 10 mg/L. The new rule is expected to include consideration of site-specific chemistry when calculating the in-stream water quality standards. As a consequence, wastewater effluent sulfate limits will typically need to be calculated and imposed to meet the in-stream water quality standard. Some municipal wastewater treatment plants may be required to remove sulfate in the future to comply with potential future NPDES permit effluent limits for sulfate.
Historically, sulfate treatment has primarily been applied to industrial water and wastewater treatment in industries such as mining, metal finishing, and wood products for the purposes of metals removal, total dissolved solids reduction, and sulfate removal. It is removed (as a component of dissolved solids removal) in many high-pressure industrial boiler applications as part of boiler feed water production. Municipal wastewater systems have not typically considered sulfate treatment (beyond considerations related to corrosion or odor control). Therefore, little information is available concerning the applicability of sulfate treatment technologies to municipal wastewater processes for the purpose of effluent limit compliance.
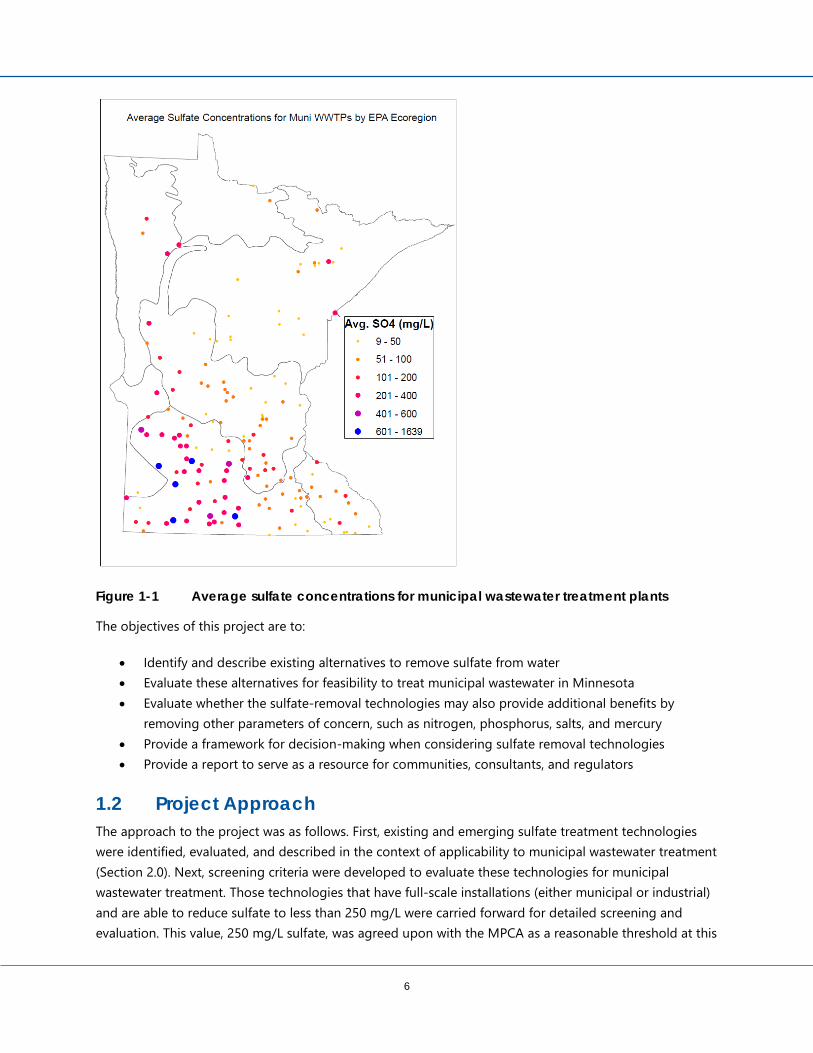
Municipal wastewater sulfate concentrations in Minnesota range from about 10 to over 1,500 mg/L and originate from a drinking water source (i.e., river or aquifer), human waste, or industrial sources [Ref. (2)]. As shown on Figure 1-1, there are currently 152 municipal WWTPs in Minnesota that monitor effluent sulfate concentrations. Minnesota has over 600 municipal WWTPs permitted to discharge to surface water. The MPCA assigns municipal WWTPs sulfate monitoring requirements for the following reasons:
• The facility has been identified as being upstream of a wild rice water. • The facility is a continuous discharger that discharges to a low-dilution receiving water. • The facility receives flow from industrial users known to have high salt concentrations.
Figure 1-1 shows the average sulfate concentrations across the state for the WWTPs currently monitoring effluent sulfate.
6
Figure 1-1 Average sulfate concentrations for municipal wastewater treatment plants
The objectives of this project are to:
• Identify and describe existing alternatives to remove sulfate from water • Evaluate these alternatives for feasibility to treat municipal wastewater in Minnesota • Evaluate whether the sulfate-removal technologies may also provide additional benefits by
removing other parameters of concern, such as nitrogen, phosphorus, salts, and mercury • Provide a framework for decision-making when considering sulfate removal technologies • Provide a report to serve as a resource for communities, consultants, and regulators
1.2 Project Approach The approach to the project was as follows. First, existing and emerging sulfate treatment technologies were identified, evaluated, and described in the context of applicability to municipal wastewater treatment (Section 2.0). Next, screening criteria were developed to evaluate these technologies for municipal wastewater treatment. Those technologies that have full-scale installations (either municipal or industrial) and are able to reduce sulfate to less than 250 mg/L were carried forward for detailed screening and evaluation. This value, 250 mg/L sulfate, was agreed upon with the MPCA as a reasonable threshold at this

7
time for use in focusing on technologies that hold the greatest potential for reliable treatment. Additional screening criteria were applied and promising technologies were ranked (Section 3.0). In addition, secondary technologies for managing treatment residuals and byproducts, such as brine, sludge, and sulfide, were also researched and described (Section 4.0). Based on technology screening, some examples regarding how municipalities and regulators can use this information to assist in selecting appropriate sulfate treatment technologies were developed (Section 5.0). Conclusions from the study are summarized (Section 6.0).
When considering and identifying treatment technologies, to the extent possible, the focus was placed on technology categories rather than specific proprietary technologies. Within any one treatment technology category, there may be many proprietary and non-proprietary versions available by which to implement the process. This report does not attempt to identify all versions of a particular process or technology category. Where appropriate, some specific proprietary technologies are given. In these cases, these technologies provide a useful illustration of variations in configurations available or highlight a unique process element for consideration. Where a specific proprietary technology has been included in this report, no endorsement of the product is explicit or implied.
8
2.0 Primary Technologies for Reducing Sulfate in Municipal Wastewater Effluents
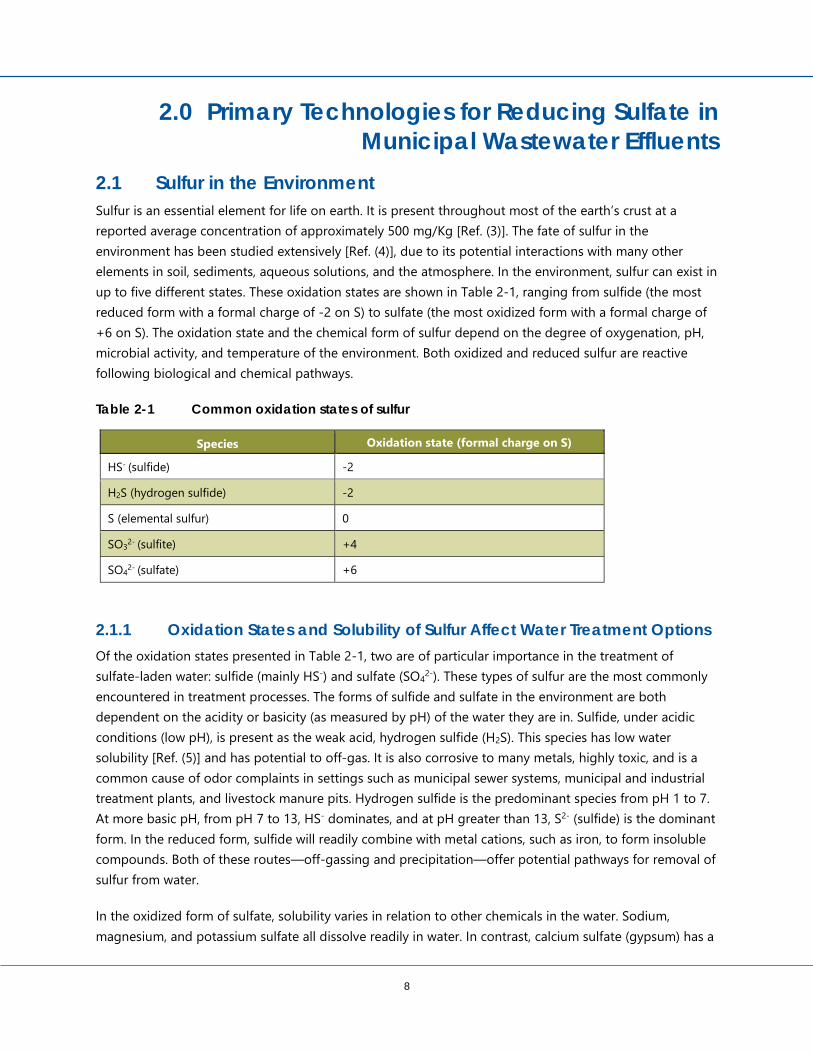
2.1 Sulfur in the Environment Sulfur is an essential element for life on earth. It is present throughout most of the earth’s crust at a reported average concentration of approximately 500 mg/Kg [Ref. (3)]. The fate of sulfur in the environment has been studied extensively [Ref. (4)], due to its potential interactions with many other elements in soil, sediments, aqueous solutions, and the atmosphere. In the environment, sulfur can exist in up to five different states. These oxidation states are shown in Table 2-1, ranging from sulfide (the most reduced form with a formal charge of -2 on S) to sulfate (the most oxidized form with a formal charge of +6 on S). The oxidation state and the chemical form of sulfur depend on the degree of oxygenation, pH, microbial activity, and temperature of the environment. Both oxidized and reduced sulfur are reactive following biological and chemical pathways.
Table 2-1 Common oxidation states of sulfur
Species Oxidation state (formal charge on S)
HS- (sulfide) -2
H2S (hydrogen sulfide) -2
S (elemental sulfur) 0
SO32- (sulfite) +4
SO42- (sulfate) +6
2.1.1 Oxidation States and Solubility of Sulfur Affect Water Treatment Options Of the oxidation states presented in Table 2-1, two are of particular importance in the treatment of sulfate-laden water: sulfide (mainly HS-) and sulfate (SO42-). These types of sulfur are the most commonly encountered in treatment processes. The forms of sulfide and sulfate in the environment are both dependent on the acidity or basicity (as measured by pH) of the water they are in. Sulfide, under acidic conditions (low pH), is present as the weak acid, hydrogen sulfide (H2S). This species has low water solubility [Ref. (5)] and has potential to off-gas. It is also corrosive to many metals, highly toxic, and is a common cause of odor complaints in settings such as municipal sewer systems, municipal and industrial treatment plants, and livestock manure pits. Hydrogen sulfide is the predominant species from pH 1 to 7. At more basic pH, from pH 7 to 13, HS- dominates, and at pH greater than 13, S2- (sulfide) is the dominant form. In the reduced form, sulfide will readily combine with metal cations, such as iron, to form insoluble compounds. Both of these routes—off-gassing and precipitation—offer potential pathways for removal of sulfur from water.
In the oxidized form of sulfate, solubility varies in relation to other chemicals in the water. Sodium, magnesium, and potassium sulfate all dissolve readily in water. In contrast, calcium sulfate (gypsum) has a

9
moderate solubility and barium sulfate is generally insoluble, which makes these salts amenable to sulfate removal via chemical precipitation.
Elemental sulfur, S(s), can form in some conditions, but its formation can be difficult to control, as evidenced by the small area shown for elemental sulfur on Figure 2-1 as S(s).
Figure 2-1 Eh – pH diagram of sulfate – sulfide system, only [Ref. (5)]
One of the most challenging aspects of sulfate removal is that sulfur can be readily transformed from sulfate to sulfide (and back to sulfate) biologically and chemically (by exposure to oxygen in air, for example). Each of these routes offers potential options for removing sulfur mass (and therefore sulfate mass) from wastewater, but it also means that all aspects of the treatment process must be managed so that sulfur is actually removed from the system rather than temporarily transformed to a different form, but not permanently removed from the environment where it can convert back to sulfate.
2.2 Treatment Technology Categories Table 2-2 provides the sulfate treatment categories identified and treatment technologies specifically evaluated as part of the study. Sulfate influent source reduction was evaluated separately in Section 2.3 and not as a specific treatment technology category.

10
Table 2-2 Sulfate treatment categories
Technology Category Treatment Technology
Chemical Precipitation
Gypsum Precipitation
Ettringite Precipitation (Cost-Effective Sulfate Removal (CESR) or SAVMIN)
Ettringite Precipitation with Aluminum Recovery (LoSO4)
Barite Precipitation
Co-Precipitation with Aluminum
Ion Exchange Conventional Ion Exchange
Sulf-IX
Membranes
Closed-circuit Desalination Reverse Osmosis (CCD RO)
Electrodialysis Reversal (EDR)
Zero Discharge Desalination (ZDD)
Membrane Distillation
Nanofiltration (NF)
Conventional Reverse Osmosis (RO)
Vibratory Shear Enhanced Processing (VSEP)
Forward Osmosis
Electrochemical Electrocoagulation
Electrochemical Reduction
Biological
Constructed Wetlands
Floating Wetlands
Pit Lake or In-Pit Treatment
Constructed Trench Bioreactors/ Permeable Reactive Barriers Suspended-Growth Reactor (Activated Sludge Modification)
Membrane Bioreactor
Upflow Anaerobic Sludge Blanket (UASB) Reactor with Sulfide Treatment
Packed Bed Bioreactor
Packed Bed (BioSulphide)
Bioelectrochemical
Sulfate Reduction Deammonification
Liquid-phase biofilters
Sulfate Reduction, Autotrophic Denitrification, and Nitrification Integrated Process (SANI)
Evaporative Direct Heat-contact Evaporation (LM-HT Concentrator) Mechanical Vapor Recompression Evaporation with Crystallization or Spray Drying
11
The following sections broadly describe the sulfate treatment technology categories included in Table 2-2, and also addresses source control in Section 2.3. More detailed information about specific technologies, including descriptions, existing vendor examples, lowest achievable sulfate concentrations, chemical additives, and additional treatment requirements, are shown in Large Table 1.
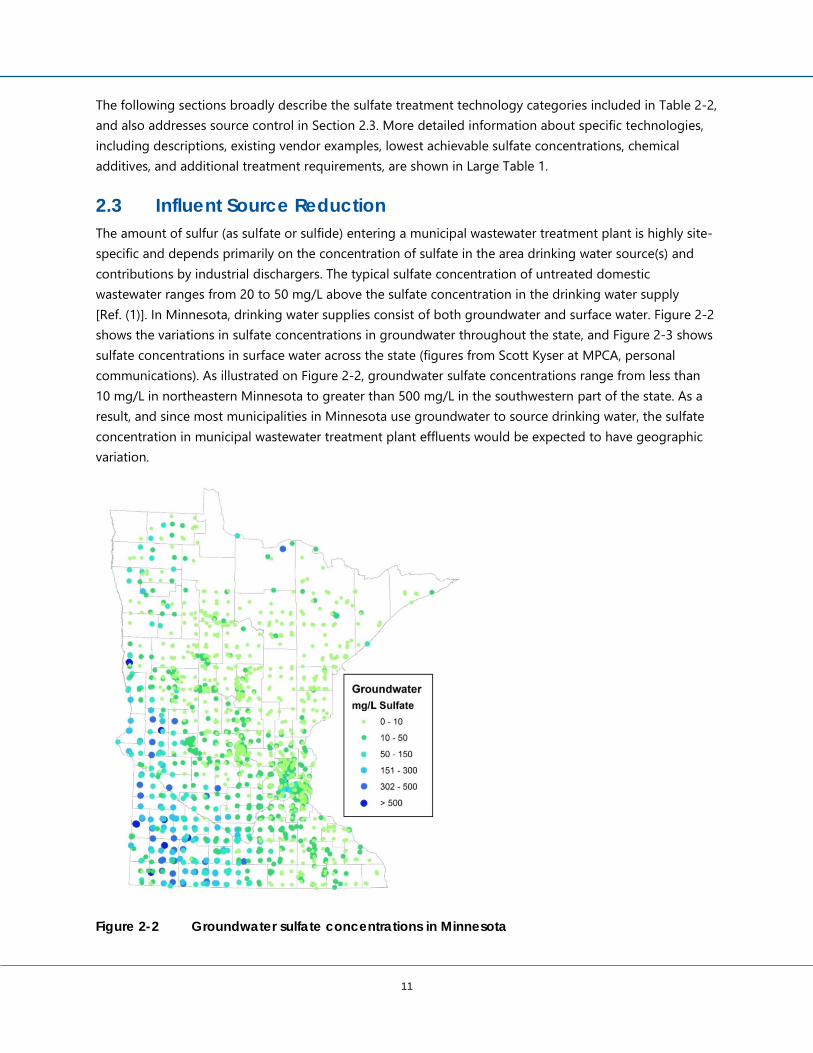
2.3 Influent Source Reduction The amount of sulfur (as sulfate or sulfide) entering a municipal wastewater treatment plant is highly site-specific and depends primarily on the concentration of sulfate in the area drinking water source(s) and contributions by industrial dischargers. The typical sulfate concentration of untreated domestic wastewater ranges from 20 to 50 mg/L above the sulfate concentration in the drinking water supply [Ref. (1)]. In Minnesota, drinking water supplies consist of both groundwater and surface water. Figure 2-2 shows the variations in sulfate concentrations in groundwater throughout the state, and Figure 2-3 shows sulfate concentrations in surface water across the state (figures from Scott Kyser at MPCA, personal communications). As illustrated on Figure 2-2, groundwater sulfate concentrations range from less than 10 mg/L in northeastern Minnesota to greater than 500 mg/L in the southwestern part of the state. As a result, and since most municipalities in Minnesota use groundwater to source drinking water, the sulfate concentration in municipal wastewater treatment plant effluents would be expected to have geographic variation.
Figure 2-2 Groundwater sulfate concentrations in Minnesota
12
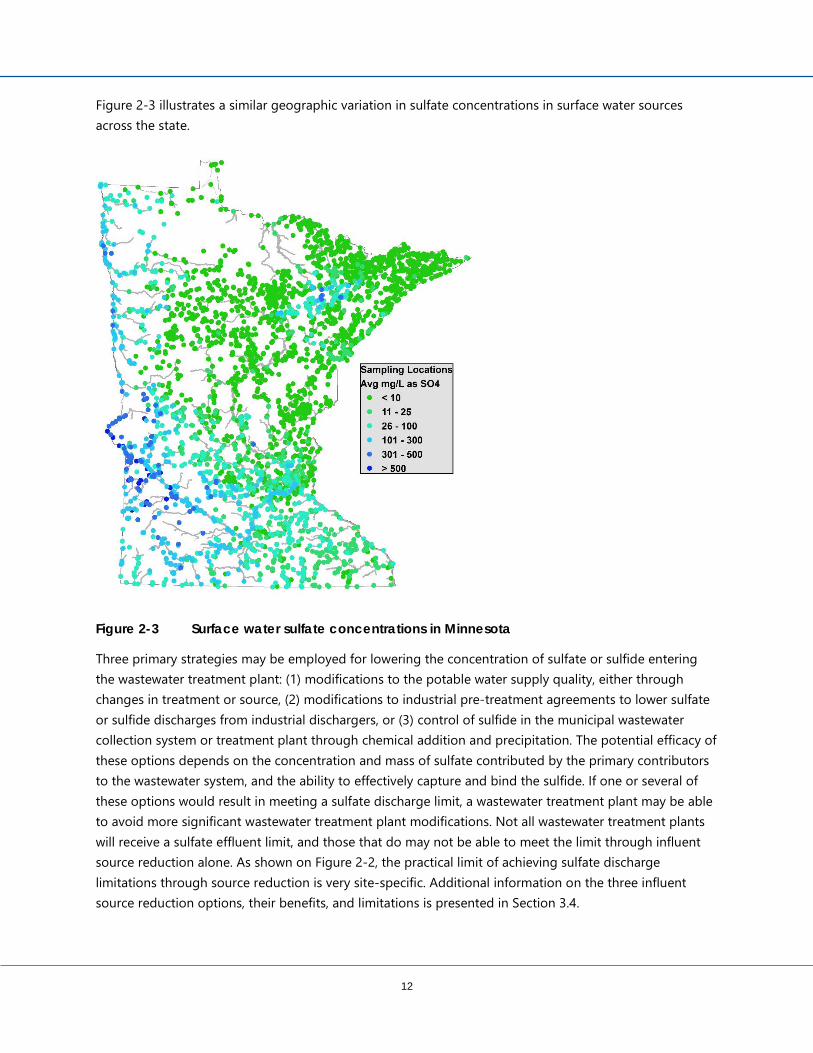
Figure 2-3 illustrates a similar geographic variation in sulfate concentrations in surface water sources across the state.
Figure 2-3 Surface water sulfate concentrations in Minnesota
Three primary strategies may be employed for lowering the concentration of sulfate or sulfide entering the wastewater treatment plant: (1) modifications to the potable water supply quality, either through changes in treatment or source, (2) modifications to industrial pre-treatment agreements to lower sulfate or sulfide discharges from industrial dischargers, or (3) control of sulfide in the municipal wastewater collection system or treatment plant through chemical addition and precipitation. The potential efficacy of these options depends on the concentration and mass of sulfate contributed by the primary contributors to the wastewater system, and the ability to effectively capture and bind the sulfide. If one or several of these options would result in meeting a sulfate discharge limit, a wastewater treatment plant may be able to avoid more significant wastewater treatment plant modifications. Not all wastewater treatment plants will receive a sulfate effluent limit, and those that do may not be able to meet the limit through influent source reduction alone. As shown on Figure 2-2, the practical limit of achieving sulfate discharge limitations through source reduction is very site-specific. Additional information on the three influent source reduction options, their benefits, and limitations is presented in Section 3.4.

13
2.4 Chemical Precipitation One common way to remove sulfate from water is to remove it as a solid, insoluble sulfate salt. Chemical precipitation for sulfate removal is used widely in both mining and industrial applications. The minimum achievable sulfate concentration depends on the specific salt formed. For example, lime (calcium hydroxide) can be added to water to remove sulfate as gypsum (calcium sulfate); however, this method can only reduce the sulfate concentration to about 1,500 mg/L. This is significantly higher than the sulfate concentrations typically found in wastewater. Other sulfate salts, such as ettringite and barium sulfate, are less soluble in water, so can be used to remove sulfate to lower concentrations, around 100 mg/L and 50 mg/L, respectively [Ref. (6) and (7)]. While some salts, like gypsum and barium sulfate, are relatively easy to precipitate, others, such as ettringite, require more complex chemical conditions to form reliably; thus, ettringite precipitation technology is more complex to operate. Metal salts are not effective at precipitating sulfate, but can be used to remove sulfide from solution and provide another means to remove sulfur from an aqueous system. The use of sulfide precipitation is discussed in Section 4.3.1.
Chemical precipitation processes produce sludges that must be managed and disposed. Typically, the sludge is dewatered to reduce the volume as much as possible, then disposed of in a landfill or sometimes land-applied. Sludge disposal options are further discussed in Section 4.2.
2.5 Ion Exchange Ion exchange is a common water treatment process used in a wide range of applications, from municipal drinking water treatment to mining and power generation. It is also commonly used in home water softeners. Ion exchange treatment media (resins) are available to remove different constituents, such as calcium and magnesium hardness (e.g., as in home water softeners), and are also available to remove sulfate. Ion exchange involves passing water through specialized ion “exchange” resins in a closed vessel. The resin surface has active sites, which remove the constituent of interest in exchange for other, less problematic or more desirable ions when the water passes through. Figure 2-4 provides a visual of the ion exchange process.

14
Figure 2-4 Ion exchange process [Ref. (8)]
(Reprinted with permission from Water Reuse, Metcalf and Eddy, G. Tchobanoglous et al. © McGraw-Hill Education, New York, 2007. All rights reserved.)
Once all the active sites have been used, the resin capacity for treatment must be restored (regenerated). The regeneration process involves exposing the resin to a concentrated salt, acid, or base solution to restore the active sites by switching the ions back to the initial condition. For ion exchange treatment of a water with 500 mg/L sulfate, treated water would contain less than 200 mg/L sulfate if operated correctly, and concentrated regeneration waste would contain about 10,000 mg/L sulfate in about 2%-5% of the initial flow [Ref. (9)].
For sulfate removal, the regeneration process most commonly produces a concentrated liquid salt waste (brine), containing an elevated concentration of sulfate that needs to be disposed. Brine disposal options are further discussed in Section 4.1. In the specialized Sulf-IX system, sulfate is removed from the concentrated brine solution using chemical precipitation.
2.6 Membrane Separation Membrane separation is another common, well-established water treatment technology that can be used for sulfate removal. Membrane treatment is used for treating sea water for use as drinking water, and for a wide variety of industrial applications such as high-purity water treatment for boilers and semiconductor manufacturing. Use of this technology is uncommon in municipal wastewater treatment, though some facilities with water reuse programs do employ this advanced polishing treatment, depending on the end use of the water.
In membrane separation, water is forced (using applied pressure or electrical potential) through membranes with very small openings (“pores”) that prevent particles and some chemicals such as sulfate from passing through. These technologies require energy to provide enough pressure to overcome the osmotic pressure and push water through the membranes, which ranges from approximately 100 to 1,000
15
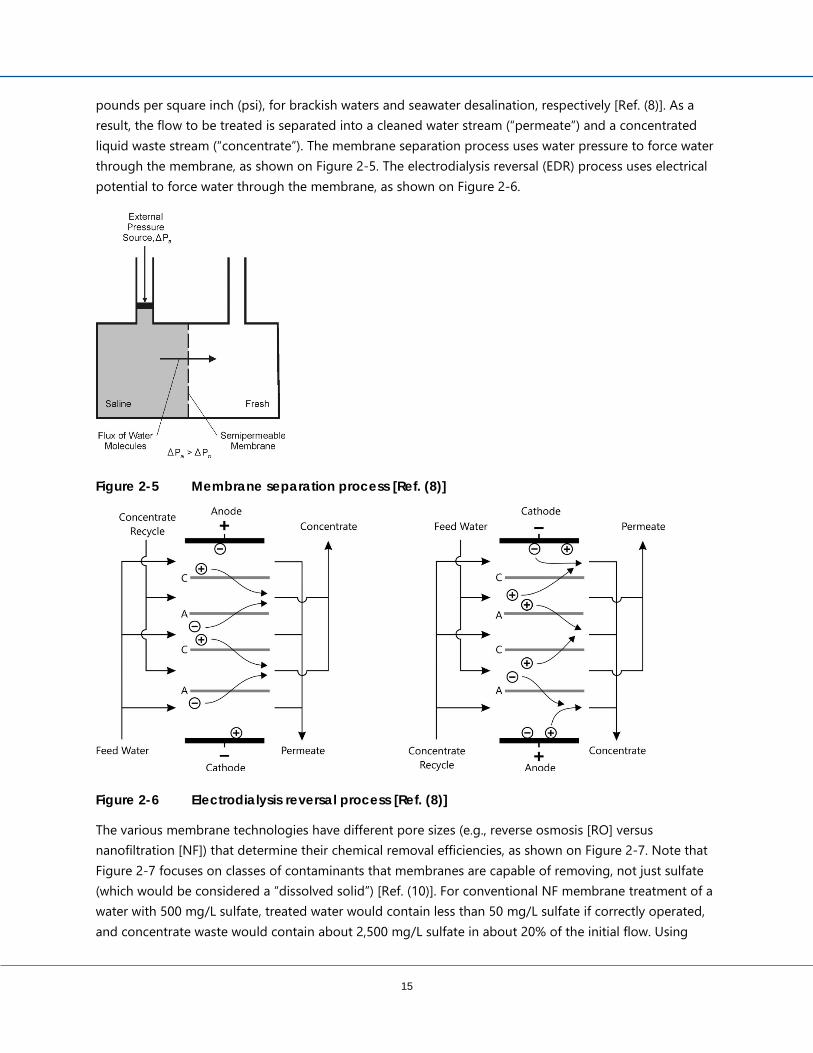
pounds per square inch (psi), for brackish waters and seawater desalination, respectively [Ref. (8)]. As a result, the flow to be treated is separated into a cleaned water stream (“permeate”) and a concentrated liquid waste stream (“concentrate”). The membrane separation process uses water pressure to force water through the membrane, as shown on Figure 2-5. The electrodialysis reversal (EDR) process uses electrical potential to force water through the membrane, as shown on Figure 2-6.
Figure 2-5 Membrane separation process [Ref. (8)]
Figure 2-6 Electrodialysis reversal process [Ref. (8)]
The various membrane technologies have different pore sizes (e.g., reverse osmosis [RO] versus nanofiltration [NF]) that determine their chemical removal efficiencies, as shown on Figure 2-7. Note that Figure 2-7 focuses on classes of contaminants that membranes are capable of removing, not just sulfate (which would be considered a “dissolved solid”) [Ref. (10)]. For conventional NF membrane treatment of a water with 500 mg/L sulfate, treated water would contain less than 50 mg/L sulfate if correctly operated, and concentrate waste would contain about 2,500 mg/L sulfate in about 20% of the initial flow. Using

16
conventional RO membrane treatment can achieve less than 10 mg/L sulfate with an influent concentration of 500 mg/L, and achieve approximately 70-90% recovery of the initial flow. To achieve these high recoveries, it will be necessary to implement multi-stage treatment, where the concentrate from the first stage is sent to a second stage of membrane treatment, which will be covered under Activity 2.
Figure 2-7 Removal abilities of various membrane technologies [Ref. (10)]
(Reprinted with permission from Manual of Water Supply Practices, M46 (2nd ed.). Reverse Osmosis and Nanofiltration. © AWWA, Denver, 2007. All rights reserved.)
Membrane separation using EDR, RO, and NF also produces a concentrated salt waste requiring disposal, and concentrate disposal costs can far exceed the membrane system costs. Multi-stage membrane treatment is one way to reduce the volume of concentrate requiring management and disposal, as shown on Figure 2-8. Concentrate disposal options are further discussed in Section 4.1. In addition, membrane systems typically require pre-treatment to protect the membranes from fouling and may require post-treatment to restore pH, reduce corrosivity, and to return some salts and minerals to the water (depending on the end use of the water). Pre- and post-treatment for RO are further discussed in Section 5.2.2.

17
Figure 2-8 Multi-stage membrane treatment example [Ref (11)]
2.7 Electrochemical Treatment Electrochemical treatment of sulfate can be achieved in two primary ways. Metal ions formed in an electrochemical cell are used to precipitate metal hydroxides, which can remove anions such as sulfate from water. Alternately, sulfate can be converted to sulfide using electrical means, but must be done at high temperatures. Abiotic sulfate reduction to sulfide is not energetically favorable, as the sulfate ion is very stable and unreactive. This process requires the input of large amounts of energy in the form of heat. As discussed in Section 2.1, chemical reactions to change sulfate into other forms of sulfur for removal require large amounts of external energy and are unlikely to be feasible in a municipal wastewater treatment setting.
Full-scale use of electrochemical treatment for sulfate removal is not reported in any industry.
2.8 Biological Treatment Municipal wastewater treatment plants employ a combination of biological, physical, and chemical processes to remove carbon (as biochemical oxygen demand [BOD]), nitrogen, and phosphorus from wastewater. Sulfate can be removed from water biologically by bacteria. It cannot be used as a bacterial food source, but can be used as an electron sink, similar to the way that humans use oxygen. Using sulfate instead of oxygen or other compounds is relatively inefficient, so bacteria can only use it in conditions without oxygen present. If oxygen is present, the bacteria will not use sulfate. When bacteria use sulfate, it is converted to sulfide, which can escape as toxic hydrogen sulfide gas. Thus, any biological system to remove sulfate must also be equipped with a way to remove hydrogen sulfide that is produced.
The bacteria that use sulfate are called sulfate-reducing bacteria (SRBs), and are strict anaerobes and slow growers. This means that biomass needs to stay in the system for a minimum of about 20 days (depending on the reactor conditions), or the SRBs will not grow fast enough to keep a population within the system sufficient to remove appreciable amounts of sulfate. Solids retention time for BOD removal in a typical activated sludge wastewater treatment plant, by comparison, is approximately three to five days

18
[Ref. (11)]. Other factors that affect solids retention time include temperature and desired level of nitrification. The required solids retention time for sulfate removal is approximately four to seven times longer in duration than activated sludge wastewater treatment plants typically employ. Activated sludge treatment plants are designed around a target solids retention time, which impacts treatment process performance, aeration tank volume, sludge production, and oxygen requirements. As a result, making modifications to accommodate biological treatment of sulfate using an activated-sludge-type process can be difficult.
This can be accomplished in a variety of different reactors under anaerobic conditions. An example packed bed reactor is shown on Figure 2-9. A food source must be supplied to any biological sulfate reduction technology, and can be a chemical addition, such as methanol, or direct addition of electrons from an electrochemical source.
Figure 2-9 Packed bed reactor biological treatment [Ref. (11)]
Biological treatment of sulfate has primarily been applied in mine water treatment, where sulfate removal is a secondary consequence of primary treatment goals such as metals removal. In mine water treatment, sulfate is converted to sulfide, which reacts with and immobilizes metals in the water. Because sulfate removal is not the primary goal, the removal efficiency can be relatively low, so low-efficiency biological treatment systems like constructed wetlands and mine in-pit lake treatment configurations can be practical. Oxidation reduction potential (ORP) in these passive-type systems fluctuates seasonally; therefore, consistent, overall sulfate removal is variable.
2.9 Evaporative Treatment Another option for removing sulfate from water is to evaporate the water. Because salts cannot be evaporated, they remain behind as a concentrated brine or a solid residual. The evaporated water can be recovered and reused, similar to a distillation process. Evaporative technologies are also called zero-liquid discharge (ZLD) technologies and are occasionally used in power and refining industry sectors, but are rarely used in municipal wastewater treatment due to their high capital, operation, and maintenance costs. Municipalities rarely require treatment of parameters of concern to meet effluent limits that would necessitate such technology. This type of technology is very energy-intensive, as it requires enough energy to evaporate water. Given the large flow rates of municipal wastewater requiring treatment, the
19
energy cost would be very high ($10 to $20 per 1,000 gallons) [Ref. (12)]. In addition, concentrated brine or salt solids would need to be disposed. Residuals management alternatives are presented in Sections 4.1 and 4.2. Evaporative technologies typically have high capital costs because they are often mechanically complex and require corrosion-resistant materials.

20
3.0 Technology Screening 3.1 Overview of Approach to Screening The application of the treatment technologies included in Table 2-2 to municipal wastewater treatment for the purposes of sulfate removal was reviewed in a detailed screening process that included three steps:
1. Threshold screening based on the technology’s degree of development and commercialization and ability to achieve a threshold sulfate removal performance;
2. Technology screening based on performance, cost, and other factors; and 3. Screening based on removal performance for other parameters of concern.
The goal of the screening process was to understand the advantages and limitations of each sulfate treatment approach, and to identify the most feasible treatment technologies for reducing sulfate in municipal wastewater effluent using a uniform scoring and ranking methodology. The outcome of the screening process is a ranked list of feasible technologies, which can be used as a guide or starting point for further investigation and detailed review of sulfate removal options by municipal wastewater treatment plants.
3.1.1 Threshold Screening The purpose of the threshold screening step was to limit the treatment technologies for the full screening effort to those that would be viable for municipal wastewater treatment application in Minnesota (i.e., those technologies with proven effectiveness in full-scale applications). Each of the treatment technologies included in Table 2-2 was evaluated against the two threshold screening criteria:
• The ability to remove sulfate to a concentration of 250 mg/L (assuming an influent sulfate concentration of 500 mg/L); and
• The existence of full-scale installations for treatment of any contaminant in any industry.
An influent sulfate concentration of 500 mg/L represents the upper end of the range of expected sulfate concentrations in municipal wastewater from groundwater contributions alone, as shown on Figure 2-2. The selected threshold concentration of 250 mg/L represents the ability of a technology to remove at least half of the sulfate. The MPCA concurred with the threshold screening criteria selection approach prior to screening completion.
It was assumed in this study that municipal wastewater treatment plants would be unlikely to implement technologies that either have not been applied at full-scale or cannot remove significant amounts of sulfate. If either criterion was not met, the technology was not evaluated further in this study.
Of the 31 treatment technologies included in the literature review and threshold screening, 18 technologies were screened out. Several technologies evaluated during the initial research collection
21
phase of the project remain in the exploratory phase of development with only bench- or pilot-scale demonstrations, but indicate promise, especially those in the biological sulfate treatment category.
The biological treatment technologies identified and reviewed had few full-scale applications for sulfate removal and a limited ability to remove sulfate below 250 mg/L. While biological processes do exist to transform and remove sulfate, additional investigations and development are needed to establish reliable means by which to leverage the full potential of this category of treatment options. Sulfate treatment technologies actively being researched at the University of Minnesota (U of M) include bioelectrochemical sulfate removal and liquid-phase biofilters. Suspended-growth reactors (activated sludge modification) and SANI demonstrations have indicated the ability to remove sulfate to below 250 mg/L; however, no full-scale systems exist. Further development of these technologies and application beyond the pilot scale is required and could improve the viability of the biological treatment options.
Treatment technologies that were found to remove sulfate to below 250 mg/L and have at least one, full-scale demonstration are summarized in Table 3-1 and received additional screening as described in Section 3.1.2. Descriptions of treatment technologies, basic technical information and references for additional information for all of the treatment options identified and reviewed, including those that were screened out, is available in Large Table 1.

22
Table 3-1 Sulfate treatment technology threshold screening
Technology Category Treatment Technology
Threshold Criteria
Receives full screening criteria Ability to remove sulfate to 250 mg/L[1] Demonstrated at full-scale[2]
Chemical Precipitation
Gypsum Precipitation No Yes No Ettringite Precipitation (CESR or SAVMIN) Yes Yes Yes Ettringite Precipitation with Aluminum Recovery (LoSO4) Yes No No Barite Precipitation Yes Yes Yes Co-Precipitation with Aluminum No No No
Ion Exchange Conventional Ion Exchange Yes Yes Yes Sulf-IX Yes Yes Yes
Membranes
Closed-circuit Desalination Reverse Osmosis (CCD RO) Yes Yes Yes Electrodialysis Reversal (EDR) Yes Yes Yes Zero Discharge Desalination (ZDD) Yes No No Membrane Distillation No Yes No Nanofiltration (NF) Yes Yes Yes Conventional Reverse Osmosis (RO) Yes Yes Yes Vibratory Shear Enhanced Processing (VSEP) Yes Yes Yes Forward Osmosis No Yes No
Electrochemical Electrocoagulation No No No Electrochemical Reduction No No No
Biological
Constructed Wetlands No Yes No Floating Wetlands No No No Pit Lake or In-Pit Treatment No No No Constructed Trench Bioreactors/ Permeable Reactive Barriers No Yes No Suspended-Growth Reactor (Activated Sludge Modification) Yes No No UASB Reactor with Sulfide Treatment Yes Yes Yes Packed Bed Bioreactor Yes Yes Yes Packed Bed (BioSulphide) No Yes No Bioelectrochemical No No No Sulfate Reduction Deammonification No No No Liquid-phase Biofilters No No No Sulfate Reduction, Autotrophic Enitrification, and Nitrification Integrated Process (SANI) Yes No No
Evaporative Direct Heat-contact Evaporation (LM-HT Concentrator) Yes Yes Yes Mechanical Vapor Recompression Evaporation with Crystallization or Spray Drying Yes Yes Yes
Notes [1] Assumes an influent sulfate concentration of 500 mg/L. [2] Demonstrated at full scale but not necessarily for sulfate removal, specifically.

23
3.1.2 Technology Screening The 13 technologies that passed the threshold screening were evaluated using the following screening criteria:
• Effectiveness • Operability/Maintainability • Relative Cost • Degree/Complexity of Pre- and Post-Treatment Requirements • Residuals Management
Each of the five criteria above were broken down into two or more sub-criteria. For example, the effectiveness criteria were broken down to these sub-criteria:
• Ability to meet treated water quality goals • Degree of commercialization
3.1.2.1 Rationale for Sub-Criteria Weighting Each of the sub-criteria were given a numeric weight to reflect their relative importance for a general municipal wastewater treatment plant. Weighting was based on generic criteria to apply to a broad cross-section of wastewater applications. It is possible that weighting could vary for an individual wastewater treatment plant, depending on site-specific circumstances and priorities; this should be taken into consideration when evaluating treatment technologies on a case-by-case basis. Each technology was assigned rankings for each criteria using information readily available in reports, studies, research papers, vendor literature, etc. Where information was not readily available, assumptions based on process knowledge and engineering judgment were used to assign ranks for each technology. The screening criteria are described in more detail in Section 3.1.2.2. Large Table 2 provides the scoring key associated with each sub-criteria and criteria. All weights were multiplied by ranks to produce a score as described in this section. The scores for each technology were then summed to obtain a numerical total score for each technology. The technologies were then ordered from high to low by their total scores. This scoring is not intended to be absolute, but rather should be considered a starting point for considering technologies. The higher-scored technologies reflect the more reliable, proven technologies for sulfate and/or those with the greatest demonstrated removal capability. The overall total scores are intended to enable relative comparisons among the technologies.
For example, under the effectiveness criteria, the sub-criteria ability to meet treated water quality goals for sulfate and degree of commercialization both had weights of three (3). Each sub-criteria was given a ranking choice from one to five, with five indicating the highest level of achievement for that technology and one being the lowest achievement.
RO received a ranking of five (5) under both of these sub-criteria because it has the ability to meet the lowest achievable sulfate treatment goal evaluated, 5 mg/L, and has been commercialized in three or more industries, including municipal wastewater treatment. The overall score under the effectiveness category for RO was 30, which was calculated as follows:
24
Overall effectiveness score = sum of (sub-criteria weight x sub-criteria rank)
Overall effectiveness score = (3 x 5) + (3 x 5) = 30
3.1.2.2 Sub-Criteria Weights and Rankings Effectiveness The effectiveness criteria describe the ability of a technology to remove sulfate, including the degree of commercialization (i.e., technical maturity in the marketplace, degree of development, and how broadly each technology is used throughout industry). Effectiveness criteria included the following.
Weight:
• Both sub-criteria under effectiveness received a weight of three (3). The ability of each technology to achieve treated water goals for sulfate was the primary concern of this study. Degree of commercialization received the same weight, because municipal wastewater treatment plants are most likely to implement reliable, well-commercialized technologies and specifically those that have been employed in municipal wastewater treatment.
Ranking:
• Ability to meet treated water quality goals for sulfate (5-250 mg/L) o Implementation of the wild rice in-stream water quality standard is expected to result in a
range of possible effluent limits for municipal wastewater treatment plants, depending on conditions in receiving waters they discharge into. This screening criterion is intended to reflect a range of potential limits. The ability of a technology to remove sulfate was based on treated water quality goals for sulfate provided by the MPCA, with 250 mg/L used as the threshold screening value. Technologies receiving the highest scores have demonstrated sulfate removal to concentrations below 10 mg/L, including removal to below 5 mg/L for reverse osmosis.
o Scores correspond with the following treatment abilities: 1 - <=250 mg/L 2 - <=100 mg/L 3 - <=50 mg/L 4 - <=10 mg/L 5 - <=5 mg/L
• Degree of commercialization o Technologies with a range of commercialization were evaluated in order to include a
large number of feasible options. o Scores correspond with the following levels of commercialization:
1 - not commercialized 2 - commercialized in one industry primarily 3 - commercialized in one to three industries
25
4 - commercialized in more than three industries 5 - commercialized in more than three industries, including municipal wastewater
treatment
Operability/maintainability Operability and maintainability refer to the complexity of a technology’s operation and maintenance requirements, and resulting reliability of performance. Operability and maintainability sub-criteria included the following.
Weight:
• The reliability of performance, including cold climate suitability, received the highest weight under this category, a weight of three (3). With ability to meet sulfate treatment targets being the primary concern, reliable performance year-round is necessary.
• General complexity of operation/maintenance of primary technology received a weight of two (2). While an operationally simple technology would be preferred in a wastewater treatment plant retrofit, some of the more complex technologies are capable of meeting the most stringent sulfate water treatment goals. A weight of two (2) was assigned to balance the ability to remove sulfate to low concentrations with operational simplicity.
• Operator and public health received a weight of one (1). The primary hazard identified for some of the sulfate removal approaches was the generation of hydrogen sulfide, which can be both a health and odor concern, depending on concentration. Hydrogen sulfide is a common hazard that must already be managed now in many current wastewater treatment plants and collections systems, through monitoring, ventilation, and other means. Given the industry-wide familiarity and experience with this hazard, a lower weight was assigned.
Ranking:
• Reliability of performance, including cold climate suitability o Reliability of performance, including cold climate suitability, applies to the technology’s
ability to operate and produce the required treated water quality consistently given variable influent water quality and weather conditions, including extreme winter temperatures observed across Minnesota.
• General complexity of operation/maintenance of primary technology o Relative complexity of primary technology operation was evaluated based on number of
treatment process steps, pre- and post-treatment requirements, level of operator attention required, and anticipated amount of operational changes required under normal operation conditions.
• Operator and public health o The operator and public health criterion refers to known risks associated with operation
of each technology to the individuals operating the treatment system and the general public.

26
Another operability consideration is WWTP operator certification level. While this was not considered in the screening process, operation of the technologies evaluated in this report will require a high level of operator certification and training. The implications of this for municipalities are considered in Part 2 of this project.
Relative Costs Relative cost criteria were used to compare anticipated costs associated with each technology based on available information from existing full-scale applications and technology vendors. Relative cost criteria included the following.
Weight:
• Capital costs for primary technology received a weight of three (3), and O&M costs for primary technology received a weight of two (2). In addition to sulfate treatment effectiveness, cost impacts are a primary concern for most municipalities and their customers. Depending on the degree of sulfate removal required, municipalities requiring sulfate treatment may be required to increase fees to pay for the additional treatment through a combination of connection fees and volume of use fees. The degree of impact on rates will depend on the size of the wastewater treatment plant and technology selected for implementation. Both capital costs and O&M costs have the potential to increase typical sewer rates by a significant amount [Ref. (2) and (13)].
Ranking:
• Capital costs for primary technology o Under this criterion, lower rankings were given to the most expensive technologies and
higher rankings to relatively low-cost technologies. Technologies that incorporated less mechanical equipment and fewer tanks and reactors had the lowest capital costs.
• O&M costs for primary technology o Operating and maintenance (O&M) costs consist of power, labor, parts and maintenance,
chemicals for operations and cleaning processes, consumables, and residuals management.
Degree/Complexity of Pre- and Post-Treatment Degree and complexity of pre- and post-treatment applies to the extent and difficulty of treatment required in addition to the primary sulfate treatment technology. For example, in order for the primary sulfate removal technology to be used to treat municipal wastewater effluent, additional steps or processes may be necessary to ensure reliable operation of the sulfate removal technology. These additional steps are considered “pre-treatment.” Similarly, for post-treatment, the water produced after using the sulfate removal technology may require additional polishing or stabilization in order to meet all water quality requirements for discharge. Screening considered pre- and post-treatment assumed for retrofit of an existing wastewater treatment plant with secondary treatment. Thus, processes already

27
included in typical secondary wastewater treatment were not factored into the screening. Degree and complexity of pre- and post-treatment sub-criteria included the following.
Weight:
• Pre-treatment and post-treatment complexity and cost each received a weight of two (2). With the primary focus being sulfate removal, the degree and complexity of pre- and post-treatment was secondary.
• Beneficial reuse of residuals and treated water received a weight of one (1). While beneficial reuse is an important factor, especially if it can provide some offsetting of costs, it is considered a secondary effect of sulfate removal and hence received a lower weight.
Ranking:
• Influent pre-treatment complexity/cost o Influent pre-treatment complexity and cost refers to the degree of additional treatment
required prior to use of the primary treatment technology. Pre-treatment varies and is generally required to protect some function of the primary treatment technology or improve its effectiveness and/or reliability.
• Effluent post-treatment complexity/cost o Effluent post-treatment complexity and cost refers to additional treatment required
downstream of the primary treatment technology. Post-treatment is generally required to stabilize the effluent prior to discharge to protect the beneficial reuse of the receiving water and prevent downstream toxicity. Post-treatment evaluation for this study did not include typical tertiary treatment already in place at municipal wastewater treatment plants or chlorine or ultraviolet disinfection.
• Beneficial reuse of residuals and treated water o This criterion applies to the potential use of residuals resulting from primary treatment
and the treated water itself, such as water reuse instead of discharge. Beneficial reuse of either the residuals or the treated water may enable some offsetting of costs of sulfate treatment, though this is very site-specific.
Residuals Management Residuals are materials that result as a byproduct of the primary treatment process that may or may not have a beneficial reuse. Residuals management criteria refer to the complexity of managing residuals associated with the primary treatment technology and the volume of residuals requiring management. Large Table 1 includes residuals resulting from sulfate treatment technology operation. Screening sub-criteria included the following.
Weight:
• Residuals management complexity and cost received a weight of three (3). Residuals management can contribute significantly to overall treatment costs, which were a primary

28
concern of the study. This criterion also emphasized the high costs and energy requirements for membrane treatment concentrate management and evaporative treatment residual slurries and salts management. This criteria weight was equal to those of the effectiveness category to balance the complex residuals management requirements for some of the most effective sulfate treatment technologies.
• Residuals stability received a weight of one (1). This criteria was included to capture the uncertainty of stability in residuals resulting from some treatment technologies including ettringite precipitation and the evaporative technologies. Residuals stability was considered a tertiary concern of the overall study as it does not relate to sulfate removal effectiveness and has relatively minimal impacts on treatment technology selection.
Ranking:
• Residuals management complexity/cost o Residuals management complexity and cost applies to the anticipated costs of managing
residual materials, including the mechanical and/or operational complexity of processes needed, special disposal requirements, hazardous waste disposal costs, residuals volume and storage requirements, etc.
• Residuals stability o Residuals stability refers to the composition and disposition of the residual material and
how likely it is to transform into another material (e.g., through chemical or biological reactors or transformations) or phase (such as through dissolution) at some point during its management and disposal.
3.1.3 Screening for Removal of Other Parameters Each treatment alternative was also evaluated for its ability to remove other parameters of concern. The purpose of this screening was to evaluate whether removal of these other parameters of concern could co-occur with the evaluated sulfate removal technologies. Removal of other parameters is considered a secondary goal to sulfate removal.
The other parameters screening included:
• Chloride • Total mercury • Total nitrogen • Total phosphorus • Total dissolved solids
The ability to remove these parameters from the water phase was evaluated relative to specific treatment targets, shown in Table 3-4. Treatment targets for total nitrogen, total phosphorus, and total mercury were provided by the MPCA. Treatment targets for chloride, total mercury, and total dissolved solids were selected based on the most stringent water quality standards included in Minnesota Rules Chapter 7050, Water Quality Standards for Protection of Waters of the State [Ref. (14)].

29
3.2 Screening Results 3.2.1 Summary of Screening Results Each rank resulting from the technology screening process was multiplied by a weight assigned to each sub-criteria, and these sub-criteria scores were added together for a final score for each technology. As described earlier, this score is intended to enable relative comparisons among the technologies. However, the scoring is not absolute and is not intended to recommend a specific technology for a given application. The approach taken for selection of sulfate removal technologies for a given wastewater treatment plant will be site-specific. For examples regarding the use of the screening information provided, please refer to Section 5.0. The spread of total scores for the treatment technologies ranged from 69 to 89 with higher scores representing the technologies that would best meet the primary focuses of the study.
Large Table 2 provides the detailed results of the technology screening process. The technology scores fell into three broad groups as shown in Table 3-2. Group 1 includes technologies that are well-commercialized, proven successful in sulfate removal, and have broad applications across multiple industries. Group 2 includes technologies that are moderately commercialized, but not in municipal wastewater treatment, and are more often secondary treatment technologies rather than primary. Group 3 consists of technologies that have important technical or economical limitations and are limited in terms of sulfate removal abilities.
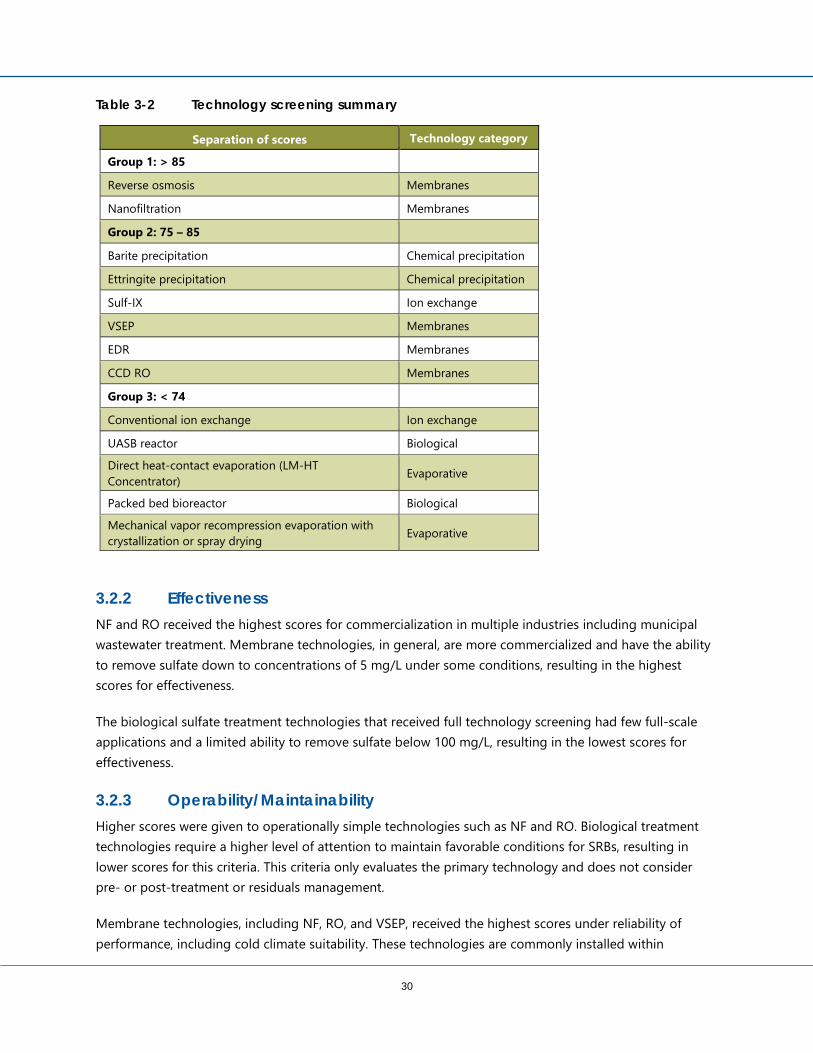
30
Table 3-2 Technology screening summary
Separation of scores Technology category
Group 1: > 85
Reverse osmosis Membranes
Nanofiltration Membranes
Group 2: 75 – 85
Barite precipitation Chemical precipitation
Ettringite precipitation Chemical precipitation
Sulf-IX Ion exchange
VSEP Membranes
EDR Membranes
CCD RO Membranes
Group 3: < 74
Conventional ion exchange Ion exchange
UASB reactor Biological
Direct heat-contact evaporation (LM-HT Concentrator) Evaporative
Packed bed bioreactor Biological
Mechanical vapor recompression evaporation with crystallization or spray drying Evaporative
3.2.2 Effectiveness NF and RO received the highest scores for commercialization in multiple industries including municipal wastewater treatment. Membrane technologies, in general, are more commercialized and have the ability to remove sulfate down to concentrations of 5 mg/L under some conditions, resulting in the highest scores for effectiveness.
The biological sulfate treatment technologies that received full technology screening had few full-scale applications and a limited ability to remove sulfate below 100 mg/L, resulting in the lowest scores for effectiveness.
3.2.3 Operability/Maintainability Higher scores were given to operationally simple technologies such as NF and RO. Biological treatment technologies require a higher level of attention to maintain favorable conditions for SRBs, resulting in lower scores for this criteria. This criteria only evaluates the primary technology and does not consider pre- or post-treatment or residuals management.
Membrane technologies, including NF, RO, and VSEP, received the highest scores under reliability of performance, including cold climate suitability. These technologies are commonly installed within

31
buildings to avoid exposure to inclement weather. Water temperature can impact water throughput and sulfate removal, but to a lesser degree than some biological processes such as treatment wetlands. These membrane technologies are well-established and commercialized, so have more available data and installed experience to inform an assessment of reliable performance.
Most technologies screened were found to have no significant health risk to operators or the public. Lower scores were assigned to biological treatment technologies due to risks associated with hydrogen sulfide gas production and management. Hydrogen sulfide gas management is discussed further in Section 4.3. Additionally, production of barium sulfate in the barium precipitation process poses risks to operators handling the waste.
3.2.4 Relative Costs Technologies with the highest capital costs, VSEP, and the evaporative technologies, also had the highest operating and maintenance (O&M) costs, largely associated with energy consumption. The primary O&M costs by technology category are identified in Table 3-3. Costs are generally listed from highest cost to lowest cost. Exact order will depend on site-specific conditions and plant size.
Table 3-3 Primary O&M costs by treatment category
Chemical Precipitation
Ion Exchange Membranes Biological Evaporative
Chemical addition Regeneration chemicals
Concentrate handling Substrate addition Power
Sludge handling (dewatering and disposal)
Power Power Power Salt or slurry management
Labor Labor Clean-in-place (CIP) waste handling and disposal
Labor Cleaning chemicals and associated waste disposal
Power Ion exchange media Labor
Sludge handling (dewatering and disposal)
Operating chemicals
− − Anti-scalant chemicals − −
− − CIP chemicals − −
3.2.5 Degree/Complexity of Pre- and Post-Treatment Membrane technologies, while having a long history of reliable treatment, also require relatively complex pre-treatment in order to sustain reliable operation. Ion exchange is rarely applied to municipal wastewater treatment, though it is common in municipal drinking water treatment. As a result, the degree of pre-treatment required for these systems is not well characterized in the context of municipal wastewater.
32
There are an increasing number of installations of membranes in the U.S. following secondary or tertiary municipal wastewater treatment, primarily for water reuse applications instead of environmental discharge requirements [Ref. (8)]. Wastewater effluent fed to membrane treatment requires more pre-treatment than groundwater or surface water, because organic material and bacteria in the water can cause biofouling and organic fouling. Biofouling (growth of bacteria films on a membrane surface) and organic fouling (buildup of organic matter on a membrane surface) interfere with membrane operation by clogging and narrowing membrane pores; this makes it more difficult to push clean water through the membranes [Ref. (8)]. Pre-treatment for membrane separation may include settling, sand or cartridge filtration, membrane filtration, chemical addition, advanced oxidation, etc., depending on wastewater chemistry, scaling potential, and operational limitations of the primary treatment technology. All membrane technologies require a similar extent of pre-treatment, with the exception of VSEP, which may require less extensive pre-treatment, depending on the specific application. In contrast to traditional spiral-wound membranes, VSEP uses flat-sheet membranes in a cross-flow configuration, which reduces the boundary layer at the membrane surface. This, in combination with applied vibratory shear, reduces fouling and scaling.
Post-treatment across the membrane technology category can be relatively complex. Membrane treatment is highly effective for removing sulfate, but it does not selectively remove sulfate. Other constituents in the water such as dissolved minerals (e.g., hardness and alkalinity) are also removed. Constituents such as dissolved gasses (carbon dioxide or hydrogen sulfide) will pass through the membrane into the treated water. As a result, the membrane-treated water is likely to require additional treatment prior to discharge or reuse. Common post-treatment processes include:
• Mixing with membrane feed water to achieve the final desired composition based on a mass balance
• Degasification • pH adjustment • Stabilization/remineralization using lime or calcite
Specific requirements will depend on the wastewater chemistry after membrane treatment and the final effluent limits and/or the final use of the water (if reused, for example).
3.2.5.1 Beneficial Reuse Most of the treatment technologies evaluated in the full screening do not produce residuals with beneficial reuse. Solid gypsum precipitated from the Sulf-IX process can be repurposed as a construction material or fertilizer [Ref. (9)]. Biological sludge can be managed with other biological sludge streams from the wastewater treatment plant.
Depending on the municipal wastewater treatment plant site, treated effluent from membrane treatment technologies can potentially be reused onsite or by some other industry, business, or irrigation need in the vicinity. Because of the high-quality water that membrane treatment produces, reuse of the treated water in some capacity to decrease either potable or non-potable water demand is worth evaluating and

33
may help offset capital and O&M costs associated with the primary treatment technology. Reuse of treated effluent may also reduce or eliminate post-treatment requirements.
3.2.6 Residuals Management Residuals from each technology category requiring management vary in their degrees of stability depending on application and water quality. Sludge management associated with ettringite precipitation may result in the loss of sulfate through reactions with atmospheric CO2 [Ref. (15)]. The ultimate fate of sulfur is also uncertain in the management of biological sludges and metal sulfide sludges. If sulfur is bound with iron, it may be subject to oxidation and loss of sulfate to the environment. Salt residuals resulting from evaporative treatment technologies used as primary treatment and residuals management for membrane treatment readily dissolve. As a result, and as introduced in Section 2.1, residuals management for most of the treatment categories will require additional investigation and planning to mitigate the unintentional or unwanted reintroduction of sulfate into the receiving water. The residuals management planning process is of equal importance to the selection of the primary treatment technology itself, and is critical to the success of the selected treatment process.
The membrane treatment technologies received the lowest overall scores under residuals management. Concentrate management for membrane treatment technologies represents a significant technical and economic challenge for inland municipalities, including those outside of Minnesota that employ these technologies for drinking water production. Options for concentrate management and a brief review of the “state of the industry” is provided in Section 4.1.
3.2.7 Screening for Removal of Other Parameters A table summarizing the ability of the technologies to remove parameters of concern other than sulfate from municipal wastewater is included in Table 3-4. A “Yes” indicates the technology can meet the treatment target, and a “No” indicates the technology cannot meet the target. Some technologies had limited data or no data available, as noted in the table.
This information provides a useful summary for municipalities challenged with removal of other regulated constituents in addition to sulfate. RO, for example, can also effectively remove chloride, total nitrogen, total phosphorus, and total dissolved solids, and therefore if implemented for sulfate removal, would provide additional benefits for the removal of other constituents as well. Membrane treatment, in general, can effectively remove chloride, total phosphorus, and total dissolved solids, with exceptions noted in Table 3-4. Biological treatment is capable of removing total nitrogen but requires both nitrification and denitrification processes. Evaporation with crystallization produces a distillate that removes chloride, total phosphorus, and total dissolved solids.
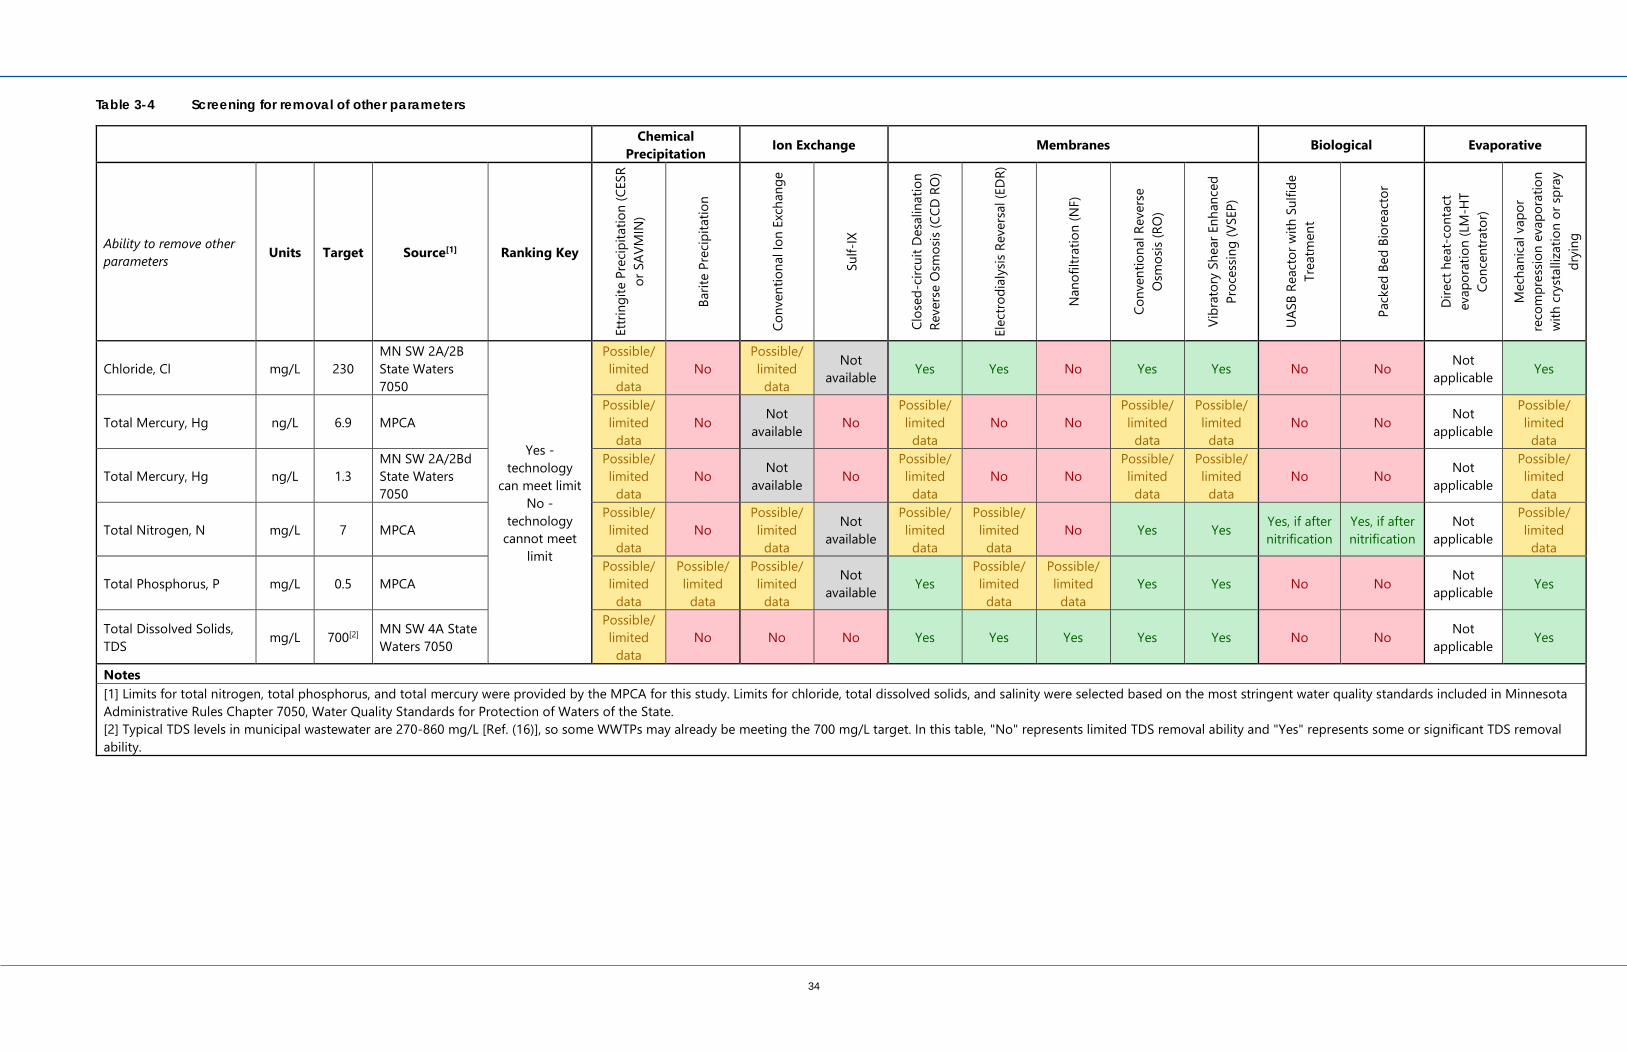
34
Table 3-4 Screening for removal of other parameters
Chemical Precipitation Ion Exchange Membranes Biological Evaporative
Ability to remove other parameters Units Target Source[1] Ranking Key
Ettri
ngite
Pre
cipita
tion
(CES
R or
SAV
MIN
)
Barit
e Pr
ecip
itatio
n
Conv
entio
nal I
on E
xcha
nge
Sulf-
IX
Clos
ed-c
ircui
t Des
alin
atio
n Re
vers
e O
smos
is (C
CD R
O)
Elec
trodi
alys
is Re
vers
al (E
DR)
Nan
ofilt
ratio
n (N
F)
Conv
entio
nal R
ever
se
Osm
osis
(RO
)
Vibr
ator
y Sh
ear E
nhan
ced
Proc
essin
g (V
SEP)
UASB
Rea
ctor
with
Sul
fide
Trea
tmen
t
Pack
ed B
ed B
iore
acto
r
Dire
ct h
eat-
cont
act
evap
orat
ion
(LM
-HT
Conc
entra
tor)
Mec
hani
cal v
apor
re
com
pres
sion
evap
orat
ion
with
cry
stal
lizat
ion
or sp
ray
dryi
ng
Chloride, Cl mg/L 230 MN SW 2A/2B State Waters 7050
Yes - technology
can meet limit No -
technology cannot meet
limit
Possible/ limited data
No Possible/ limited data
Not available Yes Yes No Yes Yes No No Not
applicable Yes
Total Mercury, Hg ng/L 6.9 MPCA Possible/ limited data
No Not available No
Possible/ limited data
No No Possible/ limited data
Possible/ limited data
No No Not applicable
Possible/ limited data
Total Mercury, Hg ng/L 1.3 MN SW 2A/2Bd State Waters 7050
Possible/ limited data
No Not available No
Possible/ limited data
No No Possible/ limited data
Possible/ limited data
No No Not applicable
Possible/ limited data
Total Nitrogen, N mg/L 7 MPCA Possible/ limited data
No Possible/ limited data
Not available
Possible/ limited data
Possible/ limited data
No Yes Yes Yes, if after nitrification
Yes, if after nitrification
Not applicable
Possible/ limited data
Total Phosphorus, P mg/L 0.5 MPCA Possible/ limited data
Possible/ limited data
Possible/ limited data
Not available Yes
Possible/ limited data
Possible/ limited data
Yes Yes No No Not applicable Yes
Total Dissolved Solids, TDS mg/L 700[2] MN SW 4A State
Waters 7050
Possible/ limited data
No No No Yes Yes Yes Yes Yes No No Not applicable Yes
Notes [1] Limits for total nitrogen, total phosphorus, and total mercury were provided by the MPCA for this study. Limits for chloride, total dissolved solids, and salinity were selected based on the most stringent water quality standards included in Minnesota Administrative Rules Chapter 7050, Water Quality Standards for Protection of Waters of the State. [2] Typical TDS levels in municipal wastewater are 270-860 mg/L [Ref. (16)], so some WWTPs may already be meeting the 700 mg/L target. In this table, "No" represents limited TDS removal ability and "Yes" represents some or significant TDS removal ability.

35
Typical TDS levels in municipal wastewater are 270-860 mg/L [Ref. (16)], so some wastewater treatment plants may already be meeting the 700 mg/L target. In Table 3-4, "No" represents limited TDS removal ability and "Yes" represents some or significant TDS removal ability.
Direct heat-contact evaporation (e.g., the LM-HT Concentrator) was “not applicable” for all parameters because there is typically no treated water/liquid stream for discharge. A liquid stream remaining after concentration would be either “brine” or “slurry” (more concentrated than brine). These are not distillate streams like with other evaporative technologies or ZLD. The brine or slurry would be disposed of by some other method and not discharged.
3.3 Summary of Achievable Effluent Concentrations As previously discussed, the current sulfate water quality standard is 10 mg/L but is undergoing revision. Due to this, and site-specific considerations for the determination of effluent limits, there is uncertainty regarding the range of actual effluent limits that will result for individual wastewater treatment plants. Because the future water quality standard and derived effluent limits are unknown, this study was designed to provide useful information over a range of possible influent conditions and effluent limits. Potential sulfate treatment technologies meeting the threshold criteria were evaluated for their ability to achieve a range of effluent sulfate concentrations given a range of influent concentrations. Table 3-5 summarizes the ability of each technology to achieve given influent/effluent combinations. In some cases, definitive data regarding full-scale sulfate removal capabilities were not available; in these cases, removal capabilities were estimated based on laboratory studies and relevant chemical and microbiological information.
These data are also presented visually on Figure 3-1, where the line for each technology reflects the boundary between “not likely” and “possible.” In some cases, similar technologies with equivalent removal abilities were grouped together. A wastewater treatment plant with a specific anticipated effluent limit and expected influent concentration can plot that point on the chart; any technology plotted below the selected point should be evaluated as a potential treatment option. Technologies plotted above the selected point are unlikely to meet the treatment requirements.
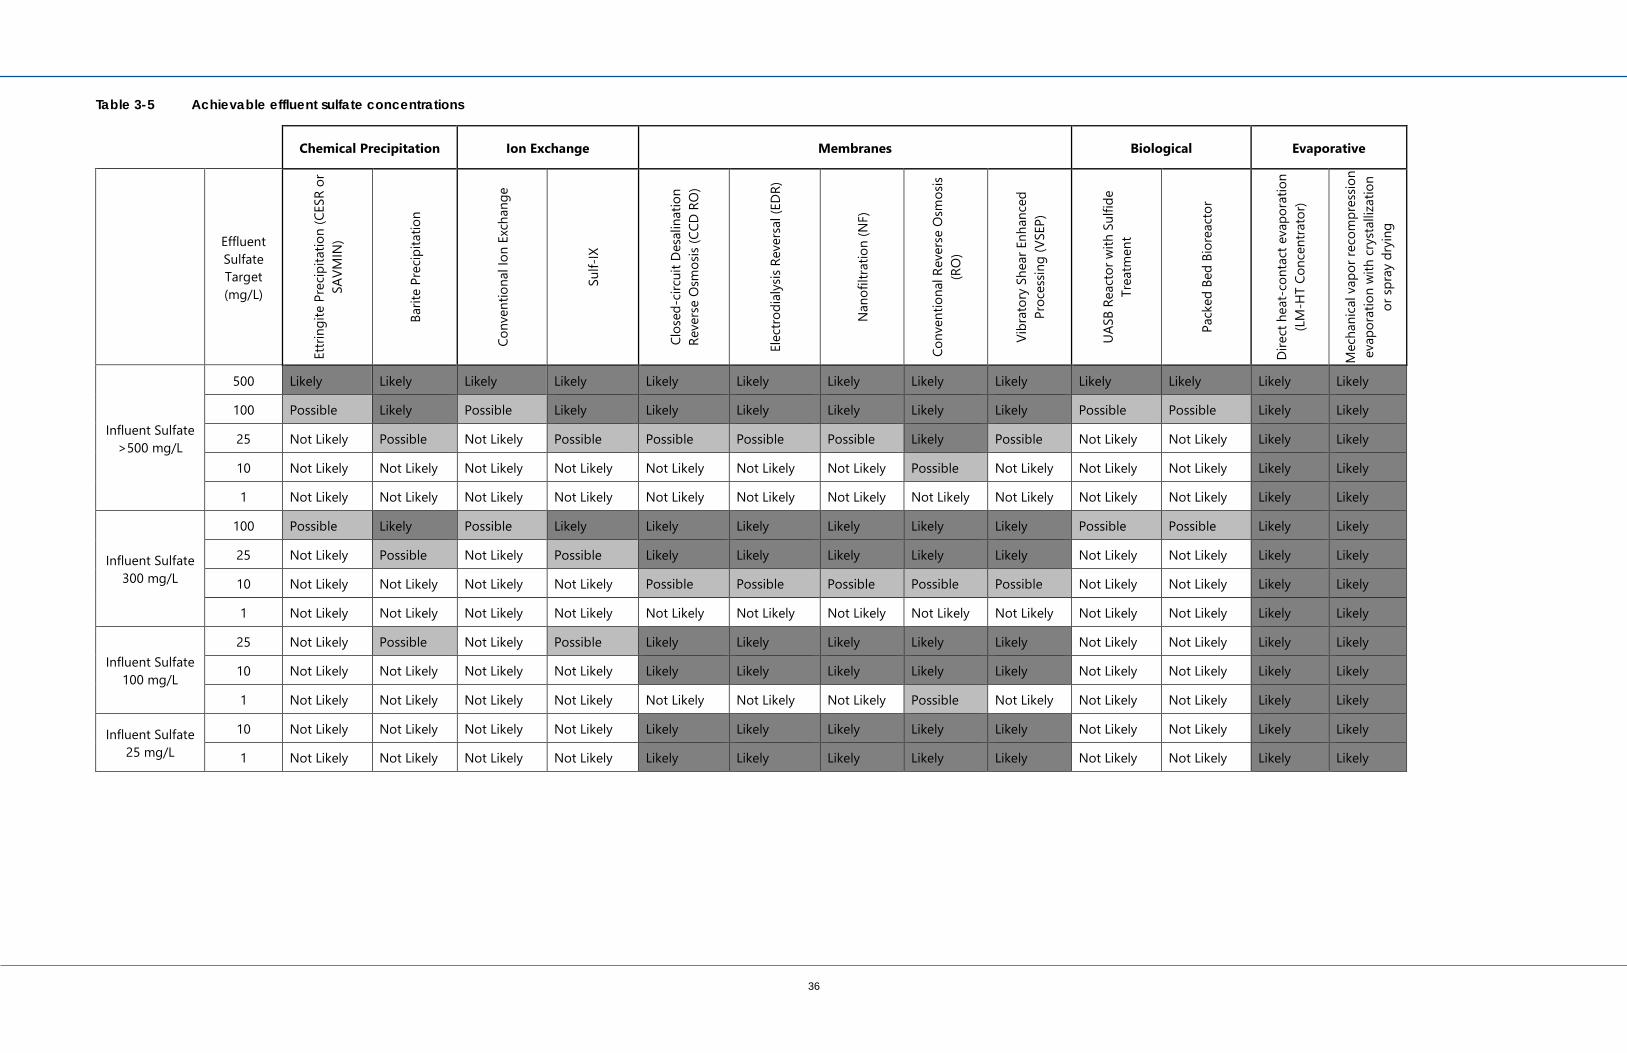
36
Table 3-5 Achievable effluent sulfate concentrations
Chemical Precipitation Ion Exchange Membranes Biological Evaporative
Effluent Sulfate Target (mg/L)
Ettri
ngite
Pre
cipita
tion
(CES
R or
SA
VMIN
)
Barit
e Pr
ecip
itatio
n
Conv
entio
nal I
on E
xcha
nge
Sulf-
IX
Clos
ed-c
ircui
t Des
alin
atio
n Re
vers
e O
smos
is (C
CD R
O)
Elec
trodi
alys
is Re
vers
al (E
DR)
Nan
ofilt
ratio
n (N
F)
Conv
entio
nal R
ever
se O
smos
is (R
O)
Vibr
ator
y Sh
ear E
nhan
ced
Proc
essin
g (V
SEP)
UASB
Rea
ctor
with
Sul
fide
Trea
tmen
t
Pack
ed B
ed B
iore
acto
r
Dire
ct h
eat-
cont
act e
vapo
ratio
n (L
M-H
T Co
ncen
trato
r)
Mec
hani
cal v
apor
reco
mpr
essio
n ev
apor
atio
n w
ith c
ryst
alliz
atio
n or
spra
y dr
ying
Influent Sulfate >500 mg/L
500 Likely Likely Likely Likely Likely Likely Likely Likely Likely Likely Likely Likely Likely
100 Possible Likely Possible Likely Likely Likely Likely Likely Likely Possible Possible Likely Likely
25 Not Likely Possible Not Likely Possible Possible Possible Possible Likely Possible Not Likely Not Likely Likely Likely
10 Not Likely Not Likely Not Likely Not Likely Not Likely Not Likely Not Likely Possible Not Likely Not Likely Not Likely Likely Likely
1 Not Likely Not Likely Not Likely Not Likely Not Likely Not Likely Not Likely Not Likely Not Likely Not Likely Not Likely Likely Likely
Influent Sulfate 300 mg/L
100 Possible Likely Possible Likely Likely Likely Likely Likely Likely Possible Possible Likely Likely
25 Not Likely Possible Not Likely Possible Likely Likely Likely Likely Likely Not Likely Not Likely Likely Likely
10 Not Likely Not Likely Not Likely Not Likely Possible Possible Possible Possible Possible Not Likely Not Likely Likely Likely
1 Not Likely Not Likely Not Likely Not Likely Not Likely Not Likely Not Likely Not Likely Not Likely Not Likely Not Likely Likely Likely
Influent Sulfate 100 mg/L
25 Not Likely Possible Not Likely Possible Likely Likely Likely Likely Likely Not Likely Not Likely Likely Likely
10 Not Likely Not Likely Not Likely Not Likely Likely Likely Likely Likely Likely Not Likely Not Likely Likely Likely
1 Not Likely Not Likely Not Likely Not Likely Not Likely Not Likely Not Likely Possible Not Likely Not Likely Not Likely Likely Likely
Influent Sulfate 25 mg/L
10 Not Likely Not Likely Not Likely Not Likely Likely Likely Likely Likely Likely Not Likely Not Likely Likely Likely
1 Not Likely Not Likely Not Likely Not Likely Likely Likely Likely Likely Likely Not Likely Not Likely Likely Likely

37
Figure 3-1 Sulfate removal capabilities based on influent concentrations
0
100
200
300
400
500
0 100 200 300 400 500
Efflu
ent S
ulfa
te (m
g/L)
Influent Sulfate (mg/L)
No Removal Ettringite Precipitation (CESR or SAVMIN) Barite Precipitation
Conventional Ion Exchange Sulf-IX Electrodialysis Reversal (EDR)
Nanofiltration (NF) Conventional Reverse Osmosis (RO) Engineered Biological Reactor
Evaporative

38
3.4 Considerations for Source Reduction Source reduction may be a practical alternative if the degree of sulfate removal required is low. The maximum achievable sulfate reduction depends on the amount of sulfate originating from the targeted source, and additional treatment may still be needed to meet effluent limits. Source reduction options are outlined on Figure 3-2.

39
Does the WWTP currently meet the proposed effluent
sulfate limit?
Develop sulfate/sulfide mass balance
for the WWTP
Significant sulfate or sulfide from
industrial discharges?
Internal process streams with high
sulfide?
Significant dissolved sulfide at locations
in the collection system?
Review potable water supply and
treatment
Is sulfate concentration in potable supply
elevated?
Are alternative supplies available with lower sulfate
concentration?
Determine if pretreatment
agreements can be added or modified to
reduce sulfate or sulfide discharge to WWTP
Determine if sulfide can be captured and safely removed from
system (e.g. with chemical
precipitation)
Determine if sulfide can be captured and safely removed from
system (e.g. with chemical precipitation)
Does drinking water plant use ferric sulfate
or alum in amounts greater than 50 mg/L
sulfate?
Reassess sulfate/sulfide mass balance
for the WWTP
Assess costs of options for reducing sulfate and/or
sulfide upstream or within WWTP and cost of
additional “end of pipe” treatment
Consider alternative coagulants that are not sulfate-based
NO
YES YES YESYES YES
Can sulfate treatment be
implemented at the water treatment
plant?
Figure 3-2 Source reduction options chart

40
3.4.1 Understanding the Sulfur Mass Balance Developing a sulfur mass balance around a wastewater treatment plant will help identify potential means to reduce the mass of sulfate or sulfide coming to the plant. This mass balance approach would include identifying sources of sulfur in its various forms and species entering the plant or recycled within the plant and confirming that they match the measured amount of sulfur in influent and internal streams. External sources are industrial waste streams and domestic sewage, while potential internal sources include anaerobic digester sludge dewatering filtrate and digester decant. If the mass balance indicates that sulfate concentration in the potable water supply is elevated, a mass balance around the entire system, including water treatment, should be completed.
3.4.1.1 Removal of Sulfide from Collection System Generally, sulfide is easier to remove from water streams than sulfate, because it is volatile as hydrogen sulfide gas in certain pH ranges and readily precipitates with metals as insoluble metal sulfides. In systems that see hydrogen sulfide corrosion of wastewater collection systems, it may be possible to capture sulfide in collection systems before it reaches the wastewater treatment plant through air stripping and/or addition of iron salts. These methods can also be used to remove sulfide from internal recycle streams containing sulfide. Sulfide will only occur in water downstream of an anaerobic process. Any pipe or tank with enough sulfide to precipitate a meaningful amount is likely to see hydrogen sulfide corrosion or health issues, unless the pH is above 8. At low pH, remaining hydrogen sulfide can be stripped from solution, but must be managed to limit equipment damage and public health risk as described in Section 4.3.2.
Iron sulfide salts produced will end up in primary or secondary treatment sludges. Ultimately, the success of this approach relies on the stability of the iron sulfide precipitate. The fate of iron sulfide in the aeration basin and other places where it is exposed to oxidizing should be considered and understood prior to implementation.
3.4.1.2 Industrial Pre-treatment Agreement Modifications Sulfate in wastewater effluent originates from industrial, commercial, and municipal waste streams. If a substantial mass of sulfate in a specific wastewater influent comes from industrial sources, the municipality could potentially implement more restrictive pre-treatment requirements for those industries contributing significant amounts of sulfate or sulfide. The achievable sulfate reduction is limited to the sulfur mass originating from industrial facilities. Industrial facilities, such as ethanol plants, may be able to implement changes to minimize sulfate discharges to the wastewater treatment plant by switching to processes that use less sulfuric acid, for example.
In addition to reducing the influent sulfate to the wastewater treatment plant, external source reduction has the added benefit of reducing the potential for sulfide-induced corrosion of wastewater collection systems. Corrosion is caused by bacterial activity that converts sulfate in wastewater to sulfide and then to sulfuric acid, so reducing sulfate concentrations decreases the potential for corrosion.
41
3.4.2 Water Supply Modifications If a municipality sources its drinking water from groundwater aquifers, sulfate naturally present in groundwater travels through drinking water distribution, water use, and disposal to wastewater treatment where it contributes to influent and effluent sulfate concentrations. If the amount of sulfate present in the groundwater source is above the sulfate effluent limit at the wastewater treatment plant and there is a surface water source readily available, wastewater sulfate concentrations may be reduced by switching the drinking water source from groundwater to surface water. The achievable sulfate reduction is limited to the difference between the sulfate concentration in the groundwater and the sulfate concentration in the surface water.
If the source water contains elevated sulfate, many of the treatment technologies previously described could be used to reduce the sulfate concentration in the drinking water supply, and in fact, the use of some of these technologies (e.g., membrane treatment) is more common in the drinking water industry. Removing sulfate in the drinking water supply rather than at the outlet of the wastewater treatment plant may reduce the complexity of the pretreatment that is required. However, for the membrane and ion exchange technologies, the technical challenges of residuals management remain.
Another option for source reduction is to reduce sulfate added to the water during drinking water treatment. Some drinking water treatment plants use ferric sulfate or alum, both of which contain sulfate, to treat their water. If a specific wastewater treatment plant collects wastewater from an area serviced by a drinking water plant using these chemicals, they may be able to reduce influent sulfate by having the drinking water plant use different chemicals that do not add sulfate. The achievable sulfate reduction is limited to the sulfate mass originating from these chemicals. The sulfate salts used have the advantage of being readily soluble in water. The primary alternatives are ferric chloride and polyaluminum chloride.

42
4.0 Secondary Technologies for Managing Residuals and Byproducts
It is often the case when evaluating treatment options for various constituents, including sulfate, that the primary treatment objective can be met simply. However, the more difficult challenge is how to manage the waste products (residuals) from the treatment process. Whether the parameter of concern is sulfate, mercury, nitrogen, or chloride, the management and final disposition of the residuals can be more technically complex and often more costly than the primary treatment technology itself. In this section, technical considerations for residuals management are reviewed, beginning with the membrane technologies. Membrane treatment using either RO or NF can provide reliable removal of sulfate; however, it generates a salty, liquid waste stream. Management of this concentrate is a challenge that extends beyond Minnesota’s borders. It is encountered in other states that use these same technologies for drinking water production and in industries that use RO and NF for high-purity water production or wastewater treatment. The purpose of this section is to provide an overview of the “state-of-the-industry” with respect to residuals management, what approaches are being used elsewhere, and what technical, regulatory, and economic challenges remain.
4.1 Membrane Residuals: Concentrate Management Sulfate and other contaminants separated in membrane treatment processes end up in a concentrated brine solution that requires disposal. Membrane separation often consists of multiple stages of treatment, where the concentrate from the first stage is sent to the second stage to reduce the volume requiring further management. Management of concentrate is commonly managed in the following ways [Ref. (17)]:
• Surface water disposal • Discharge to the sanitary sewer (for potable water and industrial applications) • Deep-well injection • Land application • Evaporation ponds
Some industries also employ thermal evaporative technologies, as has been previously discussed. Within Minnesota and across the country, the technical, economic, or regulatory viability of these approaches is often significantly constrained. As a result, there are efforts currently underway to develop alternatives for managing the concentrate from these otherwise very promising treatment technologies. These efforts include resource recovery to extract or create materials that have market value from the concentrate and creative volume reduction and water reuse techniques. The importance of these efforts cannot be overstated. In fact, the U.S. Bureau of Reclamation recently launched a series of Advanced Water Treatment Prize Competitions to spur cross-disciplinary innovation in key areas [Ref. (18)]. Two of the competition areas revolve around concentrate management. The sections that follow provide an overview of technologies under development and examples of creative approaches being pursued by the drinking water industry to manage membrane concentrates.

43
4.1.1 Deep-well Injection Deep-well injection is regulated under the federal Underground Injection Control program (UIC) and the Safe Drinking Water Act (SDWA). In Minnesota, there is a moratorium on injection wells [Ref. (14)], preventing this as an option for concentrate disposal. However, an Underground Injection Control Permit Application can be filed with the United States Environmental Protection Agency (USEPA) Region 5, and a rule variance request submitted to the Minnesota Department of Health (MDH), which is responsible for granting variances to the administrative rule prohibiting use of wells for disposal or injection. Variances would likely require significant technical and legal review. Outside of Minnesota, deep-well injection is more commonly employed. One example of this is the El Paso Water Utilities (EPWU) Kay Bailey Hutchison Desalination Plant, which is the world’s largest inland desalination plant and produces 15.5 million gallons per day (MGD) of permeate and 3 MGD of concentrate [Ref. (19)]. The planning for this facility included extensive investigations into concentrate management options, which reviewed six alternatives for disposal. According to EPWU [Ref. (19)]:
Two methods were determined to be the most feasible: evaporation and deep-well injection. EPWU then tested evaporation methods, including conventional evaporation ponds, evaporation misting equipment and evaporation ponds with concentrators. Deep-well injection was selected as the preferred method of disposal, and the concentrate is placed in porous, underground rock through wells. The sites would confine the concentrate to prevent migration to fresh water, provide storage volume sufficient for 50 years of operation and meet all the requirements of the Texas Commission on Environmental Quality.
Deep-well injection entailed extensive study of local geological and hydrological conditions as well as the examination of existing data, including seismic analysis and water samples. The University of Texas at El Paso conducted a geophysics study that EPWU used to create a geologic model and the Army drilled four wells to test for geological formation.
This facility is illustrative of the challenges posed by inland applications of membrane technologies, the importance of residuals management planning and the level of effort required for it, but also the potential for successful, large-scale inland applications.
4.1.2 Volume Reduction Technologies Volume reduction technologies are designed to reduce the volume and thus the cost of disposal of a residual liquid stream [Ref. (20)] and can be used in combination with other concentrate management approaches. Mature volume reduction technologies include specialized membrane systems, such as electrodialysis (ED), Vibratory Shear Enhanced Processing (VSEP), High Efficiency Reverse Osmosis (HERO), and mechanical thermal technologies, such as evaporation, crystallization, and spray dryers. Further information on these technologies is included in Large Table 3.
Other volume reduction technologies under development include forward osmosis (FO), membrane distillation, slurry precipitation and reverse osmosis (SPARRO), and advanced reject recovery of water (ARROW). Further details regarding these technologies are included in Section 4.1.4 and Large Table 3.

44
4.1.3 Zero Liquid Discharge (ZLD) The original definition of the general term ZLD referred to no discharge of liquid streams across the plant boundary. Treated water or liquid wastes were managed by internal reuse or further treatment of liquid streams (by mechanical evaporation, for example). In the context of this report, ZLD refers to no liquid waste discharge. Treated water, on the other hand, is discharged. Wastes are subject to further treatment or solidification and not discharged. The term ZLD, in its current context, also does not necessarily mean taking concentrate or the wastewater feed in general all the way to solids or completely processing using thermal evaporation. ZLD is considered a subset of high recovery where the final residual wastes contain zero liquid [Ref. (17)]. Mechanical or thermal evaporation of membrane concentrate is one type of ZLD process. In this case, the product resulting from the ZLD system is typically a solid salt residue requiring disposal at an appropriate facility [Ref. (20)].
Given the high capital and O&M costs associated with evaporation and crystallization or spray drying and the requirement to further manage resulting brine streams or salt solids, the water and wastewater treatment industry is shifting toward combinations of treatment technologies for primary membrane concentrate minimization rather than direct use of evaporation with crystallization, thereby reducing the flow to these systems if they are implemented. There are three steps in a typical ZLD process, as shown on Figure 4-1 [Ref. (21)].
Primary
Concentration
Concentrate
Treatment
Secondary
Concentration
Concentrate
Salts
Salts
Final
Concentration
Permeate
Discharge
Figure 4-1 Typical ZLD process
In a sulfate treatment application, “primary concentration” represents the membrane treatment technology for sulfate removal, such as conventional NF or RO. “Concentrate treatment” represents solids contact clarification, chemical precipitation clarification, water softening, or some other step to condition concentrate for further membrane treatment. “Secondary concentration” consists of some additional membrane treatment to further minimize the concentrate stream, and the “final concentration” step can
45
consist of further clarification, a third stage of membrane treatment, or a thermal process to evaporate any remaining liquid leaving only salts for final disposal.
Combining multiple technologies provides operational flexibility and the ability to modify the concentrate management process based on water quality, using less chemical additives. Water and wastewater treatment plants in cities including Palm Coast, Florida; El Paso, Texas; and Chino, California have implemented combinations of treatment technologies to achieve ZLD to manage primary membrane concentrate. The primary membranes at these facilities are not necessarily for sulfate treatment. However, the concentrate management practices in place reflect options that could be applied to concentrate streams from primary membranes installed for sulfate removal.
Concentrate management at the City of Palm Coast, Florida drinking water treatment plant is used to reduce the concentrate volume requiring treatment and increase treated water supply for drinking water distribution. The ZLD system consists of a solids contact clarifier, followed by ultrafiltration (UF). Lime-soda ash softening is used as pre-treatment to ultrafiltration to precipitate carbonate and non-carbonate hardness, and a polymer is added to improve solids settling. Sulfuric acid and polyphosphate are added to softened water to inhibit scale formation on UF membranes. UF removes most of the remaining suspended solids. UF filtrate is disinfected prior to mixing with the existing water treatment plant permeate for distribution as drinking water [Ref. (22)].
Sludge removed from the softening clarifier is sent to a solids handling system that includes thickening and dewatering. Liquid removed from the sludge is recycled back to the head of the ZLD process. Dewatered lime solids are reused in the production of concrete aggregate and paver base [Ref. (22)].
Using this concentrate management combination of technologies, the City of Palm Coast is able to achieve zero liquid discharge and manage the concentrate through less energy-intensive means compared to evaporation with crystallization. A process flow diagram of concentrate management at the City of Palm Coast Water Treatment Plant #2 is provided on Figure 4-2.

46
Solids Contact ClarifierMembrane
treatment
concentrate
Sulfuric acid and
scale inhibitor
Feed pumps
Sludge dewatering and off-site disposal
Ultrafiltration Transfer pumps
Storage tank
Blend with finished drinking water for
distribution
Ammonium
sulfate
Sodium
hypochlorite
Equalization tank
Lime, soda ash,
polymer
Figure 4-2 Zero liquid discharge concentrate management, City of Palm Coast Water Treatment Plant #2

47
EPWU’s Kay Bailey Hutchison Drinking Water Desalination Plant (KBH) uses deep-well injection as a primary concentrate disposal technique. However, EPWU continues pioneering work around concentration management and is partnering with Enviro Water Minerals Company (EWM) to test and operate a ZLD product recovery plant to manage concentrate at the facility. The product recovery plant began operation on April 25, 2017. The EWM Plant (EWM P1) converts the 1.25 MGD concentrate stream from KBH plus 1.0 MGD raw brackish water into 2.1 MGD potable-quality water that is distributed as drinking water [Ref. (23)]. Using a proprietary combination of membrane treatment technologies followed by multiple chemical precipitation steps, the following products are recovered for beneficial reuses [Ref. (23)]:
• Potable-quality water (TDS<700 mg/L) • Caustic soda • Hydrochloric acid • Gypsum • Magnesium hydroxide
EWM P1 is the first of its type in the world and a demonstration of concentrate management that results in production of marketable chemical and mineral products in addition to eliminating waste disposal associated with concentrate management. As operation of EWM P1 continues and similar full-scale ZLD product recovery systems are installed, full economic impacts can be evaluated to determine the processes viability for concentrate management in other applications and states.
The concentrate minimization process in place at the Chino II Concentrate Reduction Facility (CRF), in Jurupa Valley, Southern California, combines chemical softening and membrane filtration to achieve ZLD. The Chino II CRF receives concentrate from the Chino II Desalter, a facility in Jupiter Valley, California that utilizes ion exchange (IX) and RO treatment trains to treat brackish groundwater for drinking water. Concentrate is first sent through a pellet softener system to remove calcium and silica from RO concentrate. Softened water is then passed though granular media filters for particle removal ahead of a second-stage RO process. With this concentrate management approach, the primary RO recovery, which is the ratio of the product water flow to the feed water flow, increased from 83.5 percent to 95 percent, which results in a smaller volume of concentrate for disposal [Ref. (24)]. A process flow diagram of concentrate management at the Chino II CRF is provided on Figure 4-3.

48
Solids Contact ClarifierMembrane
treatment
concentrate
Sludge dewatering and off-site disposal
Discharge
Lime
Pellet Softener
System
Dual Media Filtration
System
Filter backwash
storage
Caustic
soda
RO
Seed
material
Ferric
chloride
Feed pumps
Reduced concentrate stream requiring off-site disposal
Figure 4-3 Concentrate minimization process, Chino II Concentrate Reduction Facility

49
4.1.4 Concentrate Management Technologies under Development While thermal technologies have the broadest range of existing applications with the highest liquid recovery, high capital and energy costs are spurring the development of pressure driven, electric potential, or intermediate precipitation processes for concentrate management as alternatives to thermal technologies [Ref. (21)]. Use of waste heat or biogas could potentially be viable options to reduce costs associated with evaporation with crystallization, as well as co-locating thermal concentrate management with other industries that generate waste heat, such as the power industry.
A number of concentrate management technologies are currently under development and have the potential to become viable options once pilot and full-scale applications are installed and successful operation is demonstrated. Large Table 3 includes a selection of emerging technologies and notable advantages and disadvantages associated with each. As mentioned in Section 4.1.3, new concentrate management commonly incorporate combinations of additional membrane treatment, softening, etc., rather than an energy-intensive thermal process to reduce the volume of primary membrane concentrate.
4.1.5 Concentrate Management in Minnesota The viability of concentrate management processes will depend upon the sulfate mass balance, unless zero liquid discharge is implemented. In Minnesota, concentrate management options with the greatest viability include deep-well injection and ZLD coupled with high-recovery membrane processes. Deep-well injection remains prohibited in Minnesota, as described in Section 4.1. Further research and development that evaluates combinations of membrane treatment and chemical precipitation to achieve ZLD would be valuable to support concentrate management alternatives to thermal treatment.
Selective salt recovery and development of a saleable product from a ZLD process is dependent on specific salts in the concentrate, concentrate quality, concentrate quantity, market size, and stability. Research and evaluation of the likely composition of saleable products resulting from municipal wastewater treatment concentrate management would be valuable because this could help to offset capital and O&M costs associated with the ZLD system. While ZLD processes may not require costly thermal treatment technologies, the full economic impacts associated with multiple treatment processes, when fully accounted for, may be equally cost-prohibitive.
As mentioned in Section 4.1, in 2017, the U.S. Bureau of Reclamation (USBR) launched a series of Advanced Water Treatment Prize Competitions to solve critical water and water-related issues. The Advanced Water Treatment Grand Challenge Framework includes the following stages:
• Stage 1 – conceptual proposal • Stage 2 – lab-scale prototype tests • Stage 3 – field-scale demonstrations
Of the specific challenge topics identified to date, two relate to concentrate management:
• More Water Less Concentrate Stage 1 (Stage 1 launched December 2016 and closed March 2017) • Beneficial Uses for Concentrate Stage 1 (has not yet launched)

50
Award notices have not been released after the close of Stage 1 of the More Water Less Concentrate challenge topic [Ref. (25)]. Moving forward, the USBR will determine scope and level of effort for future challenge competitions based on funding available. A topic selection advisory committee will be assembled and they will continue to recruit partners from the public, industry, venture capital, and non-profit organizations for specific prize competitions [Ref. (25)]. Following concentrate management, innovative ideas, as they unfold through this competition, could provide valuable insight for applications in Minnesota.
4.2 Biological and Chemical Treatment Residuals: Sludge and Solids Management
Both chemical precipitation and biological treatment processes produce solids that require management. Either type of sludge should be thickened and/or dewatered prior to disposal to reduce the volume. Dewatered sludge can be disposed of in landfills.
Chemical precipitation sludges from sulfate removal processes consist of gypsum, ettringite, or barite salts, depending on the process used, along with any organic matter or other salts removed in the process. Depending on the concentration and leachability of barium in the barite sludge, it may require disposal in a hazardous waste landfill, if toxicity characteristic leaching procedure (TCLP) concentrations are greater than 100 mg/L. Because ettringite is a more complex salt that requires specific conditions to form, ettringite sludge is less stable than either gypsum or barite sludge, and can dissolve to release sulfate at low pH. It also has a looser crystal structure, and therefore is more difficult to settle; in some cases, centrifugation may be needed to separate ettringite from solution [Ref. (26)].
Biological sludge from sulfate removal processes can be managed like other biological wastewater sludge. Ultimate disposal can be achieved in landfills or via land application, depending on the biosolid grade achieved. The sulfate-reducing bacteria are slow growers and would be expected to have minimal impact on overall mass of biosolids that need to be managed.
4.3 Sulfide Management Sulfide, which is produced in all biological sulfate treatment processes, poses a safety risk to operators and nearby public. Hydrogen sulfide is detectable by the human nose at concentrations as low as 0.01 ppm, and toxic to humans at concentrations over 2 ppm. Health effects of hydrogen sulfide gas are well known [Ref. (27)].
Due to this high toxicity, any biological sulfate treatment technology should be paired with a sulfide management technology. Sulfide can be managed in several different ways, as described in the following sections.
4.3.1 Chemical Sulfide Removal When sulfide is combined with metals, the resulting compounds are very insoluble in water, so they form solids that settle out of solution. The most common chemical method to remove sulfide is addition of iron or other metal salts [Ref. (28)]. Iron filings or minerals such as magnetite can be used to precipitate sulfide

51
in ponds or reactors [Ref. (29)]. Sulfide can also be chemically oxidized using hydrogen peroxide, chlorine, or potassium permanganate, but this process converts the sulfide back into sulfate [Ref. (28)]. Produced metal sulfide sludge can be disposed of in landfills. Depending on landfill degradation processes, sulfide could be released as sulfates into landfill leachate.
4.3.2 Air Stripping of Sulfide and Associated Treatment The least complex sulfide treatment option involves moving the hydrogen sulfide from the water into the gas phase using a process called stripping, with either air or an inert gas, such as nitrogen, and then treating the hydrogen sulfide-containing gas using physical, chemical, or biological methods. The pH of the water is a critical operational component for the efficacy of air stripping. The water must have a pH lower than about 6 for this option, because hydrogen sulfide stays dissolved in the liquid at higher pH values. After stripping the hydrogen sulfide into the air stream, one option is to route the contaminated air through a bed of woodchips or other organic matter, which serves as a biofilter where bacteria eat the sulfide and produce elemental sulfur or sulfate. Biofilters require a large surface area and the biofilter material must be replaced intermittently and landfilled.
Another option is to remove the sulfide using a chemical reaction with solids such as reduced iron or granulated activated carbon (GAC). The resulting materials would end up as a solid waste, which could be landfilled. In either case, sequestered sulfur would end up in the landfilled material, and may leach out again in the future as sulfate. In some cases, spent GAC can be reactivated using heat and reused.
52
5.0 Use of Information 5.1 Treatment Technology Selection Process The screening process presented in Section 3.0 reviewed and scored treatment technologies that are reasonably well-commercialized and have a demonstrated ability to remove sulfate to a given concentration. Membrane technologies scored high in the screening exercise, but it is important to understand that this is not the only class of technologies that may be an option for a given wastewater treatment plant. Each wastewater treatment plant that may be required to reduce the sulfate concentration in its wastewater effluent will have unique conditions and circumstances that must be considered. For example, not all municipalities will be required to achieve very low concentrations of sulfate (i.e., tens of mg/L). In those circumstances, a polishing-level of treatment may be all that is required and technologies other than membrane treatment may be more viable.
In that light, this section is intended to provide guidance to municipalities on how to use the data presented in this report to begin the process of assessing their unique situation. What follows is a framework for informing decision-making to select sulfate reduction technologies. This framework was developed assuming that the primary considerations for a wastewater treatment plant are the ability to reliably meet sulfate targets and cost.
1. Evaluate whether source reduction can meet the sulfate target using the flow chart presented on Figure 3-2. If source reduction is not practical or unable to meet sulfate target, evaluate sulfate treatment technologies in the following steps.
2. If sulfate removal to greater than 250 mg/L is all that is required, review the technology information outlined in Large Table 1. This table contains a summary of all technologies reviewed, including those not fully commercialized yet and those that remove sulfate down to only 250 mg/L. If treatment to less than 250 mg/L is required, compare the influent and effluent sulfate concentrations to the sulfate removal estimates depicted on Figure 3-1. List the technologies that are below the point, which are the technologies that are likely able to meet the sulfate treatment requirements.
3. Review the technology information outlined in Large Table 1 for the technologies selected in Step 1. If any of the technology characteristics are incompatible with the existing wastewater treatment plant or with the needs of the community, remove those from the list.
4. Compare the screening criteria and their weights to the priorities of the wastewater treatment plant and the community. Review the screening table outlined in Large Table 2 for technologies remaining after Step 2 and favorably consider technologies that score high overall and for the criteria that are most important to the community. Weighting of factors may vary by municipality and should be adjusted accordingly.

53
5. Contact MPCA to identify other parameters that might require additional removal. Review the ability of the technologies to remove other parameters that may be of concern presented in Table 3-4 and favorably consider technologies that also remove other required parameters.
6. Develop management possibilities for residuals and byproducts using Section 4.0.
7. Develop a preliminary cost estimate, including primary technology and ancillary technologies for pre- or post-treatment or residuals and byproduct management, to inform relative costs of different options.
5.2 Treatment Technology Selection – Facility Examples This section provides examples of how two types of municipalities may employ the treatment processes described in Section 3.0.
5.2.1 Treatment Technology Selection – Pond System Example An example pond wastewater treatment system process flow diagram is provided on Figure 5-1. This example illustrates a stabilization pond wastewater treatment plant with an influent sulfate concentration of approximately 300 mg/L and an effluent sulfate limit of 100 mg/L. In this example, 66% sulfate removal is required, and biological sulfate treatment with a packed bed bioreactor may be able to provide the required removal. Sulfate treatment technology process equipment and pre- and post-treatment are shown in red. Note that site-specific bench- and pilot-testing would be needed to evaluate the ability of any technology to meet effluent limits.

54
Primary Stabilization
Pond(s)
Influent sulfate
300 mg/LPacked Bed
Bioreactor
Liquid Carbon
Source
Organic Biofilter
Air
Air
Stripper
Intermittent biofilter material landfill disposal
DischargeWater
Sulfide
Removal
Effluent sulfate
limit 100 mg/LpH
Adjustment
Secondary Stabilization
Pond(s)
Figure 5-1 Pond system example sulfate treatment retrofit

55
In this stabilization pond treatment system example, the first stabilization pond serves as solids removal pre-treatment to the packed bed bioreactor, where an optional liquid carbon source, such as methanol, can be added to the reactor as food for the sulfate-reducing bacteria. The feed for the packed bed could potentially be drawn from the bottom of the facultative lagoon so that it is already at a low ORP. Seasonal mixing effects should be considered. Bioreactor effluent is routed through an air stripper to separate the hydrogen sulfide-containing gas from the treated wastewater. pH adjustment to less than 6 would be required ahead of the air stripper for optimal hydrogen sulfide removal, and additional pH adjustment may be necessary downstream to keep the effluent into the range of 6-9. Water leaving the air stripper would be routed to the second stabilization pond for removal of remaining influent BOD and any extra supplemental carbon not used in the bioreactor.
Hydrogen sulfide-laden air removed in the air stripper would be routed through an organic biofilter consisting of woodchips or other organic matter, where bacteria consume the sulfide and convert it to elemental sulfur. Biofilter material would be replaced periodically and landfilled.
Further considerations for a pond system retrofit for sulfate removal using a packed bed bioreactor include:
• Liquid carbon and pH adjustment chemical metering and storage requirements • Biofilter selection based on available footprint – generally requires a large surface area • Truck access for biofilter material removal • Temperature impacts biofilter and packed bed reactor performance • WWTP operator certification level required for operation
5.2.2 Treatment Technology Selection – Activated Sludge System Example An example activated sludge system sulfate treatment technology process flow diagram is provided on Figure 5-2. This example represents an activated sludge wastewater treatment plant with an influent sulfate concentration of greater than 500 mg/L and an effluent sulfate limit of 25 mg/L. With 95% sulfate removal required, RO or NF membrane separation is the only sulfate treatment technology likely to meet the effluent limit. Sulfate treatment technology process equipment and pre- and post-treatment are shown in red. Note that site-specific bench- and pilot-testing would be needed to evaluate the ability of any technology to meet effluent limits. Additionally, multiple stages of membrane separation and subsequent concentrate management may be required beyond what is shown on the figure. Complete treatment system design needs to be evaluated on a site-specific basis.

56
RO or NF
Reduced concentrate stream requiring off-site disposal or
management
Preliminary
Treatment
Complete Mix
Activated Sludge
Secondary ClarificationNH4
NO3
Secondary Clarification Tertiary Filtration / RO
Pretreatment
Nitrification –
Suspended
Growth
Discharge
Disinfection
Antiscalant
Lime or
Calcite
Contactor
Primary Clarification
Influent
sulfate
>500 mg/L
Effluent sulfate
limit 25 mg/L
Figure 5-2 Activate sludge system example sulfate treatment retrofit

57
If tertiary filtration is already in place at an activated sludge facility, this can potentially be retrofitted to meet membrane pre-treatment requirements. However, there are several parameters of general fouling concern for RO treatment, and other membrane technologies, including total organic carbon (TOC), total suspended solids (TSS), calcium carbonate, organics, iron, manganese, barium sulfate, calcium sulfate, strontium sulfate, calcium phosphate, silica, and aluminum. In waters with high concentrations of organic matter and nutrients, membranes are susceptible to fouling due to biological activity at the membrane surface, where conditions support the growth of microorganisms and permeability can decrease as microorganisms grow in the membrane pores [Ref. (8)].
TOC presents significant concerns for membrane treatment systems by providing a substrate for biofouling and by fouling the membranes directly. The TOC concentration required to minimize biofouling potential depends on the character of the organic matter present [Ref. (30)]. Potentially viable TOC removal technologies include carbon adsorption, coagulation/flocculation/filtration, and biofiltration [Ref. (10)]. Ferric chloride use, for example, ahead of microfiltration or ultrafiltration provides a surface for TOC adsorption.
Strategies commonly used to control membrane fouling include [Ref. (8)]:
• Pre-treatment of feed water o Microfiltration or ultrafiltration
• Hydraulic flushing o Cross-flow velocity across the membrane
• Chemical treatment and conditioning o Adding antiscalants and dispersants ahead of the membrane o Maintaining the optimal pH using acid o Maintaining residual chloramines throughout the system to control the presence of
microorganisms
• Chemical cleaning of the membranes
• Careful membrane selection o Taking pore size into consideration o Smooth, hydrophilic membrane for high and constant flux [Ref. (31)]
Membrane treatment systems produce high-quality, low-TDS treated water. This permeate water quality is often better than is required for its final use. In order to minimize the cost of the treatment system and associated concentrate management, in typical applications such as drinking water treatment, membrane treatment systems are sized to treat the portion of the flow adequate to bring final product water to the target water quality. In the case of treating municipal wastewater for sulfate removal, the sulfate mass balance in the final polishing step should be carefully examined and optimized to assist with concentrate minimization.

58
Extreme conditions including the low-flow, high-sulfate concentration condition and the high-flow, low-sulfate concentration condition should be evaluated based on historic water quality and flow data. If a high-flow condition controls required membrane treatment system sizing, additional equalization capacity should also be considered.
Further considerations for activated sludge system retrofit for sulfate removal by membrane treatment include:
• Pre- and post-treatment chemical storage and metering and space requirements • Concentrate management selection based on available footprint • Salt storage and truck access for salt removal if evaporation with crystallization is the selected
concentrate management method • WWTP operator certification level required for operation
59
6.0 Conclusions Alternatives to remove sulfate from wastewater include source reduction, chemical precipitation, ion exchange, membrane treatment, biological treatment, and evaporative treatment. This study evaluated the feasibility of these alternatives and specific technologies associated with each category. Several technologies were eliminated as feasible options for sulfate removal based on a threshold screening process. Technologies that have been found able to remove sulfate to below 250 mg/L and have been demonstrated at full-scale were further evaluated in a detailed technology screening process.
The technology screening process results indicate that reverse osmosis and nanofiltration are the most well-developed and effective alternatives for sulfate removal. However, the management of the residuals from these technologies poses a significant impediment to their implementation, and approaches for concentration management must be carefully considered when planning for implementation of membrane technologies. Chemical precipitation and ion exchange scored slightly below reverse osmosis and nanofiltration (membrane technologies), primarily due to limited ability to remove sulfate to low concentrations (e.g., less than 50 mg/L), fewer commercial applications, and higher risks to operator and public health. However, depending upon the influent sulfate concentration, if a wastewater treatment plant effluent limit for sulfate is above 50 mg/L, a chemical precipitation or ion exchange treatment technology may be effective for the required sulfate removal. The screening results also reflect the state of the industry today in terms of municipal wastewater treatment for sulfate removal and provide an indication of additional technologies that may be viable in the future pending further commercialization, demonstration of reliable operation, and residuals management developments.
As demonstrated by the threshold screening, numerous biological treatment processes are under development for sulfate removal. Due to the slow growth of sulfate-reducing bacteria, a much longer retention time is required in the biological reactor than is typically practical in municipal wastewater treatment. In addition, biological treatment systems for sulfate removal require significant development of design and operational strategies to ensure the success of sulfate-reducing bacteria growth before they can be employed to full-scale implementation for municipal wastewater treatment. Biological treatment of sulfate has primarily been applied to mine water treatment, where metals removal by converting sulfate to sulfide is the primary goal, not sulfate removal; so in those settings, low-efficiency biological treatment systems like constructed wetlands and mine pit reactors are practical. However, for municipal wastewater treatment, the retention time requirement and other operational limitations resulted in technology screening scores on the lowest end of the range compared to the other treatment technologies.
The technologies were also screened for their ability to remove other parameters of concern, including other major ions, mercury, and total dissolved solids in addition to sulfate. This was not a primary focus in selecting treatment technologies for research and screening; however, the ability to remove parameters of concern in addition to sulfate can help inform technology selection for wastewater treatment plants. This phase of screening found that while there is limited information on the use of some technologies for the removal of these other parameters, certain membrane technologies based on reverse osmosis membranes provide the most removal of these constituents.

60
The sulfate treatment technology screening results presented as part of this study helped inform Part 2 of this study, which considered the implementation of sulfate removal at municipal wastewater treatment plants. In Part 2, preliminary designs for sulfate removal for several municipal case studies were developed. The goal of the designs was to identify and illustrate key technical considerations that are associated with technology implementation. Cost estimates for the conceptual designs were also developed.

61
7.0 References 1. Water Environment Federation. Design of Municipal Wastewater Treatment Plants: WEF Manual of Practice No. 8, ASCE Manuals and Reports on Engineering Practice No. 76, Fifth Edition. s.l. : McGraw-Hill Education, 2010.
2. Barr Engineering Co. Engineering Cost Analysis of Current and Recently Adopted, Proposed, and Anticipated Changes to Water Quality Standards and Rules for Municipal Stormwater and Wastewater Systems in Minnesota. Minneapolis, MN : s.n., January 2017.
3. Ehrlich, H.L. Geomicrobiology. Journal of Basic Microbiology. 1981. Vol. 22, 6.
4. Howarth, R.W. and Stewart, J.B. The Interactions of Sulphur with other Element Cycles in Ecosystems. Sulphur Cycling on the Continents. New York : John Wiley and Sons, Ltd., 1992.
5. Stumm, W. and Morgan, J.J. Aquatic Chemisry. New York : John Wiley & Sons, 1981.
6. Veolia Water Technologies. LoSO4™ Sulfate Reduction Technology for Mine Water. [Fact Sheet]. n.d.
7. Bologo, V., Maree, J.P. and Louw, W.J. Treatment of Mine Water for Sulphate and Metal Removal Using Magnesium Hydroxide and Barium Hydroxide. s.l. : Tshwane University of Technology; Pretoria, South Africa.
8. Metcalf & Eddy. Water Reuse. [ed.] G. Tchobanoglous, et al. First. New York : McGraw Hill, 2007.
9. Littlejohn, P., Kratochvil, D., Baker, B., and Fatula, P. Removal of Hardness and Sulfate from Flue Gas Desulfurization Effluent Using Ion Exchange. 74th Annual International Water Conference. Orlando, FL : s.n., November 2013.
10. American Water Works Association. Reverse Osmosis and Nanofiltration. Denver, CO : s.n., 2007. Vols. Manual of Water Supply Practices-M46, 2nd Edition.
11. Metcalf & Eddy. Wastewater Engineering: Treatment and Reuse. Fourth Edition. s.l. : McGraw-Hill, 2003.
12. Mackey, E.D., Seacord, T., Stringfield, D. and Carlo, P. Salinity Removal Cost Curves for Small to Medium Size Water Wells and Wastewater Effluents. Technology 2005. s.l. : Water Environment Federation, 2005. pp. 539-557.
13. Minnesota Pollution Control Agency. Draft - Cost Analysis Components of Regulatory Analysis, Proposed Sulfate Standard for Protection of Wild Rice. December 2016.

62
14. The Office of the Revisor of Statutes. Minnesota Administrative Rules, Ch. 7050, Waters of the State, Minnesota Pollution Control Agency. [Online] [Cited: June 20, 2017.] https://www.revisor.mn.gov/rules/?id=7050.
15. Grounds, T., Midgley, H.G. and Nowell, D.V. The use of thermal methods to estimate the state of hydration of calciumtrisulphoaluminate hydrate 3CaO·Al2O3·3CaSO4·nH2O. Thermochimica Acta. April 1985. Vol. 85, pp. 215-218.
16. Tchobanoglous, G. and Kreith, F. Handbook of Solid Waste Management. Second Edition. s.l. : McGraw-Hill, 2002.
17. Mickley, M. White Paper: Brackish Groundwater Concentrate Management. Mickley & Associates. March 2010. Prepared for New Mexico State University and Consortium for High Technology Investigations on Water and Wastewater.
18. U.S. Department of the Interior-Bureau of Reclamation. Reclamation - Managing Water in the West, Advanced Water Treatment Prize Competitions, Turning Clean Water Innovation into a Global Sporting Event. s.l. : Water Environment & Reuse Foundation, January 9, 2017.
19. El Paso Water. Water: Setting the Stage for the Future. El Paso Water. [Online] [Cited: June 23, 2017.] www.epwu.org/water/desal_info.html.
20. U.S. Department of the Interior - Bureau of Reclamation. Brine-Concentrate Treatment and Disposal Options Report; Southern California Regional Brine-Concentrate Management Study-Phase I, Lower Colorado Region. October 2009.
21. Kinser, K. and Sampson, D. (HDR). What are the options for ZLD? Jupiter, FL : s.n., May 10, 2017.
22. Greiner, F. and Hogan, J. Palm Coast Water Plant #2, Zero Liquid Discharge Process. Recovery Zone. Spring 2016.
23. Enviro Water Minerals Company. Projects: El Paso, TX - EWM P1. EWM Enviro Water Minerals Company. [Online] [Cited: June 23, 2017.] http://envirowaterminerals.com/projects.html.
24. Shih, W., Yallaly, B., Marshall, M., Meyerhofer, J., Safely, J., Paxton, C. and Najm, I. Chino II Desalter Concentrate Management via Innovative Byproduct Resale and Treatment. Membrane Residuals Solutions - Fall 2013. s.l. : American Membrane Technology Association.
25. U.S. Department of the Interior-Bureau of Reclamation. More Water, Less Concentrate - Stage 1. Reclamation - Managing Water in the West. [Online] [Cited: June 23, 2017.] https://www.usbr.gov/research/challenges/morewater.html.
26. Coaltech 2020. Evaluation of New and Emerging Mine Water Treatment Technologies - Part D, Evaluation of the Savmin Sulphate Removal Process. [n.d.].

63
27. United States Depatment of Labor. Occupational Safety and Health Administration - Hydrogen Sulfide. [Online] [Cited: June 20, 2017.] https//www.osha.gov/SLTC/hydrogensulfide/hazards.html.
28. Zhang, L., De Schryver, P., De Gusseme, B., De Muynck, W., Boon, N. and Verstraete, W. Chemical and biological technologies for hydrogen sulfide emission control in sewer systems: a review. Water Research. January 2008. Vol. 42, (1-2), pp. 1-12.
29. Zhang, L., Verstraete, W., Mendoza, M., Lu, Z., Liu, Y., Huang, G. and Cai, L. Decrease of dissolved sulfide in sewage by powdered natural magnetite and hematite. Science of the Total Environment. 2016. Vol. 573, pp. 1070-1078.
30. Tang, F., Hu, H.Y., Sun, L.J., Wu, Q.Y, Jiang, Y.M., Guan, Y.T. and Huang, J.J. Fouling of reverse osmosis membrane for municipal wastewater reclamation: Autopsy results from a full-scale plant. Desalination. 2014. Vol. 349, pp. 39-73.
31. Xu, P., Bellona, C. and Drewes, J. Fouling of nanofiltration and reverse osmosis membranes during municipal wastewater reclamation: Membrane autopsy results from pilot-scale investigations. Journal of Membrane Science. s.l. : Elsevier B.V., 2010. Vol. 353, pp. 111-121.
32. U.S. Geological Survey. Ground Water Atlas of the United States. Iowa, Michigan, Minnesota, Wisconsin (HA 730-J). Cambrian-Ordovician aquifer system. [Online] https://pubs.usgs.gov/ha/ha730/ch_j/J-Cambrian.html.
33. Banerjee, K., Kronebusch, H., Buisson, H., Dambrosio, C. and Robinson, C. Comparison of advanced and conventional technologies for low level sulfate reduction from mine water. s.l. : Veolia Water Technologies.
34. Lorax Environmental. Treatment of Sulphate in Mine Effluents. s.l. : International Network for Acid Prevention, October 2003.
35. Silva, R., Cadorin, L. and Rubio, J. Sulphate ions removal from an aqueous solution: I. Co-precipitation with hydrolysed aluminum-bearing salts. Minerals Engineering. 2010. Vol. 23, pp. 1220-1226.
36. Dow. Separation of Sulfur from Liquid or Vapor. Dow. [Online] [Cited: June 24, 2017.] http://www.dow.com/en-us/water-and-process-solutions/resources/periodic-table/sulfur.
37. Barr Engineering Co. Ion Exchange Bench Test Report - Dunka Mining Area; NPDES Permit No. MN 0042579. Prepared for Cliffs Erie LLC. September 2011.
38. Desalitech. High Recovery Reverse Osmosis Water Treatment for Industrial & Municipal Applications. 2017.
39. Archer Daniels Midland. A Better Mousetrap: Minimizing Cost and Operational Risk in Water and Wastewater Reverse Osmosis. [PowerPoint]. 2017.

64
40. General Electric Power & Water - Water and Process Technologies. Many Municipalities Tap into Benefits of EDR Water Treatment. [Fact Sheet]. June 2013.
41. Reahl, E.R. Half a Century of Desalination with Electrodialysis. GE Water & Process Tehnologies. 2006.
42. Veolia Water Technologies. ZDD - Zero Discharge Desalination. [Brochure]. 2017.
43. Alkhudhiri, A., Darwish, N. and Hilal, N. Membrane distillation: a comprehensive review. Desalination. February 15, 2012. Vol. 287, pp. 2-18.
44. Ashoor, B.B., Mansour, S., Giwa, A., Dufour, V., and Hasan, S.W. Principles and applications of direct contact membrane distillation (DCMD): A comprehensive review. Desalination. November 2016. Vol. 398, pp. 222-246.
45. Koeman-Stein, N.E., Creusen, R.J.M., Zijlstra, M., Groot, C.K., van den Broek, W.B.P. Membrane Distrillation of Industrial Cooling Tower Blowdown Water. Water Resources and Industry. 2016. Vol. 14, 11-17.
46. New Logic Research, Inc. VSEP Technology. New Logic Research, Inc. [Online] [Cited: June 24, 2017.] http://www.vsep.com/technology/index.htm..
47. Oasys Water. Technology - ClearFlo MBCx platform. Oasys Water. [Online] [Cited: June 24, 2017.] http://oasyswater.com/solutions/technology/.
48. —. Markets - High Recovery Desalination. Oasys Water. [Online] [Cited: June 24, 2017.] http://oasyswater.com/markets/.
49. Mickova, I. Advanced Electrochemical Technologies in Wastewater Treatment Part I: Electrocoagulation. American Scientific Research Journal for Engineering, Technology, and Sciences. 2015. Vol. 14, No. 2, pp. 233-257.
50. Bilal, B.A. and Tributsch, H. Thermo-electrochemical reduction of sulfate to sulfide using a graphite cathode. Journal of Applied Electrochemistry. October 1998. Vol. 28, 10, pp. 1073-1081.
51. Bowell, R.J. A review of sulfate removal options for mine waters. Mine Water - 2004. s.l. : SRK Consulting, Windsor Court, 1 Windsor Place, Cardiff CF10 3BX, Wales.
52. Samee, M. Biological Sulfate Reduction of Reverse Osmosis Brine Concentrate: Process Modeling and Design. Dissertation presented to Faculty of the Graduate School, University of Southern California. May 2007.
53. Greben, H.A., Matshusa, M.P. and Maree, J.P. The biological sulphate removal technology. 9th International Mine Water Congress. 2005.

65
54. Krapivina, M., Kurissoo, T., Blonskaja, V., Zub, S. and Vilu, R. Treatment of sulphate containing yeast wastewater in an anaerobic sequence batch reactor. Proc. Estonian. Acad. Sci. Chem. 2007. Vol. 56, 1, pp. 38-52.
55. Reinsel, M. Biological Treatment at Kinross' Kettle River Operations. Northwest Mining Association Annual Meeting. [Presentation]. September 25, 2013.
56. BioteQ. Industrial Solutions. [Brochure]. Vancouver, British Columbia : s.n., [n.d.].
57. Hao, T., Xiang, P., Mackey, H.R., Chi, K., Lu, H., Chui, H., van Loosdrecht, M.C.M., and Chen, G. A review of biological sulfate conversions in wastewater treatment. Water Research. 2014. Vol. 65, I-21.
58. Lu, H., Wu, D., Feng, J., Ekama, G.A., van Loosdrecht, M.C.M. and Chen, G. The Demonstration of a Novel Sulfur Cycle-Based Wastewater Treatment Process: Sulfate Reduction, Autotrophic Denitrification, and Nitrification Integrated (SANI) Biological Nitrogen Removal Process. Biotechnology and Bioengineering. November 2012. Vols. 109, No. 11.
59. Hong Kong University of Science and Technology. Executive Summary: Large-Scale Study on Realization and Application of SANI Process in Sewage Treatment in Hong Kong. September 2015.
60. Heartland Water Technology. Core Technologies. Heartland Water Technology. [Online] [Cited: June 24, 2017.] http://www.heartlandtech.com/about/core-technologies/.
61. —. Industry Solutions. Heartland Water Technology. [Online] [Cited: June 24, 2017.] http://www.heartlandtech.com/category/solutions/.
62. Veolia Water Technologies. MBD™ Modular Brine Crystallization System, HPD® Evaporation and Crystallization. [Fact Sheet]. 2015.
63. —. Zero Liquid Discharge (ZLD) Systems, HPD® Evaporation and Crystallization. [Fact Sheet]. 2016.
64. Gonzalez, A., Urtiaga, A.M., Ibanez, R. and Ortiz, I. State of the art and review on the treatment technologies of water reverse osmosis concentrates. Water Research. 2012. Vol. 46, pp. 267-283.
65. Paques. SULFATEQ™. Paques - Leading in biological wastewater and gas treatment. [Online] [Cited: June 24, 2017.] http://en.paques.nl/products/other/sulfateq.

Large Tables

Large Table 1 Sulfate reduction technology details
Primary Sulfate
Removal Categories
Technology Technology description
Lowest achievable
sulfate concentration
(mg/L)
Prim
ary
Tech
nolo
gy
Con
cent
rate
M
anag
emen
t Te
chno
logy
Addi
tives
Req
uire
d
Pre-
trea
tmen
t re
quire
men
ts [1
]
Post
-tre
atm
ent
requ
irem
ents
[2]
Resi
dual
s m
anag
emen
t and
se
cond
ary
impa
cts
Deg
ree
of
com
mer
cial
izat
ion
Rela
tive
cost
/
com
plex
ity o
f op
erat
ion
Influent source sulfate
reduction
Change Drinking Water Source (if
groundwater source)
Change drinking water to a surface water source with lower chloride concentrations.
Reduction of 100-1,000 mg/L, depending on concentration in source [Ref. (32)]
X - N/A N/A N/A N/A Common practice
Drinking water supply and plant would require major modifications
Change Drinking Water Coagulant (if alum and surface
water source)
Change drinking water treatment process to use ferric chloride instead of aluminum sulfate as the primary coagulant.
Reduction of 10-50 mg/L, depending on alum dose
X - N/A N/A N/A N/A Common practice
Similar chemical cost, drinking water plant would require some adaptations
Restrict Industrial Discharges
Implement tighter pre-treatment requirements to reduce sulfate concentration in discharges.
Reduction varies depending on industrial sources
X - N/A N/A N/A N/A Common practice May have economic implications
Influent and Recycle Sulfide Control
Remove sulfide from influent and WWTP recycle streams through precipitation with metal salts
Reduction varies depending on sulfide mass
X - Iron or other metal salts
N/A N/A N/A Common practice in collection systems
May have economic implications
Chemical precipitation
Gypsum Precipitation
Calcium is added in the form of lime, and combines with sulfate to form gypsum solids, which can be removed from the water by settling. Final concentration is limited by solubility of gypsum to about 1,500 mg/L [Ref. (33)].
1,200 mg/L [Ref. (34); (33)] - X Lime None
Recarbonation and pH adjustment
Sludge management required
Common in mine water treatment
Similar in operation to lime softening
Ettringite Precipitation (CESR or SAVMIN)
Lime and Gibbsite are added to form ettringite, which can be removed in a clarifier. Gibbsite can be recovered from ettringite and reused.
100-200 mg/L [Ref. (34); (33)] X X
Lime, aluminum reagent
Most cost-effective if gypsum removed first (if influent sulfate is greater than 1,000 mg/L)
Recarbonation and pH adjustment
Sludge management required
Common in mine water treatment
Aluminum reagent expensive, ettringite formation requires specific conditions, sludge unstable

Large Table 1 Sulfate reduction technology details
Primary Sulfate
Removal Categories
Technology Technology description
Lowest achievable
sulfate concentration
(mg/L)
Prim
ary
Tech
nolo
gy
Con
cent
rate
M
anag
emen
t Te
chno
logy
Addi
tives
Req
uire
d
Pre-
trea
tmen
t re
quire
men
ts [1
]
Post
-tre
atm
ent
requ
irem
ents
[2]
Resi
dual
s m
anag
emen
t and
se
cond
ary
impa
cts
Deg
ree
of
com
mer
cial
izat
ion
Rela
tive
cost
/
com
plex
ity o
f op
erat
ion
Ettringite Precipitation with Aluminum
Recovery (LoSO4) Example Vendor:
Veolia
Lime and aluminum reagent are added to form ettringite, which can be removed in a clarifier. Sludge is then processes to recover aluminum reagent for reuse. Designed for mine water treatment of nanofiltration (NF) reject [Ref. (6)].
100 mg/L [Ref. (6)] X X
Lime, aluminum reagent
Most cost-effective if gypsum removed first (if influent sulfate is greater than 1,000 mg/L)
Recarbonation and pH adjustment
Sludge management required
Pilot scale only
Aluminum reagent expensive, ettringite formation requires specific conditions
Barite Precipitation Barium chloride or barium hydroxide is added, then barium combines with sulfate to form barium sulfate, which is removed by settling [Ref. (33); (7)].
50 mg/L [Ref. (7)] X X Lime, barium salt
Most cost-effective if gypsum and carbonate removed first
pH adjustment
Sludge management required, barium toxic to aquatic life
Some cases in mine water treatment
Barium reagent is expensive
Co-Precipitation with Aluminum
Sulfate ions can form complexes with aluminum precipitates and be removed from solution at pH 4-5 [Ref. (35)].
400 mg/L [Ref. (35)] X -
Aluminum coagulant, acid
Secondary wastewater treatment.
pH adjustment Sludge management required
Bench-scale only Requires precise pH control and reagent dosing
Ion exchange
Conventional Ion Exchange
Example Vendor: Dow
A strong base anion exchange resin can be used to remove all anions along with sulfate and sulfite [Ref. (36)].
<100 mg/L X - Lime
Most cost-effective if gypsum removed first. Filtration to remove solids and organic matter to prevent resin fouling.
pH adjustment Regeneration waste
Common in mine water treatment and commercial/public water supply applications
Moderate complexity and cost
Sulf-IX Proprietary technology.
Vendor: BQE Water
Sulfate removal is completed in a two-stage process. Feed water passed through a series of vessels containing cation exchange resin to remove calcium and magnesium, then passed through a second set of contactors containing anion exchange resins to remove sulfate [Ref. (9)]. Resin regeneration process uses lime and sulfuric acid and generates gypsum, rather than a liquid waste.
<50 mg/L [Ref. (37)] X -
Lime, sulfuric acid
Pilot studies have shown best sulfate removal when water is treated to pH ~10.6 prior to IX [Ref. (9)] or if hardness is present primarily as calcium hardness. Filtration to remove solids and organic matter to prevent resin fouling.
pH adjustment
Regeneration waste - regeneration streams from both stages are recycled, except for precipitated gypsum. Regeneration process produces a clean gypsum product that can be used as a construction material.
Moderately commercialized for mine water treatment and commercial/ public water supply applications
Moderate complexity and cost

Large Table 1 Sulfate reduction technology details
Primary Sulfate
Removal Categories
Technology Technology description
Lowest achievable
sulfate concentration
(mg/L)
Prim
ary
Tech
nolo
gy
Con
cent
rate
M
anag
emen
t Te
chno
logy
Addi
tives
Req
uire
d
Pre-
trea
tmen
t re
quire
men
ts [1
]
Post
-tre
atm
ent
requ
irem
ents
[2]
Resi
dual
s m
anag
emen
t and
se
cond
ary
impa
cts
Deg
ree
of
com
mer
cial
izat
ion
Rela
tive
cost
/
com
plex
ity o
f op
erat
ion
Membranes
Closed-circuit Desalination Reverse Osmosis (CCD RO)
Proprietary technology. Vendor: Desalitech
Uses conventional RO membranes. Permeate is produced at a rate equal to the incoming flow rate, and when a desired (high) recovery percentage is reached, brine is throttled out of the system, displaced by feed water in a single “plug flow” sweep [Ref. (38)].
Assumed similar to conventional RO, ~99% removal
X X Unknown
Filtration to remove solids and organic matter to prevent membrane fouling, anti-scalant addition to control scale formation
Similar to conventional RO
Brine management and disposal
Moderately commercialized, industrial, agricultural and wastewater reuse and concentration management applications [Ref. (39)]
Moderate complexity and cost - generally lower operation costs than conventional RO.
Electrodialysis Reversal (EDR)
Example Vendor: GE
An electric current is used to move dissolved salt ions through layers of charged membranes [Ref. (40)].
<50 mg/L [Ref. (41)] X X Unknown
Filtration to remove solids, potential need for removal of organic matter to prevent membrane fouling.
Unknown Brine management and disposal
Highly commercialized, commercial applications in groundwater treatment, desalination, drinking water
High complexity and cost - cost typically higher than NF/RO.
Zero Discharge Desalination (ZDD)
Proprietary technology. Vendor: Veolia
Combines conventional reverse osmosis with electrodialysis metathesis (EDM) to remove salts from water a high recovery levels. EDM prevents divalent salts from precipitating while producing clean water [Ref. (42)].
~99% removal [Ref. (42)] X X
Electrode rinse (Na2SO4), sodium chloride [Ref. (42)]
pH adjustment with hydrochloric acid followed by filtration to remove solids and organic matter to prevent membrane fouling and antiscalant addition [Ref. (42)].
Similar to conventional RO
Mixed salts disposal, low waste volume
Pilot scale only
Moderate complexity and cost - anticipated lower capital and operation costs than conventional softening followed by high recovery RO or ZLD evaporation.
Membrane distillation Example Vendor:
Memsys
A separation process that is thermally-driven, in which only vapor molecules transfer through a microporous hydrophobic membrane. Membrane distillation is driven by the vapor pressure difference that results from the temperature difference across the hydrophobic membrane [Ref. (43)].
Unknown X X Unknown
Filtration to remove solids and organic matter, as well as alcohols and surfactants [Ref. (44)].
Post treatment to remove permeated volatile compounds and gases may be required. [Ref. (44)].
Brine management and disposal
Pilot scale only
Moderate complexity and cost - anticipated lower operation costs than conventional RO. Distillation can take place at temperatures as low as 70 C, and required energy

Large Table 1 Sulfate reduction technology details
Primary Sulfate
Removal Categories
Technology Technology description
Lowest achievable
sulfate concentration
(mg/L)
Prim
ary
Tech
nolo
gy
Con
cent
rate
M
anag
emen
t Te
chno
logy
Addi
tives
Req
uire
d
Pre-
trea
tmen
t re
quire
men
ts [1
]
Post
-tre
atm
ent
requ
irem
ents
[2]
Resi
dual
s m
anag
emen
t and
se
cond
ary
impa
cts
Deg
ree
of
com
mer
cial
izat
ion
Rela
tive
cost
/
com
plex
ity o
f op
erat
ion
can come from waste heat sources or alternative heat sources [Ref. (45)].
Nanofiltration (NF) Example Vendors: GE, Dow, Hydranautics,
Toray, Koch
Pressure is applied to force a solution through the membrane. The membrane allows the water to pass through but restricts some salts and other compounds. NF membranes have a larger pore size than conventional RO; monovalent ions can pass through the membrane.
~95% removal X - Unknown
Filtration to remove solids and organic matter to prevent membrane fouling, antiscalant/ chemical pre-treatment; treatments to remove organics and mitigate biofouling also required.
Degasification, stabilization, pH adjustment
Brine management and disposal
Highly commercialized
Lower complexity and cost of operation - generally slightly lower operation costs than conventional RO.
Conventional Reverse Osmosis (RO)
Example Vendors: GE, Dow, Hydranautics,
Toray, Koch
Pressure is applied to force a solution through a spiral-wound membrane. The membrane allows the water to pass through but restricts some salts and other compounds. Membranes have a smaller pore size than NF; monovalent ions are rejected by the membrane/cannot pass through.
~99% removal X - Unknown
Filtration to remove solids and organic matter to prevent membrane fouling, antiscalant/ chemical pre-treatment; treatments to remove organics and mitigate biofouling also required.
Degasification, stabilization, pH adjustment
Brine management and disposal
Highly commercialized
Lower complexity and cost of operation, when compared to other membrane technologies.
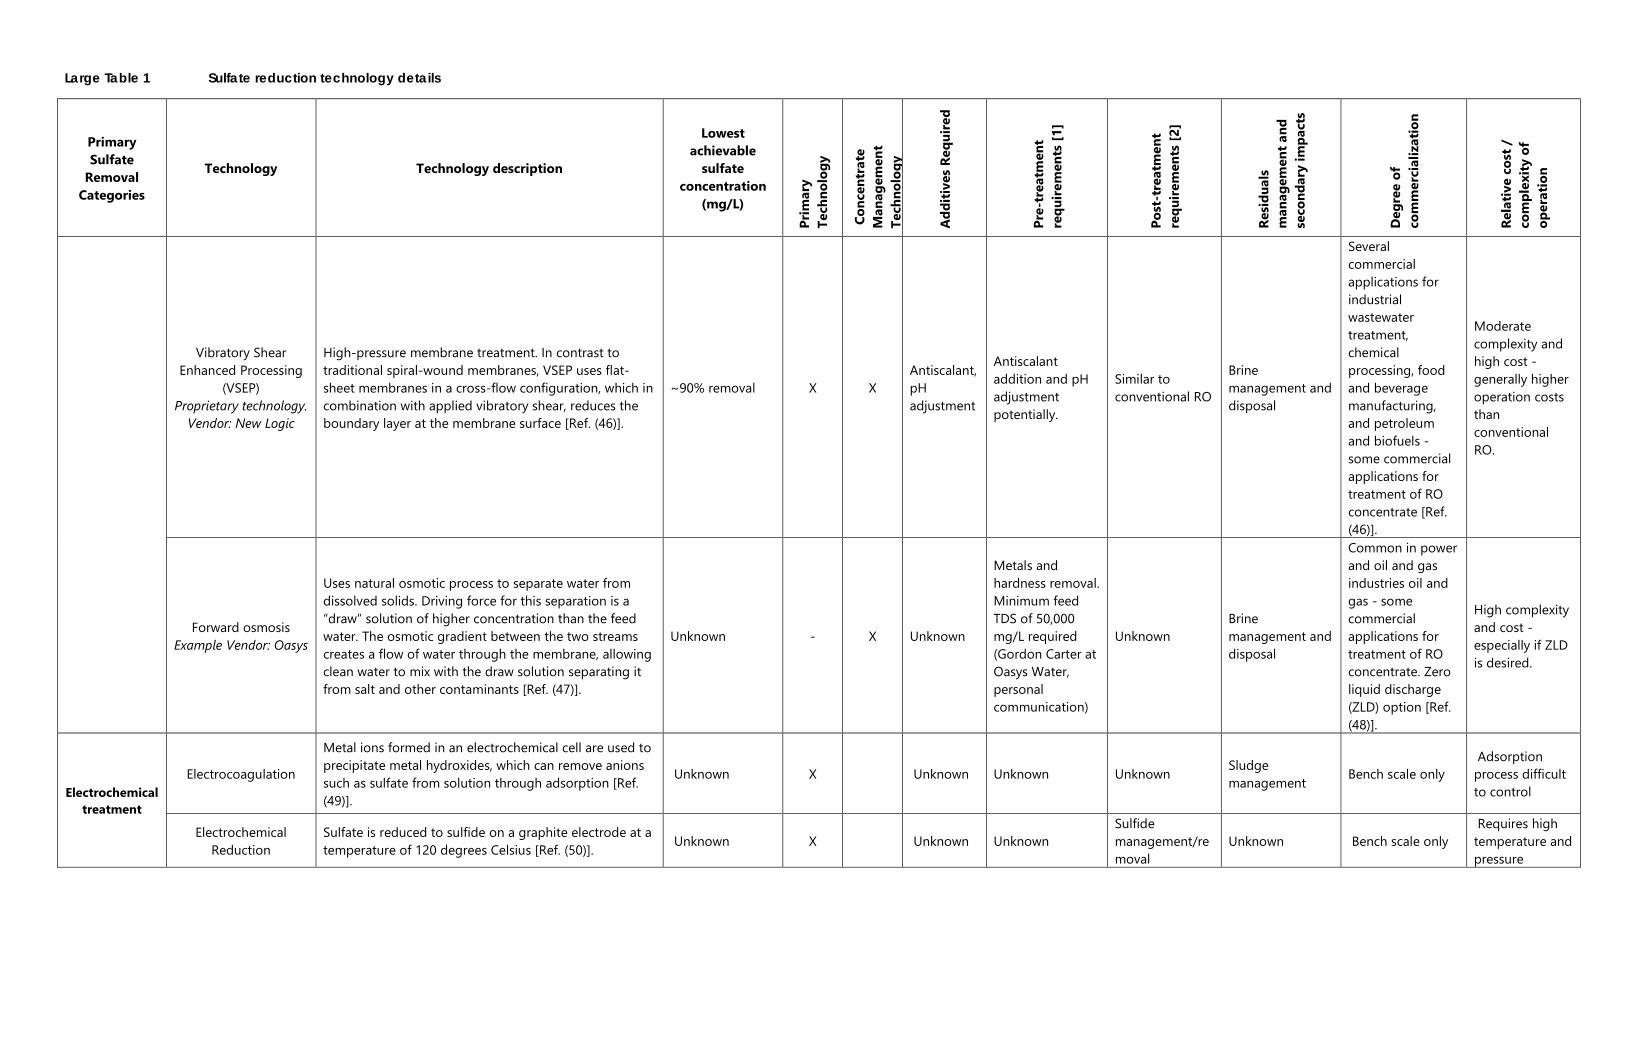
Large Table 1 Sulfate reduction technology details
Primary Sulfate
Removal Categories
Technology Technology description
Lowest achievable
sulfate concentration
(mg/L)
Prim
ary
Tech
nolo
gy
Con
cent
rate
M
anag
emen
t Te
chno
logy
Addi
tives
Req
uire
d
Pre-
trea
tmen
t re
quire
men
ts [1
]
Post
-tre
atm
ent
requ
irem
ents
[2]
Resi
dual
s m
anag
emen
t and
se
cond
ary
impa
cts
Deg
ree
of
com
mer
cial
izat
ion
Rela
tive
cost
/
com
plex
ity o
f op
erat
ion
Vibratory Shear Enhanced Processing
(VSEP) Proprietary technology.
Vendor: New Logic
High-pressure membrane treatment. In contrast to traditional spiral-wound membranes, VSEP uses flat-sheet membranes in a cross-flow configuration, which in combination with applied vibratory shear, reduces the boundary layer at the membrane surface [Ref. (46)].
~90% removal X X Antiscalant, pH adjustment
Antiscalant addition and pH adjustment potentially.
Similar to conventional RO
Brine management and disposal
Several commercial applications for industrial wastewater treatment, chemical processing, food and beverage manufacturing, and petroleum and biofuels - some commercial applications for treatment of RO concentrate [Ref. (46)].
Moderate complexity and high cost - generally higher operation costs than conventional RO.
Forward osmosis Example Vendor: Oasys
Uses natural osmotic process to separate water from dissolved solids. Driving force for this separation is a “draw” solution of higher concentration than the feed water. The osmotic gradient between the two streams creates a flow of water through the membrane, allowing clean water to mix with the draw solution separating it from salt and other contaminants [Ref. (47)].
Unknown - X Unknown
Metals and hardness removal. Minimum feed TDS of 50,000 mg/L required (Gordon Carter at Oasys Water, personal communication)
Unknown Brine management and disposal
Common in power and oil and gas industries oil and gas - some commercial applications for treatment of RO concentrate. Zero liquid discharge (ZLD) option [Ref. (48)].
High complexity and cost - especially if ZLD is desired.
Electrochemical treatment
Electrocoagulation
Metal ions formed in an electrochemical cell are used to precipitate metal hydroxides, which can remove anions such as sulfate from solution through adsorption [Ref. (49)].
Unknown X Unknown Unknown Unknown Sludge management Bench scale only
Adsorption process difficult to control
Electrochemical Reduction
Sulfate is reduced to sulfide on a graphite electrode at a temperature of 120 degrees Celsius [Ref. (50)]. Unknown X Unknown Unknown
Sulfide management/removal
Unknown Bench scale only Requires high temperature and pressure

Large Table 1 Sulfate reduction technology details
Primary Sulfate
Removal Categories
Technology Technology description
Lowest achievable
sulfate concentration
(mg/L)
Prim
ary
Tech
nolo
gy
Con
cent
rate
M
anag
emen
t Te
chno
logy
Addi
tives
Req
uire
d
Pre-
trea
tmen
t re
quire
men
ts [1
]
Post
-tre
atm
ent
requ
irem
ents
[2]
Resi
dual
s m
anag
emen
t and
se
cond
ary
impa
cts
Deg
ree
of
com
mer
cial
izat
ion
Rela
tive
cost
/
com
plex
ity o
f op
erat
ion
Biological treatment
Constructed Wetlands Bacteria present in wetland sediments reduce some sulfate to sulfide, which then removes metals from industrial wastewaters [Ref. (34)].
Minimal removal (10%) [Ref. (34)] X Carbon
source None Sulfide management/removal
Sulfide Common in mine water treatment
Low complexity and cost, but unreliable in cold weather. need to maintain conditions favorable to SRBs
Floating Wetlands
Islands consisting of floating media and wetland plants can remove some sulfate from a larger body of water. Floating wetlands are most practical in existing water bodies [Ref. (34)].
Minimal removal (10%) [Ref. (34)] X Carbon
source None Sulfide management/removal
Unknown Used in mine water treatment
Low complexity and cost, but unreliable in cold weather, and needs large surface area
Pit Lake or In-Pit Treatment
Naturally-occurring microbiological communities in pit lakes or constructed pits remove some sulfate to sulfide [Ref. (51)].
500 mg/L [Ref. (51)] X X Carbon
source None Sulfide management/removal
Unknown Used in mine water treatment
Low complexity and cost, but unreliable in cold weather
Constructed Trench Bioreactors/
Permeable Reactive Barriers
Water is routed through a soil bed trench packed with carbon substrate, which grows a biofilm to reduce some sulfate to sulfide.
500 mg/L [Ref. (51); (34)] X X Carbon
source None Sulfide management/removal
Unknown Used in mine water treatment
Low complexity and cost, but unreliable in cold weather
Suspended-Growth Reactor (Activated
Sludge Modification)
Anaerobic suspended-growth treatment, similar to an activated sludge process, could be used upstream of traditional activated sludge treatment systems, but would require a long solids retention time [Ref. (52); (53)].
200 mg/L [Ref. (53); (34)] X
Liquid carbon source
Nitrate removal if nitrate present in feed
Sulfide management/removal
Sludge management
Not used for sulfate removal
High complexity - need high SRT to maintain SRB biomass in the reactor
Membrane bioreactor Example vendor: GE
Suspended-growth treatment that uses membrane to retain biomass in the reactor.
200 mg/L [Ref. (53); (34)] X
Liquid carbon source
Nitrate removal if nitrate present in feed, solids removal
Sulfide management/removal
Sludge management
Not used for sulfate removal
Membrane fouling potential
Suspended-Growth Reactor (Sequencing
Batch Reactor)
A sequencing batch reactor (SBR) allows for more efficient biological removal by suspended bacteria in the liquid phase and lower tank volume, but requires more sophisticated operations and control that activated sludge-like operation.
10 mg/L [Ref. (54)] X
Liquid carbon source
Nitrate removal if nitrate present in feed
Sulfide management/removal
Sludge management
Not used for sulfate removal
Need high SRT to maintain SRB biomass in the reactor

Large Table 1 Sulfate reduction technology details
Primary Sulfate
Removal Categories
Technology Technology description
Lowest achievable
sulfate concentration
(mg/L)
Prim
ary
Tech
nolo
gy
Con
cent
rate
M
anag
emen
t Te
chno
logy
Addi
tives
Req
uire
d
Pre-
trea
tmen
t re
quire
men
ts [1
]
Post
-tre
atm
ent
requ
irem
ents
[2]
Resi
dual
s m
anag
emen
t and
se
cond
ary
impa
cts
Deg
ree
of
com
mer
cial
izat
ion
Rela
tive
cost
/
com
plex
ity o
f op
erat
ion
UASB Reactor with Sulfide Treatment Example Vendor:
Paques
A UASB reactor provides sufficient SRT to grow sulfate-reducers and reduce sulfate to sulfide if influent concentrations are greater than 1,000 mg/L (Shashi Gorur and Nina Kang at Paques, personal communication).
300 mg/L (Shashi Gorur and Nina Kang at Paques, personal communication).
X X Liquid carbon source
Nitrate removal if nitrate present in feed
Sulfide management/removal
Minimal sludge produced
Limited use in mine water treatment and other industries
Need to maintain conditions favorable to SRBs, difficult to only partially oxidize sulfide to sulfur
Packed Bed Bioreactor Sulfate reducing bacteria retained on synthetic or natural media in a tank, where sulfate is reduced to sulfide [Ref. (55)].
<150 mg/L [Ref. (55)] X X
Liquid carbon source
Nitrate removal if nitrate present in feed
Sulfide management/ removal
Minimal sludge produced
Limited use in mine water treatment
Moderate complexity - need to maintain conditions favorable to SRBs
Packed Bed Sulfide Reactor
Example Vendor: BQE Water (BioSulphide)
Commercial process to produce sulfide from sulfate reduction primarily designed to precipitate and recover metals from industrial wastewaters [Ref. (56)].
Unknown X X Liquid carbon source
Nitrate removal if nitrate present in feed
Sulfide management/removal
Minimal sludge produced
Limited use in mine water treatment
Moderate complexity - need to maintain conditions favorable to SRBs
Bioelectrochemical
Bioreactors with electrodes can reduce sulfate to recover sulfur as elemental sulfur or iron sulfide using electrons (Chanlun Chun at U of MN Duluth, personal communication).
Unknown X X Liquid carbon source
Nitrate removal if nitrate present in feed
Sulfide management/removal
Minimal sludge produced , Possible sulfur recovery
Bench scale only High complexity
Sulfate reduction deammonification
Using a biological metabolism similar to ANAMMOX, sulfate can be used to remove ammonia [Ref. (57)]. Unknown X X
Ammonia, if not present
Nitrate removal if nitrate present in feed
Unknown Minimal sludge produced
Theoretical only - no known bench application
High complexity - three reactors with different specific operation requirements
Liquid-phase biofilters
Biofilms growing on GAC or biochar can reduce sulfate to sulfide, which can be precipitated with metals as metal sulfides (Sebastian Behren at U of MN, personal communication).
Unknown X X Carbon source
Nitrate removal if nitrate present in feed, solids removal
Sulfide management/removal
Minimal sludge produced Bench scale only High complexity

Large Table 1 Sulfate reduction technology details
Primary Sulfate
Removal Categories
Technology Technology description
Lowest achievable
sulfate concentration
(mg/L)
Prim
ary
Tech
nolo
gy
Con
cent
rate
M
anag
emen
t Te
chno
logy
Addi
tives
Req
uire
d
Pre-
trea
tmen
t re
quire
men
ts [1
]
Post
-tre
atm
ent
requ
irem
ents
[2]
Resi
dual
s m
anag
emen
t and
se
cond
ary
impa
cts
Deg
ree
of
com
mer
cial
izat
ion
Rela
tive
cost
/
com
plex
ity o
f op
erat
ion
Sulfate reduction, autotrophic
denitrification, and nitrification integrated
process (SANI)
SANI includes removal of ammonia, nitrate, and sulfate in three separate reactors. Sulfate is reduced to sulfide, which feeds dinitrifiers in a second reactor. Ammonia is then removed in a third, aerated reactor. This system would replace activated sludge treatment and decrease sludge production [Ref. (58); (59)].
<100 mg/L (Lu, 2012) X X Unknown None Unknown Sludge
management Pilot scale only
High complexity - three reactors with different specific operation requirements
Evaporative treatment
Direct heat-contact evaporation (LM-HT
Concentrator) Example Vendor:
Heartland Technologies
The system involves the direct contact of hot gases and water/brine to evaporate water and produce a more concentrated brine or salt slurry, which is then stabilized and disposed. No heat exchangers are used, less fouling, but requires a source of hot gas for the process [Ref. (60)].
N/A - X Unknown Unknown
No high-quality distillate stream, liquids separated from solids can be returned to the evaporative section [Ref. (60)].
If evaporating all liquid, salt cake disposal, needs to pass TCLP for non-hazardous waste disposal. Otherwise, slurry stabilization/ solidification required for disposal.
Highly commercialized - several applications in oil and gas, power, industrial wastewater, landfill leachate - no specific municipal applications information [Ref. (61)].
High complexity and cost, potentially lower cost than conventional ZLD if waste heat is available.
Mechanical vapor recompression
evaporation with crystallization or spray
drying Example Vendor:
Veolia
Evaporation with crystallization includes brine concentration, where brine is heated and recirculated until about 95% is converted to high purity distillate, followed by crystallization which uses heat to reduce brine concentrate to a dry solid. Overall water recovery up to 99%. High-purity distillate suitable for reuse, discharge, or aquifer reinjection. Produces solid salt cake suitable for landfill disposal [Ref. (62)] .
Unknown, but likely given less than 10 mg/L TDS of distillate [Ref. (20)]
- X Unknown Scale and foam control Unknown
Salt cake disposal, needs to pass TCLP for non-hazardous waste disposal.
Highly commercialized - several applications in oil and gas, power, drinking water - no specific municipal applications information [Ref. (63)].
High complexity and cost
[1] Pre-treatment requirements only include those that would be needed in addition to secondary wastewater treatment, assuming that the technology would be implemented downstream of existing plant processes. [2] Post-treatment processes include only those for the treated water, and do not include brine, sludge, or sulfide management.
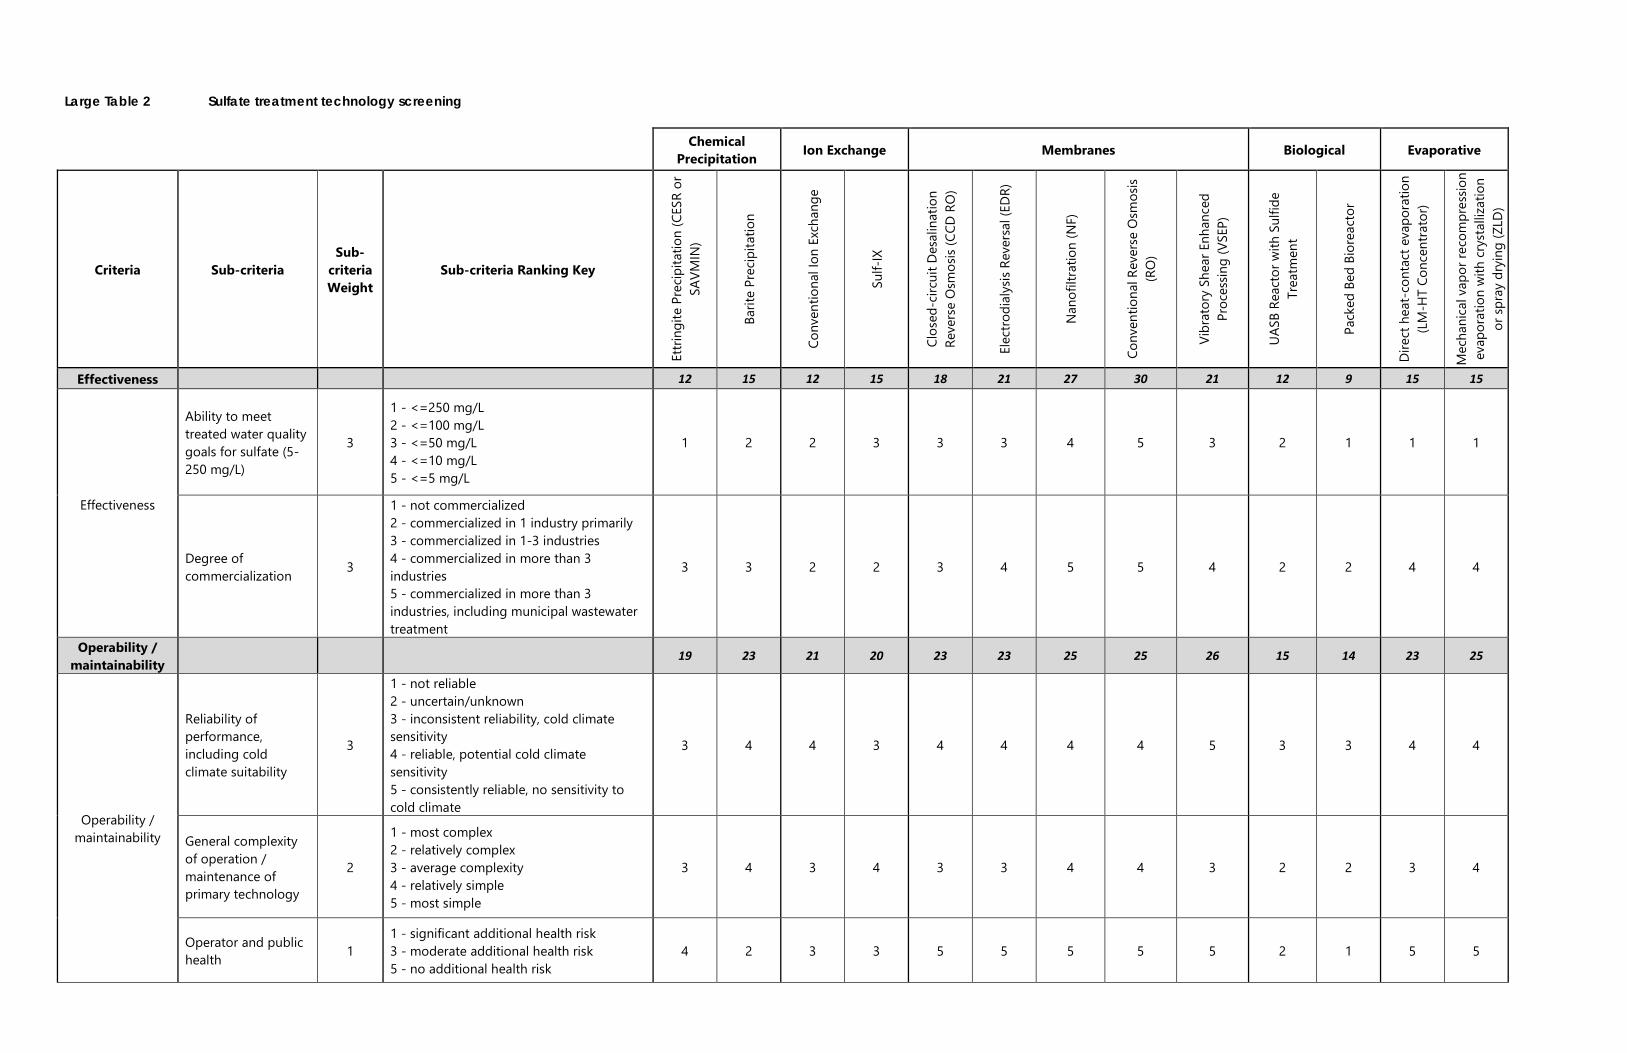
Large Table 2 Sulfate treatment technology screening
Chemical Precipitation Ion Exchange Membranes Biological Evaporative
Criteria Sub-criteria Sub-
criteria Weight
Sub-criteria Ranking Key
Ettri
ngite
Pre
cipita
tion
(CES
R or
SA
VMIN
)
Barit
e Pr
ecip
itatio
n
Conv
entio
nal I
on E
xcha
nge
Sulf-
IX
Clos
ed-c
ircui
t Des
alin
atio
n Re
vers
e O
smos
is (C
CD R
O)
Elec
trodi
alys
is Re
vers
al (E
DR)
Nan
ofilt
ratio
n (N
F)
Conv
entio
nal R
ever
se O
smos
is (R
O)
Vibr
ator
y Sh
ear E
nhan
ced
Proc
essin
g (V
SEP)
UASB
Rea
ctor
with
Sul
fide
Trea
tmen
t
Pack
ed B
ed B
iore
acto
r
Dire
ct h
eat-
cont
act e
vapo
ratio
n (L
M-H
T Co
ncen
trato
r)
Mec
hani
cal v
apor
reco
mpr
essio
n ev
apor
atio
n w
ith c
ryst
alliz
atio
n or
spra
y dr
ying
(ZLD
)
Effectiveness 12 15 12 15 18 21 27 30 21 12 9 15 15
Effectiveness
Ability to meet treated water quality goals for sulfate (5-250 mg/L)
3
1 - <=250 mg/L 2 - <=100 mg/L 3 - <=50 mg/L 4 - <=10 mg/L 5 - <=5 mg/L
1 2 2 3 3 3 4 5 3 2 1 1 1
Degree of commercialization 3
1 - not commercialized 2 - commercialized in 1 industry primarily 3 - commercialized in 1-3 industries 4 - commercialized in more than 3 industries 5 - commercialized in more than 3 industries, including municipal wastewater treatment
3 3 2 2 3 4 5 5 4 2 2 4 4
Operability / maintainability
19 23 21 20 23 23 25 25 26 15 14 23 25
Operability / maintainability
Reliability of performance, including cold climate suitability
3
1 - not reliable 2 - uncertain/unknown 3 - inconsistent reliability, cold climate sensitivity 4 - reliable, potential cold climate sensitivity 5 - consistently reliable, no sensitivity to cold climate
3 4 4 3 4 4 4 4 5 3 3 4 4
General complexity of operation / maintenance of primary technology
2
1 - most complex 2 - relatively complex 3 - average complexity 4 - relatively simple 5 - most simple
3 4 3 4 3 3 4 4 3 2 2 3 4
Operator and public health 1
1 - significant additional health risk 3 - moderate additional health risk 5 - no additional health risk
4 2 3 3 5 5 5 5 5 2 1 5 5

Large Table 2 Sulfate treatment technology screening
Chemical Precipitation Ion Exchange Membranes Biological Evaporative
Criteria Sub-criteria Sub-
criteria Weight
Sub-criteria Ranking Key
Ettri
ngite
Pre
cipita
tion
(CES
R or
SA
VMIN
)
Barit
e Pr
ecip
itatio
n
Conv
entio
nal I
on E
xcha
nge
Sulf-
IX
Clos
ed-c
ircui
t Des
alin
atio
n Re
vers
e O
smos
is (C
CD R
O)
Elec
trodi
alys
is Re
vers
al (E
DR)
Nan
ofilt
ratio
n (N
F)
Conv
entio
nal R
ever
se O
smos
is (R
O)
Vibr
ator
y Sh
ear E
nhan
ced
Proc
essin
g (V
SEP)
UASB
Rea
ctor
with
Sul
fide
Trea
tmen
t
Pack
ed B
ed B
iore
acto
r
Dire
ct h
eat-
cont
act e
vapo
ratio
n (L
M-H
T Co
ncen
trato
r)
Mec
hani
cal v
apor
reco
mpr
essio
n ev
apor
atio
n w
ith c
ryst
alliz
atio
n or
spra
y dr
ying
(ZLD
)
Relative costs 18 16 15 13 14 12 14 14 7 15 15 5 5
Relative costs
Capital costs for primary technology 3
1 - high relative capital cost 3 - average relative capital cost 5 - low relative capital cost
4 4 3 3 2 2 2 2 1 3 3 1 1
O&M costs for primary technology 2
1 - high relative O&M cost 3 - average relative O&M cost 5 - low relative O&M cost
3 2 3 2 4 3 4 4 2 3 3 1 1
Degree / complexity of pre-treatment
and post-treatment
17 17 19 15 13 13 13 13 17 16 19 22 16
Degree / complexity of pre-treatment
and post-treatment
Influent pre-treatment complexity/cost
2
1 - complex, energy-intensive 2 - complex, average relative energy requirements 3 - average complexity and relative energy requirements 4 - simple, average relative energy requirements 5 - simple, low relative energy requirements
3 3 3 2 2 2 2 2 4 4 4 5 4
Effluent post-treatment complexity/cost
2
1 - complex, energy-intensive 2 - complex, average relative energy requirements 3 - average complexity and relative energy requirements 4 - simple, average relative energy requirements 5 - simple, low relative energy requirements
4 4 5 3 3 3 3 3 3 3 4 5 3

Large Table 2 Sulfate treatment technology screening
Chemical Precipitation Ion Exchange Membranes Biological Evaporative
Criteria Sub-criteria Sub-
criteria Weight
Sub-criteria Ranking Key
Ettri
ngite
Pre
cipita
tion
(CES
R or
SA
VMIN
)
Barit
e Pr
ecip
itatio
n
Conv
entio
nal I
on E
xcha
nge
Sulf-
IX
Clos
ed-c
ircui
t Des
alin
atio
n Re
vers
e O
smos
is (C
CD R
O)
Elec
trodi
alys
is Re
vers
al (E
DR)
Nan
ofilt
ratio
n (N
F)
Conv
entio
nal R
ever
se O
smos
is (R
O)
Vibr
ator
y Sh
ear E
nhan
ced
Proc
essin
g (V
SEP)
UASB
Rea
ctor
with
Sul
fide
Trea
tmen
t
Pack
ed B
ed B
iore
acto
r
Dire
ct h
eat-
cont
act e
vapo
ratio
n (L
M-H
T Co
ncen
trato
r)
Mec
hani
cal v
apor
reco
mpr
essio
n ev
apor
atio
n w
ith c
ryst
alliz
atio
n or
spra
y dr
ying
(ZLD
)
Beneficial reuse of residuals and treated water
1
1 - no beneficial reuse 2 - uncertain/unknown 3 - likely no beneficial reuse 4 - likely beneficial reuse 5 - established beneficial reuse
3 3 3 5 3 3 3 3 3 2 3 2 2
Residuals management
15 10 7 17 7 7 7 7 7 16 13 8 8
Residuals management
Residuals management complexity/cost
3
1 - complex, energy-intensive 2 - complex, average relative energy requirements 3 - average complexity and relative energy requirements 4 - simple, average relative energy requirements 5 - simple, low relative energy requirements
4 2 1 4 1 1 1 1 1 4 3 2 2
Residuals stability 1
1 - unstable 2 - uncertain/unknown 3 - potentially unstable 4 - likely stable 5 - stable
3 4 4 5 4 4 4 4 4 4 4 2 2
Total Score 81 81 74 80 75 76 86 89 78 74 70 73 69

Large Table 3 Concentrate management technologies
Management Type Status Management Category Technology Description Advantages Disadvantages Sources
Volume Reduction Technologies
Conventional/ currently in use
Electric Potential Driven
Technology
Electrodialysis (ED), electrodialysis reversal (EDR)
Uses an electric current to move dissolved salt ions through layers of charged membranes.
Less energy intensive than thermal evaporation, effective for high influent silica content.
Limited effectiveness with high calcium sulfate saturation resulting in precipitation on membrane surface.
[Ref. (64)] [Ref. (21)]
Pressure Driven Technologies
High-Efficiency Reverse Osmosis (HERO)
Process combines a two-phase RO process with chemical pre-treatment of primary RO feed, intermediate IX treatment of primary RO concentrate, and high pH operation of a secondary RO. The secondary RO step operates at high efficiency due to IX pre-treatment and operations at a high pH.
Results in higher recovery/less concentrate volume than traditional RO systems, relatively small footprint.
High capital and O&M costs, complex process control system, produces two concentrated waste streams.
[Ref. (20)]
Vibratory Shear-Enhanced Processing (VSEP)
High-pressure membrane treatment that uses flat-sheet membranes in a cross-flow configuration, which reduces the boundary layer at the membrane surface, which in combination with applied vibratory shear, reduces the boundary layer at the membrane surface.
High recovery rates, production of high-quality permeate, potentially no pre-treatment required.
No municipal wastewater treatment applications, frequent clean-in-place (CIP) required, higher capital and O&M costs than traditional RO, proprietary technology from a single vendor.
[Ref. (20)]
Under development
Advanced Technologies
Forward osmosis (FO)
Osmotic process that uses a semi-permeable membrane to separate salts from water using an osmotic pressure gradient instead of hydraulic pressure to create a driving force to push water through the membrane.
Lower energy requirement than RO, high energy efficiency.
Draw solute requirement to create an effective drawing force needs to be added continuously, economic feasibility has not been demonstrated, emerging technology.
[Ref. (64)] [Ref. (21)]
Membrane distillation with crystallization (MDC)
Concentrates salts up to supersaturated state which allows crystallization.
High contact area provided by hollow fiber membranes allows reliable evaporation flux at moderate temperatures, comparatively lower energy consumptions compared to evaporation/ crystallization, no applied pressure.
Not yet commercially available at industrial scale.
[Ref. (64)] [Ref. (21)]
Eutectic freeze crystallization
Based on achieving the eutectic temperature as a means to separate aqueous solutions into pure water and solid salts.
Energy required to separate the water as ice is significantly lower than that required to separate it by evaporation, simultaneous production of pure ice and pure salts, significant cost savings over evaporation/crystallization, no applied pressure.
High initial investment, complex operation, emerging technology.
[Ref. (64)] [Ref. (21)]

Large Table 3 Concentrate management technologies
Management Type Status Management Category Technology Description Advantages Disadvantages Sources
Pressure Driven Technologies
Advanced Reject Recovery of Water (ARROW)
High-recovery, advanced membrane system that couples softening process with RO to increase water recovery.
High-quality product water, high water recovery, compact/small footprint system.
Process still under development, high pre-treatment costs associated with softening, complex operation.
[Ref. (20)]
Slurry Precipitation and Reverse Osmosis (SPARRO)
Involves circulating a slurry of seed crystals within the RO system, which serve as preferential growth sites for calcium sulfate and other calcium salts and silicates.
Lower energy requirement than thermal processes, less pre-treatment needs compared to other hybrid technologies.
Limited to use of membrane configurations such as tubular membrane systems that do not plug to allow the continued circulation of slurry, large footprint, complex operation, process still under development with no full-scale applications.
[Ref. (20)]
Zero Liquid Discharge
Conventional/ currently in use
Thermal Technology
Evaporation/ Crystallization/Spray Drying
Evaporators are mechanical systems that minimize membrane concentrate through a combination of thermal evaporation and increased surface area, and crystallizers use thermal energy to separate dissolved salts from the water.
Proven technology for concentrate volume reduction, small site footprint, most organic and inorganic constituents removed resulting in a high-quality produced water.
High capital and O&M costs, potential noise issues/sound enclosures needed, aesthetic issues, not feasible for projects with specific height limitations.
[Ref. (20)]
Under development
Evaporation Ponds Solar evaporation Shallow, lined pond where water evaporates naturally by using solar
energy.
Easy to construct, little operation attention required, no mechanical equipment.
Requires large land areas, especially in areas with low evaporation rates, such as Minnesota, evaporated water not recovered.
[Ref. (64)]
Technology Combinations ZLD
RO tandem (two stages of RO) with intermediate treatment, followed by post-treatment of superconcentrates. Additional combinations: 1) RO - IX - RO 2) RO - precipitation - RO 3) RO - wind-aided intensified evaporation (WAIV) RO - membrane crystallizer - precipitation 4) RO - ED/EDR 5) RO - lime-soda ash treatment - RO - evaporation 6) RO - intermediate treatment - RO - brine concentrator + pond
High recovery, successful demonstrations with a number of combinations.
Zero discharge goal not necessarily or consistently accomplished, antifouling and antiscalant compounds used in RO pre-treatment have negative effects in the post-treatment of concentrates, technology combinations may end up being as costly as evaporation/ crystallization.
[Ref. (64)]
Analyzing Alternatives for Sulfate Treatment in
Municipal Wastewater
Part 2: Cost Analysis for Implementation of Sulfate Removal
Technology at Full Scale Wastewater Treatment Facilities
Prepared for
Minnesota Pollution Control Agency
May 1, 2018
H:\MNPCA_ST_MN\M21113135\3_Design\C_Reports\Final Draft\Part 2.docx
i
Certifications
I hereby certify that this plan, specification, or report was prepared by me or under my direct
supervision and that I am a duly Licensed Professional Engineer under the laws of the State of
Minnesota.
Responsible for Part 2 of this Report.
Herman A. Dharmarajah
PE #: 18256
Date: May 1, 2018
I hereby certify that this plan, specification, or report was prepared by me or under my direct
supervision and that I am a duly Licensed Professional Engineer under the laws of the State of
Minnesota.
Responsible for Part 2 of this Report.
Adrian T. Hanson
PE #: 16540
Date: May 1, 2018
ii
Acknowledgements
The Project Team would like to acknowledge and thank the following individuals for their technical input
and feedback, and for sharing their perspectives during the study:
Andy Bradshaw – City of Moorhead, MN and Minnesota Environmental Science & Economic
Review Board (MESERB)
Al Parrella – Western Lake Superior Sanitary District (WLSSD)
Scott Kyser – MPCA
Bruce Henningsgaard – MPCA
Abram Peterson – MPCA
Brian Schweiss – MPCA

iii
Analyzing Alternatives for Sulfate Municipal Wastewater Treatment
Part 2: Cost Analysis for Implementation of Sulfate Removal
Technology at Full Scale Wastewater Treatment Facilities
May 1, 2018
Contents
Certifications............................................................................................................................................................................................ i
Acknowledgements ............................................................................................................................................................................. ii
Abstract .................................................................................................................................................................................................... 1
Executive Summary .............................................................................................................................................................................. 3
1.0 Background ............................................................................................................................................................................ 9
1.1 Introduction ...................................................................................................................................................................... 9
1.2 Technology Summary from Volume 1 ................................................................................................................... 9
1.2.1 Overall Ranking Method Summary ..................................................................................................................10
1.2.2 Technology Evaluation Table ..............................................................................................................................11
1.2.3 Top Ranked Technologies for Further Analysis ...........................................................................................12
1.3 Chemistry .........................................................................................................................................................................13
1.3.1 Minnesota Ground Water (GW) and Surface Water (SW) Sulfate Levels ..........................................13
1.3.2 Minnesota Municipal Wastewater Effluent Sulfate Levels.......................................................................15
1.3.3 Synthetic Water Used in this Study ..................................................................................................................16
1.4 Range of Flow ................................................................................................................................................................16
1.4.1 Minnesota Wastewater Treatment Plant Flows ...........................................................................................17
1.4.2 Wastewater Flows Used in this Study ..............................................................................................................17
1.4.3 Wastewater Flows Associated with Specific Water Chemistry ..............................................................18
1.5 Secondary Contaminants of Interest.....................................................................................................................18
2.0 Overview of Technologies and Flows ........................................................................................................................19
2.1 Treatment Matrix ..........................................................................................................................................................19
2.1.1 Flows and Sulfate Levels .......................................................................................................................................20
2.1.2 NPDES Limits for Biological Treatment...........................................................................................................20
2.2 Design Tools ...................................................................................................................................................................22
2.2.1 Hydromantis CapdetWorks .................................................................................................................................22
iv
2.2.2 EnviroSim BioWin ....................................................................................................................................................22
2.2.3 MPCA Reliability for Mechanical Wastewater Treatment Facilities .....................................................23
2.3 Membrane Treatment .................................................................................................................................................23
2.3.1 Overview of Reverse Osmosis/Nanofiltration Technology .....................................................................23
2.3.2 Equalization/UF Pretreatment /RO Treatment and Concentrate Management .............................26
2.3.3 Post-Membrane Permeate Treatment ............................................................................................................29
2.3.4 Concentrate Minimization ...................................................................................................................................30
2.4 Concentrate (Reject) Management ........................................................................................................................34
2.4.1 Evaporation/Concentration .................................................................................................................................34
2.4.1.1 Theory and Process Variability .................................................................................................................34
2.4.1.2 Limitations ........................................................................................................................................................36
2.4.2 Crystallization ............................................................................................................................................................36
2.4.2.1 Theory and Process Variability .................................................................................................................36
2.4.2.2 Limitations ........................................................................................................................................................37
2.4.3 Costs (Capital and O&M) .....................................................................................................................................38
2.5 Cost Estimation Planning Level and Sources .....................................................................................................38
3.0 Case Study 1 ........................................................................................................................................................................41
3.1 10 MGD Activated Sludge Treatment Facility ...................................................................................................41
3.2 Biological Pretreatment Costs .................................................................................................................................43
3.3 Membrane Treatment Costs .....................................................................................................................................43
3.4 Concentrate Minimization & Elimination Costs ...............................................................................................44
4.0 Case Study 2 ........................................................................................................................................................................45
4.1 2.5 MGD Fixed Film Treatment Facility.................................................................................................................45
4.2 Biological Pretreatment Costs .................................................................................................................................47
4.3 Membrane Treatment Costs .....................................................................................................................................47
4.4 Concentrate Minimization & Elimination Costs ...............................................................................................47
5.0 Case Study 3 ........................................................................................................................................................................49
5.1 2.5 MGD Activated Sludge Treatment Facility...................................................................................................49
5.2 Biological Pretreatment Costs .................................................................................................................................51
5.3 Membrane Treatment Costs .....................................................................................................................................51
5.4 Concentrate Minimization & Elimination Costs ...............................................................................................52
6.0 Case Study 4 ........................................................................................................................................................................53
6.1 0.5 MGD Activated Sludge Treatment Facility...................................................................................................53
6.2 Biological Pretreatment Costs .................................................................................................................................55
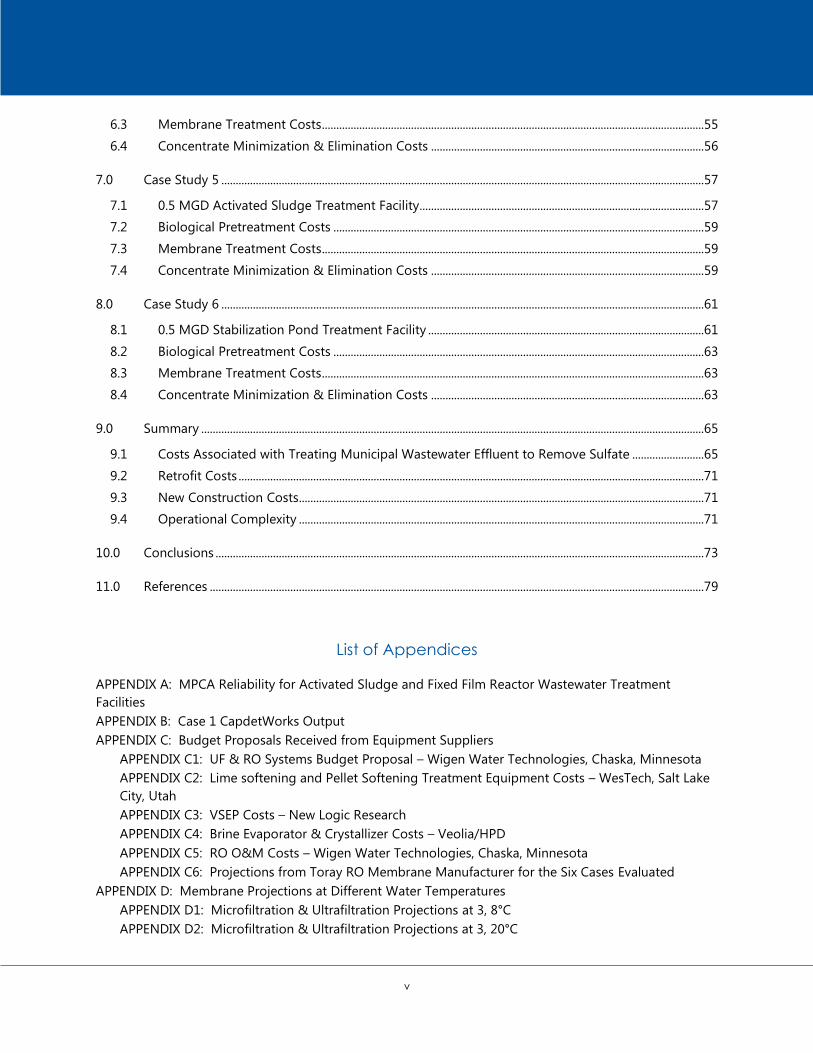
v
6.3 Membrane Treatment Costs .....................................................................................................................................55
6.4 Concentrate Minimization & Elimination Costs ...............................................................................................56
7.0 Case Study 5 ........................................................................................................................................................................57
7.1 0.5 MGD Activated Sludge Treatment Facility...................................................................................................57
7.2 Biological Pretreatment Costs .................................................................................................................................59
7.3 Membrane Treatment Costs .....................................................................................................................................59
7.4 Concentrate Minimization & Elimination Costs ...............................................................................................59
8.0 Case Study 6 ........................................................................................................................................................................61
8.1 0.5 MGD Stabilization Pond Treatment Facility ................................................................................................61
8.2 Biological Pretreatment Costs .................................................................................................................................63
8.3 Membrane Treatment Costs .....................................................................................................................................63
8.4 Concentrate Minimization & Elimination Costs ...............................................................................................63
9.0 Summary ...............................................................................................................................................................................65
9.1 Costs Associated with Treating Municipal Wastewater Effluent to Remove Sulfate .........................65
9.2 Retrofit Costs ..................................................................................................................................................................71
9.3 New Construction Costs .............................................................................................................................................71
9.4 Operational Complexity .............................................................................................................................................71
10.0 Conclusions ..........................................................................................................................................................................73
11.0 References ............................................................................................................................................................................79
List of Appendices
APPENDIX A: MPCA Reliability for Activated Sludge and Fixed Film Reactor Wastewater Treatment
Facilities
APPENDIX B: Case 1 CapdetWorks Output
APPENDIX C: Budget Proposals Received from Equipment Suppliers
APPENDIX C1: UF & RO Systems Budget Proposal – Wigen Water Technologies, Chaska, Minnesota
APPENDIX C2: Lime softening and Pellet Softening Treatment Equipment Costs – WesTech, Salt Lake
City, Utah
APPENDIX C3: VSEP Costs – New Logic Research
APPENDIX C4: Brine Evaporator & Crystallizer Costs – Veolia/HPD
APPENDIX C5: RO O&M Costs – Wigen Water Technologies, Chaska, Minnesota
APPENDIX C6: Projections from Toray RO Membrane Manufacturer for the Six Cases Evaluated
APPENDIX D: Membrane Projections at Different Water Temperatures
APPENDIX D1: Microfiltration & Ultrafiltration Projections at 3, 8°C
APPENDIX D2: Microfiltration & Ultrafiltration Projections at 3, 20°C

vi
List of Tables
(embedded)
Table ES-1 Analysis cases for cost evaluations in Activity 2 ............................................................................................ 2
Table ES-2 Standardized water chemistry profiles for various initial sulfate concentrations ............................ 3
Table ES-3 Details of six case studies and the percentage to be treated by RO system .................................... 3
Table ES-4 NPDES biological treatment parameters ......................................................................................................... 4
Table ES-5 Required BNR nitrate and phosphorus removal with vs. without RO treatment ............................. 4
Table ES-6 Mercury removal by reverse osmosis filtration ............................................................................................ 5
Table ES-7 Estimated RO concentrate flow .......................................................................................................................... 5
Table ES-8 Estimated costs for biological treatment costs for liquid treatment and biosolids ...................... 6
Table ES-9 Estimated costs for sulfate removal by RO membrane treatment process and concentrate
management .............................................................................................................................................................. 6
Table ES-10 Summary of the total capital costs, O&M costs and a 20-year present cost for all six case
studies ............................................................................................................................................................................ 7
Table 1-1 Ranking of successful technologies for sulfate removal......................................................................... 13
Table 1-2 Standardized water chemistry profiles for various initial sulfate concentrations ......................... 16
Table 1-3 Intent of the treatment matrix for the evaluation ..................................................................................... 18
Table 2-1 Details of six case studies .................................................................................................................................... 19
Table 2-2 NPDES biological treatment parameters ...................................................................................................... 21
Table 2-3 Required BNR nitrate removal with vs. without RO treatment ............................................................ 22
Table 2-4 Typical pore sizes and feed pressures for membrane technologies .................................................. 24
Table 2-5 Projected sulfate removal by NF membrane treatment ......................................................................... 24
Table 2-6 Summary of sulfate removal by RO treatment process for the six case studies ........................... 26
Table 2-7 RO/NF flux rates based on pretreatment ..................................................................................................... 27
Table 2-8 Energy use for various membrane and thermal evaporation processes .......................................... 30
Table 2-9 Salinity at which osmotic force reaches 54 atmospheres ...................................................................... 30
Table 2-10 Calculated concentrate flows from the sulfate removal RO processes for the six cases
comparison ............................................................................................................................................................... 31
Table 2-11 Projected concentrator and crystallizer costs ............................................................................................. 31
Table 2-12 Conventional ZLD capital and O&M costs (1-MGD facility) [1] ............................................................. 38
Table 2-13 Cost estimating classes [1] .................................................................................................................................... 38
Table 2-14 Standard capital cost breakdown .................................................................................................................... 39
Table 3-1 Case 1 Preliminary and biological treatment costs ................................................................................... 43
Table 3-2 Case 1 Reverse osmosis treatment costs ...................................................................................................... 43
Table 3-3 Case 1 Concentrate minimization and evaporator/crystallizer costs................................................. 44
Table 4-1 Case 2 Preliminary and biological treatment costs ................................................................................... 47
Table 4-2 Case 2 Reverse osmosis treatment costs ...................................................................................................... 47
Table 4-3 Case 2 Concentrate minimization and evaporator/crystallizer costs................................................. 47
Table 5-1 Case 3 Preliminary and biological treatment costs ................................................................................... 51
Table 5-2 Case 3 Reverse osmosis treatment costs ...................................................................................................... 51

vii
Table 5-3 Case 3 Concentrate minimization and evaporator/crystallizer costs................................................. 52
Table 6-1 Case 4 Preliminary and biological treatment costs ................................................................................... 55
Table 6-2 Case 4 Reverse osmosis treatment costs ...................................................................................................... 55
Table 6-3 Case 4 Concentrate minimization and evaporator/crystallizer costs................................................. 56
Table 7-1 Case 5 Preliminary and biological treatment costs ................................................................................... 59
Table 7-2 Case 5 Reverse osmosis treatment costs ...................................................................................................... 59
Table 7-3 Case 5 Concentrate minimization and evaporator/crystallizer costs................................................. 59
Table 8-1 Case 6 Preliminary and biological treatment costs ................................................................................... 63
Table 8-2 Case 6 Reverse osmosis treatment costs ...................................................................................................... 63
Table 8-3 Case 6 Concentrate minimization and evaporator/crystallizer costs................................................. 63
Table 9-1 Cost summary table .............................................................................................................................................. 67
Table 10-1 Details of six case studies .................................................................................................................................... 73
Table 10-2 Estimated RO concentrate flow ........................................................................................................................ 73
Table 10-3 Estimated costs for biological treatment costs for liquid treatment and biosolids ..................... 74
Table 10-4 Estimated costs for sulfate removal by ro membrane treatment process and concentrate
management ............................................................................................................................................................ 74
Table 10-5 Costs for Sulfate Removal at 200,000 GPD Facility ................................................................................... 75
Table 10-6 Summary of the total capital costs, O&M costs and a 20-year present cost for all six case
studies ......................................................................................................................................................................... 76
List of Figures
Figure 1-1 31 Treatment Technologies Evaluated During Activity 1 ....................................................................... 11
Figure 1-2 Minnesota Ground Water (left image) and Surface Water Sulfate Levels (right image) ........... 14
Figure 1-3 Average Sulfate Concentrations for Selected Minnesota Municipal Wastewater Treatment
Plant Discharges ..................................................................................................................................................... 15
Figure 1-4 Ranking of Treatment Plants with Continuous Discharge and Controlled Discharge at a Given
Flow Rate ................................................................................................................................................................... 17
Figure 2-1 Functioning RO Membrane ................................................................................................................................ 25
Figure 2-2 VSEP® Membrane Comparison ......................................................................................................................... 25
Figure 2-3 Concentrate Evaporator Rated for 250 gpm at a Facility in Chandler, Arizona ............................. 32
Figure 2-4 Mechanical Vapor Recompression Brine Concentrator (image courtesy of GE) ........................... 34
Figure 2-5 Submerged Combustion Evaporator (image courtesy of EvapoDry) ................................................ 35
Figure 2-6 Steam-Driven Crystallizer (image courtesy of Prodromos Technologies) ....................................... 37
Figure 10-1 Case 1 Concentrate Minimization Lifetime Cost Comparison .............................................................. 75
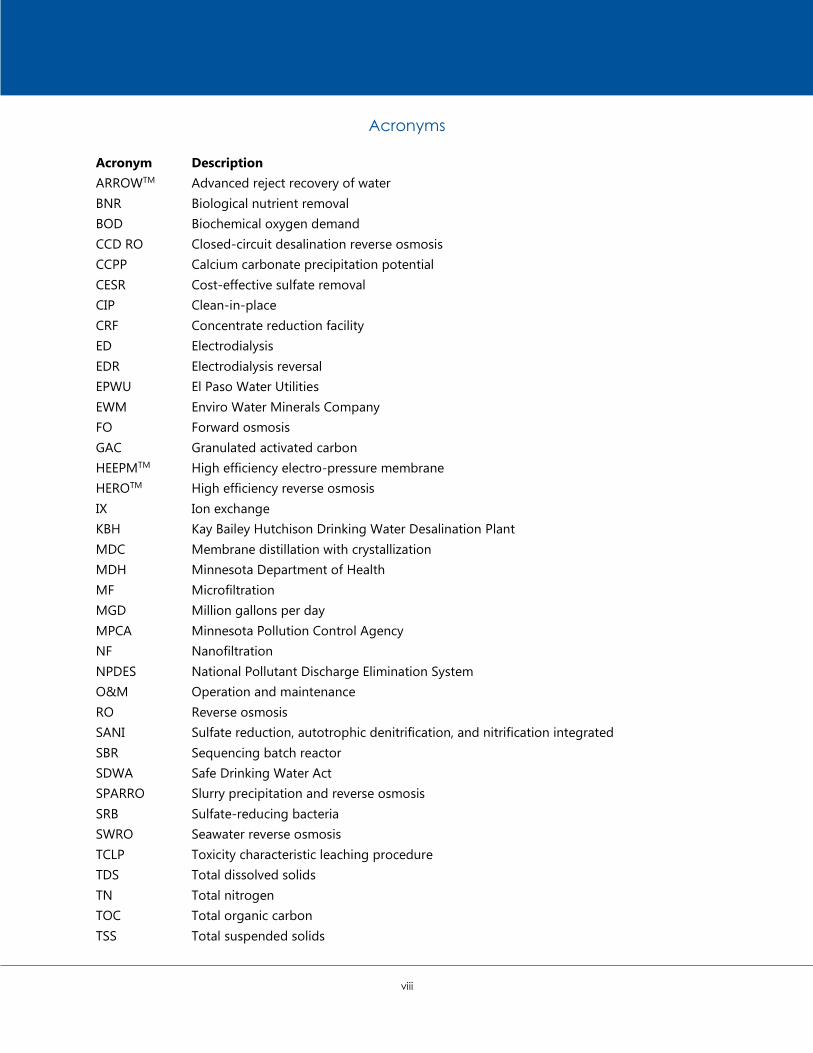
viii
Acronyms
Acronym Description
ARROWTM Advanced reject recovery of water
BNR Biological nutrient removal
BOD Biochemical oxygen demand
CCD RO Closed-circuit desalination reverse osmosis
CCPP Calcium carbonate precipitation potential
CESR Cost-effective sulfate removal
CIP Clean-in-place
CRF Concentrate reduction facility
ED Electrodialysis
EDR Electrodialysis reversal
EPWU El Paso Water Utilities
EWM Enviro Water Minerals Company
FO Forward osmosis
GAC Granulated activated carbon
HEEPMTM High efficiency electro-pressure membrane
HEROTM High efficiency reverse osmosis
IX Ion exchange
KBH Kay Bailey Hutchison Drinking Water Desalination Plant
MDC Membrane distillation with crystallization
MDH Minnesota Department of Health
MF Microfiltration
MGD Million gallons per day
MPCA Minnesota Pollution Control Agency
NF Nanofiltration
NPDES National Pollutant Discharge Elimination System
O&M Operation and maintenance
RO Reverse osmosis
SANI Sulfate reduction, autotrophic denitrification, and nitrification integrated
SBR Sequencing batch reactor
SDWA Safe Drinking Water Act
SPARRO Slurry precipitation and reverse osmosis
SRB Sulfate-reducing bacteria
SWRO Seawater reverse osmosis
TCLP Toxicity characteristic leaching procedure
TDS Total dissolved solids
TN Total nitrogen
TOC Total organic carbon
TSS Total suspended solids

ix
U of MN University of Minnesota
UF Ultrafiltration
UIC Underground Injection Control
USBR United States Bureau of Reclamation
UASB Upflow anaerobic sludge blanket
USEPA United States Environmental Protection Agency
VSEPTM Vibratory shear enhanced processing
WET Whole effluent toxicity
WWTP Wastewater treatment plant
ZDD Zero discharge desalination
ZLD Zero-liquid discharge

x
Page intentionally left blank

H:\MNPCA_ST_MN\M21113135\3_Design\C_Reports\Final Draft\Part 2.docx
1
Abstract
The current revision of the State of Minnesota’s surface water quality standard for sulfate may result in
some municipal wastewater treatment plants having to treat for sulfate in their discharge. This report
addressed sulfate treatment in municipal wastewater treatment facilities in two integrated reports; the first
activity identified and evaluated 31 technologies for removal of sulfate from municipal wastewater and
the second activity takes the top two technologies reviewed, Reverse Osmosis (RO) and Nano Filtration
(NF) and addresses implementation requirements and costs of those treatments. The sulfate treatment
evaluation criteria used to select membrane treatment (RO & NF) as the best technology available were:
effectiveness, operability/maintainability, cost, complexity of pre and post treatment, and residual
management. Using membrane treatment to treat sulfate, six hypothetical new wastewater treatment
scenarios were developed across a range of treatment plant sizes and sulfate treatment goals in order to
address costs and implementation concerns for the range of wastewater plants found in Minnesota. There
is also a discussion regarding the retrofit existing treatment plants to treat sulfate. The case studies
include: biological wastewater treatment plant costs, membrane treatment costs, concentrate
management costs, and if required, intermediate water treatment with a second stage of membrane
treatment for concentrate minimization. The membrane treatment costs include the cost of pretreatment,
which includes flow equalization and particle removal, such as rapid sand filtration or ultrafiltration (UF).
The main driver of sulfate treatment costs and complexity was treating membrane concentrate using
evaporation and crystallization. Sulfate treatment using RO membranes and evaporation with
crystallization was found to be both extremely expensive and very complex and difficult to operate.
Evaporation and crystallizer capital costs were found to be least $30 million per 1 Million Gallon per Day
(MGD) of treatment with annual operation and maintenance costs of at least $9.4 million per 1 MGD.
Operating an evaporator and crystallizer system is not only expensive but is also labor intensive, would
require a totally new operator skillset, would increase waste disposal costs, and would be very energy
intensive. Design engineers should make every effort to minimize the volume of RO concentrate produced
during sulfate treatment in order to minimize overall treatment costs. Further research and development
into cost-effective means for managing the waste concentrate generated using membranes is needed.

2
Page intentionally left blank

3
Executive Summary
Activity I using a screening process and a ranking system ranked the available sulfate removal
technologies for use in a publicly operated treatment works (POTW). Activity II used the two top ranked
technologies and developed capital and operating and maintenance (O&M) costs for POTW’s ranging in
flows from 0.5 to 10 MGD. The two ranked treatment processes are Reverse Osmosis (RO) and Nano
Filtration (NF) membrane processes.
Table ES-1 shows the various flow rates and biological treatment processes considered for evaluation.
Table ES-1 Analysis cases for cost evaluations in Activity 2
Case
Number
Flow
(MGD)
Type Biological
Treatment Common Name for Treatment
1 10 Suspended Growth Activated Sludge BNR
2 2.5 Fixed Film Biotower / Trickling Filter
3 2.5 Suspended Growth Activated Sludge BNR
4 & 5 0.5 Suspended Growth Activated Sludge BNR
6 0.5 Suspended Growth Controlled Discharge Facultative Pond
Although the Activity I ranked RO and NF as the two top ranked treatment process, Activity II used only
RO treatment for developing the detailed costs for the six different case studies. The reasons for not
considering NF membrane process for detailed evaluation were based on discussions with membrane
manufacturers Dow Chemical and Toray membranes. Both these membrane manufacturers stated that the
sulfate rejection by NF membrane is dependent on the monovalent ions present in the feed water, and
computer projection is only an estimate and has to be verified by pilot studies. Original equipment
manufacturer (OEM) of membrane skid Wigen Water Technologies, Chaska, Minnesota, stated that there
is no significant capital cost difference between skids using NF and RO membranes. The NF membranes
costs are about 15 percent higher than RO membrane costs and this cost difference offsets the savings
with a slightly lower-cost feed pump for NF skid.
The hypothetical water quality characteristics for influent with various sulfate levels are presented in
Table ES-2.

4
Table ES-2 Standardized water chemistry profiles for various initial sulfate concentrations
Initial Sulfate in WWTP Effluent
Parameter Unit 25 mg/L 100 mg/L 250 mg/L 500 mg/L
Calcium mg/L 50 100 150 250
Magnesium mg/L 15 50 75 125
Sodium mg/L 45 200 300 400
Potassium mg/L 6.5 15 27 27
Chloride mg/L 136 393 502 687
Alkalinity mg/L as CaCO3 120 300 400 520
Sulfate mg/L as SO4 25 100 250 500
Phosphorus mg/L 14 14 14 14
Ammonia mg/L as N 30 30 30 30
Organic Nitrogen mg/L as N 10 10 10 10
CBOD5 mg/L 200 200 200 200
TSS mg/L 200 200 200 200
pH 7.3 7.5 7.9 7.55
TDS mg/L 398 1158 1754 2637
Table ES-3 presents the details of the six case studies with percentage of water that has to be treated to
meet the required sulfate effluent level.
Table ES-3 Details of six case studies and the percentage to be treated by RO system
Case 1 Case 2 Case 3 Case 4 Case 5 Case 6
Biological Treatment Technology
Activated Sludge
Trickling Filter
Activated Sludge
Activated Sludge
Activated Sludge
Facultative Pond
Design Flow (MGD) 10 2.5 2.5 0.5 0.5 0.5
Sulfate Influent (mg/L) 100 25 600 300 300 600
Required Sulfate Effluent (mg/L)
10 10 100 10 100 250
Percent of Flow Treated by RO System
93% 63% 89% 99% 74% 68%
Depending on the influent and the required effluent level for sulfate, the percentage that had to be
treated by the RO membrane system ranged from 60 to 99 percent.
The design, in addition to meeting the required sulfate level, had to meet other NPDES requirements. The
additional NPDES requirements are shown in Table ES-4.
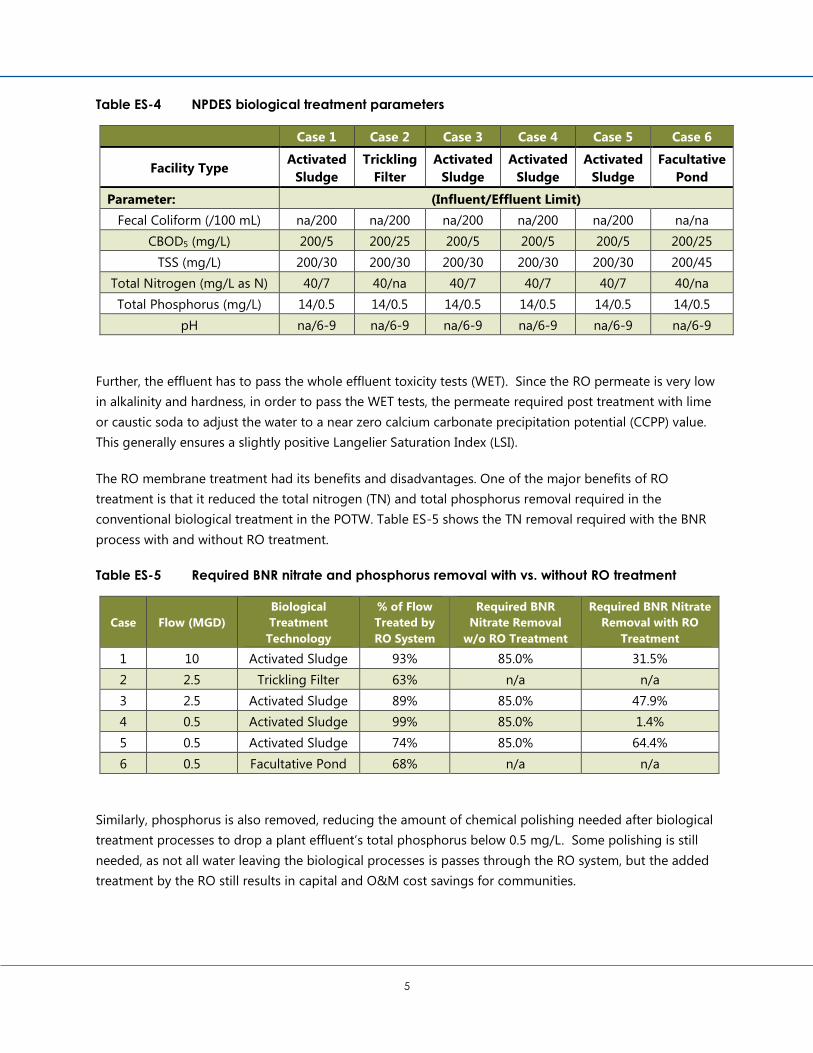
5
Table ES-4 NPDES biological treatment parameters
Case 1 Case 2 Case 3 Case 4 Case 5 Case 6
Facility Type Activated
Sludge
Trickling
Filter
Activated
Sludge
Activated
Sludge
Activated
Sludge
Facultative
Pond
Parameter: (Influent/Effluent Limit)
Fecal Coliform (/100 mL) na/200 na/200 na/200 na/200 na/200 na/na
CBOD5 (mg/L) 200/5 200/25 200/5 200/5 200/5 200/25
TSS (mg/L) 200/30 200/30 200/30 200/30 200/30 200/45
Total Nitrogen (mg/L as N) 40/7 40/na 40/7 40/7 40/7 40/na
Total Phosphorus (mg/L) 14/0.5 14/0.5 14/0.5 14/0.5 14/0.5 14/0.5
pH na/6-9 na/6-9 na/6-9 na/6-9 na/6-9 na/6-9
Further, the effluent has to pass the whole effluent toxicity tests (WET). Since the RO permeate is very low
in alkalinity and hardness, in order to pass the WET tests, the permeate required post treatment with lime
or caustic soda to adjust the water to a near zero calcium carbonate precipitation potential (CCPP) value.
This generally ensures a slightly positive Langelier Saturation Index (LSI).
The RO membrane treatment had its benefits and disadvantages. One of the major benefits of RO
treatment is that it reduced the total nitrogen (TN) and total phosphorus removal required in the
conventional biological treatment in the POTW. Table ES-5 shows the TN removal required with the BNR
process with and without RO treatment.
Table ES-5 Required BNR nitrate and phosphorus removal with vs. without RO treatment
Case Flow (MGD)
Biological
Treatment
Technology
% of Flow
Treated by
RO System
Required BNR
Nitrate Removal
w/o RO Treatment
Required BNR Nitrate
Removal with RO
Treatment
1 10 Activated Sludge 93% 85.0% 31.5%
2 2.5 Trickling Filter 63% n/a n/a
3 2.5 Activated Sludge 89% 85.0% 47.9%
4 0.5 Activated Sludge 99% 85.0% 1.4%
5 0.5 Activated Sludge 74% 85.0% 64.4%
6 0.5 Facultative Pond 68% n/a n/a
Similarly, phosphorus is also removed, reducing the amount of chemical polishing needed after biological
treatment processes to drop a plant effluent’s total phosphorus below 0.5 mg/L. Some polishing is still
needed, as not all water leaving the biological processes is passes through the RO system, but the added
treatment by the RO still results in capital and O&M cost savings for communities.
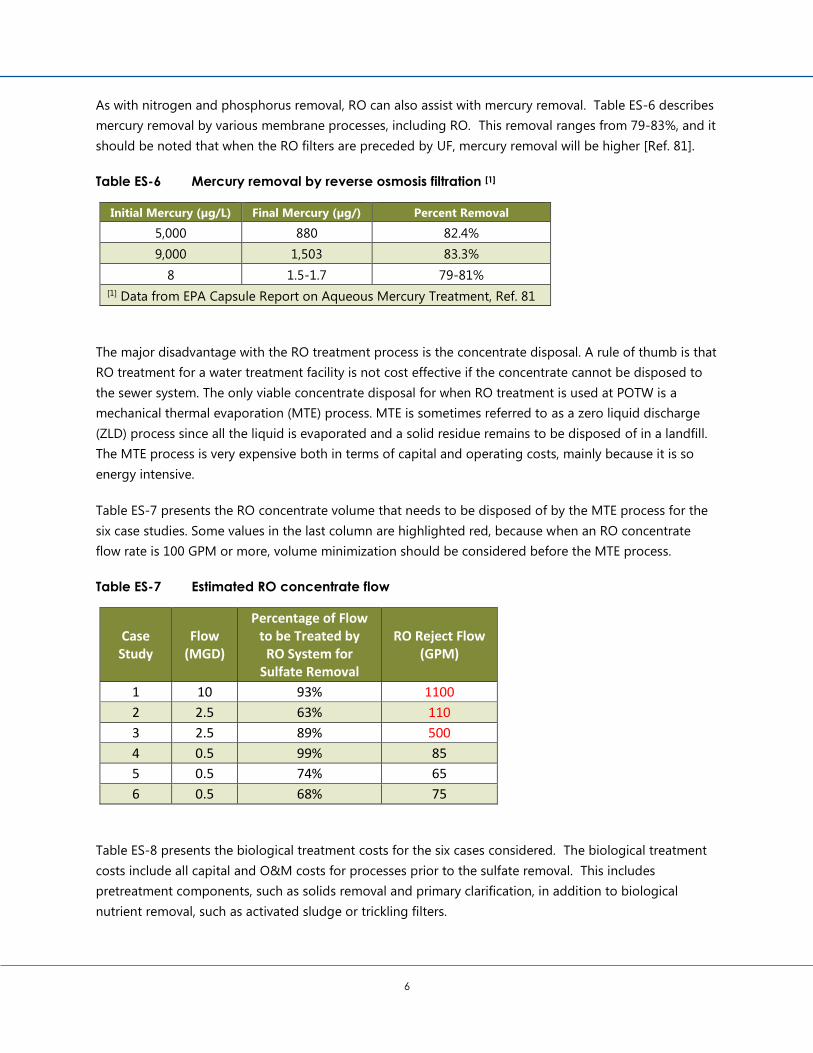
6
As with nitrogen and phosphorus removal, RO can also assist with mercury removal. Table ES-6 describes
mercury removal by various membrane processes, including RO. This removal ranges from 79-83%, and it
should be noted that when the RO filters are preceded by UF, mercury removal will be higher [Ref. 81].
Table ES-6 Mercury removal by reverse osmosis filtration [1]
Initial Mercury (µg/L) Final Mercury (µg/) Percent Removal
5,000 880 82.4%
9,000 1,503 83.3%
8 1.5-1.7 79-81%
[1] Data from EPA Capsule Report on Aqueous Mercury Treatment, Ref. 81
The major disadvantage with the RO treatment process is the concentrate disposal. A rule of thumb is that
RO treatment for a water treatment facility is not cost effective if the concentrate cannot be disposed to
the sewer system. The only viable concentrate disposal for when RO treatment is used at POTW is a
mechanical thermal evaporation (MTE) process. MTE is sometimes referred to as a zero liquid discharge
(ZLD) process since all the liquid is evaporated and a solid residue remains to be disposed of in a landfill.
The MTE process is very expensive both in terms of capital and operating costs, mainly because it is so
energy intensive.
Table ES-7 presents the RO concentrate volume that needs to be disposed of by the MTE process for the
six case studies. Some values in the last column are highlighted red, because when an RO concentrate
flow rate is 100 GPM or more, volume minimization should be considered before the MTE process.
Table ES-7 Estimated RO concentrate flow
Case Study
Flow (MGD)
Percentage of Flow to be Treated by
RO System for Sulfate Removal
RO Reject Flow (GPM)
1 10 93% 1100
2 2.5 63% 110
3 2.5 89% 500
4 0.5 99% 85
5 0.5 74% 65
6 0.5 68% 75
Table ES-8 presents the biological treatment costs for the six cases considered. The biological treatment
costs include all capital and O&M costs for processes prior to the sulfate removal. This includes
pretreatment components, such as solids removal and primary clarification, in addition to biological
nutrient removal, such as activated sludge or trickling filters.
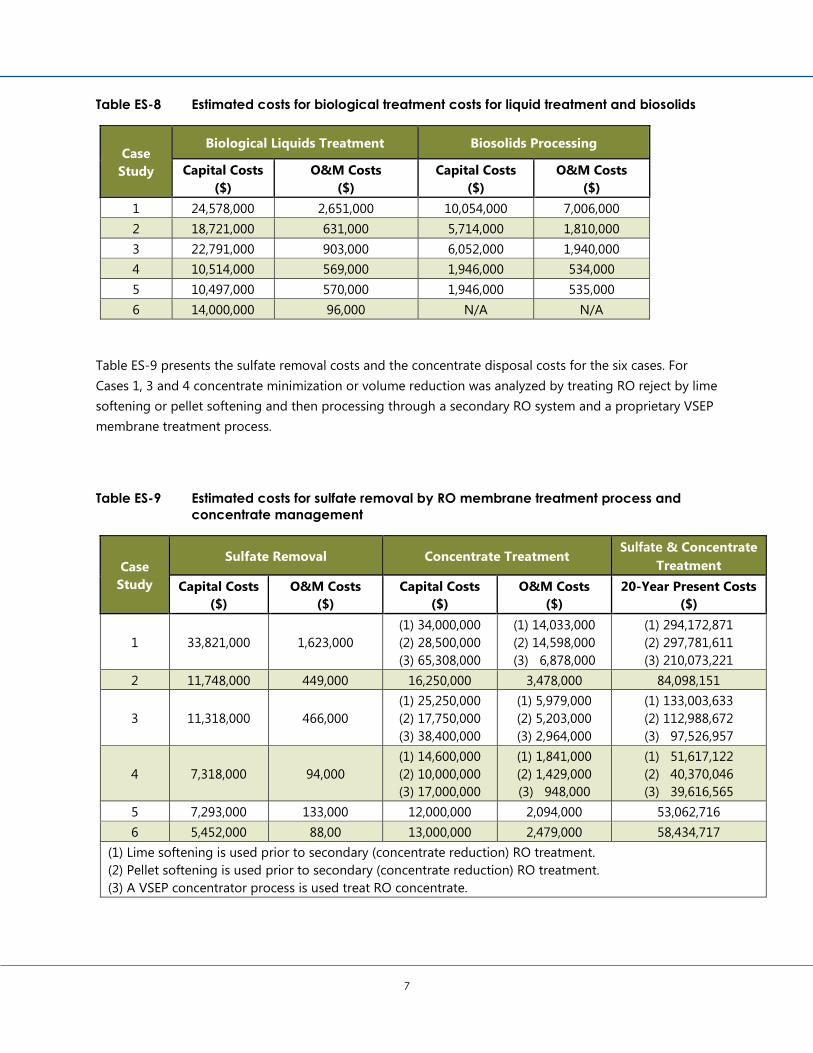
7
Table ES-8 Estimated costs for biological treatment costs for liquid treatment and biosolids
Case
Study
Biological Liquids Treatment Biosolids Processing
Capital Costs
($)
O&M Costs
($)
Capital Costs
($)
O&M Costs
($)
1 24,578,000 2,651,000 10,054,000 7,006,000
2 18,721,000 631,000 5,714,000 1,810,000
3 22,791,000 903,000 6,052,000 1,940,000
4 10,514,000 569,000 1,946,000 534,000
5 10,497,000 570,000 1,946,000 535,000
6 14,000,000 96,000 N/A N/A
Table ES-9 presents the sulfate removal costs and the concentrate disposal costs for the six cases. For
Cases 1, 3 and 4 concentrate minimization or volume reduction was analyzed by treating RO reject by lime
softening or pellet softening and then processing through a secondary RO system and a proprietary VSEP
membrane treatment process.
Table ES-9 Estimated costs for sulfate removal by RO membrane treatment process and
concentrate management
Case
Study
Sulfate Removal Concentrate Treatment Sulfate & Concentrate
Treatment
Capital Costs
($)
O&M Costs
($)
Capital Costs
($)
O&M Costs
($)
20-Year Present Costs
($)
1 33,821,000 1,623,000
(1) 34,000,000
(2) 28,500,000
(3) 65,308,000
(1) 14,033,000
(2) 14,598,000
(3) 6,878,000
(1) 294,172,871
(2) 297,781,611
(3) 210,073,221
2 11,748,000 449,000 16,250,000 3,478,000 84,098,151
3 11,318,000 466,000
(1) 25,250,000
(2) 17,750,000
(3) 38,400,000
(1) 5,979,000
(2) 5,203,000
(3) 2,964,000
(1) 133,003,633
(2) 112,988,672
(3) 97,526,957
4 7,318,000 94,000
(1) 14,600,000
(2) 10,000,000
(3) 17,000,000
(1) 1,841,000
(2) 1,429,000
(3) 948,000
(1) 51,617,122
(2) 40,370,046
(3) 39,616,565
5 7,293,000 133,000 12,000,000 2,094,000 53,062,716
6 5,452,000 88,00 13,000,000 2,479,000 58,434,717
(1) Lime softening is used prior to secondary (concentrate reduction) RO treatment.
(2) Pellet softening is used prior to secondary (concentrate reduction) RO treatment.
(3) A VSEP concentrator process is used treat RO concentrate.

8
Table ES-10 presents the summary of the total capital costs, total O&M costs and the 20-year present
value costs for the six case studies evaluated. These costs incorporate all of those previously mentioned,
including biological liquids and solids treatment, and sulfate removal.
Table ES-10 Summary of the total capital costs, O&M costs and a 20-year present cost for all
six case studies
Case
Study
Total Capital Costs
($)
Total O&M Costs
($)
20-Year Present Costs
($)
1
(1) 102,453,000
(2) 96,953,000
(3) 133,761,000
(1) 25,313,000
(2) 25,878,000
(3) 18,158,000
(1) 510,751,642
(2) 514,360,382
(3) 426,651,992
2 52,432,688 6,367,243 155,136,318
3
(1) 65,411,000
(2) 57,911,000
(3) 78,561,000
(1) 9,287,000
(2) 8,511,000
(3) 6,272,000
(1) 215,207,205
(2) 195,192,224
(3) 179,730,529
4
(1) 34,378,000
(2) 29,778,000
(3) 36,778,000
(1) 3,039,000
(2) 2,626,000
(3) 2,146,000
(1) 83,388,571
(2) 72,141,495
(3) 71,388,014
5 31,736,000 3,331,000 85,467,866
6 32,452,00 2,662,000 75,397,024
(1) Lime softening is used prior to secondary (concentrate reduction) RO treatment.
(2) Pellet softening is used prior to secondary (concentrate reduction) RO treatment.
(3) A VSEP concentrator process is used treat RO concentrate.

9
1.0 Background
1.1 Introduction
The State of Minnesota is currently revising the surface water quality standard of 10 mg/L. A revised water
quality standard may result in some municipal wastewater treatment plants (WWTPs) needing to reduce
the concentration of sulfate in their discharges. Historically, WWTPs have not been required to treat
sulfate to achieve compliance with a NPDES permit. This report presents the results of the second of a
two-part study commissioned by the Minnesota Pollution Control Agency through funding from the
Minnesota Environment and Natural Resources Trust Fund to assess the current technologies and tools
available to WWTPs to reduce sulfate concentrations in their discharges and identifies the challenges of
meeting potential sulfate limits in the future.
In Part 1 of the study (2017), a wide range of established and emerging sulfate treatment technologies
from the municipal and industrial sectors and source control options were reviewed, screened, and ranked
to understand their advantages and disadvantages and to identify potentially feasible technologies
currently available for sulfate removal. While several potential treatment technologies may be available for
municipal WWTPs, several key technical challenges still need to be overcome.
Of the technologies reviewed, reverse osmosis and nanofiltration, both membrane technologies, were
identified as the most promising, well-established technologies for sulfate removal. Part 1 also stated that
further research and development on cost-effective means for managing the salt-laden, liquid waste
generated by these processes is needed. This liquid waste stream is called either concentrate or reject.
The process and cost of managing this waste stream became a major part of Activity 2.
Activity 2 (2018) examines the practical design, implementation considerations, and costs of select
treatment technologies for use in removing sulfate in typical WWTP applications. Six hypothetical case
studies are presented, based on four water chemistry scenarios, three wastewater treatment plant
technologies, and four effluent requirements. The case studies include: biological wastewater treatment
plant costs, membrane treatment costs, concentrate management costs, and if required, intermediate
water treatment with a second stage of membrane treatment for concentrate minimization.
1.2 Technology Summary from Volume 1
The report on Activity 1 identified and evaluated 31 sulfate treatment technologies in the context of
municipal wastewater treatment. This report will not re-evaluate or comment on the conclusions of
Activity 1, but will take the two technologies that rated highest and perform detailed evaluation, design
and cost estimations for implementation of the highest-rated technologies.

10
1.2.1 Overall Ranking Method Summary
The screening process used in Activity 1 was a three-step process that included:
1. Threshold screening based on the technology’s degree of development and commercialization,
and ability to achieve a threshold sulfate removal performance;
2. Technology screening based on performance, cost, and other factors; and
3. Screening based on removal performance for other parameters of concern.
The goal of the screening process used in Activity 1 was to understand the advantages and limitations of
each sulfate treatment approach, and to identify the most feasible treatment technologies for reducing
sulfate in municipal wastewater effluent using a uniform scoring and ranking methodology.
The criteria for success in the evaluation covered in the first report were successful full-scale
implementation of the technology and the ability to treat sulfate down to a level of 250 mg/L or less.
Figure 1-1 lists the 31 technologies evaluated during Activity 1 relative to their potential for
implementation at a municipal scale to successfully remove sulfate from treated wastewater effluent.
In addition to sulfate removal, there are secondary contaminants of interest (parameters of concern), the
removal of which were also evaluated, with regard to each technology class. These secondary parameters
are: chloride, total mercury, total nitrogen (TN), total phosphorous, and total dissolved solids (TDS). The
ability of the technology to remove each of these contaminants to a specified target level was evaluated.
The treatment targets were provided by MPCA. The treatment targets for chloride, total mercury, and total
dissolved solids were selected based on the most stringent water quality standards included in Minnesota
Rules Chapter 7050, Water Quality Standards for Protection of Waters of the State.
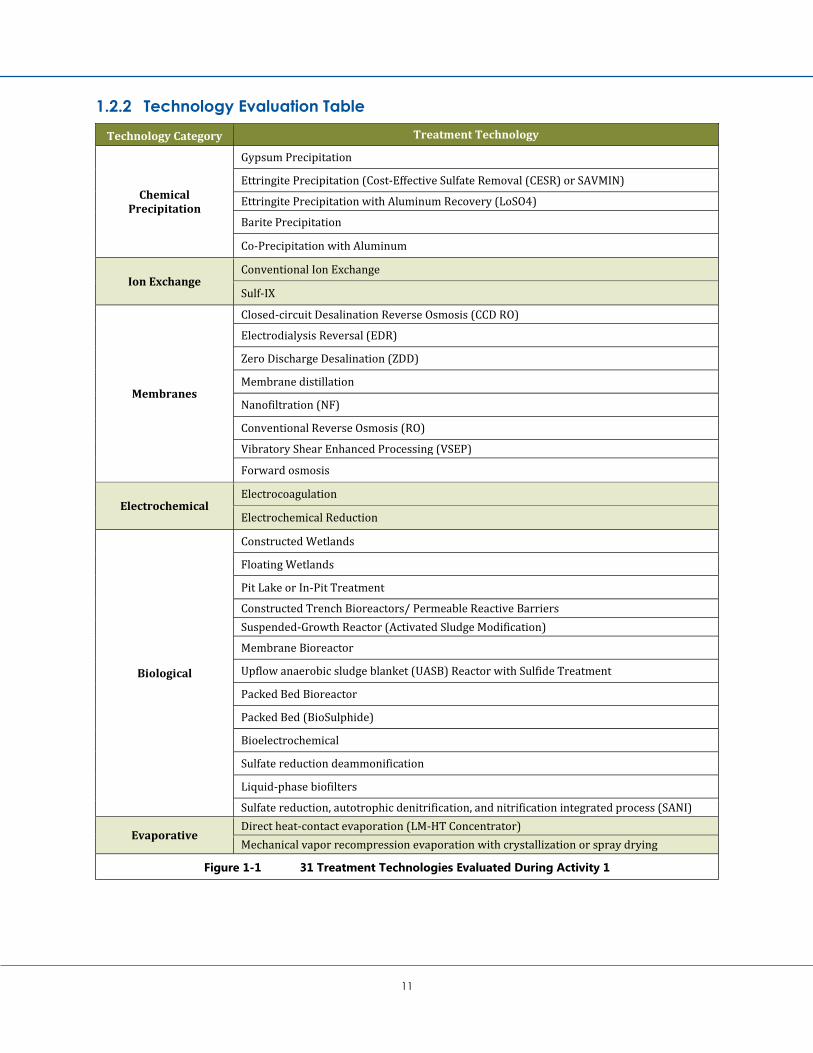
11
1.2.2 Technology Evaluation Table
Technology Category Treatment Technology
Chemical Precipitation
Gypsum Precipitation
Ettringite Precipitation (Cost-Effective Sulfate Removal (CESR) or SAVMIN)
Ettringite Precipitation with Aluminum Recovery (LoSO4)
Barite Precipitation
Co-Precipitation with Aluminum
Ion Exchange Conventional Ion Exchange
Sulf-IX
Membranes
Closed-circuit Desalination Reverse Osmosis (CCD RO)
Electrodialysis Reversal (EDR)
Zero Discharge Desalination (ZDD)
Membrane distillation
Nanofiltration (NF)
Conventional Reverse Osmosis (RO)
Vibratory Shear Enhanced Processing (VSEP)
Forward osmosis
Electrochemical Electrocoagulation
Electrochemical Reduction
Biological
Constructed Wetlands
Floating Wetlands
Pit Lake or In-Pit Treatment
Constructed Trench Bioreactors/ Permeable Reactive Barriers
Suspended-Growth Reactor (Activated Sludge Modification)
Membrane Bioreactor
Upflow anaerobic sludge blanket (UASB) Reactor with Sulfide Treatment
Packed Bed Bioreactor
Packed Bed (BioSulphide)
Bioelectrochemical
Sulfate reduction deammonification
Liquid-phase biofilters
Sulfate reduction, autotrophic denitrification, and nitrification integrated process (SANI)
Evaporative Direct heat-contact evaporation (LM-HT Concentrator)
Mechanical vapor recompression evaporation with crystallization or spray drying
Figure 1-1 31 Treatment Technologies Evaluated During Activity 1

12
1.2.3 Top Ranked Technologies for Further Analysis
Thirteen technology classes met the first round screening criteria and were further evaluated and ranked
based on effectiveness, operability/maintainability, relative cost, degree/complexity of pre and post
treatment requirements, and management of treatment residuals.
Effectiveness is defined as the ability of the technology to remove sulfate. The original screening criteria
for effectiveness was the ability to reduce sulfate to 250 mg/L. In the second screening round, the criteria
becomes the ability of the technology to reduce sulfate down to 10 mg/L. The rating is a function of how
low the technology will reduce the sulfate. The effectiveness criteria also included consideration of the
degree of commercialization or technical maturity in the marketplace and how broadly the technology is
used throughout the industry.
Operability/maintainability refers to the complexity of the technologies operating and maintenance and
the subsequent reliability of the process in removing sulfate. The reliability specifically considered cold
temperature performance. Relative complexity was evaluated based on number of treatment process
steps, pre and post treatment requirements, level of operator attention required, and number of
operational changes required under normal operating conditions. Operator health and public health risk
associated with operations were considered.
Relative cost was based on literature information as well as vendor supplied information. Relative costs
considered capital costs, and operation and maintenance (O&M) costs, which included power, labor, parts,
chemicals for operations and cleaning, consumables, and residual management.
Degree/complexity of pre and post treatment reflects the additional treatment required to allow
successful sulfate removal by the primary sulfate removal process. Addition of these additional unit
operations was considered in the screening process. Processes included in a standard/conventional
wastewater treatment plant for producing secondary effluent were not considered in the screening
process. If post treatment creates a product with beneficial reuse opportunities, post treatment can be a
benefit rather than a cost.
Residual management is the cost and complexity required to manage the secondary side streams (waste)
generated by the sulfate removal process. As mentioned in the previous paragraph, this category can be
a benefit or a cost. This category refers to the complexity of managing residuals associated with the
primary treatment technology as well as the volume of residuals generated.
Of the 31 technologies evaluated (Figure 1-1), 18 technologies were screened out, and 13 technologies
were successful in the first level of screening and were then screened using these second level criteria.
The detailed weighting factors have not been presented here. These 13 technologies were ranked, as
summarized in Table 1-1.

13
Table 1-1 Ranking of successful technologies for sulfate removal
Separation of Scores Technology Category
Group 1: > 85
Reverse osmosis Membranes
Nanofiltration Membranes
Group 2 : 75 – 85
Barite precipitation Chemical precipitation
Ettringite precipitation Chemical precipitation
Sulf-IX Ion exchange
VSEP Membranes
EDR Membranes
CCD RO Membranes
Group 3: < 74
Conventional ion exchange Ion exchange
UASB reactor Biological
Direct heat-contact evaporation (LM-HT Concentrator) Evaporative
Packed bed bioreactor Biological
Mechanical vapor recompression evaporation with
crystallization or spray drying Evaporative
The treatment technologies that received the top ratings were two membrane technologies: reverse
osmosis (RO), and nanofiltration (NF). These technologies got the highest scores in effectiveness and
operability/maintainability, including cold weather performance. The membrane technologies also
received very high scores in the area of removing secondary contaminants of concern. Membranes have a
high potential for beneficial reuse of the treated wastewater. Both of the membrane technologies will
produce a very high quality effluent for a wide variety of water reuse applications. The pre and post
treatment requirements for membranes is well understood from wastewater reuse applications in the arid
southwest, and it is relatively high in order to prevent biofouling, silting in, and precipitation fouling of the
membranes. The membrane technologies received the lowest overall scores under the residuals
management category. This will play an important role in this cost evaluation.
1.3 Chemistry
1.3.1 Minnesota Ground Water (GW) and Surface Water (SW) Sulfate Levels
A potential water quality standard for sulfate in surface waters could be site-specific, and has the potential
to generate a wide range of protective sulfate concentrations from less than 1 mg/L to greater than 1,000
mg/L. Historically, municipal wastewater systems have not been required to consider sulfate treatment for
discharge compliance purposes, so little information is available concerning the applicability of
technologies for this application.

14
Sulfur in wastewater is most commonly present as sulfate or sulfide, which originates primarily from
drinking water sources, human waste, and industrial discharges. More than 95 percent of municipalities in
Minnesota use ground water as the source for their drinking water. The concentration of sulfate in the
ground water varies geographically across the State from less than 10 mg/L to over 500 mg/L. Untreated
domestic wastewater constituents typically add another 20 to 50 mg/L of sulfate [Ref. 1], and some
municipalities have industrial users who produce significant contributions of sulfate. The form of sulfur is
dependent on the condition of the wastewater, with sulfate present in oxygen-rich waters and sulfide
present in oxygen-depleted water. The environmental conditions that help determine the species of sulfur
present in the wastewater may be readily transformed, either biologically or chemically, by natural and
engineered processes.
The sulfate in most Minnesota waters is from natural processes. There are a large number of mineral
forms that are sulfide based. These are only slightly soluble, but they oxidize readily to sulfates in the
presence of atmospheric oxygen. These sulfate minerals are more soluble than the sulfide counterpart.
This oxidation by atmospheric oxygen accounts for most of the sulfates in ground water and surface
water. There are two notable exceptions. One is community wastewater collection systems that have
discharges from industrial users that use or produce sulfate in their process. The other exception is
anthropogenic activities that increase the surface area of sulfide minerals exposed to atmospheric oxygen.
A good indication of the natural sulfate levels in the community water systems is the sulfate levels in
ground waters of the State. Figure 1-2 shows typical Minnesota ground water and surface water sulfate
concentrations. It is important to understand that the source water for a community will strongly
influence the overall water chemistry of the effluent for the community’s wastewater treatment plant.
Figure 1-2 Minnesota Ground Water (left image) and Surface Water Sulfate Levels (right
image)

15
1.3.2 Minnesota Municipal Wastewater Effluent Sulfate Levels
Figure 1-3 shows the average sulfate levels measured in municipal wastewater treatment plant effluents.
In the majority of municipalities, the effluent sulfate concentration is in the range of 20–50 mg/L increase
over the drinking water source concentration. This is primarily due to sulfate present in the food. The
average daily intake of sulfate in foods is estimated to be 453 mg (78). A substantial portion of this intake
is excreted into the wastewater. The communities with a significant industrial discharge may contribute
more sulfate to the wastewater.
Figure 1-3 Average Sulfate Concentrations for Selected Minnesota Municipal Wastewater
Treatment Plant Discharges
The majority of the elevated sulfate levels seen in municipal wastewater discharges are in the
southwestern and western parts of the State where there are naturally high levels of sulfate in the ground
water and the surface waters.
Because levels of sulfate in WWTP effluent depend greatly on the sulfate levels in a community’s source
water, one possible approach would be to attempt removal at the source of water entering the drinking
water system, rather than at the end of the wastewater treatment system. However, this would present
little advantage over treating the wastewater, because the same technologies would still need to be
considered as are already discussed in this study for the treatment of wastewater. Additionally, because
significant sulfate is added into the water stream by the users, in order to meet potential future limits in
wastewater effluent, processes removing sulfate at the water source or at a drinking water treatment
facility would need to achieve even lower sulfate levels than the processes discussed in this study, which
would likely present further challenges.

16
1.3.3 Synthetic Water Used in this Study
Based on a combination of data, the MPCA provided water chemistry for five different scenarios.
Table 1-2 shows water chemistry profiles used for performing full-scale treatment plant cost evaluations.
Table 1-2 Standardized water chemistry profiles for various initial sulfate concentrations
Initial Sulfate in WWTP Effluent
Parameter Unit 25 mg/L 100 mg/L 250 mg/L 500 mg/L
Calcium mg/L 50 100 150 250
Magnesium mg/L 15 50 75 125
Sodium mg/L 45 200 300 400
Potassium mg/L 6.5 15 27 27
Chloride mg/L 136 393 502 687
Alkalinity mg/L as CaCO3 120 300 400 520
Sulfate mg/L as SO4 25 100 250 500
Phosphorus mg/L 14 14 14 14
Ammonia mg/L as N 30 30 30 30
Organic Nitrogen mg/L as N 10 10 10 10
CBOD5 mg/L 200 200 200 200
TSS mg/L 200 200 200 200
pH 7.3 7.5 7.9 7.55
TDS mg/L 398 1158 1754 2637
Within the proposed regulatory framework, the effluent (discharge) sulfate concentrations required for
municipal wastewater treatment plants may vary depending on the site and discharge stream conditions,
so a number of final sulfate concentrations were considered for evaluation purposes. In addition to
removal of sulfate, the removal of secondary contaminants of interest were also considered. These
include mercury, nitrogen, phosphorous, and chloride.
It is important to realize that these are synthetic water profiles, and may not be representative of a specific
community. As seen in Figure 1-2 above, water chemistry profiles for both ground water and surface
water change dramatically across the State of Minnesota from the southwest to the northeast. For a
specific community with an interest in sulfate removal, an evaluation should be performed for the
technology of interest and for the water chemistry profile for that community.
1.4 Range of Flow
The flow from a wastewater treatment plant comes from a combination of sources: those correlated with
population, and those not correlated with population. The population-correlated flows include:
residential use, commercial use, and institutional use. The non-population-correlated wastewater flow is
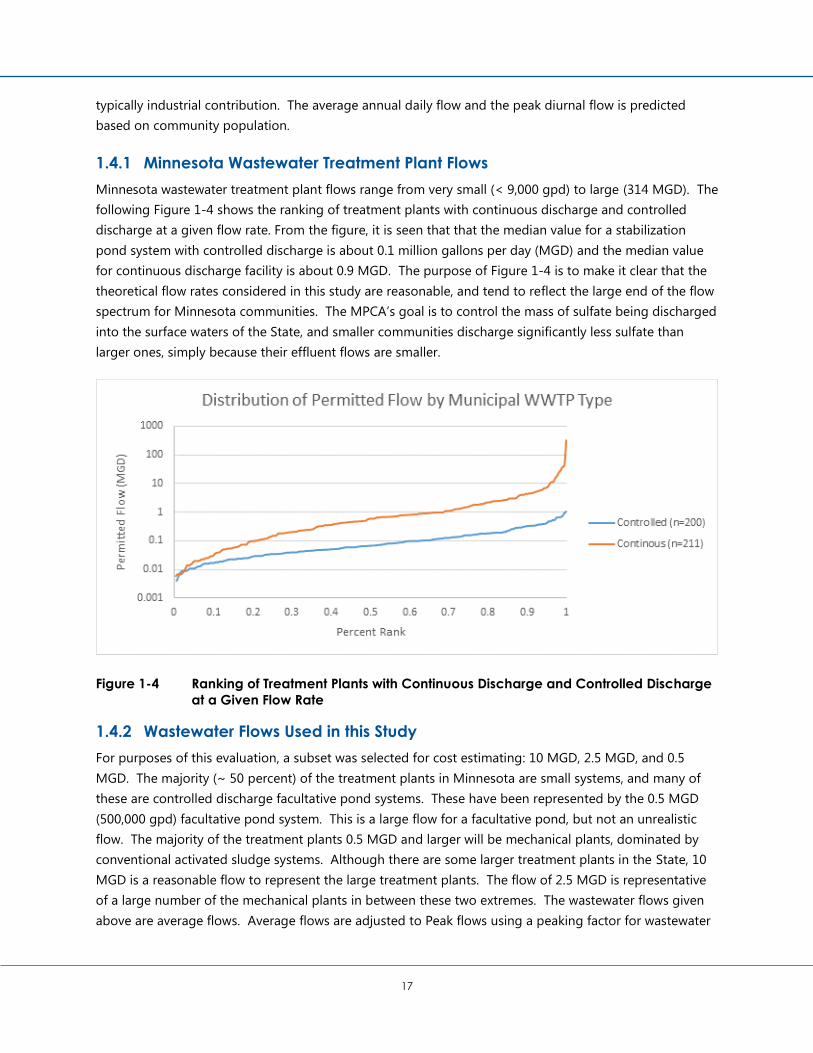
17
typically industrial contribution. The average annual daily flow and the peak diurnal flow is predicted
based on community population.
1.4.1 Minnesota Wastewater Treatment Plant Flows
Minnesota wastewater treatment plant flows range from very small (< 9,000 gpd) to large (314 MGD). The
following Figure 1-4 shows the ranking of treatment plants with continuous discharge and controlled
discharge at a given flow rate. From the figure, it is seen that that the median value for a stabilization
pond system with controlled discharge is about 0.1 million gallons per day (MGD) and the median value
for continuous discharge facility is about 0.9 MGD. The purpose of Figure 1-4 is to make it clear that the
theoretical flow rates considered in this study are reasonable, and tend to reflect the large end of the flow
spectrum for Minnesota communities. The MPCA’s goal is to control the mass of sulfate being discharged
into the surface waters of the State, and smaller communities discharge significantly less sulfate than
larger ones, simply because their effluent flows are smaller.
Figure 1-4 Ranking of Treatment Plants with Continuous Discharge and Controlled Discharge
at a Given Flow Rate
1.4.2 Wastewater Flows Used in this Study
For purposes of this evaluation, a subset was selected for cost estimating: 10 MGD, 2.5 MGD, and 0.5
MGD. The majority (~ 50 percent) of the treatment plants in Minnesota are small systems, and many of
these are controlled discharge facultative pond systems. These have been represented by the 0.5 MGD
(500,000 gpd) facultative pond system. This is a large flow for a facultative pond, but not an unrealistic
flow. The majority of the treatment plants 0.5 MGD and larger will be mechanical plants, dominated by
conventional activated sludge systems. Although there are some larger treatment plants in the State, 10
MGD is a reasonable flow to represent the large treatment plants. The flow of 2.5 MGD is representative
of a large number of the mechanical plants in between these two extremes. The wastewater flows given
above are average flows. Average flows are adjusted to Peak flows using a peaking factor for wastewater

18
from the “10 States Standards”. For cost evaluation purposes, these three wastewater flows are combined
with selected water chemistry profiles previously presented.
1.4.3 Wastewater Flows Associated with Specific Water Chemistry
Table 1-3 represents the intent of the treatment matrix for the evaluation.
Table 1-3 Intent of the treatment matrix for the evaluation
Facility
Size
Average Wet
Weather Flow
(MGD)
Sulfate Treatment
Target
Total N
Limit
Total P
Limit
Total
Mercury Limit
Small 0.5 Low, Medium, High 7 mg/L 0.5 mg/L 6.9 ng/L
Medium 2.5 Low, Medium, High 7 mg/L 0.5 mg/L 6.9 ng/L
Large 10 Low, Medium, High 7 mg/L 0.5 mg/L 6.9 ng/L
From this table, six cases were selected for full design and cost evaluation. These six represent a range of
the treatment flows, technologies, and treatment requirements. These six cases are detailed in Table 2-1.
1.5 Secondary Contaminants of Interest
The sulfate removal treatment considered in Part 2 of this report has the ability to remove other
constituents in addition to sulfate, including other undesirables. Some of these other affected parameters
are discussed in Section 2.1.2. In addition to these, which would normally be treated biologically, the
membrane technology considered in this study to remove sulfate will remove a significant portion of the
chloride which is correlated to electro-conductivity, TDS and salinity in the effluent.

19
2.0 Overview of Technologies and Flows
2.1 Treatment Matrix
Part 2 of this study focuses on the implementation of sulfate removal technology, specifically RO filtration,
at municipal WWTPs and the costs involved. In order to be as authentic and specific as possible, six
unique cases were developed to represent scenarios that plausibly could be faced by Minnesota
communities. Some of the details for these cases were decided by the MPCA, and others by Barr and
Bolton & Menk. Details of the six cases are described in Table 2-1.
Table 2-1 Details of six case studies
Case 1 Case 2 Case 3 Case 4 Case 5 Case 6
Biological Treatment Technology
Activated Sludge
Trickling Filter
Activated Sludge
Activated Sludge
Activated Sludge
Facultative Pond
Design Flow (MGD) 10 2.5 2.5 0.5 0.5 0.5
Sulfate Influent (mg/L) 100 25 600 300 300 600
Required Sulfate Effluent (mg/L)
10 10 100 10 100 250
Percent of Flow Treated by RO System
93% 63% 89% 99% 74% 68%
When estimating costs for each case, it was assumed that an entirely new treatment plant was being
constructed, with wastewater characteristics and effluent limits known, and sulfate removal considered
from the beginning. It should be noted that the costs associated with retrofitting an existing wastewater
treatment plant to remove sulfate would likely vary significantly from the costs for constructing sulfate
removal equipment/processes at an entirely new facility. Although in the event of a new sulfate limit
retrofitting an existing treatment facility would be far more common than the construction of a new one,
when comparing costs for the scenarios considered in this study it made sense to compare the costs of
constructing new facilities. This is due to the widely varying costs for retrofitting existing facilities, given
each one’s uniqueness.
Four of the six cases involve new facilities using activated sludge treatment processes for their biological
nutrient removal (BNR). Activated sludge is the most common type of BNR used in mechanical
wastewater treatment plants in the State, and therefore it was paired with all three influent flow rates and
the three highest influent sulfate values considered. Case 2 is the only one in which a trickling filter
biological treatment process is used, and it is paired with the second highest flow rate considered (2.5
MGD). A facultative pond system is examined in Case 6 to determine the cost effects of adding sulfate
treatment for a smaller community, for which it would not make sense to construct a new mechanical
treatment facility solely for the purpose of removing sulfate.

20
2.1.1 Flows and Sulfate Levels
The influent sulfate concentrations and effluent sulfate concentration limits for each case were stipulated
by the MPCA, while the design flows for each facility were assigned to realistically model the type of
wastewater treatment facilities seen in Minnesota. The design flows range from 0.5 MGD to 10 MGD. In
addition to influent sulfate concentrations and effluent limits, the MPCA also specified additional NPDES
limits to be met by each facility. These limits are discussed further in Section 2.1.2.
As discussed in Part 1 of this study, the technologies considered for implementation in sulfate removal
need to be effective over a wide range of influent sulfate concentrations. This is to account for the wide
variances in source water sulfate levels (see Figure 1-2) and the range of sulfate loads discharged by
municipal and industrial users. The highest influent sulfate concentration considered is 600 mg/L, seen in
Cases 3 and 6, while the lowest is 25 mg/L, from Case 2. Similarly, there is a wide range in the required
effluent concentrations, from 250 mg/L (Case 6) down to 10 mg/L (Cases 1, 2, and 4). The varying effluent
concentrations are used because future sulfate requirements are as yet unknown, and could possibly vary
from one facility to another. Depending on the varying sulfate influent and effluent concentrations, a
certain fraction of the facility influent was sent through the sulfate removal processes. The RO/advanced
membrane filtration processes were sized to treat a portion of the daily flow to nearly zero sulfate, with
the recombining of the two flow streams resulting in a plant effluent that meets the required sulfate limit.
This strategy saved costs compared to constructing an advanced treatment system large enough to
handle the entire daily flow. The percent of the flow stream for each case that was required to be sent
through the sulfate removal system is shown in Table 2-1, and ranges from 99 percent (Case 4), where
sulfate had to be reduced from 300 mg/L to 10 mg/L, to 63 percent (Case 2), where sulfate was reduced
from 25 mg/L to 10 mg/L. Although some water was always diverted around the sulfate treatment
processes for the Cases in this study, it was determined that for a facility where less than either 5% of the
total influent or 35 gpm was being diverted around the processed, it would no longer be economically
feasible to have a bypass stream, and all flow should be sent through the sulfate treatment processes.
2.1.2 NPDES Limits for Biological Treatment
In addition to the sulfate influent and effluent concentrations, the MPCA also provided the wastewater
starting parameters and effluent limits for biological treatment. These parameters and limits are similar to
what might normally be encountered in municipal wastewater and required on a facility’s NPDES permit,
respectively. Influent values are the same for each case, while effluent limits varied depending on what
was reasonable for the type of BNR technology. Table 2-2 outlines the limits.

21
Table 2-2 NPDES biological treatment parameters
Case 1 Case 2 Case 3 Case 4 Case 5 Case 6
Facility Type Activated
Sludge
Trickling
Filter
Activated
Sludge
Activated
Sludge
Activated
Sludge
Facultative
Pond
Parameter: (Influent/Effluent Limit)
Fecal Coliform (/100 mL) na/200 na/200 na/200 na/200 na/200 na/na
CBOD5 (mg/L) 200/5 200/25 200/5 200/5 200/5 200/25
TSS (mg/L) 200/30 200/30 200/30 200/30 200/30 200/45
Total Nitrogen (mg/L as N) 40/7 40/na 40/7 40/7 40/7 40/na
Total Phosphorus (mg/L) 14/0.5 14/0.5 14/0.5 14/0.5 14/0.5 14/0.5
pH na/6-9 na/6-9 na/6-9 na/6-9 na/6-9 na/6-9
As discussed previously, not all of the wastewater passing through the plant must be treated by the
sulfate removal processes in order to meet the designated sulfate limit, so there is a portion of the
wastewater flow leaving the biological treatment which passes through the sulfate treatment and another
portion which proceeds directly to the disinfection processes. Many of the NPDES limits, and in particular
the TN and the TP limits shown in Table 2-2, were not achieved prior to the wastewater leaving the
biological treatment processes, but instead after the BNR effluent had been blended with the permeate
from the sulfate removal train, just prior to the disinfection processes. It was recognized that the
advanced membrane filtration technology that would be used for sulfate removal also removes other
wastewater constituents, such as solids, organics, bacteria, and heavy metals [Ref. 67]. This doesn’t mean
that the biological treatment processes are unnecessary and that advanced filtration alone could be used
to treat the raw wastewater. If this were attempted, the outcome would likely be rapid and frequent
fouling of the filters as they tried to remove an excessive load of numerous constituents [Ref. 67].
However, by accounting for the additional parameters that are further treated by the sulfate removal
processes, cost savings can be realized by marginally downsizing the BNR treatment facilities. Table 2-3
below, demonstrates this effect by exhibiting for each case the percentage of the influent nitrate that
would need to be removed from the wastewater stream via the biological treatment processes, compared
with this same percentage when the RO system is in place for sulfate treatment. The last two columns
demonstrate the same effect for phosphorus, displaying the required concentration to be achieved by the
BNR and chemical polishing processes so that once the main wastewater stream and RO permeate are
blended back together, the plant effluent limit is met. A similar effect is seen for TSS and other NPDES-
mandated parameters.
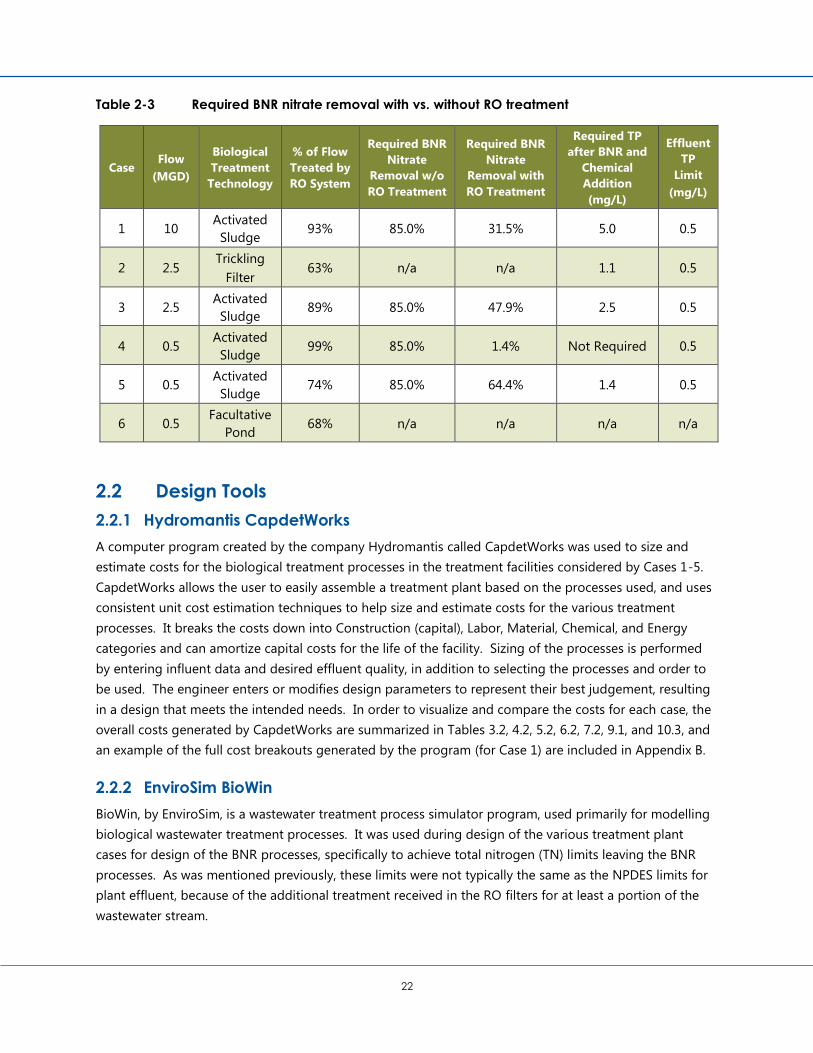
22
Table 2-3 Required BNR nitrate removal with vs. without RO treatment
Case Flow
(MGD)
Biological
Treatment
Technology
% of Flow
Treated by
RO System
Required BNR
Nitrate
Removal w/o
RO Treatment
Required BNR
Nitrate
Removal with
RO Treatment
Required TP
after BNR and
Chemical
Addition
(mg/L)
Effluent
TP
Limit
(mg/L)
1 10 Activated
Sludge 93% 85.0% 31.5% 5.0 0.5
2 2.5 Trickling
Filter 63% n/a n/a 1.1 0.5
3 2.5 Activated
Sludge 89% 85.0% 47.9% 2.5 0.5
4 0.5 Activated
Sludge 99% 85.0% 1.4% Not Required 0.5
5 0.5 Activated
Sludge 74% 85.0% 64.4% 1.4 0.5
6 0.5 Facultative
Pond 68% n/a n/a n/a n/a
2.2 Design Tools
2.2.1 Hydromantis CapdetWorks
A computer program created by the company Hydromantis called CapdetWorks was used to size and
estimate costs for the biological treatment processes in the treatment facilities considered by Cases 1-5.
CapdetWorks allows the user to easily assemble a treatment plant based on the processes used, and uses
consistent unit cost estimation techniques to help size and estimate costs for the various treatment
processes. It breaks the costs down into Construction (capital), Labor, Material, Chemical, and Energy
categories and can amortize capital costs for the life of the facility. Sizing of the processes is performed
by entering influent data and desired effluent quality, in addition to selecting the processes and order to
be used. The engineer enters or modifies design parameters to represent their best judgement, resulting
in a design that meets the intended needs. In order to visualize and compare the costs for each case, the
overall costs generated by CapdetWorks are summarized in Tables 3.2, 4.2, 5.2, 6.2, 7.2, 9.1, and 10.3, and
an example of the full cost breakouts generated by the program (for Case 1) are included in Appendix B.
2.2.2 EnviroSim BioWin
BioWin, by EnviroSim, is a wastewater treatment process simulator program, used primarily for modelling
biological wastewater treatment processes. It was used during design of the various treatment plant
cases for design of the BNR processes, specifically to achieve total nitrogen (TN) limits leaving the BNR
processes. As was mentioned previously, these limits were not typically the same as the NPDES limits for
plant effluent, because of the additional treatment received in the RO filters for at least a portion of the
wastewater stream.
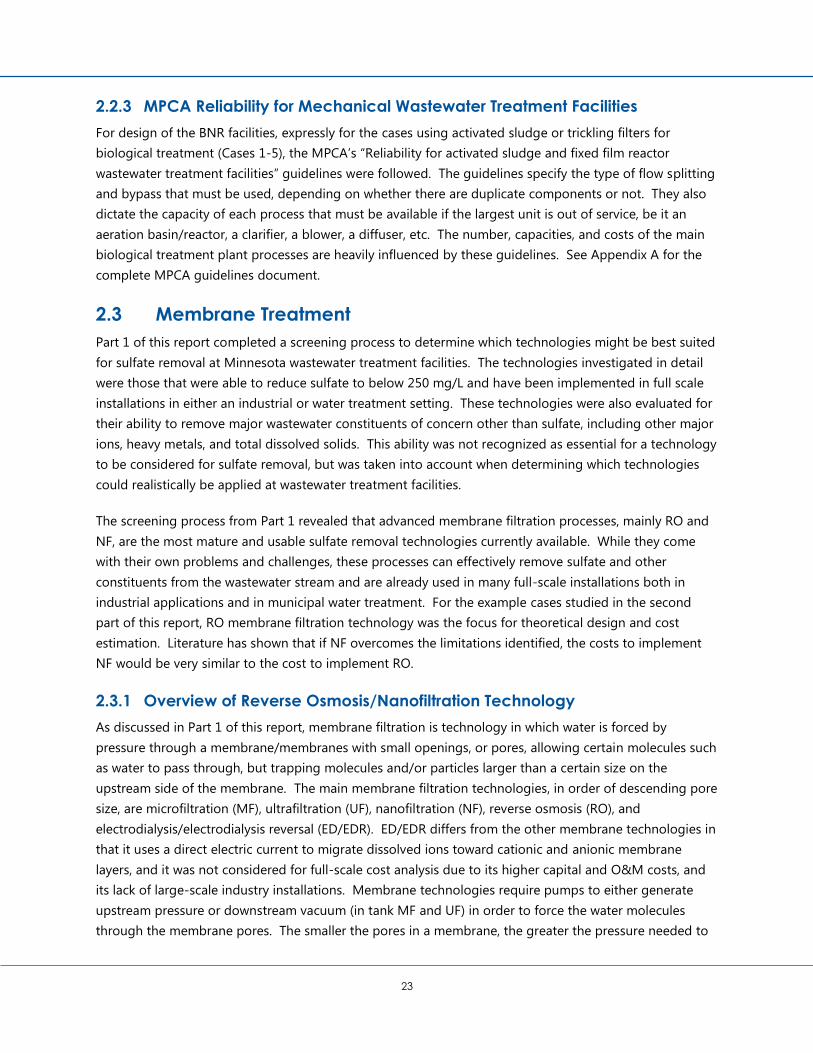
23
2.2.3 MPCA Reliability for Mechanical Wastewater Treatment Facilities
For design of the BNR facilities, expressly for the cases using activated sludge or trickling filters for
biological treatment (Cases 1-5), the MPCA’s “Reliability for activated sludge and fixed film reactor
wastewater treatment facilities” guidelines were followed. The guidelines specify the type of flow splitting
and bypass that must be used, depending on whether there are duplicate components or not. They also
dictate the capacity of each process that must be available if the largest unit is out of service, be it an
aeration basin/reactor, a clarifier, a blower, a diffuser, etc. The number, capacities, and costs of the main
biological treatment plant processes are heavily influenced by these guidelines. See Appendix A for the
complete MPCA guidelines document.
2.3 Membrane Treatment
Part 1 of this report completed a screening process to determine which technologies might be best suited
for sulfate removal at Minnesota wastewater treatment facilities. The technologies investigated in detail
were those that were able to reduce sulfate to below 250 mg/L and have been implemented in full scale
installations in either an industrial or water treatment setting. These technologies were also evaluated for
their ability to remove major wastewater constituents of concern other than sulfate, including other major
ions, heavy metals, and total dissolved solids. This ability was not recognized as essential for a technology
to be considered for sulfate removal, but was taken into account when determining which technologies
could realistically be applied at wastewater treatment facilities.
The screening process from Part 1 revealed that advanced membrane filtration processes, mainly RO and
NF, are the most mature and usable sulfate removal technologies currently available. While they come
with their own problems and challenges, these processes can effectively remove sulfate and other
constituents from the wastewater stream and are already used in many full-scale installations both in
industrial applications and in municipal water treatment. For the example cases studied in the second
part of this report, RO membrane filtration technology was the focus for theoretical design and cost
estimation. Literature has shown that if NF overcomes the limitations identified, the costs to implement
NF would be very similar to the cost to implement RO.
2.3.1 Overview of Reverse Osmosis/Nanofiltration Technology
As discussed in Part 1 of this report, membrane filtration is technology in which water is forced by
pressure through a membrane/membranes with small openings, or pores, allowing certain molecules such
as water to pass through, but trapping molecules and/or particles larger than a certain size on the
upstream side of the membrane. The main membrane filtration technologies, in order of descending pore
size, are microfiltration (MF), ultrafiltration (UF), nanofiltration (NF), reverse osmosis (RO), and
electrodialysis/electrodialysis reversal (ED/EDR). ED/EDR differs from the other membrane technologies in
that it uses a direct electric current to migrate dissolved ions toward cationic and anionic membrane
layers, and it was not considered for full-scale cost analysis due to its higher capital and O&M costs, and
its lack of large-scale industry installations. Membrane technologies require pumps to either generate
upstream pressure or downstream vacuum (in tank MF and UF) in order to force the water molecules
through the membrane pores. The smaller the pores in a membrane, the greater the pressure needed to

24
force water through them, and the more energy the membrane will consume during operation. Table 2-4
details the typical pore sizes and feed pressures for each membrane type.
Table 2-4 Typical pore sizes and feed pressures for membrane technologies
Membrane Category Typical Pore size (µm)[1] Typical Feed Pressure (psig)[1]
Microfiltration 0.05-20 2-40 (-3 to -12 vacuum)
Ultrafiltration 0.0015-0.2 7-150
Nanofiltration <0.0015 70-300
Reverse Osmosis <0.0015 125-600[2]
[1] Ref. 66
[2] For low and standard pressure systems (not high pressure/saltwater), US EPA
RO and NF are the only two membrane technologies with pore sizes small enough to reliably reject the
sulfate ion, and of the two, RO is the more effective, having a marginally smaller pore size than NF
[Ref. 66]. Based on projections by Dow Water & Process Solutions, NF membranes can perform at similar
levels to RO filters, but only under certain conditions. The examples given for full size installations in
Florida were for removing color (manganese sulfate) from drinking water, and had a relatively pure
starting solution. When natural waters with complex ionic makeups are involved, sulfate rejection by NF is
significantly reduced [Ref. 77]. Additionally, sulfate rejection is also reduced by higher temperatures,
though at the same time feed pressure and energy consumption are both also reduced (see Table 2-5). It
was determined that for NF to be used for sulfate removal, each community would probably need to be
individually considered and a pilot test performed to determine whether it would be effective. While
generally higher in feed pressure/energy consumption, RO is a more widely used and proven technology
in water treatment, and was consequently used in this study as the primary sulfate removal process.
Table 2-5 Projected sulfate removal by NF membrane treatment
Design Details 8°C (46°F)[1] 12°C (46°F)[1] 20°C (68°F)[1]
Case
Influent
Flow
(MGD)
Influent
SO4
(mg/L)
Max. SO4 in
Permeate
(mg/L)
Feed
Pressure
(psi)
Permeate
SO4
(mg/L)
Feed
Pressure
(psi)
Permeate
SO4
(mg/L)
Feed
Pressure
(psi)
Permeate
SO4
(mg/l)
1 10 100 10 101 3.4 92 4.1 77 5.8
2 2.5 25 10 92 0.9 84 1.1 70.9 1.5
3 2.5 600 100 90 17.5 80 21.2 71.5 30
4 0.5 300 10 107 6.1 95 7.4 77.1 11.1
5 0.5 300 100 94 10.5 85 12.7 70.5 18.1
6 0.5 600 250 88 17.8 79 21.7 63.7 31.5
[1] All information from Dow Water and Process Solutions
During operation, an RO membrane concentrates particles and molecules on its upstream side, and two
separate flow streams leave the unit. The clean water, or “permeate” is the finished product that leaves
the membrane system, with unwanted constituents removed. The concentrate (reject) is the water stream
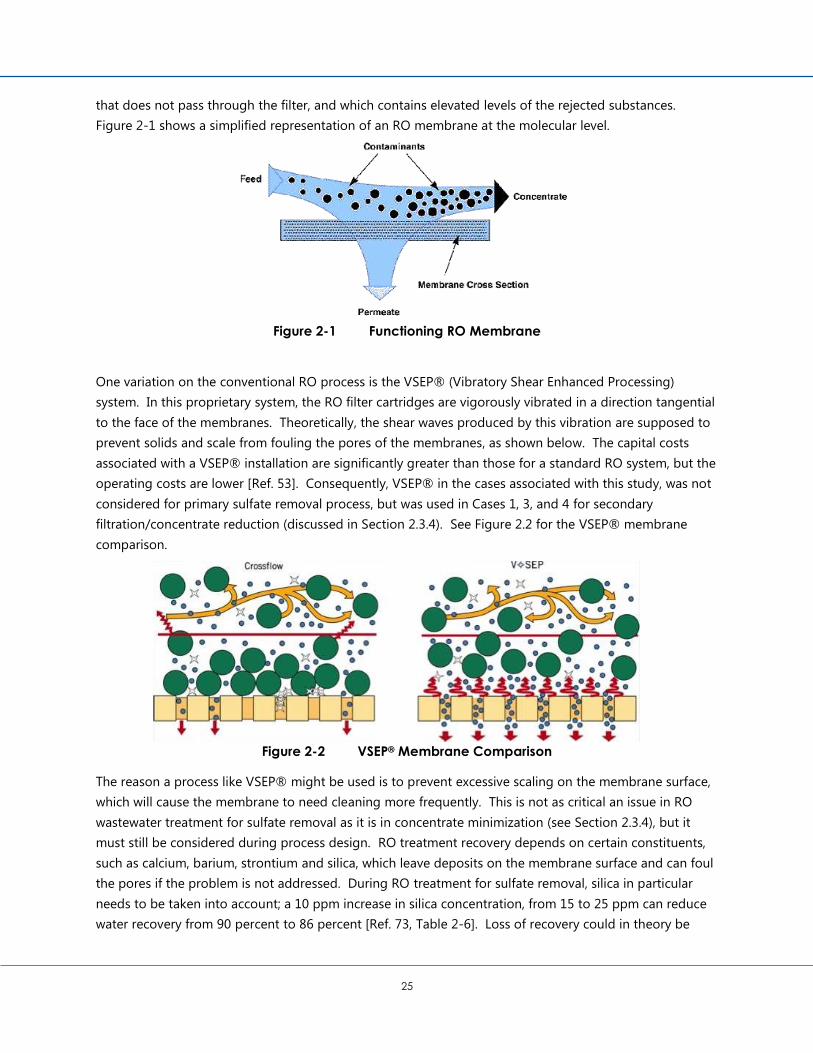
25
that does not pass through the filter, and which contains elevated levels of the rejected substances.
Figure 2-1 shows a simplified representation of an RO membrane at the molecular level.
Figure 2-1 Functioning RO Membrane
One variation on the conventional RO process is the VSEP® (Vibratory Shear Enhanced Processing)
system. In this proprietary system, the RO filter cartridges are vigorously vibrated in a direction tangential
to the face of the membranes. Theoretically, the shear waves produced by this vibration are supposed to
prevent solids and scale from fouling the pores of the membranes, as shown below. The capital costs
associated with a VSEP® installation are significantly greater than those for a standard RO system, but the
operating costs are lower [Ref. 53]. Consequently, VSEP® in the cases associated with this study, was not
considered for primary sulfate removal process, but was used in Cases 1, 3, and 4 for secondary
filtration/concentrate reduction (discussed in Section 2.3.4). See Figure 2.2 for the VSEP® membrane
comparison.
Figure 2-2 VSEP® Membrane Comparison
The reason a process like VSEP® might be used is to prevent excessive scaling on the membrane surface,
which will cause the membrane to need cleaning more frequently. This is not as critical an issue in RO
wastewater treatment for sulfate removal as it is in concentrate minimization (see Section 2.3.4), but it
must still be considered during process design. RO treatment recovery depends on certain constituents,
such as calcium, barium, strontium and silica, which leave deposits on the membrane surface and can foul
the pores if the problem is not addressed. During RO treatment for sulfate removal, silica in particular
needs to be taken into account; a 10 ppm increase in silica concentration, from 15 to 25 ppm can reduce
water recovery from 90 percent to 86 percent [Ref. 73, Table 2-6]. Loss of recovery could in theory be

26
mitigated by adjusting both water temperature and pH, but this would in all likelihood be neither practical
nor cost-effective.
Table 2-6 Summary of sulfate removal by RO treatment process for the six case studies
Case Flow
(MGD)
Sulfate Influent
Conc. (mg/L)
Required Sulfate Effluent
Conc. (mg/L)
Biological Treatment Technology
RO Sulfate
Rejection
Sulfate Conc.
in Permeate
(mg/L)
RO System
Recovery (%)a
% of Flow to be
Treated by RO
System
Rounded up %
Feed Flow to RO (MGD)
Non RO Treated
Flow (MGD)
Reject Flow
(MGD)
Reject Flow
(GPM)
1 10 100 10 Activated
Sludge 99.0% 1 83% 92.3% 93% 9.3 0.7 1.581 1098
2 2.5 25 10 Trickling
Filter 99.0% 0.2 90%b 63.0% 63% 1.575 0.925 0.1575 109
3 2.5 600 100 Activated
Sludge 99.2% 5 68% 88.6% 89% 2.225 0.275 0.712 494
4 0.5 300 10 Activated
Sludge 99.0% 3 76% 98.2% 99% 0.495 0.005 0.1188 83
5 0.5 300 100 Activated
Sludge 99.0% 3 76% 73.1% 74% 0.37 0.13 0.0888 62
6 0.5 600 250 Facultative
Pond 99.2% 5 68% 67.8% 68% 0.34 0.16 0.1088 76
a RO System Recovery was limited by CaCO3 precipitation potential. b RO System Recovery will be reduced if silicate in water equals or exceeds 25 mg/L.
When employing RO membrane filters at a wastewater treatment facility, some additional treatment may
be needed for the permeate stream to bring it into compliance for discharge to the environment. These
specific adjustments are addressed further in Section 2.3.3. The most significant challenge presented by
RO treatment in water or wastewater treatment is how to process concentrate waste stream, for which
there is no simple or inexpensive disposal. Concentrate management is addressed in Sections 2.3.2, 2.3.4,
and 2.4.
2.3.2 Equalization/UF Pretreatment /RO Treatment and Concentrate
Management
Compared to other filtration processes normally associated with wastewater treatment, RO presents a
unique set of operational challenges that must be considered. Among these are equalization of the flow
stream prior to it reaching the filtration process, pretreatment such as tertiary filtration prior to RO to
reduce the biological fouling of membranes, and management of the concentrate stream leaving the RO
treatment system.
The implementation of RO/NF filters as a primary treatment process at a WWTP generates the need for
flow equalization. Municipal wastewater plants are designed to treat wastewater flow that is not
equalized as it comes from the sanitary sewer collection system. This results in substantial variation in
influent flow, typically in a diurnal (two significant flow peaks per day) pattern. RO filter units require a
constant hydraulic loading, and there isn’t a way to vary flow to the units to match the flow entering the
plant, other than taking entire RO skid assemblies in and out of service [Ref. 67]. The solution is to add an
equalization basin or basins prior to the sulfate removal processes to absorb flow peaks and to feed
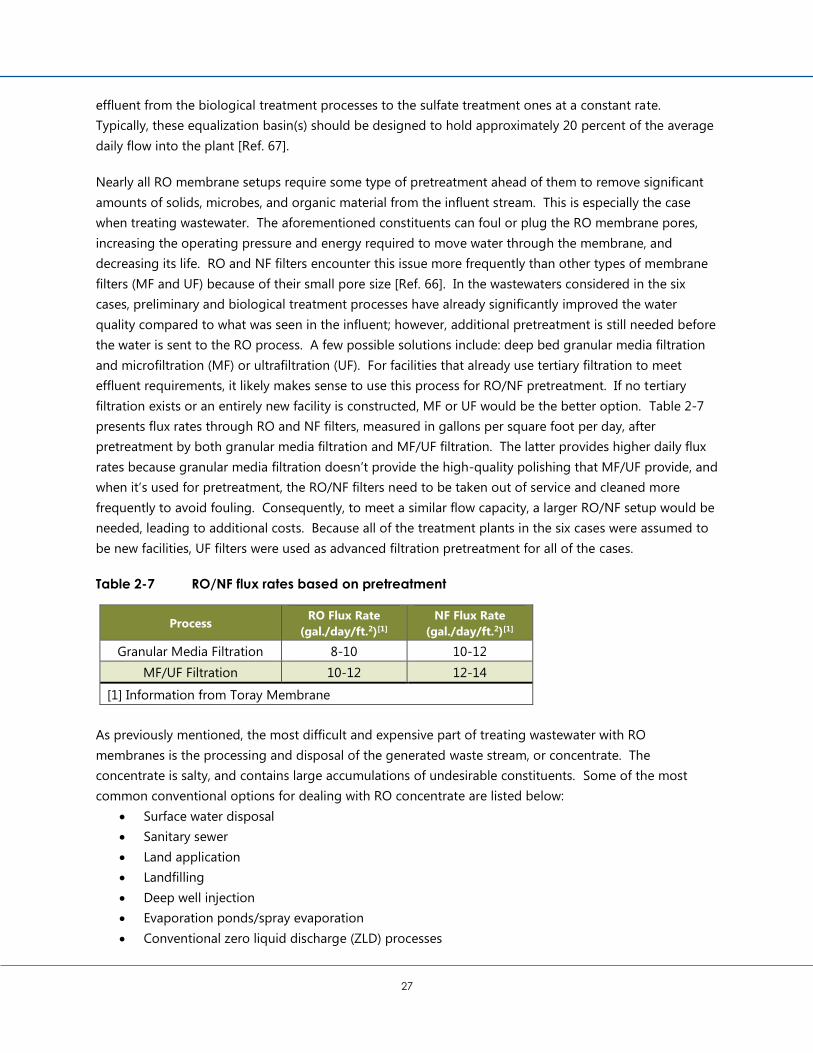
27
effluent from the biological treatment processes to the sulfate treatment ones at a constant rate.
Typically, these equalization basin(s) should be designed to hold approximately 20 percent of the average
daily flow into the plant [Ref. 67].
Nearly all RO membrane setups require some type of pretreatment ahead of them to remove significant
amounts of solids, microbes, and organic material from the influent stream. This is especially the case
when treating wastewater. The aforementioned constituents can foul or plug the RO membrane pores,
increasing the operating pressure and energy required to move water through the membrane, and
decreasing its life. RO and NF filters encounter this issue more frequently than other types of membrane
filters (MF and UF) because of their small pore size [Ref. 66]. In the wastewaters considered in the six
cases, preliminary and biological treatment processes have already significantly improved the water
quality compared to what was seen in the influent; however, additional pretreatment is still needed before
the water is sent to the RO process. A few possible solutions include: deep bed granular media filtration
and microfiltration (MF) or ultrafiltration (UF). For facilities that already use tertiary filtration to meet
effluent requirements, it likely makes sense to use this process for RO/NF pretreatment. If no tertiary
filtration exists or an entirely new facility is constructed, MF or UF would be the better option. Table 2-7
presents flux rates through RO and NF filters, measured in gallons per square foot per day, after
pretreatment by both granular media filtration and MF/UF filtration. The latter provides higher daily flux
rates because granular media filtration doesn’t provide the high-quality polishing that MF/UF provide, and
when it’s used for pretreatment, the RO/NF filters need to be taken out of service and cleaned more
frequently to avoid fouling. Consequently, to meet a similar flow capacity, a larger RO/NF setup would be
needed, leading to additional costs. Because all of the treatment plants in the six cases were assumed to
be new facilities, UF filters were used as advanced filtration pretreatment for all of the cases.
Table 2-7 RO/NF flux rates based on pretreatment
Process RO Flux Rate
(gal./day/ft.2)[1]
NF Flux Rate
(gal./day/ft.2)[1]
Granular Media Filtration 8-10 10-12
MF/UF Filtration 10-12 12-14
[1] Information from Toray Membrane
As previously mentioned, the most difficult and expensive part of treating wastewater with RO
membranes is the processing and disposal of the generated waste stream, or concentrate. The
concentrate is salty, and contains large accumulations of undesirable constituents. Some of the most
common conventional options for dealing with RO concentrate are listed below:
Surface water disposal
Sanitary sewer
Land application
Landfilling
Deep well injection
Evaporation ponds/spray evaporation
Conventional zero liquid discharge (ZLD) processes

28
Surface water disposal was immediately ruled out with the obvious reason being that the purpose of this
report was to study the removal of sulfate from the wastewater stream prior to discharge to natural
waters. Sanitary sewer disposal is often considered when dealing with RO concentrate from a drinking
water treatment facility, but because this study deals with the WWTPs treating sanitary wastewater, it is
not an option for this application. Land application via irrigation with concentrate presents its own
challenges, including the need to over-irrigate so as not to harm the plants being watered with excess salt
buildup and the possibility of the salts and other constituents leaching into underlying ground water [Ref.
47]. Most of Minnesota’s streams are gaining streams, which means the ground water may well end up in
the surface water, which is what is being avoided by the treatment that created the concentrate in the first
place. Similarly, landfilling the concentrate has a number of hurdles, which include widely varying landfill
permit requirements and high container, transport, and disposal costs [Ref. 47]. Most landfills require that
material placed in the landfill have no free water, and concentrate is, in essence, salty water. Deep well
injection is a technology in which liquid concentrate is stored underground in a geologic formation that is
not connected to anything used for beneficial purposes, such as areas where oil and/or gas have been
extracted. The key to deep well injection is to identify a subsurface water chemistry that is compatible
with the water chemistry of the concentrate. In Minnesota, there is a moratorium on injection wells
because its geology is deemed unsuitable for it, so this is another option that is unavailable [Ref. 68].
Evaporation ponds take advantage of ambient conditions to naturally evaporate concentrate, leaving
dissolved solids and particulates behind. The ponds require great areas of land and perpetual warm
weather, solar radiation, and low natural precipitation. They are common in the arid southwest of the U.S.,
but would not be practical or functional in Minnesota [Ref. 66]. There are guidelines from the MPCA for
designing evapotranspiration systems for small scale wastewater, but a system for municipal RO
concentrate management would be very large. Spray evaporation also utilizes evaporative ponds, but
uses mechanical means to spray the concentrate into the air in small droplets, creating more surface area
for faster evaporation. Nevertheless, in Minnesota’s continental climate, the evaporative ponds still would
not function effectively, and spray evaporation can be problematic if high winds cause the sprayed
concentrate to drift away from the pond site.
Evaporation ponds and spray evaporation are two types of zero liquid discharge (ZLD) treatment. The last
major technological category used for concentrate treatment are conventional ZLD processes. It should
be noted that in the context of this report, the use of the term “zero liquid discharge” should not be
understood to mean that there is no liquid effluent leaving a treatment facility. During this cost study,
ZLD processes were considered solely to handle the RO reject (concentrate) as a means of eliminating it
while incurring the least possible costs, and without violating any permits, statutes, or laws.
As the name suggests, after ZLD treatment, the only products from the concentrate stream that must be
disposed of are solids or near-solids, with all or almost all water from the concentrate stream having
either been recycled or evaporated. Because of the discussed obstacles and complications associated
with other types of concentrate disposal, ZLD is the most commonly-employed process in industrial and
desalination applications, and during this study, ZLD, combined with concentrate reduction, was used for
all of the considered cases. Although precipitate salts and crystal solids must still be disposed of, the
landfilling restrictions and costs for this are considerably less than for a liquid waste stream [Ref. 69]. In
29
some cases, the solids produced can themselves be recycled and used, but they often contain significant
levels of regulated metals and other contaminants [Ref. 69]. A hazardous waste characterization should
be conducted to make these determinations.
Conventional ZLD processes generally involve some combination of a concentrator/evaporator unit and a
crystallizer. For each of the theoretical cases considered in this study, this combination was used, while
the method of concentrate reduction was varied. The details of these processes are further discussed in
Section 2.4, while the need for concentrate reduction is covered in Section 2.3.4.
As discussed in Part 1 of this report, there are a number of potential developing or combined
technologies that could be used to deal with concentrate management, possibly without the high energy
use and costs of conventional ZLD processes; however, because these technologies are, on the whole,
unproven, and are not in wide use yet in any industry, they were not investigated further as part of this
study.
2.3.3 Post-Membrane Permeate Treatment
Wastewater that has been treated both by biological treatment processes and RO membrane filtration is
not yet ready for discharge to the environment. As discussed previously, the RO membranes are effective
at filtering out sulfate, as well as numerous other particles, dissolved solids, and molecules, with no way to
selectively control what is removed. Consequently, some final adjustment to the RO permeate is
necessary.
The WWTP effluent must meet all of the NPDES permit requirements, including a pH range of 6-9.
Permeate water leaving the RO membranes has a low pH and is very low in hardness and alkalinity; as a
result, it can be corrosive to downstream pipes and processes. For these reasons, pH adjustment is
necessary prior to the permeate rejoining the main plant effluent stream.
Treated wastewater effluent must also meet whole effluent toxicity (WET) standards for the State of
Minnesota. WET testing is a proactive method of determining whether a wastewater discharge will have
adverse effects on organisms in the receiving water, without necessarily specifically focusing on one
particular contaminant or another. The specific organisms used for WET tests are certain species of the
water flea family (daphnia magna/daphnia pulex/ceriodaphnia dubia) and the fathead minnow
(pimephales promelas). In verbal discussions with the MPCA, it was agreed that as long as the calcium
carbonate precipitation potential (CCPP) was adjusted to be slightly negative, an effluent would likely pass
the WET test. The CCPP is a practical parameter which can be used to measure the amount of calcium
carbonate which theoretically can precipitate out of a water, and takes into account calcium content, pH,
and alkalinity.
The post-RO treatment for Case 1 involved a lime slurry feed at 115 mg/L using a concrete tank and rapid
mixer, while all other cases used a caustic soda feed system with concentrations ranging from 8.5 mg/L to
39 mg/L, depending on the amount of adjustment required (see Appendix C for more details). Lime was
used instead of caustic in Case 1 because while a lime feed system requires a higher capital cost, the
chemical itself costs less than caustic soda, and for the highest-flow (10 MGD) scenario cost savings were
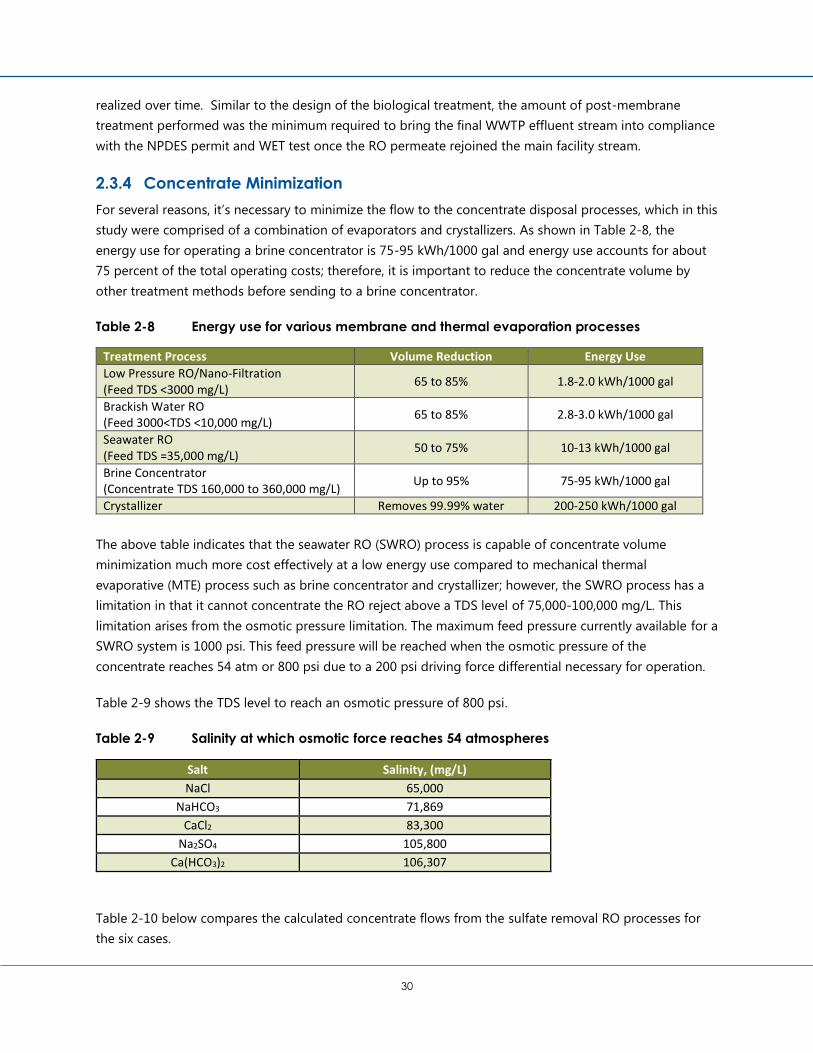
30
realized over time. Similar to the design of the biological treatment, the amount of post-membrane
treatment performed was the minimum required to bring the final WWTP effluent stream into compliance
with the NPDES permit and WET test once the RO permeate rejoined the main facility stream.
2.3.4 Concentrate Minimization
For several reasons, it’s necessary to minimize the flow to the concentrate disposal processes, which in this
study were comprised of a combination of evaporators and crystallizers. As shown in Table 2-8, the
energy use for operating a brine concentrator is 75-95 kWh/1000 gal and energy use accounts for about
75 percent of the total operating costs; therefore, it is important to reduce the concentrate volume by
other treatment methods before sending to a brine concentrator.
Table 2-8 Energy use for various membrane and thermal evaporation processes
Treatment Process Volume Reduction Energy Use
Low Pressure RO/Nano-Filtration (Feed TDS <3000 mg/L)
65 to 85% 1.8-2.0 kWh/1000 gal
Brackish Water RO (Feed 3000<TDS <10,000 mg/L)
65 to 85% 2.8-3.0 kWh/1000 gal
Seawater RO (Feed TDS =35,000 mg/L)
50 to 75% 10-13 kWh/1000 gal
Brine Concentrator (Concentrate TDS 160,000 to 360,000 mg/L)
Up to 95% 75-95 kWh/1000 gal
Crystallizer Removes 99.99% water 200-250 kWh/1000 gal
The above table indicates that the seawater RO (SWRO) process is capable of concentrate volume
minimization much more cost effectively at a low energy use compared to mechanical thermal
evaporative (MTE) process such as brine concentrator and crystallizer; however, the SWRO process has a
limitation in that it cannot concentrate the RO reject above a TDS level of 75,000-100,000 mg/L. This
limitation arises from the osmotic pressure limitation. The maximum feed pressure currently available for a
SWRO system is 1000 psi. This feed pressure will be reached when the osmotic pressure of the
concentrate reaches 54 atm or 800 psi due to a 200 psi driving force differential necessary for operation.
Table 2-9 shows the TDS level to reach an osmotic pressure of 800 psi.
Table 2-9 Salinity at which osmotic force reaches 54 atmospheres
Salt Salinity, (mg/L)
NaCl 65,000
NaHCO3 71,869
CaCl2 83,300
Na2SO4 105,800
Ca(HCO3)2 106,307
Table 2-10 below compares the calculated concentrate flows from the sulfate removal RO processes for
the six cases.

31
Table 2-10 Calculated concentrate flows from the sulfate removal RO processes for the six
cases comparison
Case Flow
(MGD)
Sulfate Influent
Concentration
(mg/L)
Required Sulfate
Effluent
Concentration
(mg/L)
Sulfate
Removal RO
Reject Flow
(MGD / gpm)
Sulfate
Removal RO
Percent
Reject
1 10 100 10 1.58 / 1100 15.8%
2 2.5 25 10 0.16 / 110 6.4%
3 2.5 600 100 0.72 / 500 28.8%
4 0.5 300 10 0.12 / 85 24.0%
5 0.5 300 100 0.09 / 65 18.0%
6 0.5 600 250 0.11 / 75 22.0%
Both capital and O&M costs for evaporative processes are extremely high. Table 2-11 displays varying
costs for a brine evaporator (concentrator)/crystallizer setup using varying influent flows and TDS
concentrations.
Table 2-11 Projected concentrator and crystallizer costs
[1]
Flow (gpm) 139 153 318 488
TDS (ppm) 15,675 21,536 15,675 13,197
MVR Brine
Concentrator Cost $3,500,000 $4,000,000 $5,000,000 $6,500,000
MVR Brine
Crystallizer Cost $3,250,000 $3,500,000 $4,000,000 $4,500,000
Estimated Total
Installation Cost[2] $7,000,000 $7,000,000 $9,000,000 $11,000,000
Solids (tons/day @
10% moisture) 16.34 24.71 37.38 48.3
Power Use
(kWh/day) 4,400 6,200 10,000 13,500
Spares/Maintenance
Allowance (3%) $203,000 $225,000 $270,000 $330,000
[1] All information from Veolia
[2] For Gulf Coast installation

32
The cost of a mechanical/thermal evaporation unit (MTE) to treat 1 MGD (695 gpm) of concentrate, paired
with a crystallizer to treat an estimated 0.05 MGD (35 gpm) of concentrate remaining after the MTE is
roughly $30,000,000 [Ref. 47]. Additionally, evaporator and crystallizer units, because they use heat to
evaporate and eliminate the liquid from the waste stream, use substantial amounts of energy, in the
vicinity of 200-250 kWh/1000 gallons [Ref. 47]. Annual O&M costs for the 1 MGD setup are
approximately $9,500,000 [Ref. 47]. In comparison, a low-pressure secondary RO system that could
reduce the volume sent to the final concentrate disposal processes by 65-85 percent might use roughly
1.8-2.0 kWh/1000 gallons [Ref. 70]. Based on this cost data, it became apparent that every opportunity to
reduce the ultimate flow being directed to the evaporative processes should be pursued.
Aside from the costs associated with evaporator and crystallizer units, their size and complexity is another
factor governing installation and use. A falling film concentrator (evaporator) sized to handle 250 gpm is
approximately 100 ft. in height, and units of this type are frequently not assembled on-site [Ref. 70].
Instead, they must be transported to the location of use and installed, which is a complicated and labor-
intensive process. Evaporators can be sized up to approximately 750 gpm and crystallizers up to roughly
100 gpm [Ref. 71], but based on their exceptionally high O&M costs and the complications associated
with their transport and installation, it was determined for the purpose of this study to attempt to
minimize the concentrate flow being directed to these processes to 100 gpm or less.
Figure 2-3 shows a 250-gpm falling film evaporator at a facility in Chandler, Arizona.
Figure 2-3 Concentrate Evaporator Rated for 250 gpm at a Facility in Chandler, Arizona

33
For Cases 2, 5, and 6, which had some of the lowest RO reject flows and for which concentrate
minimization may not be cost-effective, sulfate removal RO concentrate was sent directly to the
evaporative processes. For all other cases, some type of concentrate minimization was implemented.
Below is a list of some of the most common technologies and systems associated with reduction of
concentrate volume:
Electrodialysis Reversal (EDR) Technologies
ARROWTM Technology (O’Brien & Gere)
VSEPTM Technology (New Logic Research)
HEEPMTM Technology (EET)
HEROTM Technology (SAMCO)
Conventional softening combined with secondary RO
The majority of technologies used for reducing concentrate involve some type of membrane filter, usually
RO again. Impeding the use of merely another relatively straightforward RO setup like that used in the
primary sulfate treatment are the high concentrations of salt and hardness-causing molecules, which tend
to precipitate on RO membrane surfaces and quickly clog the pores. Most concentrate reduction
processes either use pre-softening or some more elegant solution to stop scale from forming on the
membranes.
As can be inferred by the acronyms in the names, many of the technologies listed above are proprietary,
and many are still emerging or in developmental phases. Electrodialysis/electrodialysis reversal, as
previously discussed, is a membrane filtration technique that uses direct electrical current to attract ions
to anionic and cationic plates. ARROWTM stands for Advanced Reject Recovery of Water, and uses unique
flow configurations of standard membrane technologies and high-pH caustic softening to remove silica
and carbonates to achieve high recovery [Ref. 72]. The VSEPTM technology was discussed already and uses
RO filters mounted on a vibrator process which prevents scale precipitation. HEEPMTM (High Efficiency
Electro-Pressure Membrane) uses a combination of ED and RO technology, as well as a feed tank, in a
unique loop that has been able to achieve higher recoveries than either type of system by itself [Ref. 72].
Finally, the HEROTM (High-Efficiency Reverse Osmosis) system by SAMCO uses pretreatment or interstage
lime softening or ion exchange (IX) processes to reduce scaling potential, and high pH through the
second-stage RO if silica is present.
For those cases that were determined to require concentrate reduction after RO for sulfate removal, three
different options were explored in order to compare projected costs, both for installation and operation
over time. These three options were: lime softening followed by UF and RO filters; pellet softening
followed by gravity filtration and RO filters; and a VSEPTM concentrator setup. The detailed costs
associated with each option for each case can be found in Sections 3.0, 5.0, 6.0, and Appendix C. To
determine lime softening capital costs, a recent water treatment plant project designed by Bolton & Menk
was used. The plant was designed to treat 1200 gpm (~1.7 MGD) and the capital cost was roughly
$10,000,000. Only costs for processes that would be needed for treating the concentrate were taken into
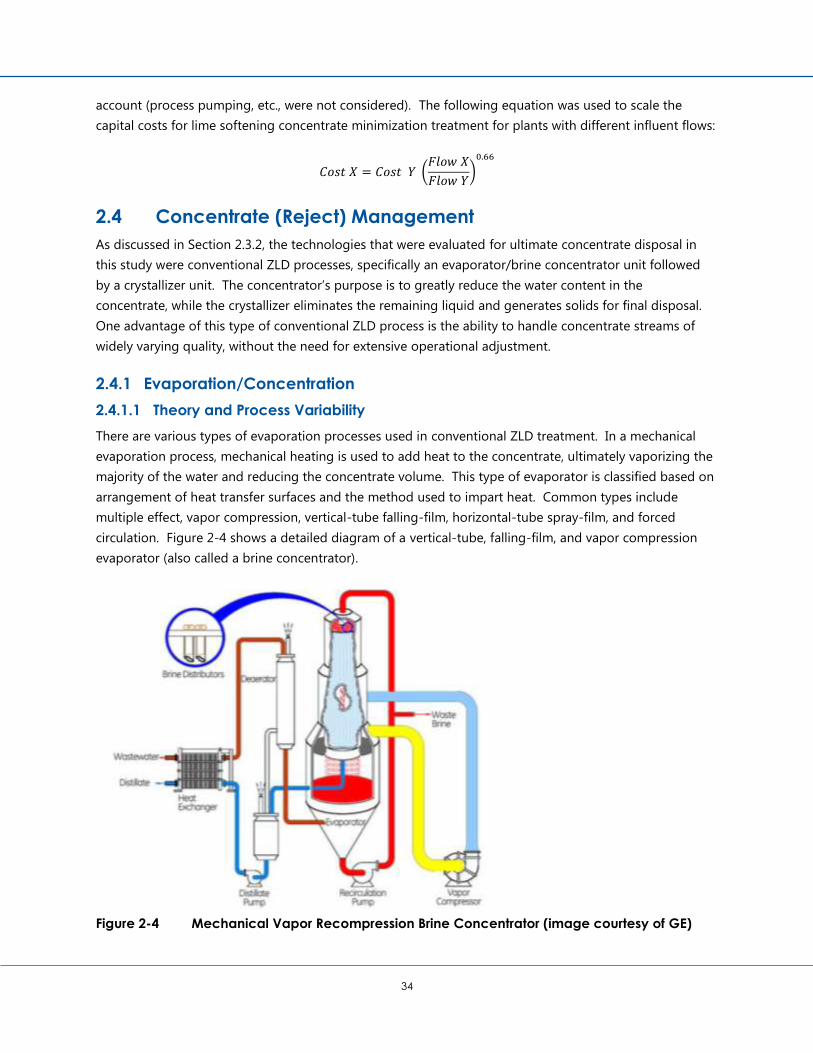
34
account (process pumping, etc., were not considered). The following equation was used to scale the
capital costs for lime softening concentrate minimization treatment for plants with different influent flows:
𝐶𝑜𝑠𝑡 𝑋 = 𝐶𝑜𝑠𝑡 𝑌 (𝐹𝑙𝑜𝑤 𝑋
𝐹𝑙𝑜𝑤 𝑌)
0.66
2.4 Concentrate (Reject) Management
As discussed in Section 2.3.2, the technologies that were evaluated for ultimate concentrate disposal in
this study were conventional ZLD processes, specifically an evaporator/brine concentrator unit followed
by a crystallizer unit. The concentrator’s purpose is to greatly reduce the water content in the
concentrate, while the crystallizer eliminates the remaining liquid and generates solids for final disposal.
One advantage of this type of conventional ZLD process is the ability to handle concentrate streams of
widely varying quality, without the need for extensive operational adjustment.
2.4.1 Evaporation/Concentration
2.4.1.1 Theory and Process Variability
There are various types of evaporation processes used in conventional ZLD treatment. In a mechanical
evaporation process, mechanical heating is used to add heat to the concentrate, ultimately vaporizing the
majority of the water and reducing the concentrate volume. This type of evaporator is classified based on
arrangement of heat transfer surfaces and the method used to impart heat. Common types include
multiple effect, vapor compression, vertical-tube falling-film, horizontal-tube spray-film, and forced
circulation. Figure 2-4 shows a detailed diagram of a vertical-tube, falling-film, and vapor compression
evaporator (also called a brine concentrator).
Figure 2-4 Mechanical Vapor Recompression Brine Concentrator (image courtesy of GE)

35
In this type of process, concentrate is first pumped through a heat exchanger, which uses heat energy
from the distillate leaving the process to raise the temperature of the incoming concentrate. The heated
concentrate then moves through a deaerator, which strips carbon dioxide to reduce corrosion and scaling
potential, and into the main body of the evaporator where it combines with the concentrate slurry. Slurry
is continuously recirculated with a pump to a flood box at the top of the evaporator, which sits at the top
of a number of heat transfer tubes. As the mixed slurry falls through these tubes, a portion of it is
evaporated. This vapor passes through mist eliminators and the vapor compressor, which imparts more
heat to the vapor. It reenters the main evaporator, this time on the outside of the heat transfer tubes, and
imparts heat to the tubes, at the same time cooling and condensing on them. The vapor, now in the form
of distillate, is collected at the base of the heat transfer tubes and pumped out of the process, passing
through the heat exchanger as it leaves and transferring some of its remaining heat energy to the
incoming condensate. Somewhere between 1-10 percent of concentrate slurry flow is wasted, with the
purpose being to maintain 20-30 percent (200,000-300,000 mg/L) total solids in the slurry.
Another major category of evaporative processes is the submerged combustion evaporator. In this type
of process, a fuel (usually natural gas, propane, butane, or fuel oil) is burned just above the surface of the
concentrate and the hot exhaust gases are forced down through the liquid before rising to the liquid
surface and leaving the unit. As the hot gases come into contact with the condensate, a portion of the
water in it is evaporated. In most cases, the evaporated water is exhausted out of the unit with the
burned fuel and is not recoverable. Solids are removed from the evaporator either by a conveyor
connected to the bottom of the unit, or in a sediment separate from the unit through which the slurry
from the base of the unit is cycled, via a pump. Whereas a mechanical evaporator doesn’t remove all
liquids in the concentrate and must be paired with a crystallizer, the combustion evaporator is itself the
final process in a ZLD train and produces for disposal only crystalline solids. Figure 2-5 shows a simplified
schematic of a submerged combustion evaporator.
Figure 2-5 Submerged Combustion Evaporator (image courtesy of EvapoDry)
36
2.4.1.2 Limitations
Mechanical evaporators, such as the one described in Figure 2-4, require special labor skills for operation
and maintenance. They are proven in industrial applications and remove most constituents to produce a
high-quality distillate; however, they create notable noise pollution, may be considered aesthetically
unattractive, and have high capital and operating costs, as previously discussed. In order to function
properly, acid may need to be added before the deaerator to lower the concentrate pH and force more
bicarbonate to be converted to carbon dioxide for removal [Ref. 69]. The removal of carbon dioxide also
removes alkalinity and reduces the possibility of calcium carbonate scaling onto heat transfer surfaces and
reducing process efficiency. It also may be necessary to seed calcium sulfate crystals into the recirculated
slurry to constitute precipitation nuclei for crystal growth for prevention of scaling, or to add other
chemicals for the same purpose. Even so, it may be necessary to periodically (every 2-6 weeks) boil out
the unit with distillate to remove scaling [Ref. 79].
Submerged combustion evaporators offer a higher thermal efficiency than mechanical types, and the
absence of heat transfer surfaces means that scaling does not present the challenges that mechanical
units face. They do face a number of challenges, including safety and noise concerns. Ultimately though,
submerged combustion processes are not widely sized to handle the scale of flows covered in this study.
Discussion with Industrial Process Heat Engineering Ltd., a manufacturer of this type of unit, determined
that the largest unit they had constructed would handle about 20,000 gpd (13.9 gpm), an order of
magnitude smaller than what was needed for the six cases [Ref. 74]. Thus, a mechanical falling-film brine
concentrator, paired with a crystallizer, was used for all six cases.
2.4.2 Crystallization
2.4.2.1 Theory and Process Variability
Like evaporators, crystallizers use mechanical vapor compression to remove water from concentrate,
producing a slurry of solids. The reason that brine concentrators are used in sequence with crystallizers
for concentrate disposal, rather than using crystallizers alone, relates to energy consumption. Whereas
brine concentrators use in the range of 60-90 kWh/1000 gallons processed, a crystallizer uses closer to
180-250 kWh/1000 gallons, meaning a significant difference in per-unit treated operating cost [Ref. 69,
Ref. 75].
The input to a crystallizer comes directly from the waste brine stream produced by the mechanical brine
concentrator (see Section 2.4.1.1). While the brine concentrator further reduces the amount of liquid in
the RO reject stream, the crystallizer eliminates nearly all remaining water. Like evaporators, there are a
few different types of large-scale crystallizers. Most commonly seen in industry applications are steam-
driven or vapor compression crystallizers, similar to the one shown in Figure 2-6.
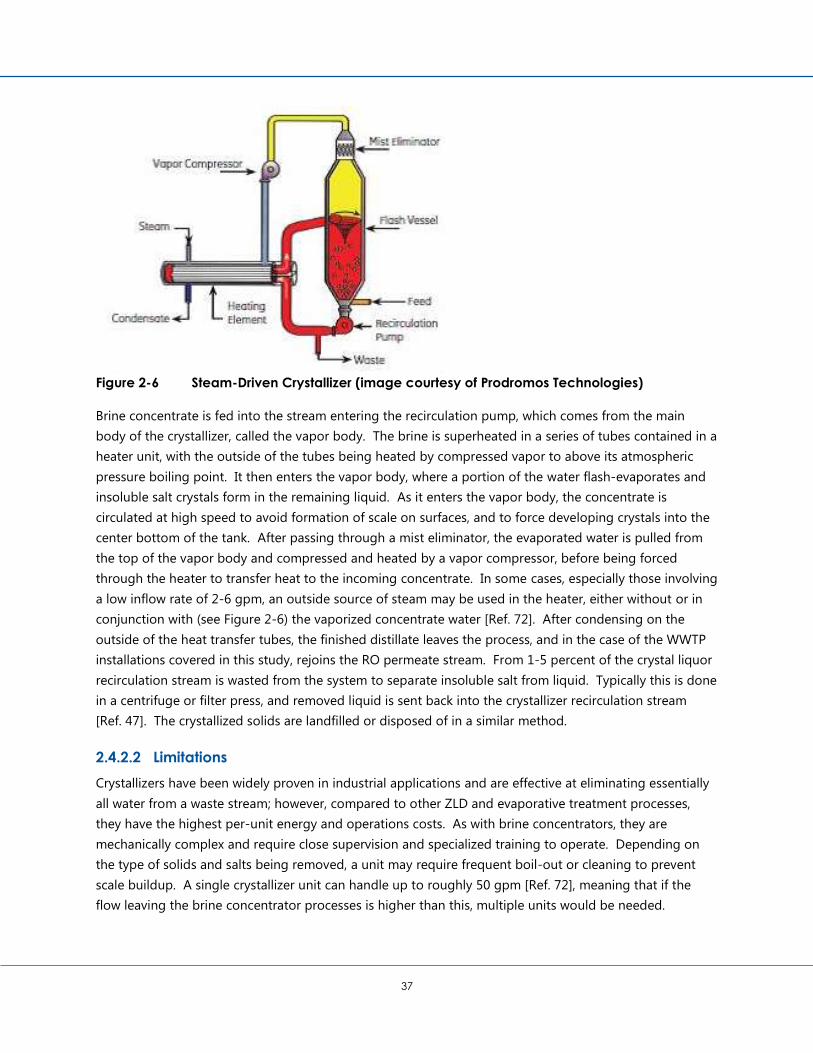
37
Figure 2-6 Steam-Driven Crystallizer (image courtesy of Prodromos Technologies)
Brine concentrate is fed into the stream entering the recirculation pump, which comes from the main
body of the crystallizer, called the vapor body. The brine is superheated in a series of tubes contained in a
heater unit, with the outside of the tubes being heated by compressed vapor to above its atmospheric
pressure boiling point. It then enters the vapor body, where a portion of the water flash-evaporates and
insoluble salt crystals form in the remaining liquid. As it enters the vapor body, the concentrate is
circulated at high speed to avoid formation of scale on surfaces, and to force developing crystals into the
center bottom of the tank. After passing through a mist eliminator, the evaporated water is pulled from
the top of the vapor body and compressed and heated by a vapor compressor, before being forced
through the heater to transfer heat to the incoming concentrate. In some cases, especially those involving
a low inflow rate of 2-6 gpm, an outside source of steam may be used in the heater, either without or in
conjunction with (see Figure 2-6) the vaporized concentrate water [Ref. 72]. After condensing on the
outside of the heat transfer tubes, the finished distillate leaves the process, and in the case of the WWTP
installations covered in this study, rejoins the RO permeate stream. From 1-5 percent of the crystal liquor
recirculation stream is wasted from the system to separate insoluble salt from liquid. Typically this is done
in a centrifuge or filter press, and removed liquid is sent back into the crystallizer recirculation stream
[Ref. 47]. The crystallized solids are landfilled or disposed of in a similar method.
2.4.2.2 Limitations
Crystallizers have been widely proven in industrial applications and are effective at eliminating essentially
all water from a waste stream; however, compared to other ZLD and evaporative treatment processes,
they have the highest per-unit energy and operations costs. As with brine concentrators, they are
mechanically complex and require close supervision and specialized training to operate. Depending on
the type of solids and salts being removed, a unit may require frequent boil-out or cleaning to prevent
scale buildup. A single crystallizer unit can handle up to roughly 50 gpm [Ref. 72], meaning that if the
flow leaving the brine concentrator processes is higher than this, multiple units would be needed.
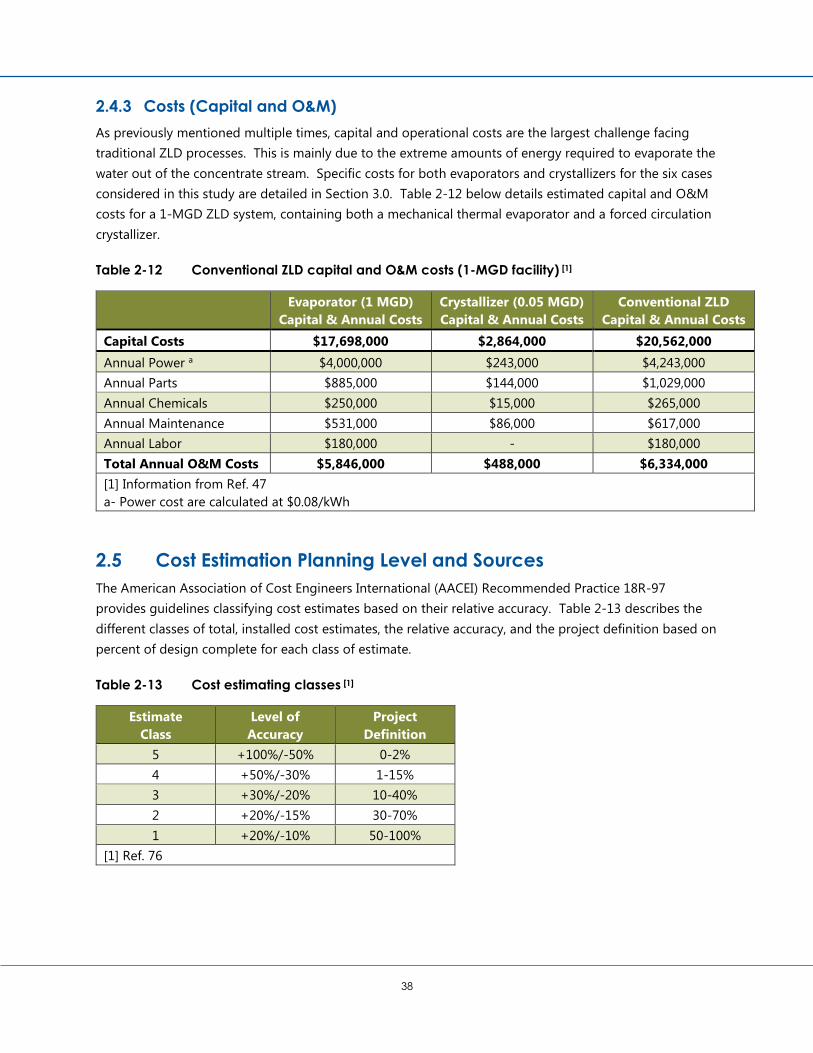
38
2.4.3 Costs (Capital and O&M)
As previously mentioned multiple times, capital and operational costs are the largest challenge facing
traditional ZLD processes. This is mainly due to the extreme amounts of energy required to evaporate the
water out of the concentrate stream. Specific costs for both evaporators and crystallizers for the six cases
considered in this study are detailed in Section 3.0. Table 2-12 below details estimated capital and O&M
costs for a 1-MGD ZLD system, containing both a mechanical thermal evaporator and a forced circulation
crystallizer.
Table 2-12 Conventional ZLD capital and O&M costs (1-MGD facility) [1]
Evaporator (1 MGD)
Capital & Annual Costs
Crystallizer (0.05 MGD)
Capital & Annual Costs
Conventional ZLD
Capital & Annual Costs
Capital Costs $17,698,000 $2,864,000 $20,562,000
Annual Power a $4,000,000 $243,000 $4,243,000
Annual Parts $885,000 $144,000 $1,029,000
Annual Chemicals $250,000 $15,000 $265,000
Annual Maintenance $531,000 $86,000 $617,000
Annual Labor $180,000 - $180,000
Total Annual O&M Costs $5,846,000 $488,000 $6,334,000
[1] Information from Ref. 47
a- Power cost are calculated at $0.08/kWh
2.5 Cost Estimation Planning Level and Sources
The American Association of Cost Engineers International (AACEI) Recommended Practice 18R-97
provides guidelines classifying cost estimates based on their relative accuracy. Table 2-13 describes the
different classes of total, installed cost estimates, the relative accuracy, and the project definition based on
percent of design complete for each class of estimate.
Table 2-13 Cost estimating classes [1]
Estimate
Class
Level of
Accuracy
Project
Definition
5 +100%/-50% 0-2%
4 +50%/-30% 1-15%
3 +30%/-20% 10-40%
2 +20%/-15% 30-70%
1 +20%/-10% 50-100%
[1] Ref. 76

39
The costs developed for this study and presented in Section 3.0 fall under Estimate Class 4, meaning that
the level of error on the overestimation of costs could theoretically be as high as 50 percent, or the costs
could be underestimated by as much as 30 percent. Class 4 assumes a Project Definition in the 1-15
percent range, meaning that was the percentage of design that was assumed to have been completed,
were the facilities in this study to actually be constructed.
The estimations made in this study for capital costs were not just for the equipment itself, but also took
into account the other major cost categories that might be associated with the installation of major
treatment processes. These other cost categories, along with their proportional relation to the equipment
costs, are detailed in Table 2-14.
Table 2-14 Standard capital cost breakdown
Factor Component Estimation Method
Direct Construction Cost
Equipment Technology-Specific Cost
Installation 25-55% of Equipment Cost
Piping 31-66% of Equipment Cost
Instrumentation and Controls 6-30% of Equipment Cost
Indirect Cost Engineering 15% of Total Construction Cost
Contingency 15% of Total Construction Cost
As stated in Section 2.2, the program CapdetWorks was used to generate most of the costs for
preliminary and biological treatment in the theoretical WWTPs. For Case 6, which involved facultative
ponds, the costs developed from recent facultative pond project designed by Bolton & Menk Inc.
The following OEM vendors were contacted to provide equipment costs for sulfate treatment and
concentrate reduction and disposal:
Wigen Water Technologies, Chaska, MN- UF pretreatment and sulfate removal RO equipment
costs
WesTech, Salt Lake City, Utah- Lime softening, Pellet softening, RO equipment costs for
concentrate volume minimization.
New Logic Research, Inc., Emeryville, California- VSEP equipment costs for concentrate volume
minimization.
Veolia Water/HPD- Brine Concentrator and Evaporator costs
GE Water Process Technology (Suez Water)- Brine Concentrator and Evaporator costs

40
Page intentionally left blank

41
3.0 Case Study 1
3.1 10 MGD Activated Sludge Treatment Facility
See a process flow diagram for 2.5 and 10 MGD activated sludge process on the following page.

H:\MNPCA_ST_MN\M21113135\3_Design\C_Reports\Final Draft\Part 2.docx
42

H:\MNPCA_ST_MN\M21113135\3_Design\C_Reports\Final Draft\Part 2.docx
43
3.2 Biological Pretreatment Costs
Table 3-1 Case 1 Preliminary and biological treatment costs
Biological Liquids Treatment Biosolids Processing
Process
Capital
Costs
Annual
O&M Costs Process
Capital
Costs
Annual
O&M Costs
Preliminary Treatment $1,030,000 $171,000 Gravity Belt Thickener $1,540,000 $41,000
Primary Clarifiers $673,000 $109,000 Anaerobic Digestion $3,850,000 $211,000
Biological Nutrient Removal $5,470,000 $856,000 Belt-Filter Press $914,000 $101,000
Chemical Phosphorus
Removal
$235,000 $47,000 Sludge Storage $2,700,000 $333,000
Final Clarifiers $1,040,000 $158,000 Hauling/Landfilling
Sludge
$1,050,000 $6,320,000
UV Disinfection $1,030,000 $60,000
Other Costs[1] $15,100,000 $1,250,000
Total Costs $24,578,000 $2,651,000 Total Costs $10,054,000 $7,006,000
[1] Other Costs include various miscellaneous costs not directly associated with a major process, such as
engineering and administration, mobilization, site preparation, electrical, and piping, and instrumentation &
control
3.3 Membrane Treatment Costs
Table 3-2 Case 1 Reverse osmosis treatment costs
Sulfate Removal
Process Capital Costs Annual O&M Costs
Control Splitter $326,000 $134,000
Equalization $1,705,000 N/A
MF/UF Pretreatment $14,647,500 $248,000
RO Filtration $15,112,500 $1,132,000
Neutralization $2,030,000 $110,000
Total Costs $33,821,000 $1,624,000

44
3.4 Concentrate Minimization & Elimination Costs
Table 3-3 Case 1 Concentrate minimization and evaporator/crystallizer costs
Concentrate Treatment
Process Capital Costs Annual O&M Costs
Lime Softening, UF/RO (Option 1) $16,000,000 $4,920,000
Evaporator/Crystallizer (Op. 1) $18,000,000 $8,604,000
Hauling/Landfilling Crystal Solids (Op. 1) N/A $509,000
Pellet Softening, RO (Option 2) $6,500,000 $1,550,000
Evaporator/Crystallizer (Op. 2) $22,000,000 $12,378,000
Hauling/Landfilling Crystal Solids (Op. 2) N/A $670,000
VSEP Concentrator (Option 3) $52,708,000 $3,920,000
Crystallizer (Op. 3) $12,600,000 $2,311,000
Hauling/Landfilling Crystal Solids (Op. 3) N/A $647,000
Total Costs Op. 1 $34,000,000 $14,033,000
Total Costs Op. 2 $28,500,000 $14,598,000
Total Costs Op. 3 $65,308,000 $6,878,000
45
4.0 Case Study 2
4.1 2.5 MGD Fixed Film Treatment Facility
See a process flow diagram for a 2.5 MGD trickling filter on the following page.
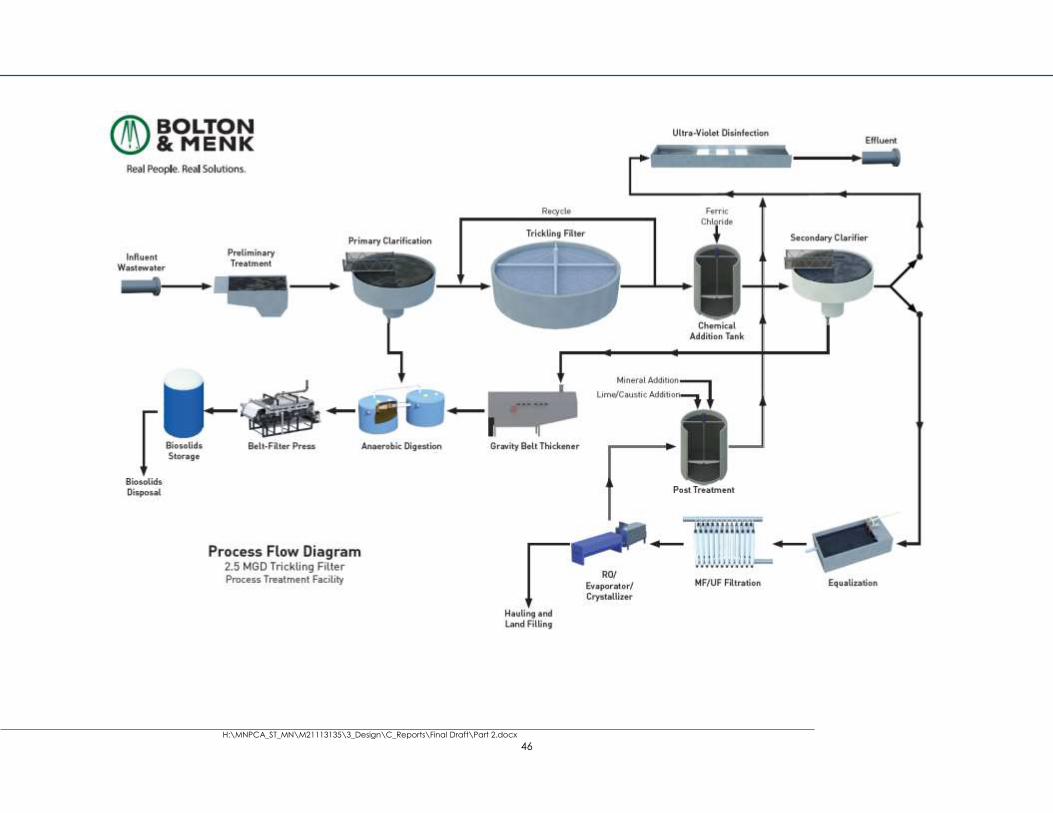
H:\MNPCA_ST_MN\M21113135\3_Design\C_Reports\Final Draft\Part 2.docx
46
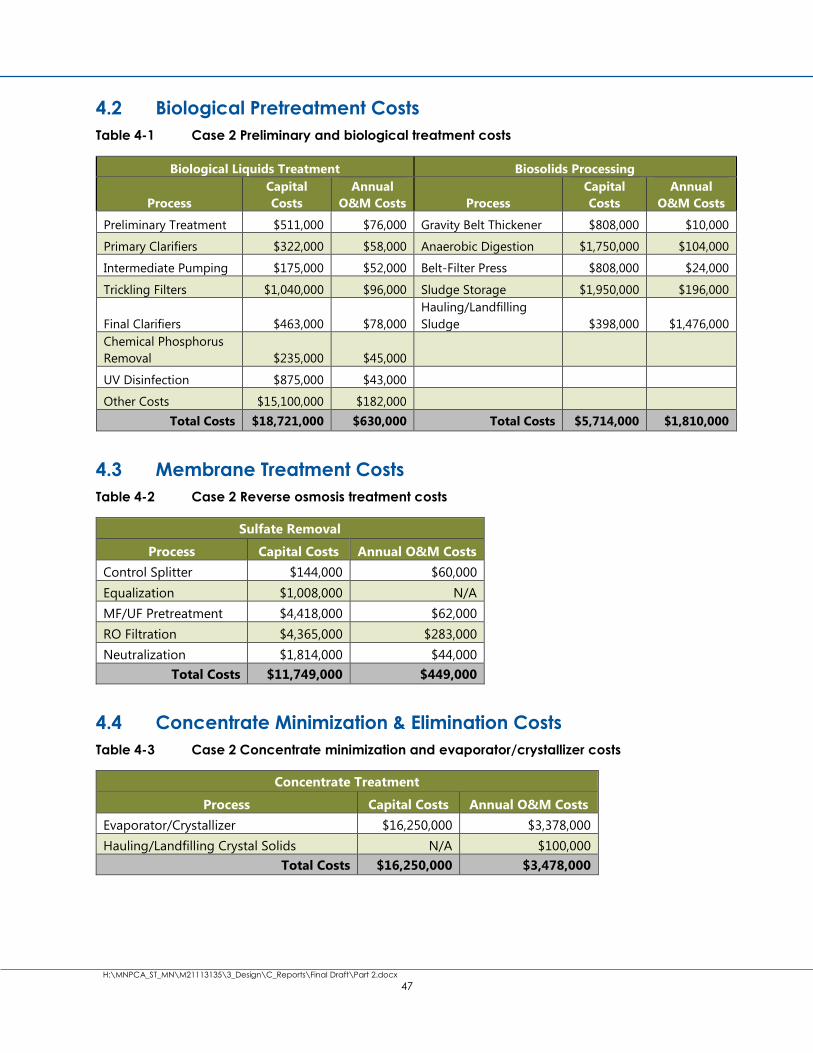
H:\MNPCA_ST_MN\M21113135\3_Design\C_Reports\Final Draft\Part 2.docx
47
4.2 Biological Pretreatment Costs
Table 4-1 Case 2 Preliminary and biological treatment costs
Biological Liquids Treatment Biosolids Processing
Process
Capital
Costs
Annual
O&M Costs Process
Capital
Costs
Annual
O&M Costs
Preliminary Treatment $511,000 $76,000 Gravity Belt Thickener $808,000 $10,000
Primary Clarifiers $322,000 $58,000 Anaerobic Digestion $1,750,000 $104,000
Intermediate Pumping $175,000 $52,000 Belt-Filter Press $808,000 $24,000
Trickling Filters $1,040,000 $96,000 Sludge Storage $1,950,000 $196,000
Final Clarifiers $463,000 $78,000
Hauling/Landfilling
Sludge $398,000 $1,476,000
Chemical Phosphorus
Removal $235,000 $45,000
UV Disinfection $875,000 $43,000
Other Costs $15,100,000 $182,000
Total Costs $18,721,000 $630,000 Total Costs $5,714,000 $1,810,000
4.3 Membrane Treatment Costs
Table 4-2 Case 2 Reverse osmosis treatment costs
Sulfate Removal
Process Capital Costs Annual O&M Costs
Control Splitter $144,000 $60,000
Equalization $1,008,000 N/A
MF/UF Pretreatment $4,418,000 $62,000
RO Filtration $4,365,000 $283,000
Neutralization $1,814,000 $44,000
Total Costs $11,749,000 $449,000
4.4 Concentrate Minimization & Elimination Costs
Table 4-3 Case 2 Concentrate minimization and evaporator/crystallizer costs
Concentrate Treatment
Process Capital Costs Annual O&M Costs
Evaporator/Crystallizer $16,250,000 $3,378,000
Hauling/Landfilling Crystal Solids N/A $100,000
Total Costs $16,250,000 $3,478,000

48
Page intentionally left blank
49
5.0 Case Study 3
5.1 2.5 MGD Activated Sludge Treatment Facility
See a process flow diagram for 2.5 and 10 MGD activated sludge on the following page.
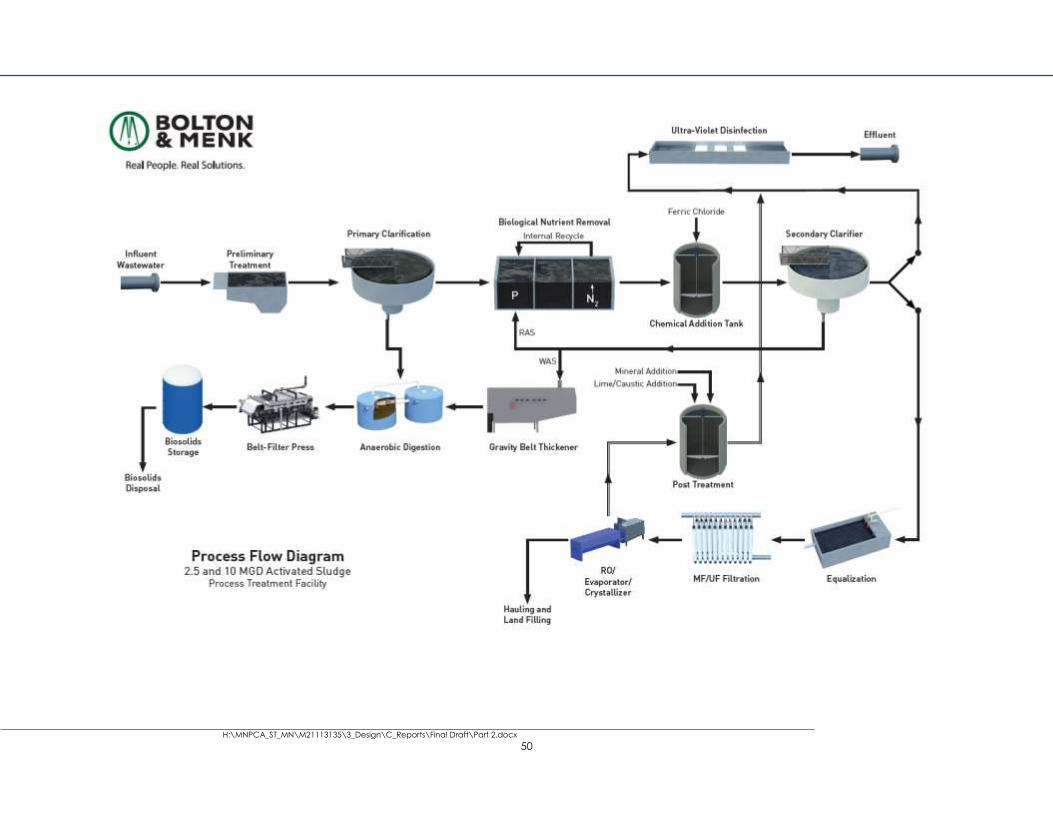
H:\MNPCA_ST_MN\M21113135\3_Design\C_Reports\Final Draft\Part 2.docx
50
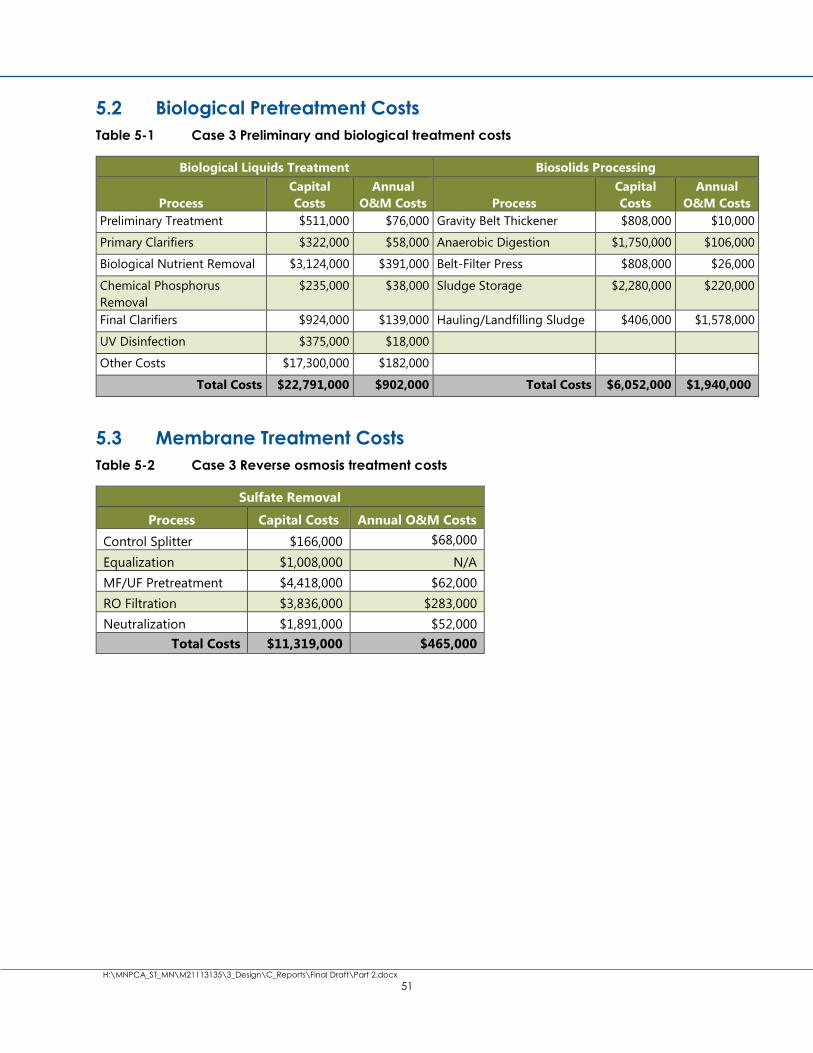
H:\MNPCA_ST_MN\M21113135\3_Design\C_Reports\Final Draft\Part 2.docx
51
5.2 Biological Pretreatment Costs
Table 5-1 Case 3 Preliminary and biological treatment costs
Biological Liquids Treatment Biosolids Processing
Process
Capital
Costs
Annual
O&M Costs Process
Capital
Costs
Annual
O&M Costs
Preliminary Treatment $511,000 $76,000 Gravity Belt Thickener $808,000 $10,000
Primary Clarifiers $322,000 $58,000 Anaerobic Digestion $1,750,000 $106,000
Biological Nutrient Removal $3,124,000 $391,000 Belt-Filter Press $808,000 $26,000
Chemical Phosphorus
Removal
$235,000 $38,000 Sludge Storage $2,280,000 $220,000
Final Clarifiers $924,000 $139,000 Hauling/Landfilling Sludge $406,000 $1,578,000
UV Disinfection $375,000 $18,000
Other Costs $17,300,000 $182,000
Total Costs $22,791,000 $902,000 Total Costs $6,052,000 $1,940,000
5.3 Membrane Treatment Costs
Table 5-2 Case 3 Reverse osmosis treatment costs
Sulfate Removal
Process Capital Costs Annual O&M Costs
Control Splitter $166,000 $68,000
Equalization $1,008,000 N/A
MF/UF Pretreatment $4,418,000 $62,000
RO Filtration $3,836,000 $283,000
Neutralization $1,891,000 $52,000
Total Costs $11,319,000 $465,000
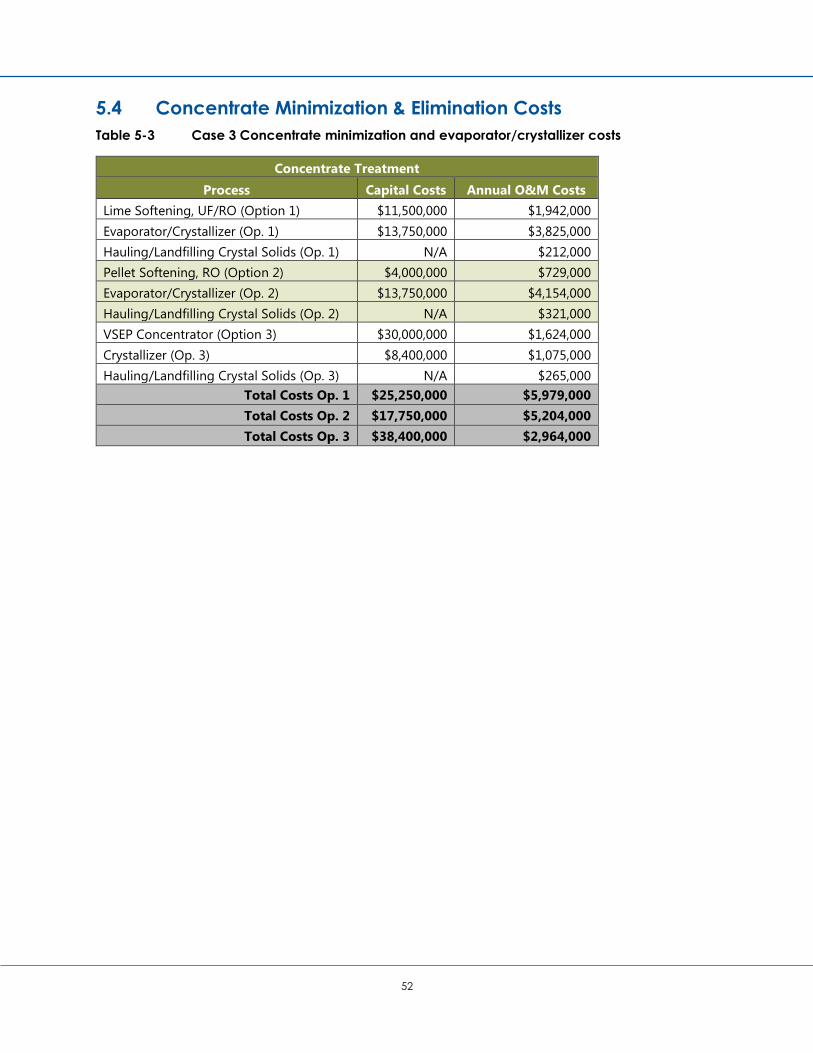
52
5.4 Concentrate Minimization & Elimination Costs
Table 5-3 Case 3 Concentrate minimization and evaporator/crystallizer costs
Concentrate Treatment
Process Capital Costs Annual O&M Costs
Lime Softening, UF/RO (Option 1) $11,500,000 $1,942,000
Evaporator/Crystallizer (Op. 1) $13,750,000 $3,825,000
Hauling/Landfilling Crystal Solids (Op. 1) N/A $212,000
Pellet Softening, RO (Option 2) $4,000,000 $729,000
Evaporator/Crystallizer (Op. 2) $13,750,000 $4,154,000
Hauling/Landfilling Crystal Solids (Op. 2) N/A $321,000
VSEP Concentrator (Option 3) $30,000,000 $1,624,000
Crystallizer (Op. 3) $8,400,000 $1,075,000
Hauling/Landfilling Crystal Solids (Op. 3) N/A $265,000
Total Costs Op. 1 $25,250,000 $5,979,000
Total Costs Op. 2 $17,750,000 $5,204,000
Total Costs Op. 3 $38,400,000 $2,964,000

53
6.0 Case Study 4
6.1 0.5 MGD Activated Sludge Treatment Facility
See a process flow diagram for a 0.5 and 10 MGD activated sludge on following page.

H:\MNPCA_ST_MN\M21113135\3_Design\C_Reports\Final Draft\Part 2.docx
54
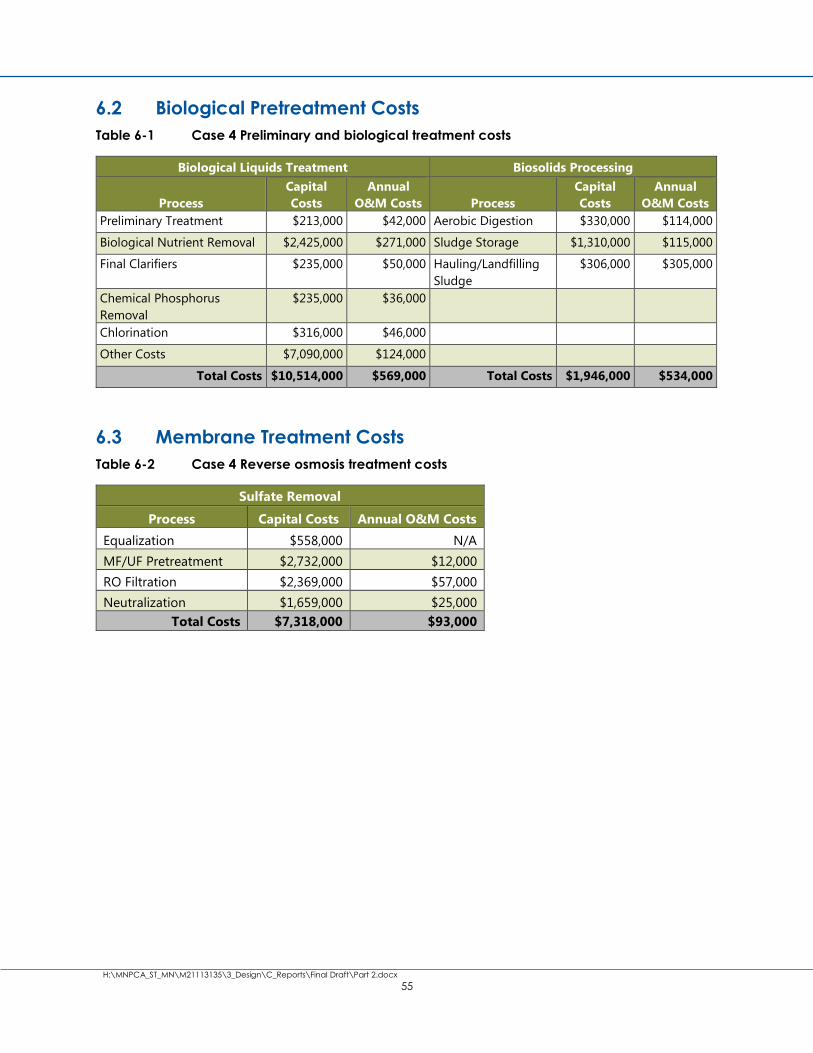
H:\MNPCA_ST_MN\M21113135\3_Design\C_Reports\Final Draft\Part 2.docx
55
6.2 Biological Pretreatment Costs
Table 6-1 Case 4 Preliminary and biological treatment costs
Biological Liquids Treatment Biosolids Processing
Process
Capital
Costs
Annual
O&M Costs Process
Capital
Costs
Annual
O&M Costs
Preliminary Treatment $213,000 $42,000 Aerobic Digestion $330,000 $114,000
Biological Nutrient Removal $2,425,000 $271,000 Sludge Storage $1,310,000 $115,000
Final Clarifiers $235,000 $50,000 Hauling/Landfilling
Sludge
$306,000 $305,000
Chemical Phosphorus
Removal
$235,000 $36,000
Chlorination $316,000 $46,000
Other Costs $7,090,000 $124,000
Total Costs $10,514,000 $569,000 Total Costs $1,946,000 $534,000
6.3 Membrane Treatment Costs
Table 6-2 Case 4 Reverse osmosis treatment costs
Sulfate Removal
Process Capital Costs Annual O&M Costs
Equalization $558,000 N/A
MF/UF Pretreatment $2,732,000 $12,000
RO Filtration $2,369,000 $57,000
Neutralization $1,659,000 $25,000
Total Costs $7,318,000 $93,000

56
6.4 Concentrate Minimization & Elimination Costs
Table 6-3 Case 4 Concentrate minimization and evaporator/crystallizer costs
Concentrate Treatment
Process Capital Costs Annual O&M Costs
Lime Softening, UF/RO (Option 1) $7,600,000 $1,247,000
Evaporator/Crystallizer (Op. 1) $7,000,000 $576,000
Hauling/Landfilling Crystal Solids (Op. 1) N/A $18,000
Pellet Softening, RO (Option 2) $2,000,000 $477,000
Evaporator/Crystallizer (Op. 2) $8,000,000 $911,000
Hauling/Landfilling Crystal Solids (Op. 2) N/A $41,000
VSEP Concentrator (Option 3) $10,000,000 $490,000
Crystallizer (Op. 3) $7,000,000 $411,000
Hauling/Landfilling Crystal Solids (Op. 3) N/A $47,000
Total Costs Op. 1 $14,600,000 $1,841,000
Total Costs Op. 2 $10,000,000 $1,429,000
Total Costs Op. 3 $17,000,000 $948,000
57
7.0 Case Study 5
7.1 0.5 MGD Activated Sludge Treatment Facility
See a process flow diagram for a 0.5 MGD activated sludge process on the following page.
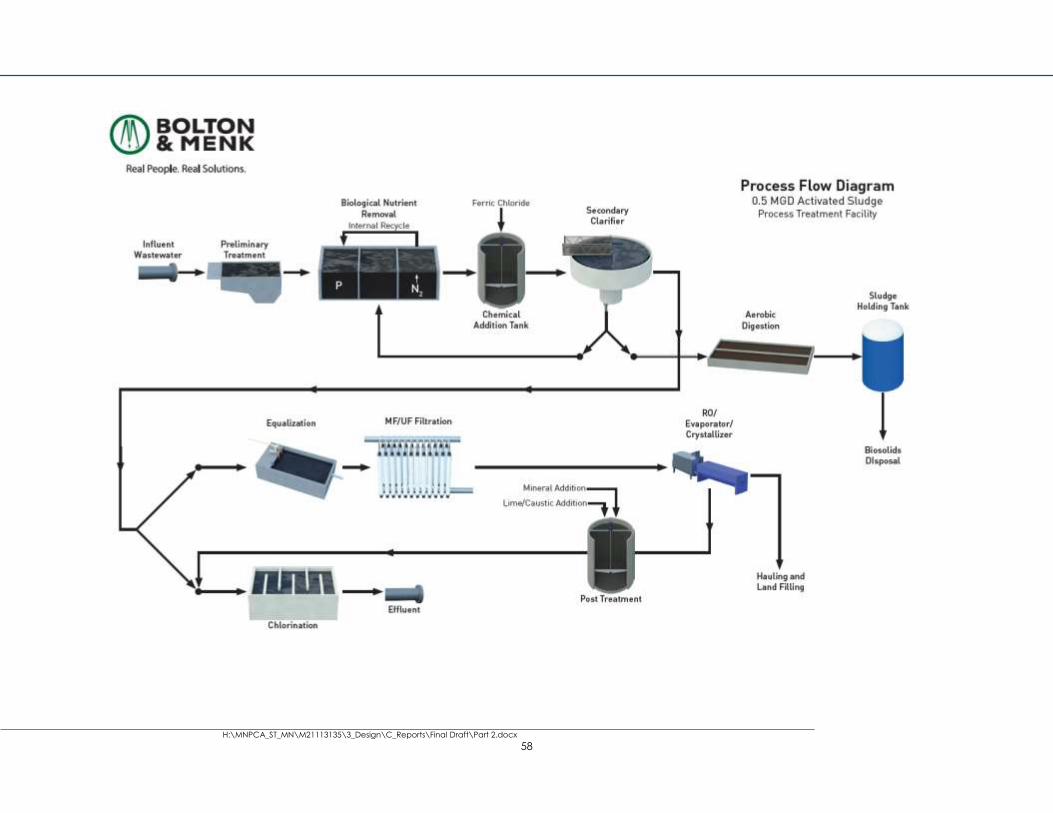
H:\MNPCA_ST_MN\M21113135\3_Design\C_Reports\Final Draft\Part 2.docx
58
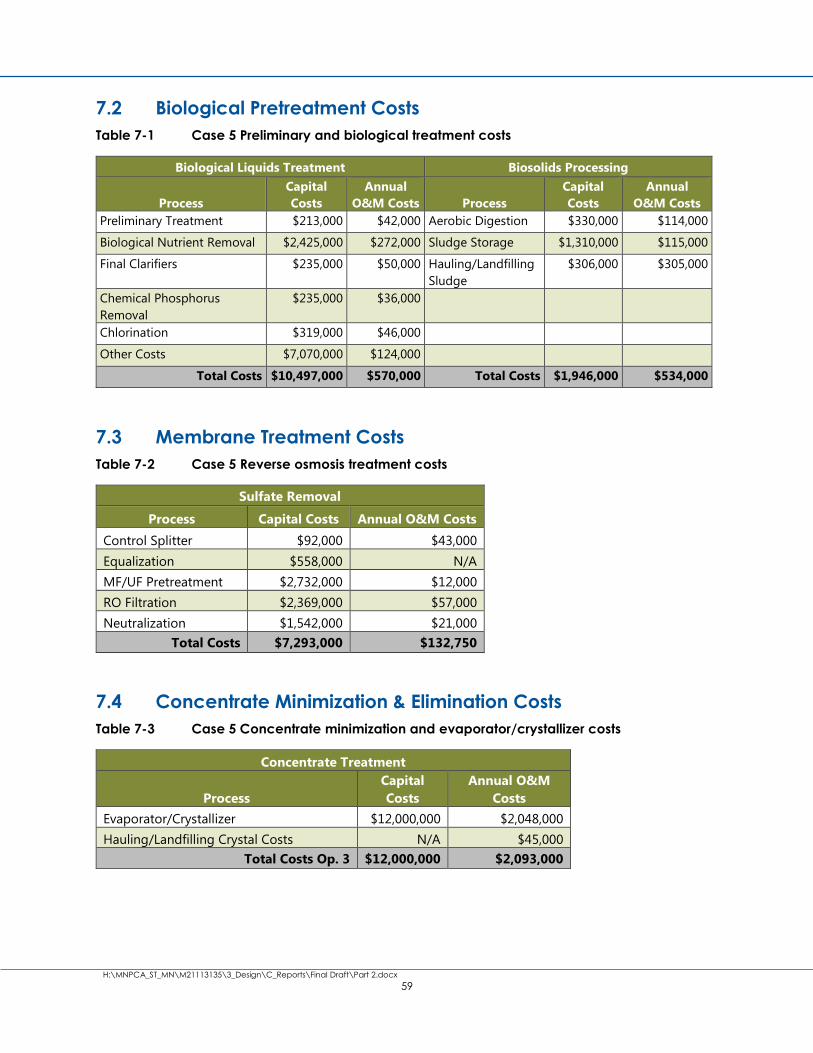
H:\MNPCA_ST_MN\M21113135\3_Design\C_Reports\Final Draft\Part 2.docx
59
7.2 Biological Pretreatment Costs
Table 7-1 Case 5 Preliminary and biological treatment costs
Biological Liquids Treatment Biosolids Processing
Process
Capital
Costs
Annual
O&M Costs Process
Capital
Costs
Annual
O&M Costs
Preliminary Treatment $213,000 $42,000 Aerobic Digestion $330,000 $114,000
Biological Nutrient Removal $2,425,000 $272,000 Sludge Storage $1,310,000 $115,000
Final Clarifiers $235,000 $50,000 Hauling/Landfilling
Sludge
$306,000 $305,000
Chemical Phosphorus
Removal
$235,000 $36,000
Chlorination $319,000 $46,000
Other Costs $7,070,000 $124,000
Total Costs $10,497,000 $570,000 Total Costs $1,946,000 $534,000
7.3 Membrane Treatment Costs
Table 7-2 Case 5 Reverse osmosis treatment costs
Sulfate Removal
Process Capital Costs Annual O&M Costs
Control Splitter $92,000 $43,000
Equalization $558,000 N/A
MF/UF Pretreatment $2,732,000 $12,000
RO Filtration $2,369,000 $57,000
Neutralization $1,542,000 $21,000
Total Costs $7,293,000 $132,750
7.4 Concentrate Minimization & Elimination Costs
Table 7-3 Case 5 Concentrate minimization and evaporator/crystallizer costs
Concentrate Treatment
Process
Capital
Costs
Annual O&M
Costs
Evaporator/Crystallizer $12,000,000 $2,048,000
Hauling/Landfilling Crystal Costs N/A $45,000
Total Costs Op. 3 $12,000,000 $2,093,000

60
Page intentionally left blank
61
8.0 Case Study 6
8.1 0.5 MGD Stabilization Pond Treatment Facility
See a process flow diagram for a 0.5 MGD stabilization pond on the following page.
Many of the smaller systems are served by controlled discharge facultative stabilization ponds. It is not
practical to attempt to treat the effluent from these systems during discharge. The system will discharge
180 days of stored/treated water in a short period of time. Treatment of this discharge would result in an
extremely oversized sulfate removal system. It is suggested that these systems should be thought of in
the context of mass removed rather than treating the effluent from the system to a specific treatment
target (effluent concentration). This mass removal can be accomplished using RO/NF. In a typical three
cell treatment system with two primary ponds and a secondary pond, the RO/NF system can be set so
that it extracts water from the second primary pond or the secondary pond. Either a rapid sand filter or a
MF/UF module followed by the RO/NF system would remove the sulfate, and then discharge the water
back into the head of the facultative pond system.
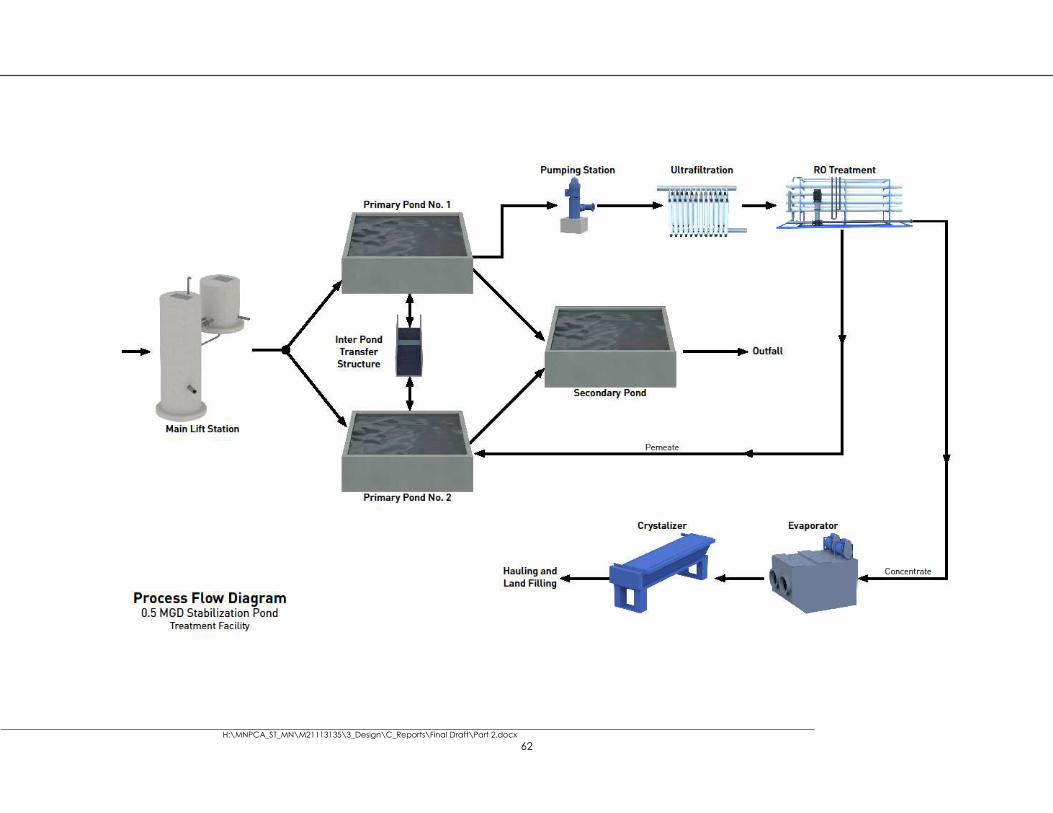
H:\MNPCA_ST_MN\M21113135\3_Design\C_Reports\Final Draft\Part 2.docx
62

H:\MNPCA_ST_MN\M21113135\3_Design\C_Reports\Final Draft\Part 2.docx
63
8.2 Biological Pretreatment Costs
Table 8-1 Case 6 Preliminary and biological treatment costs
Biological Liquids Treatment
Process
Capital
Costs
Annual
O&M Costs
Ponds $13,000,000 $72,000
Control Structures/Lift Station $1,000,000 $24,000
Total Costs $14,000,000 $96,000
8.3 Membrane Treatment Costs
Table 8-2 Case 6 Reverse osmosis treatment costs
Sulfate Removal
Process Capital Costs Annual O&M Costs
UF Pretreatment $2,732,000 $12,000
RO Filtration $1,360,000 $57,000
RO Permeate Treatment $1,360,000 $19,000
Total Costs $5,452,000 $88,000
8.4 Concentrate Minimization & Elimination Costs
Table 8-3 Case 6 Concentrate minimization and evaporator/crystallizer costs
Concentrate Treatment
Process Capital Costs Annual O&M Costs
Crystallizer $13,000,000 $2,417,000
Hauling/Landfilling Crystal Solids N/A $62,000
Total Costs $13,000,000 $2,479,000

64
Page intentionally left blank

65
9.0 Summary
9.1 Costs Associated with Treating Municipal Wastewater Effluent
to Remove Sulfate
See the following pages for Table 9-1, cost summary table.

66
Page intentionally left blank

H:\MNPCA_ST_MN\M21113135\3_Design\C_Reports\Final Draft\Part 2.docx
67
Table 9-1 Cost summary table
Case Overview
Biological Liquids Treatment Biosolids Processing Sulfate Removal Concentrate Treatment
Total Capital Costs
Total 20-Year O&M Costs
20-Year Present Worth
20-Year Costs
Annualized Process Capital Costs
Annual O&M Costs
Process Capital Costs
Annual O&M Costs
Process Capital Costs
Annual O&M Costs
Process Capital Costs
Annual O&M Costs
Case 1
Activated Sludge Influent Flow: 10
MGD Sulfate Influent-
Effluent Required: 100 mg/L-10 mg/L
Preliminary Treatment
$1,030,000 $171,050
Gravity Belt Thickener $1,540,000 $40,860
Control Splitter $326,000 $133,680
Lime Softening, UF/RO (Option 1) $16,000,000 $4,920,000
Primary Clarifiers
$673,000 $109,430
Anaerobic Digestion $3,850,000 $211,200 Equalization $1,705,000 N/A
Evaporator/Crystallizer (Op. 1) $18,000,000 $8,604,000
Biological Nutrient Removal
$5,470,000
$855,800 Belt-Filter Press $914,000 $100,950 MF/UF Pretreatment $14,647,500 $247,543
Hauling/Landfilling Crystal Solids (Op. 1) N/A $508,974
Phosphorus Removal
$235,000 $46,900 Sludge Storage $2,700,000 $332,900 RO Filtration $15,112,500 $1,131,500
Pellet Softening, RO (Option 2) $6,500,000 $1,550,000
Final Clarifiers $1,040,000 $158,170
Hauling/Landfilling Sludge $1,050,000 $6,320,000 Neutralization $2,030,000 $110,190
Evaporator/Crystallizer (Op. 2) $22,000,000 $12,377,500
UV Disinfection
$1,030,000 $59,850
Hauling/Landfilling Crystal Solids (Op. 2) N/A $670,182
Other Costs $15,100,000 $1,250,000
VSEP Concentrator (Option 3) $52,708,000 $3,920,000
Crystallizer (Op. 3) $12,600,000 $2,310,750
Hauling/Landfilling Crystal Solids (Op. 3) N/A $647,379
Total Costs $24,578,000 $2,651,200 Total Costs $10,054,000 $7,005,910 Total Costs $33,821,000 $1,622,913
Total Costs Op. 1 $34,000,000 $14,032,974 $102,453,000 $408,298,642 $510,751,642 $25,537,582
Total Costs Op. 2 $28,500,000 $14,597,682 $96,953,000 $417,407,382 $514,360,382 $25,718,019
Total Costs Op. 3 $65,308,000 $6,878,129 $133,761,000 $292,890,992 $426,651,992 $21,332,600
Case 2
Trickling Filter Influent Flow: 2.5
MGD Influent-Effluent Required Sulfate: 25 mg/L-10 mg/L
Preliminary Treatment $511,000 $75,750
Gravity Belt Thickener $808,000 $9,645
Control Splitter $144,000 $60,210 Evaporator/Crystallizer $16,250,000 $3,378,000
Primary Clarifiers $322,000 $58,047
Anaerobic Digestion $1,750,000 $104,390 Equalization $1,007,500 N/A
Hauling/Landfilling Crystal Solids N/A $100,020
Intermediate Pumping $175,000 $52,140 Belt-Filter Press $808,000 $23,858
MF/UF Pretreatment $4,417,500 $61,886
Trickling Filters $1,040,000 $96,250 Sludge Storage $1,950,000 $196,300 RO Filtration $4,365,188 $282,875
Final Clarifiers $463,000 $78,302
Hauling/Landfilling Sludge $398,000 $1,475,800 Neutralization $1,813,500 $43,750
Phosphorus Removal $235,000 $45,230
UV Disinfection $875,000 $42,790
Other Costs $15,100,000 $182,000
Total Costs $18,721,000 $630,509 Total Costs $5,714,000 $1,809,993 Total Costs $11,747,688 $448,721 Total Costs $16,250,000 $3,478,020 $52,432,688 $102,703,630 $155,136,318 $7,756,816
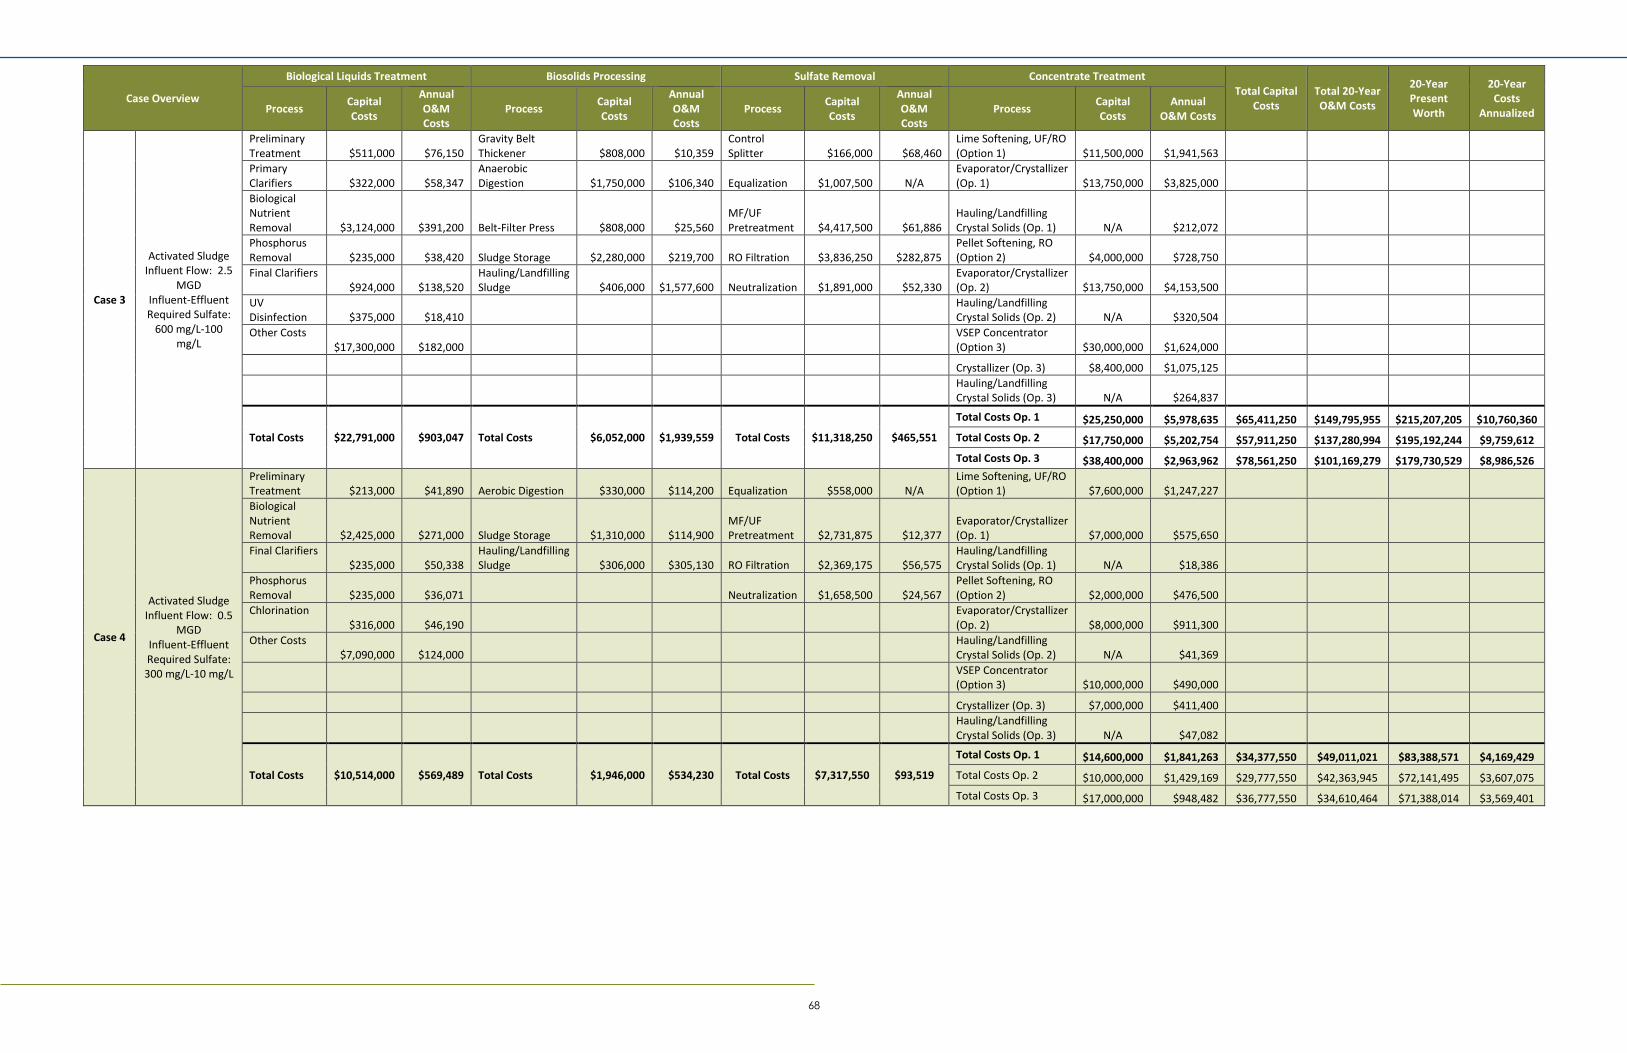
68
Case Overview
Biological Liquids Treatment Biosolids Processing Sulfate Removal Concentrate Treatment Total Capital
Costs Total 20-Year O&M Costs
20-Year Present Worth
20-Year Costs
Annualized Process Capital Costs
Annual O&M Costs
Process Capital Costs
Annual O&M Costs
Process Capital Costs
Annual O&M Costs
Process Capital Costs
Annual O&M Costs
Case 3
Activated Sludge Influent Flow: 2.5
MGD Influent-Effluent Required Sulfate:
600 mg/L-100 mg/L
Preliminary Treatment $511,000 $76,150
Gravity Belt Thickener $808,000 $10,359
Control Splitter $166,000 $68,460
Lime Softening, UF/RO (Option 1) $11,500,000 $1,941,563
Primary Clarifiers $322,000 $58,347
Anaerobic Digestion $1,750,000 $106,340 Equalization $1,007,500 N/A
Evaporator/Crystallizer (Op. 1) $13,750,000 $3,825,000
Biological Nutrient Removal $3,124,000 $391,200 Belt-Filter Press $808,000 $25,560
MF/UF Pretreatment $4,417,500 $61,886
Hauling/Landfilling Crystal Solids (Op. 1) N/A $212,072
Phosphorus Removal $235,000 $38,420 Sludge Storage $2,280,000 $219,700 RO Filtration $3,836,250 $282,875
Pellet Softening, RO (Option 2) $4,000,000 $728,750
Final Clarifiers $924,000 $138,520
Hauling/Landfilling Sludge $406,000 $1,577,600 Neutralization $1,891,000 $52,330
Evaporator/Crystallizer (Op. 2) $13,750,000 $4,153,500
UV Disinfection $375,000 $18,410
Hauling/Landfilling Crystal Solids (Op. 2) N/A $320,504
Other Costs $17,300,000 $182,000
VSEP Concentrator (Option 3) $30,000,000 $1,624,000
Crystallizer (Op. 3) $8,400,000 $1,075,125
Hauling/Landfilling Crystal Solids (Op. 3) N/A $264,837
Total Costs $22,791,000 $903,047 Total Costs $6,052,000 $1,939,559 Total Costs $11,318,250 $465,551
Total Costs Op. 1 $25,250,000 $5,978,635 $65,411,250 $149,795,955 $215,207,205 $10,760,360
Total Costs Op. 2 $17,750,000 $5,202,754 $57,911,250 $137,280,994 $195,192,244 $9,759,612
Total Costs Op. 3 $38,400,000 $2,963,962 $78,561,250 $101,169,279 $179,730,529 $8,986,526
Case 4
Activated Sludge Influent Flow: 0.5
MGD Influent-Effluent Required Sulfate:
300 mg/L-10 mg/L
Preliminary Treatment $213,000 $41,890 Aerobic Digestion $330,000 $114,200 Equalization $558,000 N/A
Lime Softening, UF/RO (Option 1) $7,600,000 $1,247,227
Biological Nutrient Removal $2,425,000 $271,000 Sludge Storage $1,310,000 $114,900
MF/UF Pretreatment $2,731,875 $12,377
Evaporator/Crystallizer (Op. 1) $7,000,000 $575,650
Final Clarifiers $235,000 $50,338
Hauling/Landfilling Sludge $306,000 $305,130 RO Filtration $2,369,175 $56,575
Hauling/Landfilling Crystal Solids (Op. 1) N/A $18,386
Phosphorus Removal $235,000 $36,071 Neutralization $1,658,500 $24,567
Pellet Softening, RO (Option 2) $2,000,000 $476,500
Chlorination $316,000 $46,190
Evaporator/Crystallizer (Op. 2) $8,000,000 $911,300
Other Costs $7,090,000 $124,000
Hauling/Landfilling Crystal Solids (Op. 2) N/A $41,369
VSEP Concentrator (Option 3) $10,000,000 $490,000
Crystallizer (Op. 3) $7,000,000 $411,400
Hauling/Landfilling Crystal Solids (Op. 3) N/A $47,082
Total Costs $10,514,000 $569,489 Total Costs $1,946,000 $534,230 Total Costs $7,317,550 $93,519
Total Costs Op. 1 $14,600,000 $1,841,263 $34,377,550 $49,011,021 $83,388,571 $4,169,429
Total Costs Op. 2 $10,000,000 $1,429,169 $29,777,550 $42,363,945 $72,141,495 $3,607,075
Total Costs Op. 3 $17,000,000 $948,482 $36,777,550 $34,610,464 $71,388,014 $3,569,401
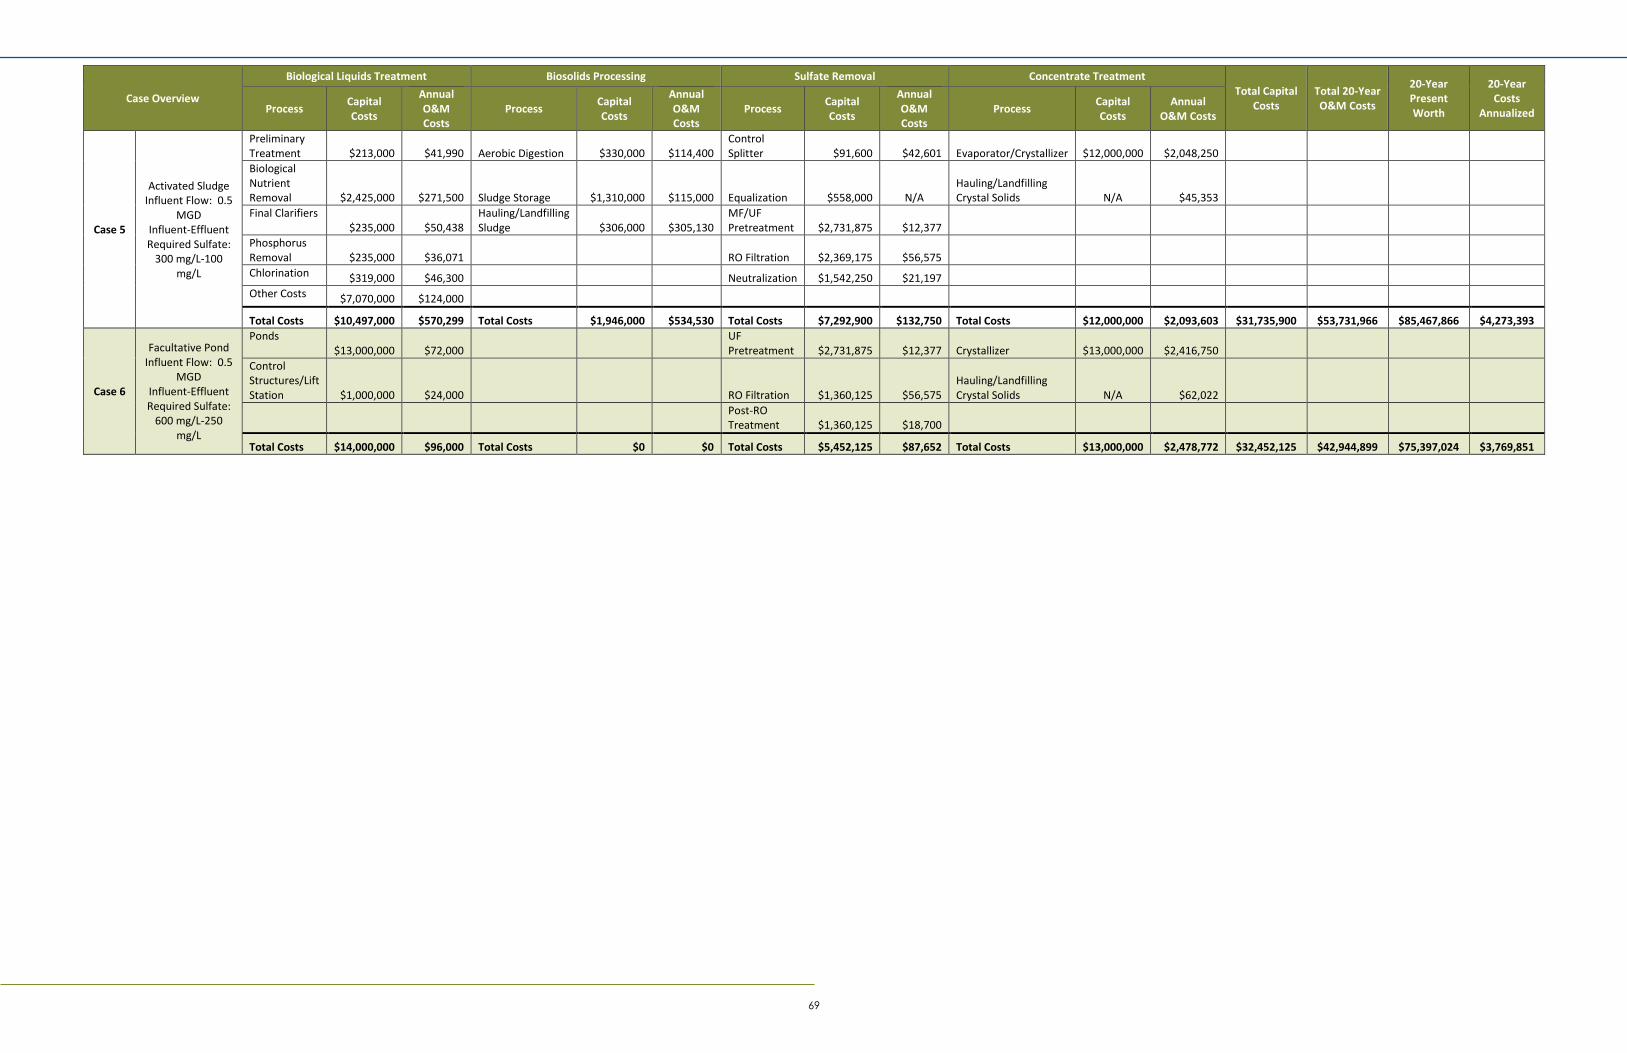
69
Case Overview
Biological Liquids Treatment Biosolids Processing Sulfate Removal Concentrate Treatment Total Capital
Costs Total 20-Year O&M Costs
20-Year Present Worth
20-Year Costs
Annualized Process Capital Costs
Annual O&M Costs
Process Capital Costs
Annual O&M Costs
Process Capital Costs
Annual O&M Costs
Process Capital Costs
Annual O&M Costs
Case 5
Activated Sludge Influent Flow: 0.5
MGD Influent-Effluent Required Sulfate:
300 mg/L-100 mg/L
Preliminary Treatment $213,000 $41,990 Aerobic Digestion $330,000 $114,400
Control Splitter $91,600 $42,601 Evaporator/Crystallizer $12,000,000 $2,048,250
Biological Nutrient Removal $2,425,000 $271,500 Sludge Storage $1,310,000 $115,000 Equalization $558,000 N/A
Hauling/Landfilling Crystal Solids N/A $45,353
Final Clarifiers $235,000 $50,438
Hauling/Landfilling Sludge $306,000 $305,130
MF/UF Pretreatment $2,731,875 $12,377
Phosphorus Removal $235,000 $36,071 RO Filtration $2,369,175 $56,575
Chlorination $319,000 $46,300 Neutralization $1,542,250 $21,197
Other Costs $7,070,000 $124,000
Total Costs $10,497,000 $570,299 Total Costs $1,946,000 $534,530 Total Costs $7,292,900 $132,750 Total Costs $12,000,000 $2,093,603 $31,735,900 $53,731,966 $85,467,866 $4,273,393
Case 6
Facultative Pond Influent Flow: 0.5
MGD Influent-Effluent Required Sulfate:
600 mg/L-250 mg/L
Ponds $13,000,000 $72,000
UF Pretreatment $2,731,875 $12,377 Crystallizer $13,000,000 $2,416,750
Control Structures/Lift Station $1,000,000 $24,000 RO Filtration $1,360,125 $56,575
Hauling/Landfilling Crystal Solids N/A $62,022
Post-RO Treatment $1,360,125 $18,700
Total Costs $14,000,000 $96,000 Total Costs $0 $0 Total Costs $5,452,125 $87,652 Total Costs $13,000,000 $2,478,772 $32,452,125 $42,944,899 $75,397,024 $3,769,851
70
Page intentionally left blank
H:\MNPCA_ST_MN\M21113135\3_Design\C_Reports\Final Draft\Part 2.docx
71
9.2 Retrofit Costs
Activity 2 is based on the assumption that the activated sludge treatment plant proceeding the RO is a
new BNR treatment plant. In a retrofit situation, the systems that would be considered are conventional
activated sludge, fixed film biotowers or trickling filters and stabilization ponds. If the activated sludge is
an existing BNR facility it may not have advanced tertiary filters. In that situation, a particle filter will have
to be added in addition to the equalization and RO/NF membrane systems. If sulfate management is the
only concern, an existing secondary or advanced secondary treatment plant will be acceptable with post
clarification solids removal (rapid sand filtration or UF) followed by the RO/NF. Either suspended growth
or fixed film will be acceptable. The main consideration in comparing the costs presented in Part 2 to the
costs of upgrading a BNR plant will be an increase in the O&M cost on the membranes due to a greater
potential for organic fouling if adequate pretreatment is not provided.
In all Cases, the membrane treatment will be similar to the membrane treatment for new construction.
Pretreatment will be required to allow the membranes to have a reasonable cleaning cycle and life
expectancy. The additional treatment that would be required between the existing technology and the
RO/NF system will include a shorter cycle time between clean-in-place and a full cleaning of the
membranes. The other additional cost will relate to the reduction in membrane flux rate due to a lower
water quality and a shorter life cycle for the membranes due to increased biofouling and siltation.
9.3 New Construction Costs
As mentioned in the previous section, all of the costs generated for this study assume construction of a
new treatment facility. Section 2.5 details the level of cost estimations developed and their various
sources. The costs include those for the equipment/processes themselves, as well as
construction/installation, supporting processes, piping, electrical/controls, and engineering/administrative
costs. Not presented in this report were the costs associated with purchasing the land to construct the
brand new facilities.
9.4 Operational Complexity
There are two issues that should be considered in contemplating impacts on staffing. The
biotowers/trickling filter plants (typically Class B and C operator license) and pond systems (typically Class
C and D operator license) will require an operator license below the highest rating. When the RO/NF
system is added to the treatment plant the licensing requirements will go to the highest level (A). In
addition, it is suggested that the 2.5 MGD activated sludge plant total operational staff may double, and
the license requirement for staff involved in working with the RO/Evaporative Condenser/ Crystallizer will
be at the highest level and will require significant advanced training. The Valero Welcome Ethanol Plant in
Welcome, MN ran a ZLD system for a period of time and has abandoned its use for internal recycle of
concentrate into their product. Operating the system is not trivial, but a larger question may be the
impact of this advanced technology on the pool of available operational professionals and the need for
improving operator training facilities to incorporate this information in existing curriculums. The existing
operator training programs train all of the pupils who come to them interested in treatment plant
operations. Questions to consider are how to expand this pool, and what will be the required time frame

72
to see a significant increase in operators on the high end of the licensure ladder. Also, what a utility will
have to pay these individuals to keep them in the smaller communities when there is a shortage and the
smaller utilities are in essence bidding against the large utilities for qualified individuals. Perhaps some
thought needs to be given as to how licensure is done in these systems.
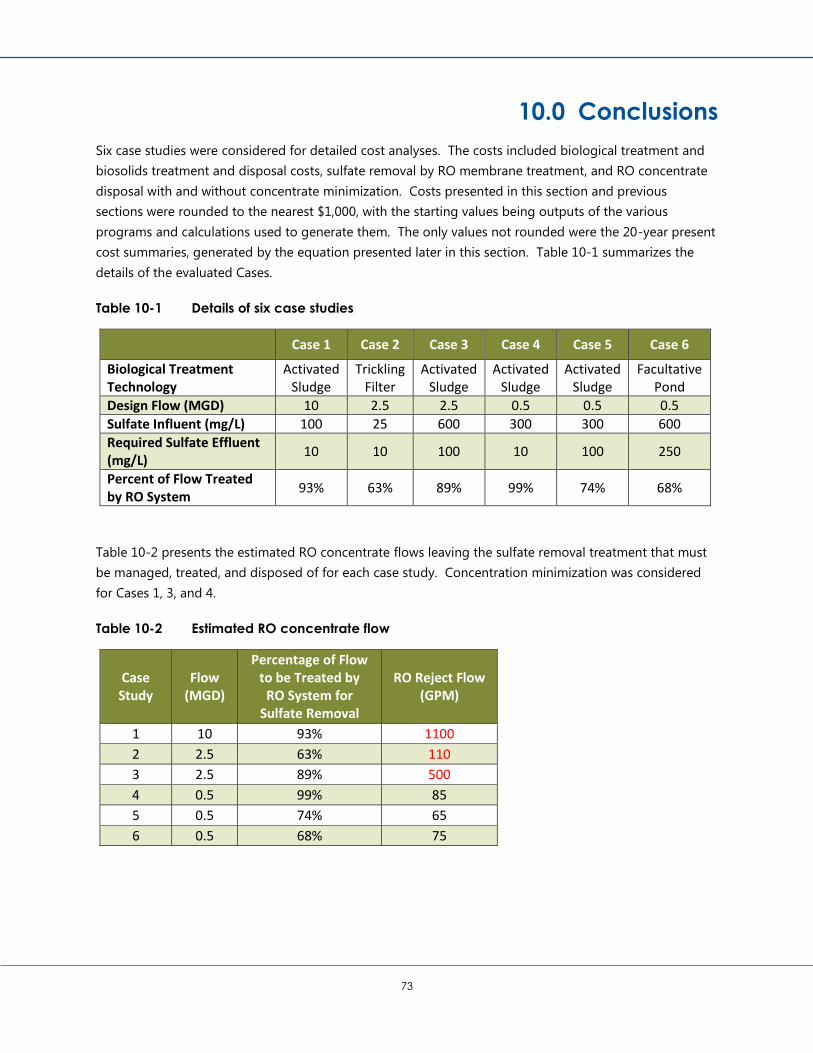
73
10.0 Conclusions
Six case studies were considered for detailed cost analyses. The costs included biological treatment and
biosolids treatment and disposal costs, sulfate removal by RO membrane treatment, and RO concentrate
disposal with and without concentrate minimization. Costs presented in this section and previous
sections were rounded to the nearest $1,000, with the starting values being outputs of the various
programs and calculations used to generate them. The only values not rounded were the 20-year present
cost summaries, generated by the equation presented later in this section. Table 10-1 summarizes the
details of the evaluated Cases.
Table 10-1 Details of six case studies
Case 1 Case 2 Case 3 Case 4 Case 5 Case 6
Biological Treatment Technology
Activated Sludge
Trickling Filter
Activated Sludge
Activated Sludge
Activated Sludge
Facultative Pond
Design Flow (MGD) 10 2.5 2.5 0.5 0.5 0.5
Sulfate Influent (mg/L) 100 25 600 300 300 600
Required Sulfate Effluent (mg/L)
10 10 100 10 100 250
Percent of Flow Treated by RO System
93% 63% 89% 99% 74% 68%
Table 10-2 presents the estimated RO concentrate flows leaving the sulfate removal treatment that must
be managed, treated, and disposed of for each case study. Concentration minimization was considered
for Cases 1, 3, and 4.
Table 10-2 Estimated RO concentrate flow
Case Study
Flow (MGD)
Percentage of Flow to be Treated by
RO System for Sulfate Removal
RO Reject Flow (GPM)
1 10 93% 1100
2 2.5 63% 110
3 2.5 89% 500
4 0.5 99% 85
5 0.5 74% 65
6 0.5 68% 75

74
Table 10-3 presents the biological treatment costs for liquid treatment and for the resulting biosolids.
Table 10-3 Estimated costs for biological treatment costs for liquid treatment and biosolids
Case
Study
Biological Liquids Treatment Biosolids Processing
Capital Costs
($) O&M Costs
($) Capital Costs
($) O&M Costs
($)
1 24,578,000 2,651,000 10,054,000 7,006,000
2 18,721,000 631,000 5,714,000 1,810,000
3 22,791,000 903,000 6,052,000 1,940,000
4 10,514,000 569,000 1,946,000 534,000
5 10,497,000 570,000 1,946,000 535,000
6 14,000,000 96,000 N/A N/A
Table 10-4 presents the costs for sulfate removal by RO membrane treatment process and concentrate
management and disposal costs by mechanical and thermal evaporative process. The ultimate disposal of
RO concentrate is to a municipal solid waste landfill as crystallized solid product.
Table 10-4 Estimated costs for sulfate removal by ro membrane treatment process and
concentrate management
Case
Study
Sulfate Removal Concentrate Treatment
Capital Costs
($) O&M Costs
($) Capital Costs
($) O&M Costs
($)
1 33,821,000 1,623,000
(1) 34,000,000
(2) 28,500,000
(3) 65,308,000
(1) 14,033,000
(2) 14,598,000
(3) 6,878,000
2 11,748,000 449,000 16,250,000 3,478,000
3 11,318,000 466,000
(1) 25,250,000
(2) 17,750,000
(3) 38,400,000
(1) 5,979,000
(2) 5,203,000
(3) 2,964,000
4 7,318,000 94,000
(1) 14,600,000
(2) 10,000,000
(3) 17,000,000
(1) 1,841,000
(2) 1,429,000
(3) 948,000
5 7,293,000 133,000 12,000,000 2,094,000
6 5,452,000 88,000 13,000,000 2,479,000
(1) Lime softening is used prior to secondary (concentrate reduction) RO treatment.
(2) Pellet softening is used prior to secondary (concentrate reduction) RO treatment.
(3) A VSEP concentrator process is used treat RO concentrate.

75
One additional subject of consideration during the development of this report was the theoretical
minimum cost of a sulfate removal system at a wastewater treatment facility with extremely low flows.
Table 10-5, below, shows the estimated capital costs for implementation of these processes at a 200,000
gpd plant, with the assumption that 90% of the daily flow would be treated by the processes. The base
level costs are dictated by the smallest crystallizer unit, which itself costs $8,000,000.
Table 10-5 Costs for Sulfate Removal at 200,000 GPD Facility
Process Capital Cost ($)
UF Pretreatment $1,700,000
RO Treatment $1,500,000
RO Permeate Treatment $800,000
Concentrate Disposal $8,000,000
Total $12,000,000
Figure 10-1 shows, solely for the Case 1 scenario, the total compiled costs over 20 years for construction
and operation of the concentration minimization and evaporative disposal processes, with the
comparative variable being the type of concentrate minimization process that is used.
Figure 10-1 Case 1 Concentrate Minimization Lifetime Cost Comparison

76
Present worth analysis was carried with discount rate of 5.375% and inflation rate of 3% using the
following equation:
Table 10-6 presents the summary of the total capital costs, O&M costs and a 20-year present cost for all
six case studies.
Table 10-6 Summary of the total capital costs, O&M costs and a 20-year present cost for all
six case studies
Case
Study
Total Capital Costs
($)
Total O&M Costs
($)
20-Year Present Costs
($)
1
(1) 102,453,000
(2) 96,953,000
(3) 133,761,000
(1) 25,313,000
(2) 25,878,000
(3) 18,158,000
(1) 510,751,642
(2) 514,360,382
(3) 426,651,992
2 52,433,000 6,367,000 155,136,318
3
(1) 65,411,000
(2) 57,911,000
(3) 78,561,000
(1) 9,287,000
(2) 8,511,000
(3) 6,272,000
(1) 215,207,205
(2) 195,192,224
(3) 179,730,529
4
(1) 34,378,000
(2) 29,778,000
(3) 36,778,000
(1) 3,039,000
(2) 2,626,000
(3) 2,146,000
(1) 83,388,571
(2) 72,141,495
(3) 71,388,014
5 31,736,000 3,331,000 85,467,866
6 32,452,000 2,662,000 75,397,024
(1) Lime softening is used prior to secondary (concentrate reduction) RO treatment.
(2) Pellet softening is used prior to secondary (concentrate reduction) RO treatment.
(3) A VSEP concentrator process is used treat RO concentrate.
77
For Cases 1, 3, and 4, three types of concentrate minimization treatment were considered: lime softening,
pellet softening, and VSEP treatment. Lime softening and pellet softening reduce the calcium in the RO
reject so that lime-softened water can be further treated by RO treatment to reduce the concentrate
volume that needs to be treated in the thermal evaporator and crystallizer for ultimate disposal. In
Figure 10-1 and Table 10-6 it can be seen that the 20-year present value cost is significantly lower for the
VSEP process for concentrate volume reduction compared to lime and pellet softening, although the VSEP
process has very high initial capital costs. No concentrate volume minimization was considered for Case 2,
Case 5 and Case 6. By comparing the present value costs for the life cycles of Cases 4 and 5, it becomes
apparent that concentrate volume reduction by lime softening does not provide adequate savings to
consider it in comparison to pellet softening or VSEP process.

78
Page intentionally left blank

79
11.0 References
1. U.S. Geological Survey. Ground Water Atlas of the United States. Iowa, Michigan, Minnesota, Wisconsin
(HA 730-J). Cambrian-Ordovician aquifer system. [Online] https://pubs.usgs.gov/ha/ha730/ch_j/J-
Cambrian.html.
2. Metcalf & Eddy. Water Reuse. [ed.] G. Tchobanoglous, et al. First. New York : McGraw Hill, 2007.
3. Zhang, L., Verstraete, W., Mendoza, M., Lu, Z., Liu, Y., Huang, G. and Cai, L. Decrease of dissolved
sulfide in sewage by powdered natural magnetite and hematite. Science of the Total Environment. 2016.
Vol. 573, pp. 1070-1078.
4. Zhang, L., De Schryver, P., De Gusseme, B., De Muynck, W., Boon, N. and Verstraete, W. Chemical
and biological technologies for hydrogen sulfide emission control in sewer systems: a review. Water
Research. January 2008. Vol. 42, (1-2), pp. 1-12.
5. Tchobanoglous, G. and Kreith, F. Handbook of Solid Waste Management. Second Edition. s.l. :
McGraw-Hill, 2002.
6. Stumm, W. and Morgan, J.J. Aquatic Chemisry. New York : John Wiley & Sons, 1981.
7. Silva, R., Cadorin, L. and Rubio, J. Sulphate ions removal from an aqueous solution: I. Co-precipitation
with hydrolysed aluminum-bearing salts. Minerals Engineering. 2010. Vol. 23, pp. 1220-1226.
8. Shih, W., Yallaly, B., Marshall, M., Meyerhofer, J., Safely, J., Paxton, C. and Najm, I. Chino II
Desalter Concentrate Management via Innovative Byproduct Resale and Treatment. Membrane Residuals
Solutions - Fall 2013. s.l. : American Membrane Technology Association.
9. Samee, M. Biological Sulfate Reduction of Reverse Osmosis Brine Concentrate: Process Modeling and
Design. Dissertation presented to Faculty of the Graduate School, University of Southern California. May
2007.
10. Reahl, E.R. Half a Century of Desalination with Electrodialysis. GE Water & Process Tehnologies. 2006.
11. Mickova, I. Advanced Electrochemical Technologies in Wastewater Treatment Part I: Electrocoagulation.
American Scientific Research Journal for Engineering, Technology, and Sciences. 2015. Vol. 14, No. 2, pp.
233-257.
12. Mickley, M. White Paper: Brackish Groundwater Concentrate Management. Mickley & Associates.
March 2010. Prepared for New Mexico State University and Consortium for High Technology Investigations
on Water and Wastewater.
13. Mackey, E.D., Seacord, T., Stringfield, D. and Carlo, P. Salinity Removal Cost Curves for Small to
Medium Size Water Wells and Wastewater Effluents. Technology 2005. s.l. : Water Environment Federation,
2005. pp. 539-557.

80
14. Lu, H., Wu, D., Feng, J., Ekama, G.A., van Loosdrecht, M.C.M. and Chen, G. The Demonstration of a
Novel Sulfur Cycle-Based Wastewater Treatment Process: Sulfate Reduction, Autotrophic Denitrification, and
Nitrification Integrated (SANI) Biological Nitrogen Removal Process. Biotechnology and Bioengineering.
November 2012. Vols. 109, No. 11.
15. Littlejohn, P., Kratochvil, D., Baker, B., and Fatula, P. Removal of Hardness and Sulfate from Flue
Gas Desulfurization Effluent Using Ion Exchange. 74th Annual International Water Conference. Orlando, FL :
s.n., November 2013.
16. Krapivina, M., Kurissoo, T., Blonskaja, V., Zub, S. and Vilu, R. Treatment of sulphate containing
yeast wastewater in an anaerobic sequence batch reactor. Proc. Estonian. Acad. Sci. Chem. 2007. Vol. 56, 1,
pp. 38-52.
17. Koeman-Stein, N.E., Creusen, R.J.M., Zijlstra, M., Groot, C.K., van den Broek, W.B.P. Membrane
Distrillation of Industrial Cooling Tower Blowdown Water. Water Resources and Industry. 2016. Vol. 14, 11-
17.
18. Kinser, K. and Sampson, D. (HDR). What are the options for ZLD? Jupiter, FL : s.n., May 10, 2017.
19. Howarth, R.W. and Stewart, J.B. The Interactions of Sulphur with other Element Cycles in Ecosystems.
Sulphur Cycling on the Continents. New York : John Wiley and Sons, Ltd., 1992.
20. Hao, T., Xiang, P., Mackey, H.R., Chi, K., Lu, H., Chui, H., van Loosdrecht, M.C.M., and Chen, G. A
review of biological sulfate conversions in wastewater treatment. Water Research. 2014. Vol. 65, I-21.
21. Greiner, F. and Hogan, J. Palm Coast Water Plant #2, Zero Liquid Discharge Process. Recovery Zone.
Spring 2016.
22. Greben, H.A., Matshusa, M.P. and Maree, J.P. The biological sulphate removal technology. 9th
International Mine Water Congress. 2005.
23. Ehrlich, H.L. Geomicrobiology. Journal of Basic Microbiology. 1981. Vol. 22, 6.
24. Bowell, R.J. A review of sulfate removal options for mine waters. Mine Water - 2004. s.l. : SRK
Consulting, Windsor Court, 1 Windsor Place, Cardiff CF10 3BX, Wales.
25. Bologo, V., Maree, J.P. and Louw, W.J. Treatment of Mine Water for Sulphate and Metal Removal
Using Magnesium Hydroxide and Barium Hydroxide. s.l. : Tshwane University of Technology; Pretoria, South
Africa.
26. Banerjee, K., Kronebusch, H., Buisson, H., Dambrosio, C. and Robinson, C. Comparison of advanced
and conventional technologies for low level sulfate reduction from mine water. s.l. : Veolia Water
Technologies.

81
27. Ashoor, B.B., Mansour, S., Giwa, A., Dufour, V., and Hasan, S.W. Principles and applications of
direct contact membrane distillation (DCMD): A comprehensive review. Desalination. November 2016. Vol.
398, pp. 222-246.
28. Veolia Water Technologies. Zero Liquid Discharge (ZLD) Systems, HPD® Evaporation and
Crystallization. [Fact Sheet]. 2016.
29. —. ZDD - Zero Discharge Desalination. [Brochure]. 2017.
30. El Paso Water. Water: Setting the Stage for the Future. El Paso Water. [Online] [Cited: June 23, 2017.]
www.epwu.org/water/desal_info.html.
31. Lorax Environmental. Treatment of Sulphate in Mine Effluents. s.l. : International Network for Acid
Prevention, October 2003.
32. American Water Works Association. Reverse Osmosis and Nanofiltration. Denver, CO : s.n., 2007.
Vols. Manual of Water Supply Practices-M46, 2nd Edition.
33. U.S. Department of the Interior-Bureau of Reclamation. Reclamation - Managing Water in the West,
Advanced Water Treatment Prize Competitions, Turning Clean Water Innovation into a Global Sporting
Event. s.l. : Water Environment & Reuse Foundation, January 9, 2017.
34. Enviro Water Minerals Company. Projects: El Paso, TX - EWM P1. EWM Enviro Water Minerals
Company. [Online] [Cited: June 23, 2017.] http://envirowaterminerals.com/projects.html.
35. United States Depatment of Labor. Occupational Safety and Health Administration - Hydrogen
Sulfide. [Online] [Cited: June 20, 2017.] https//www.osha.gov/SLTC/hydrogensulfide/hazards.html.
36. U.S. Department of the Interior-Bureau of Reclamation. More Water, Less Concentrate - Stage 1.
Reclamation - Managing Water in the West. [Online] [Cited: June 23, 2017.]
https://www.usbr.gov/research/challenges/morewater.html.
37. The Office of the Revisor of Statutes. Minnesota Administrative Rules, Ch. 7050, Waters of the State,
Minnesota Pollution Control Agency. [Online] [Cited: June 20, 2017.]
https://www.revisor.mn.gov/rules/?id=7050.
38. General Electric Power & Water - Water and Process Technologies. Many Municipalities Tap into
Benefits of EDR Water Treatment. [Fact Sheet]. June 2013.
39. Veolia Water Technologies. LoSO4™ Sulfate Reduction Technology for Mine Water. [Fact Sheet]. n.d.
40. Barr Engineering Co. Ion Exchange Bench Test Report - Dunka Mining Area; NPDES Permit No. MN
0042579. Prepared for Cliffs Erie LLC. September 2011.
41. BioteQ. Industrial Solutions. [Brochure]. Vancouver, British Columbia : s.n., [n.d.].
82
42. Hong Kong University of Science and Technology. Executive Summary: Large-Scale Study on
Realization and Application of SANI Process in Sewage Treatment in Hong Kong. September 2015.
43. Coaltech 2020. Evaluation of New and Emerging Mine Water Treatment Technologies - Part D,
Evaluation of the Savmin Sulphate Removal Process. [n.d.].
44. Barr Engineering Co. Engineering Cost Analysis of Current and Recently Adopted, Proposed, and
Anticipated Changes to Water Quality Standards and Rules for Municipal Stormwater and Wastewater
Systems in Minnesota. Minneapolis, MN : s.n., January 2017.
45. Minnesota Pollution Control Agency. Draft - Cost Analysis Components of Regulatory Analysis,
Proposed Sulfate Standard for Protection of Wild Rice. December 2016.
46. Water Environment Federation. Design of Municipal Wastewater Treatment Plants: WEF Manual of
Practice No. 8, ASCE Manuals and Reports on Engineering Practice No. 76, Fifth Edition. s.l. : McGraw-Hill
Education, 2010.
47. U.S. Department of the Interior - Bureau of Reclamation. Brine-Concentrate Treatment and
Disposal Options Report; Southern California Regional Brine-Concentrate Management Study-Phase I,
Lower Colorado Region. October 2009.
48. Archer Daniels Midland. A Better Mousetrap: Minimizing Cost and Operational Risk in Water and
Wastewater Reverse Osmosis. [PowerPoint]. 2017.
49. Reinsel, M. Biological Treatment at Kinross' Kettle River Operations. Northwest Mining Association
Annual Meeting. [Presentation]. September 25, 2013.
50. Dow. Separation of Sulfur from Liquid or Vapor. Dow. [Online] [Cited: June 24, 2017.]
http://www.dow.com/en-us/water-and-process-solutions/resources/periodic-table/sulfur.
51. Desalitech. High Recovery Reverse Osmosis Water Treatment for Industrial & Municipal Applications.
2017.
52. Alkhudhiri, A., Darwish, N. and Hilal, N. Membrane distillation: a comprehensive review.
Desalination. February 15, 2012. Vol. 287, pp. 2-18.
53. New Logic Research, Inc. VSEP Technology. New Logic Research, Inc. [Online] [Cited: June 24, 2017.]
http://www.vsep.com/technology/index.htm..
54. Oasys Water. Technology - ClearFlo MBCx platform. Oasys Water. [Online] [Cited: June 24, 2017.]
http://oasyswater.com/solutions/technology/.
55. —. Markets - High Recovery Desalination. Oasys Water. [Online] [Cited: June 24, 2017.]
http://oasyswater.com/markets/.
56. Bilal, B.A. and Tributsch, H. Thermo-electrochemical reduction of sulfate to sulfide using a graphite
cathode. Journal of Applied Electrochemistry. October 1998. Vol. 28, 10, pp. 1073-1081.

83
57. Paques. SULFATEQ™. Paques - Leading in biological wastewater and gas treatment. [Online] [Cited:
June 24, 2017.] http://en.paques.nl/products/other/sulfateq.
58. Heartland Water Technology. Core Technologies. Heartland Water Technology. [Online] [Cited: June
24, 2017.] http://www.heartlandtech.com/about/core-technologies/.
59. —. Industry Solutions. Heartland Water Technology. [Online] [Cited: June 24, 2017.]
http://www.heartlandtech.com/category/solutions/.
60. Gonzalez, A., Urtiaga, A.M., Ibanez, R. and Ortiz, I. State of the art and review on the treatment
technologies of water reverse osmosis concentrates. Water Research. 2012. Vol. 46, pp. 267-283.
61. Veolia Water Technologies. MBD™ Modular Brine Crystallization System, HPD® Evaporation and
Crystallization. [Fact Sheet]. 2015.
62. Xu, P., Bellona, C. and Drewes, J. Fouling of nanofiltration and reverse osmosis membranes during
municipal wastewater reclamation: Membrane autopsy results from pilot-scale investigations. Journal of
Membrane Science. s.l. : Elsevier B.V., 2010. Vol. 353, pp. 111-121.
63. Metcalf & Eddy. Wastewater Engineering: Treatment and Reuse. Fourth Edition. s.l. : McGraw-Hill,
2003.
64. Grounds, T., Midgley, H.G. and Nowell, D.V. The use of thermal methods to estimate the state of
hydration of calciumtrisulphoaluminate hydrate 3CaO·Al2O3·3CaSO4·nH2O. Thermochimica Acta. April
1985. Vol. 85, pp. 215-218.
65. Tang, F., Hu, H.Y., Sun, L.J., Wu, Q.Y, Jiang, Y.M., Guan, Y.T. and Huang, J.J. Fouling of reverse
osmosis membrane for municipal wastewater reclamation: Autopsy results from a full-scale plant.
Desalination. 2014. Vol. 349, pp. 39-73.
68. The Office of the Revisor of Statutes. Minnesota Administrative Rules, Ch. 7060, Waters of the State,
Minnesota Pollution Control Agency. [Online] [Cited: February 21, 2018.]
https://www.revisor.mn.gov/rules/?id=7060.
69. Alspach, B. and Juby, G. Cost-Effective ZLD Technology for Desalination Concentrate Management.
Journal AWWA. 2018. Vol. 110:1, pp. 37-47.
70. Lozier, J., Erdal, U., Lynch, A., and Schindler, S. Evaluating Traditional and Innovative Concentrate
Treatment and Disposal Methods for Water Recycling at Big Bear Valley, California. Proceedings of the
Water Environment Federation. 2007. 1329-1350.
71. Dilallo, P. “Re: Brine Concentrator Vs Crystallizer.” Suez Water Technologies & Solutions. Received by
Herman Dharmarajah, 11 Sept. 2017.
72. Mickley, M. Survey of High-Recovery and Zero Liquid Discharge Technologies for Water Utilities.
Mickley & Associates. 2008. Sponsored and published by the WateReuse Foundation.
84
73. Gonzales, R. “Re: Silica Data in WWTP Effluent – Sulfate Removal Study.” Avista Technologies.
Received by Herman Dharmarajah, 5 Dec. 2017.
74. Young, W. “Re: SubCom Evaporator – Request for a budgetary estimate.” Inproheat Industries, Ltd.
Received by Herman Dharmarajah, 12 Dec. 2017.
75. Mickley, M. Treatment of Concentrate. Mickley & Associates. March 2008. Prepared for the U.S.
Department of the Interior – Bureau of Reclamation for the Desalination and Water Purification Research
and Development Program.
76. AACE International. AACE International Recommended Practice No. 18R-97: Cost Estimate
Classifications System – As Applied in Engineering, Procurement, and Construction for the Process Industries.
TCM Framework: 7.3 – Cost Estimating and Budgeting. 2005.
77. Stevens, D. “Re: Projection for tert wastewater sulfate reduction project.” Dow Water & Process
Solutions. Received by Herman Dharmarajah, 24 Aug. 2017.
78. Drinking Water Advisory: Consumer Acceptability Advice and Health Effects Analysis on Sulfate; EPA
Report 822-R-03-007 February 2003. Accessed at www.epa.gov/safewater/ccl/pdf/sulfate.pdf.
79. Griffin, S., Schooley, K., Solomon, R., Orlando Utilities Commission. The Advantage of Mixed Salt
Crystallizers in Zero Liquid Discharge (ZLD) Wastewater Treatment Systems. Suez Water Technologies &
Solutions Technical Paper. 2017.
80. Sampson, D. ZLD Operation & Maintenance – Problems and Solutions. Modern Power Systems. 2009.
Vol. 29:12.
81. U.S. Environmental Protection Agency Office of Research and Development. Capsule Report:
Aqueous Mercury Treatment. 1997.


![Data Validation Charts for Aerosol Sulfate Definitions: Sulfate concentration: SO4fVal = [SO4]](https://cdn.vdocuments.us/doc/165x107/5681474d550346895db491a6/data-validation-charts-for-aerosol-sulfate-definitions-sulfate-concentration-5697209c43453.jpg)


