Download - An Eating Habit Study

An Eating Habit Study
December 2017
Factors that could influence female
adolescents to eat more fruits and
vegetables

2
3
CONTENTS
1 Summary 4
2 Introduction 5
2.1 Background 5
2.2 Objectives 5
3 Methodology 6
3.1 Data Collection 6
3.2 Individual Survey 6
3.3 Group Discussion 8
3.4 Ethnography 9
3.5 Time of data collection 10
4 Respondent Profiles 10
5 Findings 11
5.1 Eating habits among teens 11
5.2 Physical Activities among Teens 12
5.3 Media Consumption among Teens 12
6 Detailed Findings 13
6.1 Knowledge and Habits 13
6.2 Vegetable consumption 14
6.3 Fruit consumption 14
6.4 Barriers to Fruit and Vegetable Consumption 15
6.5 Eating behavior 16
6.5.1 Breakfast 17
6.5.2 Lunch 17
6.5.3 Dinner 18
6.5.4 Snacks 18
7 Sports and Physical Activities 20
7.1 Value of sport and physical activities 20
7.2 Sports habit 20
7.3 Other physical activities than sports 21
8 Pocket Money 22
9 Media Habits 23
9.1 Media usage 23
9.2 Health Campaign 23
9.3 Campaign contents 23
4
1 SUMMARY
WFP commissioned a market research
firm, IPSOS, to conduct a survey to
determine adolescent girls’ eating
habits, motivations for food choices
and media use.
The findings of the survey are
intended to shape a public health
campaign being implemented by the
Ministry of Health as part of the
Healthy Indonesia Movement (known
as GERMAS).
▪ Teens prefer fruits to vegetables,
because of the wide variety of sweet
and refreshing flavours. Fruits are
mostly consumed as snacks.
▪ Vegetables are considered side
dishes to a main meal. The preferred
way of eating is steamed and/or
spicy.
▪ At home, meals are mostly
consumed individually, not together
as a family around a dining table.
Often teens watch media on
smartphones, laptops or TV while
eating at home.
▪ At school, lunches mostly consist of
high-calorie, high-fat ingredients
with a few fruits or vegetables,
whether purchased at school or
brought from home.
▪ Many teens reported snacking
frequently throughout the day: on
the way to or from school, all day
long or in the middle of the night.
These respondents were more likely
to skip meals.
▪ Despite regulations and campaigns
limiting the sale of unhealthy foods
near schools, vendors sell mostly
highly-processed, unhealthy food
options.
▪ Fresh fruits were the favourite for 27
percent of respondents and cut fruit
for 21 percent. The top favourites
stood at 54 percent for meatballs
soup (known as bakso) or fried
snacks (known as gorengan).
▪ Objections to consuming more
vegetables included the taste, the
perceived lack of calories/energy
provided, and parents not
consuming them.
▪ Only 70 percent of teens receive
pocket money to spend on food
ranging from IDR 7,000 to 20,000
per day. They have considerable
purchasing power and are selective
in spending their money.
▪ All teens owned smartphones, and
used them to look for information,
entertainment and connecting with
friends. Animation was most
popular. Very few used TV,
magazines, newspapers or radio.
▪ Few teens could not recall any public
health media campaigns. When
probed, they cited Public Service
Advertisement (PSA) on TV about
health products such as milk for
people with diabetes. A very few
others recalled PSAs urging people
to stop smoking and promoting the
rubella vaccine.
▪ Key recommendations include the
following:
1. Choose either fruits or
vegetables to promote (because
the motivation for each is very
different).
2. Appeal to adolescent girls’
motivations: sweet, fresh taste;
good for your body and skin; fun
to share with friends.
3. Products are more memorable
than behaviour-oriented
messages.
4. Focus on digital media, especially
smartphone-friendly channels
and apps like YouTube,
Instagram and other social
media.
5. Animated media has broad
appeal to this demographic. Tone
should be attractive and casual.
5
2 INTRODUCTION
Background
“Balanced nutrition consists of
components which are: balanced in
quantity, quality, contain the calories,
protein, vitamins and minerals needed
to be healthy and active in daily lives
across all ages and physical conditions.”
Indonesia’s Ministry of Health
World Food Programme (WFP) and the
Government of Indonesia aim to
improve dietary diversity among
Indonesians through a multi-year
campaign to promote fruits and
vegetables consumption among female
adolescents (here, defined as 13-18
years old).
This study was undertaken to provide a
more in-depth analysis of all the factors
that influence female adolescents’
choices to eat fruits and vegetables,
which will be used to design an effective
communication campaign.
Specifically, this study seeks to
understand perception and experience
related to the frequency of fruit and
vegetable consumption, as well as
female adolescents’ perception towards
the “value” of fruits and vegetables.
Objectives
The objectives of this study include:
▪ To identify penetration of fruits and
vegetables by age group, gender,
Socio-Economic Status (SES) levels.
▪ To identify the frequency of buying
and consuming food outside home,
and the amount of money spent on
food items during the weekends and
weekdays.
▪ To assess the motivations of
adolescents in consuming fruits and
vegetables, including perceived
social desirability.
▪ To understand the dynamics behind
eating meals at home, including
fruits and vegetables.
▪ To understand the dynamics behind
adopting “pro-health” behavior,
including sports or other physical
activities.
▪ To understand the response towards
existing public health campaigns

6
3 METHODOLOGY
Data Collection
This study combined face-to-face survey
using a tablet device with a self-
completion mobile diary and a
Friendship Group Discussion, as well as
Ethnography among the same group of
respondents.
The objective of this series of
approaches is to build a rapport with
respondents during observation period
at the end of the study, to gain a
comprehensive understanding of actual
and perceived consumption patterns.
Individual Survey
Methodology Description and Target
Respondent
This survey was conducted through
face-to-face interviews using tablet
devices with selected respondents as
per defined criteria. The respondent
criteria included the age group between
13-18 years old, with the SES levels
(based on Nielsen criteria) of middle to
low-1. Gender composition was 80
percent female and 20 percent male
(detailed distribution for each criterion
is provided on the table below).
Sample Size
There were 72 respondents selected
according to the selection criteria of age
groups between 13-15 and 16-18 years
old, as well as by sex: female and male.
These respondents were recruited in the
cities of Bandar Lampung, Lampung
Tengah, Malang, Banyuwangi, Kendari
and Kolaka.
Coverage area
The study was conducted in one urban
and one rural location across three
provinces, with six locations in total.
The locations were selected based on
the total population and uniqueness of
the area.
Table 1. Sample Distribution
Province Status City/District Sample
Female Male Total
Lampung
Urban Bandar Lampung 8 4 12
Rural Lampung Tengah 8 4 12
East Jawa Urban Malang 8 4 12
Rural Banyuwangi 8 4 12
South East
Sulawesi
Urban Kendari 8 4 12
Rural Kolaka 8 4 12
Total 48 24 72

7
Table 2. Gender Profile
Gender Total Bandar
Lampung
Lampung
Tengah
Kendari Kolaka Banyuwangi Malang
Base 94 16 15 16 14 18 15
Boys 37% 38% 27% 56% 29% 39% 33%
Girls 63% 63% 73% 44% 71% 61% 67%
Table 3. Age Profile
Gender Total Bandar
Lampung
Lampung
Tengah
Kendari Kolaka Banyuwangi Malang
Base 94 16 15 16 14 18 15
13-15 y.o. 43% 50% 47% 44% 36% 33% 47%
16-18 y.o. 57% 50% 53% 56% 64% 67% 53%
Graphic 1. Grades
0%
5%
10%
15%
20%
25%
30%
Grade 1-6 Grade 7 Grade 8 Grade 9 Grade 10 Grade 11 Grade 12 College 1st
sem.
Recently
graduated
from
Grade 12
Which Grade?
Primary school
(known as SD)
Junior High School
(known as SMP)
Senior High School
(known as SMU)
Middle School
(known as SMK)
8
Group Discussion
Methodology
The Qualitative survey was conducted
using the Friendship Group Method,
where mini groups were established
which consist of four people in each
group who are familiar to each other.
Target Respondents
The respondents for the group
discussion are the same as those who
took part in the individual survey.
Coverage Areas
Target areas are the same location as
per the individual survey.
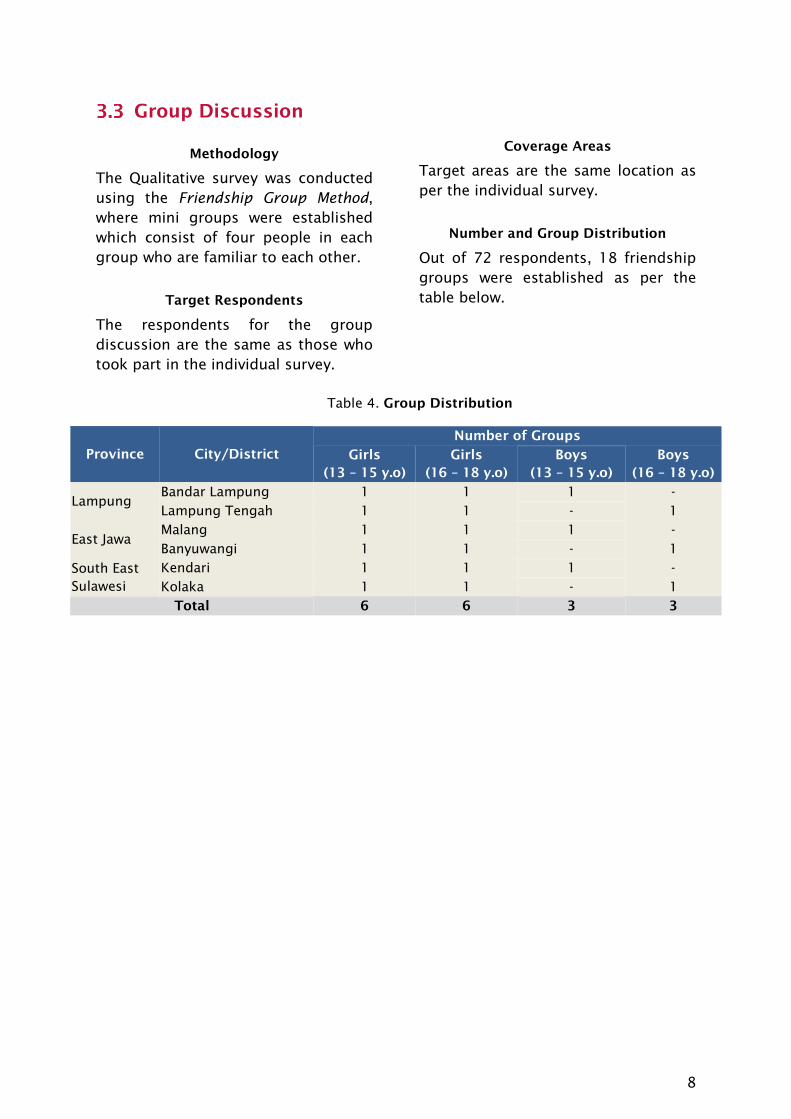
Number and Group Distribution
Out of 72 respondents, 18 friendship
groups were established as per the
table below.
Table 4. Group Distribution
Province City/District
Number of Groups
Girls
(13 – 15 y.o)
Girls
(16 – 18 y.o)
Boys
(13 – 15 y.o)
Boys
(16 – 18 y.o)
Lampung
Bandar Lampung 1 1 1 -
Lampung Tengah 1 1 - 1
East Jawa
Malang 1 1 1 -
Banyuwangi 1 1 - 1
South East
Sulawesi
Kendari 1 1 1 -
Kolaka 1 1 - 1
Total 6 6 3 3

9
Ethnography
Methodology
The Ethnography was conducted
across three provinces. Nine
respondents in each province were
selected for observation of ‘a Day in a
Life of the respondent’ from
preparation for the day (before
breakfast) up to last meal of the day,
as well as activities during the day that
might impact the eating pattern /
behavior.
Target Respondent
Respondents were identified to
capture a wide variety of eating
patterns and agreed to be involved in
the Ethnography.
Coverage Areas
The areas for Ethnography are the
same as the overall study coverage
areas.
Number of Respondents and Distribution
The Ethnography involved nine
individuals, as per the table below
Table 5. Ethnographer Distribution
Province City / District
Ethnographer Distribution
Girls
(13 – 15 y.o)
Girls
(16 – 18 y.o)
Boys
(13 – 15 y.o)
Boys
(16 – 18 y.o)
Lampung
Bandar Lampung 1 - - -
Lampung Tengah 1 - - 1
Jawa Timur
Malang - - 1 -
Banyuwangi 1 1 - -
Sulawesi
Tenggara
Kendari 1 - - -
Kolaka - 1 - 1
Total 4 2 1 2

10
Time of data collection
Data collection was conducted
from October to November 2017.
4 RESPONDENT
PROFILES
The gender, age, SES levels and
distribution coverage were pre-defined
with 80 percent of girls and
20 percent of boys, distributed between
urban and rural areas at 50:50. The
profile also include those within the
middle-1, 2 and Low-1 SES levels.
Age, Gender, City – Key Findings from Respondent Profiles:
✓ Mothers in urban areas rely mostly on street vendors for accesss to fresh vegetables
and fruits.
✓ Working mothers rely heavily on ready-to-eat food sellers for family meals.
✓ Rural mothers tend to grow or purchase fresh produce for their daily cooking supplies
of vegetables, fruits, herbs and others. This, however, resulted to less variety of meals.

11
5 FINDINGS
Eating habits among
teens
Eating patterns are attributed to
external and internal factors. External
factors including availability of food,
socio-economic status and awareness
of nutrition. Internal factors include
gender, age, body image, food
preference and degree of
independence. Among teens, food
consumption patterns change
constantly (Worthington-Robert and
Williams, 2000).
Teens reported consuming mostly food
with low in fibre and high in calories
and fat more than fruits and vegetables.
Younger teens (13-15 years old)
indicated their willingness to consume
fruits only when they taste good, while
older teens (16-18 years old) reported
consuming fruits
and vegetables when they are proven to
have some benefits for their body, in
particular, their skin (brighter and
smoother complexion, and to avoid /
cure acne and other skin problems).
Some girls in this age group also
mentioned consuming fruits and
vegetables to maintain their physical
appearance, particularly related to
helping them in losing weight through
fruits and vegetables-based diets.
Adolescents suggested that unhealthy
snacks are more readily available than
fruits and vegetables. Some of them are
aware of the needs for vitamins and
minerals, which can be sourced from
fruits and vegetables.
This is consistent with the fieldwork
findings that indicated preference,
attitude, knowledge and availability of
fruits and vegetables at home and
school heavily influenced the eating
habits of teens.
Graphic 2. Eating Motivation and Influencer for Teens’ Eating Behavior
Influencer
“Mom always force me to eat fruits
and vegetables.”
13 y.o. boy from Bandar Lampung
“No one wants to accompany me to
buy food in a clean place. I have to
join them to buy unhealthy food.”
14 y.o. girl from Lampung Tengah
✓ Nutrition Awareness
✓ Socio-Economic Status
✓ Availability at home and
school
✓ Gender
✓ Age
✓ Body image
✓ Self-efficiency
✓ Food preference
Motives
external
internal

12
Teens tend to consume more fruits than
vegetables. They expressed a higher
preference for consumption of fruits
than vegetables, as fruits were
considered tastier, and more
refreshing. In addition to eating fresh
fruits, there was a strong preference for
‘processed fruits’ such as fruit juice
and/or fruit salad. Fruit juice is more
widely available than fresh fruits as it is
sold more frequently by street vendors.
The most common fruits available at
home include bananas, watermelons,
melons and oranges. However, teens
are willing to try new things. Fruit juice
gives them the experience of taste and
texture which are considered important
by them.
Younger teens aged 13-15 years old
prefer fresh fruits much less that those
in the age group of 16-18 years old.
This appears to be linked to practicality.
For example, they prefer banana for
fruit snack as it is simpler and believed
to effectively re-charge their energy
after physical activities.
Physical Activities among
Teens
Most of the boys said that sports
outside of school is mandatory for
them. Many stated sports as a hobby
and an opportunity to hang-out /
socialize with friends. Meanwhile, girls
tend to explain that they are engaging
in sports mainly to maintain their
physical figure.
Teens aged 13-15 years old preferred
non-group sports such as badminton,
swimming or jogging. Older teens
prefered group sports such as
basketball, futsal or volleyball.
For teens aged 16-18 years old, sport
activities serve more as an opportunity
to mix with their peers.
Media Consumption
among Teens
‘High-speed connectivity’ in urban and
rural areas has replaced the need for
traditional media channels.
Smartphones have replaced TV, radio,
newspapers and magazines as the main
sources of information.

13
6 DETAILED FINDINGS
Knowledge and Habits
6.1.1 Respondent knowledge and
decision regarding daily menu
Most of the information about benefits
of fruits and vegetables are gained at
school and home, particularly through
mothers. Most respondents mentioned
benefits such as preventing anaemia,
boosting energy and improving skin
health.
The eating behavior at home is not
solely influenced by home-cooked
meals. However, mothers’ awareness of
healthy diets influence eating habits for
teens.
Graphic 3. Decision Makers for Meals Menu at Home
Decision Makers for Meals Menu at Home
Mother Request by other family members
87% 7%
My request Father
4% 1%

14
Vegetable Consumption
Respondents’ perception of vegetables
including towards green leafy
vegetables, beans and other nutritious
contents of soup, in general, found that
teens stood at moderate to high in term
of frequency of vegetable consumption.
However, they consume low quantities
each time, particularly those aged 13-
15 years old. Some reasons mentioned
include “the taste is bitter”, “you can
only consume it with rice and/or other
dishes”, and “strange texture in the
mouth.”
For green vegetables, respondents
prefer lalapan (raw, boiled or steamed
vegetables eaten with chili paste). While
for variation of colors they prefer to
have vegetables with cabai (chili),
spices, coconut milk or other
condiments with strong flavors.
The field study found vegetables are
considered as a complimentary food
and not a main dish. Most respondents
indicated they only eat vegetables when
they have no other options. Some
respondents, however, tried to include
vegetables in their meat-based dishes
with rice.
Fruit Consumption
Fruit consumption was high, especially
among the 16-18 years old teens.
Fruits are preferred over vegetables as
they also serve as refreshing snacks
helping to re-energize teens after
physical activities such as sports.
This age group defined fruits as banana
to boost energy, orange and mango for
dessert, expensive fruits such as
strawberries, grapes, and seasonal
fruits such as durian. Many preferred to
consume fruits as fruit juice and/or fruit
salad as they offer a variety of fruits
which they cannot find at home. Some
respondents dislike the fibre and seeds
in fruits, and many prefer to mix fruits
with sugar and milk.
Graphic 4. Preference for Fruit Consumption
Fruits Mean Score Scale of 1 to 10
Fresh fruits 8.10
Dry fruits 4.70
Canned fruits 4.59
Processed fruits 6.10
Dishes containing fruits 6.69
14% 29% 57%
64% 30%
6%
66% 23%
11%
37% 50%
13%
34% 40% 26%
15
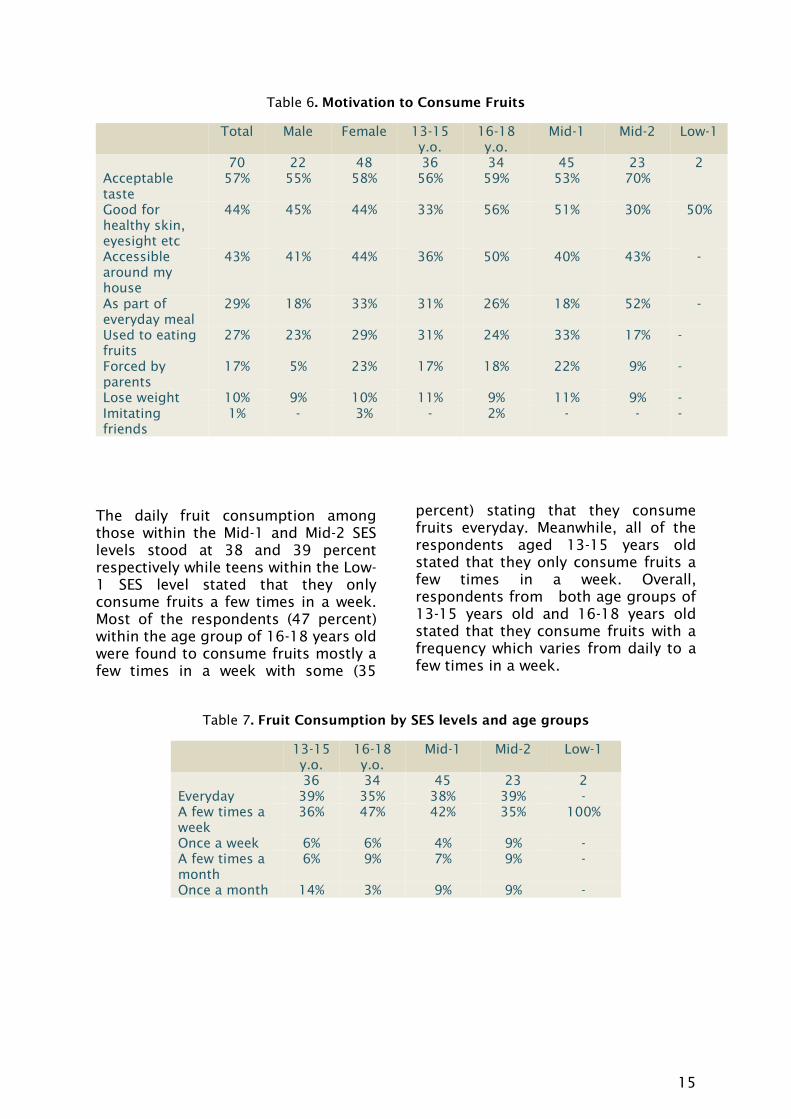
Table 6. Motivation to Consume Fruits
Total Male Female 13-15
y.o.
16-18
y.o.
Mid-1 Mid-2 Low-1
70 22 48 36 34 45 23 2
Acceptable
taste
57% 55% 58% 56% 59% 53% 70%
Good for
healthy skin,
eyesight etc
44% 45% 44% 33% 56% 51% 30% 50%
Accessible
around my
house
43% 41% 44% 36% 50% 40% 43% -
As part of
everyday meal
29% 18% 33% 31% 26% 18% 52% -
Used to eating
fruits
27% 23% 29% 31% 24% 33% 17% -
Forced by
parents
17% 5% 23% 17% 18% 22% 9% -
Lose weight 10% 9% 10% 11% 9% 11% 9% -
Imitating
friends
1% - 3% - 2% - - -
The daily fruit consumption among
those within the Mid-1 and Mid-2 SES
levels stood at 38 and 39 percent
respectively while teens within the Low-
1 SES level stated that they only
consume fruits a few times in a week.
Most of the respondents (47 percent)
within the age group of 16-18 years old
were found to consume fruits mostly a
few times in a week with some (35
percent) stating that they consume
fruits everyday. Meanwhile, all of the
respondents aged 13-15 years old
stated that they only consume fruits a
few times in a week. Overall,
respondents from both age groups of
13-15 years old and 16-18 years old
stated that they consume fruits with a
frequency which varies from daily to a
few times in a week.
Table 7. Fruit Consumption by SES levels and age groups
13-15
y.o.
16-18
y.o.
Mid-1 Mid-2 Low-1
36 34 45 23 2
Everyday 39% 35% 38% 39% -
A few times a
week
36% 47% 42% 35% 100%
Once a week 6% 6% 4% 9% -
A few times a
month
6% 9% 7% 9% -
Once a month 14% 3% 9% 9% -

16
Table 8. Vegetable Consumption by SES levels and age groups
13-15
y.o.
16-18
y.o.
Mid-1 Mid-2 Low-1
36 34 45 23 2
Everyday 39% 50% 47% 39% 50%
A few times a
week
25% 24% 22% 26% 50%
Once a week 3% - 2% - -
A few times a
month
19% 3% 9% 17% -
Once a month 3% 18% 9% 13% -
Barriers to Fruit and
Vegetable Consumption
Availability and visibility were the main
barriers to consumption by teens. In
rural areas, fruits and vegetables are
more easily accessible compared to
urban areas. This is mainly due to the
common use of kitchen gardens.
Limited household income prompts
families to prioritize ways to ensure
healthy meals. In the urban setting,
space is limited and mothers feel it is
too complicated to maintain kitchen
gardens.
Eating Behavior
The families of most respondents do
not have a proper dining table at home.
Meals are not always taken together by
family members. Teens often have their
meals anytime, anywhere including
while studying, checking media on
smartphone or laptop, or on their way
to/from school.
Picture 1. Eating activities at home

17
6.5.1 Breakfast
Different age groups have different
habits. For younger age group of 13-15
years old, breakfast at home is
mandatory; they eat whatever is
prepared for them at home before they
leave for school or weekend activities.
Older teens tend to decide whether to
eat breakfast at home or school. A more
in-depth study is needed to understand
what influences their decision-making
process. Some respondents brought
meals from home to eat during break
time, such as fried egg, fried rice, or
left-over food from the day before;
highly depending on mothers’ available
time to prepare food at home.
6.5.2 Lunch
Those aged 16-18 years old with an all-
day school routine usually brought their
meals from home. However,
respondents from the younger age
group prefer eating at the school
canteen; they said bringing food from
home was too heavy, and not practical.
Most teens in East Java province ate only
two meals a day. In other provinces,
teens aged 13-15 years old, usually had
lunch at home after school. This is
mainly intended to save their allowance
so that they can use their savings for
out-of-school activities and/or during
the weekends Although teens of 16-18
years old normally brought meals from
home, they regularly purchased snacks
from school canteens.
Graphic 5. Proportion of Teens who Brought Meals from Home

18
Boys aged 13-15 years old stated that
they did not bring meals from home
because it was not considered cool.
Many thought that bringing food from
home should stop after kindergarten.
Girls did not express this same concern.
6.5.3 Dinner
“I will eat when I’m hungry”. In general,
respondents have dinner between 6-
8pm with mostly the same menu as
lunch.
6.5.4 Snacks
Snacking is part of teen habits. On the
way to/from school, during the day,
before and after activities or even in the
midle of the night, Indonesian teens are
snacking.
Most consumed snacks which are fried
or processed.
Graphic 6. Most favorite Snacks
54%
53%
46%
39%
37%
33%
32%
31%
21%
24%
20%
17%
16%
14%
14%
14%
12%
10%
10%
Meatballs soup (known as Bakso)
Fried snacks (known as Gorengan)
an Indonesian steamed fish dumpling with
vegetables served in peanut sauce
Instant noodle
Any types of ice drinks and dessert
Fried meatballs and tofu in peanut sauce
(known as Batagor)
Cakes/Bread
Chicken noodle
Cut fruits
Crisp
Snacks with flour base
Processed vegetabnles
Cracker
a savoury fishcake delicacy (known as
Pempek)
Packed peanuts
Other type of cracker
Stuffed pancake with eggs and meat (known
as Martabak)
Instan noodle from food vendor
Chicken soup (known as soto)
Percentage
19
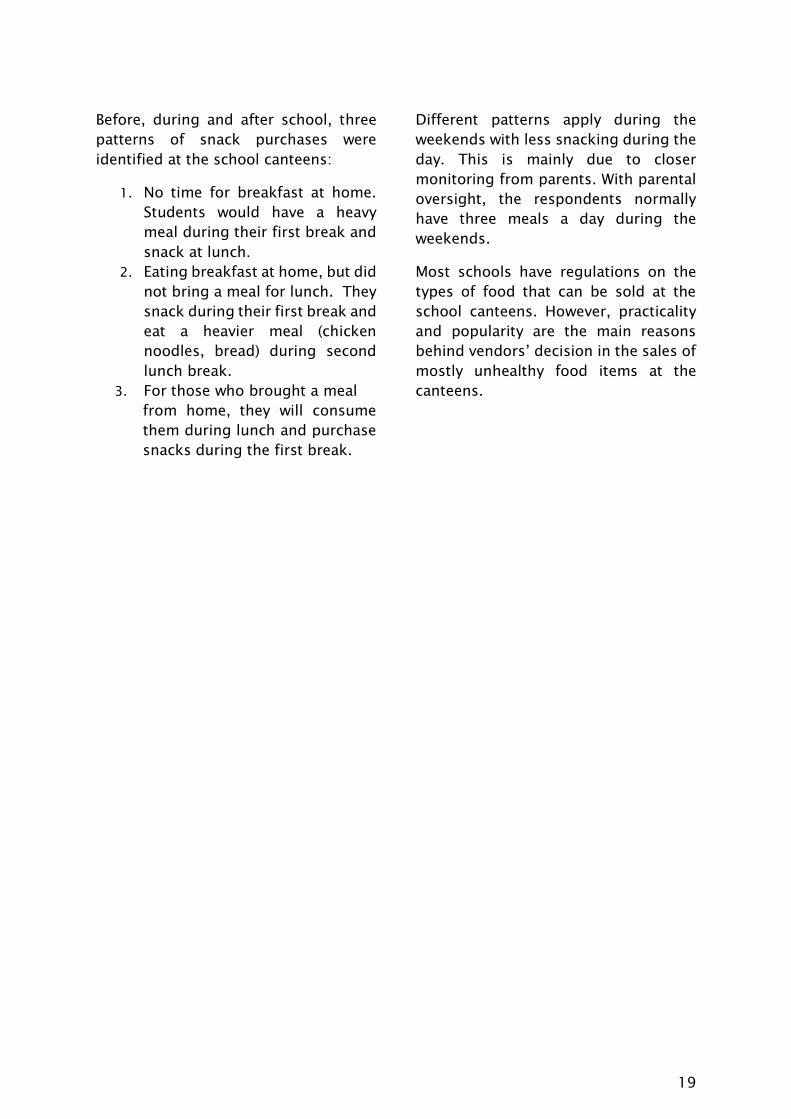
Before, during and after school, three
patterns of snack purchases were
identified at the school canteens:
1. No time for breakfast at home.
Students would have a heavy
meal during their first break and
snack at lunch.
2. Eating breakfast at home, but did
not bring a meal for lunch. They
snack during their first break and
eat a heavier meal (chicken
noodles, bread) during second
lunch break.
3. For those who brought a meal
from home, they will consume
them during lunch and purchase
snacks during the first break.
Different patterns apply during the
weekends with less snacking during the
day. This is mainly due to closer
monitoring from parents. With parental
oversight, the respondents normally
have three meals a day during the
weekends.
Most schools have regulations on the
types of food that can be sold at the
school canteens. However, practicality
and popularity are the main reasons
behind vendors’ decision in the sales of
mostly unhealthy food items at the
canteens.

20
7 SPORTS AND PHYSICAL
ACTIVITIES
Value of sport and
physical activities
The respondents were aware of the
long-term benefit of a healthy lifestyle
including sports, good eating behavior
and adequate rest.
Some respondents doubted whether
sport is essential to maintain good
health. They cited other physical
activities such as dancing, cleaning the
house, walking to or from school,
cooking, can also be considered as
‘maintaining good health and burning
calories.’
Sports habit
Early teens, in particular, boys, engaged
in more rigorous sport activities than
the older age group. The older age
group considered sport as an
opportunity to socialize with friends in
a healthy way and to make use of their
free time in a positive way.
Girls at the high school level stated that
they were too busy to do sport. Girls
within this age group prefer to socialize
with friends or simply resting at home.
The biggest motivation for them to do
sports included:
1. To be admired by their peers. Some
stated that this could also help in
attracting boys.
2. To avoid being bullied by keeping
their body in ‘ideal’ shape (slimmer
– so they look taller).
“Nobody will like me if I’m fat…boys
will not like me…people will mock
me…I will be bullied”
14 years old, Putri, Bandar
Lampung
3. To allow them to maintain their
weight while eating whatever they
want, especially favourite foods.
4. Group sports are preferred as this
provides a social network and
acknowledgement by their peers.
These sport activities include
basketball, volleyball and futsal.
“My friend is obsessed with
becoming a flag raiser during the
Independence Day, that’s why he
always go to the gym to maintain his
physical condition…he always insist
that I should come along…so if I’m
not playing futsal, then I would go to
the gym.”
15 years old, Putra, Lampung
Tengah
“I don’t like getting sweaty…it feels
weird. I have to shower after
engaging in sport activities.”
13 y.o Girl, Lampung Tengah

21
Other physical activities
than sports
The study concluded that the main
reason girls are not engaging in sport
activities include:
▪ They consider non-physical activities
more interesting, such as: reading,
sleeping, socializing, singing.
▪ Girls perceived that sports often
leads to muscle aches.
▪ They have never tried sport activities.
They tend to focus more on tutorial
classes after school.
▪ Girls often feel that sport is only
useful to help them in losing weight.
Hence, when they already feel skinny,
they avoid engaging in sport
activities.
▪ They would like to avoid getting
sweaty or smelly.
▪ They are already too tired from
school activities.
▪ Competing priorities with
responsibility to clean the house.
“I always wake up at 5
am…prepare for school, and arrive
at school by 7am…I’m too tired
with all of the activities I have to do
for the whole day to have to spend
time for sport.”
14 y.o Girl, Bandar Lampung
Most female teens considered any
physical activities such as housework
including washing, cleaning the house,
taking care of younger siblings, and
activities at school such as student
board, red cross, marching band, are
just the same as sport.
It is important to note one unique
example from South East Sulawesi
province where there is a common
perception among teens that “walking
to school” means he/she comes from
low income family. Although many
students are willing to do it, they often
avoid this to keep up appearance
among their peers, and therefore,
prefer to use public transport or motor
bike.

22
8 POCKET MONEY
Only 70 percent of the respondents
receive a regular allowance from their
parents, on a daily or weekly basis.
Some respondents receive monthly
allowance as they live far from the
parents. Respondents received between
IDR 7,000 up to IDR 20,000 per day.
For lower SES levels and younger age
group, this allowance is intended to
cover all expenses except school fees,
books etc. The older age group and
Middle SES levels, usually receive a
special allowance for the
weekends / social activities (outside of
school).
In general, the biggest portion of this
allowance is spent on food, followed by
phone credit and social activities.
All respondents stated that they
sometimes saved their allowance to buy
personal things such as clothes, food
and accessories.
With the right encouragement, these
youths have the potential to spend
more to purchase healthy food, i.e.
fruits and vegetables.

23
9 MEDIA HABITS
Media usage
There was no significant difference
found between urban and rural teens’
media usage. Conventional media
(radio, newspaper and magazine TV)
are no longer teens’ main source of
information and entertainment. Most of
them have switched to digital media
such as YouTube and/or other social
media channels. All respondents owned
smartphones. There are three
motivations for teens to access the
internet from their smartphones which
include searching for information
(related to school work), to get
connected with friends (old and new)
and for entertainment.
Respondents admitted that the social
media is addictive as it occupied most
of their time (some schools allow
students to bring smartphones to
class). The social media channels used
most frequently include Instagram,
Facebook, LINE, WhatsApp, and
Blackberry Messenger. Each is
associated with different use and
benefits. For instance, Facebook is
mostly used to browse for information
and friend’s activities, while Instagram
is mainly used to share updates of their
daily activities. Meanwhile, LINE and
WhatsApp are mostly used for regular
chats.
Health Campaign
Knowledge of Public Service
Advertisements (PSA) regarding health
was very low, especially in rural areas.
The health-related ads most readily
recalled were health products such as
milk for people with diabetes,
medicated oil, health soap etc. When
probed further, some mentioned PSAs
for Rubella vaccine, dangers of smoking
and drugs, as well as family planning.
Very few respondents were aware of the
Healthy Indoensia Campaign (known as
GERMAS), even though its activities
were held across all major cities in
Indonesia recently to commemorate the
National Health Day. Youths perceive
the previous PSAs as not attractive,
boring, too formal and too obvious. As
a result, teens are reluctant to watch the
ads and prefer to skip these ads.
Campaign contents
Based on the behaviours and
preferences expressed by the
respondents, a media campaign aimed
at promoting a more balanced diet
among female adolescents should
consider:
1. Choosing fruit or vegetables to
promote (because the motivation for
each is very different)
2. Appealing to adolescent girls’
motivations: sweet, fresh taste; good
for your body and skin; fun to share
with friends.
3. Refering to products rather than
behaviour-oriented messages.
4. Focusing on digital media especially
smart-phone friendly channels and
apps like YouTube, Instagram and
other social media.
5. Using animated media, which has
broad appeal to this demographic.
Tone should be attractive and
casual.


