
#3 LBCT- PANDA IIIA Prospective Randomized Trial of Two
Sirolimus-Eluting Bioresorbable-Polymer-Based
Metallic Stents With Varying Elution and
Absorption Kinetics
Main Arena III, Wednesday, Oct. 14Plenary Session XX. Late-Breaking Clinical Trials 3: Co-sponsored by JAMA
11:42 AM-11:52 AM, Wednesday, October 14th, 2015San Francisco, CA, USA
Bo Xu, MBBS; Runlin Gao, MD; Yuejin Yang, MD; Xuebin Cao, MD; Lei Qin, MD; Yi Li, MD; Zhanquan Li, MD; Xueqi Li, MD; Hailong Lin, MD;
Yong Guo, MD; Yitong Ma, MD; Jian’an Wang, MD; Shaoping Nie, MD; Liang Xu, MSc; Changdong Guan, MSc; Gregg W. Stone, MD
On behalf of PANDA III Investigators

Disclosure Statement of Financial Interest
• The study was funded by a research grant from
SinoMed (Tianjin, China)
• I, (Bo Xu) have no relevant conflicts of interest
to disclose

Background
• Whether the rate of drug elution and polymer absorption
affects clinical outcomes of biodegradable polymer-based
drug-eluting stents (DES) is unknown.
• The PLGA polymer-based BuMA sirolimus-eluting stent
(SES) has a unique design incorporating an electro-
grafting (eGTM) base layer between the polymer and stent
strut, securing adhesion of the PLGA coating. Sirolimus is
100% eluted within 30 days, and the PLGA polymer is
completely absorbed within 3 months.
• In contrast, the PLA polymer-based Excel SES elutes
sirolimus completely within 180 days, and the PLA
polymer is completely absorbed within 6-9 months.
• Both DES elute sirolimus from a stainless steel platform,
isolating major differences to the polymer and elution
kinetics.
BuMASinoMed, Tianjin, China
ExcelJWMS, Weihai, China

BuMA-OCT Trial80 patients were randomly assigned to receive either
BuMA (n=40) or Excel (n=40) SES
Primary Endpoint: Stent strut coverage evaluated with OCT at 3 months
Qian J et al, EuroIntervention 2014;10:806-814.
The randomized BuMA-OCT trial demonstrated that the BuMA SES was
superior to the Excel SES in stent strut coverage at 3-month follow-up
80
85
90
95
100
BuMA Excel
0.0
0.5
1.0
1.5
2.0
2.5
BuMA Excel
94.2%
90.0% 1.3%
1.8%
Difference (95% CI): 4.2% (3.7%-4.8%)
Pnon-inferiority<0.0001, Psuperiority<0.0001
P=0.51
Proportion of Covered Struts, % Proportion of Malapposed Struts, %

Objective
We sought to determine in an "all-comers"
population whether the BuMA SES is non-inferior
or superior to the Excel SES for the primary
endpoint of 1-year target lesion failure (TLF),
the composite of cardiac death, target vessel
myocardial infarction, or ischemia driven target
lesion revascularization.

PANDA III (N=2,350)Prospective, multicenter, randomized controlled trial. No lesion/vessel limitations.
• Age ≥18 years
• Symptomatic CAD or silent ischemia, or ACS, and qualifies for PCI
• ≥1 coronary artery stenosis of ≥50% with visually estimated RVD ≥2.5 mm and ≤4.0 mm
• Known allergy to contrast and/or device or study meds (PLA, PLGA, sirolimus, aspirin,
clopidogrel, stainless steel, cobalt chromium alloy, etc.)
• Planned surgery within 6 months after the index procedure
• Participation in another investigational clinical trial that has not reached its primary endpoint
Inclusion:
Exclusion:
Excel (N=1,175)Diameter: 2.5, 2.75, 3.0, 3.5, 4.0 mm
Length: 14, 18, 24, 28, 33, 36 mm
BuMA (N=1,175)Diameter: 2.5, 2.75, 3.0, 3.25, 3.5, 4.0mm
Length: 10, 15, 20, 25, 30, 35 mm
1:1 Randomization
Primary Endpoint1-year target lesion failure (TLF; cardiac death, TV-MI, or ID-TLR),
powered for sequential non-inferiority and superiority testing

Statistical Assumptions
For non-inferiority testing:
� Expected 1-year TLF in both groups = 8.3%
� Non-inferiority margin = 3.5%
� One-sided type I error = 0.025
2,232 patients randomized in a 1:1 ratio would yield at least 85% power
to detect non-inferiority
Considering anticipated loss to follow-up of 5%, a total of 2,350 patients
would need to be enrolled
For superiority testing:
� Expected 1-year TLF in Excel group = 8.3%, BuMA group = 5.3%
� One-sided type I error = 0.025
2,232 patients randomized in a 1:1 ratio would yield at least 80% power
to detect superiority of BuMA over Excel
Considering anticipated loss to follow-up of 5%, a total of 2,350 patients
would need to be enrolled
Primary Endpoint: Target Lesion Failure at 1 Year

Principal Investigator Runlin Gao, MD
Co-Principal Investigator Bo Xu, MBBS
Clinical Events Committee
Shaoping Nie, MD (Chair); Li Xu, MD;
Xin Qi, MD; Jun Guo, MD; Peng Qu,
MD
Angiographic Core LabCCRF, Beijing, China
Statistical Analysis
Data ManagementR&G, Beijing, China
Data Monitoring
Sponsor SinoMed, Tianjin, China
Study Organization

Patient Flow and Follow-up
Intention-to-Treat (ITT): 2,348 subjects (BuMA: 1,174 and Excel: 1,174)
Per-Treatment-Evaluable (PTE*): 2,263 subjects (BuMA: 1,135 and Excel: 1,128)
2,390 patients from 46 Chinese centers assessed for eligibility between Dec. 2013 and Aug. 2014
2,348 patients randomized (BuMA vs. Excel = 1:1)
42 patients excluded:
- 9 randomization errors
- 11 not meet inclusion/exclusion criteria
- 22 refused to participate
30-Day F/U
6-Month F/U
1-Year F/U
BuMA
N=1,174
BuMA
N=1,174 (100%)
BuMA
N=1,174 (100%)
BuMA
N=1,169 (99.6%)
BuMA
N=1,135
Excel
N=1,174
Excel
N=1,173 (99.9%)
Excel
N=1,173 (99.9%)
Excel
N=1,164 (99.2%)
Excel
N=1,128
39 pre-specified protocol deviations:- 29 not received study stents- 10 received hybrid stents
46 pre-specified protocol deviations:- 33 not received study stents- 13 received hybrid stents
*PTE population consisted of subjects who received only study device(s)
at the target lesion and who had no pre-specified protocol deviations.

Top 20 Enrollers
Site PI Hospital, CityPatients Enrolled
Site PI Hospital, CityPatients Enrolled
Yuejin YangFu Wai Hospital, National Center for Cardiovascular Diseases, Beijing
434 Chun Xiao Huizhou No. 3 People’s Hospital 63
Xuebin Cao Chinese PLA 252 Hospital, Baoding 124 Xinhu LuShijiazhuang No.1 People’s Hospital
61
Lei Qin Kaifeng Central Hospital, Kaifeng 120 Fuyuan Liu Xiangyang No.1 People’s Hospital 60
Yi LiYunnan St. John’s Hospital, Kunming
108 He HangXiangtan Central Hospital,Xiangtan
60
Zhanquan LiLiaoning Provincial People’s Hospital, Shenyang
108 Xi SuWuhan Asia Heart Hospital, Wuhan
60
Xueqi LiFourth Affiliated Hospital of HaerbinMedical University, Haerbin
96 Bin LiuThe 2nd Hospital of Jilin University, Changchun
57
Hailong LinDalian Municipal Central Hospital Affillated
92 Qingmin Wei Xingtai People’s Hospital, Xingtai 52
Yong Guo Dazhou Central Hospital, Dazhou 84 Jianjun Peng Beijing Shijitan Hospital, Beijing 50
Yitong MaThe First Affiliated Hospital of Xinjiang Medical University
81 Hao Zhang North Hospital, Baotou 47
Jian’anWang
Affiliated 2nd Hospital of Zhejiang University School of Medicine,Hangzhou
68 Kefei Dou Qingdao Fu Wai Hospital, Qingdao 44

Baseline Patient Characteristics (1)BuMA
(N=1174)Excel
(N=1174)P-Value
Age, years 60.8 ± 10.6 61.5 ± 10.6 0.11
Male 70.5% 70.7% 0.93
Body Mass Index, kg/m2 24.9 ± 3.4 24.9 ± 3.3 1.00
Diabetes Mellitus 23.4% 25.1% 0.34
Insulin-requiring 5.9% 7.3% 0.16
Hypertension 61.7% 61.6% 0.97
Hyperlipidemia 31.4% 31.0% 0.86
Family History of CAD 5.3% 4.7% 0.51
Smoking History 0.39
Current Smoker 37.2% 37.7%
Ex-smoker 11.9% 13.6%
None 50.9% 48.7%
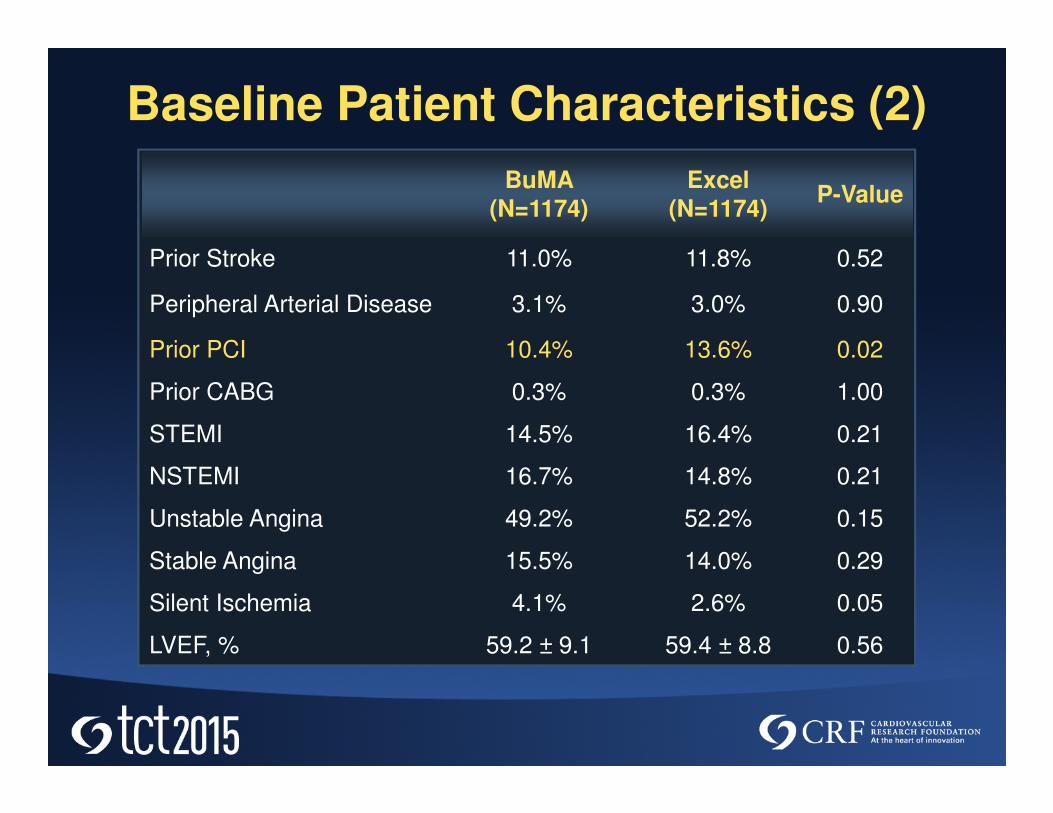
Baseline Patient Characteristics (2)
BuMA
(N=1174)
Excel
(N=1174)P-Value
Prior Stroke 11.0% 11.8% 0.52
Peripheral Arterial Disease 3.1% 3.0% 0.90
Prior PCI 10.4% 13.6% 0.02
Prior CABG 0.3% 0.3% 1.00
STEMI 14.5% 16.4% 0.21
NSTEMI 16.7% 14.8% 0.21
Unstable Angina 49.2% 52.2% 0.15
Stable Angina 15.5% 14.0% 0.29
Silent Ischemia 4.1% 2.6% 0.05
LVEF, % 59.2 ± 9.1 59.4 ± 8.8 0.56
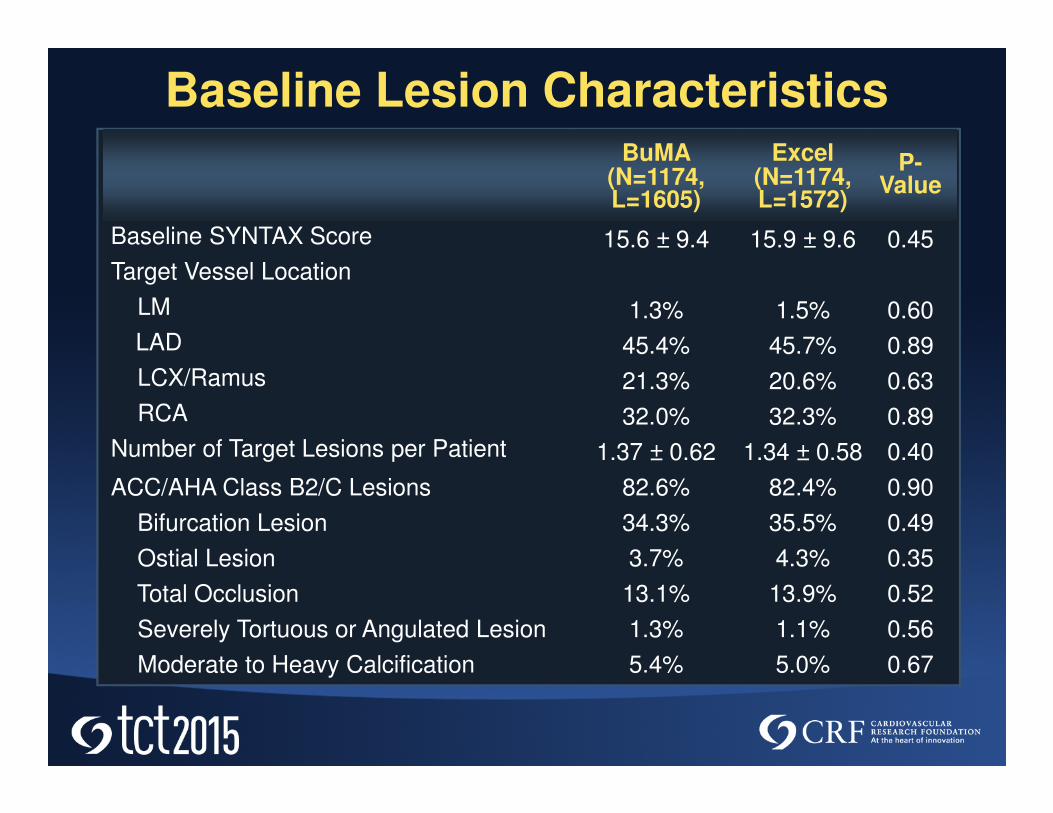
BuMA(N=1174,L=1605)
Excel(N=1174,L=1572)
P-Value
Baseline SYNTAX Score 15.6 ± 9.4 15.9 ± 9.6 0.45
Target Vessel Location
LM 1.3% 1.5% 0.60
LAD 45.4% 45.7% 0.89
LCX/Ramus 21.3% 20.6% 0.63
RCA 32.0% 32.3% 0.89
Number of Target Lesions per Patient 1.37 ± 0.62 1.34 ± 0.58 0.40
ACC/AHA Class B2/C Lesions 82.6% 82.4% 0.90
Bifurcation Lesion 34.3% 35.5% 0.49
Ostial Lesion 3.7% 4.3% 0.35
Total Occlusion 13.1% 13.9% 0.52
Severely Tortuous or Angulated Lesion 1.3% 1.1% 0.56
Moderate to Heavy Calcification 5.4% 5.0% 0.67
Baseline Lesion Characteristics

BuMA(N=1174,L=1605)
Excel(N=1174,L=1572)
P-Value
Transradial Approach 95.2% 95.7% 0.62
Balloon Pre-dilatation 89.2% 90.5% 0.20
Stents per Patient 1.74 ± 0.96 1.70 ± 0.90 0.34
Stents per Lesion 1.27 ± 0.54 1.27 ± 0.52 0.97
Stent Diameter, mm 3.03 ± 0.43 3.02 ± 0.42 0.55
Total Stent Length per Patient, mm 42.6 ± 26.6 42.0 ± 25.4 0.60
Total Stent Length per Lesion, mm 31.2 ± 17.8 31.4 ± 17.0 0.71
Post-dilatation 52.9% 50.1% 0.11
Post-procedural TIMI 3 Flow 98.8% 98.6% 0.59
Procedural Information

BuMA
(N=1174,
L=1605)
Excel
(N=1174,L=1572)
P-
Value
Pre-procedural QCA
RVD, mm 2.75 ± 0.47 2.76 ± 0.45 0.79
MLD, mm 0.70 ± 0.48 0.70 ± 0.48 0.66
DS, % 74.8 ± 16.1 75.0 ± 16.3 0.63
Lesion Length, mm 19.7 ± 12.1 19.8 ± 12.1 0.86
Post-procedural QCA
MLD, mm
In-stent 2.55 ± 0.43 2.57 ± 0.40 0.08
In-segment 2.31 ± 0.47 2.32 ± 0.46 0.55
DS, %
In-stent 8.8 ± 5.9 8.4 ± 5.8 0.05
In-segment 14.5 ± 9.3 14.7 ± 9.9 0.64
Residual SYNTAX Score 4.79 ± 5.88 4.99 ± 5.68 0.40
Device Success 99.8% 99.95% 0.22
Lesion Success 98.8% 98.6% 0.59
Procedure Success 95.1% 94.7% 0.64
QCA and Procedural Results

Primary Endpoint:
Target Lesion Failure at 1 Year
BuMA
(N = 1169)
6.4%
Excel
(N = 1164)
6.4%
Difference: 0.06%
Upper 2-sided 95% CI: 2.04%
Non-inferiority
P value
=
0.0003
Zone of non-inferiority
Pre-specified margin = 3.5%
Primary Non-inferiority Endpoint Met
%0 0.5 1.0 4.02.5 3.0 3.5-0.5 1.5 2.0
Non-inferior
Difference & Upper 95% CI

TL
F (
%)
Days After Index Procedure
0
10
8
6
4
2
BuMA
Excel
420360300240180120600
6.4%
6.3%
Patients at Risk:
Days 0 60 120 180 240 300 360
BuMA 1174 1123 1123 1118 1107 1094 1089
Excel 1174 1116 1110 1110 1104 1097 1090
HR [95% CI] = 1.01 [0.73,1.39]
Plog-rank = 0.95
Target Lesion Failure

Target Lesion Failure, % Relative Risk(95% CI)
P-Value for Interaction
BuMA, N=1169 Excel, N=1164
Age<61 years≥61 years
3.3%9.3%
4.5%7.9%
0.72 (0.39-1.31)1.18 (0.82-1.69)
0.17
SexFemaleMale
6.4%6.4%
7.3%6.0%
0.87 (0.50-1.52)1.08 (0.74-1.57)
0.54
DiabetesPresentAbsent
7.7%6.0%
6.1%6.4%
1.25 (0.68-2.29)0.94 (0.65-1.35)
0.43
AMIPresentAbsent
5.5%6.8%
8.3%5.5%
0.67 (0.39-1.15)1.24 (0.85-1.82)
0.07
Number of target lesions1≥2
4.9%9.9%
5.8%7.8%
0.85 (0.56-1.28)1.27 (0.78-2.07)
0.21
SYNTAX Score<14≥14
4.4%8.3%
3.1%9.2%
1.42 (0.78-2.61)0.90 (0.62-1.29)
0.20
Reference vessel diameter<2.71 mm≥2.71 mm
7.9%4.6%
8.1%4.3%
0.97 (0.67-1.41)1.07 (0.61-1.87)
0.77
Lesion length<16.4 mm≥16.4 mm
6.6%6.3%
6.7%6.2%
0.98 (0.62-1.56)1.03 (0.67-1.56)
0.89
ACC/AHA lesion classB2/CA/B1
6.7%4.2%
7.1%1.3%
0.94 (0.69-1.30)3.23 (0.66-15.7)
0.14
LAD lesionYesNo
8.0%4.2%
6.6%6.1%
1.22 (0.83-1.80)0.70 (0.40-1.20)
0.10
Bifurcation lesionYesNo
8.8%4.7%
6.8%6.0%
1.28 (0.83-1.97)0.79 (0.50-1.24)
0.13
Total occlusionYesNo
7.4%6.2%
8.3%5.9%
0.90 (0.46-1.74)1.04 (0.73-1.48)
0.69
Total stent length per patient<35 mm≥35 mm
4.0%8.5%
3.6%9.0%
1.11 (0.61-2.02)0.95 (0.66-1.36)
0.65
Subgroup Analyses of 1-Year TLF
1.00.1 10Favor BuMA Favor Excel

One-Year TLF and Components
6.4
1.2
4.3
1.9
6.4
1.3
4.9
1.2
0
2
4
6
8
10
12
TLF Cardiac Death TV-MI ID-TLR
BuMA Excel
On
e-Y
ea
r R
ate
s (
%)
75/1169
74/1164
50/1169
57/1164
22/1169
14/1164
14/1169
15/1164
Difference = 0.1%HR [95% CI] = 1.01
[0.73, 1.39]P = 0.95
Difference = -0.1%HR [95% CI] = 0.93
[0.45, 1.93]P = 0.86
Difference = -0.6%HR [95% CI] = 0.87
[0.60, 1.27]P = 0.49
Difference = 0.7%HR [95% CI] = 1.57
[0.80, 3.07]P = 0.18

Po
CE
(%)
Days After Index Procedure
0
10
8
6
4
2
420360300240180120600
Patient-oriented Composite Endpoint*
9.6%
8.5%
Patients at Risk:
Days 0 60 120 180 240 300 360
BuMA 1174 1119 1118 1110 1098 1080 1066
Excel 1174 1113 1104 1098 1090 1081 1070
HR [95% CI] = 1.14 [0.87, 1.50]
Plog-rank = 0.31
BuMA
Excel
*Death, MI, or any revascularization

One-Year PoCE and Components
9.8
2.3
4.5 4.5
8.5
1.7
5.3
2.9
0
3
6
9
12
15
PoCE All-cause Death All MI AnyRevascularization
BuMA Excel
On
e-Y
ea
r R
ate
s (
%)
114/1169
99/1164
52/1169
62/1164
52/1169
34/1164
27/1169
20/1164
Difference = 1.25%HR [95% CI] = 1.14
[0.87, 1.50]P = 0.31
Difference = 0.59%HR [95% CI] = 1.35
[0.76, 2.40]P = 0.31
Difference = -0.88%HR [95% CI] = 0.83
[0.58, 1.20]P = 0.34
Difference = 1.53%HR [95% CI] = 1.53
[0.993, 2.36]P = 0.05
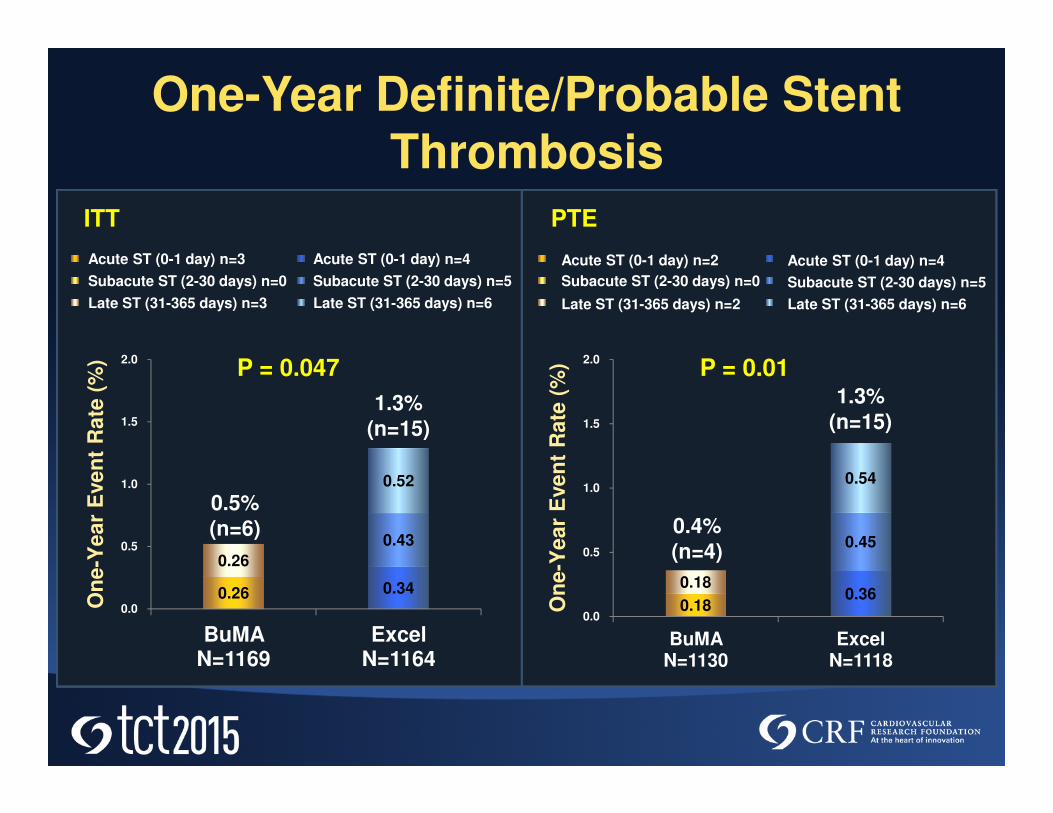
One-Year Definite/Probable Stent Thrombosis
Acute ST (0-1 day) n=3
Subacute ST (2-30 days) n=0
Late ST (31-365 days) n=3
Acute ST (0-1 day) n=4
Subacute ST (2-30 days) n=5
Late ST (31-365 days) n=6
0.26 0.34
0.43
0.26
0.52
0.0
0.5
1.0
1.5
2.0
BuMA N=1169
ExcelN=1164
On
e-Y
ea
r E
ve
nt
Ra
te (
%)
0.5%
(n=6)
1.3%
(n=15)
ITT PTE
Acute ST (0-1 day) n=2
Subacute ST (2-30 days) n=0
Late ST (31-365 days) n=2
Acute ST (0-1 day) n=4
Subacute ST (2-30 days) n=5
Late ST (31-365 days) n=6
0.18 0.36
0.45
0.18
0.54
0.0
0.5
1.0
1.5
2.0
BuMA N=1130
ExcelN=1118
On
e-Y
ea
r E
ve
nt
Ra
te (
%)
0.4%
(n=4)
1.3%
(n=15)
P = 0.01P = 0.047
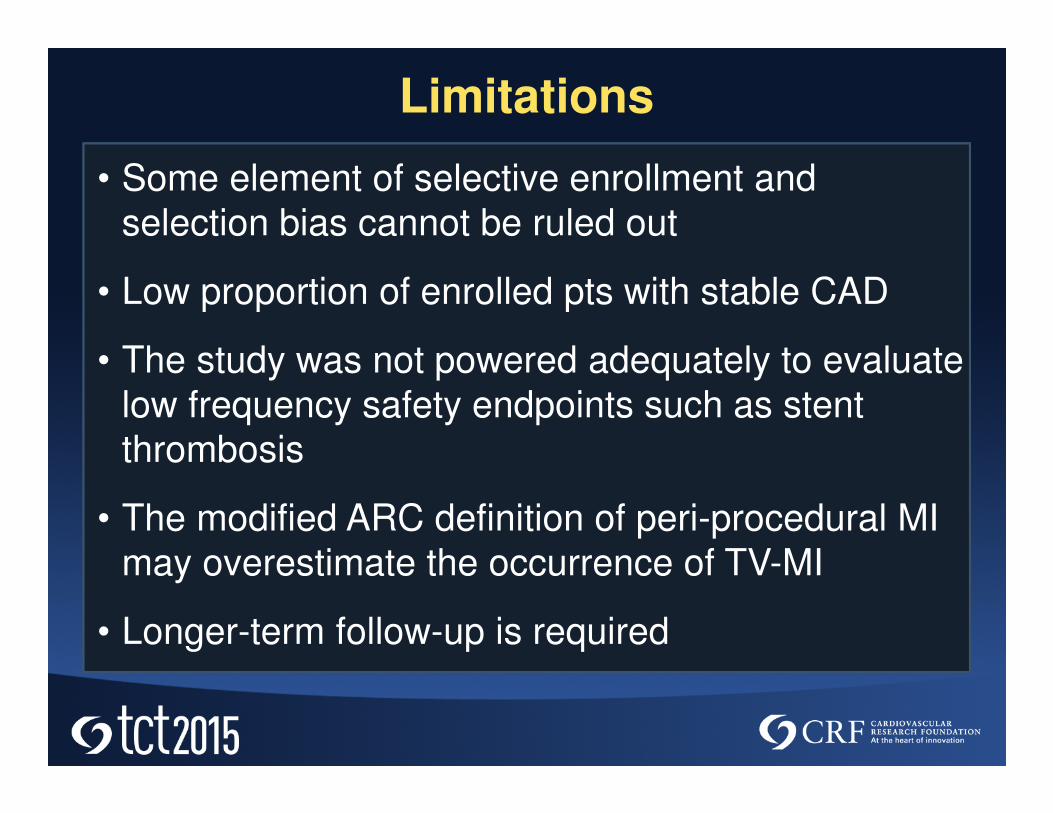
Limitations
• Some element of selective enrollment and
selection bias cannot be ruled out
• Low proportion of enrolled pts with stable CAD
• The study was not powered adequately to evaluate
low frequency safety endpoints such as stent
thrombosis
• The modified ARC definition of peri-procedural MI
may overestimate the occurrence of TV-MI
• Longer-term follow-up is required

Conclusions
• In the multicenter randomized PANDA III trial,
the BuMA SES was non-inferior to the Excel
SES for the primary endpoint of TLF at 1 year
• The PLGA polymer-based BuMA (with eGTM
base layer) SES was associated with a lower
incidence of stent thrombosis compared to the
PLA polymer-based Excel SES, consistent with
the previous findings of enhanced strut
coverage with this device


