
The Difference between Net Pay andNet Reservoir, how to pick them
and their Application to Reservoir Modelling
Steve Cuddy
27th September 2017

Outline
• Definitions of Net Pay and Net Reservoir
• How to determine Net Pay and Net Reservoir fromCore and Electrical Logs
• How to correctly upscale Net reservoir properties forthe 3D reservoir model

Common ideas about Net Cut-offs
High Sw
?

What is Net?
• Net Reservoir– The portion of reservoir rock which is capable of storing
hydrocarbon– Required for upscaling and reservoir modelling– Relatively easy to pick
• Net Pay– “The portion of reservoir rock which will produce commercial
quantities of hydrocarbon” - SPWLA– The portion of reservoir rock which will produce or help
support production of hydrocarbon over field developmenttimescales
– Required to select intervals to be perforated?– More difficult to pick

How can Net Pay be Determined?
• Microlog => mudcake
• Sxo > Sw => moveable HC
• Mud losses – esp. for fractures
• Formation pressure
• NMR
• Borehole gas chromatography
• Production logs
• DST
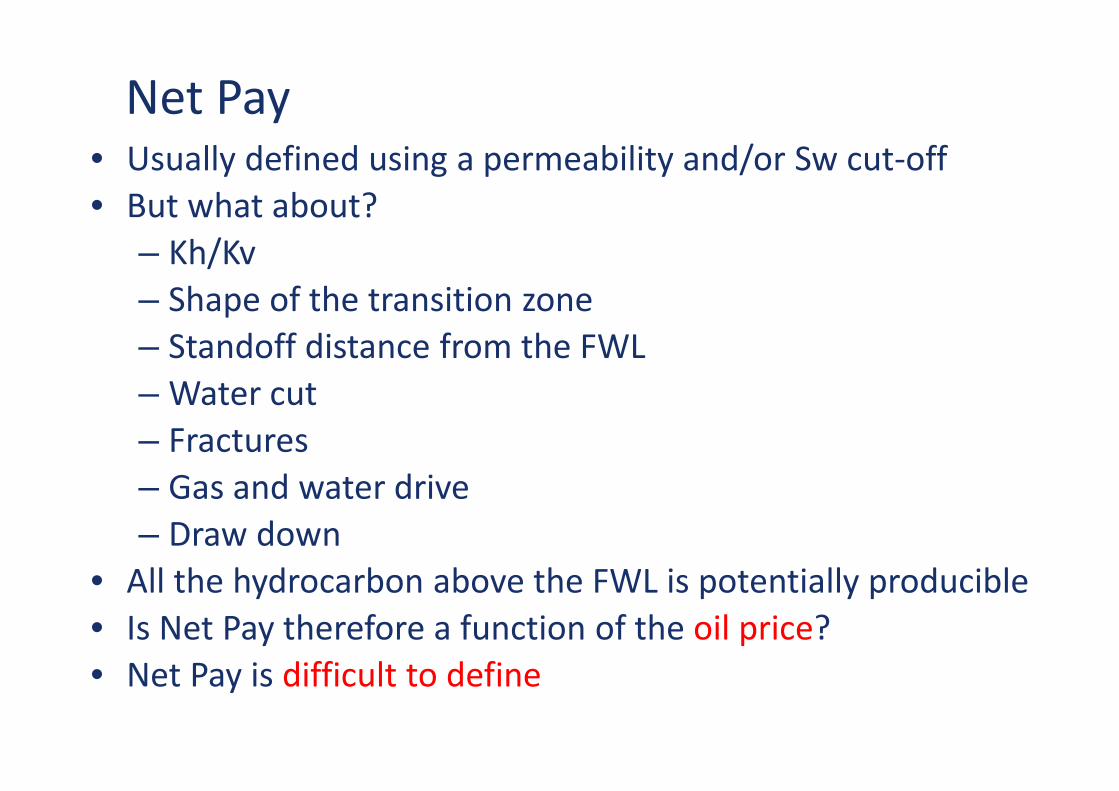
Net Pay• Usually defined using a permeability and/or Sw cut-off
• But what about?
– Kh/Kv
– Shape of the transition zone
– Standoff distance from the FWL
– Water cut
– Fractures
– Gas and water drive
– Draw down
• All the hydrocarbon above the FWL is potentially producible
• Is Net Pay therefore a function of the oil price?
• Net Pay is difficult to define
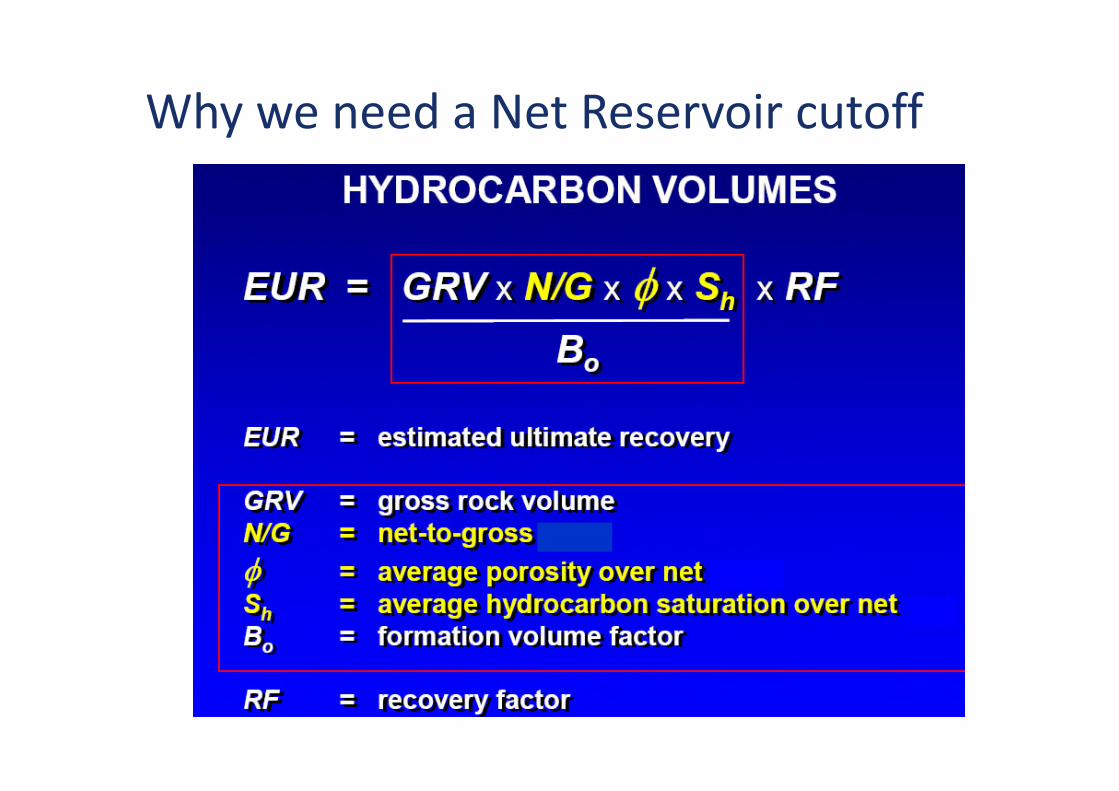
Why we need a Net Reservoir cutoff
Net Reservoir
• Net Reservoir is much easier to define
– The portion of reservoir rock which is capable of storinghydrocarbon
• Knowledge of Net Reservoir is essential
– For upscaling
– For reservoir averaging, 3D geomodelling
– Reservoir modelling – transmissibilities
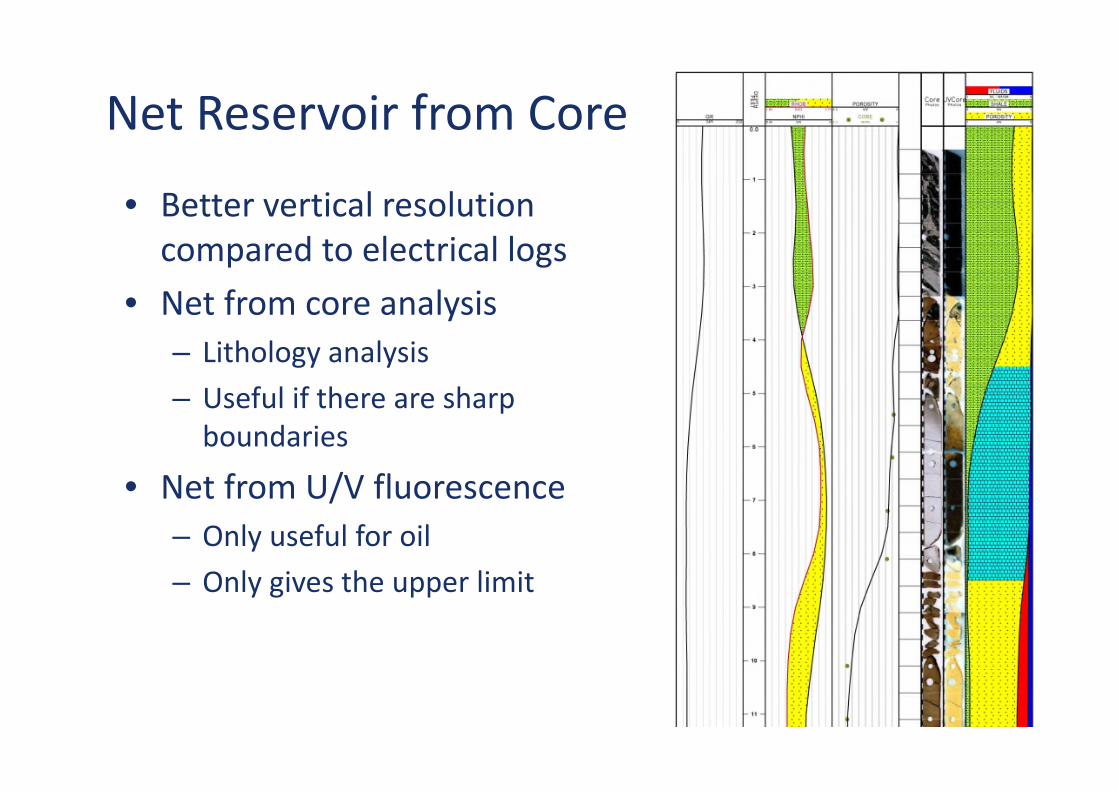
Net Reservoir from Core
• Better vertical resolutioncompared to electrical logs
• Net from core analysis
– Lithology analysis
– Useful if there are sharpboundaries
• Net from U/V fluorescence
– Only useful for oil
– Only gives the upper limit
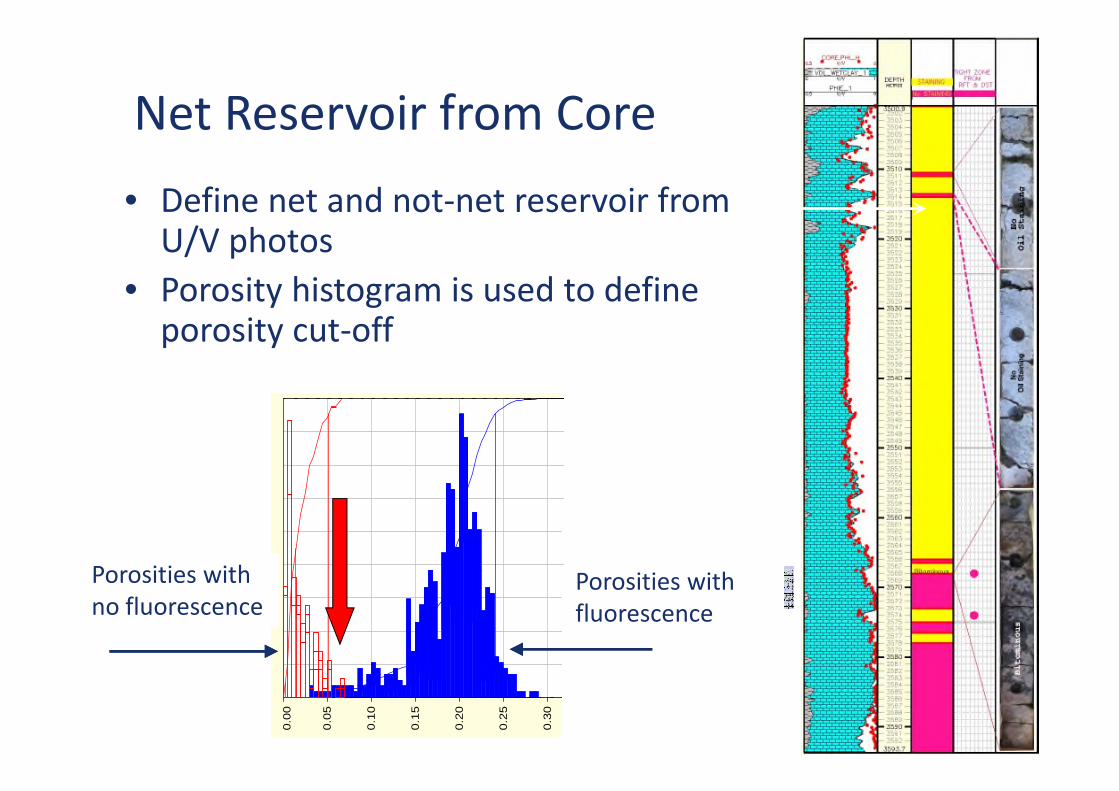
Net Reservoir from Core
• Define net and not-net reservoir fromU/V photos
• Porosity histogram is used to defineporosity cut-off
0.0
0
0.0
5
0.1
0
0.1
5
0.2
0
0.2
5
0.3
0
Porosities withno fluorescence
Porosities withfluorescence
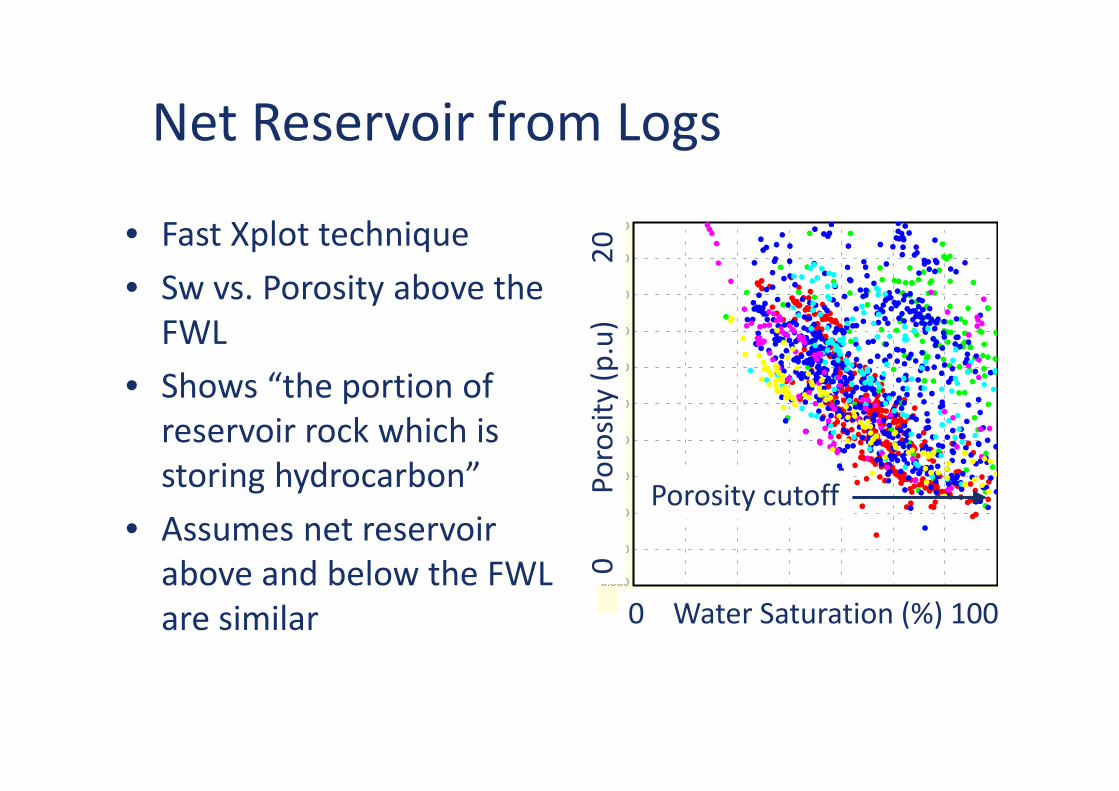
Net Reservoir from Logs
• Fast Xplot technique
• Sw vs. Porosity above theFWL
• Shows “the portion ofreservoir rock which isstoring hydrocarbon”
• Assumes net reservoirabove and below the FWLare similar 0
.00
0.1
4
0.2
9
0.4
3
0.5
7
0.7
1
0.8
6
1.0
0
0.000
0.020
0.040
0.060
0.080
0.100
0.120
0.140
0.160
0.180
0.200
0Po
rosi
ty(p
.u)
20
0 Water Saturation (%) 100
Porosity cutoff
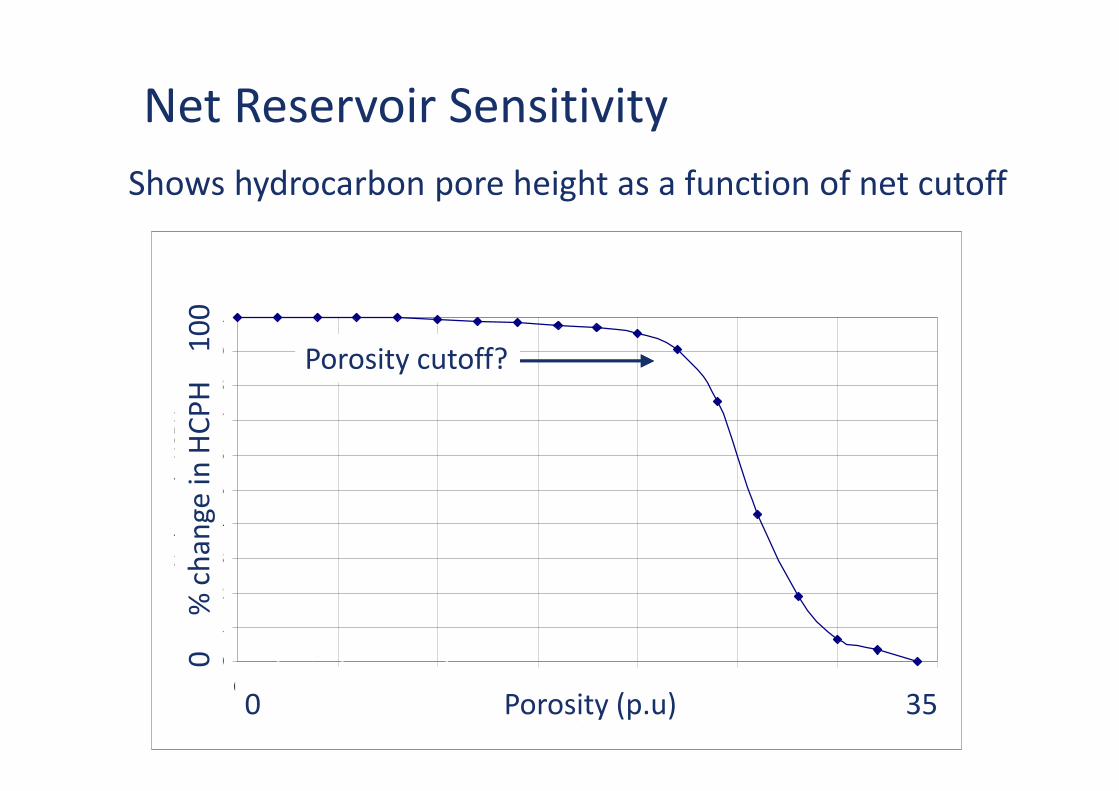
Net Reservoir Sensitivity
Shows hydrocarbon pore height as a function of net cutoff
Net sand sensitivity to Porosity
0
0.1
0.2
0.3
0.4
0.5
0.6
0.7
0.8
0.9
1
0 5 10 15 20 25 30 35
Porosity Cut-off
%ch
an
ge
inH
CP
H
HCPH = (1-Sw) * Porosity * Net
Porosity cutoff?
0 Porosity (p.u) 35
0%
chan
gein
HC
PH
10
0
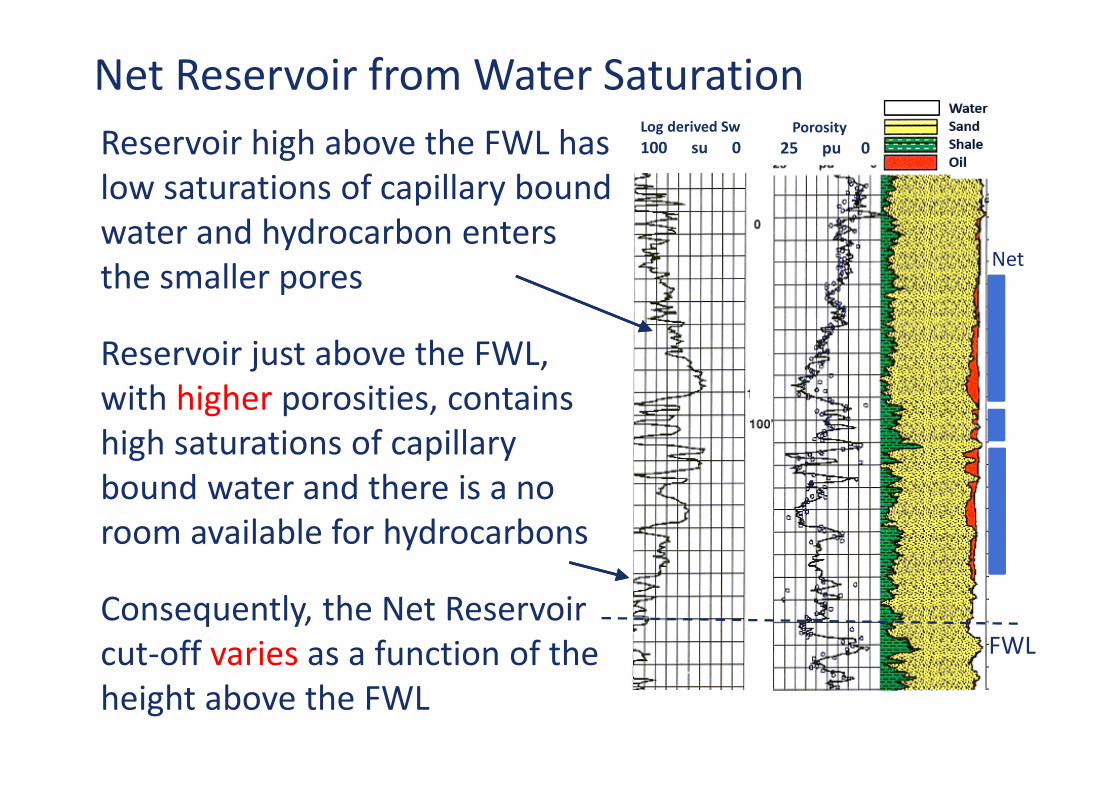
Reservoir high above the FWL haslow saturations of capillary boundwater and hydrocarbon entersthe smaller pores
Reservoir just above the FWL,with higher porosities, containshigh saturations of capillarybound water and there is a noroom available for hydrocarbons
Consequently, the Net Reservoircut-off varies as a function of theheight above the FWL
Net Reservoir from Water Saturation
Net
Porosity
25 pu 0
SandShaleGas
FWL
Log derived Sw
100 su 0

Net
Porosity
25 pu 0
SandShaleGas
FWL
Log derived Sw
100 su 0The Net Reservoir cut-off variesas a function of the heightabove the FWL
Sw varies as a function ofporosity
BVW varies only as a function ofheight above the FWL
Net Reservoir from Bulk Volume of Water
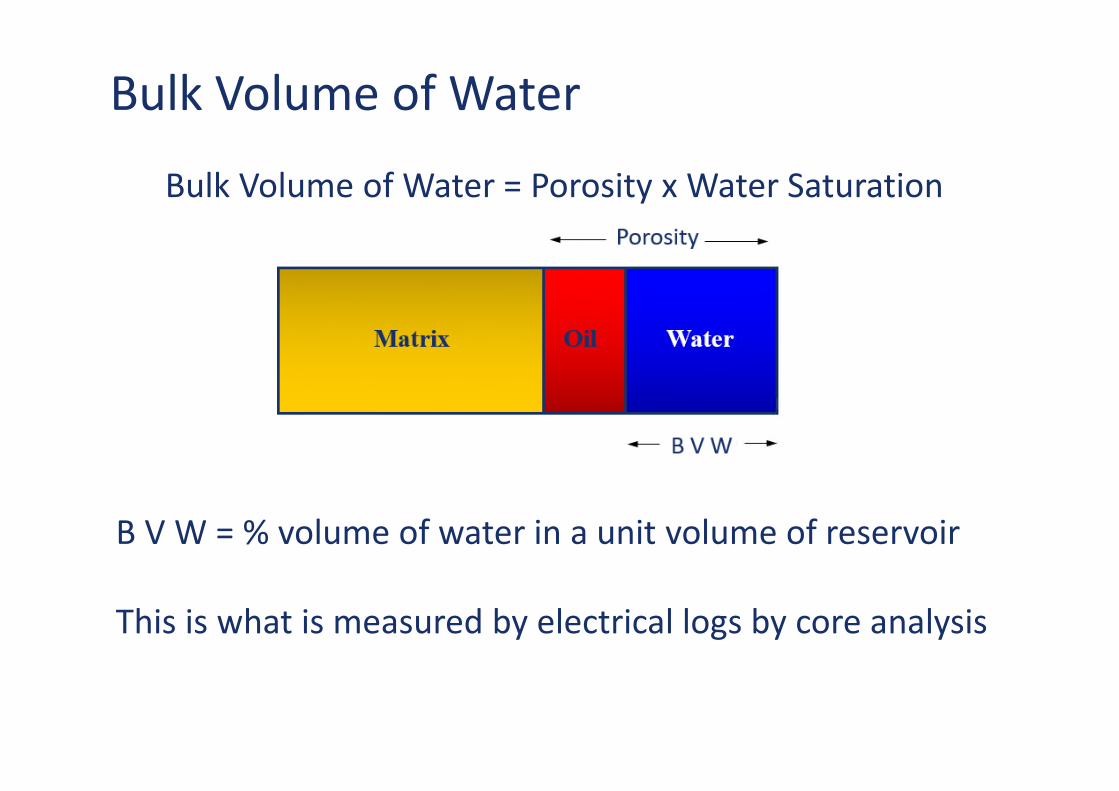
Bulk Volume of Water = Porosity x Water Saturation
B V W = % volume of water in a unit volume of reservoir
This is what is measured by electrical logs by core analysis
Bulk Volume of Water
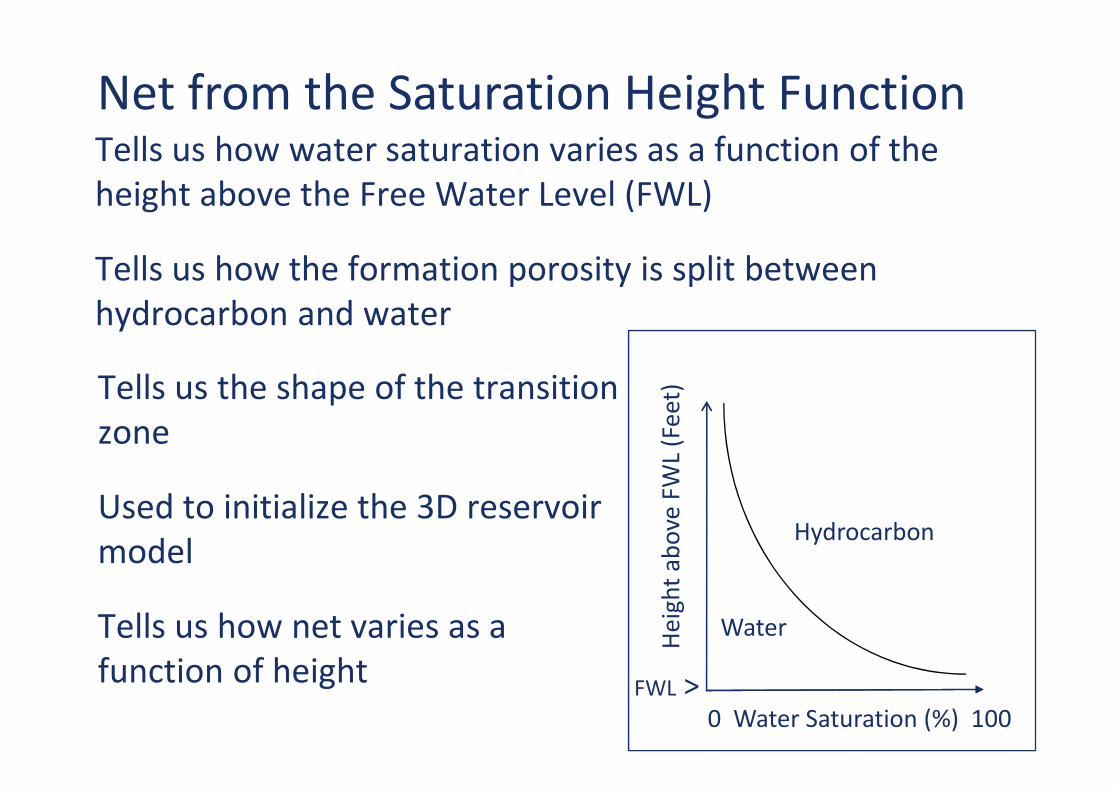
Tells us how water saturation varies as a function of theheight above the Free Water Level (FWL)
Tells us how the formation porosity is split betweenhydrocarbon and water
Net from the Saturation Height Function
0 Water Saturation (%) 100
Hei
ght
abo
veFW
L(F
eet)
FWL >
Water
Hydrocarbon
Tells us the shape of the transitionzone
Used to initialize the 3D reservoirmodel
Tells us how net varies as afunction of height
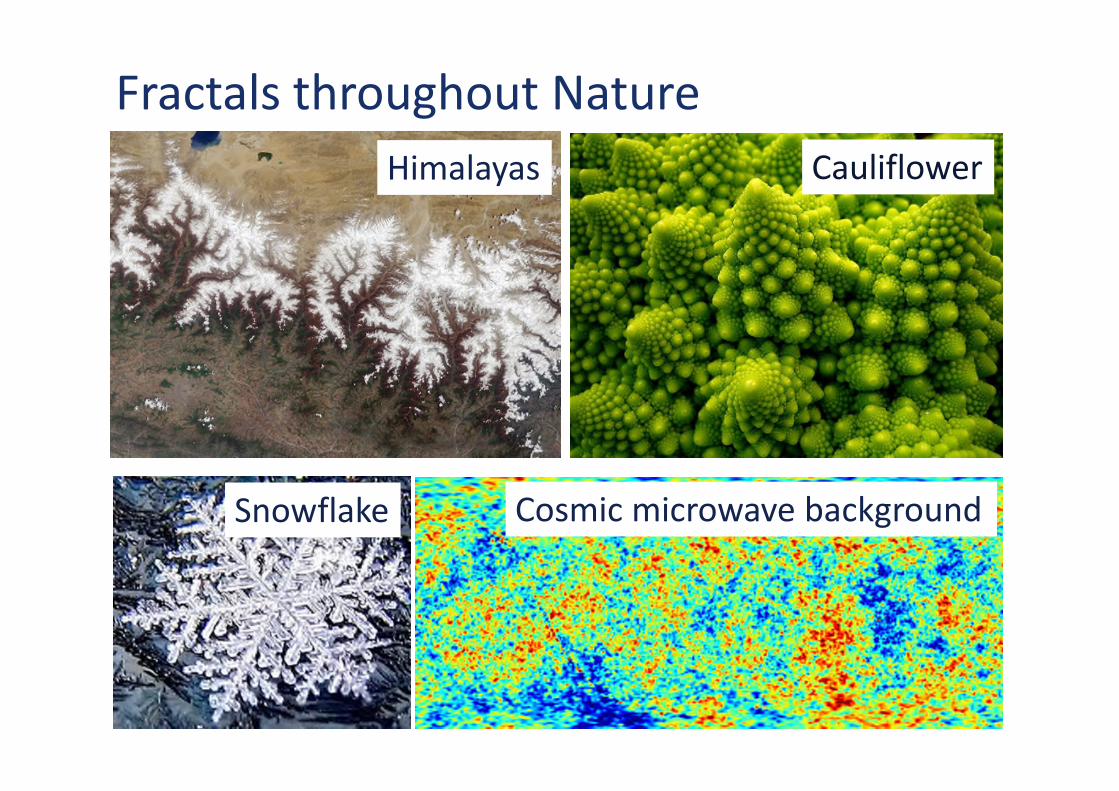
Fractals throughout Nature
Himalayas Cauliflower
Snowflake Cosmic microwave background
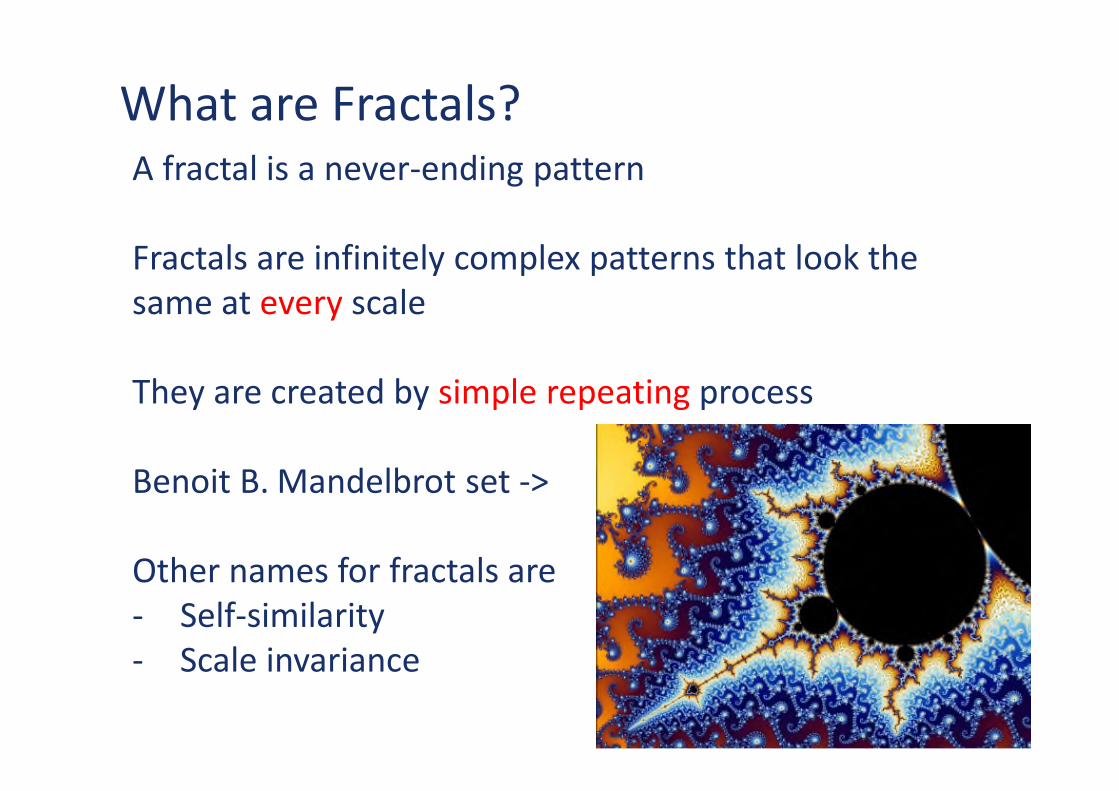
What are Fractals?A fractal is a never-ending pattern
Fractals are infinitely complex patterns that look thesame at every scale
They are created by simple repeating process
Benoit B. Mandelbrot set ->
Other names for fractals are- Self-similarity- Scale invariance
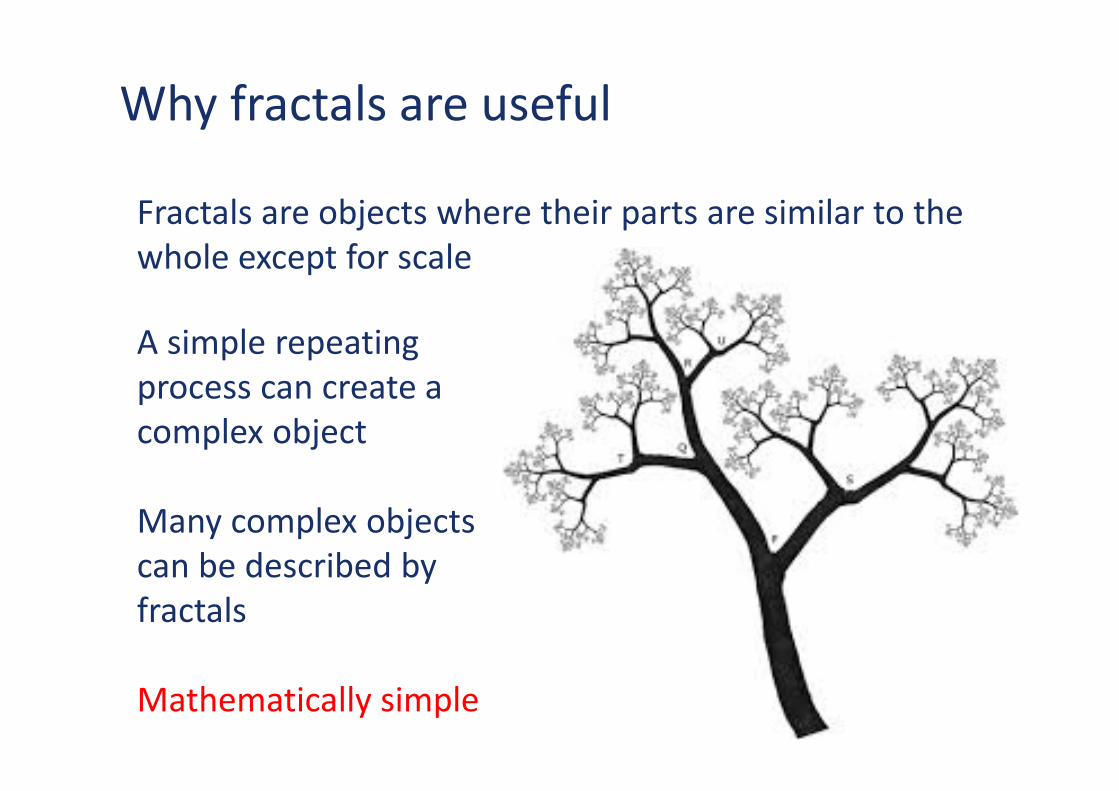
Why fractals are useful
Fractals are objects where their parts are similar to thewhole except for scale
A simple repeatingprocess can create acomplex object
Many complex objectscan be described byfractals
Mathematically simple
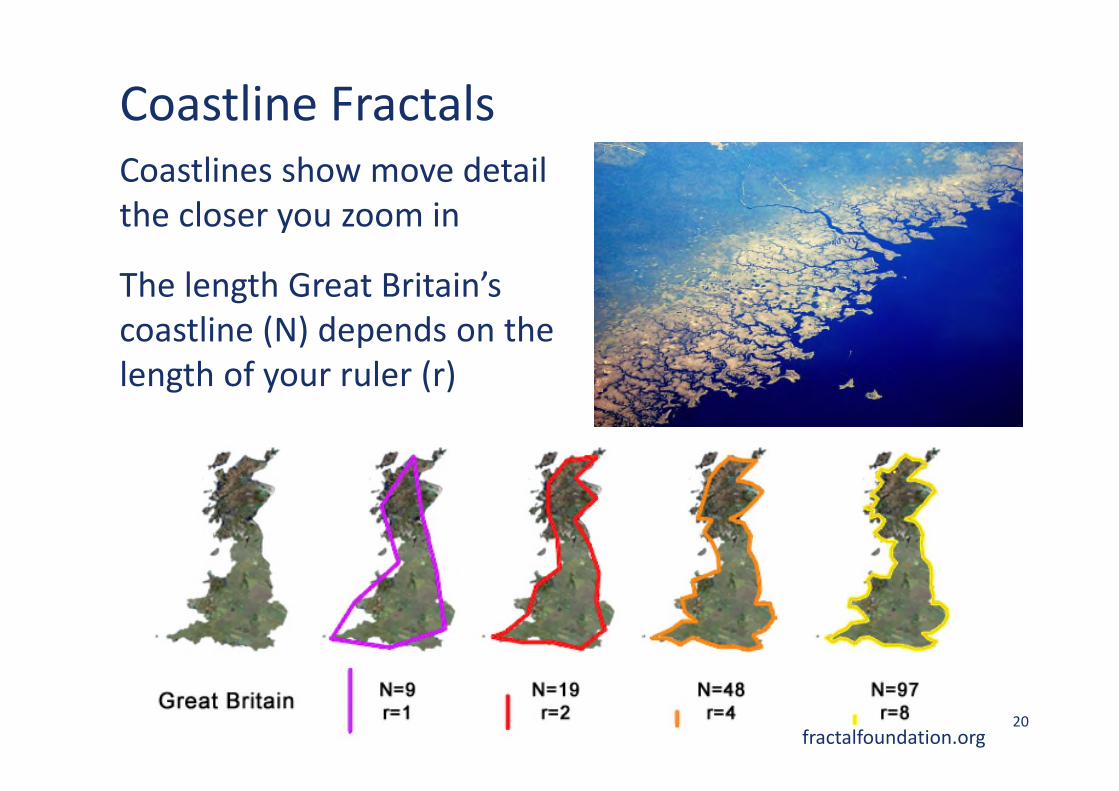
Coastline Fractals
20
Coastlines show move detailthe closer you zoom in
The length Great Britain’scoastline (N) depends on thelength of your ruler (r)
fractalfoundation.org
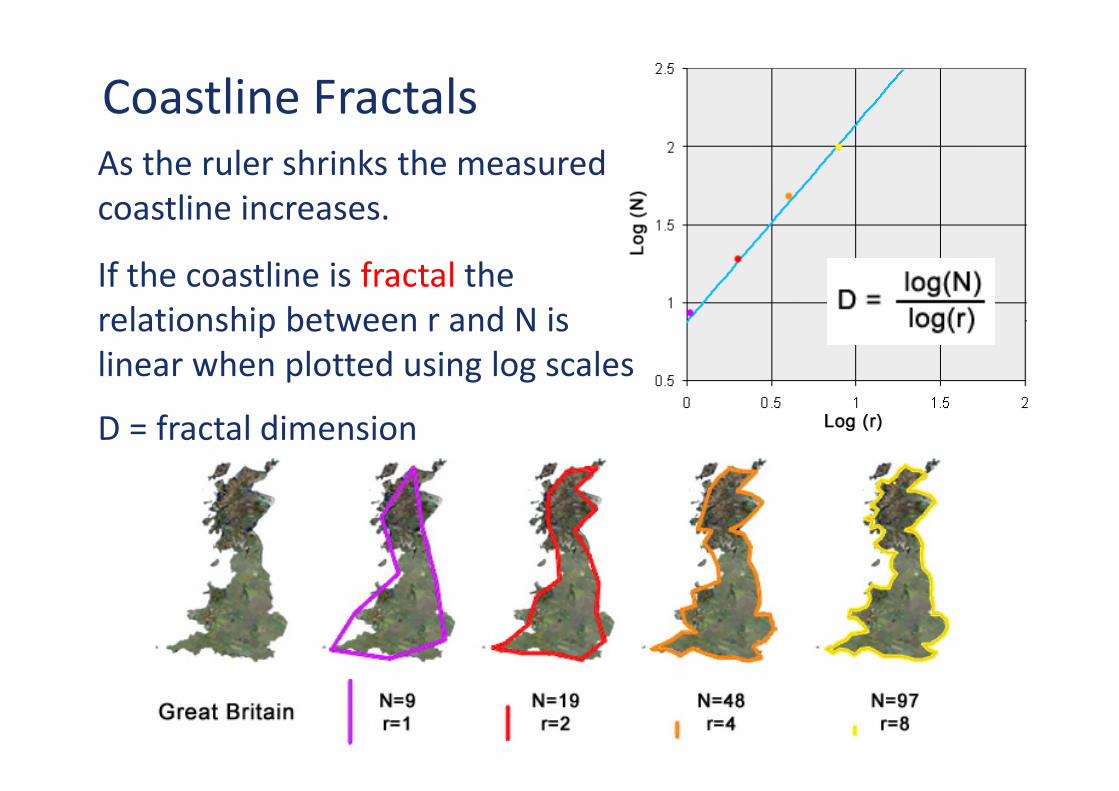
Coastline FractalsAs the ruler shrinks the measuredcoastline increases.
If the coastline is fractal therelationship between r and N islinear when plotted using log scales
D = fractal dimension
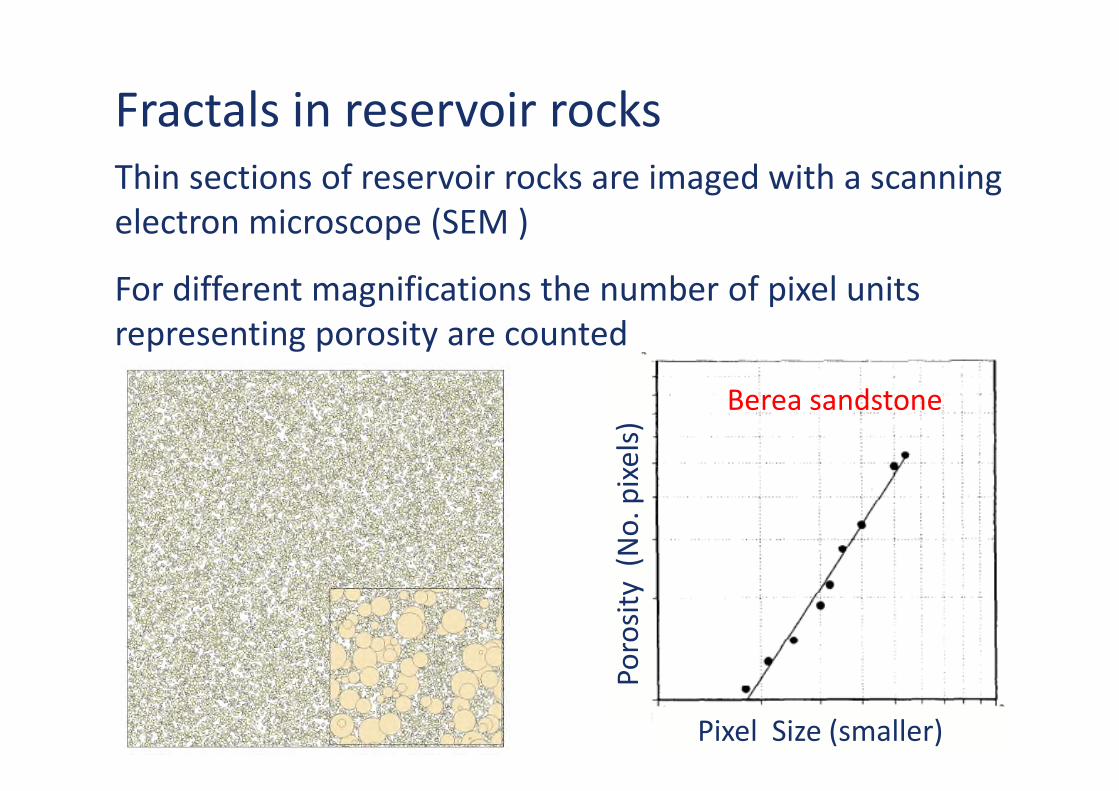
Fractals in reservoir rocksThin sections of reservoir rocks are imaged with a scanningelectron microscope (SEM )
For different magnifications the number of pixel unitsrepresenting porosity are counted
Berea sandstonePixel Size (smaller)
Poro
sity
(No
.pix
els)
Berea sandstone

Fractals describe the rock pore networkThe rock pore space can be described by the fractal formula
Where:V Pore space in rock volumer Radius of the rock capillariesDf Fractal dimension (non-integer constant)
This reduces to
Where:BVW Volume of capillary bound water in the rock
Height above the free water level& constants
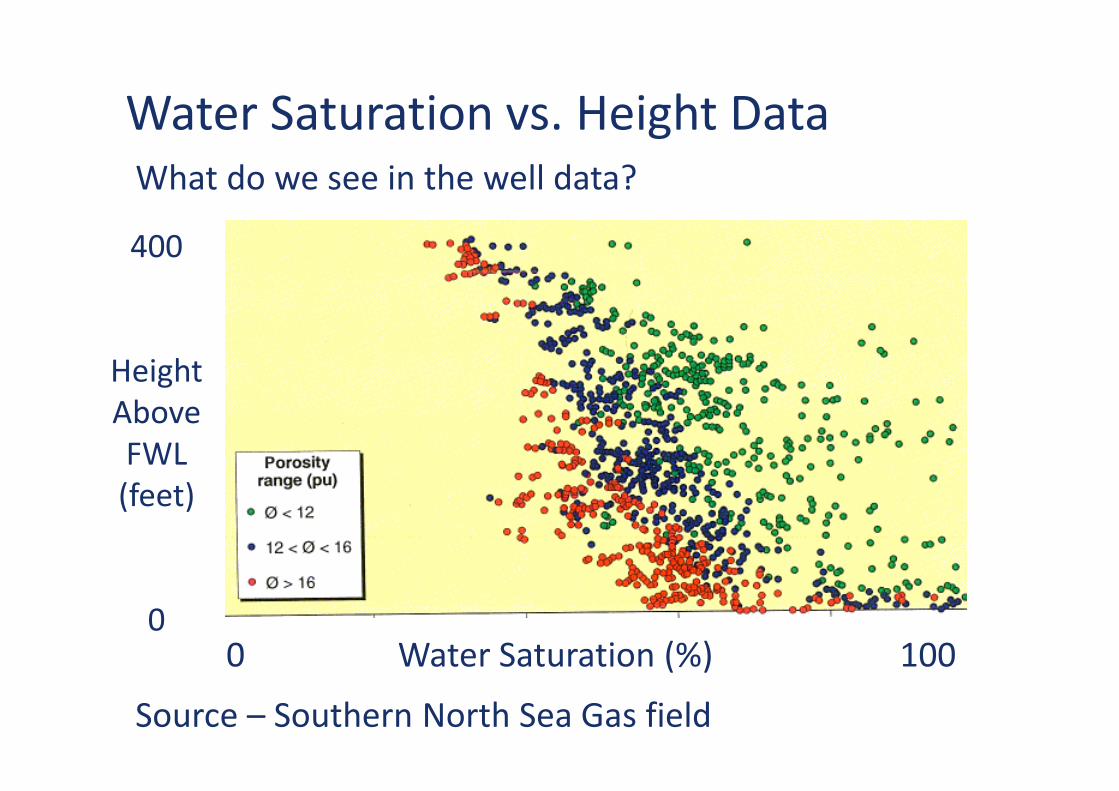
Water Saturation vs. Height Data
0 Water Saturation (%) 100
400
HeightAboveFWL(feet)
0
Source – Southern North Sea Gas field
What do we see in the well data?
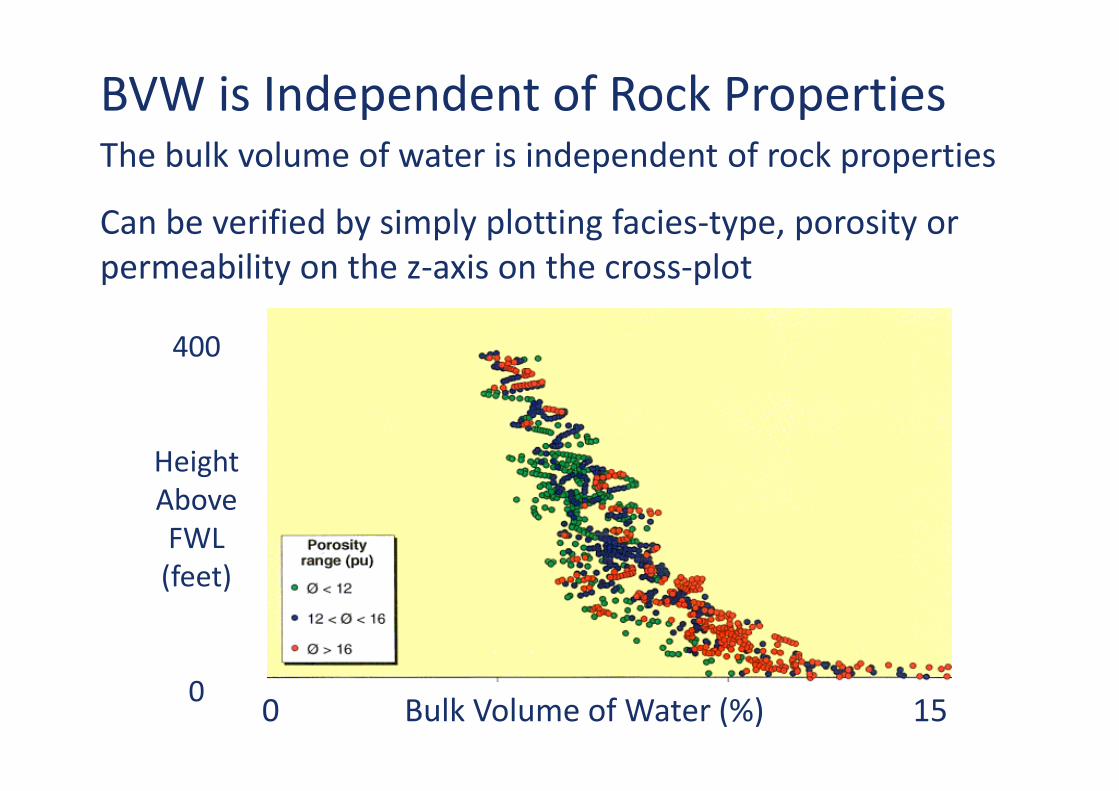
BVW is Independent of Rock Properties
0 Bulk Volume of Water (%) 15
400
HeightAboveFWL(feet)
0
The bulk volume of water is independent of rock properties
Can be verified by simply plotting facies-type, porosity orpermeability on the z-axis on the cross-plot
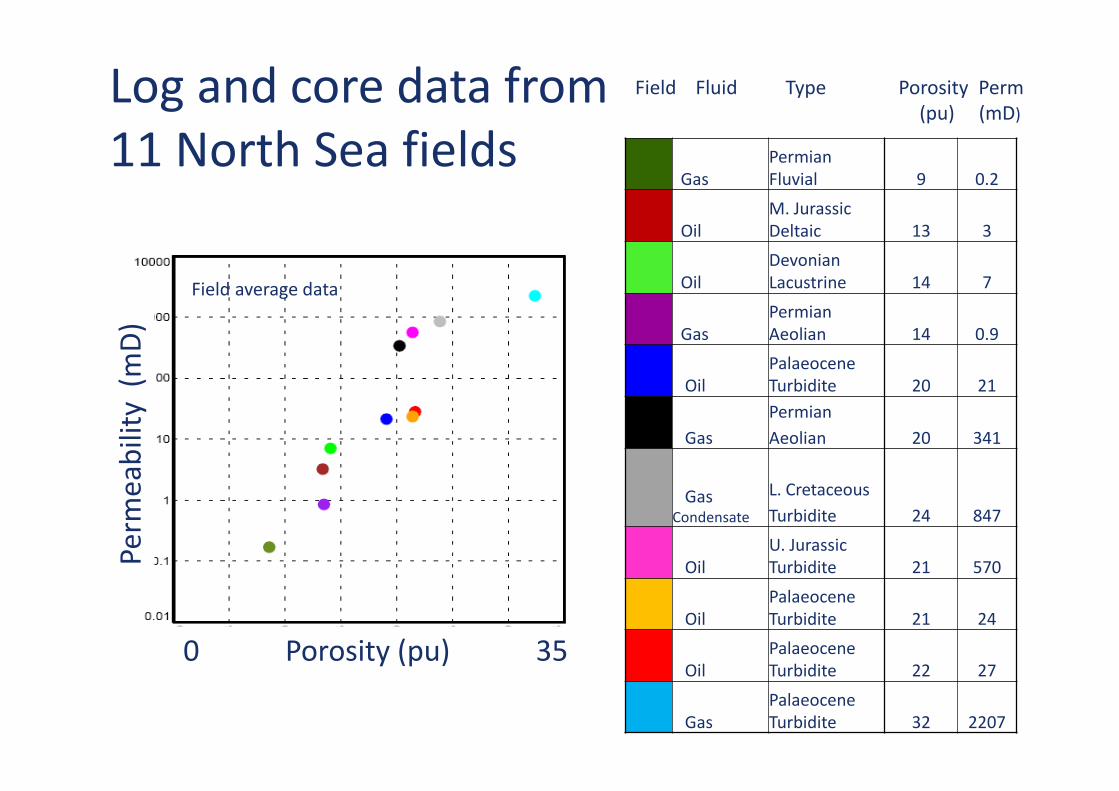
Log and core data from11 North Sea fields
Field Fluid Type Porosity Perm(pu) (mD)
GasPermianFluvial 9 0.2
OilM. JurassicDeltaic 13 3
OilDevonianLacustrine 14 7
GasPermianAeolian 14 0.9
OilPalaeoceneTurbidite 20 21
Gas
Permian
20 341Aeolian
GasCondensate
L. Cretaceous
24 847Turbidite
OilU. JurassicTurbidite 21 570
OilPalaeoceneTurbidite 21 24
OilPalaeoceneTurbidite 22 27
GasPalaeoceneTurbidite 32 2207
Field average data
0 Porosity (pu) 35
Perm
eab
ility
(mD
)
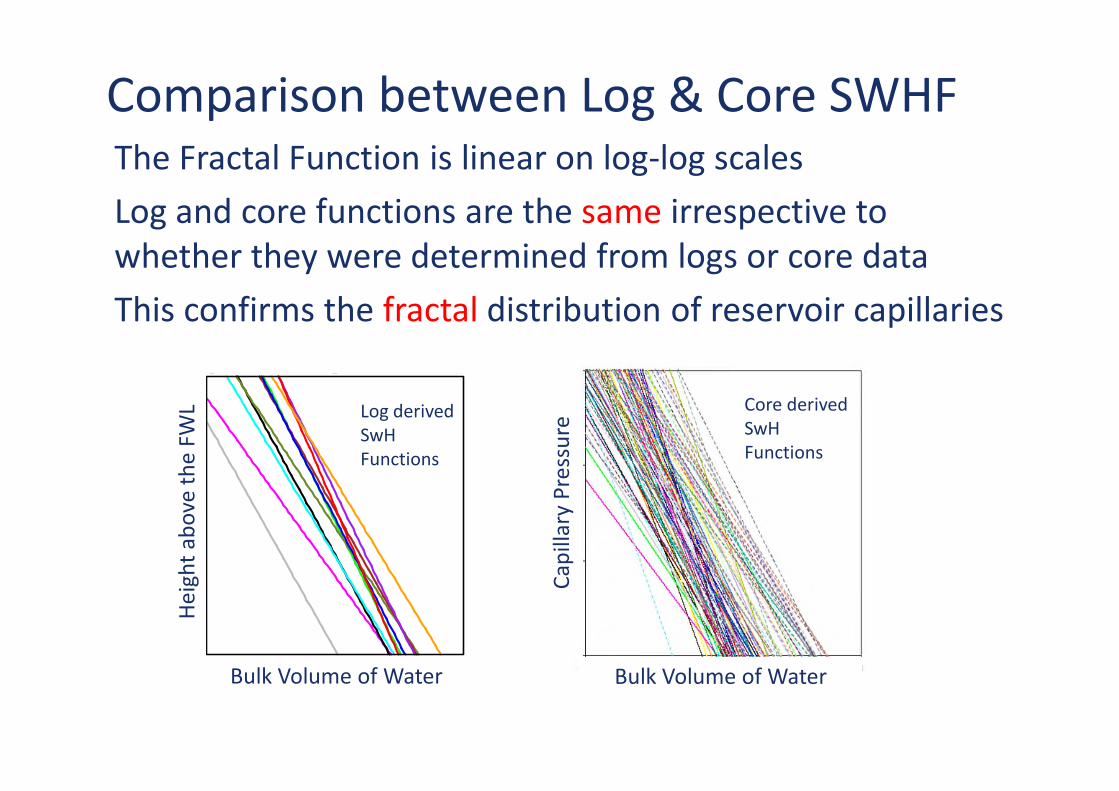
The Fractal Function is linear on log-log scales
Log and core functions are the same irrespective towhether they were determined from logs or core data
This confirms the fractal distribution of reservoir capillaries
Comparison between Log & Core SWHF
0.0
10
.01
0.1
0.1
11
1 1
10 10
100 100
1000 1000
He
igh
ta
bo
ve
the
FW
L(F
ee
t)
Bulk Volume of Water (V/V)
Bulk Volume of Water
Log derivedSwHFunctions
Bulk Volume of Water
Core derivedSwHFunctions
Hei
ght
abo
veth
eFW
L
Cap
illar
yP
ress
ure

What BVW tells us
Bulk Volume of Water = Function (Height above the FWL)
• The BVW Swh function gives the net reservoir cutoff• In this example: porosity > 9 porosity units
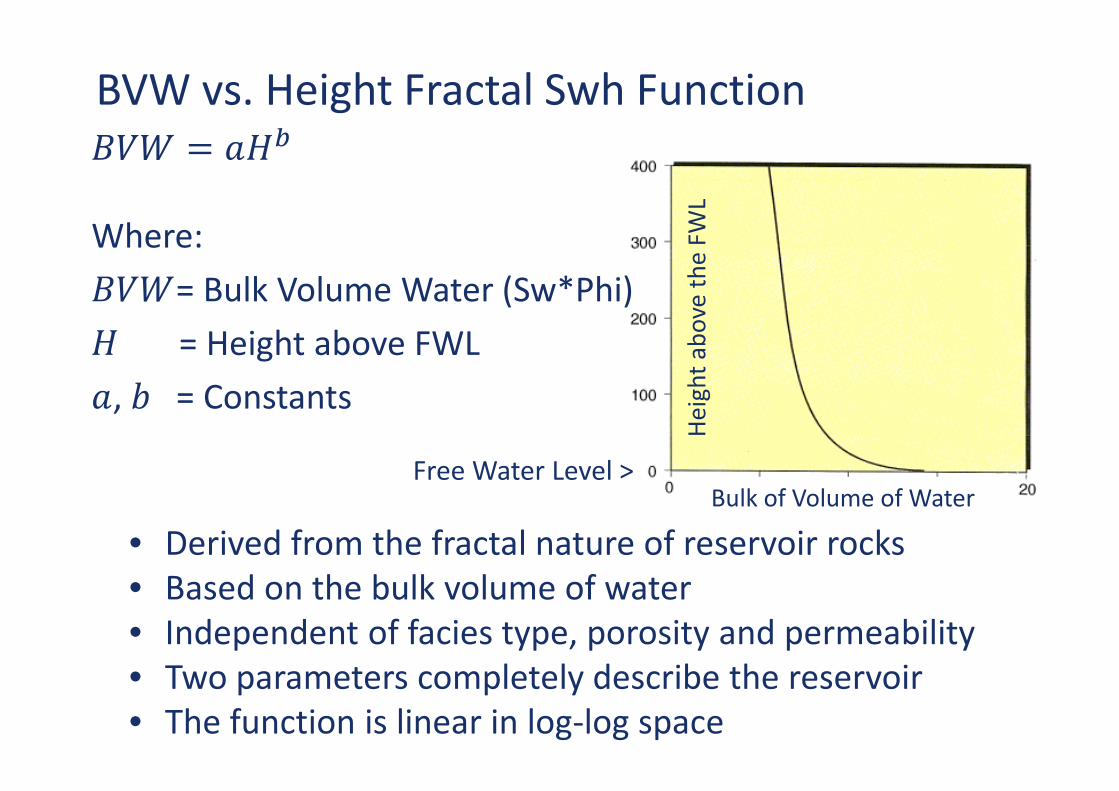
BVW vs. Height Fractal Swh Function
• Derived from the fractal nature of reservoir rocks• Based on the bulk volume of water• Independent of facies type, porosity and permeability• Two parameters completely describe the reservoir• The function is linear in log-log space
Bulk of Volume of WaterFree Water Level >
Where:
= Bulk Volume Water (Sw*Phi)
= Height above FWL
, = Constants
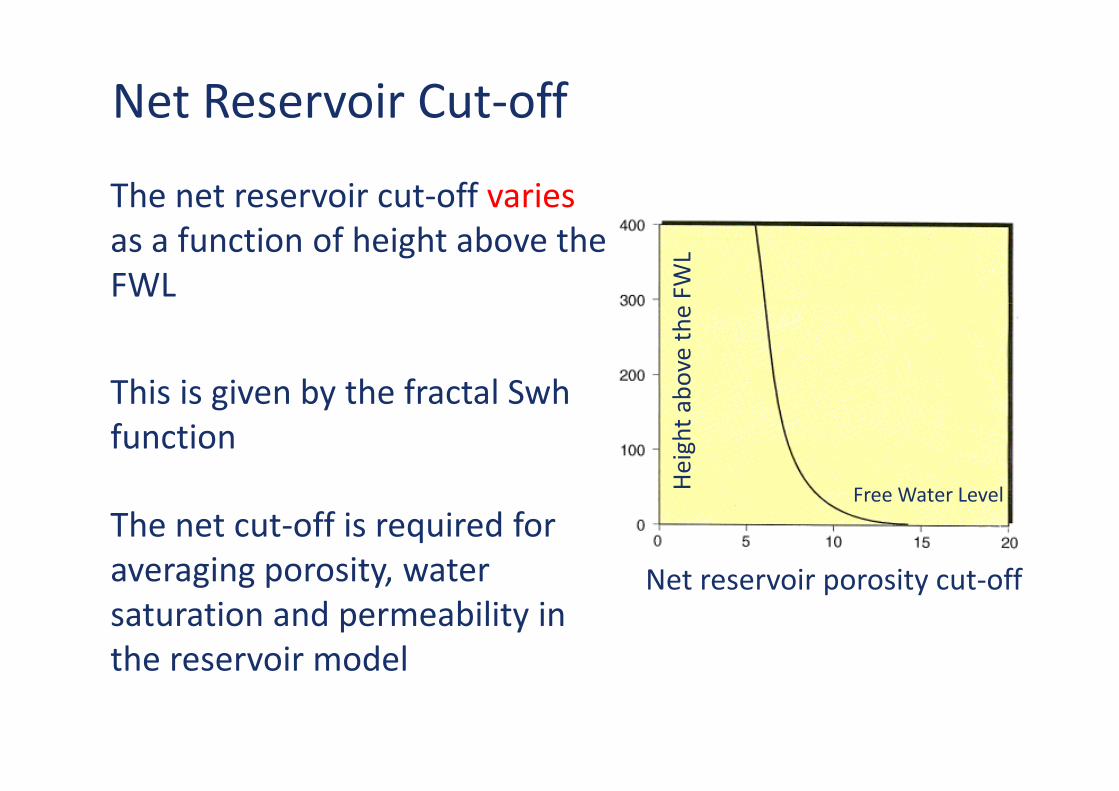
Net Reservoir Cut-off
Net reservoir porosity cut-off
Free Water Level
The net reservoir cut-off variesas a function of height above theFWL
This is given by the fractal Swhfunction
The net cut-off is required foraveraging porosity, watersaturation and permeability inthe reservoir model
Upscaling
From ½ foot to the cell size of the reservoir model
Net flag required
Sw-Height functions (SWHF) are used to initialize thereservoir model. It is essential that the SWHF predictedwater saturations upscale accurately
This is done by integrating the Sw-Height function
Unlike other parameters, such as porosity, watersaturation must be pore volume averaged
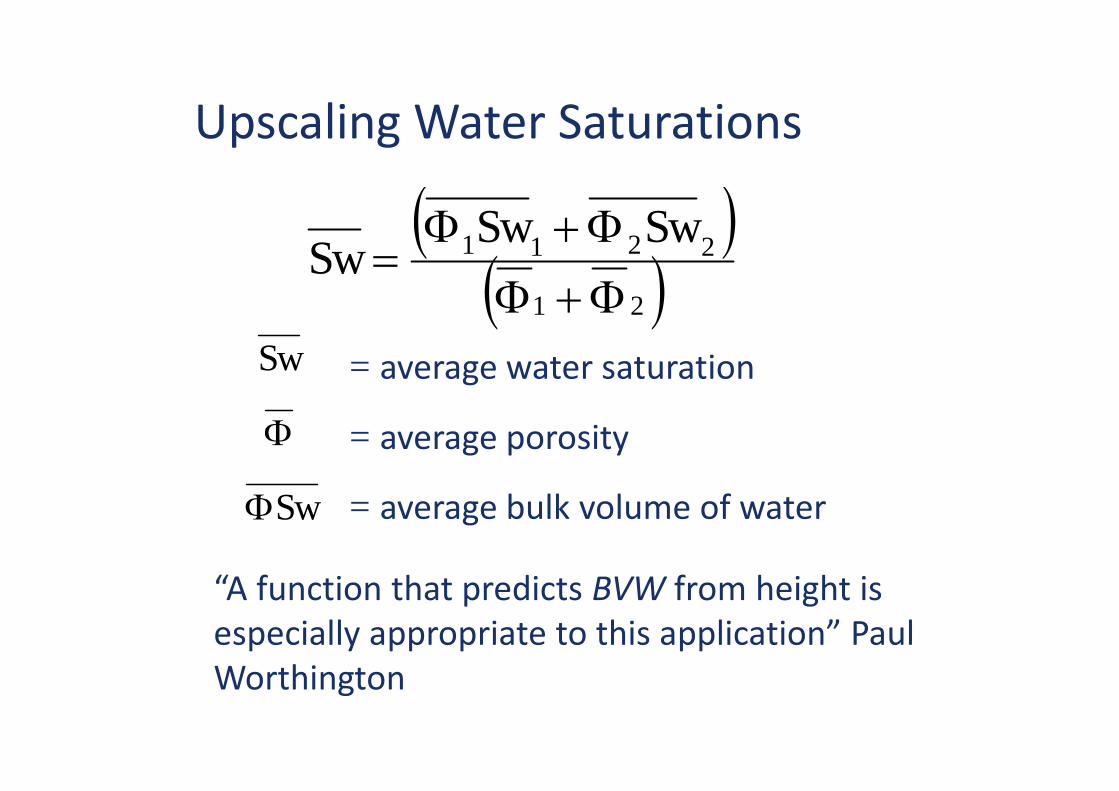
Upscaling Water Saturations
( )( )21
2211
Φ+Φ
Φ+Φ=
SwSwSw
= average water saturationSw
Φ = average porosity
SwΦ = average bulk volume of water
“A function that predicts BVW from height isespecially appropriate to this application” PaulWorthington
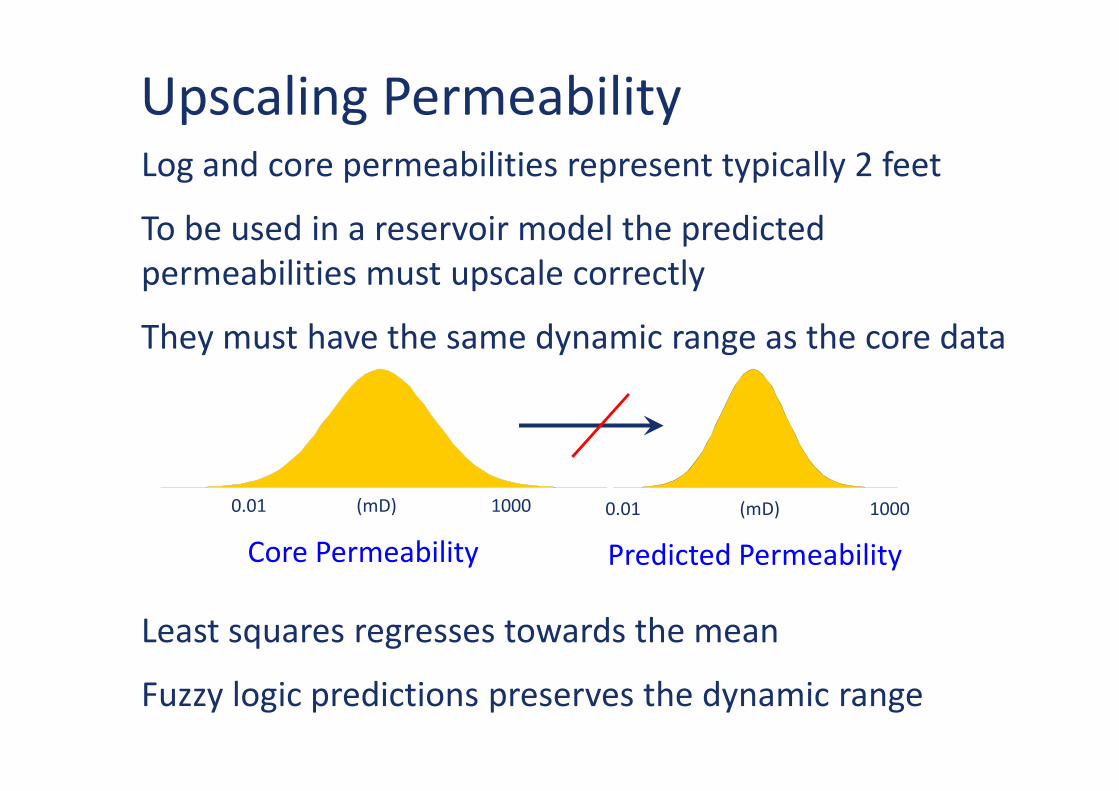
Upscaling PermeabilityLog and core permeabilities represent typically 2 feet
To be used in a reservoir model the predictedpermeabilities must upscale correctly
They must have the same dynamic range as the core data
Least squares regresses towards the mean
Fuzzy logic predictions preserves the dynamic range
Core Permeability Predicted Permeability
0.01 (mD) 1000 0.01 (mD) 1000
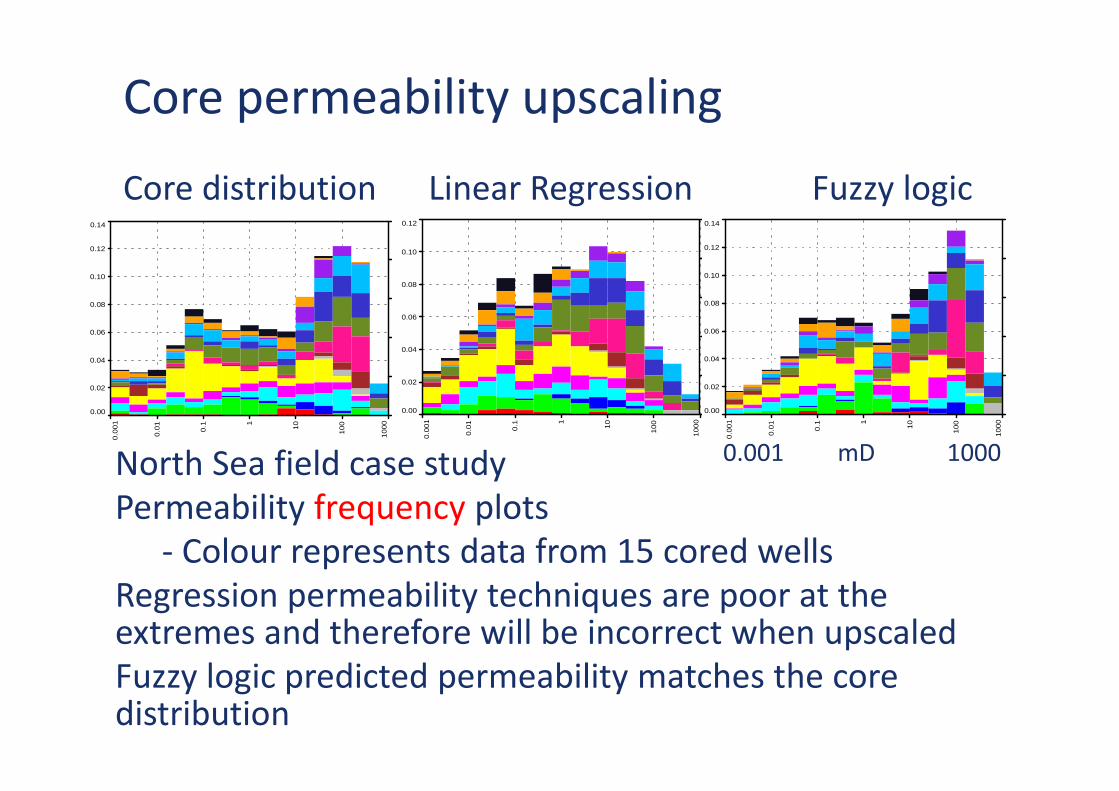
Core permeability upscaling
Core distribution Linear Regression Fuzzy logicprediction
0.00
0.02
0.04
0.06
0.08
0.10
0.12
0.14
0.0
01
0.0
1
0.1 1
10
100
1000
0.00
0.02
0.04
0.06
0.08
0.10
0.12
0.14
0.0
01
0.0
1
0.1 1
10
100
1000
0.00
0.02
0.04
0.06
0.08
0.10
0.12
0.0
01
0.0
1
0.1 1
10
100
1000
North Sea field case studyPermeability frequency plots
- Colour represents data from 15 cored wellsRegression permeability techniques are poor at theextremes and therefore will be incorrect when upscaledFuzzy logic predicted permeability matches the coredistribution
0.001 mD 1000
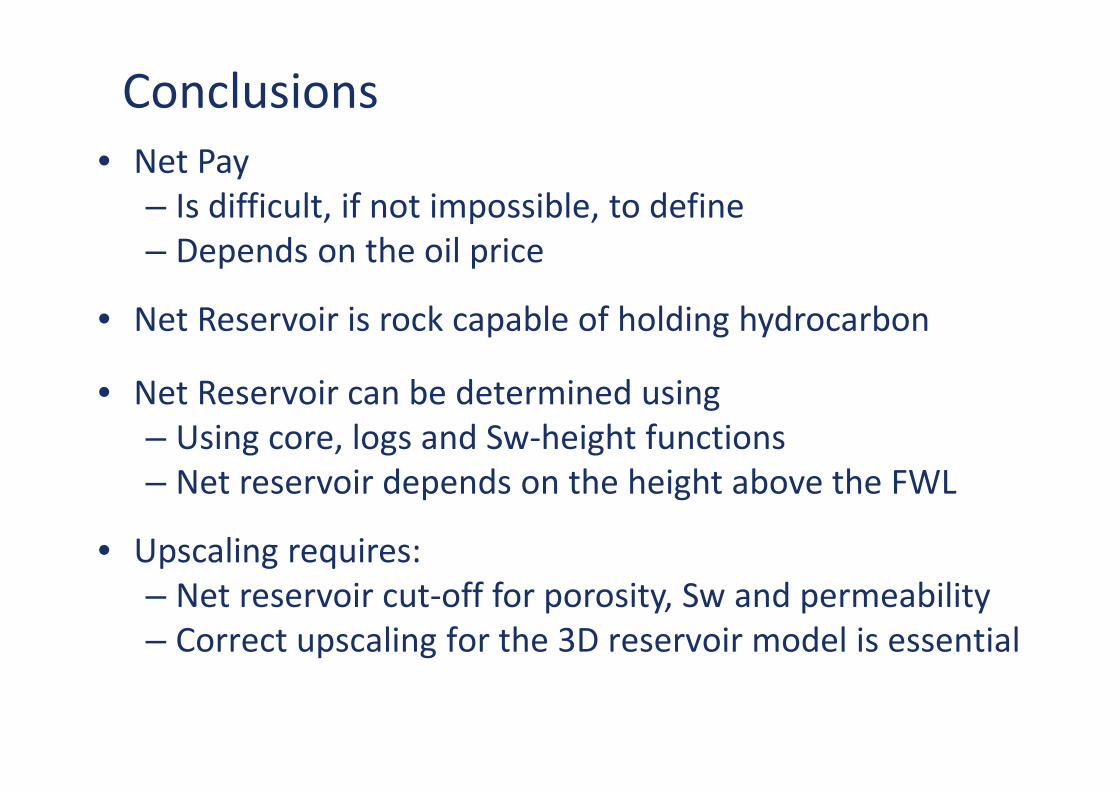
Conclusions• Net Pay
– Is difficult, if not impossible, to define– Depends on the oil price
• Net Reservoir is rock capable of holding hydrocarbon
• Net Reservoir can be determined using– Using core, logs and Sw-height functions– Net reservoir depends on the height above the FWL
• Upscaling requires:– Net reservoir cut-off for porosity, Sw and permeability– Correct upscaling for the 3D reservoir model is essential
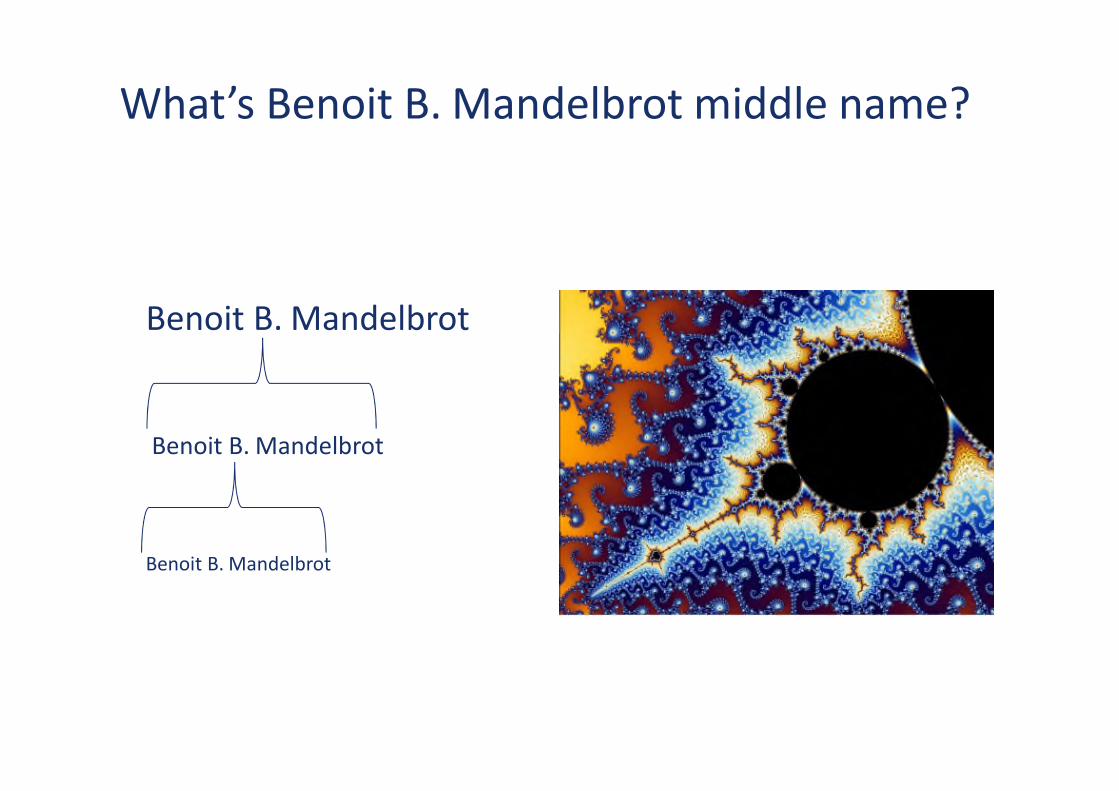
What’s Benoit B. Mandelbrot middle name?
Benoit B. Mandelbrot
What’s Benoit B. Mandelbrot middle name?
Benoit B. Mandelbrot
Benoit B. Mandelbrot
Benoit B. Mandelbrot


![Predictabilities of Typhoon Yagi 2013...(AFES) [1][2][3][4] initialized with ALERA2 (AFES–LETKF experimental ensemble reanalysis 2, where LETKF stands for the local ensemble transform](https://cdn.vdocuments.us/doc/165x107/5e8793184fbb227aec5d46ce/predictabilities-of-typhoon-yagi-2013-afes-1234-initialized-with-alera2.jpg)

