
2008 2008 Regional Bus SurveyRegional Bus SurveyPreliminary ResultsPreliminary Results
Presentation to the
Access for All Advisory Committee
Robert E. GriffithsTechnical Services Director
April 23, 2009

Expanded On-Board Survey Expanded On-Board Survey Ridership TotalsRidership Totals
System Weekday Riders(Preliminary Factors)
ART 5,400
TheBus 15,300
CUE 3,600
DASH 14,700
TransIT 2,800
PRTC 12,400
Fairfax Connector 66,500
Ride-On 98,000
Metrobus 454,900
Total 673,500

Bus Riders Bus Riders Jurisdiction of ResidenceJurisdiction of Residence
System
Percent Distribution
DC Suburban Md
N. Virginia Outside Region
ART 5% 4% 90% 1%
TheBus 11% 88% 1% ---
CUE 5% 5% 88% 2%
DASH 3% 3% 94% 1%
TransIT --- 97% --- 3%
PRTC --- 1% 98% 1%
Connector 3% 3% 91% 3%
Ride-On 5% 93% 1% 1%
Metrobus 49% 33% 16% 1%
All 38% 43% 18% 1%
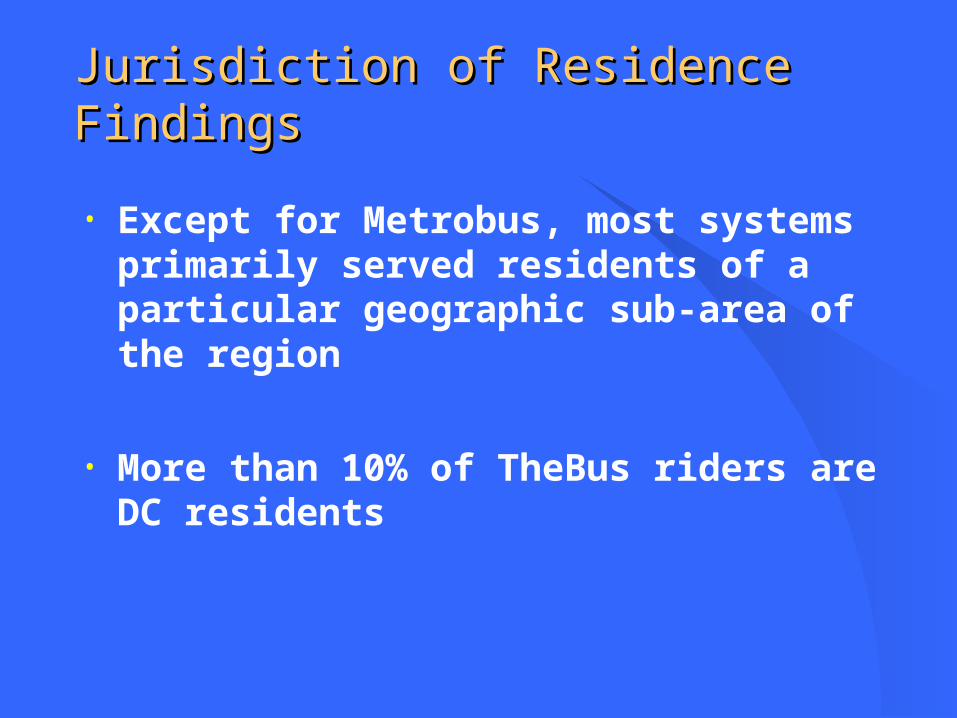
Jurisdiction of Residence FindingsJurisdiction of Residence Findings
• Except for Metrobus, most systems primarily served residents of a particular geographic sub-area of the region
• More than 10% of TheBus riders are DC residents

Access Mode to BusAccess Mode to Bus
Walk Metrorail Bus Auto D Auto P Bike Other
ART 76% 15% 7% 1% --- --- 1%
TheBus 49% 21% 10% 15% 3% --- 2%
CUE 65% 26% 6% 1% 1% --- 1%
DASH 71% 14% 10% 1% 2% --- 1%
TransIT 70% 1% 25% 1% 1% --- 1%
PRTC 49% 7% 12% 22% 8% --- 2%
Connector 49% 25% 14% 5% 4% --- 2%
Ride-On 54% 19% 20% 2% 3% --- 1%
Metrobus 59% 17% 18% 2% 2% --- 1%
All 58% 17% 18% 3% 2% --- 1%
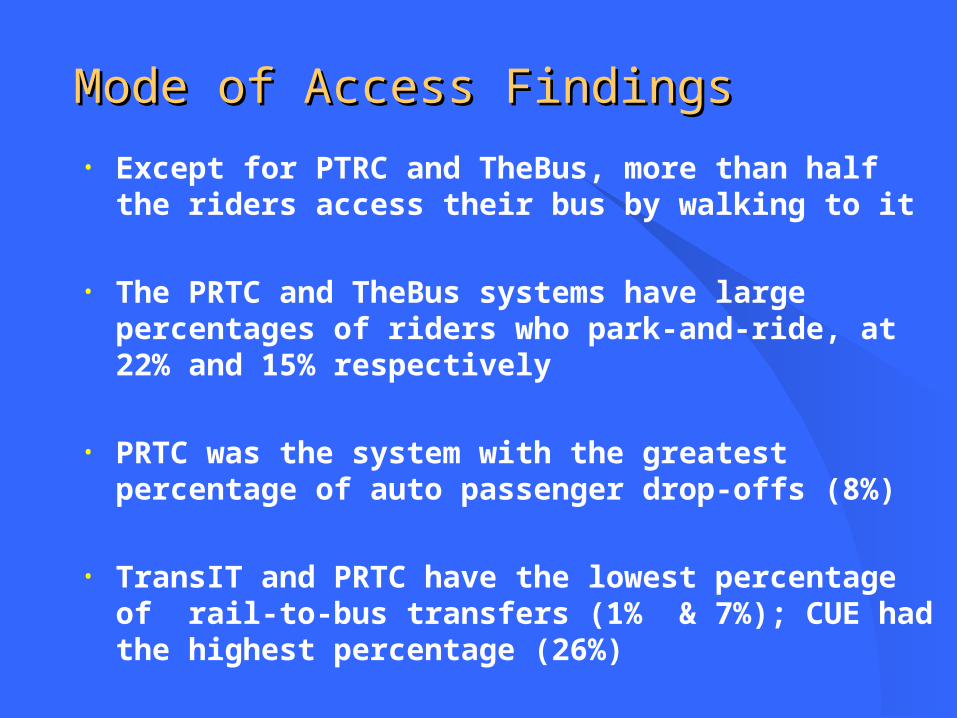
Mode of Access FindingsMode of Access Findings
• Except for PTRC and TheBus, more than half the riders access their bus by walking to it
• The PRTC and TheBus systems have large percentages of riders who park-and-ride, at 22% and 15% respectively
• PRTC was the system with the greatest percentage of auto passenger drop-offs (8%)
• TransIT and PRTC have the lowest percentage of rail-to-bus transfers (1% & 7%); CUE had the highest percentage (26%)

Purpose of TripPurpose of TripGo to Work
Job- Related
Personal Business
Shopping or Meal
To School
Soc/ Rec
Other
ART 62% 3% 13% 6% 15% 1% ---
TheBus 54% 4% 28% 6% 5% 3% ---
CUE 57% 2% 14% 3% 17% 5% 2%
DASH 63% 4% 14% 8% 6% 5% 1%
TransIT 56% 10% 18% 11% 4% 2% ---
PRTC 68% 3% 13% 9% 4% 3% ---
Connector 58% NA NA NA NA NA NA
Ride-On 52% 4% 19% 9% 9% 6% 1%
Metrobus 55% 5% 20% 7% 7% 5% ---
All 55% 5% 20% 7% 8% 5% 1%

Trip Purpose Findings Trip Purpose Findings
• Commuting to work accounts for one-half to two-thirds of the trips on each bus system
• TheBus was the system with the greatest percentage of its riders traveling for personal business reasons (28%)
• TransIT was the system with the greatest percentage of its riders making shopping trips or going to a restaurant (11%)
• A significant percentage of CUE and ART riders were traveling to school (17% for CUE and 15% for ART)

How Fare was PaidHow Fare was PaidCash Smart
TripWeekly Pass
Rail Transfer
Bus Transfer
Senior Discount
Other
ART 45% 36% 8% 2% 2% 1% 7%
TheBus 63% 8% 3% 3% 6% 6% 11%
CUE 39% 31% 2% 2% 3% --- 24%
DASH 43% 37% 2% 2% 4% --- 12%
TransIT 71% --- --- 3% 4% 5% 18%
PRTC 34% 57% --- --- --- 1% 8%
Connector 48% 41% --- --- --- --- 11%
Ride-On 34% 26% 15% 2% 2% 5% 16%
Metrobus 34% 42% 11% 2% 3% 3% 5%
All 35% 38% 11% 2% 3% 4% 7%

Fare Payment FindingsFare Payment Findings• SmarTrip was the predominant payment method used by
PRTC (57%) and Metrobus (42%)
• Cash was the primary mode of fare payment for TransIT (71%) and TheBus (63%) riders
• A significant percentage of Ride-On (15%) and Metrobus (11%) riders paid their fare using a weekly pass
• Approximately 5% of TheBus, TransIT and Ride-On riders paid a discounted senior citizen/disabled rider fare.

Number of TransfersNumber of Transfers
System
Total Number of Bus and Rail Transfers
No Transfers
One Transfer
Two Transfers
Three or More
Transfers
ART 38% 45% 13% 4%
TheBus 31% 47% 16% 6%
CUE 38% 47% 12% 3%
DASH 40% 44% 13% 3%
TransIT 34% 52% 9% 5%
PRTC 58% 29% 7% 6%
Connector 34% 45% 16% 5%
Ride-On 31% 48% 16% 6%
Metrobus 33% 45% 17% 5%
All 33% 45% 17% 5%
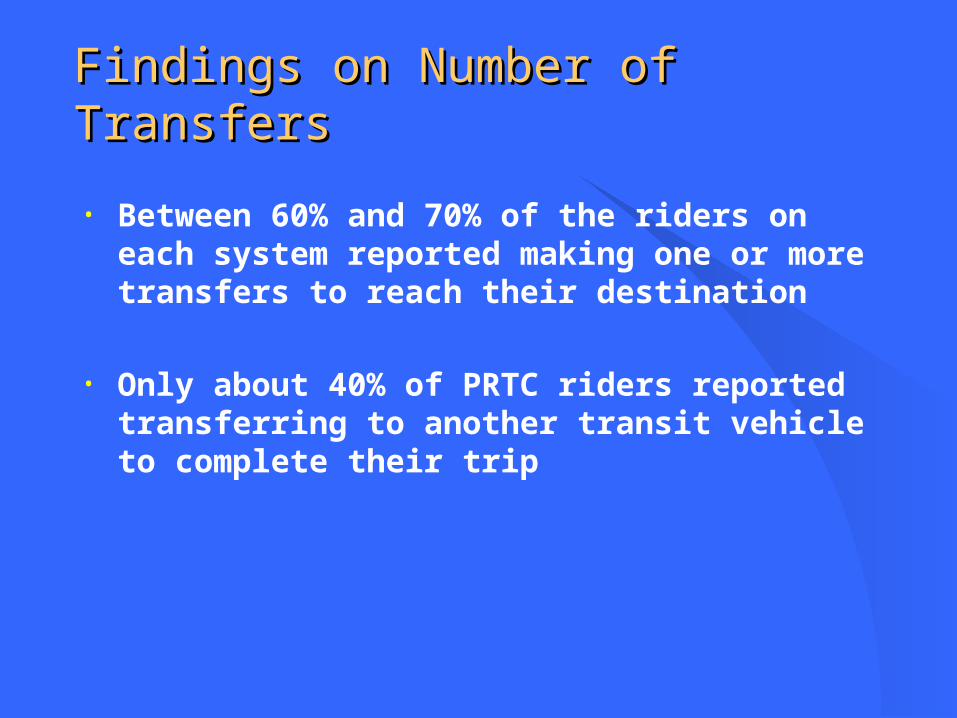
Findings on Number of TransfersFindings on Number of Transfers
• Between 60% and 70% of the riders on each system reported making one or more transfers to reach their destination
• Only about 40% of PRTC riders reported transferring to another transit vehicle to complete their trip

Receive Transit BenefitReceive Transit Benefit from Employer? from Employer?
System Yes No
ART 32% 68%
TheBus 13% 87%
CUE 23% 77%
DASH 35% 65%
TransIT 5% 95%
PRTC 42% 58%
Connector NA NA
Ride-On 21% 79%
Metrobus 24% 76%
All 24% 76%

Findings on Transit BenefitsFindings on Transit Benefits• Overall 24% of the surveyed bus riders reported
receiving a transit benefit from their employer
• Approximately 42% of PRTC riders, 35% of DASH
riders and 32% of ART riders said that they received a transit benefit
• Only 5% of TransIT riders and 13% of TheBus riders said they received a transit benefit from their employer

Number of Household VehiclesNumber of Household Vehicles
System
Number of HH Vehicles
No Vehicles
One Vehicle
Two Vehicles
Three or More
VehiclesART 43% 42% 13% 3%
TheBus 49% 26% 21% 4%
CUE 45% 31% 19% 5%
DASH 37% 43% 17% 3%
TransIT 52% 31% 10% 7%
PRTC 26% 30% 28% 17%
Connector 40% 29% 23% 8%
Ride-On 43% 31% 19% 6%
Metrobus 53% 30% 13% 4%
Total 50% 31% 14% 5%

FindingsFindings on Household Vehicle Availabilityon Household Vehicle Availability
• Approximately 50% of the riders on the Metrobus, TransIT and TheBus systems are from households without autos or other vehicles
• PRTC Riders were twice as likely to live in households with 2 or more vehicles than bus riders on other systems and three times more likely to live households with 3 or more vehicles in than riders on other systems

Was a Vehicle Available Was a Vehicle Available for This Trip? for This Trip?
System Yes No
ART 42% 58%
TheBus 27% 73%
CUE 33% 67%
DASH 40% 60%
TransIT 24% 76%
PRTC 54% 46%
Connector 37% 63%
Ride-On 30% 70%
Metrobus 28% 72%
All 29% 71%

Findings on “Choice” Bus RidersFindings on “Choice” Bus Riders• The PRTC ART and DASH systems had the greatest
percentages of “choice” riders
• Choice riders are riders who had a vehicle available to them to make the trip they were making, but “chose” to make the trip by bus instead
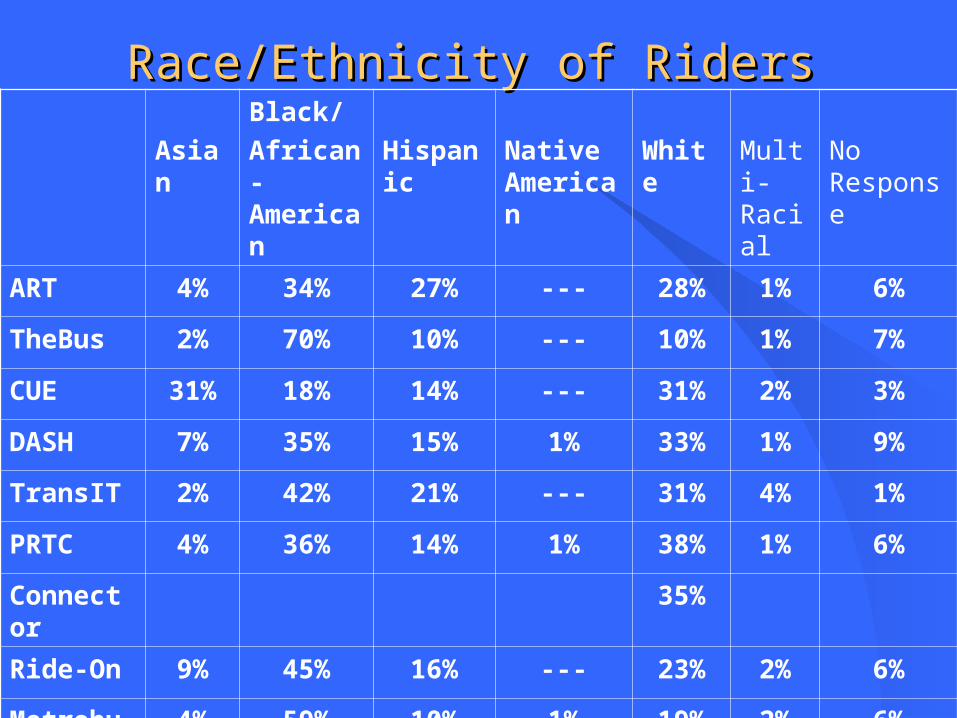
Race/Ethnicity of RidersRace/Ethnicity of Riders
Asian
Black/
African-American
Hispanic Native American
White Multi-Racial
No Response
ART 4% 34% 27% --- 28% 1% 6%
TheBus 2% 70% 10% --- 10% 1% 7%
CUE 31% 18% 14% --- 31% 2% 3%
DASH 7% 35% 15% 1% 33% 1% 9%
TransIT 2% 42% 21% --- 31% 4% 1%
PRTC 4% 36% 14% 1% 38% 1% 6%
Connector 35%
Ride-On 9% 45% 16% --- 23% 2% 6%
Metrobus 4% 59% 10% 1% 19% 2% 6%
Total 5% 56% 11% 1% 20% 2% 6%

Race/Ethnicity FindingsRace/Ethnicity Findings• The majority of riders on TheBus and Metrobus systems
identified their race/ethnicity as Black/African American
• By far, CUE had the greatest percentage of riders identifying themselves as Asian (31%)
• The ART and TransIT had high percentages of their riders identifying themselves as Hispanic, 27% on ART and 21% on TransIT
• TheBus had the lowest percentage of riders identifying themselves as white (10%)

Household IncomeHousehold Income<10K 10-20K 20-40K 40-60K 60-100K 100K+ No
Response
ART 22% 10% 15% 10% 15% 14% 14%
TheBus 16% 8% 24% 11% 17% 7% 17%
CUE 20% 9% 19% 15% 10% 12% 15%
DASH 16% 8% 20% 13% 16% 14% 13%
TransIT 31% 9% 32% 11% 5% 3% 8%
PRTC 14% 6% 13% 9% 18% 28% 12%
Connector (43%<30K) ,( 29% 30-70K), (18% 70-125K),( 11% 125K+)
Ride-On 18% 10% 20% 15% 13% 9% 15%
Metrobus 19% 11% 23% 14% 12% 9% 12%
Total 19% 10% 22% 14% 13% 9% 13%

Household Income FindingsHousehold Income Findings• Overall, 19% of the bus system riders surveyed reported
annual household income of less than $10,000 and more than half of all riders reported household incomes of less than $40,000
• Almost one-third of TransIT riders reported household incomes of less than $10,000
• About one-quarter of PRTC riders reported household incomes in excess of $100,000

Questions on Survey Results and Questions on Survey Results and Findings?Findings?


![[electrodynamics]-griffiths ans](https://cdn.vdocuments.us/doc/165x107/55c57e93bb61ebbd5d8b46ae/electrodynamics-griffiths-ans.jpg)
