2008 regional bus survey preliminary results presentation to the access for all advisory committee...
TRANSCRIPT

2008 2008 Regional Bus SurveyRegional Bus SurveyPreliminary ResultsPreliminary Results
Presentation to the
Access for All Advisory Committee
Robert E. GriffithsTechnical Services Director
April 23, 2009

Expanded On-Board Survey Expanded On-Board Survey Ridership TotalsRidership Totals
System Weekday Riders(Preliminary Factors)
ART 5,400
TheBus 15,300
CUE 3,600
DASH 14,700
TransIT 2,800
PRTC 12,400
Fairfax Connector 66,500
Ride-On 98,000
Metrobus 454,900
Total 673,500

Bus Riders Bus Riders Jurisdiction of ResidenceJurisdiction of Residence
System
Percent Distribution
DC Suburban Md
N. Virginia Outside Region
ART 5% 4% 90% 1%
TheBus 11% 88% 1% ---
CUE 5% 5% 88% 2%
DASH 3% 3% 94% 1%
TransIT --- 97% --- 3%
PRTC --- 1% 98% 1%
Connector 3% 3% 91% 3%
Ride-On 5% 93% 1% 1%
Metrobus 49% 33% 16% 1%
All 38% 43% 18% 1%
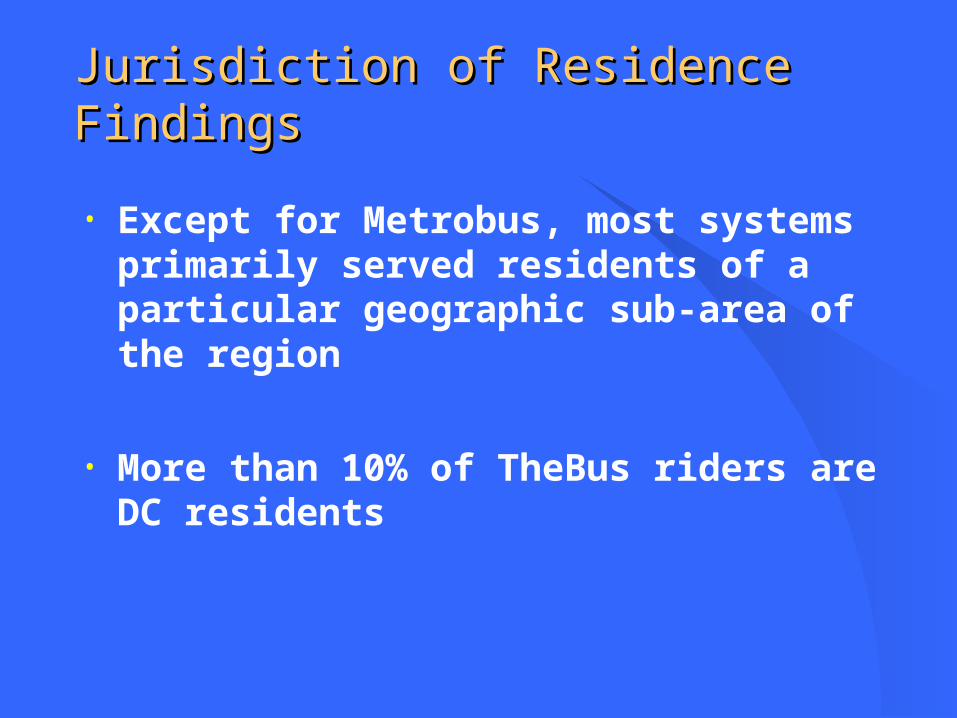
Jurisdiction of Residence FindingsJurisdiction of Residence Findings
• Except for Metrobus, most systems primarily served residents of a particular geographic sub-area of the region
• More than 10% of TheBus riders are DC residents

Access Mode to BusAccess Mode to Bus
Walk Metrorail Bus Auto D Auto P Bike Other
ART 76% 15% 7% 1% --- --- 1%
TheBus 49% 21% 10% 15% 3% --- 2%
CUE 65% 26% 6% 1% 1% --- 1%
DASH 71% 14% 10% 1% 2% --- 1%
TransIT 70% 1% 25% 1% 1% --- 1%
PRTC 49% 7% 12% 22% 8% --- 2%
Connector 49% 25% 14% 5% 4% --- 2%
Ride-On 54% 19% 20% 2% 3% --- 1%
Metrobus 59% 17% 18% 2% 2% --- 1%
All 58% 17% 18% 3% 2% --- 1%
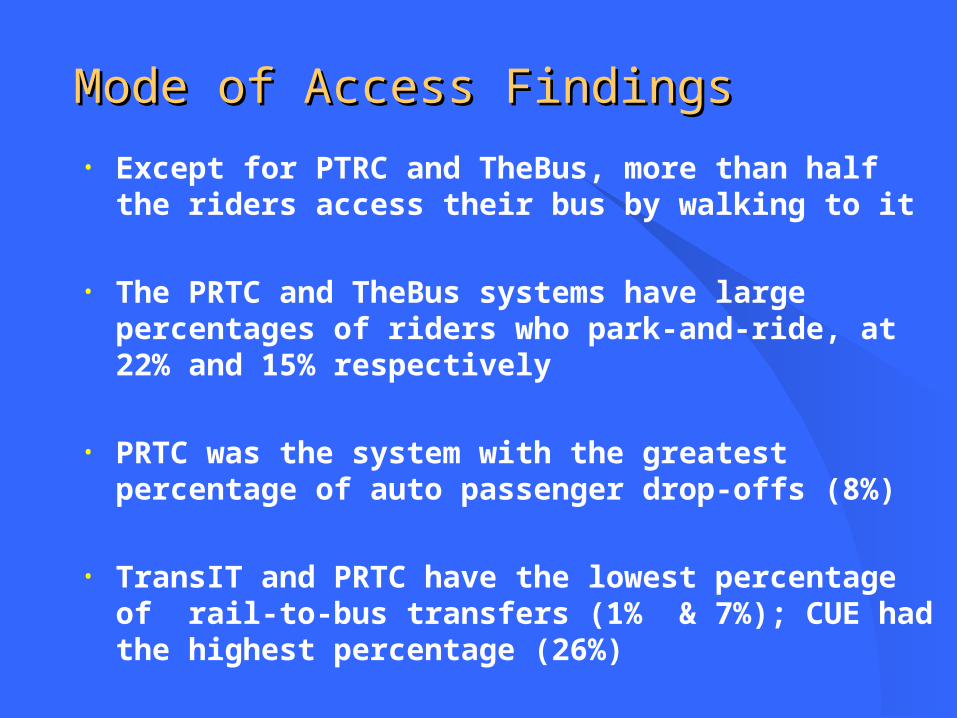
Mode of Access FindingsMode of Access Findings
• Except for PTRC and TheBus, more than half the riders access their bus by walking to it
• The PRTC and TheBus systems have large percentages of riders who park-and-ride, at 22% and 15% respectively
• PRTC was the system with the greatest percentage of auto passenger drop-offs (8%)
• TransIT and PRTC have the lowest percentage of rail-to-bus transfers (1% & 7%); CUE had the highest percentage (26%)

Purpose of TripPurpose of TripGo to Work
Job- Related
Personal Business
Shopping or Meal
To School
Soc/ Rec
Other
ART 62% 3% 13% 6% 15% 1% ---
TheBus 54% 4% 28% 6% 5% 3% ---
CUE 57% 2% 14% 3% 17% 5% 2%
DASH 63% 4% 14% 8% 6% 5% 1%
TransIT 56% 10% 18% 11% 4% 2% ---
PRTC 68% 3% 13% 9% 4% 3% ---
Connector 58% NA NA NA NA NA NA
Ride-On 52% 4% 19% 9% 9% 6% 1%
Metrobus 55% 5% 20% 7% 7% 5% ---
All 55% 5% 20% 7% 8% 5% 1%

Trip Purpose Findings Trip Purpose Findings
• Commuting to work accounts for one-half to two-thirds of the trips on each bus system
• TheBus was the system with the greatest percentage of its riders traveling for personal business reasons (28%)
• TransIT was the system with the greatest percentage of its riders making shopping trips or going to a restaurant (11%)
• A significant percentage of CUE and ART riders were traveling to school (17% for CUE and 15% for ART)

How Fare was PaidHow Fare was PaidCash Smart
TripWeekly Pass
Rail Transfer
Bus Transfer
Senior Discount
Other
ART 45% 36% 8% 2% 2% 1% 7%
TheBus 63% 8% 3% 3% 6% 6% 11%
CUE 39% 31% 2% 2% 3% --- 24%
DASH 43% 37% 2% 2% 4% --- 12%
TransIT 71% --- --- 3% 4% 5% 18%
PRTC 34% 57% --- --- --- 1% 8%
Connector 48% 41% --- --- --- --- 11%
Ride-On 34% 26% 15% 2% 2% 5% 16%
Metrobus 34% 42% 11% 2% 3% 3% 5%
All 35% 38% 11% 2% 3% 4% 7%

Fare Payment FindingsFare Payment Findings• SmarTrip was the predominant payment method used by
PRTC (57%) and Metrobus (42%)
• Cash was the primary mode of fare payment for TransIT (71%) and TheBus (63%) riders
• A significant percentage of Ride-On (15%) and Metrobus (11%) riders paid their fare using a weekly pass
• Approximately 5% of TheBus, TransIT and Ride-On riders paid a discounted senior citizen/disabled rider fare.

Number of TransfersNumber of Transfers
System
Total Number of Bus and Rail Transfers
No Transfers
One Transfer
Two Transfers
Three or More
Transfers
ART 38% 45% 13% 4%
TheBus 31% 47% 16% 6%
CUE 38% 47% 12% 3%
DASH 40% 44% 13% 3%
TransIT 34% 52% 9% 5%
PRTC 58% 29% 7% 6%
Connector 34% 45% 16% 5%
Ride-On 31% 48% 16% 6%
Metrobus 33% 45% 17% 5%
All 33% 45% 17% 5%
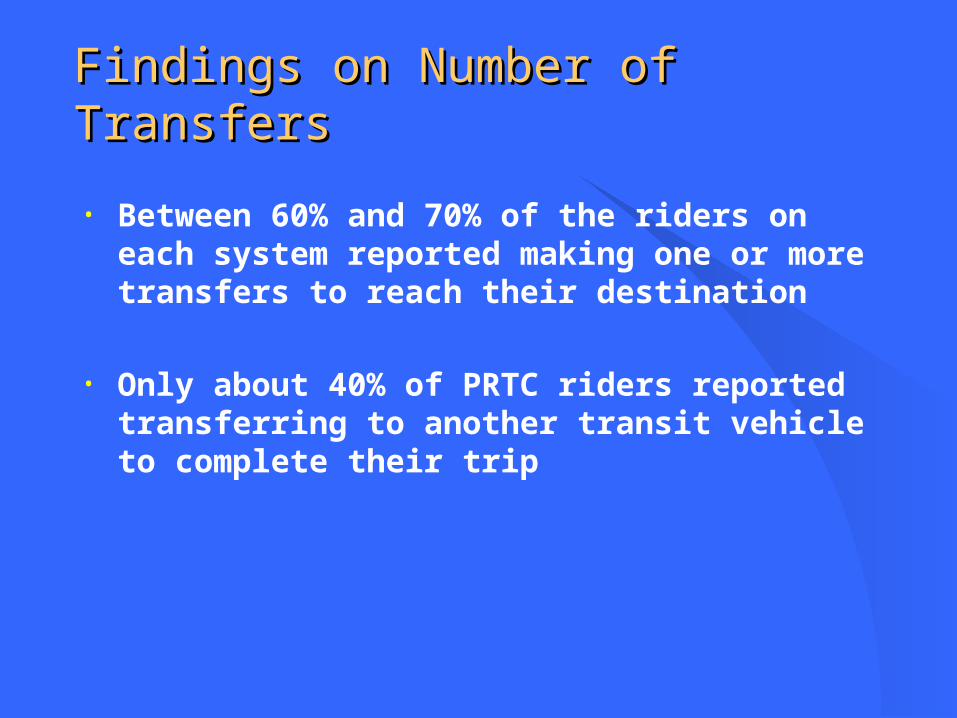
Findings on Number of TransfersFindings on Number of Transfers
• Between 60% and 70% of the riders on each system reported making one or more transfers to reach their destination
• Only about 40% of PRTC riders reported transferring to another transit vehicle to complete their trip

Receive Transit BenefitReceive Transit Benefit from Employer? from Employer?
System Yes No
ART 32% 68%
TheBus 13% 87%
CUE 23% 77%
DASH 35% 65%
TransIT 5% 95%
PRTC 42% 58%
Connector NA NA
Ride-On 21% 79%
Metrobus 24% 76%
All 24% 76%

Findings on Transit BenefitsFindings on Transit Benefits• Overall 24% of the surveyed bus riders reported
receiving a transit benefit from their employer
• Approximately 42% of PRTC riders, 35% of DASH
riders and 32% of ART riders said that they received a transit benefit
• Only 5% of TransIT riders and 13% of TheBus riders said they received a transit benefit from their employer

Number of Household VehiclesNumber of Household Vehicles
System
Number of HH Vehicles
No Vehicles
One Vehicle
Two Vehicles
Three or More
VehiclesART 43% 42% 13% 3%
TheBus 49% 26% 21% 4%
CUE 45% 31% 19% 5%
DASH 37% 43% 17% 3%
TransIT 52% 31% 10% 7%
PRTC 26% 30% 28% 17%
Connector 40% 29% 23% 8%
Ride-On 43% 31% 19% 6%
Metrobus 53% 30% 13% 4%
Total 50% 31% 14% 5%

FindingsFindings on Household Vehicle Availabilityon Household Vehicle Availability
• Approximately 50% of the riders on the Metrobus, TransIT and TheBus systems are from households without autos or other vehicles
• PRTC Riders were twice as likely to live in households with 2 or more vehicles than bus riders on other systems and three times more likely to live households with 3 or more vehicles in than riders on other systems

Was a Vehicle Available Was a Vehicle Available for This Trip? for This Trip?
System Yes No
ART 42% 58%
TheBus 27% 73%
CUE 33% 67%
DASH 40% 60%
TransIT 24% 76%
PRTC 54% 46%
Connector 37% 63%
Ride-On 30% 70%
Metrobus 28% 72%
All 29% 71%

Findings on “Choice” Bus RidersFindings on “Choice” Bus Riders• The PRTC ART and DASH systems had the greatest
percentages of “choice” riders
• Choice riders are riders who had a vehicle available to them to make the trip they were making, but “chose” to make the trip by bus instead
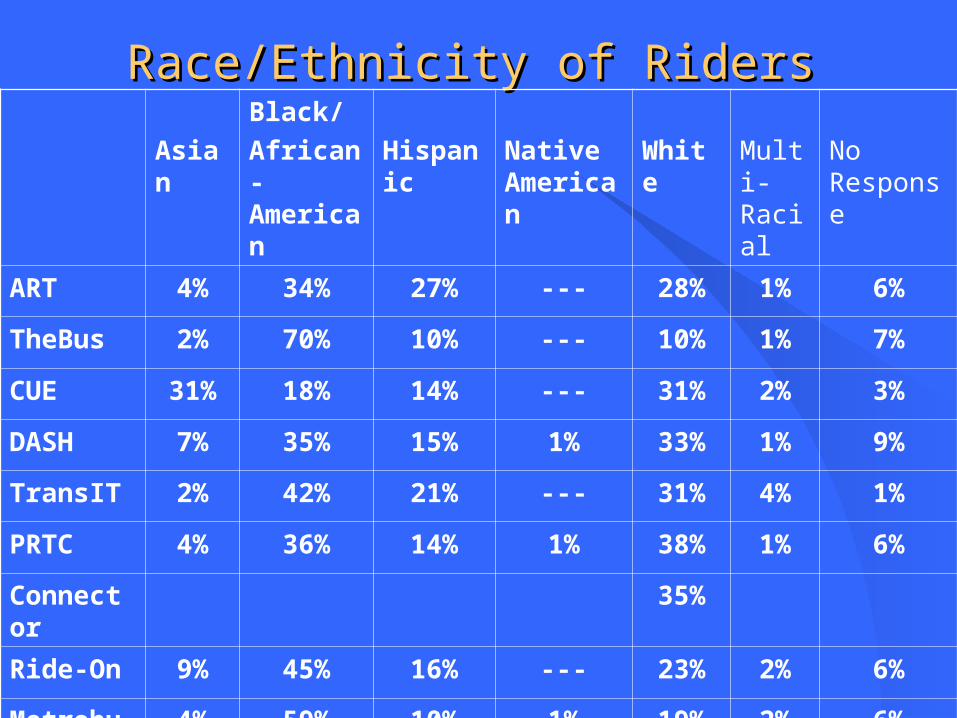
Race/Ethnicity of RidersRace/Ethnicity of Riders
Asian
Black/
African-American
Hispanic Native American
White Multi-Racial
No Response
ART 4% 34% 27% --- 28% 1% 6%
TheBus 2% 70% 10% --- 10% 1% 7%
CUE 31% 18% 14% --- 31% 2% 3%
DASH 7% 35% 15% 1% 33% 1% 9%
TransIT 2% 42% 21% --- 31% 4% 1%
PRTC 4% 36% 14% 1% 38% 1% 6%
Connector 35%
Ride-On 9% 45% 16% --- 23% 2% 6%
Metrobus 4% 59% 10% 1% 19% 2% 6%
Total 5% 56% 11% 1% 20% 2% 6%

Race/Ethnicity FindingsRace/Ethnicity Findings• The majority of riders on TheBus and Metrobus systems
identified their race/ethnicity as Black/African American
• By far, CUE had the greatest percentage of riders identifying themselves as Asian (31%)
• The ART and TransIT had high percentages of their riders identifying themselves as Hispanic, 27% on ART and 21% on TransIT
• TheBus had the lowest percentage of riders identifying themselves as white (10%)

Household IncomeHousehold Income<10K 10-20K 20-40K 40-60K 60-100K 100K+ No
Response
ART 22% 10% 15% 10% 15% 14% 14%
TheBus 16% 8% 24% 11% 17% 7% 17%
CUE 20% 9% 19% 15% 10% 12% 15%
DASH 16% 8% 20% 13% 16% 14% 13%
TransIT 31% 9% 32% 11% 5% 3% 8%
PRTC 14% 6% 13% 9% 18% 28% 12%
Connector (43%<30K) ,( 29% 30-70K), (18% 70-125K),( 11% 125K+)
Ride-On 18% 10% 20% 15% 13% 9% 15%
Metrobus 19% 11% 23% 14% 12% 9% 12%
Total 19% 10% 22% 14% 13% 9% 13%

Household Income FindingsHousehold Income Findings• Overall, 19% of the bus system riders surveyed reported
annual household income of less than $10,000 and more than half of all riders reported household incomes of less than $40,000
• Almost one-third of TransIT riders reported household incomes of less than $10,000
• About one-quarter of PRTC riders reported household incomes in excess of $100,000

Questions on Survey Results and Questions on Survey Results and Findings?Findings?