douglas partners - home page - mitchell shire council · pdf filedouglas partners geotechnics...
TRANSCRIPT

tj)
-o I. a) as
J)
Douglas Partners Geotechnics I Environment I Groundwater
Report on Groundwater Investigation
Proposed Clay Quarry 2330 Epping Kilmore Road
Wallan
Prepared for Austral Bricks
Project: 79048.00 10 January 2014

11[1] Douglas Partners Geotechnics I Environment I Groundwater I I I I I M I 1 Geotechnics I Environment I Groundwater
Document History
Document details Project No. 79048.00 Document title Report on Groundwater Investigation
Proposed Clay Quarry Site address 2330 Epping - Kilmore Road, Wallan Report prepared for Austral Bricks
Document status and review Revision Prepared by Reviewed by Date issued
0 Jim Curtis Glyn Eade 10 January 2014
Distribution of copies Revision Electronic Paper Issued to
1 Austral Bricks
The undersigned, on behalf of Douglas Partners Pty Ltd, confirm that this document and all attached drawings, logs and test results have been checked and reviewed for errors, omissions and inaccuracies.
Signature Date
Author -
Reviewer t o I LF.
104
0 CERTIFIED
QUALITY MA...3AGEUE4T $YSIEU
Douglas Partners Pty Ltd ABN 75 053 980 117
www.douglaspartners.com.au 231 Normanby Road
PO Box 5051 South Melbourne VIC 3205
Phone (03) 9673 3500 Fax (03) 9673 3599
1
1 1
1 1

111EDouglas Partners Geotechnics 1 Environment 1 Groundwater
Table of Contents
Page
1 . Introduction 1
2. Scope of Work 1
3. Background Information 1
3.1 Site Description 1
3.2 Geology and Hydrogeology 2 3.2.1 Geology 2 3.2.2 Hydrogeology 2
3.3 Previous Investigation 2
4. Method of Investigation 3
4.1 Well Boring and Construction 3
4.2 Groundwater Sampling 3
4.3 Laboratory Analysis 4
5. Results of Investigation 5
5.1 Field Work Results 5 5.1.1 Subsurface Conditions 5 5.1.2 Groundwater Sampling Results 6
5.2 Groundwater Flow Direction 6
5.3 Groundwater Assessment Criteria 7
5.4 Groundwater Laboratory Results 8 5.4.1 General Chemistry 8 5.4.2 Comparison to Beneficial Use Criteria 8 5.4.3 Quality Assurance (QA) and Quality Control (QC) 9
6. Summary / Conclusions and Recommendations 10
6.1 Groundwater Quality 10
6.2 Groundwater Contamination 10
6.3 Groundwater Management 11
6.4 Salinity Management Overlay 11
6.5 Effects on Merri Creek 11
6.6 Recommendations 11
7. Limitations 12
Report on Groundwater Investigation Project : 79048.00 2330 Epping - Kilmore Road, Wallan 10 January 2014

IBDoug las Partners Geotechnics I Environment I Groundwater
Appendix A: Notes About This Report
Appendix B: Drawings
Appendix C: Borehole Logs
Appendix D Tabulated Laboratory Results Laboratory Analysis Reports
Appendix E Bore Construction License
Appendix F Quality Assurance / Quality Control
Report on Groundwater Investigation Project : 79048.00 2330 Epping - Kilmore Road, Wallan 10 January 2014

I C D o u g l a s Partners Geotechnics I Environment I Groundwater 1 of 12
Report on Groundwater Investigation Proposed Clay Quarry 2330 Epping - Kilmore Road, Wallan
1. Introduction
Douglas Partners Pty Ltd (DP) was engaged by Austral Bricks (AB) to conduct a groundwater investigation at the site of a proposed Clay Quarry located at 2330 Epping - Kilmore Road in Wallan.
It is understood that the proposed quarrying works will involve excavation to depths of up to 6.5 m below existing site levels during seven stages of works and that the excavations will be subsequently backfilled on completion.
The Investigation works are required by Melbourne Water (MW) to assess groundwater conditions at the site prior to the commencement of quarrying operations and to assess likely groundwater management requirements during operations, potential impact on water flows in the Merri Creek and groundwater implications in relation to a Salinity Management Overlay which is applicable to the site.
2. Scope of Work
The agreed scope of work is provided in DP's proposal MEL130412, dated 11 September 2013 and can be summarised as:
• Drilling and installation of six groundwater monitoring wells to a target depth of between 5 - 8 m;
• Logging of the subsurface conditions encountered;
• Conducting a single round of groundwater standing water level measurements and sampling of the six wells;
• Laboratory testing of groundwater samples collected for a limited suite of potential contaminants and water quality parameters; and
• Preparation of this report detailing the findings of the investigation.
3. Background Information
3.1 Site Description
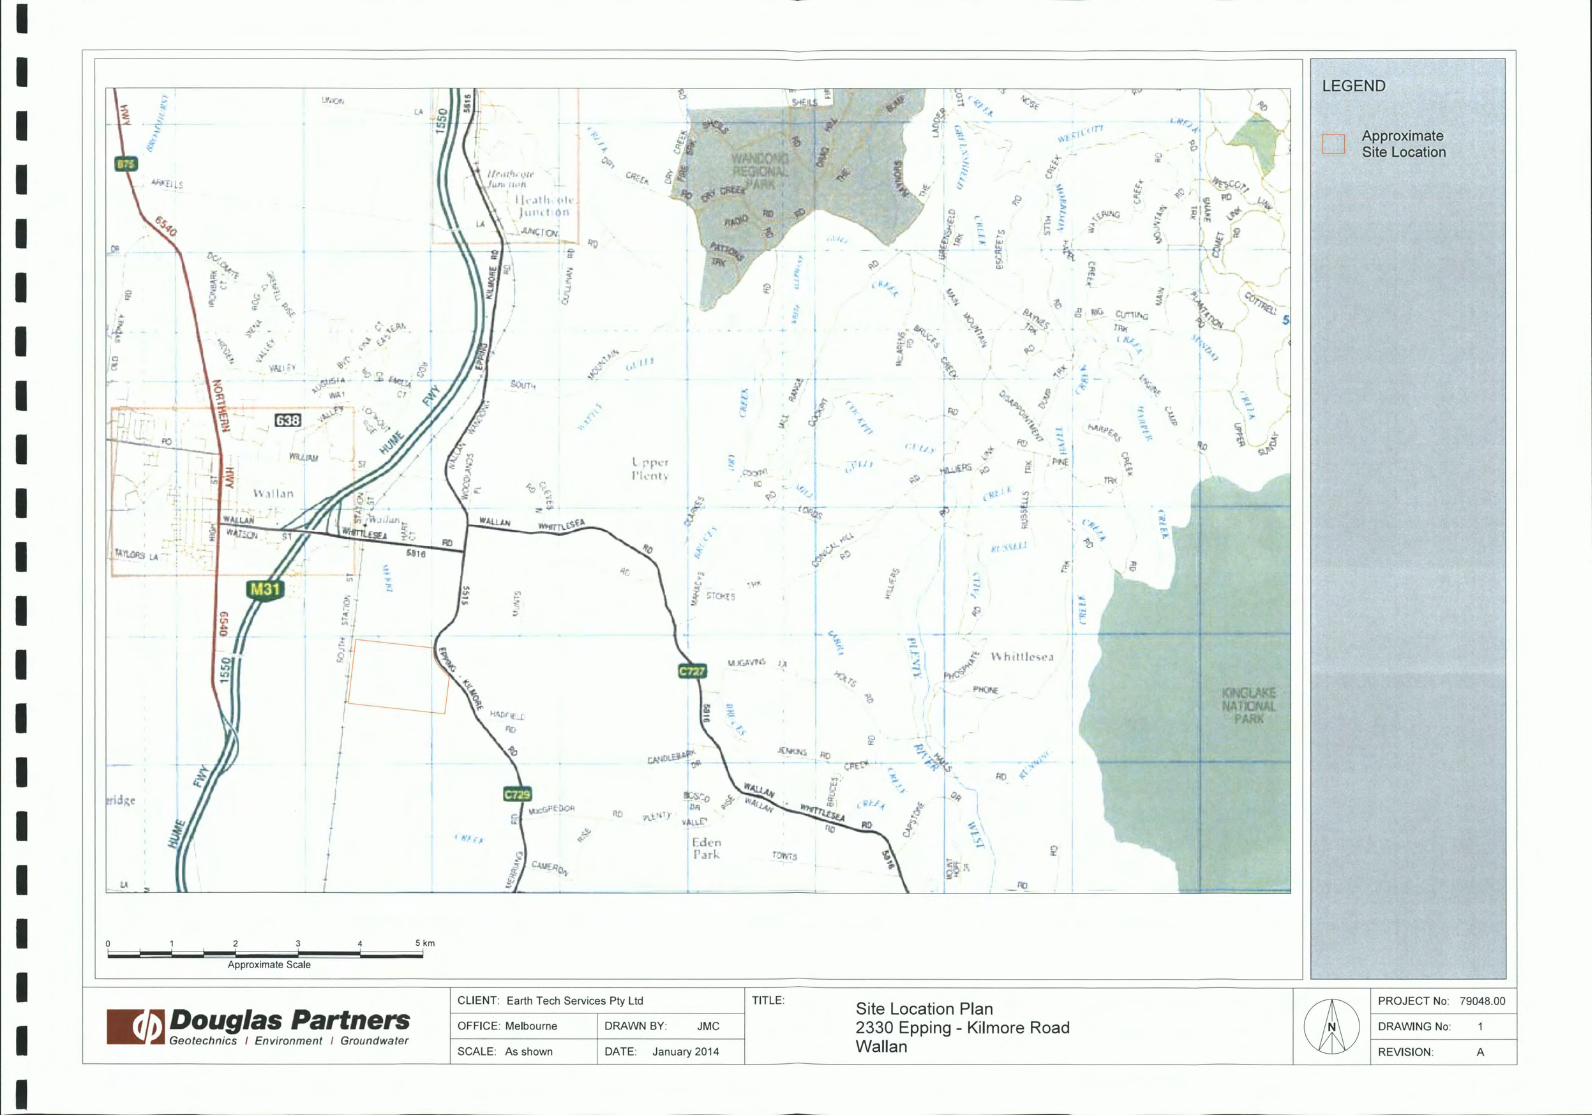
The site is located on the western side of the Epping - Kilmore Road in Wallan and comprises an area of approximately 157 hectares. The location of the site is shown on Drawing 1, Appendix B.
At the time of the investigation, the site dominantly comprised cleared land utilised for cattle grazing and horse agistment. A farmhouse and associated buildings were located in the south-eastern area of the site. Surrounding land use comprised further cleared farm land to the north and south, the Epping Kilmore Road and farmland to the east and a rail line, cleared farmland and a water treatment plant to the west.
Report on Groundwater Investigation Project : 79048.00 2330 Epping - Kilmore Road, Wallan 10 January 2014

EgDouglas Partners Geotechnics I Environment I Groundwater 2 of 12
The site topography comprised a level flood plain set at approximately RL 294.5 (mAHD). A locally elevated area of up to RL 320 mAHD, however was located along the central eastern site boundary.
Onsite surface water features include a 1.2 km long section of the north-south oriented Merri Creek, located in the western half of the site, a 0.4 km section of an east-west oriented tributary to the Merri Creek in the central west of the site and several farm dams. Based on the observed topography, surface water is expected to drain toward and discharge into the Merri Creek.
3.2 Geology and Hydrogeology
3.2.1 Geology
The Geological Survey of Victoria's 1:63 360 Scale King Lake Map Sheet indicates that the majority of the site is underlain by Quaternary Age alluvial deposits comprising clay, silt, sand and minor gravel. The map further indicates that additional units including Silurian Age siltstones and sandstones (Dargile Formation) underlie the elevated area located along the eastern site boundary and Quaternary Age Basalt (Newer Volcanics) underlies the south-west corner of the site.
3.2.2 Hydrogeology
Published data on regional aquifer geology and groundwater quality (Victorian Groundwater Beneficial Use Map Series, South Western Victoria Water Table Aquifers - Department o f Conservation and Natural Resources 1995) indicates the regional aquifer to comprise pre-Tertiary siltstone and sandstone (Dargile Formation) and groundwater to be part of Segment B of the groundwater environment.
For segment B, groundwater salinity (TDS) is expected to be between 1,001 to 3,500 mg/L. The protected beneficial uses for Segment B under the SEPP (Groundwaters of Victoria) are:
• Ecosystem protection;
• Irrigation;
• Stock water;
• Industrial water use;
• Primary Contact Recreation; and
• Buildings and structures.
Based on the regional topography and location of the Merri Creek, groundwater across the majority of the site is expected to be flowing to the west or south west and discharging into Merri Creek.
3.3 Previous Investigation
In 2012, Earthtech Services conducted an exploration drilling program on behalf of Austral Bricks which comprised the drilling of 26 boreholes to depths of between 6 m and 21 m below existing site surface levels.
Report on Groundwater Investigation Project : 79048.00 2330 Epping - Kilmore Road, Wallan 10 January 2014

E l D o u g l a s Partners Geotechnics I Environment I Groundwater 3 of 12
Subsurface conditions typically comprised between 8 m and 18 m of alluvial clays overlying basalt. Siltstone was encountered at depths of between 5 m and 15.5 m at five locations in the north-east corner of the site and within the central eastern area of the site adjacent to areas of elevated topography.
Based on information provided to DP, groundwater was encountered at depths of approximately 4 m below site surface levels during the drilling works.
4. Method of Investigation
4.1 Well Boring and Construction
DP supervised the installation of six groundwater monitoring wells (GW1 - GW6) across the site at the locations shown on Drawing 2 in Appendix B. The planned location of the wells was intended to provide broad coverage across the site. Final well locations however, were restricted due to current farming activities and proposed future quarrying works and infrastructure.
The wells were drilled and installed on 6 and 7 November 2013 by Horizon Drilling under the supervision of DP engineers. Prior to drilling, a bore construction licence WLE058304 was obtained from Southern Rural Water, as required by the Water Act 1989. A copy of the license is provided in Appendix E.
The bores were drilled using a 4WD mounted 100 mm solid flight auger to depths of between 6 m and 6.5 m below existing site levels. All wells were screened across the anticipated groundwater level as based on drilling observations.
Each well was constructed using new 50 mm diameter PVC casing and machine slotted PVC screen. A gravel pack of 8/16 grade sand was placed between the screen and the soil extending beyond the top of the PVC screen by at least 0.5 m, and a bentonite seal was placed above the sand. Each well was backfilled with cement/bentonite grout above the bentonite seal.
Following construction, the wells were developed using an electric pump to maximise the hydraulic connection between the bore and the surrounding geological formation. The development process comprised the removal of a minimum of 3 bore volumes of water.
The groundwater well co-ordinates were recorded by DP using a hand held GPS unit set to WGS 84 Zone 55H and surface levels at the well locations were extrapolated from a client supplied survey plan.
4.2 Groundwater Sampling
Measurement of groundwater levels, purging, field testing and sampling of the six wells was conducted on 21 November 2013. In total six primary groundwater samples were collected in addition to two quality control (QC) samples. Further information and assessment of quality assurance / quality control (QA/QC) is presented in Section 5.4.3 and Appendix F.
Report on Groundwater Investigation Project : 79048.00 2330 Epping - Kilmore Road, Wallan 10 January 2014

I E l D o u g l a s Partners I
Geotechnics I Environment I Groundwater 4 of 12
Groundwater sampling and decontamination was conducted in general accordance with EPA Publication 669, April 2000, "Groundwater Sampling Guidelines". The general decontamination and sample handling procedure comprised:
• Decontamination of all re-usable sampling and purging equipment between sampling locations using a 3% solution of phosphate free detergent (Extran) and then rinsing with deionised water prior to collecting groundwater samples at each groundwater well location;
• Samples to be analysed for metals were filtered in the field using a 0.45 pm in line filter;
• All groundwater samples were collected into appropriate laboratory prepared sample containers and immediately capped;
• All samples were labelled with individual and unique identification details including project number, sampling date and well number; and
• All samples were placed into a cooled, insulated and sealed container for transport to the NATA accredited laboratory. The samples were transported to the analytical laboratory accompanied by chain of custody documentation at the completion of field work.
The wells were purged and sampled using a disposable hand bailer, with a new hand bailer used at each well. Prior to sampling all water in the wells was removed and sampling performed following sufficient well recharge. All water purged prior to sampling was field tested for dissolved oxygen, total dissolved solids (TDS), pH, redox potential and temperature using a flow cell and water quality meter.
4.3 Laboratory Analysis
Details of the analytical program for the primary groundwater samples collected are provided in Table 1.
Table 1 : Summary of Groundwater Sampling and Laboratory Analysis
Well ID Sample ID Sampling Method
Analytical Program
Primary Samples
GW1 GW1-211113
GW2 GW2-211113 Metals (arsenic, cadmium, chromium, copper, GW3 GW3-211113
Hand Bailer mercury, molybdenum, nickel, lead, tin, selenium,
silver and zinc), total nitrogen, nitrate, nitrite, ammonia, total dissolved solids (TDS), pH, major GW4 GW4-211113
GW5 GW5-211113 anions and cations, and pH.
GW6 GW6-211113
QC Samples
GW1 DUP1-211113 Hand Bailer As above
- RIN-211113 Hand Bailer
Report on Groundwater Investigation 2330 Epping - Kilmore Road, Wallan
Project : 79048.00 10 January 2014
I I I I I I I I I I I I I I I I 1 I I
t o D o u g l a s Partners Geotechnics I Environment I Groundwater 5 of 12
1
Testing of all samples was performed by ALS Laboratory Group (ALS), who are accredited with the National Association of Testing Authorities (NATA), for the analyses required. All analyses were conducted within the holding times recommended by EPA Victoria publication IWRG701, Sampling and Analysis o f Waters, Wastewaters, Soils and Wastes, June 2009.
5. Results of Investigation
5.1 Field Work Results
5.1.1 Subsurface Conditions
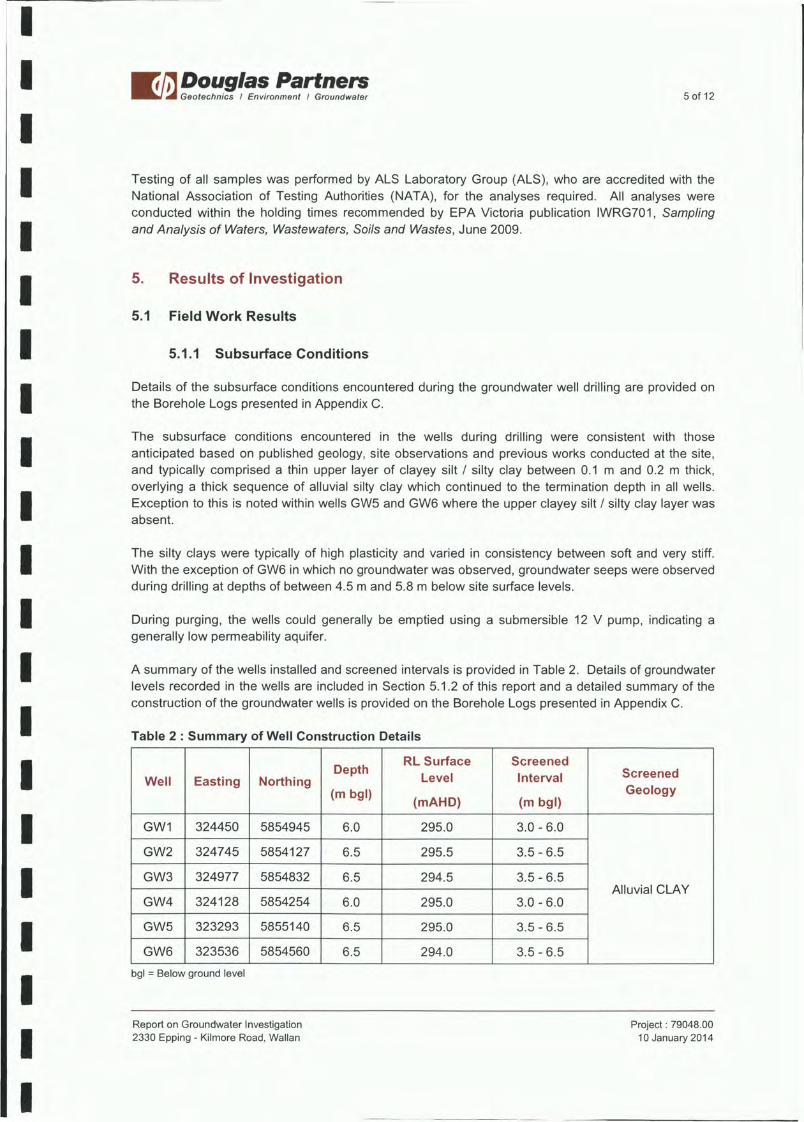
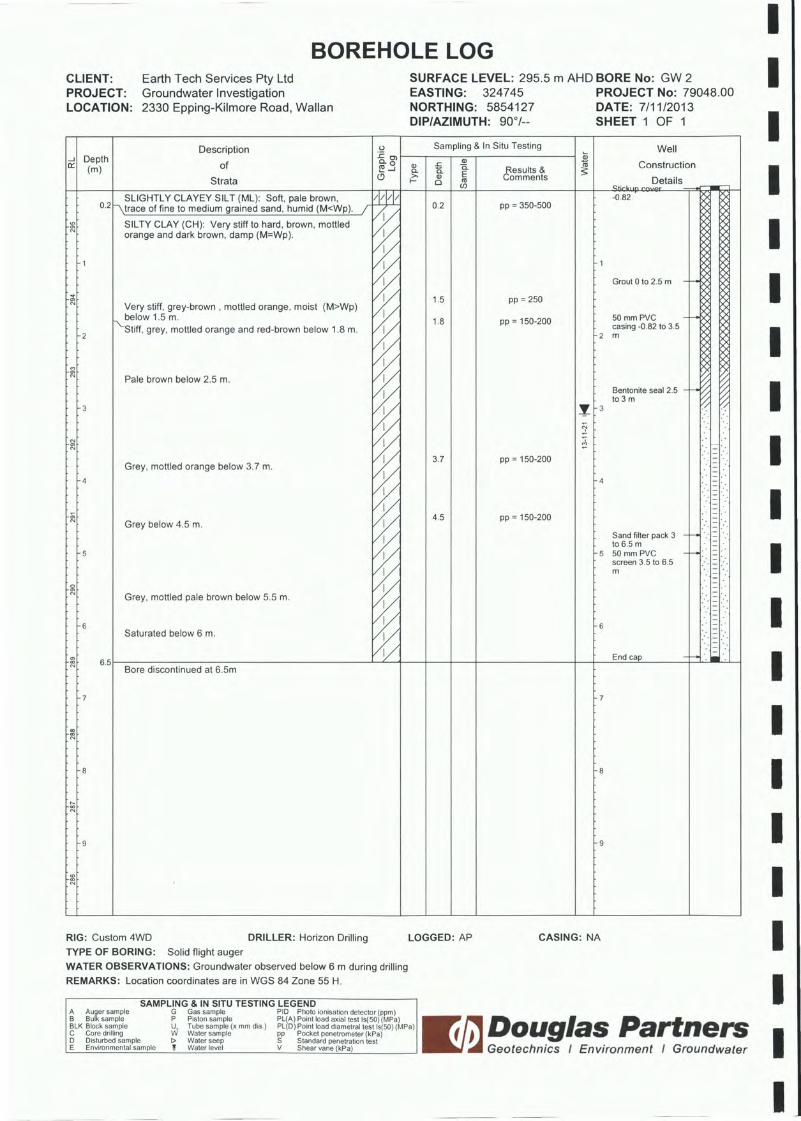
Details of the subsurface conditions encountered during the groundwater well drilling are provided on the Borehole Logs presented in Appendix C.
The subsurface conditions encountered in the wells during drilling were consistent with those anticipated based on published geology, site observations and previous works conducted at the site, and typically comprised a thin upper layer of clayey silt / silty clay between 0.1 m and 0.2 m thick, overlying a thick sequence of alluvial silty clay which continued to the termination depth in all wells. Exception to this is noted within wells GW5 and GW6 where the upper clayey silt / silty clay layer was absent.
The silty clays were typically of high plasticity and varied in consistency between soft and very stiff. With the exception of GW6 in which no groundwater was observed, groundwater seeps were observed during drilling at depths of between 4.5 m and 5.8 m below site surface levels.
During purging, the wells could generally be emptied using a submersible 12 V pump, indicating a generally low permeability aquifer.
A summary of the wells installed and screened intervals is provided in Table 2. Details of groundwater levels recorded in the wells are included in Section 5.1.2 of this report and a detailed summary of the construction of the groundwater wells is provided on the Borehole Logs presented in Appendix C.
Table 2 : Summary of Well Construction Details
Well Easting Northing Depth
(m bgl)
RL Surface Level
(mAHD)
Screened Interval
(m bgl)
Screened Geology
GW1 324450 5854945 6.0 295.0 3.0 - 6.0
Alluvial CLAY
GW2 324745 5854127 6.5 295.5 3.5 - 6.5
GW3 324977 5854832 6.5 294.5 3.5 - 6.5
GW4 324128 5854254 6.0 295.0 3.0 - 6.0
GW5 323293 5855140 6.5 295.0 3.5 - 6.5
GW6 323536 5854560 6.5 294.0 3.5 - 6.5 bgl = Below ground level
Report on Groundwater Investigation 2330 Epping - Kilmore Road, Wallan
Project : 79048.00 10 January 2014

JJDouglas Partners Geotechnics I Environment I Groundwater 6 o f 12
5.1.2 Groundwater Sampling Results
A summary of groundwater standing water levels and sampling conditions is provided in Table 3.
Standing water levels (SWL) recorded in the wells ranged between 0.95 m and 3.08 m below ground level.
Field recorded EC and pH values ranged between 1,232- 12,780 pS and 6.19 - 7.12 respectively.
The groundwater encountered during the sampling did not demonstrate any indications of potential contamination including odours or sheens.
Table 3 : Summary of Groundwater Measurements / Observations during Sampling
Well ID SWL
m (bgl)
pH EC
(i.JS)
TDS (Calculated)*
mg/L
Water Observations
GW1 1.55 6.84 4,150 2,490 Pale brown, no odour
GW2 3.08 6.19 12,780 7,668 Pale brown, no odour
GW3 2.11 6.60 2,091 1,255 Pale brown, no odour
GW4 2.38 6.53 9,940 5,964 Pale brown, no odour
GW5 0.95 7.12 4,320 2,592 Pale brown, no odour
GW6 2.22 7.01 1,232 739 Pale brown, no odour bgl = below ground level EC = Electrical conductivity
mS = millisiemens *TDS = total dissolved solids (EC x 0.6)
5.2 Groundwater Flow Direction
Based on surface level data of the monitoring well locations combined with the measured standing water levels, an inferred south-westerly groundwater flow direction, towards the Merri Creek was established for the central and eastern areas of the site (areas east of Merri Creek) and a south-easterly
flow direction was established for the western site area (areas west of Merri Creek) toward the Merri Creek and its onsite tributary. This was generally consistent with anticipated flow directions based on visual observations of site topography and local surface water bodies.
Survey data and water level (RL) data derived from the standing water level measurements collected during sampling used to provide the flow direction are summarised in Table 4. Groundwater contours based on the calculated groundwater RLs are shown on Drawing 2, Appendix B.
Based on the established flow directions, monitoring wells GW1, GW3 and GW5 would represent up-gradient wells.
Report on Groundwater Investigation Project : 79048.00 2330 Epping - Kilmore Road, Wallan 10 January 2014

KADouglas Partners Geotechnics I Environment Groundwater
Table 4 : Summary of GL Data, and SWL Data
Well RL (GL)
m (AHD)
RL (SWL)
m (AHD)
GW1 295.0 293.5
GW2 295.5 292.4
GW3 294.5 292.4
GW4 295.0 292.6
GW5 295.0 294.1
GW6 294.0 291.1 AHD = GL = SWL =
Australian Height Datum Ground Level
Standing Water Level
5.3 Groundwater Assessment Criteria
7 of 12
Based on the field recorded EC / TDS values for groundwater encountered at the site, which ranged between 1,232 pS and 12,780 pS / 739 mg/L and 7,668 mg/L respectively, and likely groundwater receptors comprising the Merri Creek, the following policies and relevant segments of the groundwater environment are considered applicable to groundwater at the site.
Policy Segment
State Environmental Protection Policy (SEPP) — Groundwaters of Victoria Segment C
This is contrary to published data on salinity which indicates site groundwater to be part of segment B.
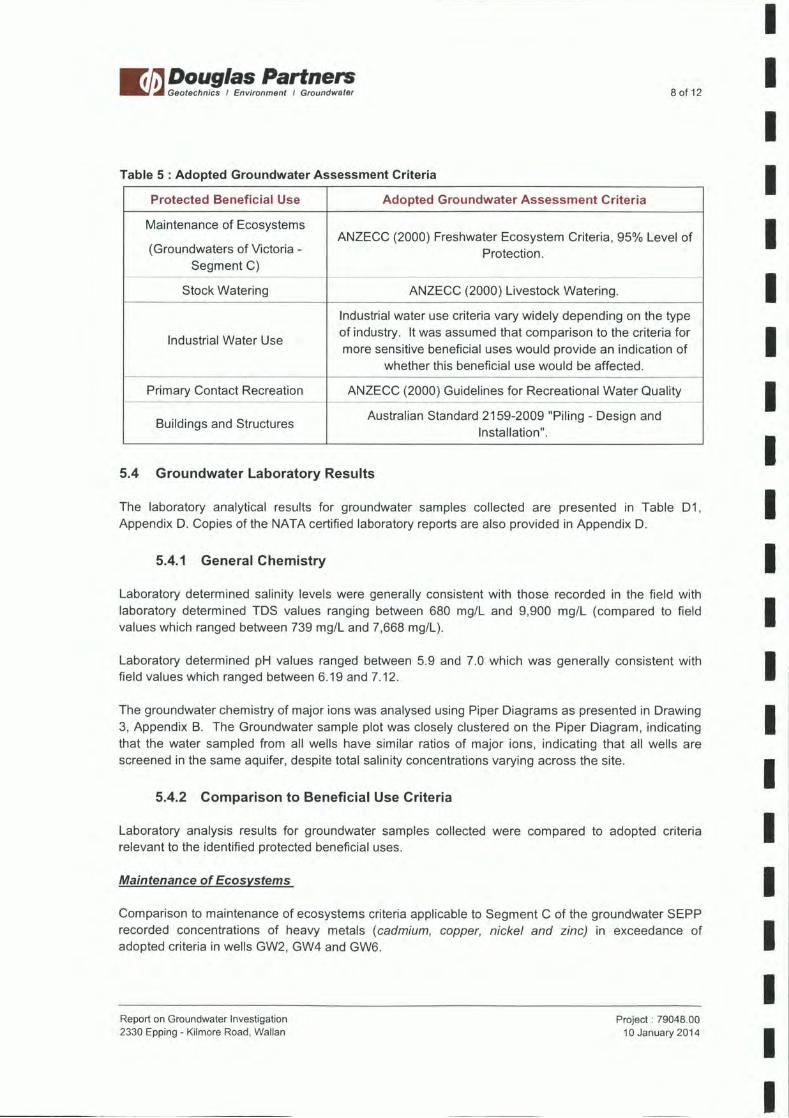
The subsequent assessment criteria used to compare groundwater laboratory analysis results are summarised in Table 5 and the adopted assessment criteria are provided in Table D1 in Appendix D.
Report on Groundwater Investigation Project : 79048.00 2330 Epping - Kilmore Road, Wallan 10 January 2014
IEDoug las Partners Geotechnics I Environment I Groundwater
Table 5 : Adopted Groundwater Assessment Criteria
8 of 12
Protected Beneficial Use Adopted Groundwater Assessment Criteria
Maintenance of Ecosystems
(Groundwaters of Victoria - Segment C)
Stock Watering
Industrial Water Use
Primary Contact Recreation
Buildings and Structures
ANZECC (2000) Freshwater Ecosystem Criteria, 95% Level of Protection.
ANZECC (2000) Livestock Watering.
Industrial water use criteria vary widely depending on the type of industry. It was assumed that comparison to the criteria for more sensitive beneficial uses would provide an indication of
whether this beneficial use would be affected.
ANZECC (2000) Guidelines for Recreational Water Quality
Australian Standard 2159-2009 "Piling - Design and Installation".
5.4 Groundwater Laboratory Results
The laboratory analytical results for groundwater samples collected are presented in Table D1, Appendix D. Copies of the NATA certified laboratory reports are also provided in Appendix D.
5.4.1 General Chemistry
Laboratory determined salinity levels were generally consistent with those recorded in the field with laboratory determined TDS values ranging between 680 mg/L and 9,900 mg/L (compared to field values which ranged between 739 mg/L and 7,668 mg/L).
Laboratory determined pH values ranged between 5.9 and 7.0 which was generally consistent with field values which ranged between 6.19 and 7.12.
The groundwater chemistry of major ions was analysed using Piper Diagrams as presented in Drawing 3, Appendix B. The Groundwater sample plot was closely clustered on the Piper Diagram, indicating that the water sampled from all wells have similar ratios of major ions, indicating that all wells are screened in the same aquifer, despite total salinity concentrations varying across the site.
5.4.2 Comparison to Beneficial Use Criteria
Laboratory analysis results for groundwater samples collected were compared to adopted criteria relevant to the identified protected beneficial uses.
Maintenance of Ecosystems Comparison
to maintenance of ecosystems criteria applicable to Segment C of the groundwater SEPP recorded concentrations of heavy metals (cadmium, copper, nickel and zinc) in exceedance of adopted criteria in wells GW2, GW4 and GW6.
Report on Groundwater Investigation Project : 79048.00 2330 Epping - Kilmore Road, Wallan 10 January 2014

11BDouglas Partners Geotechnics I Environment I Groundwater
A summary of recorded exceedances of the adopted ecosystems criteria is presented in Table 6.
Table 6: Summary of Ecosystems Criteria Exceedances
Analyte Concentration
Range Criteria
mg/L
Recorded Exceedances
Cadmium <0.0002 - 0.0003 0.0002 GW4
Copper 0.001 - 0.003 0.0014 GW2 and GW6
Nickel 0.002 - 0.051 0.011 GW2 and GW4
Zinc 0.002 - 0.019 0.008 GW2
Stock Water
All results were below the adopted stock water criteria for all wells.
Primary Contact Recreation (PCR)
9 of 12
With the exception of GW6 all wells recorded exceedances of the PCR criteria for chloride and sodium.
Buildings and Structures Laboratory
analysis results reported pH, chloride and sulphate concentration at levels below the adopted buildings and structures criteria indicating that site groundwater is not considered aggressive to steel or concrete structures.
5.4.3 Quality Assurance (QA) and Quality Control (QC)
As part of the project quality procedures, data quality objectives (DQ05) and data quality indicators (DQ15), in accordance with AS 4482.1 - 2005, were developed to ensure the integrity and reproducibility of the tests and to provide a check on the potential for cross-contamination during the sampling process. These and other information on quality assurance and quality control are presented in Appendix F.
The accuracy and precision of the groundwater testing procedures for this assessment are considered by DP to be of sufficient standard to allow the data reported by the nominated laboratory to be used for interpretation of site groundwater contamination conditions.
Report on Groundwater Investigation Project : 79048.00 2330 Epping - Kilmore Road, Wallan 10 January 2014

1171 Douglas Partners Geotechnics I Environment I Groundwater 10 of 12
6. Summary / Conclusions and Recommendations
Groundwater was encountered within alluvial silty clays at depths of between 4.5 m and 5.8 m below site surface levels during the drilling and installation of the six groundwater monitoring wells. Standing water levels measured in the completed wells varied between 0.95 m and 3.08 m below site surface levels (RL 291.1 to 294.1 RL mAHD). The shallow groundwater levels recorded were consistent with those anticipated based on the observed site topography which was dominated by a low lying, level flood plain. The inferred groundwater flow direction across the eastern and central areas of the site is toward the southwest and in the west of the site toward the southeast with all groundwater likely discharging into the Merri Creek or its onsite tributary.
Based on the results of the groundwater investigation and planned depths of excavation during the proposed quarrying activities of up to 6.5 m below current surface levels, groundwater is expected to be encountered during the quarrying works. Based on the results of the purging and sampling conducted during the investigation, aquifer permeability is considered to be generally low and as such groundwater inflow rates into open excavations is also anticipated to be low. Variation in inflow rates in response to variations in aquifer permeability however, should be expected across the site.
6.1 Groundwater Quality
Laboratory determined salinity levels ranged between 680 mg/L and 9,900 mg/L (Total dissolved solids (TDS)) and pH values ranged between 5.9 and 7.0.
Although a significant variation in salinity values recorded between wells is noted, comparison of the ratio of major ions in groundwater from individual wells (see Piper Plot Drawing 3) indicates that all wells intercept the same aquifer. This is consistent with drilling observations. As such, the variation in TDS values recorded is considered likely a result of natural variation within the aquifer.
The pH values indicate neutral to slightly alkaline groundwater conditions and are also considered to represent the natural groundwater conditions.
6.2 Groundwater Contamination
Laboratory analysis results recorded concentrations of one or more of cadmium, copper, nickel, and zinc in exceedance of the adopted maintenance of ecosystems criteria within wells GW2, GW4 and GW6 and concentrations of sodium and chloride in exceedance of the adopted PCR criteria within all wells except GW6.
Based on the highly modified nature of the Merri Creek in which groundwater is likely to be discharging, metal concentrations within the site groundwater are not considered to represent a significant risk to creek ecosystems. Further groundwater sampling and testing however, would be required to establish trends and correlations of metal concentrations.
The widespread exceedances of the PCR criteria for sodium and chloride and consistent ion ratios between all wells as shown on the Piper Plot (Drawing 3, Appendix B), suggests that sodium and chloride concentrations are naturally occurring. Although the PCR beneficial use would be precluded based on these results, the likelihood of water being utilised for recreational purposes is low based on the nature of the proposed future site usage.
Report on Groundwater Investigation Project : 79048.00 2330 Epping - Kilmore Road, Wallan 10 January 2014

IFODouglas Partners Geotechnics I Environment I Groundwater 11 of 12
based on these results, the likelihood of water being utilised for recreational purposes is low based on the nature of the proposed future site usage.
6.3 Groundwater Management
Based on the results of the groundwater sampling and testing conducted to date, no site specific groundwater management is anticipated to be required. If however, groundwater is required to be disposed of to a surface water body, appropriate testing of the receiving water body should be conducted to ensure receiving water bodies are not affected by the discharge. Furthermore, an EPA discharge permit may be required to facilitate any planned discharge to surface water bodies.
6.4 Salinity Management Overlay
Although groundwater encountered during the investigation varied widely in recorded salinity levels, the groundwater is generally considered to be moderately saline. Under the proposed quarrying works however, the groundwater table is not anticipated to be raised and as such is not expected to result in water discharge at existing site surface levels or pose a significant risk to increased soil salinity.
6.5 Effects on Merri Creek
Given the inferred low permeability of the alluvial clay aquifer, the interception of the groundwater table during quarrying works is not anticipated to significantly affect base flow within the adjacent Merri Creek.
6.6 Recommendations
It is recommended that continued groundwater monitoring, sampling and laboratory analysis be conducted on a regular basis to establish a baseline data set and maintain records of groundwater quality and contamination prior to commencement and during quarrying activities.
Report on Groundwater Investigation 2330 Epping - Kilmore Road, Wallan
Project : 79048.00 10 January 2014

t i D o u g l a s Partners Geotechnics I Environment I Groundwater 12 of 12
7. Limitations
Douglas Partners (DP) has prepared this report for the groundwater monitoring, sampling and laboratory analysis conducted at a proposed clay quarry located at 2330 Epping — Kilmore Road in Wallan in accordance with DP proposal MEL1300412, dated 11 September 2013 and modified via email correspondence 17 September 2013. The work was carried out under DP's Standard Conditions of Engagement. This report is provided for the exclusive use of Austral Bricks for the specific projects and purpose as described in the report. It should not be used by or relied upon for other projects or purposes on the same or other sites or by a third party.
The results provided in the report are considered to be indicative of the sub-surface conditions on the sites only to the depths investigated at the specific sampling and/or testing locations, and only at the time the work was carried out. DP's advice may be based on observations, measurements, and tests or derived interpretations. The accuracy of the advice provided by DP in this report is limited by unobserved features and variations in ground conditions across the site in areas between test locations and beyond the site boundaries or by variations with time. The advice may be limited by restrictions in the sampling and testing which was able to be carried out, as well as by the amount of data that could be collected given the project and site constraints. Actual ground and groundwater conditions observed or inferred at the test locations may differ from those which may be encountered elsewhere on the site. Should variations in ground conditions be encountered, then additional advice should be sought from DP and, if required, amendments made.
This report must be read in conjunction with the attached note "About This Report" included in Appendix A and any other attached explanatory notes and should be kept in its entirety without separation of individual pages or sections. DP cannot be held responsible for interpretations or conclusions from review by others of this report or test data, which are not otherwise supported by an expressed statement, interpretation, outcome or conclusion stated in this report. In preparing this report DP has necessarily relied upon information provided by the client and/or their agents.
Douglas Partners Pty Ltd
Report on Groundwater Investigation Project : 79048.00 2330 Epping - Kilmore Road, Wallan 10 January 2014

Appendix A
Notes About This Report

About this Report
Introduction These notes have been provided to amplify DP's report in regard to classification methods, field procedures and the comments section. Not all are necessarily relevant to all reports.
DP's reports are based on information gained from limited subsurface excavations and sampling, supplemented by knowledge of local geology and experience. For this reason, they must be regarded as interpretive rather than factual documents, limited to some extent by the scope of information on which they rely.
Copyright This report is the property of Douglas Partners Pty Ltd. The report may only be used for the purpose for which it was commissioned and in accordance with the Conditions of Engagement for the commission supplied at the time of proposal. Unauthorised use of this report in any form whatsoever is prohibited.
Borehole and Test Pit Logs The borehole and test pit logs presented in this report are an engineering and/or geological interpretation of the subsurface conditions, and their reliability will depend to some extent on frequency of sampling and the method of drilling or excavation. Ideally, continuous undisturbed sampling or core drilling will provide the most reliable assessment, but this is not always practicable or possible to justify on economic grounds. In any case the boreholes and test pits represent only a very small sample of the total subsurface profile.
Interpretation of the information and its application to design and construction should therefore take into account the spacing of boreholes or pits, the frequency of sampling, and the possibility of other than 'straight line' variations between the test locations.
Groundwater Where groundwater levels are measured in boreholes there are several potential problems, namely: • In low permeability soils groundwater may
enter the hole very slowly or perhaps not at all during the time the hole is left open;
• A localised, perched water table may lead to an erroneous indication of the true water table;
• Water table levels will vary from time to time with seasons or recent weather changes. They may not be the same at the time of construction as are indicated in the report; and
• The use of water or mud as a drilling fluid will mask any groundwater inflow. Water has to be blown out of the hole and drilling mud must first be washed out of the hole if water measurements are to be made.
More reliable measurements can be made by installing standpipes which are read at intervals over several days, or perhaps weeks for low permeability soils. Piezometers, sealed in a particular stratum, may be advisable in low permeability soils or where there may be interference from a perched water table.
Reports The report has been prepared by qualified personnel, is based on the information obtained from field and laboratory testing, and has been undertaken to current engineering standards of interpretation and analysis. Where the report has been prepared for a specific design proposal, the information and interpretation may not be relevant if the design proposal is changed. If this happens, DP will be pleased to review the report and the sufficiency of the investigation work.
Every care is taken with the report as it relates to interpretation of subsurface conditions, discussion of geotechnical and environmental aspects, and recommendations or suggestions for design and construction. However, DP cannot always anticipate or assume responsibility for: • Unexpected variations in ground conditions.
The potential for this will depend partly on borehole or pit spacing and sampling frequency;
• Changes in policy or interpretations of policy by statutory authorities; or
• The actions of contractors responding to commercial pressures.
If these occur, DP will be pleased to assist with investigations or advice to resolve the matter.
July 2010

About this Report
Site Anomalies In the event that conditions encountered on site during construction appear to vary from those which were expected from the information contained in the report, DP requests that it be immediately notified. Most problems are much more readily resolved when conditions are exposed rather than at some later stage, well after the event.
Information for Contractual Purposes Where information obtained from this report is provided for tendering purposes, it is recommended that all information, including the written report and discussion, be made available. In circumstances where the discussion or comments section is not relevant to the contractual situation, it may be appropriate to prepare a specially edited document. DP would be pleased to assist in this regard and/or to make additional report copies available for contract purposes at a nominal charge.
Site Inspection The company will always be pleased to provide engineering inspection services for geotechnical and environmental aspects of work to which this report is related. This could range from a site visit to confirm that conditions exposed are as expected, to full time engineering presence on site.
July 2010

Sampling Methods
Sampling Sampling is carried out during drilling or test pitting to allow engineering examination (and laboratory testing where required) of the soil or rock.
Disturbed samples taken during drilling provide information on colour, type, inclusions and, depending upon the degree of disturbance, some information on strength and structure.
Undisturbed samples are taken by pushing a thin-walled sample tube into the soil and withdrawing it
to obtain a sample of the soil in a relatively undisturbed state. Such samples yield information on structure and strength, and are necessary for laboratory determination of shear strength and compressibility. Undisturbed sampling is generally effective only in cohesive soils.
Test Pits Test pits are usually excavated with a backhoe or an excavator, allowing close examination of the in-situ
soil if it is safe to enter into the pit. The depth of excavation is limited to about 3 m for a backhoe and up to 6 m for a large excavator. A potential disadvantage of this investigation method is the larger area of disturbance to the site.
Large Diameter Augers Boreholes can be drilled using a rotating plate or short spiral auger, generally 300 mm or larger in diameter commonly mounted on a standard piling rig. The cuttings are returned to the surface at intervals (generally not more than 0.5 m) and are disturbed but usually unchanged in moisture content. Identification of soil strata is generally much more reliable than with continuous spiral flight augers, and is usually supplemented by occasional undisturbed tube samples.
Continuous Spiral Flight Augers The borehole is advanced using 90-115 mm diameter continuous spiral flight augers which are withdrawn at intervals to allow sampling or in-situ testing. This is a relatively economical means of drilling in clays and sands above the water table. Samples are returned to the surface, or may be collected after withdrawal of the auger flights, but they are disturbed and may be mixed with soils from the sides of the hole. Information from the drilling (as distinct from specific sampling by SPTs or undisturbed samples) is of relatively low
reliability, due to the remoulding, possible mixing or softening of samples by groundwater.
Non-core Rotary Drilling The borehole is advanced using a rotary bit, with water or drilling mud being pumped down the drill rods and returned up the annulus, carrying the drill cuttings. Only major changes in stratification can be determined from the cuttings, together with some information from the rate of penetration. Where drilling mud is used this can mask the cuttings and reliable identification is only possible from separate sampling such as SPTs.
Continuous Core Drilling A continuous core sample can be obtained using a diamond tipped core barrel, usually with a 50 mm internal diameter. Provided full core recovery is achieved (which is not always possible in weak rocks and granular soils), this technique provides a very reliable method of investigation.
Standard Penetration Tests Standard penetration tests (SPT) are used as a means of estimating the density or strength of soils and also of obtaining a relatively undisturbed sample. The test procedure is described in Australian Standard 1289, Methods of Testing Soils for Engineering Purposes - Test 6.3.1.
The test is carried out in a borehole by driving a 50 mm diameter split sample tube under the impact of a 63 kg hammer with a free fall of 760 mm. It is normal for the tube to be driven in three successive 150 mm increments and the 'N' value is taken as the number of blows for the last 300 mm. In dense sands, very hard clays or weak rock, the full 450 mm penetration may not be practicable and the test is discontinued.
The test results are reported in the following form.
• In the case where full penetration is obtained with successive blow counts for each 150 mm of, say, 4, 6 and 7 as:
4,6,7 N=13
• In the case where the test is discontinued before the full penetration depth, say after 15 blows for the first 150 mm and 30 blows for the next 40 mm as:
15, 30/40 mm
July 2010

Sampling Methods
The results of the SPT tests can be related empirically to the engineering properties of the soils.
Dynamic Cone Penetrometer Tests / Perth Sand Penetrometer Tests Dynamic penetrometer tests (DCP or PSP) are carried out by driving a steel rod into the ground using a standard weight of hammer falling a specified distance. As the rod penetrates the soil the number of blows required to penetrate each successive 150 mm depth are recorded. Normally there is a depth limitation of 1.2 m, but this may be extended in certain conditions by the use of extension rods. Two types of penetrometer are commonly used.
• Perth sand penetrometer - a 16 mm diameter flat ended rod is driven using a 9 kg hammer dropping 600 mm (AS 1289, Test 6.3.3). This test was developed for testing the density of sands and is mainly used in granular soils and filling.
• Cone penetrometer - a 16 mm diameter rod with a 20 mm diameter cone end is driven using a 9 kg hammer dropping 510 mm (AS 1289, Test 6.3.2). This test was developed initially for pavement subgrade investigations, and correlations of the test results with California Bearing Ratio have been published by various road authorities.
July 2010

Soil Descriptions
Description and Classification Methods The methods of description and classification of soils and rocks used in this report are based on Australian Standard AS 1726, Geotechnical Site Investigations Code. In general, the descriptions include strength or density, colour, structure, soil or rock type and inclusions.
Soil Types Soil types are described according to the predominant particle size, qualified by the grading of other particles present:
Type Particle size (mm) Boulder >200 Cobble 63 - 200 Gravel 2.36 - 63 Sand 0.075 - 2.36 Silt 0.002 - 0.075 Clay <0.002
The sand and gravel sizes can be further subdivided as follows:
Type Particle size (mm) Coarse gravel 20 - 63 Medium gravel 6 - 2 0 Fine
gravel 2.36 - 6 Coarse sand 0.6 - 2.36 Medium sand 0.2 - 0.6 Fine sand 0.075 - 0.2
The proportions of secondary constituents of soils are described as:
Term Proportion Example And Specify Clay (60%) and
Sand (40%) Adjective 20 - 35% Sandy Clay Slightly 12 - 20% Slightly Sandy
Clay With some 5 - 12% Clay with some
sand With a trace of 0 - 5% Clay with a trace
of sand
Definitions of grading terms used are:
• Well graded - a good representation of all particle sizes
• Poorly graded - an excess or deficiency of particular sizes within the specified range
• Uniformly graded - an excess of a particular particle size
• Gap graded - a deficiency of a particular particle size with the range
Cohesive Soils Cohesive soils, such as clays, are classified on the basis of undrained shear strength. The strength may be measured by laboratory testing, or estimated by field tests or engineering examination. The strength terms are defined as follows:
Description Abbreviation Undrained shear strength
(kPa) Very soft vs <12 Soft s 12 - 25 Firm f 25 - 50 Stiff st 5 0 - 100 Very stiff vst 100 - 200 Hard h >200
Cohesionless Soils Cohesionless soils, such as clean sands, are classified on the basis of relative density, generally from the results of standard penetration tests (SPT), cone penetration tests (CPT) or dynamic penetrometers (PSP). The relative density terms are given below:
Relative Density
Abbreviation SPT N value
CPT qc value (MPa)
Very loose vl <4 <2 Loose I 4-10 2 -5 Medium dense
md 10 -30 5 - 15
Dense d 30 - 50 15 - 25 Very dense
vd >50 >25
July 2010
1

Soil Descriptions
Soil Origin It is often difficult to accurately determine the origin of a soil. Soils can generally be classified as:
• Residual soil - derived from in-situ weathering of the underlying rock;
• Transported soils - formed somewhere else and transported by nature to the site; or
• Filling - moved by man.
Transported soils may be further subdivided into:
• Alluvium - river deposits
• Lacustrine - lake deposits
• Aeolian - wind deposits
• Littoral - beach deposits
• Estuarine - tidal river deposits
• Talus - scree or coarse colluvium
• Slopewash or Colluvium - transported downslope by gravity assisted by water. Often includes angular rock fragments and boulders.
July 2010
Rock Descriptions
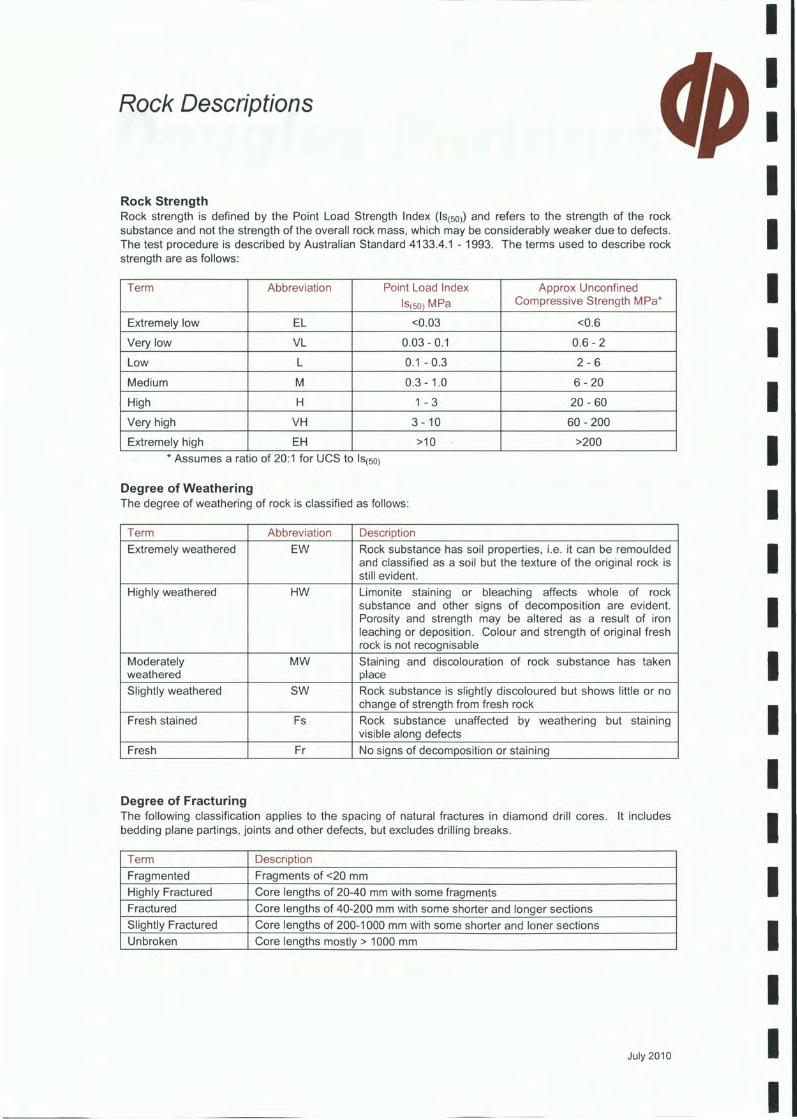
Rock Strength Rock strength is defined by the Point Load Strength Index (Is(50)) and refers to the strength of the rock substance and not the strength of the overall rock mass, which may be considerably weaker due to defects. The test procedure is described by Australian Standard 4133.4.1 - 1993. The terms used to describe rock strength are as follows:
Term Abbreviation Point Load Index Is(50) MPa
Approx Unconfined Compressive Strength MPa*
Extremely low EL <0.03 <0.6
Very low VL 0.03 - 0.1 0.6 - 2
Low L 0.1 - 0.3 2 - 6
Medium M 0.3 - 1.0 6 - 20
High H 1 - 3 20 - 60
Very high 1
VH 3-10 6 0 - 200
Extremely high EH >10 - >200 * Assumes a ratio of 20:1 for UCS to Is(50)
Degree of Weathering The degree of weathering of rock is classified as follows:
Term Abbreviation Description Extremely weathered EW Rock substance has soil properties, i.e. it can be remoulded
and classified as a soil but the texture of the original rock is still evident.
Highly weathered HW Limonite staining or bleaching affects whole of rock substance and other signs of decomposition are evident. Porosity and strength may be altered as a result of iron leaching or deposition. Colour and strength of original fresh rock is not recognisable
Moderately weathered
MW Staining and discolouration of rock substance has taken place
Slightly weathered SW Rock substance is slightly discoloured but shows little or no change of strength from fresh rock
Fresh stained Fs Rock substance unaffected by weathering but staining visible along defects
Fresh Fr No signs of decomposition or staining
Degree of Fracturing The following classification applies to the spacing of natural fractures in diamond drill cores. It includes bedding plane partings, joints and other defects, but excludes drilling breaks.
Term Description Fragmented Fragments of <20 mm Highly Fractured Core lengths of 20-40 mm with some fragments Fractured Core lengths of 40-200 mm with some shorter and longer sections Slightly Fractured Core lengths of 200-1000 mm with some shorter and loner sections Unbroken Core lengths mostly > 1000 mm
July 2010

Term Separation of Stratification Planes Thinly laminated < 6 mm Laminated 6 mm to 20 mm Very thinly bedded 20 mm to 60 mm Thinly bedded 60 mm to 0.2 m Medium bedded 0.2 m to 0.6 m Thickly bedded 0.6 m to 2 m Very thickly bedded > 2 m
Rock Descriptions
Rock Quality Designation The quality of the cored rock can be measured using the Rock Quality Designation (RQD) index, defined as:
RQD ')/0 = cumulative length of 'sound' core sections 100 mm long total drilled length of section being assessed
where 'sound' rock is assessed to be rock of low strength or better. The ROD applies only to natural fractures. If the core is broken by drilling or handling (i.e. drilling breaks) then the broken pieces are fitted back together and are not included in the calculation of ROD.
Stratification Spacing For sedimentary rocks the following terms may be used to describe the spacing of bedding partings:
July 2010
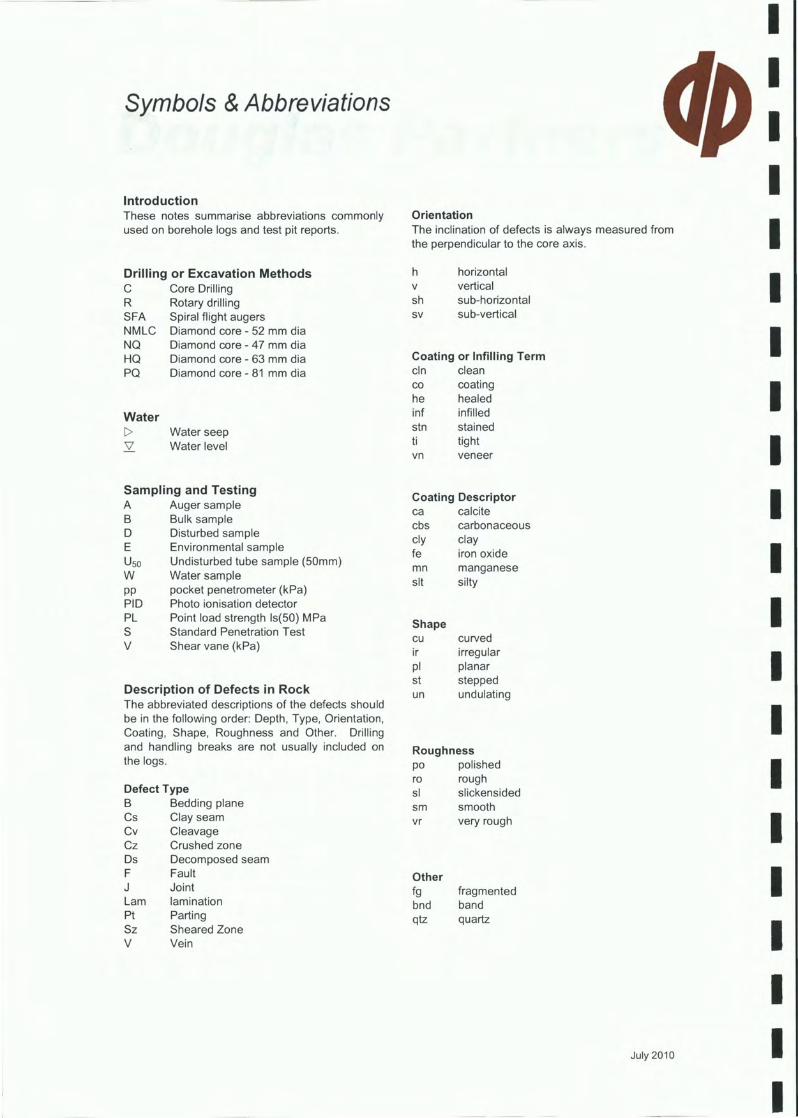
Symbols & Abbreviations
Introduction These notes summarise abbreviations commonly used on borehole logs and test pit reports.
Drilling or Excavation Methods C Core Drilling R SFA NMLC NQ HQ PQ
Rotary drilling Spiral flight augers Diamond core - 52 mm dia Diamond core - 47 mm dia Diamond core - 63 mm dia Diamond core - 81 mm dia
Water > Water seep
Water level
Sampling and Testing A Auger sample B Bulk sample D Disturbed sample E Environmental sample U50 Undisturbed tube sample (50mm) W Water sample pp pocket penetrometer (kPa) PID Photo ionisation detector PL Point load strength Is(50) MPa S Standard Penetration Test
Shear vane (kPa)
Description of Defects in Rock The abbreviated descriptions of the defects should be in the following order: Depth, Type, Orientation, Coating, Shape, Roughness and Other. Drilling and handling breaks are not usually included on the logs.
Defect Type B Bedding plane Cs Clay seam Cv Cleavage Cz Crushed zone Ds Decomposed seam F Fault J Joint Lam lamination Pt Parting Sz Sheared Zone
Vein
Orientation The inclination of defects is always measured from the perpendicular to the core axis.
h V sh sv
horizontal vertical sub-horizontal sub-vertical
Coating or Infilling Term cln clean CO coating he healed inf infilled stn stained ti tight vn veneer
Coating Descriptor ca calcite cbs carbonaceous cly clay fe iron oxide mn manganese sit silty
Shape cu ir pl st un
curved irregular planar stepped undulating
Roughness po polished ro rough sl slickensided sm smooth vr very rough
Other fg bnd qtz
fragmented band quartz
July 2010

Symbols & Abbreviations
Graphic Symbols for Soil and Rock
General
4.
■
. A
Soils
4(44 f
g 4
f 4
I / /
A-v5rize-•••
. • • • . • • • • • • • • • • • • • • •
r"/ "./.
/ . /.
F 1 . 1 . 1 . 1 1 1 1•I . 1- 1 • 1.1
_ 1 6 , L SAL
AAA"
Asphalt
Road base
Concrete
Filling
Topsoil
Peat
Clay
Silty clay
Sandy clay
Gravelly clay
Shaly clay
Silt
Clayey silt
Sandy silt
Sand
Clayey sand
Silty sand
Gravel
Sandy gravel
Cobbles, boulders
Talus
Sedimentary Rocks
Boulder conglomerate
° O Conglomerate
Conglomeratic sandstone
. . . . . . Sandstone • • • • • . . . .
• — • — — — Siltstone
. . . _ Laminite
_ — — — — - Mudstone, claystone, shale
Coal
1 1 1 1 Limestone
■ ■ ■ ■ ■ ■ • ■ ■ ■ ■ ■■■
11 1 1 I
Metamorphic Rocks • 'N.. •••■.• ••••••... ••••■••
• •••••,... "sa •-•••••• ••••••••
—r--
—I— —I--+—
—4— —4—I
Slate, phyllite, schist
Gneiss
Quartzite
Igneous Rocks +++++]
X X X
A 1/4r )
-<
X X X
V V V
Granite
Dolerite, basalt, andesite
Dacite, epidote
Tuff, breccia
Porphyry
July 2010

Appendix B
Drawings
LEGEND
Approximate
S i t e Location
875 ,,...
c
,_.,
.1 ''‘,..;
Lt
61 41;
4.jj
II
V)
4
WNW
Afti 1
,- 1
.., ,t.
„
rworro3 I
C127
4U C72.9 .
v , -`
I Li I
c,
i
_
r
-
—
.
, i
°!' IA tiltile.,.'i -,
I C, . . , . .
4*.
L c J.
,:...:-.:
. . 1 . —
, . - - $ A
.... t
KiNAKE NOMA
PARK
iri
en
I s ) i,W,
*AA Lim tr,
*A' P iSEA • g a I
o 1 2 3 4 5 km
Approximate Scale
r q Douglas Partners Geotechnics I Environment I Groundwater
CLIENT: Earth Tech Services Pty Ltd T I T L E : S t e Locaton Plan . i 2330 Epping - Kilmore Road Wallan
(AS PROJECT No: 79048.00
OFFICE: Melbourne DRAWN BY: JMC DRAWING No: 1
SCALE: As shown DATE: January 2014 REVISION: A

0 50 100
MERRI CREEK EPPING - KILMORE ROAD
1011
293 5
,,521 29'3 4
KEION
_ 2912
11/4"
291.2
291.4
Qi CV 0) CV \\DD
150 200 300 400 500m
Approximate Scale
NOM
_ 292.9
_ 292 8
_ 292.7
292.6_
292.5 _
LEGEND
Groundwater Well
Approximate Site Boundary
Inferred Groundwater Flow Direction
Groundwater Level Contour (0.1 m intervals)
Creek / Tributary
E I D o u g l a s Partners Geotechnics 1 Environment 1 Groundwater
CLIENT: Earth Tech Services Pty Ltd
OFFICE: Melbourne DRAWN BY: JMC
SCALE: As shown DATE: January 2014
TITLE: Groundwater Well Location Plan 2330 Epping - Kilmore Road Wallan
PROJECT No: 79048.00
DRAWING No: 2
REVISION: A

SIM 11111 111111 N111 MIMI M N INN 1111111 111111 M I 1111111 INS E N BEI M I M N MINI
EXPLANATION
Owl
OW2 GW3
GW4 GW5
GW6
100 0
100
v \ Y V
v ls \ / \ / \ / \ / \ y, / / / \ / \ : \ '\ X >,\ Y \/, V /\ \ v \ / \ / \ / /\/ \ /
\ / 0 " V \/\ \x\ A ),\ 2.\ >/' / s .100 V \, ‘ic A
)(, i 2,\ y‘ >i
\ ( \)(4y K \X )< >\ A
i
0 I 00
)(44- 7 A A /\
100 \ / V \\/ -(> \ 0 -100 100
2- Ca CATIONS
• 0 100
CI ANIONS
/!JDouglas Partners Geotechnics I Environment I Groundwater
CLIENT: Earth Tech Services Pty Ltd
OFFICE: Melbourne DRAWN BY: AP
SCALE: N/A DATE: Jan 2014
TITLE:
Groundwater Piper Plot 2330 Epping - Kilmore Road, Wallan
PROJECT No: 79048.00
DRAWING No: 3
REVISION: 0

Appendix C
Borehole Logs

CLIENT: PROJECT: LOCATION:
BOREHOLE LOG Earth Tech Services Pty Ltd Groundwater Investigation 2330 Epping-Kilmore Road, Wallan
SURFACE LEVEL: 295 m AHD EASTING: 324450 NORTHING: 5854945 DIP/AZIMUTH: 900/--
BORE No: GW 1 PROJECT No: 79048.00 DATE: 6/11/2013 SHEET 1 OF 1
—1 Depth ( X (m)
Description
of
Strata
Sampling & In Situ Testing Water
1 Well
Construction
Details ctic1.9
Grapt Log a a) >. 1—
.-F., °- a.) 0
a) a
E n:1 co
Results & Comments
V, ,.. . 0.15_,
, . , . _ . . '
. 1-1
- -
. .
. .
-F,3-2
- - . _ _
-3
_ - _ _ , _
. "
- . .
- -
_ .
. - 6 6.0
. .
. .
. .
-7
' . . . . . . . .
N.. (...,
. .
. . - - . .
_ _ .
. . . .
C L A Y E Y S I L T ! S ILTY C L A Y (Cl): Brown, moist, some A
0.3
1.0
2.5
3.5
5 .0
pp = 320
pp = 320
pp =50
p p = 150
p p = 110
-
, . _ — —
c.Quer - 1 0
-
- . _ -
-1 G r o u t 0 t o 2 m
gm ■v4 o• : ■ 4 ■ • ' • 14
4 ■ 1
0,
0, 44
0 '
. ■
_ *v •
• ,
•
• •
\ g r a s s roots. rp
0
0°
°
0
0
00
°,
, S ILTY C L A Y (CH): V e r y stiff, grey-brown, moist
V(M>WP). Pale brown, pale g rey be low 0.5 m.
S o f t , w e t be low 2 m.
Stiff, grey, pale b rown below 3 m.
Saturated be low 4.5 m.
Pale grey, pale b rown below 5 m.
5 0 m m PVC
- c a s i n g - 1 . 0 t o 3 m
-
-2
B e n t o n i t e s e a l 2 to . 2 . 5 m
-3
.
,
. -4
a5rirt:10F6ilmter p a c k
.4 • , 4
0 . 4,
L■
%
1
• •
•
•
'
.. . .
' .;
. .. • ;
... 5 0 m m PVC
- s c r e e n 3 t o 6 m
-5
-
_ .
E n d cap
. .
.. .
'
.
Bore d iscont inued at 6.0m C
.
.
.
.
-7
.
.
.
-8
.
.
.
.
.
.
.
.
.
RIG: C u s t o m 4 W D D R I L L E R : Hor izon Dril l ing LI
TYPE OF BORING: Sol id f l igh t auger
WATER OBSERVATIONS: G r o u n d w a t e r observed b e l o w 4.5 m dur ing drilling
REMARKS: Loca t i on c o o r d i n a t e s a r e in W G S 8 4 Z o n e 5 5 H.
LOGGED: JMC
SAMPLING & IN SITU TESTING A Auger sample G Gas sample B Bulk sample P Piston sample BLK Block sample U„ Tube sample (x mm dia.) C Core drilling W Water sample D Disturbed sample I> Water seep E Environmental sample ..T. Water level
LEGEND PID Photo ionisation detector (ppm) PL(A) Point load axial test Is(50)(MPa) PL(D)Point load diametral test Is(50) (MPa) pp Pocket penetrometer (kPa) S Standard penetration test
Shear vane (kPa)
CASING: NA
M . Douglas Partners Geotechnics I Environment I Groundwater
BOREHOLE LOG CLIENT: Earth Tech Services Pty Ltd PROJECT: Groundwater Investigation LOCATION: 2330 Epping-Kilmore Road, Wallan
SURFACE LEVEL: 295.5 m AHD BORE No: GW 2 EASTING: 324745 PROJECT No: 79048.00 NORTHING: 5854127 DATE: 7/11/2013 DIP/AZIMUTH: 90°/-- SHEET 1 OF 1
—1 Depth ix (m)
Description
of
Strata
Sampling & In Situ Testing Water
Well
Construction
Details qtirkiip
Grapt Log a) (3- I—
-.F. - °
a .
+,) E 0 CO
Results & Comments
' '
—
.
- - 1-
- -2
-
;F71 - -
- - 4
-
- - -
- - 5
. -
:F1:
- - 6
. . -r , i
-
- -
. .
- -8
-
- .
. .
-9
_ -
0 . 2
6 . 5
S L I G H T L Y CLAYEY SILT (ML): Soft, pale brown, ////
r 0
0
°
0 4 # ' # #
°°
0.2
3.7
4.5
p p = 350-500
p p = 150-200
p p = 150-200
p p = 150-200
- -
m _
-.
.
-1
. : . 7 2
.
. -
-4
-
- . -5 -
-
. - .
-6
-
rnvor
G r o u t 0 t o 2 . 5 m
5 0 m m PVC
c a s i n g - 0 . 8 2 t o 3.5
m
tB0e3ntmonite s e a l 2.5
S a n d f i l t e r p a c k 3
t o 6 . 5 m 5 0 m m PVC
s c r e e n 3 . 5 t o 6.5
m
E n d cap
li: • 1 I
■ ■
1,4 , N ,4•4 ■•■ k 0:444
N N, ■ 14 ■I
I I
/
■1■1 . (
1
I • ' ' ' I : ,
,4411
N N .■ •
; 1
■ ' ,4,
, 1
/
..7. — _ = _ - _ - _
-: =
_ — — _ — — _ _ _ -=
— =
_ _ =
_ - _ = = _
—\trace of fine to medium grained sand, humid (M<Wp).
SILTY CLAY (CH): Very stiff to hard, brown, mottled orange and dark brown, damp (M=Wp).
Very stiff, grey-brown , mottled orange, most (M>Wp) below 1.5 m. Stiff, grey, mottled orange and red-brown below 1.8 m.
Pale brown below 2.5 m.
Grey, mottled orange below 3.7 m.
Grey below 4.5 m.
Grey, mottled pale brown below 5.5 m.
Saturated below 6 m.
Bore discontinued at 6.5m .
- -
.
-8
.
.
. -
79
- ,
RIG: Custom 4WD DRILLER: Horizon Drilling T Y P E O F B O R I N G : Solid flight auger W A T E R O B S E R V A T I O N S : Groundwater observed below 6 m during drilling R E M A R K S : Location coordinates are in WGS 84 Zone 55 H.
L O G G E D : AP
SAMPLING & IN SITU TESTING A Auger sample G Gas sample B Bulk sample P Piston sample BLK Block sample U„ Tube sample (x mm dia.) C Core drilling W Water sample D Disturbed sample I> Water seep E Environmental sample ti Water level
LEGEND PID Photo ionisation detector (ppm) PL(A) Point load axial test Is(50)(MPa) PL(D) Point load diametral test Is(50)(MPa) pp Pocket penetrometer (kPa) S Standard penetration test
S h e a r vane (kPa)
C A S I N G : NA
1110Douglas Partners Geotechnics I Environment I Groundwater

CLIENT:
PROJECT:
LOCATION:
BOREHOLE LOG Earth Tech Services Pty Ltd Groundwater Investigation 2330 Epping-Kilmore Road, Wallan
S U R F A C E L E V E L : 294.5 m AHD B O R E No: GW 3 E A S T I N G : 3 2 4 9 7 7 P R O J E C T No: 79048.00 N O R T H I N G : 5 8 5 4 8 3 2 DATE: 7/11/2013 D I P / A Z I M U T H : 9 0 ° / - - SHEET 1 OF 1
-.) Depth ct (m)
Description
of
Strata
Sampling & In Situ Testing Water
Well
Construction
Details qti,k
Graph Log a) °- >, I-
-.F., a a.) o
1 E 0 cr)
Results & Comments
- - 0 . 1
:,91: . .
_ _ 1 . .
'
' - -
-2
-
. . - 3
- -
._ 4
. •-
-5
. .
. . - - 6
- 2 6.5 r.,
. .
. -
.
-8
- -
- -9
- .
-'s, '
0.5
1.5
2.5
3.5
4.5
pp >600
pp = 150
pp = 80
pp = 60
= pp110
v -E-
:= A
. 9 cower - 0 II m
.
-1 .
Grout 0 to 2.5 m
-
.
on ■ ,' ' i i ' • I,
N cl, o• N !
N
IN :4, 4 N V
N $1 V ■ , ■ ' 1
' '
\ CLAYEY SILT / SILTY CLAY (Cl): Grey-brown, moist, \some grass roots.
pr 0°°°°
#0°'
0
/1
1
SILTY CLAY (CH): Hard, dark brown, mottled orange-brown, moist (M>Wp).
Stiff, grey, orange-brown, moist below 1 m.
Moist to wet, firm, M>>Wp below 2 m.
Pale grey, orange-brown, with occasional pockets of ferruginous sand and gravel below 3 m.
Stiff, grey-brown, pale brown, orange-brown, wet below 4 m.
Grey, pale grey below 5 m.
Grey, pale brown, saturated, trace of fine to medium grain ferruginous gravel below 5.8 m.
50 mm PVC
. casing -0.8 to 3.5 - 2 m. -
- -
. -3
' Bentonite seal 2.5 -4
,
.
. Sand filter pack 3
. to 6.5 m
V o* N
0
0
I
■ ■ 1 ■ ■ '
0
0
=
— r =
===
= - 5 50 mm PVC
m
7 6
: screen 3.5 yo 6.5
End cap
— _ _ I =
=- 1.. — = = = _
Bore discontinued at 6.5m .
-
.
-a
- -
-9
-
, .
RIG: Custom 4WD DRILLER: Horizon Drilling LI TYPE OF BORING: Solid flight auger WATER OBSERVATIONS: Groundwater observed below 5.8 m during drilling REMARKS: Location coordinates are in WGS 84 Zone 55 H.
LOGGED: AP
SAMPLING & IN SITU TESTING A Auger sample G Gas sample B Bulk sample P Piston sample BLK Block sample U, Tube sample (x mm dia.) C Core drilling W Water sample D Disturbed sample I> Water seep E Environmental sample 11 Water level
LEGEND PID Photo ionisation detector (ppm) PL(A) Point load axial test Is(50)(MPa) PL(D)Point load diametral test Is(50) (MPa) pp Pocket penetrometer (kPa) S Standard penetration test
Shear vane (kPa)
CASING: NA
/]Douglas Partners Geotechnics I Environment I Groundwater Geotechnics I Environment I Groundwater

BOREHOLE LOG CLIENT: Earth Tech Services Pty Ltd PROJECT: Groundwater Investigation LOCATION: 2330 Epping-Kilmore Road, Wallan
SURFACE LEVEL: 295 m AHD EASTING: 324128 NORTHING: 5854254 DIP/AZIMUTH: 900/--
BORE No: GW 4 PROJECT No: 79048.00 DATE: 7/11/2013 SHEET 1 OF 1
--i Depth w (m)
Description
of
Strata
Sampling & In Situ Testing Water
Well
Construction
Details Ctirki
Grapt Log a) C L >. 1—
a a, a
-1t:2).
al (/)
Results & Comments
0.26.0 S L I G H T L Y C L A Y E Y S I L T ( M L ) : S o f t , p a l e brown, ////
1.5
2.5
2.9
4.5
4.9
p p = 100-150
p p = 100-150
p p = 100-150
p p = 200-250
p p = 100-200
9 rrivar -0.84m
- 1 G r o u t 0 t o 2 m
WI 'A Pt
'4, i 4 • 4
4* t'
: I,
4
IPS
4 t
A .4
4 . 1 I,
• • 1
— \ m o i s t ( M > W p ) s o m e g r a s s r o o t s . /
A r 0
/
0
0
/0SILTY CLAY (CH): Firm, brown, with pale orange Amottling, moist (M>Wp), some grass roots. Firm to stiff below 0.5 m.-\-Grey,
mottled orange, trace of fine grained sand below
ff below 1.5 m. Stiff
Grey mottled orange and red, trace of coarse grained gravel at 2.5 m.
Grey, yellow, orange below 2.9 m.
Very stiff, grey mottled orange, and dark grey, trace of fine grained sand below 4.5 m.
Moist to wet below 4.9 m.
Saturated below 5.5. m.
5 0 m m PVC
c a s i n g - 0 . 8 4 to 2 . 5 m
_ B e n t o n i t e
s e a l 2 to
-
_
4:
■ 4 , •
4
r
I
4,
• 4
S l o t t e d P V C 2 . 5 to 6 m S a n d f i l t e r pack
• 2 . 5 t o 6 m
-5
E n d cap
Bore discontinued at 6.0m
-
_
_
R I G : C u s t o m 4 W D D R I L L E R : H o r i z o n Drilling
T Y P E O F B O R I N G : S o l i d f l i g h t auger
W A T E R O B S E R V A T I O N S : G r o u n d w a t e r o b s e r v e d b e l o w 5 . 5 m d u r i n g drilling
R E M A R K S : L o c a t i o n c o o r d i n a t e s a r e i n W G S 8 4 Z o n e 5 5 H.
L O G G E D : AP
SAMPLING & IN SITU TESTING A Auger sample G Gas sample B Bulk sample P Piston sample BLK Block sample Ux Tube sample (x mm dia.) C Core drilling W Water sample D Disturbed sample 1> Water seep E Environmental sample T Water level
LEGEND PID Photo ionisation detector (ppm) PL(A) Point load axial test Is(50)(MPa) PL(D) Point load diametral test Is(50)(MPa) pp Pocket penetrometer (kPa) S Standard penetration test
Shear vane (kPa)
C A S I N G : NA
I IEDouglas Partners Geotechnics I Environment I Groundwater awsinrautemar I—C11 1111111=11 0 I Geotechnics I Environment I Groundwater

CLIENT: PROJECT: LOCATION:
BOREHOLE LOG Earth Tech Services Pty Ltd Groundwater Investigation 2330 Epping-Kilmore Road, Wallan
SURFACE LEVEL: 295 m AHD EASTING: 323293 NORTHING: 5855140 DIP/AZIMUTH: 900/--
BORE No: GW 5 PROJECT No: 79048.00 DATE: 6/11/2013 SHEET 1 OF 1
—I Depth 1: (m)
'a
Description
of
Strata
Sampling & In Situ Testing Water
I Well
Construction
Details ctick..p
Grapt Log a)
' 1—
-.5 ?., - o
a) z. E 0 w
Results & Comments
-
. .
.
-1
. . .
- - -
-2
.
. _ - - . _
- 3
- . . . . . .
. .
. . - -
- 5
. .
. _
- '
: 6
- - 6.5
-E--7
. .
. .
. .
.
. . n. 1,1-8
' . . . .
. .
. . . . _
- _ -
SILTY CLAY (CH): Stiff, dark brown, mottled orange-brown, moist (M>Wp).
Grey, orange-brown, moist to wet below 2 m.
Firm, wet below 3 m.
Pale grey, pale orange-brown below 4 m.
V e r y stiff, pale grey, saturated below 5 m.
0°
0
0°°°
0
0.5
1.5
2.5
3.5
pp = 150
pp = 150
pp = 110
pp = 80
pp = 80
.-
cover -0.84 m
1
Grout 0 to 2.5 m '
•
•
• ••
• • •
Pil
■ 1
to4 t.■
■I 0 . *4 ■: ■ '
4
.7--
c5a0Mrn s i n g
_P0V.84C
t o 3.5
- 2 m
-
.
.
.... 3
tB0e3ntmonite seal 2.5
3
_ to 6.5 m
•
• • •
/ /
.'
..
•
..
l• Ni ■ i : i
I 4,
'p
/
. 5
5Soanmdmfiltpevrcpack
- screen 3.5 to 6.5 - m
-6
- End cap
.
Bore discontinued at 6.5m
- 7
.
.
.
.
. -8
.
.
.
. -
RIG: Custom 4WD DRILLER: Horizon Drilling TYPE OF BORING: Solid flight auger WATER OBSERVATIONS: Groundwater observed below 5 m during drilling REMARKS: Location coordinates are in WGS 84 Zone 55 H.
LOGGED: AP
SAMPLING & IN SITU TESTING A Auger sample G Gas sample B Bulk sample P Piston sample BLK Block sample U„ Tube sample (x mm dia.) C Core drilling W Water sample D Disturbed sample I> Water seep E Environmental sample Water level
LEGEND PID Photo ionisation detector (ppm) PL(A) Point load axial test Is(50)(MPa) PL(D)Point load diametral test Is(50)(MPa) pp Pocket penetrometer (kPa) S Standard penetration test
Shear vane (kPa)
CASING: NA
1 0 D o u g l a s Partners Geotechnics I Environment I Groundwater Geotechnics I Environment I Groundwater

BOREHOLE LOG CLIENT: Earth Tech Services Pty Ltd PROJECT: Groundwater Investigation LOCATION: 2330 Epping-Kilmore Road, Wallan
SURFACE LEVEL: 294 m AHD BORE No: GW 6 EASTING: 323536 PROJECT No: 79048.00 NORTHING: 5854560 DATE: 6/11/2013 DIP/AZIMUTH: 90°/-- SHEET 1 OF 1
—1 Depth (m)
Description
of
Strata
Sampling & In Situ Testing Water
Well
Construction
Details ctirlca Ft
Grapt Log 11,:„. 1--
I
a
c u _
Cili U)
Results & Comments
; .
r,
. .
. .
.
-
-1
. . - - .
P,11 : 7 2
i - 3 l
.
- 4
.
•
7 5
- 6
-
. .
- 8
- . . . .
.
.
6.5
SILTY CLAY (CH): Very stiff, dark brown, mottled orange-brown, moist (M>Wp).
Stiff, pale grey, pale orange-brown, moist to wet below
Firm, moist to wet below 3 m.
Stiff, pale grey, wet below 4 m.
Pale grey, pale orange-brown, saturated below 5.5 m.
0°
I
A!
0
Or
$
I
r e
0.7
2.5
3.5
4.5
pp = 300
pp =110
pp = 80
pp =110
Y _ 7 (...'
-
_
i
:2
• '
*
. - 3
:4
'
. -5
- .
-6
'
9 r n v o r -fl
m
Grout 0 to 2.5 m
IR 'A
o* ■,*(4
V4 P 4 $ :
■ :
141 ■ ■
o
■ :
V: N ■ :
■ :
50 mm PVC casing -0.8 to 3.5
Bentonite seal 2.5 to 3 m
Sand filter pack 3 to 6.5 m
: 1
it41
/
■
14
oopti 0
/
= _ = =
_ :
I
50 mm PVC screen 3.5 to 6.5 m
End cap
_ _ _ = _ =
— _ _ _ — _ 7=
=- —
Bore discontinued at 6.5m
.
-8
- . . . .
:9
. -
-
RIG: Custom 4WD DRILLER: Horizon Drilling TYPE OF BORING: Solid flight auger WATER OBSERVATIONS: No free groundwater observed REMARKS: Location coordinates are in WGS 84 Zone 55 H.
LOGGED: AP
SAMPLING & IN SITU TESTING LEGEND A Auger sample G Gas sample PID Photo ionisation detector (ppm) B Bulk sample P Piston sample PL(A) Point load axial test Is(50) (MPa) BLK Block sample U„ Tube sample (x mm dia.) PL(D) Point load diametral test Is(50) (MPa) C Core drilling W Water sample pp Pocket penetrometer (kPa) D Disturbed sample I> Water seep S Standard penetration test E Environmental sample T Water level V Shear vane (kPa)
CASING: NA
I S D o u g l a s Partners Geotechnics 1 Environment 1 Groundwater

Appendix D
Tabulated Laboratory Results Laboratory Analysis Reports

1 r Douglas Partners Geotechnics I Environment I Groundwater
Table D1 Results of Groundwater Laboratory Analysis
Sample ID Sample Date cn 0 1--
x a.
Chloride Sulphate Calcium Magnesium Potassium
Sodium
Alka inity Nitrogen Metals
Bicarbonate Carbonate 0 70 R
2
-0 >, i
Total
Alkalinity
Total
Kjeldahl
Nitrogen
Total
Nitrogen
Ammonia Nitrate
Nitrogen
Nitrite
Nitrogen
Arsenic Cadmium
Total
Chromium
Copper -a ms a) ...,
Mercury
E c c 0 -c Jo >, 0 2
76 ..h, (.., Z
Selenium
, w 2 ri) c
i= 0 c RI
mg/L mg/L mg/L mg/L mg/L mg/L mg/L mg/L mg/L mg/L mg/L mg/L mg/L mg/L mg/L mg/L mg/L mg/L mg/L mg/L mg/L mg/L mg/L mg/L mg/L mg/L mg/L mg/L
Maintenance o f Ecosystems' 0.7 0.013' 0.0002 0.01 0.0014 0.0034 0.0006 0.011 0.011 0.00005 0.008
Stock Water2 1000 1000 400 0.5 0.01 1 0.4 0.1 0.002 0.15 1 0.02 20 Primary Contact Recreation3 6.5 - 8.5 400 400 300 500 300 10 1 0.05 0.005 0.05 1 0.05 0.001 0.1 0.01 0.05 5
Buildin • s and Structures4 >5.5 6000 1000 21 November 2013
GW1-211113 21-11-13 4900 6.7 2700 230 150 270 7 1100 410 <2 <2 410 0.3 0.3 0.1 0.02 <0.01 <0.001 <0.0002 <0.001 0.001 <0.001 <0.0001 <0.001 0.003 0.001 <0.001 0.002 0.004 GW2-211113 21-11-13 9900 5.9 5200 350 130 450 10 2100 64 <2 <2 64 0.4 0.5 <0.1 0.02 <0.01 0.001 <0.0002 <0.001 0.002 0.002 <0.0001 <0.001 0.051 0.004 <0.001 0.004 0.019 GW3-211113 21-11-13 1200 6.1 640 57 16 43 2 320 65 <2 <2 65 0.4 0.4 <0.1 <0.01 <0.01 <0.001 <0.0002 <0.001 0.001 <0.001 <0.0001 <0.001 0.006 <0.001 <0.001 <0.001 0.004 GW4-211113 21-11-13 8400 6.5 4500 360 200 400 4 2200 180 <2 <2 180 _ 0.4 0.4 <0.1 <0.01 0.02 <0.001 0.0003 <0.001 0.001 <0.001 <0.0001 <0.001 0.020 <0.001 <0.001 0.003 0.005 GW5-211113 21-11-13 2800 7.0 1500 37 38 140 9 720 260 <2 <2 260 0.4 0.4 <0.1 0.08 <0.01 <0.001 <0.0002 <0.001 0.001 <0.001 <0.0001 0.005 0.002 <0.001 <0.001 <0.001 0.002 GW6-211113 21-11-13 680 6.2 300 23 12 24 1 120 50 <2 <2 50 <0.1 <0.1 <0.1 0.06 <0.01 <0.001 <0.0002 <0.001 0.003 <0.001 <0.0001 <0.001 0.005 <0.001 <0.001 <0.001 0.005
CIA/QC DUP-211113* 21-11-13 5000 6.7 2500 230 120 220 6.7 1100 410 <2 <2 410 0.2 0.3 <0.1 0.03 <0.01 <0.001 <0.0002 <0.001 0.001 <0.001 <0.0001 <0.001 0.003 <0.001 <0.001 0.001 RIN-211113# 21-11-13 <5 7.0 <1 <1 <0.1 <0.1 <0.1 <0.1 3 <2 <2 3 <0.2 <0.1 <0.1 <0.01 <0.01 <0.001 <0.0002 <0.001 <0.001 <0.001 <0.0001 <0.001 <0.001 <0.001 <0.001 0.007 <0.001
Groundwater Investigation 2330 Epping Kilmore Road, Wallan
Notes A blank space indicates no test performed, or no criteria available
22 Indicates an exceedance of the adopted beneficial use criteria
References for Criteria 1) ANZECC (2000) Freshwater Ecosystem Criteria adopting 95% level of protection (Segment C - Groundwaters of Victoria)
2) ANZECC (1992 Livestock Drinking Water 3) ANZECC (1992) Primary Contact Recreation 4) Australian Standard 2159-2009 "Piling Design and Installation" a) ANZECC (2000) Criteria for As V b) ANZECC (2000) Criteria for Cr VI c) ANZECC (2000) Marinewater Criteria d) ANZECC (2000) Freshwater Ecosystems Criteria adopting 99% level of protection
Page 1 of 1
* Blind duplicate sample of sample GW1-211113 analysed by ALS 'Equipment Rinsate sample analysed by ALS
Project: 79048.00 10 January 2014

11111 111111 M N MEI B M 1111111 11111 INN 111111 111111 N M IMO IMO INN 1111111 E N IMO VIM M I NS
AL. ; A L S ) Group Environmental Division (Water Resources Group)
NATA
NATA Accredited Laboratory No. 992
Accredfted . compliance with 1.50/11C 17025
eetWIMPIMI001
Batch No:
Final Report
Client:
Contact:
Address:
Client Program Ref
ALS Program Ref
PO No:
13-51503 405937
Douglas Partners Pty Ltd
Alex Patterson
231 Normanby Road SOUTH MELBOURNE VIC 3205
79048.00 - Wallan
DOUGLAS
112571
Page
Laboratory Address Phone Fax Contact:
Date Sampled:
Date Samples Received:
Date Issued:
Page 1 of 11
Scoresby Laboratory
Caribbean Business Park, 22 Dalmore Drive, Scoresby, VIC 3179 03 8756 8000 03 9763 1862 Tuyen Nguyen Client Manager [email protected]
21-Nov-2013
22-Nov-2013
05-Dec-2013
Analysis Alkalinity TCN NO3-N
pH
The sample(s) referred to in this report were analysed by the following method(s): #
- NATA accreditation does not cover the performance of this service Method
VIC-CM060 A VIC-CM019 VIC-CM007
Laboratory Scoresby Scoresby Scoresby
VIC-CM060 B Scoresby
Analysis Chloride NH3 as N (DA) NOX as N (DA)
TDS at 180°C +1-5°C
Method Laboratory VIC-CM031 Scoresby VIC-CM003 Scoresby VIC-CM007, 035 Scoresby
EA015WRG Scoresby
TKN/TP (HL) VIC-CM009 Scoresby
Result for pH in water tested in the laboratory may be indicative only as holding time is generally not achievable.
Where a result is required to meet compliance limits the associated uncertainty must be considered. Refer to the ALS Contact for details.
Analysis MS Total Metals NO2-N OES Scan
SO4 DA
Method Laboratory VIC-CM050 C Scoresby EK057G Scoresby VIC-CM050 D (Si Scoresby not NATA); EA065-69 VIC-CM033 Scoresby
N A T A Accredited
L a b o r a t o r y N o . 992
HATA Accred i ted f o r compliance
w i t h 1 5 0 / I E C 17025
WORLD RECOGNISED ACCREDITATION
Signatories These results have been electronically signed by the authorised signatories indicated below. Electronic signing has been carried out in compliance with procedures specified in 21 CFR Part 11
Name Chatura Perera John Earl Michael Clahsen
Title Team Leader Nutrients Team Leader Metals Principal Inorganic Chemist
Name Hoa Nguyen John Levvey
Title Analyst Principal Trace Metals Chemist

E M I NMI MOM 11111 M O 11101 M I S M a i N I B = I 11111 N I B MOM 110111 E M I a n N I B M E I MI
% 1 - 1 1 1 - 1 1 1 1 r 3 , . , AL le-K11).
o3-peqoi,sie-vvviin

M B a l l N M NMI M E N M MIN 111111 M N 111•11 M S I N N M I 11111 111111 MIN M S M N 111111 11111
Page: Page 3 of 11 Batch No: 13-51503 Report Number: 405937 Client: Douglas Partners Pty Ltd Client Program Ref 79048.00 - Wallan
Ls
LOR = Limit of reporting. When a reported LOR is higher than the standard LOR, this may be due to high moisture content, insufficient sample or matrix interference. CAS Number = Chemistry Abstract Services Number. The analytical procedures in this report ( including in house methods ) are developed from internationally recognised procedures such as those published by USEPA, APHA and NEPM.
Sample No. Client Sample ID
Sample Date Sample Type
3700186 GW1-211113
21/11/13 WATER
3700188 GW2-211113
21/11/13 WATER
3700189 GW3-211113
21111/13 WATER
3700190 GW4-211113
21/11/13 WATER
3700191 GW5-211113
21/11/13 WATER
3700192 GW6-211113
21/11/13 WATER
Analysis Analyte CAS# LOR pH pH, units pH_Lab Units 6.7 5.9 6.1 6.5 7.0 6.2 TDS at 180°C +/- Total Dissolved Solids TDS <5 mg/L 4900 9900
. 1200 8400 2800 680
Chloride Chloride, as Cl 16887-00-6 <1 mg/L 2700 5200 640 4500 1500 300 SO4 DA Sulphate, as SO4 14808-79-8 <1 mg/L 230 350 57 360 37 23 Alkalinity Bicarbonate Alkalinity as CaCO3 ALKBICARBON <2 mg CaCO3 / L 410 64 65 180 260 50 Alkalinity Carbonate Alkalinity as CaCO3 ALK_CARBON <2 mg CaCO3 / L <2 <2 <2 <2 <2 <2 Alkalinity Hydroxide Alkalinity as CaCO3 ALK_HYDROXI <2 mg CaCO3 /L <2 <2 <2 <2 <2 <2 Alkalinity Total Alkalinity as CaCO3 ALK_CAC03 <2 mg CaCO3 / L 410 64 65 180 260 50 Analysis Analyte CAS# LOR MS Total Metals Arsenic 7440-38-2 <0.001 mg/L <0.001 0.001 <0.001 <0.001 <0.001 <0.001 MS Total Metals Cadmium 7440-43-9 <0.0002 mg/L <0.0002 <0.0002 <0.0002 0.0003 <0.0002 <0.0002 MS Total Metals Chromium 7440-47-3 <0.001 mg/L <0.001 <0.001 <0.001 <0.001 <0.001 <0.001 MS Total Metals Copper 7440-50-8 <0.001 mg/L 0.001 0.002 0.001 0.001 0.001 0.003 MS Total Metals Lead 7439-92-1 <0.001 mg/L <0.001 0.002 <0.001 <0.001 <0.001 <0.001 MS Total Metals Mercury 7439-97-6 <0.0001 mg/L <0.0001 <0.0001 <0.0001 <0.0001 <0.0001 <0.0001 MS Total Metals Molybdenum 7439-98-7 <0.001 mg/L <0.001 <0.001 <0.001 <0.001 0.005 <0.001 MS Total Metals Nickel 7440-02-0 <0.001 mg/L 0.003 0.051 0.006 0.020 0.002 0.005 MS Total Metals Selenium 7782-49-2 <0.001 mg/L 0.001 0.004 <0.001 <0.001 <0.001 <0.001 MS Total Metals Silver 7440-22-4 <0.001 mg/L <0.001 <0.001 <0.001 <0.001 <0.001 <0.001 MS Total Metals Tin 7440-31-5 <0.001 mg/L 0.002 0.004 <0.001 0.003 <0.001 <0.001 MS Total Metals Zinc 7440-66-6 <0.001 •nng/L 0.004 0.019 0.004 0.005 0.002 0.005 OES Scan Calcium 7440-70-2 <0.1 mg/L 150 130 16 200 38 12 OES Scan Magnesium 7439-95-4 <0.1 mg/L 270 450 43 400 140 24 OES Scan Potassium 7440-09-7 <0.1 mg/L 7 10 2 4 9 1 OES Scan Sodium 7440-23-5 <0.1 mg/L 1100 2100 320 2200 720 120
Analysis Analyte CAS # LOR TKN/TP (HL) Total Kjeldahl Nitrogen as N K.NITROGEN <0.1 mg N / L 0.3 0.4 0.4 0.4 0.4 <0.1 TCN Total Nitrogen as N (Calc) 7727-37-9 <0.1 mg/L 0.3 0.5 0.4 0.4 0.4 <0.1 NH3 as N (DA) Ammonia, as N 7664-41-7 (as <0.1 mg N / L 0.1 <0.1 <0.1 <0.1 <0.1 <0.1 NOX as N (DA) Nitrate + Nitrite, as N NOx (as N) <0.01 mg N /L 0.03 0.03 0.01 0.02 0.08 0.06
Samples tested as received. A blank space indicates no test performed. Soil results expressed in mg/kg dry weight unless specified otherwise. Microbiological testing was commenced within 24 hours of sampling unless otherwise stated. VIC-MM524: Plate count results <10 per mL and >300 per mL are deemed as approximate. VIC-MM526: Plate count results <2,500 per mL and >250,000 per mL are deemed as approximate. Calculated results are based on raw data.

Page: Page 4 of 11 Batch No: 13-51503 Report Number: 405937 Client: Douglas Partners Pty Ltd Client Program R e f 79048.00 - Wallan
Sample No. Client Sample ID
Sample Date Sample Type
3700186 GW1-211113
21/11/13 WATER
3700188 GW2-211113
21/11/13 WATER
3700189 GW3-211113
21/11/13 WATER
3700190 GW4-211113
21/11/13 WATER
3700191 GW5-211113
21/11/13 WATER
3700192 GW6-211113
21/11/13 WATER
NO3-N NO2-N
Nitrate, as N Nitrite, as N
14797-55-8(as 14797-65-0(as
<0.01 mg N / L <0.01 mg N / L
0.02 <0.01
0.02 <0.01
<0.01 <0.01
<0.01 0.02
0.08 <0.01
0.06 <0.01
Samples tested as received. A blank space indicates no test performed. Soil results expressed in mg/kg dry weight unless specified otherwise. Microbiological testing was commenced within 24 hours of sampling unless otherwise stated. VIC-MM524: Plate count results <10 per mL and >300 per mL are deemed as approximate. VIC-MM526: Plate count results <2,500 per mL and >250,000 per mL are deemed as approximate. Calculated results are based on raw data.
M I IMO MIIII NMI = I NMI E M I I N N M E = I I E N = I NMI 111111 IIII I I NMI = I I = I I M P NMI MINN

U M I I . 1.11 11M M N NMI M I NMI INI1 M I I = • IMO
Page: Page 5 of 11 Batch No: 13-51503 Report Number: 405937 Client: Douglas Partners Pty Ltd
Client Program Ref 79048.00 - Wallan AILS
LOR = Limit of reporting. When a reported LOR is higher than the standard LOR, this may be due to high moisture content, insufficient sample or matrix interference. CAS Number = Chemistry Abstract Services Number. The analytical procedures in this report ( including in house methods ) are developed from internationally recognised procedures such as those published by USEPA, APHA and NEPM
Sample No. Client Sample ID
Sample Date Sample Type
3700193 DUP-211113
21/11/13 WATER
3700195 RIN-211113
21/11/13 WATER
Analysis Analyte CAS# LOR pH pH, units pH_Lab Units 6.7 7.0 TDS at 180°C +/- Total Dissolved Solids TDS <5 mg/L 5000 <5 Chloride Chloride, as Cl 16887-00-6 <1 mg/L 2500 <1 SO4 DA Sulphate, as SO4 14808-79-8 <1 mg/L 230 <1 Alkalinity Bicarbonate Alkalinity as CaCO3 ALKBICARBON <2 mg CaCO3 / L 410 3 Alkalinity Carbonate Alkalinity as CaCO3 ALK_CARBON <2 mg CaCO3 / L <2 <2 Alkalinity Hydroxide Alkalinity as CaCO3 ALK_HYDROXI <2 mg CaCO3 /L <2 <2 Alkalinity Total Alkalinity as CaCO3 ALK_CAC03 <2 mg CaCO3 / L 410 3 Analysis Analyte CAS# LOR MS Total Metals Arsenic 7440-38-2 <0.001 mg/L <0.001 <0.001 MS Total Metals Cadmium 7440-43-9 <0.0002 mg/L <0.0002 <0.0002 MS Total Metals Chromium 7440-47-3 <0.001 mg/L <0.001 <0.001 MS Total Metals Copper 7440-50-8 <0.001 mg/L 0.001 <0.001 MS Total Metals Lead 7439-92-1 <0.001 mg/L <0.001 <0.001 MS Total Metals Mercury 7439-97-6 <0.0001 mg/L <0.0001 <0.0001 MS Total Metals Molybdenum 7439-98-7 <0.001 mg/L <0.001 <0.001 MS Total Metals Nickel 7440-02-0 <0.001 mg/L 0.003 <0.001 MS Total Metals Selenium 7782-49-2 <0.001 mg/L <0.001 <0.001 MS Total Metals Silver 7440-22-4 <0.001 mg/L <0.001 <0.001 MS Total Metals Tin 7440-31-5 <0.001 mg/L 0.001 0.007 MS Total Metals Zinc 7440-66-6 <0.001 mg/L 0.005 <0.001 OES Scan Calcium 7440-70-2 <0.1 mg/L 120 <0.1 OES Scan Magnesium 7439-95-4 <0.1 mg/L 220 <0.1 OES Scan Potassium 7440-09-7 <0.1 mg/L 6.7 <0.1 OES Scan Sodium 7440-23-5 <0.1 mg/L 1100 <0.1
Analysis Analyte CAS # LOR TKNfTP (HL) Total Kjeldahl Nitrogen as N K.NITROGEN <0.1 mg N / L 0.2 <0.1 TCN Total Nitrogen as N (Calc) 7727-37-9 <0.1 mg/L 0.3 <0.1 NH3 as N (DA) Ammonia, as N 7664-41-7 (as <0.1 mg N / L <0.1 <0.1 NOX as N (DA) Nitrate + Nitrite, as N NOx (as N) <0.01 mg N / L 0.04 <0.01
Samples tested as received. A blank space indicates no test performed. Soil results expressed in mg/kg dry weight unless specified otherwise. Microbiological testing was commenced within 24 hours of sampling unless otherwise stated. VIC-MM524: Plate count results <10 per mL and >300 per mL are deemed as approximate. VIC-MM526: Plate count results <2,500 per mL and >250,000 per mL are deemed as approximate. Calculated results are based on raw data.

Page: Page 6 of 11 Batch No: 13-51503 Report Number: 405937 Client. Douglas Partners Pty Ltd
Client Program Ref 79048.00 - WaIlan
Sample No. Client Sample ID
3700193 DUP-211113
3700195 RIN-211113
Sample Date 21/11/13 21/11/13 Sample Type WATER WATER
NO3-N Nitrate, as N 14797-55-8(as <0.01 mg N /L 0.03 <0.01 NO2-N Nitrite, as N 14797-65-0(as <0.01 mg N IL <0.01 <0.01
Samples tested as received. A blank space indicates no test performed. Soil results expressed in mg/kg dry weight unless specified otherwise. Microbiological testing was commenced within 24 hours of sampling unless otherwise stated. VIC-MM524: Plate count results <10 per mL and >300 per mL are deemed as approximate. VIC-MM526: Plate count results <2,500 per mL and >250,000 per mL are deemed as approximate. Calculated results are based on raw data.
1•111 N M I N N = I I = I = I I NMI III•11 NMI IMO MIMI = I I = I = I I = I NMI M I M I IMO I N N IIIIIII

IIIIIIII MIN N M E l l I I I . I I = 111111 IIIIII M I I N N • 111111 I = 11•1 i l l M I MI
Page: Page 7 of 11 Batch No: 13-51503 Report Number: 405937 Client: Douglas Partners Pty Ltd
Client Program Ref 79048.00 - Wallan
QUALITY CONTROL - BLANKS QC Blanks are an 'analyte free matrix in which all applicable reagents have been added in the same proportion as in standard samples and are an internal monitor for laboratory contamination.
Value Lab Sample ID Client Sample ID Analysis Analyte 3701238 QC - Blank pH pH, units Units 5.6 3701365 QC - Blank pH pH, units Units 5.5 3701426 QC - Blank Chloride Chloride, as Cl mg/L <1 3701426 QC - Blank SO4 DA Sulphate, as SO4 mg/L <1 3703109 QC - Blank Chloride Chloride, as Cl mg/L <1 3703109 QC - Blank SO4 DA Sulphate, as SO4 mg/L <1 3703627 QC - Blank TDS at 180°C +/- 5°C Total Dissolved Solids mg/L <5 LathSample ID Client Sample ID Analysis Analyte 3701269 QC - Blank TKN/TP (HL) Total Kjeldahl Nitrogen as N mg N / L <0.1 3701426 QC - Blank NH3 as N (DA) Ammonia, as N mg N / L <0.1 3701426 QC - Blank NOX as N (DA) Nitrate + Nitrite, as N mg N / L <0.01 3701426 QC - Blank NO2-N Nitrite, as N mg N / L <0.01 3703109 QC - Blank NH3 as N (DA) Ammonia, as N mg N / L <0.1 3703109 QC - Blank NOX as N (DA) Nitrate + Nitrite, as N mg N / L <0.01 3703109 QC - Blank NO2-N Nitrite, as N mg N / L <0.01 Lab Sample ID Client Sample ID Analysis Analyte 3703042 QC - Blank MS Total Metals Arsenic mg/L <0.001 3703042 QC - Blank MS Total Metals Cadmium mg/L <0.0002 3703042 QC - Blank MS Total Metals Chromium mg/L <0.001 3703042 QC - Blank MS Total Metals Copper mg/L <0.001
3703042 QC - Blank MS Total Metals Lead mg/L <0.001 3703042 QC - Blank MS Total Metals Mercury mg/L <0.0001 3703042 QC - Blank MS Total Metals Molybdenum mg/L <0.001 3703042 QC - Blank MS Total Metals Nickel mg/L <0.001
3703042 QC - Blank MS Total Metals Selenium mg/L <0.001
3703042 QC - Blank MS Total Metals Silver mg/L <0.001
3703042 QC - Blank MS Total Metals Tin mg/L <0.001 3703042 QC - Blank MS Total Metals Zinc mg/L <0.001 3703182 QC - Blank OES Scan Calcium mg/L <0.1
3703182 QC - Blank OES Scan Magnesium mg/L <0.1
Samples tested as received. A blank space indicates no test performed. Soil results expressed in mg/kg dry weight unless specified otherwise. Microbiological testing was commenced within 24 hours of sampling unless otherwise stated. VIC-MM524: Plate count results <10 per mL and >300 per mL are deemed as approximate. VIC-MM526: Plate count results <2,500 per mL and >250,000 per mL are deemed as approximate. Calculated results are based on raw data.

Page: Page 8 of 11 Batch No: 13-61503 Report Number: 405937 Client: Douglas Partners Pty Ltd
Client Program Ref 79048.00 - Wallan AAI--S Value
3703182 QC - Blank OES Scan Potassium mg/L <0.1 3703182 QC-Blank OES Scan Sodium mg/L <0.1 3703188 QC - Blank OES Scan Calcium mg/L <0.1 3703188 QC - Blank OES Scan Magnesium mg/L <0.1 3703188 QC - Blank OES Scan Potassium mg/L <0.1 3703188 QC - Blank OES Scan Sodium mg/L <0.1 3707021 QC - Blank OES Scan Calcium mg/L <0.1 3707021 QC - Blank OES Scan Magnesium mg/L <0.1 3707021 QC - Blank OES Scan Potassium mg/L <0.1 3707021 QC - Blank OES Scan Sodium mg/L <0.1
QUALITY CONTROL - DUPLICATES QC Data for duplicates is calculated on raw 'unrounded' values. Laboratory duplicates are randomly selected samples tested by the laboratory to maintain method precision and provide information on sample homogeniety. RPD = Relative Percentage Difference for duplicate determinations. RPD's that fall outside the general acceptance criteria will be attributed to non-homogeneity of samples or results of low magnitudes.
Sample Value Duplicate Value % RP D Lab Sample ID Client Sample ID Analysis Analyte 3701419 NCP Chloride Chloride, as Cl mg/L 1400 1400 2.2 3701419 NCP SO4 DA Sulphate, as SO4 mg/L 200 200 3.0 3702291 NCP pH pH, units Units 7.0 7.1 0.1 3702313 NCP pH pH, units Units 8.4 8.4 0.1 3703090 GW3-211113 Chloride Chloride, as Cl mg/L 640 650 1.4
3703090 GW3-211113 SO4 DA Sulphate, as SO4 mg/L 57 56 2.0
3703454 NCP Alkalinity Bicarbonate Alkalinity as CaCO3 mg CaCO3 IL <2 <2 0
3703454 NCP Alkalinity Carbonate Alkalinity as CaCO3 mg CaCO3 IL <2 <2 0
3703454 NCP Alkalinity Hydroxide Alkalinity as CaCO3 mg CaCO3 IL <2 <2 0
3703454 NCP Alkalinity Total Alkalinity as CaCO3 mg CaCO3 IL <2 <2 0
3703455 GW4-211113 Alkalinity Bicarbonate Alkalinity as CaCO3 mg CaCO3 IL 180 190 1.9
3703455 GW4-211113 Alkalinity Carbonate Alkalinity as CaCO3 mg CaCO3 IL <2 <2 0
3703455 GW4-211113 Alkalinity Hydroxide Alkalinity as CaCO3 mg CaCO3 IL <2 <2 0
3703455 GW4-211113 Alkalinity Total Alkalinity as CaCO3 mg CaCO3 /L 180 190 1.9
3703621 NCP TDS at 180°C +A 5°C Total Dissolved Solids mg/L 540 550 0.9
3703622 RIN-211113 TDS at 180°C +/- 5°C Total Dissolved Solids mg/L <5 <5 0
Lab Sample ID Client Sample ID Analysis Analyte 3701248 NCP TKNITTP (HL) Total Kjeldahl Nitrogen as N mg NIL 84 81 3.2
Samples tested as received. A blank space indicates no test performed. Soil results expressed in mg/kg dry weight unless specified otherwise. Microbiological testing was commenced within 24 hours of sampling unless otherwise stated. VIC-MM524: Plate count results <10 per mL and >300 per m l are deemed as approximate. VIC-MM526: Plate count results <2,500 per mL and >250,000 per mL are deemed as approximate. Calculated results are based on raw data.
M I M N M i l l M I NMI = I M R NMI = I M N M I M I M I NMI = I NMI = I = I NMI

1111111111MMINNIMIN■1111•111011•IMMINIMI•11111•111MINIIIIINIIIIIMI,
Page: Page 9 of 11 Batch No: 13-51503 Report Number: 405937 Client: Douglas Partners Pty Ltd
Client Program Ref: 79048.00 - Wallan
Sample Value I Duplicate Value I )̀/0 RPD 3701419 NCP NH3 as N (DA) Ammonia, as N mg N / L 0.1 0.2 44.2 3701419 NCP NO3-N Nitrate, as N mg N / L 6.9 6.8 1.5 3703090 GW3-211113 NH3 as N (DA) Ammonia, as N mg N / L <0.1 <0.1 0 3703090 GW3-211113 NOX as N (DA) Nitrate + Nitrite, as N mg N / L 0.01 0.01 0.0 3703090 GW3-211113 NO3-N Nitrate, as N mg N / L <0.01 <0.01 0 3703090 GW3-211113 NO2-N Nitrite, as N mg N / L <0.01 <0.01 0 Lab Sample ID Client Sample ID Analysis Analyte 3703045 RIN-211113 MS Total Metals Arsenic mg/L <0.001 <0.001 0 3703045 RIN-211113 MS Total Metals Cadmium mg/L <0.0002 <0.0002 0 3703045 RIN-211113 MS Total Metals Chromium mg/L <0.001 <0.001 0 3703045 RIN-211113 MS Total Metals Copper mg/L <0.001 <0.001 0 3703045 RIN-211113 MS Total Metals Lead mg/L <0.001 <0.001 0 3703045 RIN-211113 MS Total Metals Mercury mg/L <0.0001 <0.0001 0 3703045 RIN-211113 MS Total Metals Molybdenum mg/L <0.001 <0.001 0 3703045 RIN-211113 MS Total Metals Nickel mg/L <0.001 <0.001 0 3703045 RIN-211113 MS Total Metals Selenium mg/L <0.001 <0.001 0 3703045 RIN-211113 MS Total Metals Silver mg/L <0.001 <0.001 0 3703045 RIN-211113 MS Total Metals Tin mg/L 0.007 0.006 2.3 3703046 DUP-211113 MS Total Metals Arsenic mg/L <0.001 <0.001 0 3703046 DUP-211113 MS Total Metals Cadmium mg/L <0.0002 <0.0002 0 3703046 DUP-211113 MS Total Metals Chromium mg/L <0.001 <0.001 0 3703046 DUP-211113 MS Total Metals Copper mg/L 0.001 0.002 5.2 3703046 DUP-211113 MS Total Metals Lead mg/L <0.001 <0.001 0 3703046 DUP-211113 MS Total Metals Mercury mg/L <0.0001 <0.0001 0 3703046 DUP-211113 MS Total Metals Molybdenum mg/L <0.001 <0.001 0 3703046 DUP-211113 MS Total Metals Nickel mg/L 0.003 0.004 5.1 3703046 DUP-211113 MS Total Metals Selenium mg/L <0.001 <0.001 0 3703046 DUP-211113 MS Total Metals Silver mg/L <0.001 <0.001 0 3703046 DUP-211113 MS Total Metals Tin mg/L 0.001 0.001 0.8 3703046 DUP-211113 MS Total Metals Zinc mg/L 0.005 0.006 . _
19.5 _ 3703181 NCP OES Scan Calcium mg/L 74 68 8.3
3703181 NCP OES Scan Magnesium mg/L 46 44 5.9 _ 3703181 NCP OES Scan Potassium mg/L 33 32 4.1
3703181 NCP OES Scan Sodium mg/L 430 430 1.4 3707012 GW6-211113 OES Scan Calcium mg/L 12 11 8.7 3707012 GW6-211113 OES Scan Magnesium mg/L 24 22 4.6
Samples tested as received. A blank space indicates no test performed. Soil results expressed in mg/kg dry weight unless specified otherwise. Microbiological testing was commenced within 24 hours of sampling unless otherwise stated. VIC-MM524: Plate count results <10 per mL and >300 per mL are deemed as approximate. VIC-MM526: Plate count results <2,500 per mL and >250,000 per mL are deemed as approximate. Calculated results are based on raw data.

Page: Page 10 of 11 Batch No: 13-51503 Report Number: 405937 Client: Douglas Partners Pty Ltd
Client Program Ref 79048.00 - Wallan IL S
Sample Value I Duplicate Value % RP D 3707012 GW6-211113 OES Scan Potassium mg/L 1 1 3.3 3707012 GW6-211113 OES Scan Sodium mg/L 120 120 7.4 3707013 GW2-211113 OES Scan Calcium mg/L 130 110 19.0 3707013 GW2-211113 OES Scan Magnesium mg/L 450 440 2.5 3707013 GW2-211113 OES Scan Potassium mg/L 10 9 7.5 3707013 GW2-211113 OES Scan Sodium mg/L 2100 2000 3.1
QUALITY CONTROL - SPIKES QC Data for spikes is calculated on raw 'unrounded values. Laboratory spikes are randomly selected samples in which the analytes in question have been artificially introduced and recovered via standard analysis and are used to provide information on potential matrix effects on analyte recoveries. Spike recoveries that fall outside the general acceptance criteria will be attributed to sample matrix interference or results of high magnitudes. NCP: Non-Customer Parent (sample quality is representative of the analytical batch but the sample that was QC tested belongs to a customer not pertaining to the report.)
Sample Value I Expected Value I % Recove Lab Sample ID Client Sample ID Analysis Analyte 3701413 NCP Chloride Chloride, as CI mg/L 1400 1600 117 3701413 NCP SO4 DA Sulphate, as SO4 mg/L 200 400 111 3703078 GW3-211113 Chloride Chloride, as CI mg/L 640 840 103 3703078 GW3-211113 SO4 DA Sulphate, as SO4 mg/L 57 260 102 3703618 NCP TDS at 180°C +/- 5°C Total Dissolved Solids mg/L 260 3600 103 Lab Sample ID Client Sample ID Analysis Analyte 3701250 NCP TKN/TP (HL) Total Kjeldahl Nitrogen as N mg N / L 0.8 2.8 104 3701413 NCP NH3 as N (DA) Ammonia, as N mg N / L 0.1 70 100 3701413 NCP NO3-N Nitrate, as N mg NIL 6.9 15 88.0 3703078 GW3-211113 NH3 as N (DA) Ammonia, as N mg NIL <0.1 70 97.7 3703078 GW3-211113 NOX as N (DA) Nitrate + Nitrite, as N mg N / L 0.01 10 99.2 3703078 GW3-211113 NO3-N Nitrate, as N mg NIL <0.01 8.0 98.3 3703078 GW3-211113 NO2-N Nitrite, as N mg N / L <0.01 2.0 102 Lab Sample ID Client Sample ID Analysis Analyte 3703047 DUP-211113 MS Total Metals Arsenic mg/L <0.001 0.40 108 3703047 DUP-211113 MS Total Metals Cadmium mg/L <0.0002 0.40 105 3703047 DUP-211113 MS Total Metals Chromium mg/L <0.001 0.40 101 3703047 DUP-211113 MS Total Metals Copper mg/L 0.001 0.40 101 3703047 DUP-211113 MS Total Metals Lead mg/L <0.001 0.40 99.8 3703047 DUP-211113 MS Total Metals Mercury mg/L <0.0001 0.0020 88.5 3703047 DUP-211113 MS Total Metals Molybdenum mg/L <0.001 0.40 106
Samples tested as received. A blank space indicates no test performed. Soil results expressed in mg/kg dry weight unless specified otherwise. Microbiological testing was commenced within 24 hours of sampling unless otherwise stated. VIC-MM524: Plate count results <10 per mL and >300 per mL are deemed as approximate. VIC-MM526: Plate count results <2,500 per mL and >250,000 per mL are deemed as approximate. Calculated results are based on raw data.
V I E = I M I M I i l l NMI n i l I = MIN NMI NMI MIN M N = I = I I =I

I N N IIIIII 1.111 O M = I M I N M M I I = O M I = I = M i l M N I = M I M I •
Page: Page 11 of 11 Batch No: 13-51503 Report Number: 405937 Client: Douglas Partners Pty Ltd
Client Program Ref: 79048.00 - Wallan AL S Sample Value Expected Value Recove 3703047 DUP-211113 MS Total Metals Nickel mg/L 0.003 0.40 100 3703047 DUP-211113 MS Total Metals Selenium mg/L <0.001 0.40 107 3703047 DUP-211113 MS Total Metals Silver mg/L <0.001 0.20 117 3703047 DUP-211113 MS Total Metals Tin mg/L 0.001 0.40 108 3703047 DUP-211113 MS Total Metals Zinc mg/L 0.005 0.40 103 3707020 NCP OES Scan Calcium mg/L 0.2 2.2 92.4 3707020 NCP OES Scan Magnesium mg/L 0.1 2.1 88.3 3707020 NCP OES Scan Potassium mg/L 0.3 2.3 95.2 3707020 NCP OES Scan Sodium mg/L 3.2 5.2 90.0
Samples tested as received. A blank space indicates no test performed. Soil results expressed in mg/kg dry weight unless specified otherwise. Microbiological testing was commenced within 24 hours of sampling unless otherwise stated. VIC-MM524: Plate count results <-10 per mL and >300 per mL are deemed as approximate. VIC-MM526: Plate count results <2,500 per mL and >250,000 per mL are deemed as approximate. Calculated results are based on raw data.

I I E D o u g l a s Partners Geotechnics I Environment I Groundwater
S(S-t)
Project Name: Wallan GW monitoring Project Number. 79048.00 DP Contact Person: Alex Patterson Prior storage: E s k y Fridge
Date relinquished: Results required by: Turnaround requirements:
22.11.13 29.11.13 PM standard
LAB REFERENCE:
To ALS 22 Dalmore Drive Scoresby
Ph: Attn: Tuyen Nguyen 8 samples in 2 eskies Sample Receipt: Signed' Sample Receipt: Signed' Date.
f " ft
I A L S Water Piusources Gra, p !Received By: i n L IDaie: i i i t i t i . ; Time: IALS WRG Bottles: ISampla Intact:
i._.
'C,hillediPressived: 1
,
Y Rio Y I No
Y '
Laboratory Sample Receipt Stamp
Sample ID Sample Sample Lab ID pH & TDS \ .k, Nitrogen, Nitrates,
Nitrites, Ammonia
*4 Major Anions and Cations
N. Metals*
- Notes Type Date
, GW1-211113 Water 21.11.13 Y Y Y -../ ,
*As, Cd, Cr, Cu, Pb, 1-laMo, Ni, Sn, Se, Ag, Zn
GW2-211113 Water 21.11.13 i Y Y Y GW3-211113 Water 21.11.13 Y ../ Y Y GW4-211113Water 21.11_13 1 Y ../ Y GW5-211113 Water 21.11.13 1 i Y ,./ GM-211113 Water 21.11.13 I Y i Y DUP-211113 Water 21.11.13 Y Y Y i RIN-211113 Water 21.11.13 Y Y V ../
M N = I I IMO NMI NMI M I M I NMI NMI = I = I I IM I E M I NMI = I M I NMI I=

Appendix E
Groundwater Well Construction License

Works Licence ID:
WLE058304 Printed on: 04 Nov 2013 8:26:57 am
COPY OF RECORD IN THE VICTORIAN WATER REGISTER
LICENCE TO CONSTRUCT WORKS under Section 67 o f the Water Act 1989
The information in this copy o f record is as recorded at the time o f printing. Current information should be obtained by a search o f the register. The State o f Victoria does not warrant the accuracy or completeness o f this information and accepts no responsibility f o r any subsequent release, publication or reproduction o f this information.
This licence does not remove the need to apply f o r any authorisation or permission necessary under any other Act of Parliament with respect to anything authorised by the works licence.
Water used under this licence is not f i t f o r any use that may involve human consumption, directly or indirectly, without first being properly treated.
This licence is not to be interpreted as an endorsement o f the design and/or construction o f any works (including dams). The Authority does not accept any responsibility or liability f o r any suits or actions arising from injury, loss, damage or death to person or property which may arise from the maintenance, existence or use o f the works.
Each person named as a licence holder is responsible for ensuring all the conditions o f this licence are complied with.
This licence authorises its holders to construct the described works, subject to the conditions.
Licence Holder(s) AUSTRAL BRICKS o f 525 STUD ROAD SCORESBY VIC 3179
Licence Contact Details AUSTRAL BRICKS 525 STUD ROAD
SCORESBY VIC 3179
Licence Details Expiry date 04 Nov 2014
Status Active
Authority Southern Rural Water
Name o f waterway or aquifer UNC-Unincorporated
Water system Unincorporated (GMU)
Summary o f Licensed Works The details in this section are a summary only. They are subject to the conditions specified in this licence.
Works ID Works type Use o f water WRK076775 Bore Observation or investigation WRK076776 Bore Observation or investigation WRK076777 Bore Observation or investigation WRK076778 Bore Observation or investigation WRK076779 Bore Observation or investigation WRK076780 Bore Observation or investigation
Copy of Record Printed on: 04 Nov 2013 8:26:57 am Works Licence ID:WLE058304 Page 1 of 6

Description o f Licensed Works
W O R K S ID WRK076775 Works type Bore Works subtype Drilled bore Maximum depth 50.000 metres
Extraction Details
Use of water Observation or investigation
Works location
Easting Northing Zone MGA
Nil
Land description Volume 10520 Folio 126 Lot 1 o f Plan TP015332D
Property address
2330 EPPING - KILMORE ROAD, WALLAN, VIC 3756
Description o f Licensed Works
W O R K S ID WRK076776 Works type Bore Works subtype Drilled bore Maximum depth 50.000 metres
Extraction Details
Use o f water Observation or investigation
Works location
East ing Northing Zone MGA
Nil
Land description Volume 10520 Folio 126 Lot 1 of Plan TP015332D
Property address
2330 EPPING - KILMORE ROAD, WALLAN, VIC 3756
Description o f Licensed Works
W O R K S ID WRK076777 Works type Bore Works subtype Drilled bore Maximum depth 50.000 metres
Copy o f Record Printed on: 04 Nov 2013 8:26:57 am Works Licence ID:WLE058304 Page 2 of 6

Extraction Details
Use o f water Observation or investigation
Works location Easting Northing Zone MGA Nil
Land description Volume 10520 Folio 126 Lot 1 o f Plan TP015332D
Property address
2330 EPPING - KILMORE ROAD, WALLAN, VIC 3756
Description o f Licensed Works
WORKS ID WRK076778 Works type Bore
Works subtype Drilled bore
Maximum depth 50.000 metres
Extraction Details
Use o f water Observation or investigation
Works location
Easting Northing Zone MGA Nil
Land description Volume 10520 Folio 126 Lot 1 o f Plan TP015332D
Property address
2330 EPPING - KILMORE ROAD, WALLAN, VIC 3756
Description o f Licensed Works
WORKS ID WRK076779 Works type Bore
Works subtype Drilled bore
Maximum depth 50.000 metres
Extraction Details
Use o f water Observation or investigation
Works location
Easting Northing Zone MGA Nil
Copy of Record Printed on: 04 Nov 2013 8:26:57 am Works Licence ID:WLE058304 Page 3 of 6

Land description Volume 10520 Folio 126 Lot 1 o f Plan TP015332D
Property address 2330 EPPING - KILMORE ROAD, WALLAN, VIC 3756
Description o f Licensed Works
W O R K S ID WRK076780
Works type Bore
Works subtype Drilled bore
Maximum depth 50.000 metres
Extraction Details Use o f water Observation or investigation
Works location Easting Northing Zone MGA Nil
Land description Volume 10520 Folio 126 Lot 1 o f Plan TP015332D
Property address 2330 EPPING - KILMORE ROAD, WALLAN, VIC 3756
Related Instruments Related entitlements Nil
Related water-use entities Nil
Application History Reference Type Status Lodged date Approved date Recorded date W11022328 Issue Approved 01 N o v 2013 04 N o v 2013
Copy o f Record Printed on: 04 Nov 2013 8:26:57 am Works Licence ID:WLE058304 Page 4 of 6

Conditions Licence WLE058304 is subject to the following conditions: Siting and construction
1 The bore must be constructed on the land described in the licence, at coordinates E: 323977.0, N: 5854832.0, Zone: 55.
2 The bore(s) must be drilled at the location specified in the application approved by the Authority, but if after drilling a bore is considered unsatisfactory, a replacement bore may be drilled at an alternative site no greater than 20 metres from the authorised site and no closer to neighbouring bores or nearby waterways, or as authorised by the Authority before the commencement o f drilling.
Preventing pollution
3 All earthworks must be carried out, and all drilling fluids and waters produced during construction and development must be disposed of, in ways that avoid contaminating native vegetation, waterways, aquifers, the riparian environment, the riverine environment or other people's property.
4 Construction must stop immediately if the Authority reasonably believes that fuel, lubricant, drilling fluid, soil or water produced during construction and development is at risk of being spilled into native vegetation, waterways, aquifers, the riparian environment, the riverine environment or other people's property.
5 The licence holder must construct and maintain bund walls, in accordance with the timeframe, specifications, guidelines or standards prescribed by the Authority, to prevent fuel, lubricant, drilling fluid, soil or water produced during construction and development from being spilled into native vegetation, waterways, aquifers, the riparian environment, the riverine environment or other people's property.
Construction standards
6 The bore(s) must be constructed, and where relevant decommissioned, in accordance with the Minimum Construction Requirements for Water Bores in Australia, Edition 3.
Drilling licence and supervision requirements
7 The bore(s) must be constructed by, or under the direct supervision of, a driller licensed under the Water Act 1989 and endorsed as a Class 1, 2, or 3 driller, with appropriate endorsements.
8 The licence holder must ensure that the licensed driller notifies the Authority's Drilling Inspector at least one day prior to work commencing on any grouting operations and must not proceed with the work unless authorised by the Drilling Inspector.
Bore completion report
9 The licence holder must ensure that the licensed driller sends a Bore Completion Report to the Authority within twenty-eight working days of the bore(s) being completed.
10 The works referred to in the licence must not be made operational until the Authority acknowledges receipt o f an acceptable Bore Completion Report.
11 The works referred to in the licence must not be made operational until the licence holder sends a water sample to the laboratory nominated by the Authority.
Protecting water resources 12 No more than 6 bore(s) may be brought to final development under this licence. 13 At the completion o f drilling, and before the drilling rig leaves the site, all but 6 bore(s) must
be decommissioned so as to eliminate physical hazards, conserve aquifer yield, prevent groundwater contamination and prevent the intermingling of desirable and undesirable waters.
Protecting water quality
14 The bore(s) must be constructed so as to prevent aquifer contamination caused by vertical flow outside the casing.
15 If two or more aquifers are encountered, the bore(s) must be constructed to ensure that an Copy of Record Printed on: 04 Nov 2013 8:26:57 am Works Licence ID:WLE058304 Page 5 of 6
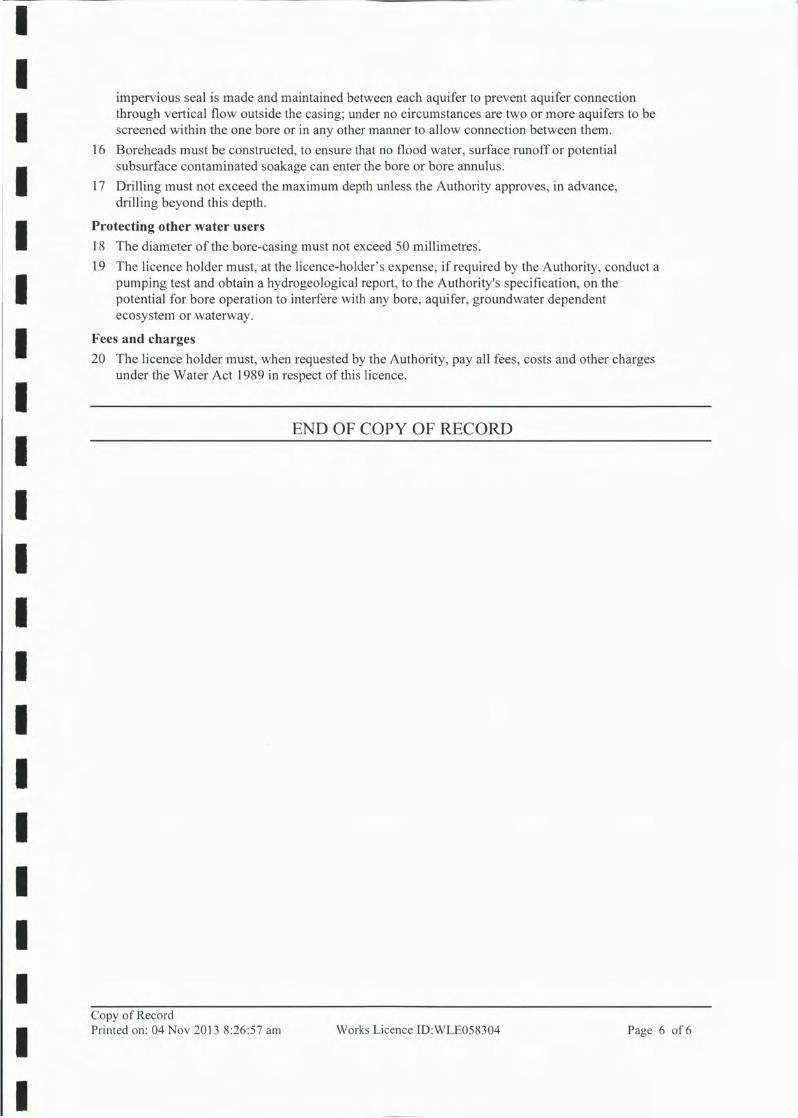
impervious seal is made and maintained between each aquifer to prevent aquifer connection through vertical flow outside the casing; under no circumstances are two or more aquifers to be screened within the one bore or in any other manner to allow connection between them.
16 Boreheads must be constructed, to ensure that no flood water, surface runoff or potential subsurface contaminated soakage can enter the bore or bore annulus.
17 Drilling must not exceed the maximum depth unless the Authority approves, in advance, drilling beyond this depth.
Protecting other water users 18 The diameter o f the bore-casing must not exceed 50 millimetres. 19 The licence holder must, at the licence-holder's expense, if required by the Authority, conduct a
pumping test and obtain a hydrogeological report, to the Authority's specification, on the potential for bore operation to interfere with any bore, aquifer, groundwater dependent ecosystem or waterway.
Fees and charges 20 The licence holder must, when requested by the Authority, pay all fees, costs and other charges
under the Water Act 1989 in respect of this licence.
END OF COPY OF RECORD
Copy o f Record Printed on: 04 Nov 2013 8:26:57 am Works Licence ID:WLE058304 Page 6 of 6

Appendix F
Quality Assurance / Quality Control

110Douglas Partners Geotechnics 1 Environment 1 Groundwater
APPENDIX F
QUALITY ASSURANCE/QUALITY CONTROL 2330 Epping - Kilmore Road, Wallan
Data Quality Objectives
Data quality objectives (DQO) were developed for the groundwater sampling undertaken to ensure the integrity and reproducibility of the tests and to provide a check on the potential for cross-contamination during the sampling process.
The procedures undertaken to achieve the DQO included deployment of trained personnel familiar with soil and groundwater sampling techniques. Laboratory QA/QC was undertaken and fulfilled by the primary laboratory, ALS Water Resources Group (ALS).
Quality Assurance (QA) was maintained by:
• Using qualified environmental scientists and engineers to undertake the field supervision and sampling.
• following the DP operating procedures for field testing and decontamination, and
• Using NATA registered laboratories for sample testing that utilise standard laboratory methods of the US EPA, the APHA and Victorian EPA.
2. Data Quality Indicators
The analysis of quality control duplicate samples and in-house laboratory QA/QC procedures should be assessed against the following data quality indicators for the assessment:
• Conformance with specified holding times.
• Accuracy of spiked sample recoveries within the acceptable range (70-130% for inorganic contaminants/metals and 60-140% organics).
• Field and laboratory duplicates and replicates samples will have a precision average of +/- 50% relative percent difference (RPD).
• Concentration of contaminants in laboratory reagents and blanks below the practical quantitation limit.
• Field duplicates/replicates will be collected at a minimum frequency of one each day of sampling.
• One rinsate sample of field equipment will be collected for each day of groundwater sampling.
Field Quality Assurance / Quality Control
DP split a groundwater sample into two during field procedures, and sent both samples to the primary laboratory (ALS) for analysis without any indication of their duplication. Both samples were analysed for the same parameters. This procedure is known as blind duplicate sampling.

E 3 D o u g l a s Partners Geotechnics I Environment I Groundwater
A measure of laboratory precision was obtained by calculating the relative percent difference (RPD) between duplicate pairs, as shown in equation (1) below. The RPD has a value between 0% and 200%, and DP generally adopts a criterion of between 0% and 50% as acceptable, depending on the contaminant.
ICoriginal -
Cduplicatel
% RPD - x100 Average(Coriginal,Cduplicate) (1)
The results of blind duplicate testing performed by ALS for the blind duplicate groundwater sample analysed is provided in Table F l below.
Table Fl : Groundwater Blind Duplicate Analysis Analyte GW1-211113 DUP1-211113 RPD (%)
0.0 2.0
7.7 0.0 4.4
22.2 20.4
0.0 40.0 0.0
40.0
pH
TDS
Chloride
Sulphate
Potassium
Calcium
Magnesium
Sodium
TKN
Total Nitrogen
Nitrate Nitrogen (N mg/L)
Nitrite Nitrogen (N mg/L)
Ammonia
Arsenic
Cadmium
Total Chromium
Copper
Mercury
Nickel
Lead
Silver
Selenium
Tin
Zinc
6.7
4900
2700
230
7
150
270
1100
0.3
0.3
0.02
<0.01
0.1
<0.001
<0.0002
<0.001
0.001
<0.0001
0.003
<0.001
<0.001
0.001
0.002
0.004
6.7
5000
2500
230
6.7
120
220
1100
0.2
0.3
0.03
<0.01
<0.1
<0.001
<0.0002
<0.001
0.001
<0.0001
0.003
<0.001
<0.001
<0.001
0.001
0.005
0.00
0.00
66.67
22.22
Note: Results in mg/kg unless otherwise stated
- = Indicates primary and / or duplicate sample(s) results are below the limits of laboratory Detection
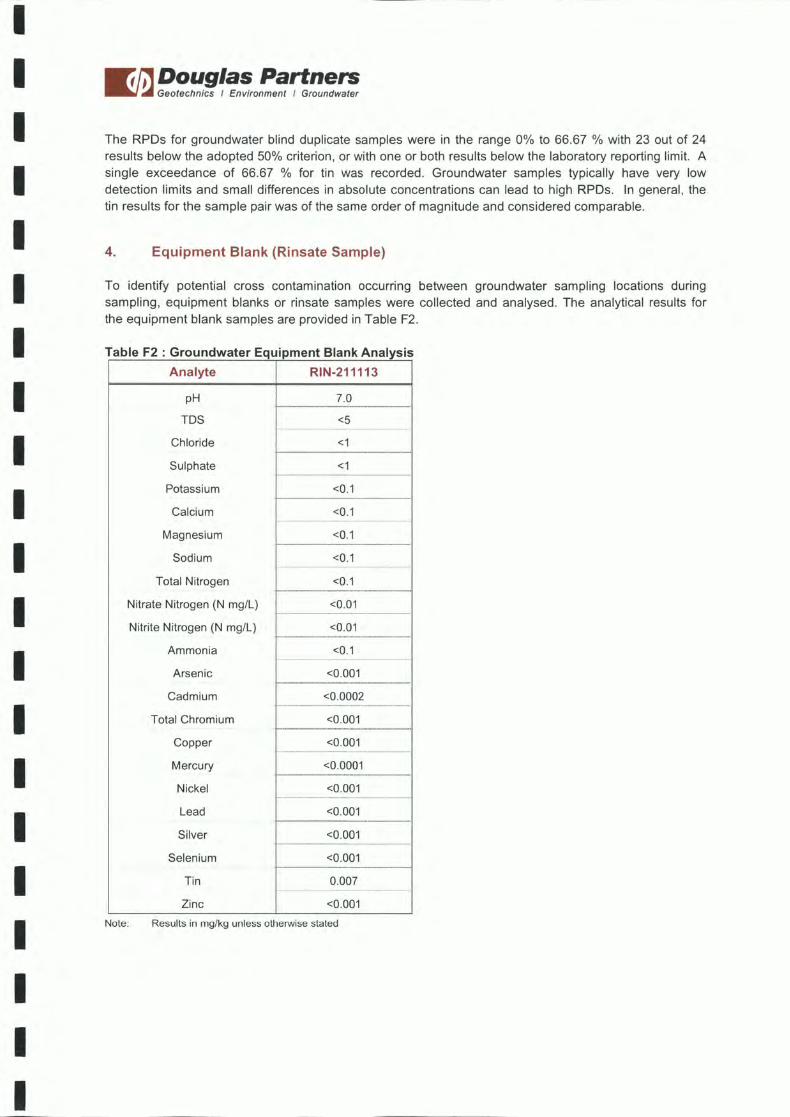
J] Douglas Partners Geotechnics Environment I Groundwater Geotechnics Environment I Groundwater
The RPDs for groundwater blind duplicate samples were in the range 0% to 66.67 % with 23 out of 24 results below the adopted 50% criterion, or with one or both results below the laboratory reporting limit. A single exceedance of 66.67 °A for tin was recorded. Groundwater samples typically have very low detection limits and small differences in absolute concentrations can lead to high RPDs. In general, the tin results for the sample pair was of the same order of magnitude and considered comparable.
4. Equipment Blank (Rinsate Sample)
To identify potential cross contamination occurring between groundwater sampling locations during sampling, equipment blanks or rinsate samples were collected and analysed. The analytical results for the equipment blank samples are provided in Table F2.
Table F2 : Groundwater Equipment Blank Analysis Analyte RIN-211113
pH
TDS
Chloride
Sulphate
Potassium
Calcium
Magnesium
Sodium
Total Nitrogen
Nitrate Nitrogen (N mg/L)
Nitrite Nitrogen (N mg/L)
Ammonia
Arsenic
Cadmium
Total Chromium
Copper
Mercury
Nickel
Lead
Silver
Selenium
Tin
Zinc
7.0
<5
<1
<1
<0.1
<0.1
<0.1
<0.1
<0.1
<0.01
<0.01
<0.1
<0.001
<0.0002
<0.001
<0.001
<0.0001
<0.001
<0.001
<0.001
<0.001
0.007
<0.001
Note: Results in mg/kg unless otherwise stated

r f j D o u g l a s Partners Geotechnics 1 Environment I Groundwater
The rinsate sample recorded a detectable concentration for tin of 0.007 mg/kg. Although this indicates a theoretical risk of cross contamination from the sampling equipment during the sampling, the laboratory analysis results did not show consistently elevated tin results indicative of contamination by the sampling equipment. As such the implemented equipment decontamination procedures were considered adequate to have prevented cross contamination during sample collection.
5. Laboratory Quality Assurance / Quality Control
Quality Control (QC) of the laboratory program was achieved by the following means:
• Method blanks - the laboratory ran reagent blanks to confirm the equipment and standards used were uncontaminated.
• Laboratory duplicates - the laboratory split samples internally and conducted tests on separate extracts.
• Laboratory spikes - samples were spiked by the laboratory with a known concentration of contaminants and subsequently tested for recovery.
5.1 Method Blanks
All method blanks returned results below the laboratory reporting limit, and therefore, it may be concluded that there is minimal potential for contamination in laboratory equipment or standards.
5.2 Laboratory Duplicates
The relative percent difference (RPD) between duplicate pairs was calculated to measure laboratory precision. DP generally adopts a criterion of 50% as acceptable. The laboratory duplicates were within the adopted criteria of 50%.
5.3 Laboratory Spikes
The recoveries for individual contaminants were all found to be within the acceptable range of 60-140% for organics and 70-130% for inorganics.
6. Conclusions
Overall the accuracy and precision of the soil and groundwater testing procedures, as inferred by the QA/QC data, is considered by DP to be of sufficient standard to enable the data, as reported by ALS to be used by DP for interpretation of groundwater contamination conditions.