dopas - igdtp.eu · report d3.17 presents up-to-date results of laboratory testing related to the...
TRANSCRIPT

DOPAS
DOPAS (Contract Number: FP7 - 323273)
Deliverable n° D3.17
D3.17 Interim results of EPSP laboratory testing
Authors: Radek Vašíček, Markéta Levorová, Lucie Hausmannová, Jiří Šťástka,
CTU in Prague;
Petr Večerník, Dagmar Trpkošová, Jenny Gondolli, ÚJV Řež, a. s.;
Date of issue of this report: 31/1/2014
Start date of project: 01/09/2012 Duration: 48 Months
Project co-funded by the European Commission under the Euratom Research and Training Programme on Nuclear Energy within the Seventh Framework Programme
Dissemination Level
PU Public
PP Restricted to other programme participants (including Commission Services) x
RE Restricted to a group specified by the partners of the DOPAS project
CO Confidential, only for partners of the DOPAS project

Deliverable n°D3.17 Version n°1.0 DOPAS 2/32
Dissemination level: PP
Date of issue of this report: 27/2/2014
Scope Deliverable n°3.17 Version: 1.0
Type/No. Report Total pages: 32
Appendices: 0
Title: D3.17 Interim results of EPSP laboratory testing Articles: 4
ABSTRACT:
This report presents up-to-date results of laboratory work related to the EPSP experiment. The
laboratory work will provide data for the subsequent numerical analysis of EPSP behaviour (WP5).
Bentonite parameters were determined and compared with other bentonites from the Czech Republic.
RESPONSIBLE:
Centre of Experimental Geotechnics, Czech Technical University in Prague, Radek Vašíček
REVIEW/OTHER COMMENTS:
Reviewed by SÚRAO, CTU and ÚJV, 28 January 2014
APPROVED FOR SUBMISSION:
Name: Johanna Hansen Date: 27 February 2014

Deliverable n°D3.17 Version n°1.0 DOPAS 3/32
Dissemination level: PP
Date of issue of this report: 27/2/2014
TABLE OF CONTENTS
1 Introduction ............................................................................................................................. 4
2 Qualitative requirements oF EPSP building materials ............................................................ 5
3 Current state of laboratory tests ............................................................................................... 6
4 Results of laboratory tests ....................................................................................................... 9
4.1 Work performed by the Centre of Experimental Geotechnics, CTU in Prague .................. 9
4.1.1 Laboratory tests on bentonite ...................................................................................... 9
4.1.2 Comparison of B75_2013 with other Czech bentonites ............................................ 10
4.1.3 Pellet manufacturing technology and quality verification ......................................... 12
4.1.4 Conclusion of CTU work .......................................................................................... 17
4.2 Work performed by ÚJV Řež, a. s. ................................................................................... 18
4.2.1 Laboratory tests on bentonite .................................................................................... 18
4.2.2 Laboratory tests on grouting materials ...................................................................... 21
4.2.3 Laboratory tests on concrete/ cement ........................................................................ 21
4.2.4 Laboratory tests on the host rock ............................................................................... 25
4.2.5 Physical models ......................................................................................................... 26
4.2.6 Conclusion of ÚJV work ........................................................................................... 30
5 Literature ............................................................................................................................... 31
6 List of abbreviations .............................................................................................................. 32

Deliverable n°D3.17 Version n°1.0 DOPAS 4/32
Dissemination level: PP
Date of issue of this report: 27/2/2014
1 INTRODUCTION
The aim of the DOPAS project is to address the design basis of and reference designs and strategies
for plugs and seals to be used in geological disposal facilities. The Czech experiment “Experimental
Pressure and Sealing Plug” (EPSP) is studying developments concerning the design basis, reference
designs and strategies including compliance issues.
Laboratory testing will provide data for the numerical analysis of EPSP behaviour (WP5). The
laboratory and in-situ tests have been planned so as to include the verification of the quality of the
work carried out by subcontracting companies (rock permeability following rock improvement,
deformation and strength parameters, concrete behaviour etc.) and to ensure that the relevant
parameters concerning the various rock and concrete plug components have been met in full.
Three groups of data are being produced – input material parameters, material parameters from
verification testing (the occasional checking for possible changes as the project progresses) and data
from small-scale physical models.
Report D3.17 presents up-to-date results of laboratory testing related to the EPSP experiment. The
data presented in this version of the report (by January 2014) was obtained by the Czech DOPAS
participants – CTU in Prague and ÚJV Řež, a. s.
This report presents the interim data, which has not been fully quality assured and analysed while
the laboratory testing work is still ongoing. This report will inform to the DOPAS Consortium about
the status of laboratory work within EPSP and increase the possibility to discuss the achieved results
so far within DOPAS Consortium. More comprehensive information on laboratory work done for
EPSP and the final results will be reported within D3.21 Final laboratory test report of EPSP, which
will be published in 2015.
Indicative time schedule of the project works on EPSP follows:
1. Selection of test location (MS4): 2012
2. Preparing the test site – clean up, engineering networks installation (electricity, technological
water, data network, light, ventilation): 01-04/2013
3. EPSP construction – phase 1 – drift shape adjustment, instrumentation boreholes incl. sensors,
connecting boreholes incl. casing/tubing, rock improvement: 11/2013-04/2014
4. EPSP construction – phase 2 – plug erection, monitoring and technology installation (MS11):
05-09/2014
5. Pilot testing: 09-12/2014
6. Monitoring and testing of plug: 09/2014-02/2016

Deliverable n°D3.17 Version n°1.0 DOPAS 5/32
Dissemination level: PP
Date of issue of this report: 27/2/2014
2 QUALITATIVE REQUIREMENTS OF EPSP BUILDING MATERIALS
The qualitative requirements of EPSP materials were set out in the DOPAS Deliverable D2.1
Design Bases and Criteria report (White et. al., 2013). Figure 1 shows EPSP components and their
building materials.
Glass fibres will be used as the reinforcement element in the fibre shotcrete. The concrete blocks
which serve as a permeable lost formwork may, alternatively, be made from aerated concrete. Czech
Ca-Mg bentonite “Bentonit 75” (B75) was selected as the material to be used for the bentonite sealing
section of EPSP, i.e. also as the raw material for pellet production. B75 is a Czech Ca-Mg, factory-
produced bentonite (raw bentonite is dried, milled and sifted to obtain required granulometry). It was
extracted from deposits in Northern Bohemia and produced by KERAMOST, Plc.
Figure 1 - Scheme of the EPSP conceptual design. Dimensions are in mm. (DOPAS Deliverable D2.1)
The requirements of EPSP materials according to DOPAS Deliverable D2.1 consist of:
The strength of the concrete shall be sufficient to withstand a maximum applied
pressure of 7MPa.
The emplaced bentonite B75 (mixture of pellets made of B75) shall achieve a density of
1.4Mg.m-3
.
The density of the bentonite seal is specified to achieve a swelling pressure of 2MPa
and a hydraulic conductivity of 10-12
m.s-1
.
The concrete blocks wall shall be constructed of reduced pH concrete, the same as for
the shotcrete. The pH of the concrete has not yet been specified but is expected to be
below 12.
Grouting shall be required for 5m around the EPSP niche in order to reduce hydraulic
conductivity and to allow sufficient pressurisation for the test.

Deliverable n°D3.17 Version n°1.0 DOPAS 6/32
Dissemination level: PP
Date of issue of this report: 27/2/2014
3 CURRENT STATE OF LABORATORY TESTS
The laboratory testing plan and the relevant responsible persons are provided in the following table
according to DOPAS Deliverable 3.16 - Testing plan for the EPSP laboratory experiment. The plan for
obtaining input parameters (chapter 4.1 in Deliverable 3.16, Vašíček et. al., 2013) is also shown.
In 2013 several series of initial tests on the bentonite, concrete mixture, rock samples and grouting
substances were performed. Testing which should have been performed by the winner of a public
tender on “EPSP construction – phase 1” (W1 in the table) has not yet been delivered. The results are
expected in April 2014. The results which should have been delivered by W2 (winner of the public
tender on EPSP construction – phase 2) are expected in mid-2014. The following table presents the
current status of laboratory testing.
Tab. 1- Status of the tests
Material Parameter Responsi
ble institution
Responsible person
Test procedure/ Standard Test and material
conditions
Testing period -
plan
State as in Dec. 2013
Bentonite Hydraulic
conductivity CEG CTU Vašíček
ČSN CEN ISO/TS 17892-11 Geotechnical
investigation and testing - Laboratory testing of soil - Part 11: Determination of permeability by constant
and falling head
compacted powder, dry densities 1100-
1800kg/m3
12/2013-04/2014
Done
Bentonite Swelling pressure
CEG CTU Vašíček
Testing without volume change, internal
description following Dixon et. al., 1999; procedure
available on Projectplace
compacted powder, dry densities 1100-
1800kg/m3
12/2013-04/2014
Done
Bentonite Hydraulic
conductivity CEG CTU Vašíček
ČSN CEN ISO/TS 17892-11 Geotechnical
investigation and testing - Laboratory testing of soil - Part 11: Determination of permeability by constant
and falling head
pellets compacted to dry densities
1100-1600kg/m3
04/2014-12/2014
Related to pellets/mixture
selection; under preparation
Bentonite Swelling pressure
CEG CTU Vašíček
Testing without volume change, internal
description following Dixon et. al., 1999; procedure
available on Projectplace
pellets compacted to dry densities
1100-1600kg/m3
04/2014-12/2014
Related to pellets/mixture
selection; under preparation
Bentonite Thermal
conductivity, heat capacity
CEG CTU Vašíček ISOMET 2104 device
powder - compacted, dry densities 1100-
1800kg/m3
12/2013-04/2014
Ongoing, by 04/2014
Bentonite Specific density
CEG CTU Vašíček
ČSN CEN ISO/TS 17892-3 - Geotechnical
investigation and testing - Laboratory testing of soil - Part 3: Determination of
particle density - Pycnometer method
powder 12/2013-04/2014
Done
Bentonite Atterberg
limits CEG CTU Vašíček
ČSN CEN ISO/TS 17892-
12: Geotechnical investigation and testing - Laboratory testing of soil - Part 12: Determination of
Atterberg limits
powder 12/2013-04/2014
Done
Bentonite Hydraulic
conductivity UJV
Večerník / Gondolli
ČSN CEN ISO/TS 17892-11 Geotechnical
investigation and testing - Laboratory testing of soil
dry densities 1100-1800kg/m
3
12/2013-04/2014
Ongoing, preliminary tests done

Deliverable n°D3.17 Version n°1.0 DOPAS 7/32
Dissemination level: PP
Date of issue of this report: 27/2/2014
Material Parameter Responsi
ble institution
Responsi
ble person Test procedure/ Standard
Test and material
conditions
Testing period -
plan
State as in
Dec. 2013
Bentonite Gas
permeability UJV
Večerník / Gondolli
Internal procedure based on ČSN CEN ISO/TS
17892-11 Geotechnical investigation and testing - Laboratory testing of soil
dry densities 1100-1800kg/m
3
12/2013-04/2014
Ongoing, preliminary tests done
Bentonite Porosity UJV Večerník / Gondolli
Internal procedure dry densities 1100-
1800kg/m3
12/2013-04/2014
Ongoing
Bentonite Swelling pressure
UJV Večerník / Gondolli
Internal procedure based on ČSN CEN ISO/TS
17892-11 Geotechnical investigation and testing - Laboratory testing of soil
dry densities 1100-1800kg/m
3
12/2013-04/2014
Ongoing, preliminary tests done
Bentonite (pellet
technology)
Manufacturing and mixture
selection CEG CTU Šťástka
Selection of Czech pellets producer with suitable
manufacturing technology
mixtures of various pellets types/
particle fractions 2013
Ongoing, by January 2014
Spraying and
compaction field tests
CEG CTU Šťástka Internal procedure mixtures of various
particle fractions/ pellets types
03/2013-07/2013
Delayed,
expected by March 2014
Concrete Thermal
conductivity, heat capacity
CEG CTU Vašíček ISOMET 2104 device
samples taken during installation,
according to Standard
09/2013-03/2014
Delayed, expected in mid-2014
Concrete Compressive
strength W2 (CTU) Vašíček
ČSN EN 12390 (731302) - Testing of hardened
concrete
samples taken during installation,
according to Standard
12/2013-02/2014
Delayed, expected in mid-2014
Concrete
Static modulus of elasticity in
compression
W2 (CTU) Vašíček
ČSN ISO 6784 (731319) - Concrete. Determination of static modulus of elasticity
in compression
samples taken during installation,
according to Standard
12/2013-02/2014
Delayed, expected in mid-2014
Concrete Static
modulus of deformation
W2 (CTU) Vašíček
ČSN ISO 6784 (731319) - Concrete. Determination of static modulus of elasticity
in compression
samples taken during installation,
according to Standard
12/2013-02/2014
Delayed, expected in mid-2014
Concrete Composition
and pH of leachate
UJV Večerník Based on SKB report R-
12-02 leaching into distilled water
07/2013-03/2014
Testing of cement paste
and cement+SiO2
done
Concrete Hydraulic
conductivity UJV Večerník
Based on ČSN CEN ISO /TS 17892
cylindrical sample 07/2013-03/2014
Delayed, expected in mid-2014
Concrete Gas
permeability UJV Večerník Internal procedure cylindrical sample
07/2013-03/2014
Expected in mid-2014
Concrete Porosity UJV Večerník Mercury porosimetry/ water
immersion method external analysis /
cubes, discs 07/2013-03/2014
Expected in mid-2014
Concrete Hardened concrete testing
W2 (UJV) Večerník ČSN EN 12390
Compressive strength, Depth of
penetration of water under pressure
07/2013-03/2014
Expected in mid-2014
Grouting substances
Interactions UJV Večerník Internal procedure for interaction processes
grouting/plug materials/plug environment
05/2013-06/2015
Influence of alkaline waters
on grouting material -
preliminary test
Rock samples
Compressive strength
W1 (SURAO)
Dvořáková
ČSN EN 1926 - Natural stone test methods -
Determination of uniaxial compressive strength
drilled cores 5/2013-7/2013
Delayed, expected in April 2014
Rock samples
Static modulus of deformation
W1 (SURAO)
Dvořáková
ČSN ISO 6784 (731319) - Concrete. Determination of static modulus of elasticity
in compression
drilled cores 5/2013-7/2013
Delayed, expected in April 2014

Deliverable n°D3.17 Version n°1.0 DOPAS 8/32
Dissemination level: PP
Date of issue of this report: 27/2/2014
Material Parameter Responsi
ble institution
Responsi
ble person Test procedure/ Standard
Test and material
conditions
Testing period -
plan
State as in
Dec. 2013
Rock samples
Density W1
(SURAO) Dvořáková
e.g. ČSN CEN ISO/TS 17892-2
drilled cores 5/2013-7/2013
Delayed, expected in April 2014
Rock samples
Permeability UJV Večerník Changes in rock
permeability due to grouting,
drilled cores 07/2013-03/2014
Delayed, expected in April 2014
Rock samples
Porosity UJV Večerník Mercury porosimetry /
water immersion method
external analysis / cubes, discs of plug
material
07/2013-03/2014
preliminary tests; Delayed,
expected in April 2014
Rock massif Modulus of deformation
W1 (SURAO)
Dvořáková Loading plate 1 field test (testing
niche) 5/2013-7/2013
Delayed, expected in April 2014
Rock massif Modulus of deformation
W1 (SURAO)
Dvořáková Menard presiometer test,
Eurocode 7- Part 2 field test, 2
boreholes (5m long) 5/2013-7/2013
Delayed, expected in April 2014
Rock massif Hydraulic
conductivity W1
(SURAO) Dvořáková Hydraulic pressure test
field test, 5 boreholes (5m)
5/2013-7/2013
Delayed, expected in April 2014
CEG CTU - Centre of Experimental Geotechnics, Faculty of Civil Engineering, Czech Technical University in Prague
W1 – winner of public tender on “EPSP construction – phase 1” work
W2 – winner of public tender on “EPSP construction – phase 2” work

Deliverable n°D3.17 Version n°1.0 DOPAS 9/32
Dissemination level: PP
Date of issue of this report: 27/2/2014
4 RESULTS OF LABORATORY TESTS
The following chapters present the latest results obtained from laboratory testing (by December
2013). The work performed is presented in the form of chapters according to the institution
responsible for delivery.
The bentonite material labelled as B75_2013 was selected for the DOPAS EPSP seal. B75
Bentonite is a Czech Ca-Mg industrially milled and sifted non-activated bentonite. The B75_2013
material was supplied in 2013. The laboratory tests were performed on the material in order to verify
its properties. In some cases the results of B75_2010 testing were used for comparison purposes
(B75_2010, i.e. B75 material supplied in 2010, examined in 2010-2013, e.g. Červinka & Hanuláková,
2013 and Červinka et. al., 2012).
Type of water (distilled and/ or “SGW - synthetic granitic water”, for composition see Tab. 2) used
during the laboratory tests is indicated in each sub-chapter. The distilled water has been used when
required by the standard (testing method) or when results comparable to former ones were wanted.
Laboratory prepared SGW (Havlová et al., 2010) is based on a statistical evaluation of the
composition of the groundwater of Czech granite massifs for depths 20-200 meters. In some cases
tests with “Josef” groundwater (collected in vicinity of the EPSP drift) are planned.
Tab. 2 - Composition of SGW – Synthetic granitic water (mg/l)
Na K Ca Mg Cl SO4 NO3 HCO3 F
10.6 1.8 27.0 6.4 42.4 27.7 6.3 30.4 0.2
4.1 Work performed by the Centre of Experimental Geotechnics, CTU in Prague
The basic laboratory tests were aimed at the estimation of the specific density and Atterberg limits
of the bentonite powder. This was followed by the determination of hydraulic conductivity and
swelling pressure with regard to compacted samples (several dry density values). Distilled water was
used for all tests.
The testing of the most appropriate technology for the manufacture of the pellets, in cooperation
with potential Czech producers, was carried out from May to November 2013. Tests aimed at
determining the most suitable mixture for spray technology purposes are ongoing. The verification of
the technology to be employed for pellet emplacement (a combination of plate compaction and
spraying) is planned for early 2014. Large testing cells used for the estimation of the hydraulic
conductivity and swelling pressure of the pellet samples have been constructed and initial testing has
already commenced. Distilled water has been used.
4.1.1 Laboratory tests on bentonite
The average of measured values of specific density is 2.855g/cm3.
The average liquid limit value was found to be 171% using distilled water for test purposes.
This value falls within the anticipated liquid limit range.
The swelling pressure of bentonite B75_2013 is in the range of approximately from 1 to 8MPa
for a dry density value of 1.26–1.64g/cm3. The dependence of swelling pressure on dry density
is shown in Figure 2. The value of swelling pressure for a dry density value of 1.4g/cm3 is
2MPa which indicates that swelling pressure behaviour corresponds to the initial
assumption (see Chapter 2; taken from DOPAS Deliverable D2.1, White et. al., 2013).

Deliverable n°D3.17 Version n°1.0 DOPAS 10/32
Dissemination level: PP
Date of issue of this report: 27/2/2014
The hydraulic conductivity of bentonite B75_2013 is in the range 10-12
- 10-13
m/s for a dry
density value of 1.26-1.64g/cm3; the dependence on dry density is shown in Figure 3. The
hydraulic conductivity value determined corresponds to the initial assumption (see
Chapter 2; taken from DOPAS Deliverable D2.1, White et. al., 2013).
Figure 2 – Swelling pressure of bentonite B75_2013
Figure 3 - Hydraulic conductivity of bentonite B75_2013
4.1.2 Comparison of B75_2013 with other Czech bentonites
This chapter provides a comparison of the geotechnical parameters of bentonite B75_2013 with a
selection of other Ca-Mg bentonites from the Czech Republic. Activated bentonite SAB65 (Sabenil
65, produced by KERAMOST, Plc.), which is characterized by significantly higher liquid limit and
swelling pressure and lower hydraulic conductivity values, was also subjected to comparison.
Deliverable n°D3.17 Version n°1.0 DOPAS 11/32
Dissemination level: PP
Date of issue of this report: 27/2/2014
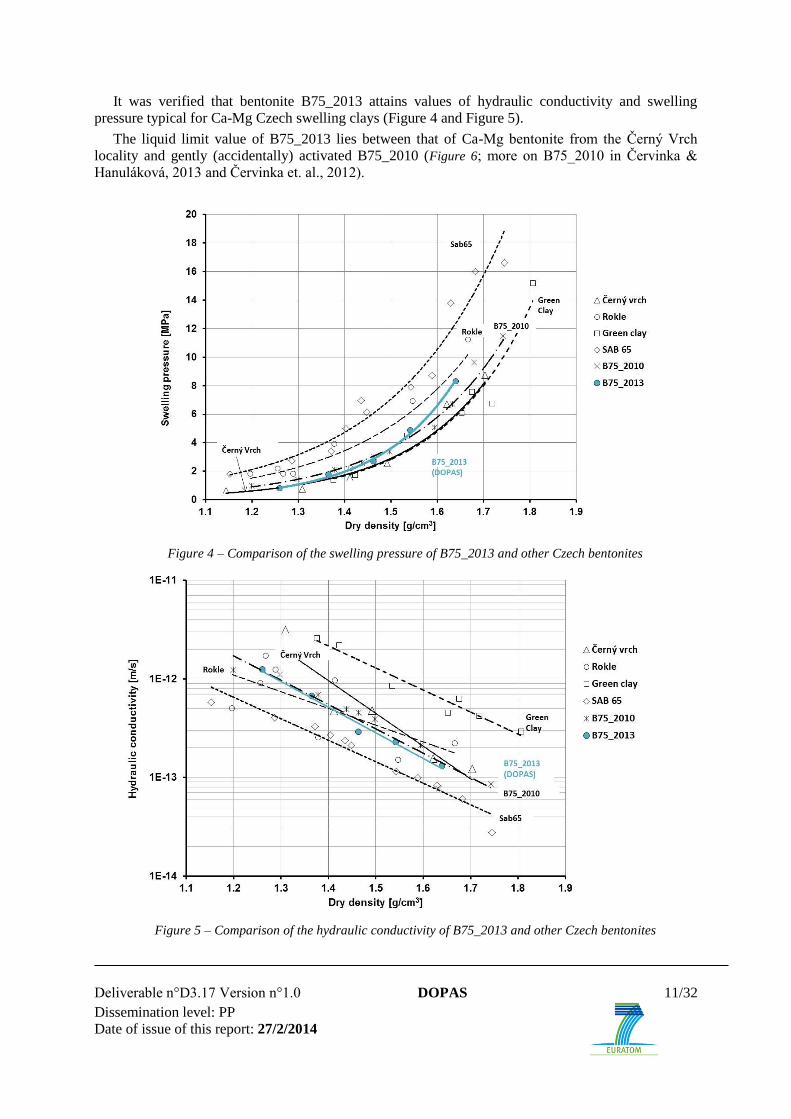
It was verified that bentonite B75_2013 attains values of hydraulic conductivity and swelling
pressure typical for Ca-Mg Czech swelling clays (Figure 4 and Figure 5).
The liquid limit value of B75_2013 lies between that of Ca-Mg bentonite from the Černý Vrch
locality and gently (accidentally) activated B75_2010 (Figure 6; more on B75_2010 in Červinka &
Hanuláková, 2013 and Červinka et. al., 2012).
Figure 4 – Comparison of the swelling pressure of B75_2013 and other Czech bentonites
Figure 5 – Comparison of the hydraulic conductivity of B75_2013 and other Czech bentonites

Deliverable n°D3.17 Version n°1.0 DOPAS 12/32
Dissemination level: PP
Date of issue of this report: 27/2/2014
Figure 6 – Comparison of the liquid limit of B75_2013 and other Czech bentonites
4.1.3 Pellet manufacturing technology and quality verification
4.1.3.1 Pellet production
The aim of this part of the project was to find Czech producers of bentonite pellets of a sufficiently
high quality level and the production capacity needed for EPSP purposes. It involved establishing
contacts with various potential industrial partners in order to verify the quality of their products, i.e.
the detailed testing of the relevant properties in terms of use in the EPSP seal. The key issue concerned
attaining the ideal dry density level following pellet emplacement, the verification of which concerns
the use of a range of techniques: free fall pouring, vibration, spraying and plate compaction.
B75 is produced in powder form which is not ideal for sealing plug purposes due to the low level of
compaction. Therefore, the first stage involved the selection of the best compaction technology
commercially available in the Czech Republic. Eventually, three technological processes were selected
for further consideration.
The first method originated from a factory which produces compacted kaolin clay pellets (cylinders
with a diameter of 12mm) by means of a roller compaction machine. A number of tests were
conducted concerning the manufacture of the bentonite pellets, the main aim of which was to
determine the conditions for the industrial compaction and production of the bentonite pellets with the
most suitable dry density value. The final dry density of the compacted pellets depends on the water
content of the material; B75_2013 bentonite had to be moistened prior to compaction. The relationship
of dry density and various water content levels is shown in Figure 7 (Šťástka, 2013). Subsequently,
material with a water content of around 16% was selected for further experimental testing. The pellets
selected from this producer, code-named B75 PEL_12, have a diameter of 12mm, a length of up to
4cm (Figure 8) and a dry density value of 1.80-1.85g/cm-3
.
The second compaction method was based on a small roller compaction machine which produced
bentonite pellets with a diameter of 8mm. This method, however, was not selected for further testing
due to the low level of bentonite compaction and the amount of time required for production.
The third method considered (employing a roller mill) was the result of consultation with a Czech
bentonite production company which was followed by laboratory testing. The pellets (fragments of
highly-compacted bentonite plate) produced employing this procedure are not available commercially

Deliverable n°D3.17 Version n°1.0 DOPAS 13/32
Dissemination level: PP
Date of issue of this report: 27/2/2014
but the machinery involved is in common use. Laboratory testing revealed a good level of compaction
(dry density 1.70-1.98g.cm-3
) with a relatively low water content value. The advantage of this
technology is the production of pellet fragments with various sizes. It allows mixing in various
proportions in order to achieve the best dry density value following emplacement. The resulting
material was code-named B75_REC (Figure 9). A comparison of the dry density and water content of
selected B75_PEL_12 and B75_REC pellets is provided in Figure 10.
Figure 7 – Range of water content and dry density values of compacted bentonite produced by the roller
machine – the red dots show B75_PEL_12 selected for further development
Figure 8 – Compacted bentonite pellets B75_PEL_12 from the roller compaction machine (Šťástka, 2013)
Figure 9 – Compacted bentonite B75_REC

Deliverable n°D3.17 Version n°1.0 DOPAS 14/32
Dissemination level: PP
Date of issue of this report: 27/2/2014
Figure 10 – Comparison of the dry density and water content values of selected materials B75_PEL_12 (red
dots) and B75_REC (black dots).
4.1.3.2 Pellet emplacement
Tests for the verification of dry density following pellet emplacement on mixtures based mainly on
B75_REC are ongoing. One of the samples was mixed according to the Fuller grain size distribution
(here without fine particles below 0.5mm, max. grain diameter 15mm) – code-named B75_REC_F.
Particle size distribution of pellets made from B75_2013 follows in Figure 11.
Figure 11 – Particle size distribution of pellets from B75_2013
Three types of technology are being tested for the emplacement of the selected materials
(B75_REC; B75_REC_F; B75_PEL_12): free fall pouring, free fall pouring with vibration and
spraying using a concrete spray machine. Initial results revealed the impact of compaction and the
technology used on the dry density of the tested materials (Tab. 3).
A combination of in-situ plate compaction and spraying is anticipated; therefore plate compaction
tests will have to be conducted.

Deliverable n°D3.17 Version n°1.0 DOPAS 15/32
Dissemination level: PP
Date of issue of this report: 27/2/2014
Tab. 3 - Dry density results [g/cm3] following initial tests concerning compaction
Material/Technology Free fall
pouring
Pouring with
vibration
Spraying Compaction
plate
B75_REC 1.11 1.20 1.32 Not yet tested
B75_REC_F 1.39 1.55 Not yet tested Not yet tested
B75_PEL_12 0.98 1.12 No tests planned No tests planned
It is clear from Tab. 3 that B75_REC F is very close to the required limit for emplaced dry density -
1.4g.cm-3
- using the free pouring method. Vibration during emplacement increases dry density up to a
value of 1.55g.cm-3
. It is expected that spraying and/or plate compaction will also increase the value of
dry density in the case of both the free fall pouring and/or vibration methods. The results were
considered particularly satisfactory and it was concluded that the use of the B75_REC F mixture for
EPSP purposes should ensure a sufficient level of dry density within the bentonite seal.
The above parameters are comparable to the results obtained at other institutions. Figure 12 shows
the experience obtained to date in the emplacement of bentonite pellets by, particularly, SKB and
Posiva (Dixon et. al., 2011).

Deliverable n°D3.17 Version n°1.0 DOPAS 16/32
Dissemination level: PP
Date of issue of this report: 27/2/2014
Figure 12 – Experience of pellet emplacement (Dixon et. al., 2011)

Deliverable n°D3.17 Version n°1.0 DOPAS 17/32
Dissemination level: PP
Date of issue of this report: 27/2/2014
4.1.4 Conclusion of CTU work
It can be assumed that B75_2013 bentonite fulfils the requirements set out in D2.1 Design Bases
and Criteria (see Chapter 2; Deliverable D2.1, White et. al., 2013):
the required swelling pressure of 2MPa is achieved when the material is compacted to a dry
density of 1.4g/cm-3
and more,
hydraulic conductivity of 10-12
m/s-1
is achieved when the material is compacted to a dry
density slightly below 1.3g/cm-3
and more,
The selected mixture of bentonite pellets (B75_REC_F) provides a dry density level very
close to the required density of 1.4g/cm-3
following free fall pouring (1.39g/cm-3
) and a
noticeably higher dry density level in excess of the required density limit following pouring
with vibration (1.55g/cm-3
). Furthermore, it is expected that spraying and plate compaction
will also increase dry density values to above the limit.
Thus it can be concluded that the above geotechnical results promise sufficient dry density levels
and, therefore, the required geotechnical behaviour of the bentonite seal in the EPSP experiment.

Deliverable n°D3.17 Version n°1.0 DOPAS 18/32
Dissemination level: PP
Date of issue of this report: 27/2/2014
4.2 Work performed by ÚJV Řež, a. s.
4.2.1 Laboratory tests on bentonite
The material used for the construction of the plugs and the laboratory physical models as well as
for further testing will consist of commercially produced Bentonit 75 (B75) supplied by KERAMOST,
Plc., Czech Republic. This product follows on from the materials studied in previous research focused
on barrier materials for deep waste repositories, the parameters of which are described in a report (in
Czech only) entitled: “Shrnutí informací o vlivu chemického složení bentonitu Rokle na chemické a
fyzikální vlastnosti” - Summary information on the effect of the chemical composition of Rokle
bentonites on chemical and physical properties.
The B75 material is currently undergoing laboratory testing. Experiments aimed at the study of
chemical and mineralogical composition, leachate analysis, the determination of ion-exchange
capacity etc. are underway or planned for the near future. Data obtained to date forms part of the
Czech report. Physical properties will be subjected to detailed testing, in particular: porosity at a
defined compaction level and permeability to water and gases of a sprayed/compacted sample
prepared from pellets and powdered bentonite. The preparation of these samples is planned for early
2014. The samples currently being tested were prepared from powdered bentonite B75 which is used
to verify the measuring methods and used devices.
The results of an internal report concerning those bentonites to be used in the plug can be
summarised as follows: the literature survey revealed that minor differences exist between two local
sources of bentonite in the Czech Republic, i.e. the Doupovské hory volcanic region (main deposit
Rokle) and the České středohoří volcanic region (main deposit Braňany-Černý vrch). The differences
can be found especially during visual inspection of the raw bentonite samples, but minor differences
can be found in chemical composition (especially in the total amount of sodium, potassium and
calcium). Nevertheless, the mineralogical composition and crystal chemistry of the bentonites from
these two sources as well as the amount of montmorillonite present are very similar, as reported by
Franče, 1992. In the present time, the factory-produced bentonite Bentonit 75 (B75) is slightly
different from previously studied bentonites coming from the Rokle deposit (raw samples and also
factory-produced B75), see Tab. 4 which shows a comparison of the chemical analyses of bentonite
B75_2010 produced in 2010 (used in previous projects) and bentonite B75_2013 produced in 2013
and being used in this project. The testing of pellet production was performed on B75_2013 (by CEG).
Differences in the properties of the two materials (free swelling, ionic form, pH of the suspension)
could be the result of the processing technology or the different source of the raw bentonite (different
deposit or a different part of the same deposit). A comparison of the leachate pH of these two
materials in distilled water is provided in Tab. 5 which shows the suspension pH results for different
solid/liquid ratios after 28 days of exposure. The analyses of leachates of B75 in distilled water were
performed for bentonite samples from 2010 and 2013 with different solid/liquid ratios. As can be seen
in Tab. 6, the concentration of Na+ in B75_2013 leachates is significantly lower than in B75_2010.
The processing technology has been identified as the main factor affecting the properties of B75
produced in recent years. It was found that partial activation and/or contamination caused by the
presence of an activation reagent affect the composition of the water suspension or water leachate,
cation exchange capacity and bentonite pore water composition. The chemical composition of the
B75_2013 (the material chosen for the verification of selected parameters) sample was found to be
different from samples studied previously – especially in the amount of total sodium, calcium, iron
and carbon/carbonates (see Tab. 4).

Deliverable n°D3.17 Version n°1.0 DOPAS 19/32
Dissemination level: PP
Date of issue of this report: 27/2/2014
Tab. 4 - Chemical analyses of bentonite B75; comparison of materials produced in 2010 (B75_2010) and
2013 (B75_2013)
wt % B75_2010 B75_2013
SiO2 51.91 49.83
Al2O3 15.52 15.35
TiO2 2.28 2.82
Fe2O3 8.89 10.9
FeO 2.95 3.74
MnO 0.11 0.09
MgO 2.22 2.88
CaO 4.60 2.01
Na2O 1.21 0.67
K2O 1.27 1.05
P2O5 0.40 0.63
CO2 5.15 3.66
Tab. 5 – pH values of the B75 leachate; comparison of materials produced in 2010 (B75_2010) and 2013
(B75_2013) at different solid/liquid (s/l) ratios, contact time: 28 days
s/l ratio B75_2010 B75_2013
18.6g/l 9.65 9.52
125g/l 9.34 9.22
Tab. 6 – Chemical analyses of B75 leachates - concentrations of major cations. Comparison of materials
produced in 2010 (B75_2010) and 2013 (B75_2013) at different solid/liquid (s/l) ratios
s/l ratio 18.6g/l 27.9g/l 37.2g/l 62.5 g/l 100g/l 125g/l
c (mg/l)
B75_2010
Na+ 93 96 132 190 255 260
K+ 5.6 7.0 7.9 10.8 11.6 11.6
Mg2+
0.54 0.88 1.10 1.70 2.20 2.90
Ca2+
1.91 1.94 2.07 2.19 2.06 2.77
B75_2013
Na+ 57.9 80.1 85 81.7 123.7 123.5
K+ 8.7 9.3 9.1 8.0 12.4 12.6
Mg2+
3.7 2.5 2.4 3.3 4.1 3.6
Ca2+
1.8 2.1 2.5 2.9 3.4 2.7
Deliverable n°D3.17 Version n°1.0 DOPAS 20/32
Dissemination level: PP
Date of issue of this report: 27/2/2014
Water permeability tests
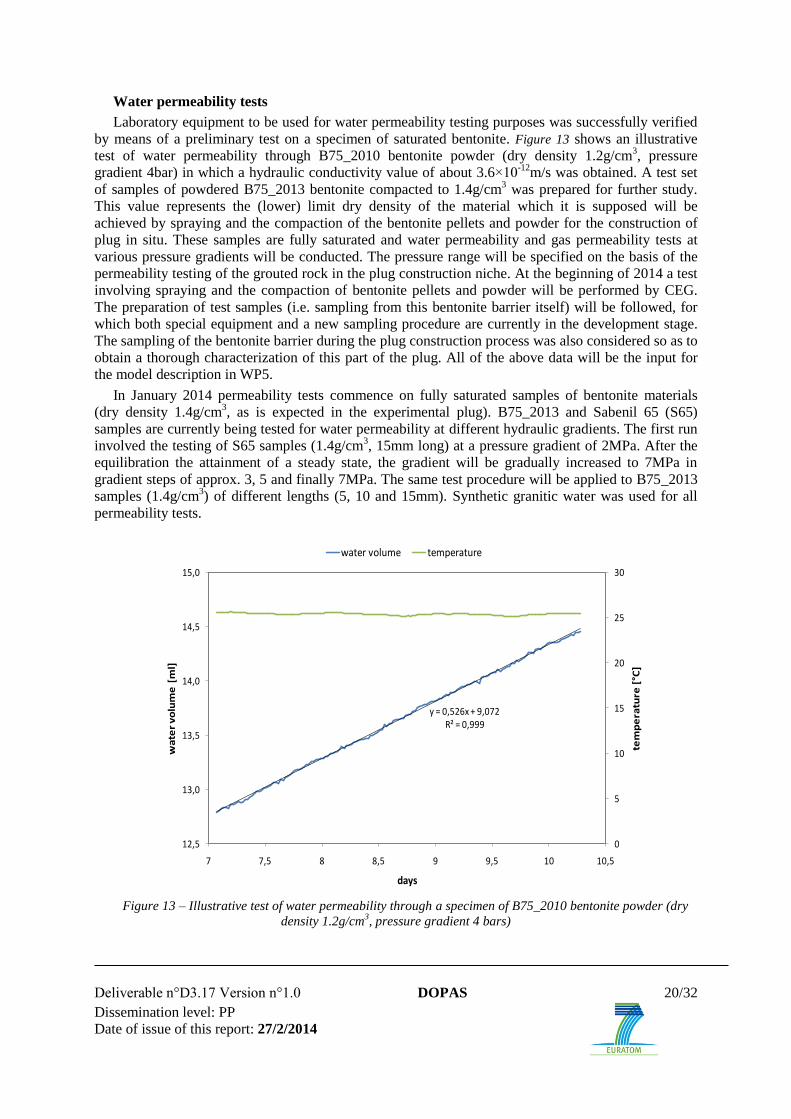
Laboratory equipment to be used for water permeability testing purposes was successfully verified
by means of a preliminary test on a specimen of saturated bentonite. Figure 13 shows an illustrative
test of water permeability through B75_2010 bentonite powder (dry density 1.2g/cm3, pressure
gradient 4bar) in which a hydraulic conductivity value of about 3.6×10⁻¹²
m/s was obtained. A test set
of samples of powdered B75_2013 bentonite compacted to 1.4g/cm3 was prepared for further study.
This value represents the (lower) limit dry density of the material which it is supposed will be
achieved by spraying and the compaction of the bentonite pellets and powder for the construction of
plug in situ. These samples are fully saturated and water permeability and gas permeability tests at
various pressure gradients will be conducted. The pressure range will be specified on the basis of the
permeability testing of the grouted rock in the plug construction niche. At the beginning of 2014 a test
involving spraying and the compaction of bentonite pellets and powder will be performed by CEG.
The preparation of test samples (i.e. sampling from this bentonite barrier itself) will be followed, for
which both special equipment and a new sampling procedure are currently in the development stage.
The sampling of the bentonite barrier during the plug construction process was also considered so as to
obtain a thorough characterization of this part of the plug. All of the above data will be the input for
the model description in WP5.
In January 2014 permeability tests commence on fully saturated samples of bentonite materials
(dry density 1.4g/cm3, as is expected in the experimental plug). B75_2013 and Sabenil 65 (S65)
samples are currently being tested for water permeability at different hydraulic gradients. The first run
involved the testing of S65 samples (1.4g/cm3, 15mm long) at a pressure gradient of 2MPa. After the
equilibration the attainment of a steady state, the gradient will be gradually increased to 7MPa in
gradient steps of approx. 3, 5 and finally 7MPa. The same test procedure will be applied to B75_2013
samples (1.4g/cm3) of different lengths (5, 10 and 15mm). Synthetic granitic water was used for all
permeability tests.
Figure 13 – Illustrative test of water permeability through a specimen of B75_2010 bentonite powder (dry
density 1.2g/cm3, pressure gradient 4 bars)
y = 0,526x + 9,072R² = 0,999
0
5
10
15
20
25
30
12,5
13,0
13,5
14,0
14,5
15,0
7 7,5 8 8,5 9 9,5 10 10,5
tem
pe
ratu
re [°C
]
wa
ter
vo
lum
e[m
l]
days
water volume temperature

Deliverable n°D3.17 Version n°1.0 DOPAS 21/32
Dissemination level: PP
Date of issue of this report: 27/2/2014
4.2.2 Laboratory tests on grouting materials
Before the construction of the plug the surrounding rock must be grouted in order to obtain low
permeability of the rock mass. Interactions with alkaline solutions released from the concrete barrier
of the plug might lead to the degradation of the grouting and thus the mass of the grouted rock could
be affected. Due to delays caused by the sub-contractor tender process and complications involving
drilling and grouting, work began at the end of 2013. Therefore it has not been possible to date to
obtain a sample of injection materials directly used in the work in-situ. Consequently testing has been
restricted so far to simple interaction tests on general polyurethane based grouting materials. Injection
material samples have been tested in two forms: hard compact and foam (see Figure 14). The samples
were immersed in solutions of additionally alkalised SGW (pH up to 13) and monitored over the long
term. It was found that the interaction of both forms of material with alkaline solutions is minimal and
has no visible effect on the nature and structure of the grouting.
Figure 14 – Samples of polyurethane based grouting materials
4.2.3 Laboratory tests on concrete/ cement
One of the important quantities of the concrete materials used in the construction of the plug
consists of the pH value of the extract/leachate. The requirement is that the concrete mixture should be
"low-pH concrete", which generally means extract pH values of ~ 11.5 or less. The recommended
procedure for the pH determination of low-pH leachates from concretes is described in the SKB R-12-
02 report: Development of an accurate pH measurement methodology for the pore fluids of low pH
cementitious materials (Alonso et. al., 2012). The ÚJV’s previous experience with the preparation of
low pH leachate cement mixtures and the experience of a commercial producer of concrete mixtures
for building purposes were used in determining the first proposal for the concrete mix composition for
the construction of the concrete parts of the experimental plug. The cement mixture formerly
developed by ÚJV achieved a pH level of < 11 in the leachate. In comparison, the pH of selected
commercially produced materials was pH ~ 12 (see Tab. 7). Although the mixtures developed by ÚJV
exhibit low pH leachate, due to their low compressive strength they are unsuitable for practical use in
construction projects. All cement/ concrete pH testing are performed by using distilled water.
A reduction in the pH of the leachate of the cement mixture can be obtained by the partial
replacement of the cement by another type of binder; it can also be modified by increasing the ratio of
fine SiO2 (microsilica/silica fume) to the cement content. A study of leachate pH changes for cement

Deliverable n°D3.17 Version n°1.0 DOPAS 22/32
Dissemination level: PP
Date of issue of this report: 27/2/2014
mixtures with the partial replacement of cement by metakaolin has been prepared in cooperation with
CEG.
Measured pH extract results for mixtures tested with the partial substitution of cement by
metakaolin (various ratios) are presented in Tab. 8 and Tab. 9. A comparison of these results with the
pH values of a cement paste leachate (pH approx. 13) clearly confirms that the addition of metakaolin
decreases leachate pH values. It can be seen that the replacement of cement by metakaolin
significantly reduces the pH of the extracts after just 1 month of cement mixture ageing. Other
additional samples will be tested over a longer period of time. However, the negative influence of the
addition of metakaolin into the cement mixture may cause a decrease in strength; this parameter has
not yet been tested, but the behaviour of samples used in their preparation of powder form for analysis
of pH would seem to indicate that a decrease in compressive strength can be expected. Experiments
confirming the time-dependent behaviour of the leachate pH of a cement mixture with SiO2 are
ongoing. According to information available on the practical experience (Poyet et. al., 2013) presented
at a recent project meeting pH values decrease after a longer time period. With regard to generally
used ageing period of 28 days, this time is not sufficient for the full development of the chemistry of
the mixture. Decrease in pH can be expected within a period of approximately 6 weeks or longer.
Confirmation experiments have commenced involving materials from the Czech Republic. The
experimental results shown in Tab. 11 and Tab. 12 indicate that a decrease in pH value is time-
dependent. The experiments are ongoing and future developments in terms of leachate pH values will
be closely monitored over time. The results confirm the findings by Poyet et. al. (2013) of and can be
applied to the materials of local origin used in this project.
Tab. 7 - Comparison of the pH leachate values of various types of cement and concrete mixes. Mixture T-22,
T-23 and P-1 were developed by ÚJV, mixtures S-1 and S-2 (repetition of S-K-1 and S-K-2) are samples of
selected commercially produced concretes
sample pH - suspension average pH pH - filtrate average pH
10.94 10.78
10.88 10.80
10.89 10.79
10.83 10.75
10.80 10.76
10.79 10.76
11.91 11.94
11.93 11.96
11.89 11.96
11.93 11.94
11.95 11.95
11.98 11.93
11.85 11.73
11.85 11.77
11.84 11.79
11.99 11.89
11.97 11.96
11.97 11.99
10.98 10.85
10.96 10.77
10.96 10.75
11.9 12.0
12.0 11.9
S-K-2
11.0 10.8
11.8 11.8
12.0 11.9
10.8 10.8
P-1
T-23
T-22 10.9 10.8
S-1
S-2
S-K-1

Deliverable n°D3.17 Version n°1.0 DOPAS 23/32
Dissemination level: PP
Date of issue of this report: 27/2/2014
Tab. 8 - Leachate pH values for a paste with the partial replacement of cement with metakaolin; ratio of
cement /metakaolin/water = 170/30/100
Tab. 9 - Leachate pH values for a paste with the partial replacement of cement with metakaolin; ratio of
cement /metakaolin/water = 150/50/100
mixture
CEM II/A-S 42,5R (g) 170
metakaolin (g) 30
water (ml) 100
after 1 week
sample sample (g) water (ml)
15 15 13.14 13.09
15 15 13.09 13.12
15 15 13.11 13.12
after 1 month
sample sample (g) water (ml)
10 10 12.57 12.54
10 10 12.56 12.59
10 10 12.56 12.58
170-30 12.6 12.6
pH suspension pH filtrate
pH suspension pH filtrate
13.1170-30 13.1
mixture
CEM II/A-S 42,5R (g) 150
metakaolin (g) 50
water (ml) 100
after 1 week
sample sample (g) water (ml)
15 15 13.05 13.08
15 15 13.01 13.05
15 15 12.98 13.06
after 1 month
sample sample (g) water (ml)
10 10 12.42 12.24
10 10 12.38 12.25
10 10 12.44 12.30
150-50 12.4 12.3
pH suspension pH filtrate
pH suspension pH filtrate
150-50 13.0 13.1

Deliverable n°D3.17 Version n°1.0 DOPAS 24/32
Dissemination level: PP
Date of issue of this report: 27/2/2014
Tab. 10 - Leachate pH values for a paste with the partial replacement of cement with metakaolin; ratio of
cement /metakaolin/water = 100/100/100
Tab. 11 - Leachate pH values for paste cement + SiO2; ratio of cement/ SiO2/water = 100/100/200
mixture
CEM II/A-S 42,5R (g) 100
metakaolin (g) 100
water (ml) 100
after 1 week
sample sample (g) water (ml)
15 15 12.93 12.89
15 15 12.92 12.91
15 15 12.88 12.88
after 1 month
sample sample (g) water (ml)
10 10 12.18 11.94
10 10 12.16 11.97
10 10 12.14 11.90
100-100 12.2 11.9
pH suspension pH filtrate
pH suspension pH filtrate
100-100 12.9 12.9
mixture
CEM II/A-S 42,5R (g) 100
SiO2 (g) 100
water (ml) 200
after 2 weeks
sample sample (g) water (ml)
10 10 11.99 11.96
10 10 11.98 11.95
10 10 12.01 11.96
after 3 weeks
sample sample (g) water (ml)
10 10 11.98 11.88
10 10 11.97 11.87
10 10 11.98 11.89
after 5 weeks
sample sample (g) water (ml)
10 10 11.56 11.31
10 10 11.50 11.33
10 10 11.50 11.30
after 7 weeks
sample sample (g) water (ml)
10 10 11.73 11.66
10 10 11.70 11.60
10 10 11.69 11.62
100-100-200 11.5 11.3
pH suspension pH filtrate
100-100-200 12.0 12.0
pH suspension pH filtrate
100-100-200 12.0 11.9
pH suspension pH filtrate
pH suspension pH filtrate
100-100-200 11.7 11.6

Deliverable n°D3.17 Version n°1.0 DOPAS 25/32
Dissemination level: PP
Date of issue of this report: 27/2/2014
Tab. 12 - Leachate pH values for paste cement + SiO2; ratio of cement/ SiO2/water = 100/100/250
4.2.4 Laboratory tests on the host rock
At the end of 2013 a drilled core sample of the host rock was taken from the niche in which the
experimental plug will be constructed. This sample (see figure below), approximately 30 cm long and
6.12 cm in diameter derive from the new drilled borehole V2 which connects the experimental and
technical niches of the EPSP project.
Figure 15 - Host rock sample; drilled core from borehole V2
mixture
CEM II/A-S 42,5R (g) 100
SiO2 (g) 100
water (ml) 250
after 2 weeks
sample sample (g) water (ml)
10 10 11.94 11.92
10 10 11.93 11.91
10 10 1196 11.91
after 3 weeks
sample sample (g) water (ml)
10 10 11.89 11.80
10 10 11.90 11.80
10 10 11.90 11.81
after 5 weeks
sample sample (g) water (ml)
10 10 11.50 11.34
10 10 11.49 11.37
7 7 11.50 11.35
after 7 weeks
sample sample (g) water (ml)
10 10 11.52 11.52
10 10 11.53 11.52
10 10 11.40 11.51
100-100-250 11.5 11.4
pH suspension pH filtrate
100-100-250 11.9 11.9
pH suspension pH filtrate
100-100-250 11.9 11.8
pH suspension pH filtrate
pH suspension pH filtrate
100-100-250 11.5 11.5

Deliverable n°D3.17 Version n°1.0 DOPAS 26/32
Dissemination level: PP
Date of issue of this report: 27/2/2014
The drilled core part was sawn into smaller samples to be used for the determination of porosity
using the water submersion method (Melnyk and Skeet, 1986). Rock samples were dried and their
weights were recorded in first step of this method. Currently the rock samples are undergoing
saturation process by SGW. Following full saturation, the saturated weights will be recorded and
sample porosity calculated. For permeability measurement purposes this type of drilled core has to be
reduced in diameter to approx. 5cm so as to fit into the experimental permeability cell or alternatively,
new samples must be drilled of the appropriate diameter.
4.2.5 Physical models
Since the simulation of unsaturated swelling materials is somewhat complicated and the EPSP
underground laboratory experiment will not be dismantled during the course of the project, the
construction of physical models of plugs at the laboratory scale was proposed in the laboratory work
plan. The aim of these experiments is to gain data for the subsequent calibration of numerical models
of the saturation of the bentonite material. In all experiments synthetic granitic water is used.
The physical model will consist of a stainless steel chamber of cylindrical shape with approximate
dimensions 0.5m in length and 0.1m in diameter and will be equipped with sensors to record the
distribution of water content within the bentonite material. Bentonite with an estimated bulk density of
from 1.4g/cm3 to 1.6g/cm
3 (the same bulk density as assumed in the EPSP experiment) will be pressed
into the test chamber and gradually saturated with water under pressure. The level of water pressure
will be determined by the field testing of the permeability of the grouted rock at the Josef
Underground Laboratory. A maximum pressure of 7MPa is assumed. A sample of the bentonite
material will be dismantled following the conclusion of the experiment and divided into layers with an
estimated thickness of 1cm. The water content in each layer will then be determined. It is assumed that
the duration of the experiment will be around 1 year.
Installation of physical models chambers with facilities to observe the progress of water content
within the sample was dealt with in time prior to construction of EPSP (2013). Sensors for the
measurement of pore water pressure and the drainage needles were tested in a small-scale chamber
(Figure 16, detail in Figure 17). Samples of bentonite B75 with bulk densities of 1.2g/cm3 and
1.6g/cm3 were pressed into small-scale chambers with internal dimensions of 3cm in diameter and
3cm in height and saturated with water under pressure of 4 bar in the case of the sample with a bulk
density of 1.2g/cm3 and 20 bar in the case of the sample of bulk density 1.6g/cm
3. The volume of the
infiltrating water was measured using a volume meter and the volume of water flowing out of the
chamber was monitored using a syringe and drainage needles. The results of the testing of the
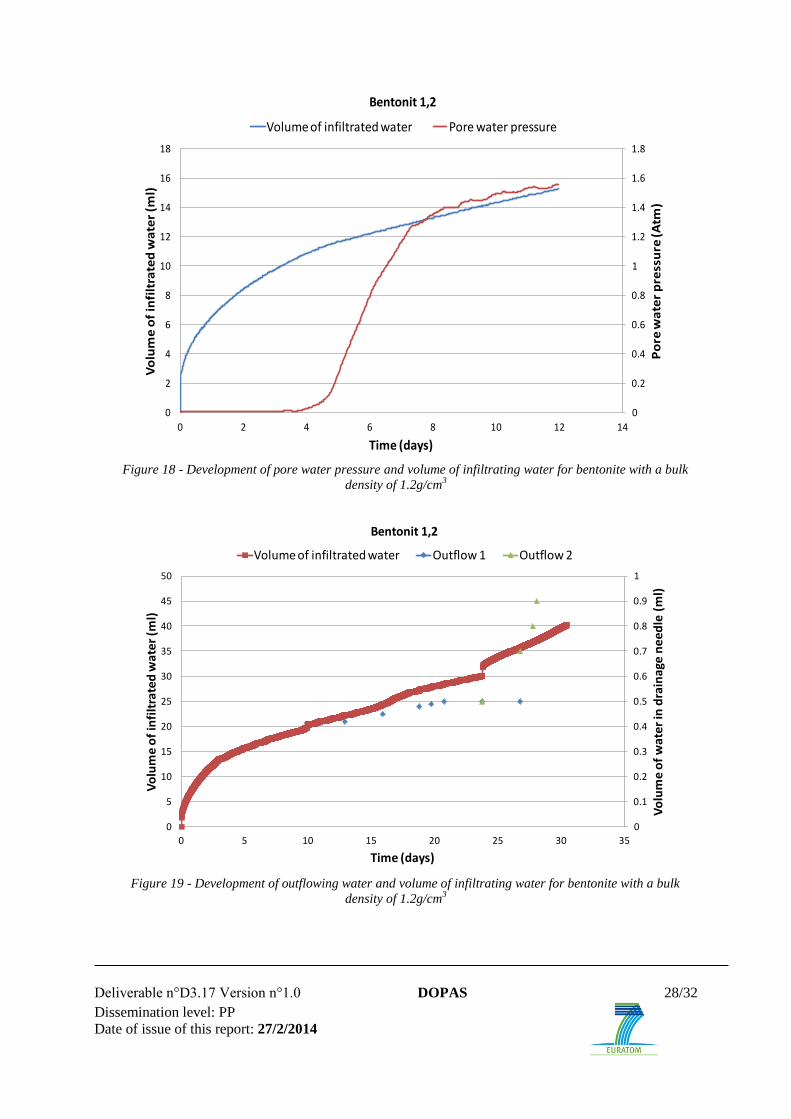
measuring equipment are shown in Figure 18 - Figure 20.

Deliverable n°D3.17 Version n°1.0 DOPAS 27/32
Dissemination level: PP
Date of issue of this report: 27/2/2014
Figure 16 - Small-scale chamber for monitoring the saturation of bentonite
Figure 17 – Detail of drainage needles and sensors for the measurement of pore water pressure
Deliverable n°D3.17 Version n°1.0 DOPAS 28/32
Dissemination level: PP
Date of issue of this report: 27/2/2014
Figure 18 - Development of pore water pressure and volume of infiltrating water for bentonite with a bulk
density of 1.2g/cm3
Figure 19 - Development of outflowing water and volume of infiltrating water for bentonite with a bulk
density of 1.2g/cm3
0
0.2
0.4
0.6
0.8
1
1.2
1.4
1.6
1.8
0
2
4
6
8
10
12
14
16
18
0 2 4 6 8 10 12 14
Po
re w
ate
r p
ress
ure
(Atm
)
Vo
lum
e o
f in
filt
rate
d w
ate
r (m
l)
Time (days)
Bentonit 1,2
Volume of infiltrated water Pore water pressure
0
0.1
0.2
0.3
0.4
0.5
0.6
0.7
0.8
0.9
1
0
5
10
15
20
25
30
35
40
45
50
0 5 10 15 20 25 30 35
Vo
lum
e o
f w
ate
r in
dra
ina
ge n
ee
dle
(m
l)
Vo
lum
e o
f in
filt
rate
d w
ate
r (m
l)
Time (days)
Bentonit 1,2
Volume of infiltrated water Outflow 1 Outflow 2

Deliverable n°D3.17 Version n°1.0 DOPAS 29/32
Dissemination level: PP
Date of issue of this report: 27/2/2014
Figure 20 - Development of pore water pressure, outflowing water and volume of infiltrating water for
bentonite with a bulk density of 1.6g/cm3
Figure 20 shows that discharge from the drainage needle occurs when pore water pressure increases
to 0.3 bar; the drainage needle sensors for the measurement of pore water pressure are located at the
same distance from the beginning of the sample and adjacent within the sample. According to the
theory of continuum mechanics, the outflow of water from the porous medium occurs when the
material achieves the saturated state which corresponds to the disappearance of negative pore water
pressure. The difference of 0.3 bar can be attributed to the resistance applied by the syringe of the
drainage needle.
With regard to the samples of bentonite with a bulk density of 1.2g/cm3, the sensors for the
measurement of pore water pressure and the drainage needle were installed within the sample at
different times. The first stage consisted of saturation with the sensor (Figure 18), the second with the
drainage needle (Figure 19). Despite efforts to prepare the sample in both experiments under the same
conditions it is clear that the results are not comparable. In addition, with concern to tests with the
drainage needles, the bentonite was leached at the end of the saturation process through the drainage
needle. Therefore, it was decided to modify the drainage needles once a porous plate with a high AEV
(air entry value) had been pressed on top of the needle (on contact with the sample). There is a
significantly higher volume of infiltrated water in the case of the installation chamber with a drainage
needle than in the installation chamber with sensors for the measurement of pore water pressure. It is
possible that the drainage needle presents a preferential path within the sample that may interfere with
flow inside the material.
Experiments with the bulk density of 1.4g/cm3 samples will be carried out before the final
installation of the chamber for the physical models; the small-scale chamber will be equipped with
drainage needles simultaneously with that of the sensor for the measurement of pore water pressure.
The resistance of the drainage of the syringe needle has been verified. Further attention will be paid to
the characteristics of the porous plate so as not to influence the processes at work within the bentonite
material.
0
1
2
3
4
5
6
7
8
0
5
10
15
20
25
30
35
40
0 10 20 30 40 50 60 70 80 90 100
Po
re w
ate
r p
ress
ure
(Atm
)
Vo
lum
e o
f in
filt
rate
d w
ate
r (m
l)
Time (days)
Bentonit 1,6
Volume of infiltrated water Pore water pressure Outflow 1 Outflow 2

Deliverable n°D3.17 Version n°1.0 DOPAS 30/32
Dissemination level: PP
Date of issue of this report: 27/2/2014
This experiment will be repeated with the chamber fitted with the sensor for the measurement of
pore water pressure only in order to show the effect of the drainage needle (preferential path) on the
water content inside the sample. If this effect proves to be significant, the drainage needle will be
fitted with closable valves during the saturation of the physical model so that the needle can be closed
upon the initial discharge of water from the drainage needle thus preventing the creation of a
preferential water flow path from the sample. In the case of the installation of drainage needles with
closable valves, a comparative experiment will be conducted with these needles but without the
sensors for the measurement of pore water pressure. The physical model chamber will be equipped
with several sensors for the measurement of pore water pressure and probably with a number of
drainage needles. Early in the 2014 the needles and the sensors will be made in sufficient quantities so
as to obtain data for the calibration of numerical models of bentonite saturation. The sensors and the
drainage needles will be thoroughly tested on at least one sample in the small-scale chamber before
being installed in the physical model chambers.
Interaction models
Physical models for the study of the interaction of materials of experimental plug have already
been designed and experimentation will commence in 2014. Exactly the same materials as those in
the experimental plug will be used. SGW will be used as a liquid phase for saturation and interaction
processes. Final material for the concrete part of the plug will be decided according to the results of
the tender for the relevant sub-contractor. Currently, the determination of the design of the
experimental cells for the physical models is ongoing.
4.2.6 Conclusion of ÚJV work
The analyses of the chemical composition, the measurement of pH in suspensions of bentonite and
distilled water at different ratios and the analysis of leachates (cation concentrations) have all been
conducted for B75_2013 bentonite. The analyses of anion concentrations in the leachates and the
determination of cation exchange capacities (CEC) are currently under way. X-ray diffraction pattern
determination and mineralogical analysis will be conducted on the B75_2013 material in 2014.
Existing available results on the properties of B75_2013 revealed, when compared with previous
data on B75 materials, a number of small property changes (chemical composition, leachate
properties) occurred within the material during the production process. Nevertheless, it can be
assumed that the main characteristics of B75 bentonite remained constant and fulfil all the
expectations, limits and requirements for the construction of the experimental plug.
It was found that common polyurethane based grouting materials are not influenced by alkaline
solutions and should not be affected by cement leachates in the grouting of the experimental plug.
With regard to cement/concrete materials, ÚJV testing has focused primarily on the measurement
of pH. It has been verified that increasing the SiO2 content in the mixture (ratio cement/SiO2 = 1/1)
leads to a decrease in the pH value of the leachate into distilled water (according to procedure based
on Alonso et al. (2012)) to pH ~ 11.5. The pH value of the leachate of the concrete used in the
construction of the experimental plug will be verified in laboratory tests conducted during the
construction of the experimental plug.
Host rock property tests (porosity, permeability tests conducted in the laboratory) have commenced
with the full saturation of rock samples in preparation for porosity determination and further testing.
The measurement equipment for the laboratory physical models has been tested and verified and
the final set-up of the equipment will be decided at the beginning of 2014. Subsequently, laboratory
tests on these physical models will begin using the same materials as those which will be applied in
the construction of the experimental plug in-situ.
Deliverable n°D3.17 Version n°1.0 DOPAS 31/32
Dissemination level: PP
Date of issue of this report: 27/2/2014
5 LITERATURE
Alonso M. C., García Calvo J. L., Walker C., Naito M., Pettersson S., Puigdomenech I., Cuñado M.
A., Vuorio M. Weber H., Ueda H., Fujisaki K.: SKB report R-12-02. Development of an accurate
pH measurement methodology for the pore fluids of low pH cementitious materials (2012).
Červinka R., Hanuláková D. (2013): Laboratorní výzkum tlumících, výplňových a konstrukčních
materiálu. Geochemické modelování bentonitová pórová voda. Zpráva ÚJV Rež, a. s., 14269,
Kveten 2013, 111 str. in Czech
Červinka R., Vejsadů J., Vokál A. (2012): Uncertainties in the pore water chemistry of compacted
bentonite from the Rokle deposit, Clays in natural and engineered barriers for radioactive waste
confinement, 5th International Meeting, 21.-25.10.2012, Montpellier, France, P/GC/T/6, p. 467-
468.
Dixon, D., Sandén, T., Jonsson, E., Hansen, J., SKB report P-11-44: Backfilling of deposition tunnels:
Use of bentonite pellets, February 2011
Havlová V., Holeček J., Vejsada J., Večerník P., Červinka R. (2010): Metodika přípravy syntetické
podzemní vody pro laboratorní experimentální práce. Technická zpráva projektu FR-TI1/367,
únor 2010, 11 str., in Czech
Melnyk T.W., Skeet A.M.M. (1986). An improved technique for the determination of rock porosity.
Can. J. Earth Sc. Vol 23, pp 1068-1074.
Poyet S., Le Bescop P., Touzé G., Moth J. (2013). Low pH concrete formulation development &
emplacement tests; CEA-LECBA; DOPAS WP3 meeting Saint-Dizier, 9 October 2013; available
on DOPAS Projectplace as: “DOPAS WP3 - FSS experiment - Meeting N°3 - Low pH concrete
formulation process.ppt”
Šťástka, J., The Development of Bentonite Gap Filling for High-Level Waste Disposal. In:
Proceedings. Ljubljana: Nuclear Society of Slovenia, p. 908.1-908.8. ISBN 978-961-6207-36-2.
2013Franče J. Bentonity ve východní části Doupovských hor. Sborník geologických věd,
Ložisková geologie a mineralogie 30, 43-90. 1992.
Vašíček R., Svoboda, J., Trpkošová, D., Večerník, P., Dvořáková, M. Deliverable 3.16 Testing plan
for EPSP laboratory experiment, DOPAS project FP7 EURATOM, no. 323273; Czech Technical
University in Prague, May 2013, on-line: http://www.posiva.fi/files/3207/
DOPAS_D3_16_testingplanEPSPlab_20052013.pdf
White, M., Doudou S., Neall, F., Deliverable D2.1 Design Bases and Criteria, DOPAS project FP7
EURATOM, no. 323273; Galson Sciences Limited, version 1d4 from 26 November 2013
Deliverable n°D3.17 Version n°1.0 DOPAS 32/32
Dissemination level: PP
Date of issue of this report: 27/2/2014
6 LIST OF ABBREVIATIONS
AEV – Air Entry Value
B75 – Czech Ca-Mg bentonite, trade name “Bentonit 75”, produced by KERAMOST, Plc.,
not activated
B75_2010 – B75 delivered in 2010 (tested in 2010-2013)
B75_2013 – B75 delivered in 2013, used in DOPAS – EPSP
B75_PEL_12 – Pellets made from B75 2013 bentonite, diameter 12mm, made by commercial roller
compaction technology for kaolin pellet production
B75_REC – Pellets (crushed highly-compacted material) made from B75 2013 bentonite, non-
commercial product
B75_REC_F – A mixture of several B75 REC fractions according to Fuller‘s curve (of optimal grain
size distribution), here without fine particles below 0.5mm
CEC – Cation Exchange Capacity
CEG – Centre of Experimental Geotechnics, Faculty of Civil Engineering, Czech Technical
University in Prague
EPSP – Experimental Pressure and Sealing Plug
SAB65, S65 – Czech bentonite, trade name “Sabenil 65”, produced by KERAMOST, Plc., activated
SGW – Synthetic Granitic Water
ÚJV – ÚJV Řež, a. s.