donor reliance on accounting and its consequences for the charitable distribution channel€¦ ·...
TRANSCRIPT
Donor Reliance on Accounting and its
Consequences for the Charitable Distribution Channel
Anil Arya
The Ohio State University
Brian Mittendorf
The Ohio State University
August 2015
Donor Reliance on Accounting and its
Consequences for the Charitable Distribution Channel
Abstract
The organization of charitable distribution channels to ensure donor contributions reach
beneficiaries in an efficient manner and the use of accounting metrics of such efficiency
(whether provided directly or by charity rating groups) are oft-discussed issues in the
nonprofit sector. The two issues are inextricably linked since reported efficiency measures
influence subsequent donor giving. This paper develops a parsimonious model of a charity
that must decide how best to employ its resources, either by acting as a direct service
provider or as a grant provider to organizations that provide services to beneficiaries. We
show that the desire to boost perceptions of efficiency vis-a-vis accounting reports leads an
organization to rely more on others to provide services rather than being a direct service
provider. This temptation to expand either the scope or length of the charity supply line is
muted by a desire to avoid redundant costs and improve service delivery. The model's
results have implications both for the role of nonprofit accounting and observed distribution
strategies of nonprofits.
1. Introduction
Charities and their donors exhibit a delicate symbiotic relationship: donors seek to
identify the most effective organizations to fund, while charities seek to maximize impact
while also convincing donors that their resources are in good hands. As often noted, the
charitable objectives of pleasing donors and maximizing impact may be at odds due to the
fact that donors cannot observe the ultimate impact of their donations but rather must
primarily rely on measures of financial propriety. These financial measures, in turn, may
not paint a complete picture of an organization's efforts. In particular, a primary means by
which donors evaluate charities is through reports on how much of the funds were directed
toward the mission, termed "program" spending. With the rise of evaluation groups such
as BBB Wise Giving Alliance, Charity Navigator, and Charity Watch, charities have noted
that the pressure to demonstrate high program spending is immense.1 Empirical evidence
confirms that this perception is not an illusion – giving to an organization in a given year is
notably sensitive to reported program spending from previous years (e.g., Tinkelman and
Mankaney 2007; Gordon et al. 2009).
Of course, if reported program expenses are a perfect reflection of an organization's
effectiveness, such pressure can help align priorities of benefactors and their recipient
organizations. Deviations can arise, however, when accounting measures fall short of a
perfect reflection of resource utilization. It is with this in mind that we consider a charity's
preferred strategy for distributing funds to meet its mission goals in light of donor pressure
to demonstrate financial efficiency. To elaborate, we consider a simple model of an
organization that solicits funds from donors and distributes those funds to achieve its
1 To be precise, the primary third-party charity evaluators rely on the functional classification ofexpenses included in Form 990 tax filings in assessing program spending. Though this reliance is ontax forms, it is worth noting that unlike with for-profit entities, accounting standards governingnonprofit tax filings largely mirror those established by the Financial Accounting Standards Board(FASB). As the calculation of functional classification of expenses for tax reports essentially followsFASB rules, this reliance by outsiders on tax forms reflects the uniform availability of tax filingsrather than any substantive difference between the two reporting methods.
2
charitable goals. The model incorporates three salient features: (i) an organization can
choose whether to be a direct service provider or a grant provider and, in the latter case,
how widely to spread its reach; (ii) if an organization passes funds to another as a grant, it
also passes some of the administrative burden of service provision; and (iii) all else equal,
donors tend to give more to organizations that demonstrate high spending levels on
programming.
With these three features in place, we consider how donor pressure to demonstrate
high program spending can influence an organization's choice of how (and how widely) to
distribute its spending. The analysis demonstrates that a charity faces two competing
priorities. On the one hand, to engage services most efficiently, a charity will focus its
efforts so as to avoid redundant administrative costs. After all, why engage an extensive
supply line, since doing so necessitates more employees, accountants, lawyers, etc. along
the way? In fact, we show that if donors do not care about reported accounting measures
or were able to perfectly assess mission impact, a charity's preferred structure is to be a
direct service provider and eliminate any "middle men" in the relationship.
On the other hand, to appear most efficient, a charity will want to spread its
resources along a complicated web of grantees. Though this adds cost redundancies, it
also shifts a portion of the administrative burden to other agencies, thus creating an
appearance that the charity is more efficient. This latter feature reflects a key practical
consideration with accounting measures: accounting for one organization's program
spending only reflects how that organization spends its funds, not how any recipients of
the organization's funds spend theirs. As a result, a donor's ability to "follow the paper
trail" is restricted to single links in the chain. At the extreme, where a charity cares only
about perceptions in order to boost donations and not on how best to employ the donations,
the preferred distribution approach is tantamount to "daisy chaining", the practice of setting
up a loop of organizations that cycle donations among them to create an outsized
appearance of impact.
3
Though the Financial Accounting Standards Board (FASB) has been aware of the
concern that passing along grants to other organizations may create an appearance of greater
efficiency that can encourage "form-over-substance" transactions (Financial Accounting
Standards Board 2012), the latest proposals from the FASB to reform nonprofit accounting
do not notably change either the functional classification of expenses or rules governing
treatment of pass-through transactions (Cohn 2015; Financial Accounting Standards Board
2015; Mittendorf 2015).
We demonstrate that the need to balance true efficiency and the appearance of
efficiency in order to boost donations gives rise to a charity's preferred distribution
method. The equilibrium distribution approach we identify reflects that the desire for short-
run impact favors more direct service provision, whereas the desire to boost short-term
perceptions, and thereby long-term donations and impact, favors a wider distribution
channel. Importantly, these offsetting pressures arise not because a charity has an inherent
desire to be large or appear large at the expense of its impact. Rather, it comes from a
desire to maximize impact, realizing that appeasing donors is part of that equation since
doing so helps the charity scale up.
A notable example of this tradeoff in practice is in the heavily scrutinized actions of
the Red Cross. The Red Cross insists on being a direct service provision organization in
order to meet acute needs rapidly. This choice comes despite the fact that it subjects the
organization to more criticism of its finances than would be observed if it simply provided
grants to others (see, e.g., Elliott et al. 2014). That said, the Red Cross has at times
succumbed to the temptation to add layers to the supply line in order to improve efficiency
measures, as has been reported about its recent efforts in Haiti. In that case, their heavy
use of grant provision to local organizations permitted the Red Cross to report a non-
program spending rate of only 9%, while also leading some familiar with circumstances on
the ground to accuse it of creating a "cycle of overhead" by taking their own administrative
4
cut and then "re-granting to another group which would take their cut" (Elliott and Sullivan
2015).
Consistent with the fundamental tradeoff we identify, comparative statics of the
primary analysis reveal that both long-term mission and greater donor pressure favor an
organization being a grant provider, providing grants across a larger spectrum of recipients.
Thus, it may not be empire building, boredom, or experimentation that lead to
organizations exhibiting outsized ambitions which leave their resources spread too thin but
rather pressure from donors and ultimately a realistic desire to have a long term impact.
To further investigate how donor demands can influence an organization's chosen
form of charity provision, we consider two extensions to the primary model. The first
extension incorporates the fact that different charitable endeavors may exhibit varying levels
of urgency – while acute public health needs necessitate quick impact, educational goals
may instead require a long view. When mission urgency is taken into account, we not only
show that the key results persist, but also demonstrate the comparative static that greater
urgency favors a more focused distribution strategy. This leads to a prediction that urgent
charitable matters such as disaster relief will exhibit a condensed supply line. Interestingly,
this prediction arises not because a long supply line takes time, but rather because an
organization focused on acute needs cares less about appearances to spur long-term
donations and more about eliminating bureaucratic waste.
The paper's second extension examines the possibility that an organization can alter
its approach over time. We show that the desire to influence donor perceptions leads
young organizations to spread their resources widely, whereas older organizations (less
reliant on the whims of donors) opt to focus their approach on how best to use resources.
This comparative static suggests that as organizations mature they will engage in more
direct service provision. This provides a more benign explanation for charities' tendency to
build their own facilities and rely less on providing grants to outside parties as they grow as
well as the same tendency often exhibited by organizations finding themselves less subject
5
to donor whims. Examples of the former include the Susan G. Komen Foundation and the
Clinton Foundation, each of which shifted toward direct programming as they matured; an
example of the latter is the shift from grant provision to service provision at the Livestrong
Foundation as scandal marked a compression of donations from the general public.
Broadly speaking, this study relates to two voluminous research streams, (i) the
design and formation of supply chains (e.g., Beamon 1998; Tsay 2013) and (ii) how
pressures to meet accounting targets can influence decision making (e.g., Healy and
Wahlen 1999; Healy and Palepu 2001). More specifically, however, this paper brings
these two considerations in play for nonprofit entities, an institutional circumstance with
organizations facing unique pressures (Berenguer 2014 and Berenguer et al. 2014). To
this end, the extant literature on supply chains of charitable organizations is much more
limited. Notable exceptions include Privett (2012); Kretschmer et al. (2014); and the
aforementioned Berenguer et al. (2014).
A distinguishing feature of our work is that it incorporates the role of accounting
performance reporting in influencing donor behavior and how this, in turn, alters
distribution and supply chain choices. Empirical evidence has consistently confirmed that
accounting performance measures and, in particular, measures of program spending do in
fact place pressures on charities due to the fact that donations (i.e., revenues) are sensitive
to their reporting (e.g., Tinkelman and Mankaney 2007; Gordon et al. 2009). There is also
notable empirical evidence that this pressure in turn leads nonprofits to engage in behavior
to manage reported program spending levels (e.g., Baber et al. 2001; Krishnan et al. 2006;
Keating et al. 2008; Tinkelman 2009). The present analysis considers how donor
pressures influence a charity's decision of how best to employ and distribute funds to meet
long-term objectives, and it does so presuming that decision-makers act not in self interest
but instead are focused entirely on the mission.2 Despite the mission focus, the pressures
2 Arya and Mittendorf (2015) consider how pressures from accounting performance measures can alsoinfluence effort and time allocation of nonprofit executives focused on maximizing their own career
6
placed by donors alone can alter decisions so as to balance short-run impact with long-term
fundraising potential.
The remainder of this paper proceeds as follows. Section 2 presents the basic
model of donor behavior and charitable distribution approaches. Section 3 identifies the
preferred distribution strategy and considers its implications: 3.1. derives equilibrium
giving behavior; 3.2. presents the equilibrium distribution strategy and its determinants;
3.3. considers the effect of mission urgency; and 3.4. examines the consequence of time-
varying distribution approaches. Finally, section 4 concludes.
2. Model
A charity is formed that intends to solicit donations from the general public and
make use of the funds to achieve its mission. The charity will operate over the course of T
periods, T ≥ 2 . The charity establishes a distribution strategy in order to direct resources
to the ultimate mission objective (beneficiary). The charity can establish itself as a direct
service provider or be a grant provider, making use of additional organizations to provide
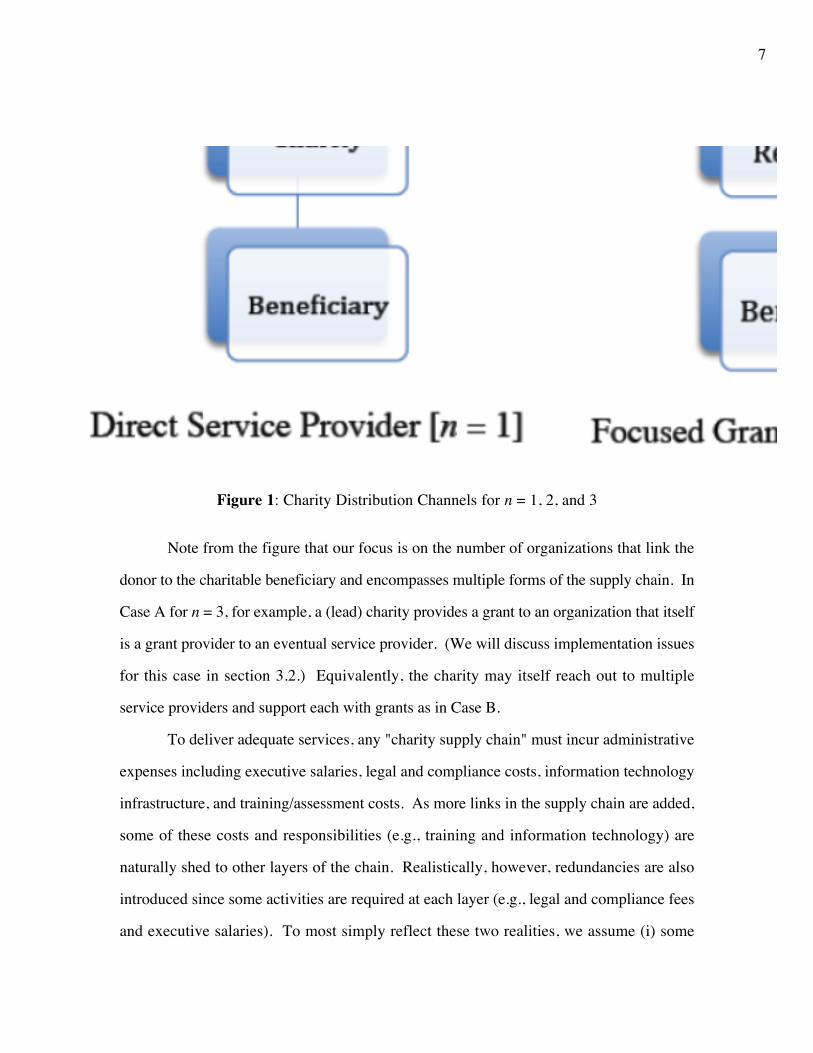
the direct services. In particular, the charity can opt for a supply line of n , n ≥ 1,
organizations in reaching its objectives. With this formulation, n = 1 corresponds to the
charity being a direct service provider, whereas n > 1 corresponds to the charity being a
grant provider. Thus, higher values of n correspond to the charity making use of more
organizations in its distribution approach. Figure 1 presents a graphical depiction of the
distribution strategies for the cases of n = 1, 2, and 3.
potential; Bagnoli and Watts (2003) demonstrate that pressures to influence external perceptions ofsocial responsibility can also impact strategic interplay of for-profit entities.
7
Figure 1: Charity Distribution Channels for n = 1, 2, and 3
Note from the figure that our focus is on the number of organizations that link the
donor to the charitable beneficiary and encompasses multiple forms of the supply chain. In
Case A for n = 3, for example, a (lead) charity provides a grant to an organization that itself
is a grant provider to an eventual service provider. (We will discuss implementation issues
for this case in section 3.2.) Equivalently, the charity may itself reach out to multiple
service providers and support each with grants as in Case B.
To deliver adequate services, any "charity supply chain" must incur administrative
expenses including executive salaries, legal and compliance costs, information technology
infrastructure, and training/assessment costs. As more links in the supply chain are added,
some of these costs and responsibilities (e.g., training and information technology) are
naturally shed to other layers of the chain. Realistically, however, redundancies are also
introduced since some activities are required at each layer (e.g., legal and compliance fees
and executive salaries). To most simply reflect these two realities, we assume (i) some
8
administrative activities/costs are split between the n entities involved in administering the
charitable activities; and (ii) some administrative activities/costs must be incurred by each of
the entities involved. In particular, denote the per-period administrative cost incurred by
each entity by A / n + k , k ≥ 0 (resulting in a total administrative burden of A + nk ).3
In addition to incurring its share of administrative costs, the lead charity must also
incur costs associated with raising funds each period, denoted by F ≥ 0.4 Denoting its
total resources available for use (the donations it collects) in period t by dt , the charity
recognizes spending on programs of pt = dt − F − [A / n + k], as reported in the
organization's accounting reports, i.e., we presume no profit carryover and the functional
classification rules require spending to be split between program, fundraising, and
administrative categories. The total funds eventually reaching the mission in period t are
thus mt = pt − [n −1][A / n + k], where the second term reflects administrative costs
incurred by the remaining n −1 links in the charity supply chain. That is, if the charity is a
direct service provider, then the reported program expenses reflect all funds ultimately
spent on mission ( mt = pt ); as a grant provider, the amount ultimately reaching the mission
is lowered due to the administrative costs incurred by the added n −1 links in the supply
chain ( mt < pt ).
To reflect the practical consideration that donors rely on reported accounting
measures of a charity's efficiency in determining their giving levels, denote the total
donations raised by the charity in period t , t = 1,...,T by dt = α + βpt−1: α ,
α > A + k + F , reflects a baseline level of funding and β , β ∈[0,1) , reflects the extent to
which donors reward those charities with higher reported program spending in one period
3 If the administrative costs are not borne equally but the lead charity instead incurs a disproportionateshare of the costs, the results we find persist as long as some portion of the non-repeating costs areshed to other charities. In that case, as the paper's intuition will confirm, the greater the proportion ofcosts that is shed, the greater the benefit from adding additional layers to the supply chain.
4 For simplicity, we presume only the lead charity must incur a fundraising cost. The possibility ofadditional fundraising costs can readily be incorporated in the analysis. In fact, one can view k in thepresent formulation as representing the total additional administrative and/or fundraising costsintroduced by each new layer of the supply chain.
9
by donating more in the subsequent period.5 The lower bound on α is necessary and
sufficient for the charity to at least have a positive impact if it is organized as a direct service
provider, i.e., for n = 1, mtt=1T∑ > 0.
With this basic model as a backdrop, we ask what is the charity's preferred
distribution channel provided it wants to maximize the total resources devoted to the
mission, i.e., the value of n that maximizes mtt=1T∑ .
3. Results
To determine the charity's preferred distribution approach, we first need to examine
how the distribution approach affects resources coming in to the organization (donations).
This, in turn, naturally gives rise to consideration of the resources coming out of the
organization and, eventually, to the mission.
3.1. Equilibrium Giving
It is often discussed that donor emphasis on reported program expenses puts
charities in a bind – they must skimp on either administrative or fundraising infrastructure if
they have any hope of generating funds from a skeptical public and this, in turn, facilitates
a starvation cycle from which charities cannot fully recover (e.g., Gregory and Howard
2009). In this model, we revisit the question of donor emphasis on program expenses but
instead hone in on how it affects distribution strategies. That is, even when fundraising
and administrative requirements for the supply line are held fixed, the length of the supply
line alone may affect giving which may thus affect the preferred design of the supply line.
Besides incorporating the natural tendency of donors to reward reported efficiencies
(see, e.g., Tinkelman and Mankaney 2007; Gordon et al. 2009), this approach also
5 A richer time-series process can also be used to model donations. For example, donations in period tmay be tied to both program expenses in period t - 1 and period t - 2 with decaying effects. The currentformulation maintains simplicity to provide intuition; in addition, it highlights how despite the one-period lag model, the repercussions of program spending in a given period last long term.
10
reflects the practical consideration that accounting measures of efficiency for one entity only
report spending practices of that one entity even though it may rely on several others to
carry out programming. That is, unless an organization has a very strong controlling and
economic interest in another, accounting rules do not entail a consolidation of entities for
reporting purposes.6 As such, the accounting reflection of program expenses by one
organization may largely reflect grants provided to another even if the recipient entity
expends additional administrative costs spending only the residual on mission. The fact
that program expenses of the charity can overstate eventual mission impact is commonly
noted as a downside of relying on accounting metrics. Taken to the extreme, the potential
for abuse is manifest in the creation of "daisy chains" of organizations that simply shuffle
around funds to create an appearance of effectiveness even if no true efforts are undertaken.
Our setting reflects this practicality by noting that donors to the charity care about its
reported program expenses ( pt) but cannot (or do not) rely on a measure of ultimate
mission impact ( mt ). The result is that donations in one period are sensitive to the level of
program spending in the previous period. If an organization can boost donations, that, in
turn, frees up funds for more programming. Thus, perceived efficiency has a self-fulfilling
prophesy effect. Formally, in accordance with the functional classification of expenses,
donations to a charity are utilized for programming, fundraising, and administration, that
is, dt−1 = pt−1 + F + [A / n + k]. For a given n , an increase in dt−1 implies a higher pt−1
and, this boost in programming expenditures in turn means that the charity can garner more
in donations in period t ; this increase in dt increases pt , and so on. The next proposition
summarizes this inter temporal connection among donations in the setting. (All proofs are
provided in the Appendix.)
6 The level of control that must be in place to trigger a consolidation of financial statements is so strongthat many national organizations report separately even from their local chapters that share the samename (e.g., United Way Worldwide).
11
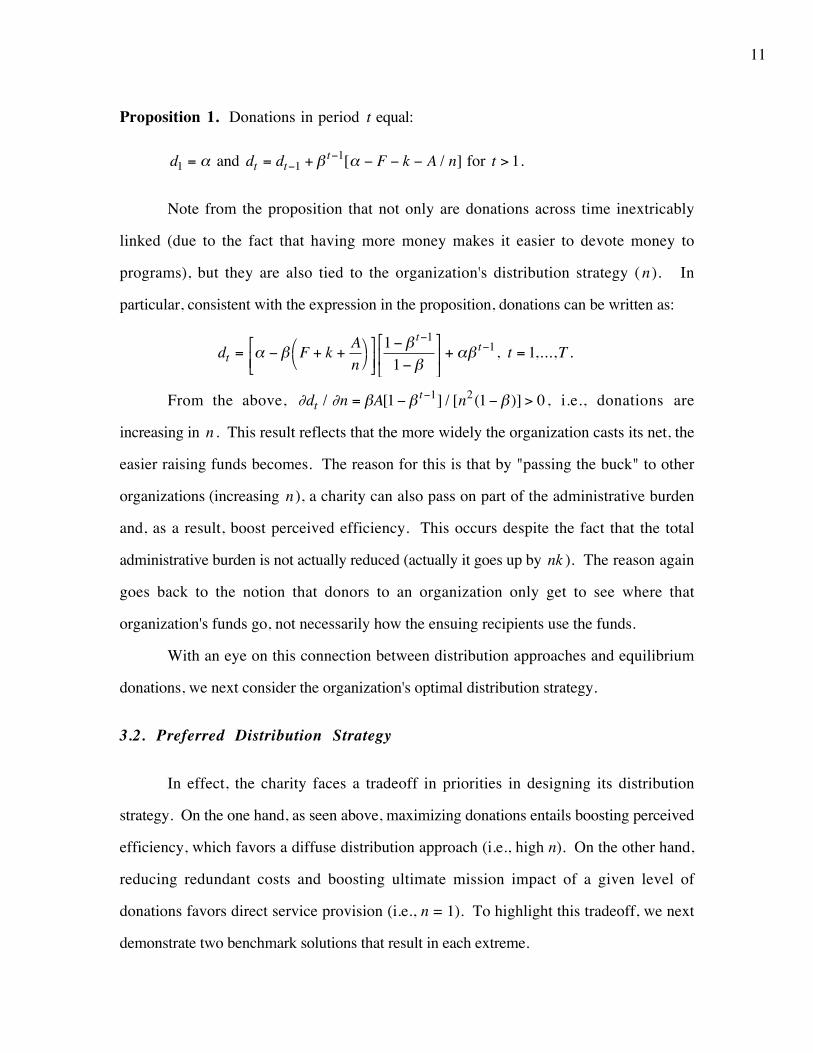
Proposition 1. Donations in period t equal:
d1 = α and dt = dt−1 + βt−1[α − F − k − A / n] for t > 1.
Note from the proposition that not only are donations across time inextricably
linked (due to the fact that having more money makes it easier to devote money to
programs), but they are also tied to the organization's distribution strategy ( n ). In
particular, consistent with the expression in the proposition, donations can be written as:
dt = α − β F + k +A
n⎛⎝
⎞⎠
⎡
⎣⎢⎤
⎦⎥1− β t−1
1− β
⎡
⎣⎢
⎤
⎦⎥ + αβ
t−1, t = 1,...,T .
From the above, ∂dt / ∂n = βA[1− β t−1] / [n2(1− β )] > 0, i.e., donations are
increasing in n . This result reflects that the more widely the organization casts its net, the
easier raising funds becomes. The reason for this is that by "passing the buck" to other
organizations (increasing n ), a charity can also pass on part of the administrative burden
and, as a result, boost perceived efficiency. This occurs despite the fact that the total
administrative burden is not actually reduced (actually it goes up by nk ). The reason again
goes back to the notion that donors to an organization only get to see where that
organization's funds go, not necessarily how the ensuing recipients use the funds.
With an eye on this connection between distribution approaches and equilibrium
donations, we next consider the organization's optimal distribution strategy.
3.2. Preferred Distribution Strategy
In effect, the charity faces a tradeoff in priorities in designing its distribution
strategy. On the one hand, as seen above, maximizing donations entails boosting perceived
efficiency, which favors a diffuse distribution approach (i.e., high n). On the other hand,
reducing redundant costs and boosting ultimate mission impact of a given level of
donations favors direct service provision (i.e., n = 1). To highlight this tradeoff, we next
demonstrate two benchmark solutions that result in each extreme.
12
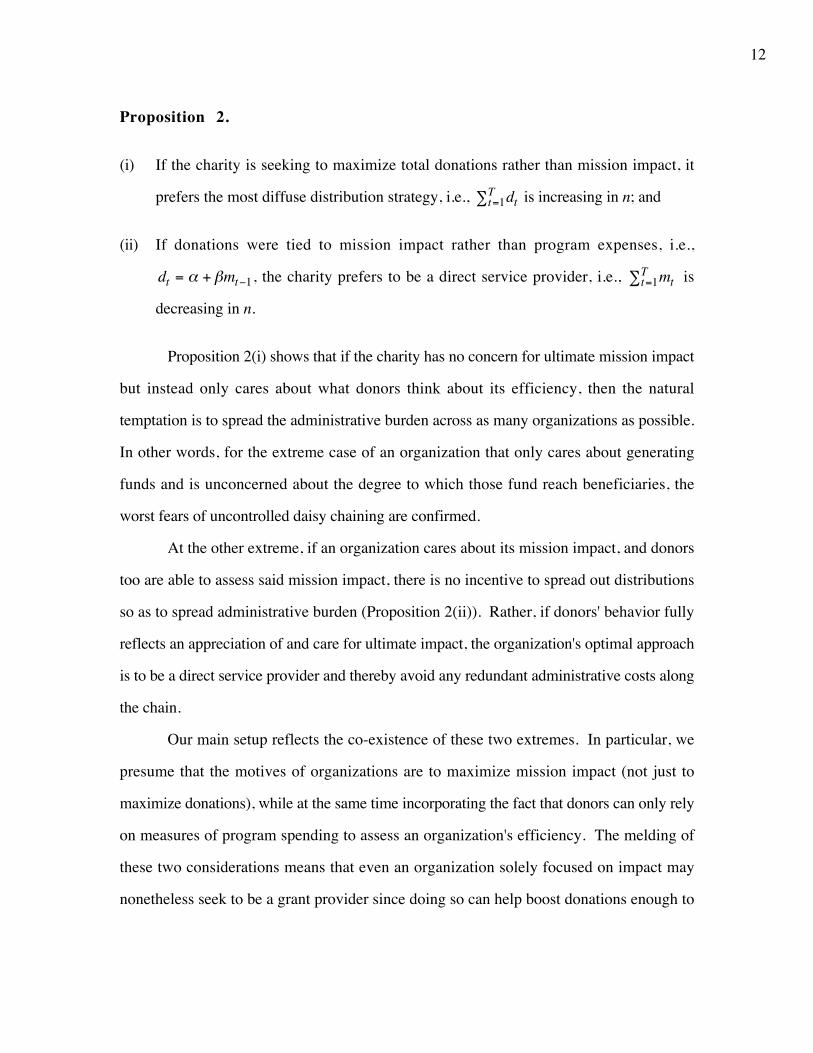
Proposition 2.
(i) If the charity is seeking to maximize total donations rather than mission impact, it
prefers the most diffuse distribution strategy, i.e., dtt=1T∑ is increasing in n; and
(ii) If donations were tied to mission impact rather than program expenses, i.e.,
dt = α + βmt−1, the charity prefers to be a direct service provider, i.e., mtt=1T∑ is
decreasing in n.
Proposition 2(i) shows that if the charity has no concern for ultimate mission impact
but instead only cares about what donors think about its efficiency, then the natural
temptation is to spread the administrative burden across as many organizations as possible.
In other words, for the extreme case of an organization that only cares about generating
funds and is unconcerned about the degree to which those fund reach beneficiaries, the
worst fears of uncontrolled daisy chaining are confirmed.
At the other extreme, if an organization cares about its mission impact, and donors
too are able to assess said mission impact, there is no incentive to spread out distributions
so as to spread administrative burden (Proposition 2(ii)). Rather, if donors' behavior fully
reflects an appreciation of and care for ultimate impact, the organization's optimal approach
is to be a direct service provider and thereby avoid any redundant administrative costs along
the chain.
Our main setup reflects the co-existence of these two extremes. In particular, we
presume that the motives of organizations are to maximize mission impact (not just to
maximize donations), while at the same time incorporating the fact that donors can only rely
on measures of program spending to assess an organization's efficiency. The melding of
these two considerations means that even an organization solely focused on impact may
nonetheless seek to be a grant provider since doing so can help boost donations enough to
13
justify the added inefficiencies that come along with it. This result is confirmed in the next
proposition.
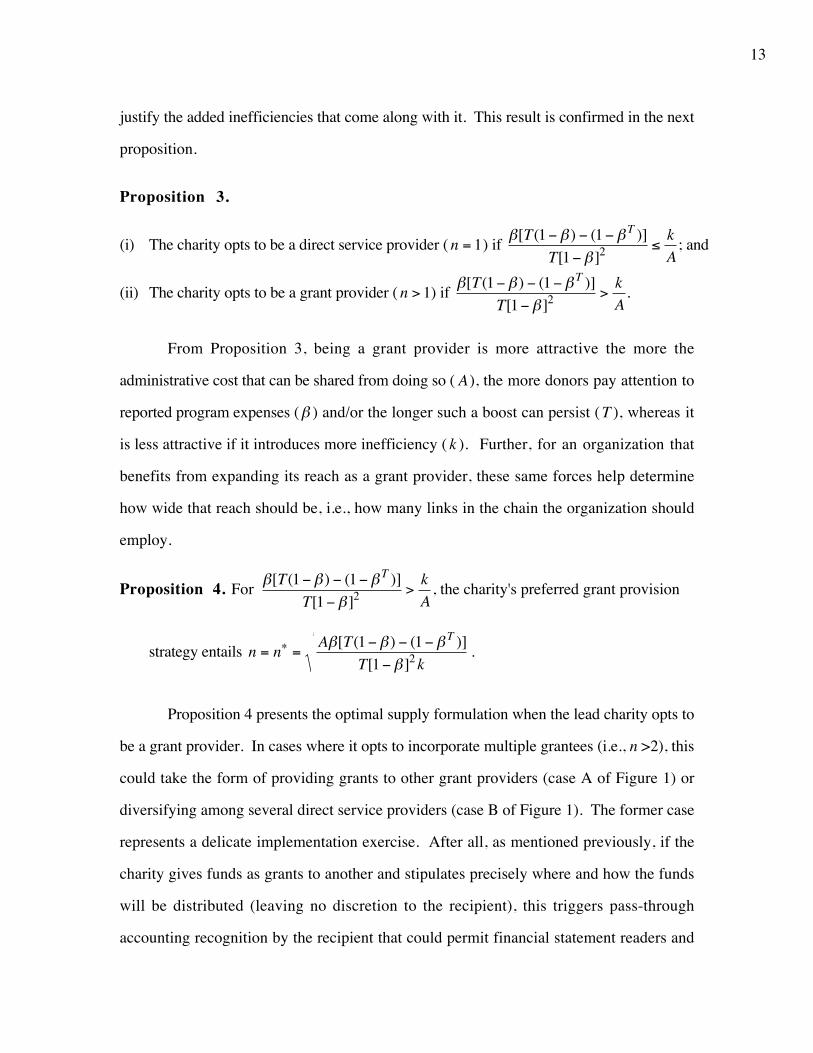
Proposition 3.
(i) The charity opts to be a direct service provider ( n = 1) if β[T(1− β ) − (1− βT )]
T[1− β ]2 ≤k
A; and
(ii) The charity opts to be a grant provider ( n > 1) if β[T(1− β ) − (1− βT )]
T[1− β ]2 >k
A.
From Proposition 3, being a grant provider is more attractive the more the
administrative cost that can be shared from doing so ( A), the more donors pay attention to
reported program expenses (β ) and/or the longer such a boost can persist ( T ), whereas it
is less attractive if it introduces more inefficiency ( k ). Further, for an organization that
benefits from expanding its reach as a grant provider, these same forces help determine
how wide that reach should be, i.e., how many links in the chain the organization should
employ.
Proposition 4. For β[T(1− β ) − (1− βT )]
T[1− β ]2 >k
A, the charity's preferred grant provision
strategy entails n = n∗ =Aβ[T(1− β ) − (1− βT )]
T[1− β ]2 k.
Proposition 4 presents the optimal supply formulation when the lead charity opts to
be a grant provider. In cases where it opts to incorporate multiple grantees (i.e., n >2), this
could take the form of providing grants to other grant providers (case A of Figure 1) or
diversifying among several direct service providers (case B of Figure 1). The former case
represents a delicate implementation exercise. After all, as mentioned previously, if the
charity gives funds as grants to another and stipulates precisely where and how the funds
will be distributed (leaving no discretion to the recipient), this triggers pass-through
accounting recognition by the recipient that could permit financial statement readers and
14
charity evaluators to bypass the "middleman" and more easily follow the paper trail.
Realistically, however, most grant providers do not go this far but rather retain a measure
of control while also leaving some discretion to grantees. This control arises either
explicitly by putting use restrictions on funds (e.g., they must be paid as grants to others
for a particular purpose without stipulating precisely who receives the grants) or implicitly
by requiring performance requirements be met for grants (e.g., setting minimum spending
ratios for a grantee which would, in turn, incentivize the grantee to itself pay grants in order
to pass along some of the administrative burden). In either circumstance, the grant
provider maintains enough control to have substantial say on the ultimate disposition of
funds. Further, it is worth stressing that in case B of Figure 1, the absence of added layers
of grant provision means that the issue of how grant recipients will act in distributing funds
to other parties is a non-issue. All that said, even in the event that outsiders could "see
through" and account for administrative costs incurred by other parties, our results broadly
apply as long is there is not complete see through – the key to our result is that accounting
metrics are not so rich that they permit perfect revelation of resources to their ultimate
disposition for the mission (else, in effect, Proposition 2(ii) applies).
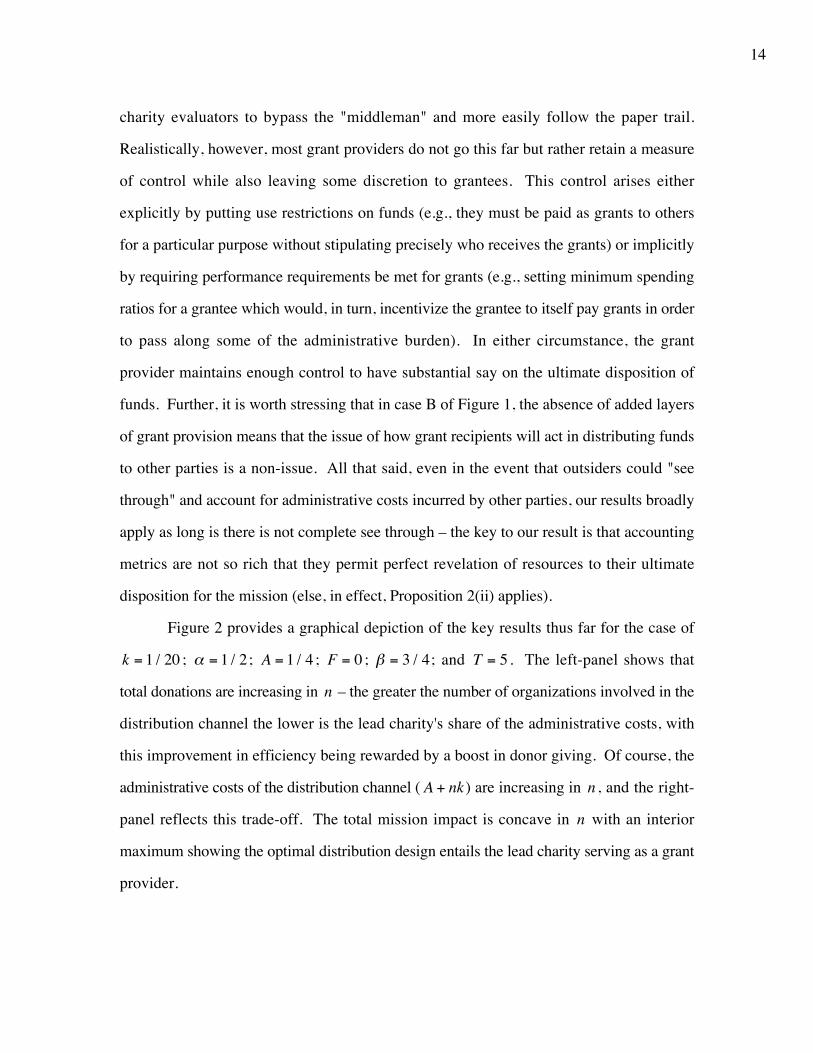
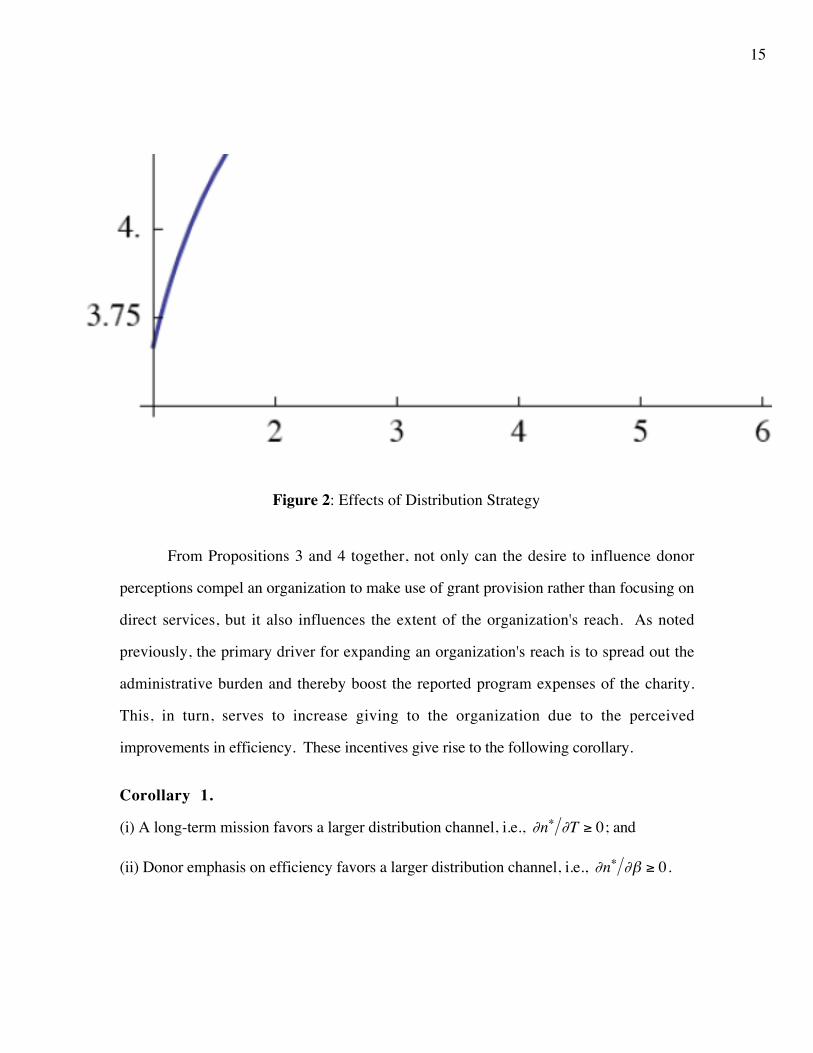
Figure 2 provides a graphical depiction of the key results thus far for the case of
k = 1 / 20 ; α = 1 / 2; A = 1 / 4 ; F = 0 ; β = 3 / 4; and T = 5. The left-panel shows that
total donations are increasing in n – the greater the number of organizations involved in the
distribution channel the lower is the lead charity's share of the administrative costs, with
this improvement in efficiency being rewarded by a boost in donor giving. Of course, the
administrative costs of the distribution channel ( A + nk ) are increasing in n , and the right-
panel reflects this trade-off. The total mission impact is concave in n with an interior
maximum showing the optimal distribution design entails the lead charity serving as a grant
provider.
15
Figure 2: Effects of Distribution Strategy
From Propositions 3 and 4 together, not only can the desire to influence donor
perceptions compel an organization to make use of grant provision rather than focusing on
direct services, but it also influences the extent of the organization's reach. As noted
previously, the primary driver for expanding an organization's reach is to spread out the
administrative burden and thereby boost the reported program expenses of the charity.
This, in turn, serves to increase giving to the organization due to the perceived
improvements in efficiency. These incentives give rise to the following corollary.
Corollary 1.
(i) A long-term mission favors a larger distribution channel, i.e., ∂n∗ ∂T ≥ 0; and
(ii) Donor emphasis on efficiency favors a larger distribution channel, i.e., ∂n∗ ∂β ≥ 0.
16
From the corollary, our model predicts that an organization seeking to balance
donor demands and a desire to reduce administrative redundancies along its supply line will
find its distribution strategy vary predictably with both the time frame of the organization's
mission and the degree to which donors pay attention to reported costs. Corollary 1(i)
demonstrates that an organization intending to reach its objectives over a long time horizon
will opt to spread its resources out over a variety of recipient organizations. Importantly,
this comparative static arises not from a desire to diversify risks or to maximize the
potential for an extreme breakthrough, but rather a desire to leverage high initial reported
program expenses to garner greater donations over the long run, even if doing so
introduces inefficiencies in the short run. That is, the longer the charity's horizon, the
greater the gains from linking and boosting donations over the many periods. It is worth
noting, however, that this temptation to expand reach as horizon expands has a limit. In
particular, taking Propositions 3 and 4 together reveals that the maximum optimal reach is
Max 1, LimT→∞
n∗ =Aβ
[1− β ]k
⎧⎨⎩
⎫⎬⎭
.
In a similar vein, Corollary 1(ii) notes that the more attention donors pay to
accounting measures of efficiency, the greater the incentive to spread resources (and, as a
result, administrative burden) across more grant recipients. It is notable that it is the desire
to boost perceptions of efficiency to boost long-run giving that creates incentives to be
more inefficient in the short run. In other words, this comparative static gives credence to
those criticizing donors and charity evaluators for relying heavily on accounting measures
of efficiency to gauge effectiveness. The desire to please these evaluators results in form
over substance in that it requires some inefficiencies to generate adequate donations. It is
concern over such myopic behavior that gave rise to the "overhead myth" movement in the
nonprofit sector, which seeks less reliance on accounting metrics in evaluating efficiency.
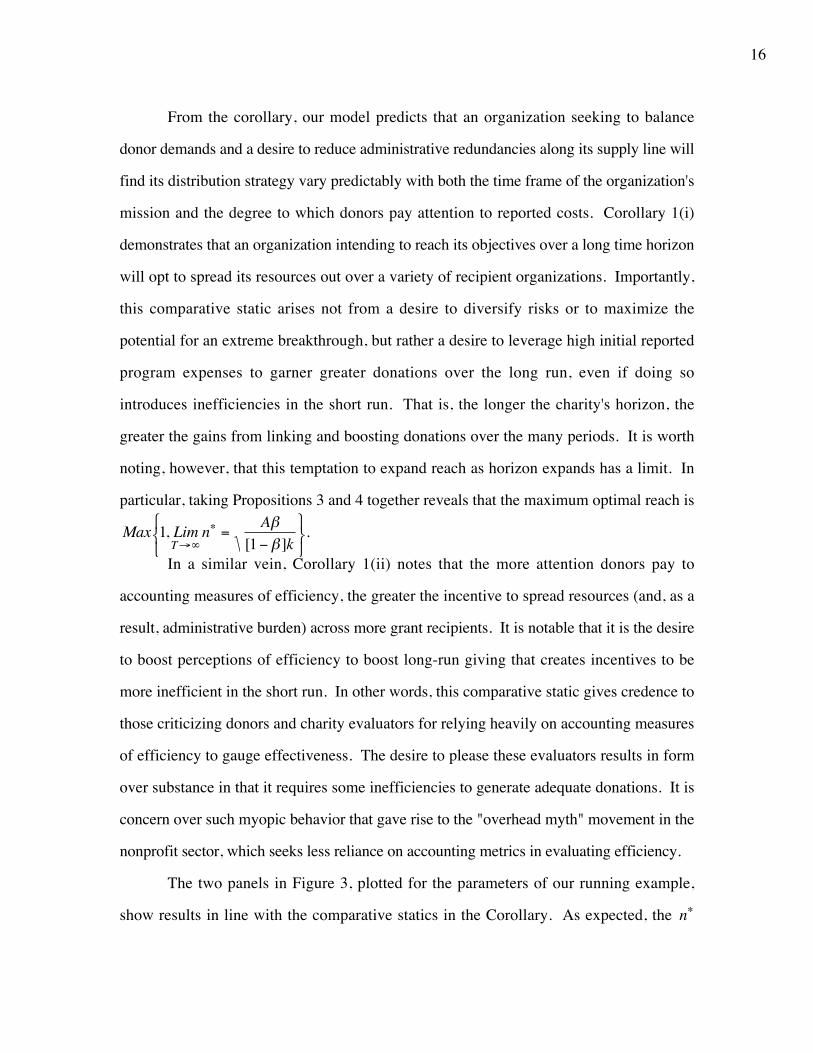
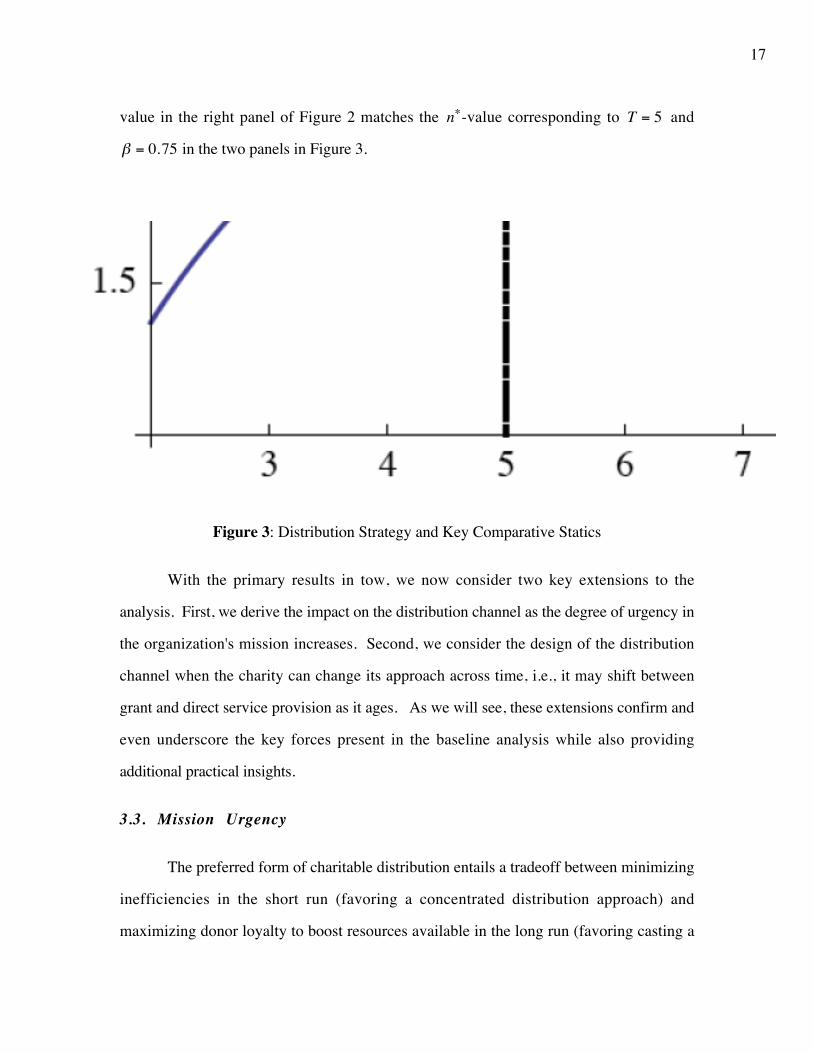
The two panels in Figure 3, plotted for the parameters of our running example,
show results in line with the comparative statics in the Corollary. As expected, the n∗
17
value in the right panel of Figure 2 matches the n∗-value corresponding to T = 5 and
β = 0.75 in the two panels in Figure 3.
Figure 3: Distribution Strategy and Key Comparative Statics
With the primary results in tow, we now consider two key extensions to the
analysis. First, we derive the impact on the distribution channel as the degree of urgency in
the organization's mission increases. Second, we consider the design of the distribution
channel when the charity can change its approach across time, i.e., it may shift between
grant and direct service provision as it ages. As we will see, these extensions confirm and
even underscore the key forces present in the baseline analysis while also providing
additional practical insights.
3.3. Mission Urgency
The preferred form of charitable distribution entails a tradeoff between minimizing
inefficiencies in the short run (favoring a concentrated distribution approach) and
maximizing donor loyalty to boost resources available in the long run (favoring casting a
18
wider distribution net to boost reported program expenses). This tradeoff suggests that an
organization facing a particularly urgent need will seek to focus on the short-run
ramifications of its strategy. To examine this conjecture, we append the analysis to
consider a charity whose goal is to maximize the present value of mission impact,
λt−1t=1T∑ mt , where the discount factor λ , 0 < λ < 1, reflects the degree of urgency to the
mission (the limiting case of λ = 1 corresponds to the primary analysis).
As confirmed in the next proposition, consideration of mission urgency complicates
the equilibrium derivation but the end result is nonetheless intuitive.
Proposition 5.
(i) In the presence of mission urgency, the charity's preferred distribution strategy is
n = n∗(λ ) = Max 1,Aβ[λ − λT + (λβ )T (1− λ ) − λβ(1− λT )]
[1− β ][1− λβ ][1− λT ]k
⎧⎨⎪
⎩⎪
⎫⎬⎪
⎭⎪.
(ii) Greater mission urgency leads to a more concentrated distribution strategy, i.e.,
∂n∗(λ ) ∂λ ≥ 0.
The key implication of accounting for mission urgency is that the more pressing an
organization's mission, the more concentrated its distribution approach. In other words,
for organizations less focused on long-term growth and more focused on short-term
results, the optimal approach will be to forget concerns about donor perceptions of
"overhead" but rather hone in on delivering services. Besides providing justification for
the use of direct aid in response to many natural disasters, it also mirrors the justification
provided by the Wounded Warrior Project which consciously decided to ignore ratings
groups after determining that the changes necessary to improve ratings would "diminish its
ability to care for veterans" (O'Neil 2014).
The next figure revisits the numerical example to demonstrate how mission urgency
(i.e., lower λ ) alters the preferred distribution approach.
19
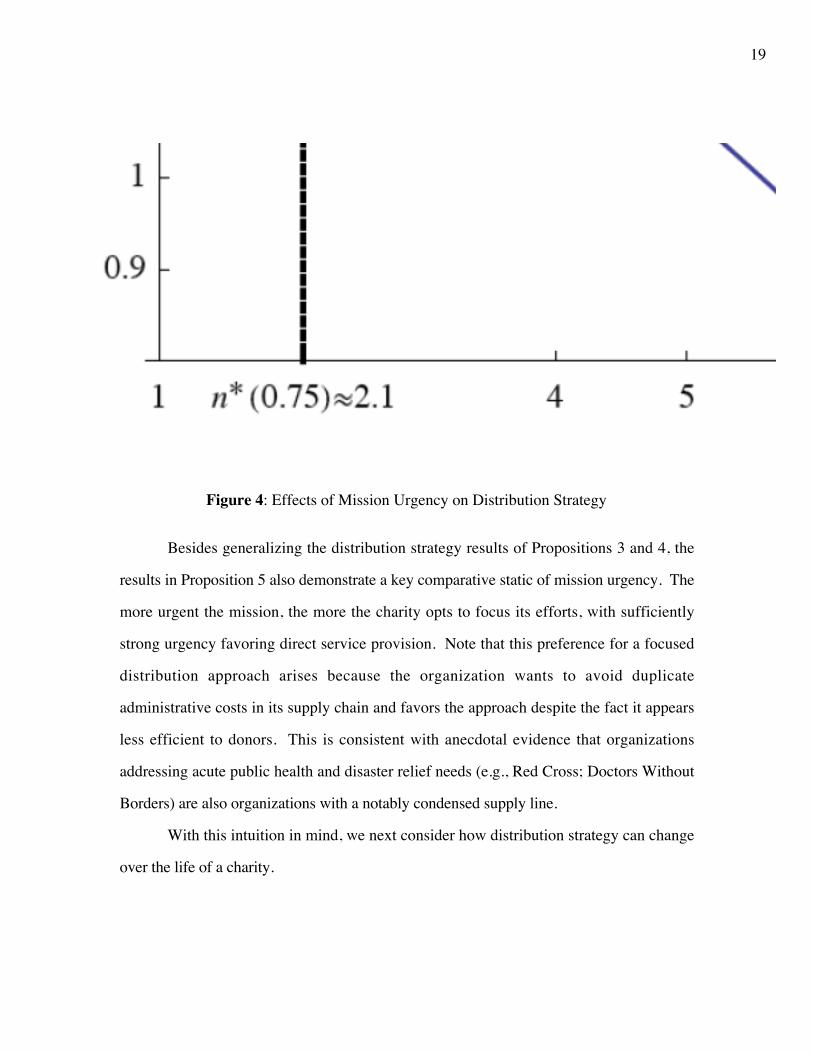
Figure 4: Effects of Mission Urgency on Distribution Strategy
Besides generalizing the distribution strategy results of Propositions 3 and 4, the
results in Proposition 5 also demonstrate a key comparative static of mission urgency. The
more urgent the mission, the more the charity opts to focus its efforts, with sufficiently
strong urgency favoring direct service provision. Note that this preference for a focused
distribution approach arises because the organization wants to avoid duplicate
administrative costs in its supply chain and favors the approach despite the fact it appears
less efficient to donors. This is consistent with anecdotal evidence that organizations
addressing acute public health and disaster relief needs (e.g., Red Cross; Doctors Without
Borders) are also organizations with a notably condensed supply line.
With this intuition in mind, we next consider how distribution strategy can change
over the life of a charity.
20
3.4. Altering Distribution Strategy over Time
Thus far, we have presumed that a charity's distribution approach is stable across
time, reflecting a singular approach. That said, charities often have flexibility in their
approach, by either focusing on grant provision or direct service provision in one year,
switching emphasis in a subsequent year. To reflect this possibility, we now append the
primary analysis to permit a different distribution strategy each period. Denote the
distribution approach in period t by nt . In this case, nt is chosen to maximize mii=tT∑ .7
The next proposition characterizes the preferred distribution approach.
Proposition 6. When distribution strategy can be altered each period,
(i) The optimal distribution strategy is nt = nt∗ = Max 1,
Aβ[1− βT−t ][1− β ]k
⎧⎨⎪
⎩⎪
⎫⎬⎪
⎭⎪; and
(ii) As an organization ages, the optimal distribution strategy becomes more concentrated,
i.e., ∂nt∗ ∂t ≤ 0.
As confirmed in Proposition 6(ii), as an organization ages it shifts to a more
focused distribution strategy. As can be seen in Proposition 6(i), this is driven not by
knowledge gained from years that have passed ( t), but rather an increased focus on the
limited years remaining ( T − t ). As such, for organizations best viewed as infinitely-lived
( T →∞), it is readily confirmed that the optimal distribution strategy is time invariant and
precisely the one examined in the primary setup. That is, LimT→∞
nt∗ = Max 1,
Aβ[1− β ]k
⎧⎨⎩
⎫⎬⎭
.
The next figure provides a graphical depiction of the proposition for the continuing
numerical example.
7 The solution is unchanged if nt is chosen upfront to maximize mii=1T∑ . This is because nt impacts
administrative costs only in period t , and its effects on donations arise only from period t + 1 onwards.
21
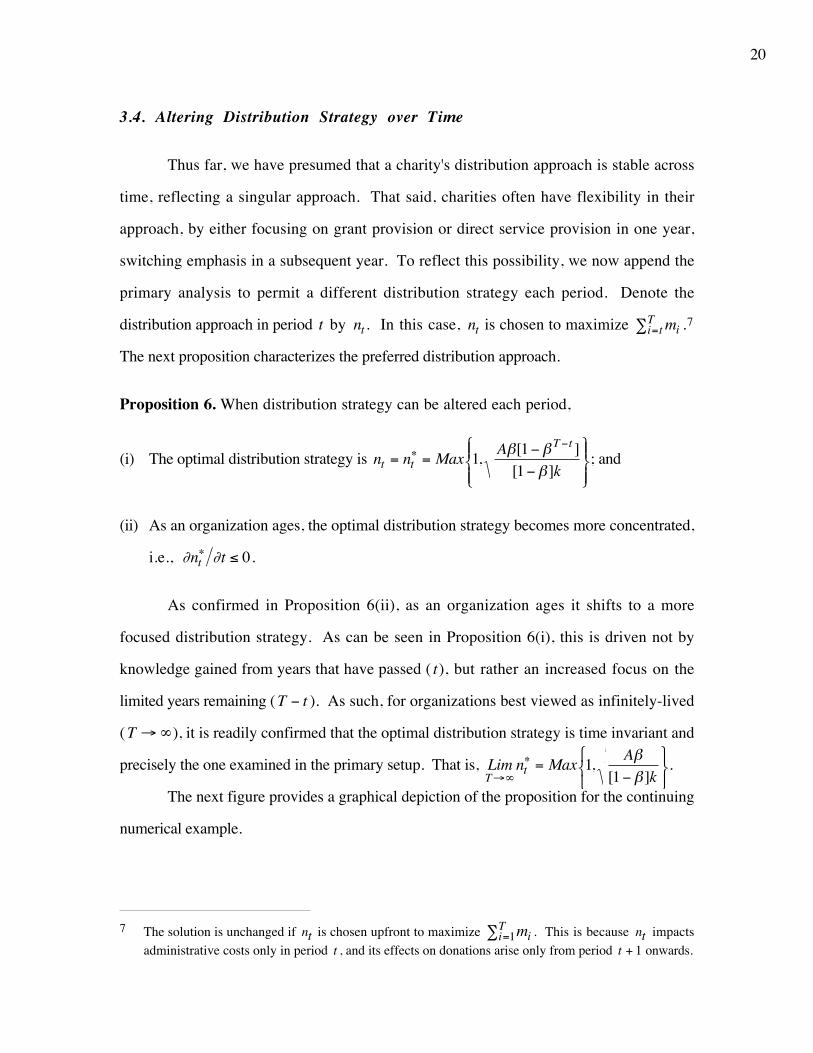
Figure 5: Preferred Time-Varying Distribution Strategy
A comparison of Proposition 6 to Propositions 3 and 4 confirms that the key
underlying forces of the analysis persist in the case of time-varying distribution strategies.
The proposition also provides a key comparative static of how distribution approaches
change over the life of a charity. In an organization's early stages, its optimal approach is
to streamline its administrative burden by distributing funds diffusely, gradually focusing
its efforts over time. While the organization may appear to be too ambitious and "spread
too thin" in early years, such an appearance of ambition turns out to be self-enforcing.
Importantly, this gradual focusing of resources is not an exercise of experimentation in
trying to find the best outlets, narrowing down to the best across time. Instead, the gradual
narrowing of distribution outlets over time is a reflection of an organization focused less on
how donor perceptions will affect future donation streams and focused more on making
immediate impact by avoiding cost redundancies. Also, note that our prediction provides
an offsetting force to the notion of organizational "mission creep" over time – here, as
organizations age, they winnow down, not expand, their initiatives.
22
4. Conclusion
This paper considers a simple model of charitable distribution strategies in light of
donor reliance on accounting measures. The model incorporates the practical feature that
donors often rely on reported program spending to determine efficiency of charitable
organizations. This reflects the fact that donors can only realistically observe how the
organization uses its funds, not how any subsequent grant recipients use theirs. As a
result, a charity appears more efficient if it employs a strategy of providing grants to a
variety of parties, since those sources in turn take on more of the administrative burden.
Thus, even a charity whose sole intent is to maximize mission impact adds extra layers
between itself and eventual beneficiaries. This desire to spread grants widely is offset by a
desire to help the mission by reducing redundant fixed costs. The results demonstrate key
determinants of the equilibrium distribution strategy in light of donor reliance on accounting
metrics of efficiency for non-profit organizations. The results also suggest that
development and refinement of impact measures and/or additional rules requiring
consolidated financial reporting can reduce bureaucratic layers in charity supply chains,
instead favoring more direct provision of services.
23
APPENDIX
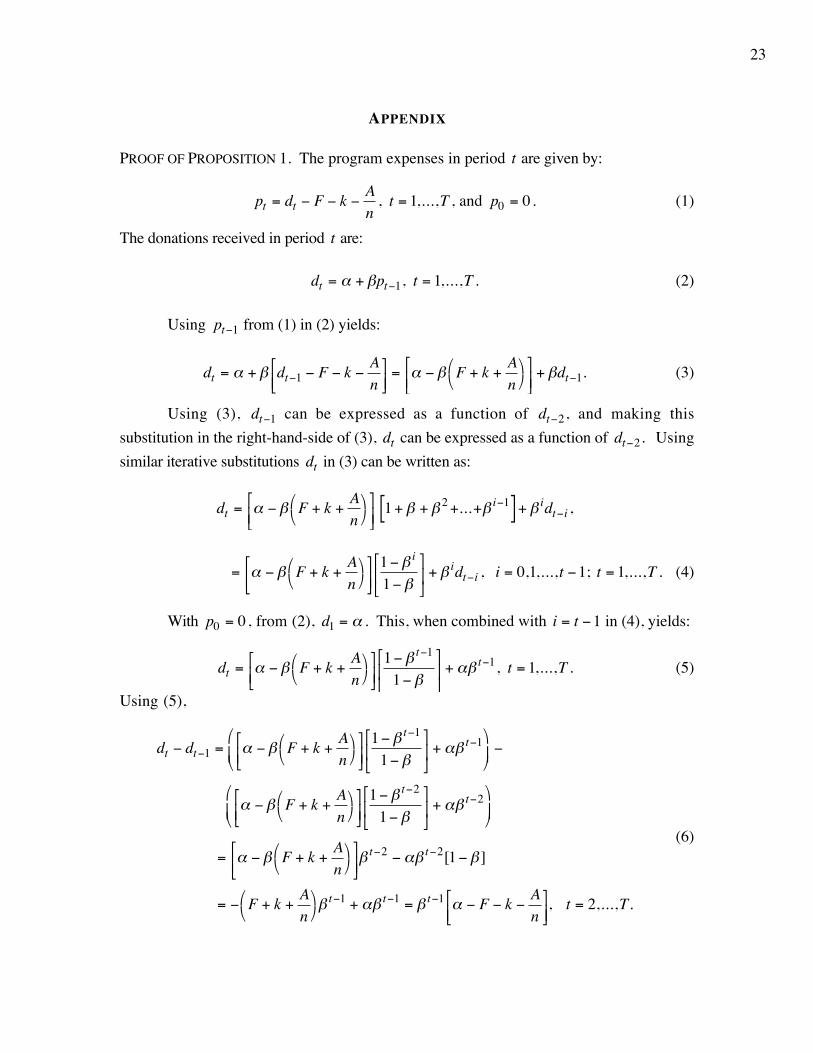
PROOF OF PROPOSITION 1. The program expenses in period t are given by:
pt = dt − F − k −A
n, t = 1,...,T , and p0 = 0. (1)
The donations received in period t are:
dt = α + βpt−1, t = 1,...,T . (2)
Using pt−1 from (1) in (2) yields:
dt = α + β dt−1 − F − k −A
n⎡⎣⎢
⎤⎦⎥= α − β F + k +
A
n⎛⎝
⎞⎠
⎡
⎣⎢⎤
⎦⎥+ βdt−1. (3)
Using (3), dt−1 can be expressed as a function of dt−2, and making this
substitution in the right-hand-side of (3), dt can be expressed as a function of dt−2. Using
similar iterative substitutions dt in (3) can be written as:
dt = α − β F + k +A
n⎛⎝
⎞⎠
⎡
⎣⎢⎤
⎦⎥ 1+ β + β 2+...+β i−1[ ] + β idt−i ,
= α − β F + k +A
n⎛⎝
⎞⎠
⎡
⎣⎢⎤
⎦⎥1− β i
1− β
⎡
⎣⎢
⎤
⎦⎥ + β
idt−i , i = 0,1,...,t −1; t = 1,...,T . (4)
With p0 = 0, from (2), d1 = α . This, when combined with i = t −1 in (4), yields:
dt = α − β F + k +A
n⎛⎝
⎞⎠
⎡
⎣⎢⎤
⎦⎥1− β t−1
1− β
⎡
⎣⎢
⎤
⎦⎥ + αβ
t−1, t = 1,...,T . (5)
Using (5),
dt − dt−1 = α − β F + k +A
n⎛⎝
⎞⎠
⎡
⎣⎢⎤
⎦⎥1− β t−1
1− β
⎡
⎣⎢
⎤
⎦⎥ + αβ
t−1⎛
⎝⎜
⎞
⎠⎟ −
α − β F + k +A
n⎛⎝
⎞⎠
⎡
⎣⎢⎤
⎦⎥1− β t−2
1− β
⎡
⎣⎢
⎤
⎦⎥ + αβ
t−2⎛
⎝⎜
⎞
⎠⎟
= α − β F + k +A
n⎛⎝
⎞⎠
⎡
⎣⎢⎤
⎦⎥β t−2 − αβ t−2[1− β ]
= − F + k +A
n⎛⎝
⎞⎠β t−1 + αβ t−1 = β t−1 α − F − k −
A
n⎡⎣⎢
⎤⎦⎥, t = 2,...,T.
(6)
24
From (6), dt = dt−1 + βt−1[α − F − k − A / n]. This completes the proof of
Proposition 1.
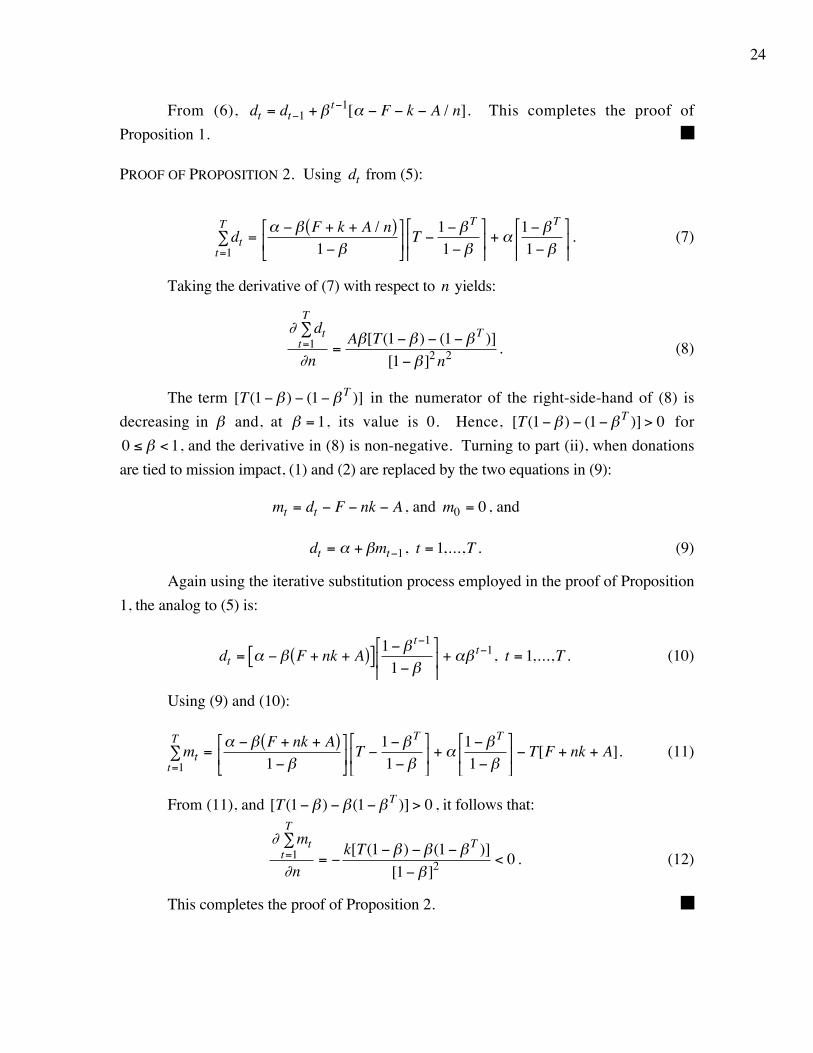
PROOF OF PROPOSITION 2. Using dt from (5):
dtt=1
T∑ =
α − β F + k + A / n( )1− β
⎡
⎣⎢
⎤
⎦⎥ T −
1− βT
1− β
⎡
⎣⎢
⎤
⎦⎥ + α
1− βT
1− β
⎡
⎣⎢
⎤
⎦⎥ . (7)
Taking the derivative of (7) with respect to n yields:
∂ dtt=1
T∑
∂n=
Aβ[T(1− β ) − (1− βT )]
[1− β ]2 n2 . (8)
The term [T(1− β ) − (1− βT )] in the numerator of the right-side-hand of (8) is
decreasing in β and, at β = 1, its value is 0. Hence, [T(1− β ) − (1− βT )] > 0 for
0 ≤ β < 1, and the derivative in (8) is non-negative. Turning to part (ii), when donations
are tied to mission impact, (1) and (2) are replaced by the two equations in (9):
mt = dt − F − nk − A , and m0 = 0, and
dt = α + βmt−1, t = 1,...,T . (9)
Again using the iterative substitution process employed in the proof of Proposition
1, the analog to (5) is:
dt = α − β F + nk + A( )[ ] 1− β t−1
1− β
⎡
⎣⎢
⎤
⎦⎥ + αβ
t−1, t = 1,...,T . (10)
Using (9) and (10):
mtt=1
T∑ =
α − β F + nk + A( )1− β
⎡
⎣⎢
⎤
⎦⎥ T −
1− βT
1− β
⎡
⎣⎢
⎤
⎦⎥ + α
1− βT
1− β
⎡
⎣⎢
⎤
⎦⎥ − T[F + nk + A]. (11)
From (11), and [T(1− β ) − β(1− βT )] > 0 , it follows that:
∂ mtt=1
T∑
∂n= −
k[T(1− β ) − β(1− βT )]
[1− β ]2 < 0 . (12)
This completes the proof of Proposition 2.
25
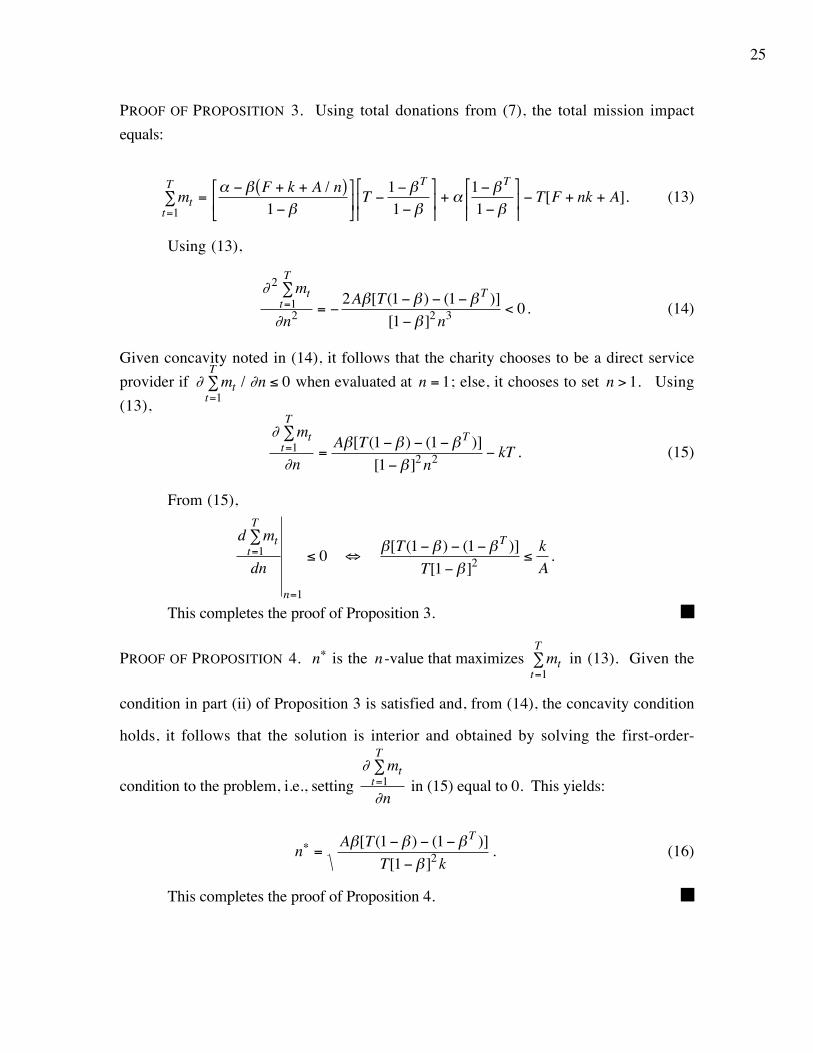
PROOF OF PROPOSITION 3. Using total donations from (7), the total mission impact
equals:
mtt=1
T∑ =
α − β F + k + A / n( )1− β
⎡
⎣⎢
⎤
⎦⎥ T −
1− βT
1− β
⎡
⎣⎢
⎤
⎦⎥ + α
1− βT
1− β
⎡
⎣⎢
⎤
⎦⎥ − T[F + nk + A]. (13)
Using (13),
∂ 2 mtt=1
T∑
∂n2 = −2Aβ[T(1− β ) − (1− βT )]
[1− β ]2 n3 < 0. (14)
Given concavity noted in (14), it follows that the charity chooses to be a direct service
provider if ∂ mtt=1
T∑ / ∂n ≤ 0 when evaluated at n = 1; else, it chooses to set n > 1. Using
(13),
∂ mtt=1
T∑
∂n=
Aβ[T(1− β ) − (1− βT )]
[1− β ]2 n2 − kT . (15)
From (15),
d mtt=1
T∑
dn
n=1
≤ 0 ⇔ β[T(1− β ) − (1− βT )]
T[1− β ]2 ≤k
A.
This completes the proof of Proposition 3.
PROOF OF PROPOSITION 4. n∗ is the n -value that maximizes mtt=1
T∑ in (13). Given the
condition in part (ii) of Proposition 3 is satisfied and, from (14), the concavity condition
holds, it follows that the solution is interior and obtained by solving the first-order-
condition to the problem, i.e., setting ∂ mt
t=1
T∑
∂n in (15) equal to 0. This yields:
n∗ =Aβ[T(1− β ) − (1− βT )]
T[1− β ]2 k. (16)
This completes the proof of Proposition 4.
26
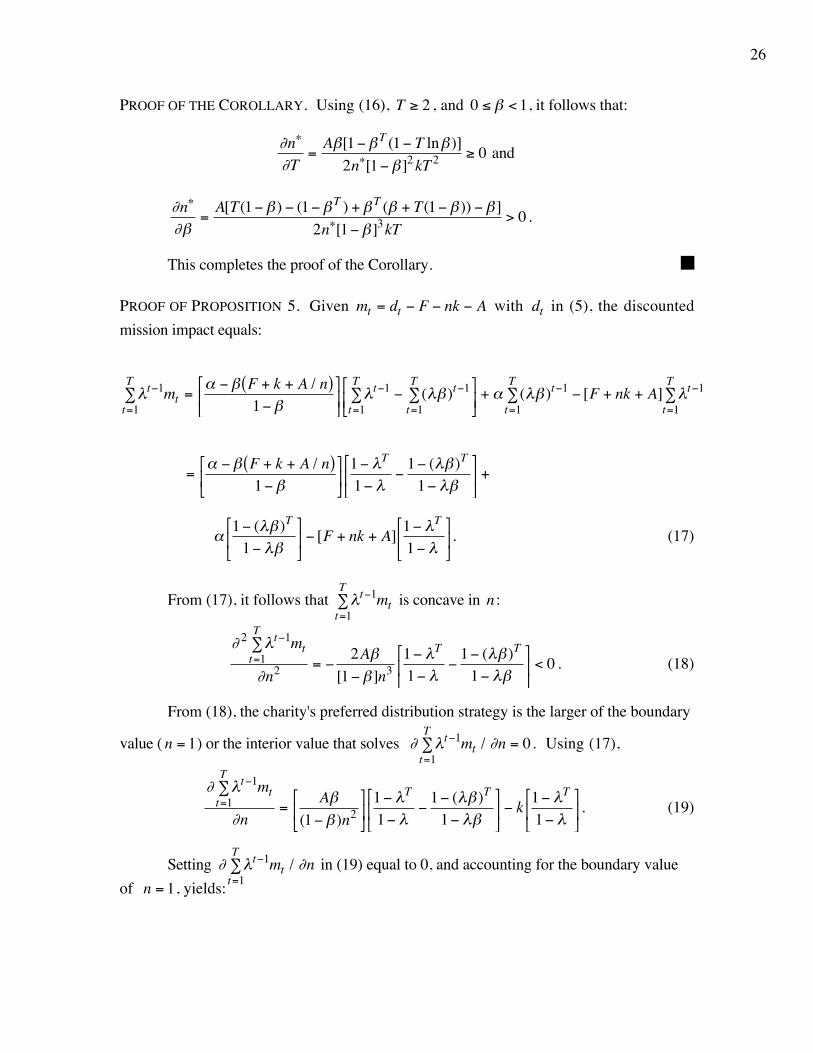
PROOF OF THE COROLLARY. Using (16), T ≥ 2 , and 0 ≤ β < 1, it follows that:
∂n∗
∂T=
Aβ[1− βT (1− T lnβ )]
2n∗[1− β ]2 kT2 ≥ 0 and
∂n∗
∂β=
A[T(1− β ) − (1− βT ) + βT (β + T(1− β )) − β ]
2n∗[1− β ]3kT> 0.
This completes the proof of the Corollary.
PROOF OF PROPOSITION 5. Given mt = dt − F − nk − A with dt in (5), the discounted
mission impact equals:
λt−1mtt=1
T∑ =
α − β F + k + A / n( )1− β
⎡
⎣⎢
⎤
⎦⎥ λt−1
t=1
T∑ − (λβ )t−1
t=1
T∑
⎡
⎣⎢
⎤
⎦⎥ + α (λβ )t−1
t=1
T∑ − [F + nk + A] λt−1
t=1
T∑
=α − β F + k + A / n( )
1− β⎡
⎣⎢
⎤
⎦⎥
1− λT
1− λ−
1− (λβ )T
1− λβ
⎡
⎣⎢
⎤
⎦⎥ +
α1− (λβ )T
1− λβ
⎡
⎣⎢
⎤
⎦⎥ − [F + nk + A]
1− λT
1− λ
⎡
⎣⎢
⎤
⎦⎥. (17)
From (17), it follows that λt−1mtt=1
T∑ is concave in n :
∂ 2 λt−1mtt=1
T∑
∂n2 = −2Aβ
[1− β ]n31− λT
1− λ−
1− (λβ )T
1− λβ
⎡
⎣⎢
⎤
⎦⎥ < 0 . (18)
From (18), the charity's preferred distribution strategy is the larger of the boundary
value ( n = 1) or the interior value that solves ∂ λt−1mtt=1
T∑ / ∂n = 0. Using (17),
∂ λt−1mt
t=1
T∑
∂n=
Aβ(1− β )n2⎡
⎣⎢
⎤
⎦⎥
1− λT
1− λ−
1− (λβ )T
1− λβ
⎡
⎣⎢
⎤
⎦⎥ − k
1− λT
1− λ
⎡
⎣⎢
⎤
⎦⎥ . (19)
Setting ∂ λt−1mtt=1
T∑ / ∂n in (19) equal to 0, and accounting for the boundary value
of n = 1, yields:
27
n∗(λ ) = Max 1,Aβ[λ − λT + (λβ )T (1− λ ) − λβ(1− λT )]
[1− β ][1− λβ ][1− λT ]k
⎧⎨⎪
⎩⎪
⎫⎬⎪
⎭⎪. (20)
Part (ii) follows by noting that, when n∗(λ ) is interior in (20), its derivative with
respect to λ equals:
∂n∗(λ )∂λ
=Aβ[λ (1− λT )(1− β )(1− (λβ )T ) − TλT (1− λ )(1− λβ )(1− βT )]
2λn∗(λ )[1− β ][1− λβ ]2[1− λT ]2 k≥ 0 . (21)
This completes the proof of Proposition 5.
PROOF OF PROPOSITION 6. Let nt denote the distribution approach in period t . In this
case, using the same iterative process as used in the proof of Proposition 1, the analog to
(5), i.e., donations in period t , can be written as:
dt = α − β F + k( )[ ] 1− β t−1
1− β
⎡
⎣⎢
⎤
⎦⎥ − βA
β i−1
nt−i
⎡
⎣⎢
⎤
⎦⎥
i=1
t−1∑ + αβ t−1, t = 1,...,T . (22)
Thus, at time t , the remaining mission impact equals:
mjj=t
T∑ =
α − β F + k( )1− β
⎡
⎣⎢
⎤
⎦⎥ (T − t +1) −
β t−1 − βT
1− β
⎡
⎣⎢
⎤
⎦⎥ − βA
β i−1
nj−i
⎡
⎣⎢⎢
⎤
⎦⎥⎥i=1
j−1∑
j=t
T∑ +
αβ t−1 − βT
1− β
⎡
⎣⎢
⎤
⎦⎥ − (T − t +1)[F + A]− k nj
j=t
T∑ .
(23)
The charity chooses nt to maximize (23). From (23), it follows that mjj=t
T∑ is
concave in nt . As a result, the charity's preferred distribution strategy is again the larger of
the boundary value ( nt = 1) or the interior value that solves ∂ mjj=t
T∑ / ∂nt = 0. From (23),
∂ mjj=t
T∑
∂nt= −k +
Aβnt
2 β i−1
i=1
T−t∑ . (24)
Setting ∂ mjj=t
T∑ / ∂nt in (24) equal to 0, and accounting for the boundary value of
n = 1, yields:
nt∗ = Max 1,
Aβ[1− βT−t ][1− β ]k
⎧⎨⎪
⎩⎪
⎫⎬⎪
⎭⎪. (25)

28
Part (ii) follows by noting that, when nt∗ is interior in (25), its derivative with
respect to t equals:
∂nt∗
∂t=
AβT−t+1 lnβ2nt
∗[1− β ]k≤ 0.
This completes the proof of Proposition 6.
29
REFERENCES
Arya, A., B. Mittendorf. 2015. Career concerns and accounting performance measures in
nonprofit organizations. Accounting, Organizations and Society 40, 1-12.
Baber, W., A. Roberts, G. Visvanathan. 2001. Charitable organizations' strategies and
program-spending ratios. Accounting Horizons 15, 329-343.
Bagnoli, M., S. Watts. 2003. Selling to socially responsible consumers: Competition and
the private provision of public goods. Journal of Economics and Management Strategy
12, 419-445.
Beamon, B. 1998. Supply chain design and analysis: models and methods. International
Journal of Production Economics 55, 281-294.
Berenguer, G. 2014. Nonprofit operations. POMS Chronicle 21, 12.
Berenguer, G., A. Richter, Z. Shen. 2014. Challenges and strategies in managing
nonprofit operations: An Operations Management perspective. Purdue University
working paper.
Cohn, M. 2015. FASB Proposes Major Changes in Nonprofit Accounting. Accounting
Today, April 22, http://www.accountingtoday.com/news/audit-accounting/fasb-
proposes-major-changes-in-nonprofit-accounting-74380-1.htm.
Elliott, J., J. Eisinger, L. Sullivan. 2014. The Red Cross' secret disaster. ProPublica,
October 29, http://www.propublica.org/article/the-red-cross-secret-disaster.
Elliott, J., L. Sullivan. 2015. How the Red Cross raised half a billion dollars for Haiti and
built six homes. ProPublica, June 3, http://www.propublica.org/article/How-the-red-
cross-raised-half-a-billion-dollars-for-Haiti-and-built-six-homes.
Financial Accounting Standards Board. 2012. Not-For-Profit Advisory Committee Meeting
Minutes, Norwalk, CT.
Financial Accounting Standards Board. 2015. Exposure Draft: Not-for-Profit Entities
(Topic 958) and Health Care Entities (Topic 954), Norwalk, CT.
Gordon, T., C. Knock, D. Neely. 2009. The role of rating agencies in the market for
charitable contributions: An empirical test. Journal of Accounting and Public Policy 28,
469-484.
Gregory, A., D. Howard. 2009. The nonprofit starvation cycle. Stanford Social
Innovation Review 7, 49-53.
30
Healy, P., J. Wahlen. 1999. A review of the earnings management literature and its
implications for standard setting. Accounting Horizons 13, 365-383.
Healy, P., K. Palepu. 2001. Information asymmetry, corporate disclosure, and the capital
markets: A review of the empirical disclosure literature. Journal of Accounting and
Economics 31, 405-440.
Keating, E., L. Parsons, A. Roberts. 2008. Misreporting fundraising: How do nonprofit
organizations account for telemarketing campaigns? The Accounting Review 83, 417-
446.
Kretschmer, A., S. Spinler, L. Van Wassenhove. 2014. A school feeding supply chain
framework: Critical factors for sustainable program design. Production and Operations
Management 23, 990-1001.
Krishnan, R., M. Yetman, R. Yetman. 2006. Expense misreporting in nonprofit
organizations. The Accounting Review 81, 399-420.
Mittendorf, B. 2015. How proposed accounting rules would affect nonprofits and donors.
The Chronicle of Philanthropy, April 29, https://philanthropy.com/article/How-
Proposed-Accounting-Rules/229775.
O'Neil, M. 2014. Wounded Warrior CEO rips rating systems as 'ineffective and
m i s i n f o r m e d . ' The Chron ic l e o f Ph i lan thropy , July 11,
https://philanthropy.com/article/Wounded-Warrior-CEO-Rips/152863.
Privett, N. 2012. Operations management in community-based nonprofit organizations. in
M. Johnson (Ed.), Community-Based Operations Research 167, 67-95.
Tinkelman, D. 2009. Unintended consequences of expense ratio guidelines: The Avon
breast cancer walks. Journal of Accounting and Public Policy 28, 485-494.
Tinkelman, D., K. Mankaney. 2007. When is administrative efficiency associated with
charitable donations? Nonprofit and Voluntary Sector Quarterly 36, 41-64.
Tsay, A. 2013. Designing and controlling the outsourced supply chain. Foundations and
Trends in Technology, Information and Operations Management 7, 1-160.