domestic-wastewater-influent-profiling-using-mitochondrial-real-time-pcr-for-source-tracking-animal-contamination_2008_journal-of-microbiological-methods...
TRANSCRIPT

Journal of Microbiological Methods xxx (2009) xxx–xxx
MIMET-03083; No of Pages 6
Contents lists available at ScienceDirect
Journal of Microbiological Methods
j ourna l homepage: www.e lsev ie r.com/ locate / jmicmeth
ARTICLE IN PRESS
Domestic wastewater influent profiling using mitochondrial real-time PCR for sourcetracking animal contamination
Jane M. Caldwell, Jay F. Levine ⁎Aquatic Epidemiology and Conservation Laboratory, Department of Population Health and Pathobiology, College of Veterinary Medicine, North Carolina State University, 4700 HillsboroughStreet, Raleigh, North Carolina 27606, United States
⁎ Corresponding author. Tel.: +1 919 513 6397; fax: +1E-mail address: [email protected] (J.F. Levine).
0167-7012/$ – see front matter © 2008 Elsevier B.V. Aldoi:10.1016/j.mimet.2008.11.007
Please cite this article as: Caldwell, J.M., Letracking animal contamination, J. Microbio
a b s t r a c t
a r t i c l e i n f oArticle history:
Real-time PCR amplifying m Received 26 September 2008Received in revised form 17 November 2008Accepted 23 November 2008Available online xxxxKeywords:Fecal contaminantsMitochondrial DNASource trackingWastewater
ammalian and avian mitochondrial DNA (mtDNA) was developed to characterizedomestic and light industrial wastewater influent from two municipal wastewater treatment facilities(WWTF) over a 24-week period. Influent samples were assayed with species-specific primers and dual-labeled probes for human, bovine, swine, dog, cat, Canada goose and white-tailed deer to detect and quantifyeukaryotic mtDNA contributors to local municipal wastewaters. Human (mean=9.6×10⁴ copies/ml) anddog (mean=5.3×10² copies/ml) mtDNA were detected in all 24 samples (12 samples/site). Bovine and swinemtDNA were detected sporadically and at lower levels than human mtDNA, means=3.0×10⁴ and9.5×102 copies/ml, respectively. Domestic cat, Canada goose and white-tailed deer were detected only oncein 24 samples. Mitochondrial DNA concentrations were compared to other bacterial, chemical andspectrophotometric parameters. Human mtDNA was positively correlated with ammonia concentration(P=0.01) and initial OD600 reading (P=0.02) at one WWTF. Bovine mtDNA was positively correlated withbiological oxygen demand (BOD) (P=0.02), final DNA concentration (P=0.03), initial and final humic acidconcentrations (P=0.01, P=0.01), and final OD600 (P=0.03) at one WWTF and total suspended solids (TSS)(P=0.04, P=0.09) at both facilities. Fecal coliforms were not positively or negatively correlated with mtDNAconcentrations of any species assayed. For source tracking purposes, a combination of human (105 copies/ml)and dogmtDNA signal (102 copies/ml) could be indicative ofmunicipal domestic wastewater contamination ofenvironmental waters.
© 2008 Elsevier B.V. All rights reserved.
1. Introduction
Domestic wastewater is flushed from bathrooms, drained fromkitchens and laundries, non-industrial businesses and restaurants thenrouted to municipal wastewater treatment facilities (WWTF) viasanitary drains. Storm water in these systems is unintentional, occur-ring only during catastrophic events such as flooding or inadvertentcrossing of lines. Municipal facilities process influent, what the mediacalls “raw sewage”, into water fit for release into local streams or land-application. Occasionally floods, system malfunctions or physicalbreaks in infrastructure allow untreated municipal influent to escapeinto environmental surfacewaters. Enteric bacteria and other bacterialand chemical methods are routinely used for documenting the pre-sence of fecal contamination in surfacewaters (Yan et al., 2007). Whenfecal contamination is documented, identifying the species of origincan aid mitigation efforts (Ram et al., 2007). Mitochondrial real-timePCR, quantifying mitochondrial DNA (mtDNA) from eukaryoticepithelial cells shed in feces, is a new potential method of identifying
919 513 6464.
l rights reserved.
vine, J.F., Domestic wastewal. Methods (2009), doi:10.101
the species of origin when fecal contamination is documented. Indomestic influent, possible sources ofmtDNA are human and pet feces,discarded meats; carry over signal from consumed meats in humanfeces (Caldwell et al., 2007), bathing and laundry. Feces contain largeamounts of exfoliated epithelial cells (Iyengar et al., 1991) and mtDNAhasmany copies per cell (Andreasson et al., 2002), (Gerber et al., 2001).Therefore, mtDNA genes give robust PCR signals similar to 16S rRNAgenes. Martellini et al. (2005) first usedmtDNAwith conventional andnested PCR to differentiate between human, bovine, porcine and ovinesources in surface waters. A multiplex real-time PCR assay was laterdeveloped (Caldwell et al., 2007) to detect human, bovine, and swinemtDNA in animal effluents and wastewater influents.
Municipal domestic influent was characterized in a novel wayby identifying and quantifying mitochondrial DNA (mtDNA) to obtaina profile of the incoming wastewater slurry. Correlations betweenroutinely measured bacterial, chemical and spectrophotometricparameters and mtDNA concentrations were noted for use in rapidmonitoring of environmental waters after influent spills. In addition,four new real-time primer/probe sets were validated for dog (Canisfamiliaris), cat (Felis catus), Canada goose (Branta canadensis), andwhite tailed deer (Odocoileus virginianus) due to potential humanhealth risks associated with widely reported pet and wildlife fecal
ter influent profiling using mitochondrial real-time PCR for source6/j.mimet.2008.11.007

2 J.M. Caldwell, J.F. Levine / Journal of Microbiological Methods xxx (2009) xxx–xxx
ARTICLE IN PRESS
contamination (Siewicki et al., 2007; Somarelli et al., 2007; Ram et al.,2007; Yan et al., 2007).
2. Materials and methods
2.1. Sample collection and concentration
Composite samples (500 ml pooled from 24 hourly samples) ofdomestic wastewater influent were collected weekly at the same dayand time for twelve weeks from two local wastewater treatmentfacilities. The Town of Holly Springs Wastewater Treatment Plantprocesses 1.1 million gallons per day of mostly domestic wastewaterfrom a population of approximately 20,000 people. Holly SpringsWWTF discharges into Utley Creek in southwesternWake County, NC.Besides domestic sources, Holly Springs also processes wastewaterfrom two light industries: a corrugated container plant that producesplastic and cardboardwaste and amicrobrewery, which produces beerlocally. The South Cary Water Reclamation Plant is a biologicalnutrient removal system with filtration. The plant has a treatmentcapacity of 12.8 million gallons per day and services 55,000 residents.Located on Middle Creek in southern Wake County, it processeswastewater from homes and small, non-industrial businesses such asoffices and restaurants.
Influent samples were collected in 500 ml sterile centrifuge bottlesand concentrated by centrifugation using a Sorvall RC-5B plussuperspeed centrifuge (Thermo Electron Corp., Asheville, NC) at9000 g for 15 min. Pellets were resuspended in remaining liquid(~5–25 ml) after supernatant aspiration. Concentrations obtainedwere approximately 6-fold as determined by DNA measurements(260 nm) taken with NanoDrop spectrophotometer (NanoDropTechnologies, Wilmington, DE) before and after centrifugation.
2.2. Chemical parameters
Holly Springs WWTF assayed influent for fecal coliforms (CFU/100 ml), BOD (biological oxygen demand, mg/l), TSS (totalsuspended solids, mg/l), ammonia (mg/l), total P (phosphorus,
Table 1Mitochondrial real-time PCR primers and probes
Primer orprobea
Nucleotide sequence (5 to 3′) Tm(°C)
Locationwithintargetb
Ampliconsize (bp)
Dog forward GGCATGCCTTTCCTTACAGGATTC 58.2 1144–1167 102Dog reverse GGGATGTGGCAACGAGTGTAATTATG 57.9 1227–1245Dog probe TCATCGAGTCCGCTAACACGTCGAAT 61.2 1184–1209Cat forward AACTATTCATCGGCTGAGAGGCA 58.1 416–438 143Cat reverse GCTATGATGAAGCCTACGTCTCCAAAG 58.9 537–560Cat probe ATGCAAACACTGCCGCCCTACAAGCAAT 64.5 488–515Canada goosefor
CTAACATCCAAATCCCTCGACCCA 58.5 430–453 77
Canada gooserev
TCCTATTCAGCCTCCTAGTGCTCT 58.8 484–507
Canada gooseprobe
TACTCACCGCCATAGCCCTAGCCT 63.1 458–482
Deer forward TAACCCGATTCTTCGCCTTCCTCT 59.7 524–547 122Deer reverse GTCTGCGTCTGATGGAATTCCTGAT 58.8 624–648Deer probe CCTCCCATTTATCATCGCAGCACTTGCT 62.3 592–579
a Primers and probeswere designed using IDT Primer Questsm program (http://scitools.idtdna.com/Primerquest/) and adjusted for mismatch amplification mutation assay(MAMA) (Cebula et al., 1995) in primers and species-specificity in probes. The dual-labeled probes were conjugated at the 5′ ends with Quasar 670 for cat and deer and FAMfor dog and C. goose. The probe 3′ ends utilized Black Hole quenchers (BioSearchTechnologies; Novato, CA).
b Positions of the oligonucleotides are listed relative to the numbering of gene ND5(dog and cat), ND2 (C. goose) and cytb (deer) in VectorNTI version 10.1 (2005, InvitrogenCorp). Nucleotide sequences were retrieved from GenBank™ (http://www3.ncbi.nlm.nih.gov) under accession numbers AY656739 (dog), NC_1700 (cat), NC_007011 (C. goose), andDQ379370 (deer).
Please cite this article as: Caldwell, J.M., Levine, J.F., Domestic wastewatracking animal contamination, J. Microbiol. Methods (2009), doi:10.101
mg/l), and total N (nitrogen, mg/l) according to Standard Methods18th edition (AWWA et al., 1992). South Cary WWTF assayed foralkalinity (mg/l), TSS, TVSS (total volatile suspended solids, mg/l),ammonia, BOD, TKN (total Kjeldahl nitrogen, mg/l), NOx (nitrate+nitrite nitrogen, mg/l), total N, total P and pH (SU) according toStandard Methods 20th edition (AWWA et al., 1999). Both facilitiestest chemical parameters from composite influent samples on adaily basis to monitor process controls for the National PollutantDischarge Elimination System (NPDES, 2008), (http://cfpub.epa.gov/npdes/home.cfm?program_id=13).
2.3. Spectrophotometric parameters
A NanoDrop spectrophotometer (NanoDrop Technologies,Wilmington, DE) was used to assess influent samples before andafter concentration by centrifugation (initial and final readings,respectively) (Table 3). Wavelengths of 260, 600 and 340 nm wererecorded, corresponding to DNA concentration, bacterial cultureoptical density (OD600) and humic acid concentration (Lakay et al.,2007), respectively.
2.4. DNA extraction
Influent samples were frozen at −20 °C overnight then thawed at55 °C. One ml aliquots were heated at 99 °C, 300 rpm for 5 min. Thisformed a crude DNA preparation suitable for real-time PCR.
2.5. Primer and probe design
Three species-specific primer and dual-labeled probe sets (human,bovine, and swine) specific for amplification of mitochondrial geneNADH dehydrogenase subunit 5 (ND5) for a multiplex real-time PCRassay were previously published (Caldwell et al., 2007): humanforward primer (5′-CAG CAG CCA TTC AAG CAA TGC-3′), humanreverse primer (5′-GGT GGA GAC CTA ATT GGG CTG ATT AG-3′),human probe (5′-TAT CGG CGA TAT CGG TTT CAT CCT CG-3′), bovineforward primer (5′-CAG CAG CCC TAC AAG CAA TGT-3′), bovinereverse primer (5′-GAG GCC AAA TTG GGC GGA TTA T-3′), bovineprobe (5′-CAT CGG CGA CAT TGG TTT CAT TTT AG-3′), swine forwardprimer (5′-ACA GCT GCA CTA CAA GCA ATG C-3′), swine reverseprimer (5′-GGA TGT AGT CCG AAT TGA GCT GAT TAT-3′), and swineprobe (5′-CAT CGGAGACAT TGGATT TGT CCTAT-3′). The dual-labeledprobes were conjugated with Quasar 570, Cal Red, and FAM at the 5′ends for human, bovine, and swine probe, respectively. The probe 3′ends utilized Black Hole quenchers (BioSearch Technologies; Novato,CA).
New species-specific primers and probes for real-time PCR(singleplex) were developed using Primer Quest software (http://scitools.idtdna.com/Primerquest/) for amplification of mitochon-drial genes NADH dehydrogenase subunit 5 (ND5) for dog and cat,ND2 for Canada goose, and cytochrome b (cytb) for white-taileddeer (Table 1). All primers, including those previously published,were adjusted for mismatch amplification mutation assay (Cebulaet al., 1995) utilizing penultimate primer mismatch kinetics toincrease their specificity. Primers were purchased from IDT (http://www.idtdna.com). Dual-labeled probes were purchased fromBioSearch (www.biosearch.com) with 3′ black hole quenchers,(BHQ), and 5′fluorophores Quasar 570, Cal Red, and Quasar 670corresponding to Cy3, Texas Red and Cy5, respectively (Table 1). Alloligonucleotides were reconstituted in TE buffer (pH 7.5) and storedat −20 °C prior to use.
2.6. Standard curves and assay specificity
Standard curves were generated using 10-fold serial dilutions(107–100) of mtDNA copies produced from double PCR amplifications
ter influent profiling using mitochondrial real-time PCR for source6/j.mimet.2008.11.007
3J.M. Caldwell, J.F. Levine / Journal of Microbiological Methods xxx (2009) xxx–xxx
ARTICLE IN PRESS
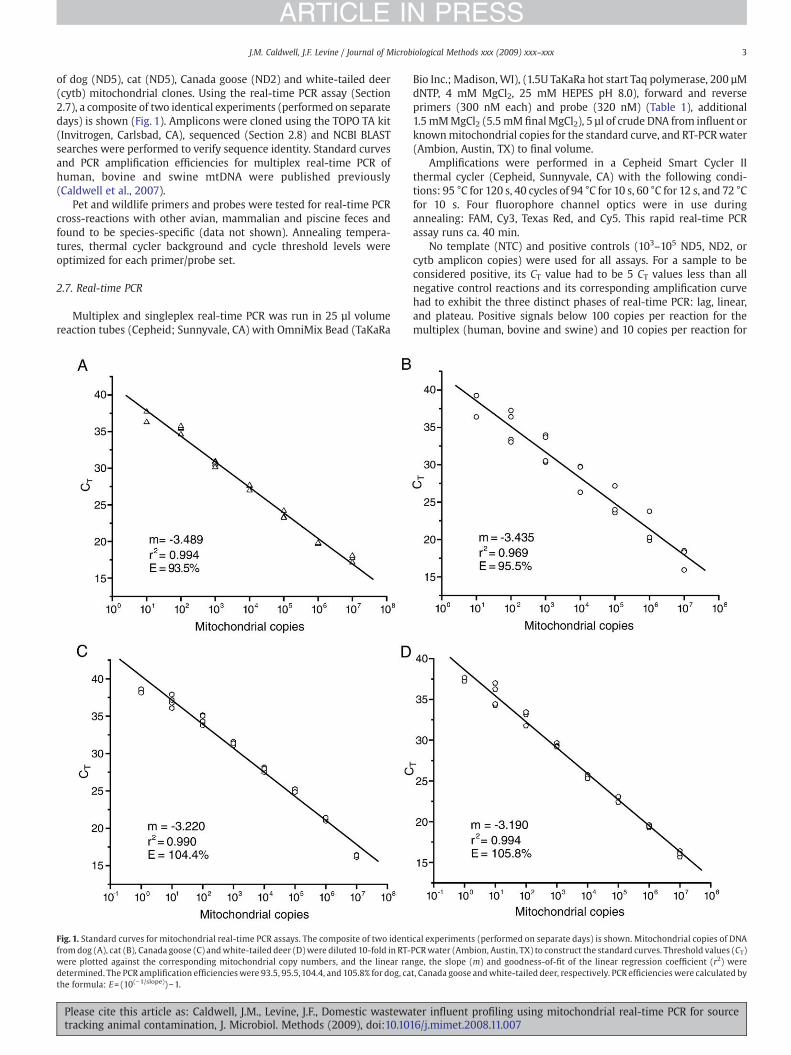
of dog (ND5), cat (ND5), Canada goose (ND2) and white-tailed deer(cytb) mitochondrial clones. Using the real-time PCR assay (Section2.7), a composite of two identical experiments (performed on separatedays) is shown (Fig. 1). Amplicons were cloned using the TOPO TA kit(Invitrogen, Carlsbad, CA), sequenced (Section 2.8) and NCBI BLASTsearches were performed to verify sequence identity. Standard curvesand PCR amplification efficiencies for multiplex real-time PCR ofhuman, bovine and swine mtDNA were published previously(Caldwell et al., 2007).
Pet and wildlife primers and probes were tested for real-time PCRcross-reactions with other avian, mammalian and piscine feces andfound to be species-specific (data not shown). Annealing tempera-tures, thermal cycler background and cycle threshold levels wereoptimized for each primer/probe set.
2.7. Real-time PCR
Multiplex and singleplex real-time PCR was run in 25 µl volumereaction tubes (Cepheid; Sunnyvale, CA) with OmniMix Bead (TaKaRa
Fig. 1. Standard curves for mitochondrial real-time PCR assays. The composite of two identfrom dog (A), cat (B), Canada goose (C) andwhite-tailed deer (D)were diluted 10-fold in RT-were plotted against the corresponding mitochondrial copy numbers, and the linear randetermined. The PCR amplification efficiencieswere 93.5, 95.5,104.4, and 105.8% for dog, cathe formula: E=(10(−1/slope))−1.
Please cite this article as: Caldwell, J.M., Levine, J.F., Domestic wastewatracking animal contamination, J. Microbiol. Methods (2009), doi:10.101
Bio Inc.; Madison,WI), (1.5U TaKaRa hot start Taq polymerase, 200 µMdNTP, 4 mM MgCl2, 25 mM HEPES pH 8.0), forward and reverseprimers (300 nM each) and probe (320 nM) (Table 1), additional1.5mMMgCl2 (5.5mM finalMgCl2), 5 µl of crude DNA from influent orknownmitochondrial copies for the standard curve, and RT-PCRwater(Ambion, Austin, TX) to final volume.
Amplifications were performed in a Cepheid Smart Cycler IIthermal cycler (Cepheid, Sunnyvale, CA) with the following condi-tions: 95 °C for 120 s, 40 cycles of 94 °C for 10 s, 60 °C for 12 s, and 72 °Cfor 10 s. Four fluorophore channel optics were in use duringannealing: FAM, Cy3, Texas Red, and Cy5. This rapid real-time PCRassay runs ca. 40 min.
No template (NTC) and positive controls (103–105 ND5, ND2, orcytb amplicon copies) were used for all assays. For a sample to beconsidered positive, its CT value had to be 5 CT values less than allnegative control reactions and its corresponding amplification curvehad to exhibit the three distinct phases of real-time PCR: lag, linear,and plateau. Positive signals below 100 copies per reaction for themultiplex (human, bovine and swine) and 10 copies per reaction for
ical experiments (performed on separate days) is shown. Mitochondrial copies of DNAPCRwater (Ambion, Austin, TX) to construct the standard curves. Threshold values (CT)ge, the slope (m) and goodness-of-fit of the linear regression coefficient (r2) weret, Canada goose andwhite-tailed deer, respectively. PCR efficiencies were calculated by
ter influent profiling using mitochondrial real-time PCR for source6/j.mimet.2008.11.007

Table 2AHolly Springs WWTF mitochondrial copies/ml influenta
Sample Human Bovine Swine Dog Cat Deer Canada goose
1 2.3×10⁴ 2.5×10⁴ 0 ⁎ ⁎ 0 02 1.3×10⁵ 5.5×10⁴ 1.5×10⁴ ⁎ 0 0 03 1.1×10⁵ 4.3×10³ 0 ⁎ 0 ⁎ 04 1.4×10⁵ ⁎ ⁎ 8.9×10² 0 0 05 2.5×10⁵ 1.9×10⁵ 0 3.7×10² 0 0 06 2.1×10⁴ 1.3×10⁵ 0 8.3×10² 0 0 07 2.0×10⁵ 3.6×10⁴ 0 4.4×10² 0 0 08 3.8×10⁴ 3.9×10⁴ 7.6×10³ 7.8×10² 0 0 ⁎
9 1.7×10⁵ 8.0×10⁴ 0 7.7×10² 0 ⁎ ⁎
10 1.9×10⁵ 2.5×10⁴ 0 ⁎ 0 0 011 8.9×10⁴ 0 0 3.1×10³ 0 7.9×10² 012 3.7×10⁴ 0 0 4.3×10² 0 0 3.8×10²
Mean 1.2×10⁵ 4.8×10⁴ 1.9×10³ 6.4×10² 0 6.6×101 3.1×101
SD 0.8×10⁵ 5.8×10⁴ 4.6×10³ 8.6×10² 0 2.3×10² 1.1×10²
Italics = Only 1 out of 3 reps had CTN0. ⁎Positive reading below predetermined lowerlimits (Section 2.7).
a Detection of mtDNA in crude preparations of domestic and light industrialwastewater influents taken weekly from 1/9/07 to 6/26/07. DNA was extracted usingfreeze/thaw method followed by heating at 99 °C, 300 rpm for 5 min and assayed bymultiplex real-time PCR (human, bovine, swine) or singleplex real-time PCR (dog, cat,deer, Canada goose) using species-specific primer and probe sets. All numbers correctedby concentration factors.
Table 2BSouth Cary WWTF mitochondrial copies/ml influenta
Sample Human Bovine Swine Dog Cat Deer Canada goose
1 2.2×10³b 0 0 ⁎ 0 0 02 5.5×10⁴ 0 0 3.3×10² 0 0 ⁎
3 3.4×10⁴ 6.2×10³ 0 5.2×10² 0 0 04 1.4×10⁵ 0 0 4.9×10² 0 0 05 4.5×10⁴ 0 0 4.9×10² 0 0 06 1.7×10⁵ 1.0×10⁵ ⁎ 6.6×10² 0 0 07 1.5×10⁵ 0 0 8.4×10² 0 0 08 4.6×10⁴ ⁎ 0 3.4×10² 0 ⁎ ⁎
9 9.1×10⁴ ⁎ 0 3.6×10² ⁎ ⁎ 010 5.9×10⁴ 1.7×10⁴ 0 2.9×10² 1.3×10³ ⁎ 011 5.5×10⁴ 2.4×10³ 0 5.0×10² ⁎ ⁎ ⁎
12 3.4×10⁴ 1.2×10³ 0 1.5×10² 0 ⁎ ⁎
Mean 7.3×10⁴ 1.1×10⁴ 0 4.2×10² 1.1×10² 0 0SD 5.3×10⁴ 2.9×10⁴ 0 2.2×10² 3.8×10² 0 0
Italics = Only 1 out of 3 reps had CTN0. ⁎Positive reading below predetermined lowerlimits (Section 2.7).
a Detection of mtDNA in crude preparations of domestic and light industrialwastewater influents taken weekly from 1/9/07 to 6/26/07. DNA was extracted usingfreeze/thaw method followed by heating at 99 °C, 300 rpm for 5 min and assayed bymultiplex real-time PCR (human, bovine, swine) or singleplex real-time PCR (dog, cat,deer, Canada goose) using species-specific primer and probe sets. All numbers correctedby concentration factors.
b 76 copies/reaction.
4 J.M. Caldwell, J.F. Levine / Journal of Microbiological Methods xxx (2009) xxx–xxx
ARTICLE IN PRESS
singleplex assays (dog, cat, Canada goose, white-tailed deer) werediscarded as noise. Internal amplification controls (IAC) wereemployed to check for PCR inhibitors: 103 copies of human ND5ampliconwere added to a sample aliquot and compared to the humanmitochondrial copy number standard curve or another IAC samplewith only water and master mix added.
2.8. Amplicon sequencing
Real-time PCR amplicons and mitochondrial clones of dog, cat,Canada goose and white-tailed deer were sequenced following therecommended protocol with the ABI BigDye v. 3.1 sequencing kit(Applied Biosystems; Foster City, CA). Sequencing reactions werepurified using an ethanol/ammonium acetate precipitation protocol(Irwin et al., 2003) and visualized using an ABI 3130XL AutomatedSequencer (Applied Biosystems, Foster City, CA). Sequences werecompiled in Sequencher version 4.5 (Gene Codes Corp., Ann Arbor, MI)andNCBI BLASTsearcheswere performed to verify sequence identities.
2.9. Statistical analyses
Amplification efficiency (E) of the PCR assay was determined forpet and wildlife primer/probe sets using the slope of the standardcurve: E=(10−1/slope)−1. Data analysis of the real-time PCR standardcurves was performed using Origin software version 7.5 (OriginLabCorp., Northampton, MA). Least squares linear regression coefficient ofdetermination (r2, goodness-of-fit) and slope were used to assess thequality of each real-time primer and probe set (Fig. 1).
Pearson correlation coefficient analysis using SAS 9.1 software wasused to compare bacterial, chemical and spectrophotometric para-meters with human, bovine, and dog mtDNA concentrations by site(Table 3).
3. Results
3.1. Linear range and amplification efficiency of real-time PCR assays
Standard curves were generated using serial dilutions of knownmitochondrial ND5, ND2 or cytb copies to determine the linear rangeand amplification efficiencies of the real-time PCR assay for dog, cat,Canada goose and white-tailed deer (Sections 2.5 and 2.6). Linearranges between 101 and 107 copies were noted for dog and cat,100 and107 for Canada goose and white-tailed deer (Fig. 1). These are
Please cite this article as: Caldwell, J.M., Levine, J.F., Domestic wastewatracking animal contamination, J. Microbiol. Methods (2009), doi:10.101
comparable to ranges in clinical real-time PCR literature. Polymerasechain reaction amplification efficiencies for dog, cat, Canada goose andwhite-tailed deer were 94, 96, 104 and 106%, respectively (Fig. 1).Linear regression coefficients (r2) were 0.99 for all standard curvesexcept for cat (r2=0.97). Linear range and efficiencies for multiplexreal-time PCR (human, bovine and swine) were determined pre-viously (Caldwell et al., 2007).
3.2. PCR assay specificity for dog, cat, Canada goose and white-tailed deer
Mitochondrial clones created for standard curves of dog, cat,Canada goose and white-tailed deer (NCBI accession numbersEU078704–EU078707) exhibited 99, 97, 98, and 97% sequence identity,respectively, to their species of origin when subjected to NCBI BLASTanalysis (data not shown). Amplicons (77–143 bp) were found to have100% identity to their designated species when subjected to NCBIBLAST analysis (data not shown). Detection of mitochondrial DNAwasspecies-specific for new primer/probe sets in fecal samples with nocross-reactions with other species tested nor human, bovine, swine,horse, sheep, goat, turkey, duck, chicken, or tilapia (data not shown).White-tailed deerwas also tested against llamawith no cross-reaction.
3.3. Mitochondrial DNA detection in influents
A freeze/thaw method followed by a brief heat treatment (99 °C,300 rpm for 5 min) was used to extract DNA from wastewaterinfluents. The heat treatment was found to improve detection resultsin complex effluent samples. Multiplex (human, bovine and swinetogether) and singleplex (dog, cat, Canada goose, and white-taileddeer separately) real-time PCR using species-specific primers andprobes were used to detect, quantify and characterize mtDNA inwastewater influents from two local municipal plants.
Human and dog mtDNA signals were detected in all 24 influentsamples taken over a period of approximately 6 months (Tables 2Aand 2B), although dog signals under 10 copies/reaction were notincluded due to previously determined lower limits (Section 2.7),(Caldwell et al., 2007). Also, sample 1 at the South Cary facilityexhibited only 76 human copies/reaction (Table 2B) which was belowthe previously set lower limit of 100 copies for human mtDNAdetection in the multiplex assay. Mean humanmtDNA copies/ml were1.2×105 and 7.3×10⁴ for Holly Springs (HS) and South Cary (SC)WWTF, respectively. Mean dog mtDNA copies/ml were approximately
ter influent profiling using mitochondrial real-time PCR for source6/j.mimet.2008.11.007
5J.M. Caldwell, J.F. Levine / Journal of Microbiological Methods xxx (2009) xxx–xxx
ARTICLE IN PRESS
200 times lower than human signal at 6.4×10² and 4.2×10²,respectively. With one exception, all human and dog replicates(three for each sample) had CT values N0. Bovine mtDNA signal(mean of both plants=3.0×10⁴ copies/ml) was less consistent having 9out of 12 and 5 out of 12 positive samples for HS and SC, respectively.Swine mtDNA (mean=1.9×10³ copies/ml for HS) was intermittent,found in only 2 positives out of 24 total samples and in only 1/3replicates in one of the 2 positive samples. The bovine signal wasapproximately 1 and the swine approximately 2 orders of magnitudelower than the human mtDNA signal. Cat mtDNA (1.1×10² copies/ml)was found only once in SC and at lower levels than dog. Deer andCanada goose signals (6.6×101 and 3.1×101 copies/ml, respectively)each had 1 positive out of 24 samples (Tables 2A and 2B).
3.4. Correlations between mtDNA concentrations and other parameters
Human mtDNA concentration (copies/ml) was positively corre-lated with ammonia concentration (P=0.01) and initial OD600 reading(P=0.02) at Holly Springs WWTF only (Table 3). Bovine mtDNA waspositively correlated with biological oxygen demand (BOD) (P=0.02),final DNA concentration (P=0.03), initial and final humic acid (P=0.01,P=0.01), and final OD600 (P=0.03) at Holly Springs WWTF and totalsuspended solids (TSS) (P=0.04, P=0.09) at HS and SC plant,respectively. Fecal coliforms were not correlated with mtDNA of anyspecies assayed. No other significant (Pb0.05) correlations wereapparent in influents from the South Cary (SC) facility.
4. Discussion
Wastewater treatment systems use a variety of vital biotechnolo-gical and natural processes to treat fecal waste and render the liquidssafe for release into local streams or land applications. If a wastewatersystem fails due to environmental catastrophes, mechanical malfunc-tions or mismanagement, methods are required to trace the locationand extent of the breach. However, when enteric organisms aredocumented in surface waters, their origin is sometimes not readilyapparent or difficult to pinpoint with bacterial methods (Yan et al.,2007). Amplification of eukaryotic mitochondrial DNA (mtDNA)identifies the source directly and can be used after culture andchemical methods to characterize contaminants. We used real-timePCR to characterize and quantify mtDNA in domestic wastewaterinfluent (untreated sewage) using primer/probe sets for human,bovine, swine, dog, cat, Canada goose and white-tailed deer. Thesespecies mtDNA values provide a baseline for identifying unintentionaldischarges of influent from domestic wastewater facilities and
Table 3Comparison of influent parameters at Holly Springs WWTF
Mitochondrial copies/ml influent
Human Bovine
r P r P
Fecal coliforms (CFU/ml) 0.31 0.32 −0.05 0.88BOD (mg/l) 0.09 0.79 0.66 0.02TSS (mg/l) 0.19 0.55 0.60 0.04Ammonia (mg/l) 0.70 0.01 0.43 0.16Final DNA (260 nm) 0.23 0.47 0.62 0.03Initial humic acid (340 nm) 0.43 0.17 0.68 0.01Final humic acid (340 nm) 0.37 0.24 0.69 0.01Initial OD600 0.65 0.02 0.15 0.64Final OD600 0.56 0.06 0.64 0.03
r = Pearson correlation coefficient; Pb0.05 in bold type (N=12). Dog mitochondrialcopies/ml influent showed no significant positive or negative correlations. Total P, totalN and initial DNA concentration showed no significant positive or negative correlationswith either human or bovine mitochondrial copies/ml influent. Initial and final refer tobefore and after centrifugation, respectively. South Cary WWTF had no correlations atPb0.05. BOD = Biological oxygen demand; TSS = total suspended solids.
Please cite this article as: Caldwell, J.M., Levine, J.F., Domestic wastewatracking animal contamination, J. Microbiol. Methods (2009), doi:10.101
differentiating among other mammalian effluents such as hog lagoonwastes or dairy barn run-off. Mitochondrial DNA shed from theepithelial cells of eukaryotic hosts can be used in conjunction withmore traditional bacterial source tracking methods to directly identifythe fecal source contaminating environmental surface waters.
The triplex mitochondrial real-time PCR assay (human, bovine,swine) was used previously to quantify animal waste effluents(Caldwell et al., 2007). Human signal was diluted 115-fold in domesticwastewater: 1.1×10⁷ copies/g feces (Caldwell et al., 2007) comparedto 9.6×10⁴ copies/ml influent, (mean value of two WWTF influents,Tables 2A and 2B). In the same article, carry-over mtDNA signal frombeef consumed was found in human feces at least two orders ofmagnitude less than the signal for human mtDNA (2×10⁴ and3×105 copies/g feces). Bovine signal is similar in domestic wastewater(mean of both plants=3.0×10⁴ copies/ml, Tables 2A and 2B) ascompared to human carry-over mtDNA in feces. Bovine mtDNAconcentration shows no dilution in influent, as is the case with humanmtDNA. Swine mtDNA exhibited no carry-over signal in human feces(Caldwell et al., 2007) but averaged 1.9×10³ copies/ml influent in twoout of 24 samples. Therefore, real-time PCR signals from bovine andswine mtDNA in domestic wastewater are probably primarily fromfood waste flushed down the sink and not carryover in feces.
The most surprising result of these effluent profiles was the con-sistent signal from dog mtDNA in domestic wastewater. TheHumane Society of the United States (http://www.hsus.org/pets/issues_affecting_our_pets/pet_overpopulation_and_owership_statis-tics/us_pet_ownership_statistics.html) cites 73 million owned dogs inthe US. The American Pet Products Manufacturers Association statesthat 45% of dogs in the 2000 census were large dogs of 40 lb or more(http://www.usatoday.com/news/science/2002-06-07-dog-usat.htm). Therefore, the potential for large volumes of dog waste isindisputable; but apparently many dog owners flush dog wastedown the sanitary drain. In many suburban areas, dog owners arerequired to pick up their pet's feces. Toilet disposal of this wastemay account for this consistent dog mtDNA signal in domesticinfluent. Cat mtDNA signal only occurred once in 24 samples.Therefore, cat owners are not flushing cat waste as often as dogowners, the total volume of cat feces is considerably less thancanine feces, or total cat mtDNA is below detectable levels for real-time PCR.
Canada goose and white-tailed deer mtDNA were intended to benegative controls for these domestic wastewater influent studies.However, each wild species had one positive sample in HS plant(Table 2A). Although, the goose mtDNA signal was positive in only 1out of 3 replicates of the same sample (Table 2A). Chimeric ampli-fication of complex DNA mixtures could give spurious results such asthese. Low, intermittent, and inconsistent (only one positive out ofthree replicates) real-time PCR signals should be evaluated conser-vatively. Due to small sampling size and complex biological back-grounds, it can be challenging to assess environmental samples withquantitative molecular techniques.
Human mtDNA can be attributed to human feces and possiblybath or wash water from homes and small businesses. Bovine andswine signal might come from human feces carry-over (Caldwellet al., 2007) but more likely from meats, grease and animal productswashed down kitchen drains. Dog signal is not as strong as human,bovine or swine signal, but consistent at ca. 102 copies/ml influentand is probably a result of flushing of dog feces in household toiletsafter daily walks and “accidents”. Cat signal comes from flushingfeces from the cat box; the lower amounts for cat might reflect lowerfeces weights of the smaller mammals. Deer and Canada goose signalwere not expected and could be caused by chimeric PCR amplifica-tion. For source tracking purposes, a combination of human(105 copies/ml) and dog mtDNA signal (102 copies/ml) could beindicative of municipal domestic wastewater contamination ofenvironmental waters.
ter influent profiling using mitochondrial real-time PCR for source6/j.mimet.2008.11.007

6 J.M. Caldwell, J.F. Levine / Journal of Microbiological Methods xxx (2009) xxx–xxx
ARTICLE IN PRESS
Other researchers (Plummer and Long, 2007) have demonstratedstatistically that one measure each of particulate matter (turbidity,particle counts), organic matter (total organic carbon, dissolved organiccarbon, UV254 absorbance), and indicator organisms (fecal coliforms,enterococci) was adequate for characterizing source water quality. Inthis study, ammonia concentration at one WWTF exhibited a strongpositive correlation with human mtDNA concentration. Neither humannor bovine mtDNA concentration exhibited a significant correlationwith fecal coliforms (Table 3). Yet, human mtDNA showed a strongpositive correlation to initial OD600 reading (P=0.02) and bovinemtDNAlikewise to final OD600 reading (P=0.03). We interpret this as a strongcorrelation to total bacteria in the influent, since OD600 is commonlyused to quantify bacterial cell concentrations in cultures. However, it ispossible that TSS (total suspended solids) could confound the OD600
reading. Bovine mtDNA also had strong positive correlations with TSS(P=0.04), final DNA (P=0.03), initial and final humic acid (P=0.01 forboth) while human mtDNA did not. Correlations with total suspendedsolids and both humic acid readings point to discarded food products asthe primary source for bovine mtDNA. Strong ammonia and initialOD600 correlations suggest human waste, urine and feces, respectively,as the primary indicators or components of human mtDNA.
Humic acid concentration can be calculated from standard curvesand absorbancy readings at 340 nm (Lakay et al., 2007). We used340 nm as a quick indicator of humic acid, an organic contaminant andpotential PCR-inhibitory compound that can co-purify with DNA. Wefound no PCR inhibition as tested by internal amplification controlsand therefore could not relate inhibition to humic acid concentration.
No significant correlations between mtDNA concentrations andother influent parameters were noted at the South Cary WWTF. Thiscould reflect variations in laboratory techniques or personnel, or theinfluent compositions from each site.
This study provides a baseline profile of domestic wastewaterinfluent for mtDNA-based differentiation of sources of fecal contam-ination. Further studies are needed to create mtDNA profiles ofresidential septic systems, agricultural and wildlife sources of fecalcontamination. Comparison of these profiles with other molecular,bacterial, chemical and spectrophotometric parameters will refine ourability to source track fecal contamination in surface waters.
Acknowledgments
Funds supporting these studies were provided by the United StatesDepartment of Agriculture Cooperative State Research, Education andExtension Service (USDA CSREES); National Research Initiative
Please cite this article as: Caldwell, J.M., Levine, J.F., Domestic wastewatracking animal contamination, J. Microbiol. Methods (2009), doi:10.101
Epidemiological Approaches to Food Safety Program and the USDACSREES supported Food Safety Research and Response Network: aUSDA Cooperative Agricultural Project. We thank Leisha Collins andTony Szempruch for their assistance in the collection and processingof influent; Amy Moore and the staff of the Town of Holly SpringsDepartment of Water Quality, Cecil Martin and Kelly Spainhour of theSouth Cary Water Reclamation Facility for influent samples andinfluent chemical data.
References
Andreasson, H., Gyllensten, U., Allen, M., 2002. Real-time DNA quantification of nuclearand mitochondrial DNA in forensic analysis. BioTechniques 33, 407–411.
AWWA, APHA, WEF, 1992. Standard Methods for the Examination of Water andWastewater, 18th ed.
AWWA, APHA, WEF, 1999. Standard Methods for the Examination of Water andWastewater, 20th ed.
Caldwell, J.M., Raley, M.E., Levine, J.F., 2007. Mitochondrial multiplex real-time PCR as asource tracking method in fecal-contaminated effluents. Environ. Sci. Technol. 41,3277–3283.
Cebula, T.A., Payne, W.L., Feng, P., 1995. Simultaneous identification of strains ofEscherichia coli serotype O157:H7 and their shiga-like toxin type by mismatchamplification mutation assay-multiplex PCR. J. Clin. Microbiol. 33, 248–250.
Gerber, A.S., Loggins, R., Kumar, S., Dowling, T.E., 2001. Does nonneutral evolutionsshape observed patterns of DNAvariation in animal mitochondrial genomes? Annu.Rev. Genet. 35, 539–566.
Irwin, D.L., Mitchelson, K.R., Findlay, I., 2003. PCR product cleanup methods for capillaryelectrophoresis. BioTechniques 34, 932–936.
Iyengar, V., Albaugh, G.P., Lohani, A., Nair, P.P., 1991. Human stools as a source of viablecolonic epithelial cells. FASEB J. 5, 2856–2859.
Lakay, F.M., Botha, A., Prior, B.A., 2007. Comparative analysis of environmental DNAextraction and purification methods from different humic acid-rich soils. J. Appl.Microbiol. 102, 1364–5072.
Martellini, A., Payment, P., Villemur, R., 2005. Use of eukaryotic mitochondrial DNA todifferentiate human, bovine, porcine and ovine sources in fecally contaminatedsurface water. Water Res. 39, 541–548.
National Pollutant Discharge Elimination System. 2008. U.S. EPA.Plummer, J.D., Long, S.C., 2007. Monitoring source water for microbial contamination:
evaluation of water quality measures. Water Res., doi:10.1016/j.watres.2007.05.004.Ram, J.L., Thompson, B., Turner, C., Nechvatal, J.M., Sheehan, H., Bobrin, J., 2007.
Identification of pets and raccoons as sources of bacterial contamination of urbanstorm sewers using a sequence-based bacterial source trackingmethod. Water Res.,doi:10.1016/j.watres.2007.04.013.
Siewicki, T.C., Pullaro, T., Pan,W., McDaniel, S., Glenn, R., Stewart, J., 2007. Models of totaland presumed wildlife sources of fecal coliforms bacteria in coastal ponds. J.Environ. Manag. 82, 120–132.
Somarelli, J.A., Makarewicz, J.C., Sia, R., Simon, R., 2007. Wildlife identified as majorsource of Escherichia coli in agriculturally dominated watersheds by BOX A1R-derived genetic fingerprints. J. Environ. Manag. 82, 60–65.
Yan, T., Hamilton, M.J., Sadowsky, M.J., 2007. High-throughput and quantitativeprocedure for determining sources of Escherichia coli in waterways by using host-specific DNA marker genes. Appl. Environ. Microbiol. 73, 890–896.
ter influent profiling using mitochondrial real-time PCR for source6/j.mimet.2008.11.007