doing business in brazil · t pis/cofins (social contribution on gross revenue) 0.65% or 1.65% t...
TRANSCRIPT

1
DOING BUSINESSIN BRAZIL
Greece, September 2014
CESAR CUNHA CAMPOS | DIRECTOR, FGV PROJETOS
2
ABOUT FGV AND FGV PROJETOS
Fundação Getulio Vargas (FGV) was founded in 1944
FGV is the leading Think Tank in Latin America and Top 25 in the world
Mission: boost the socioeconomic development of Brazil and increase its important role in the international scene
FGV’s technical advisory unit to public, private and third-sector institutions in Brazil and abroad
Develops projects in different areas: economics, administration, and public policy
30 years experience
Over 1300 projects developed
3
1. INVESTMENT CLIMATE
BRAZIL OVERVIEW
GLOBAL COMPETITIVENESS
TAXATION
TRADE PROFILE BRAZIL
2. TRADE: BRAZIL, EUROPEAN UNION AND GREECE
BRAZIL - EUROPEAN UNION
BRAZIL - GREECE
3. CONCLUSION
WHY DOING BUSINESS IN BRAZIL
GOVERNMENT SUPPORT PARTNERS
AGENDA
4
1. INVESTMENTCLIMATE
5
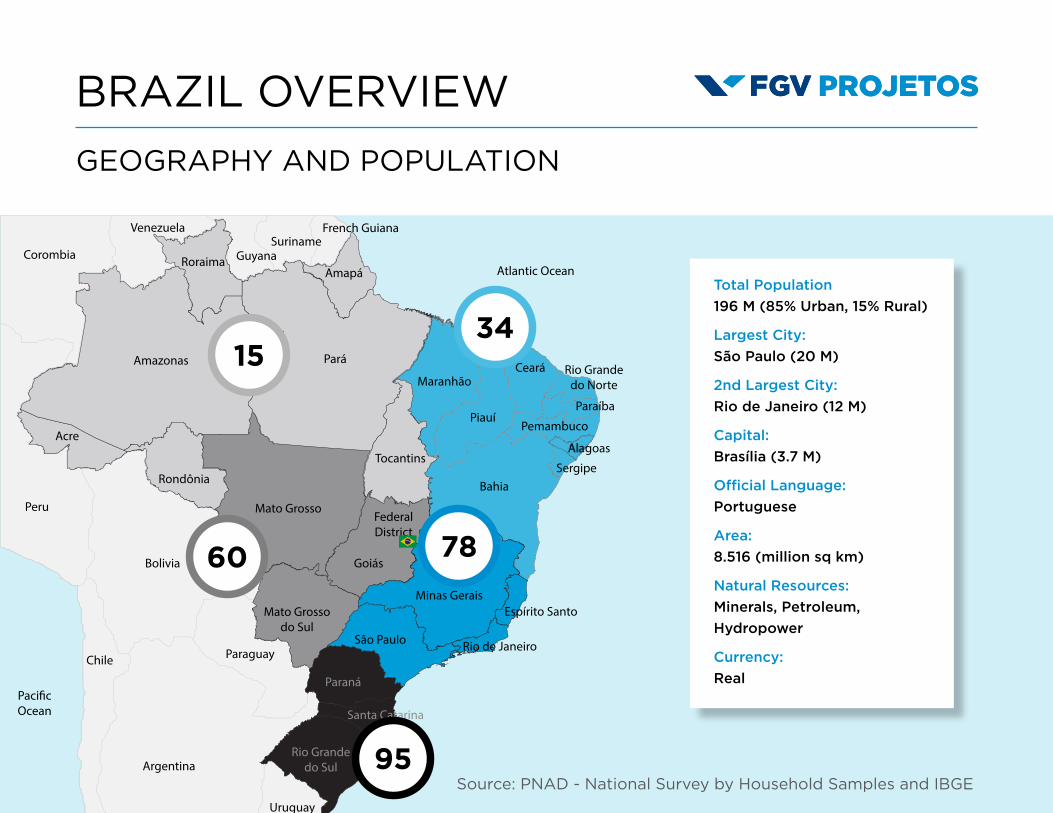
BRAZIL OVERVIEW
Source: PNAD - National Survey by Household Samples and IBGE
GEOGRAPHY AND POPULATION
15
60
95
78
34
Total Population
196 M (85% Urban, 15% Rural)
Largest City:
São Paulo (20 M)
2nd Largest City:
Rio de Janeiro (12 M)
Capital:
Brasília (3.7 M)
Official Language:
Portuguese
Area:
8.516 (million sq km)
Natural Resources:
Minerals, Petroleum,
Hydropower
Currency:
Real
6
Democratic regime, federal republic; representatives elected by
direct voting
Composed of 3 independent branches: Executive, Legislative and
Judicial
The President heads the executive branch composed of 40 Ministers
Legislative power is exerted by a National Congress consisting of
Senate (81 senators) House of Representatives (513 representatives)
Voting is compulsory from of 18 – 70
Main Ruling Parties: PT, PMDB, PSD, PSDB, PSB
BRAZIL OVERVIEW
POLITICAL SYSTEM

7
BRAZIL OVERVIEW
ELECTIONS 2014: MAIN CANDIDATES
DILMA ROUSSEFF
Economic Development with
environmental sustainability
Strategic Outlook
Party
Candidates
1st round, October 5th: All presidential candidates
2nd round, October 26th: If none of the candidates obtains majority (50%+1), then the top two candidates will run again in this round
Economic Development with
environmental sustainability
Private investment
Focus on Sustainability
AÉCIO NEVES
MARINA SILVA
7
8
BRAZIL OVERVIEW
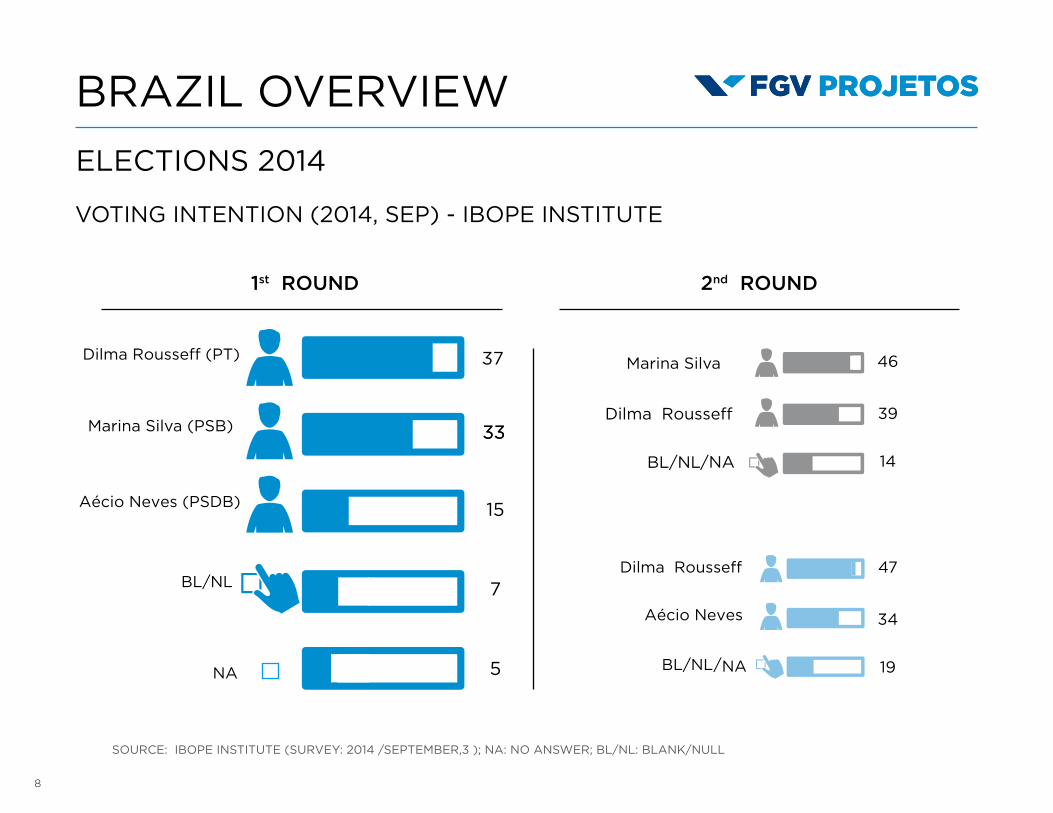
ELECTIONS 2014
VOTING INTENTION (2014, SEP) - IBOPE INSTITUTE
1st ROUND 2nd ROUND
SOURCE: IBOPE INSTITUTE (SURVEY: 2014 /SEPTEMBER,3 ); NA: NO ANSWER; BL/NL: BLANK/NULL
333339
34
14
19
46
47
7
5
15
Marina Silva (PSB)
Marina Silva
9
BRAZIL OVERVIEW
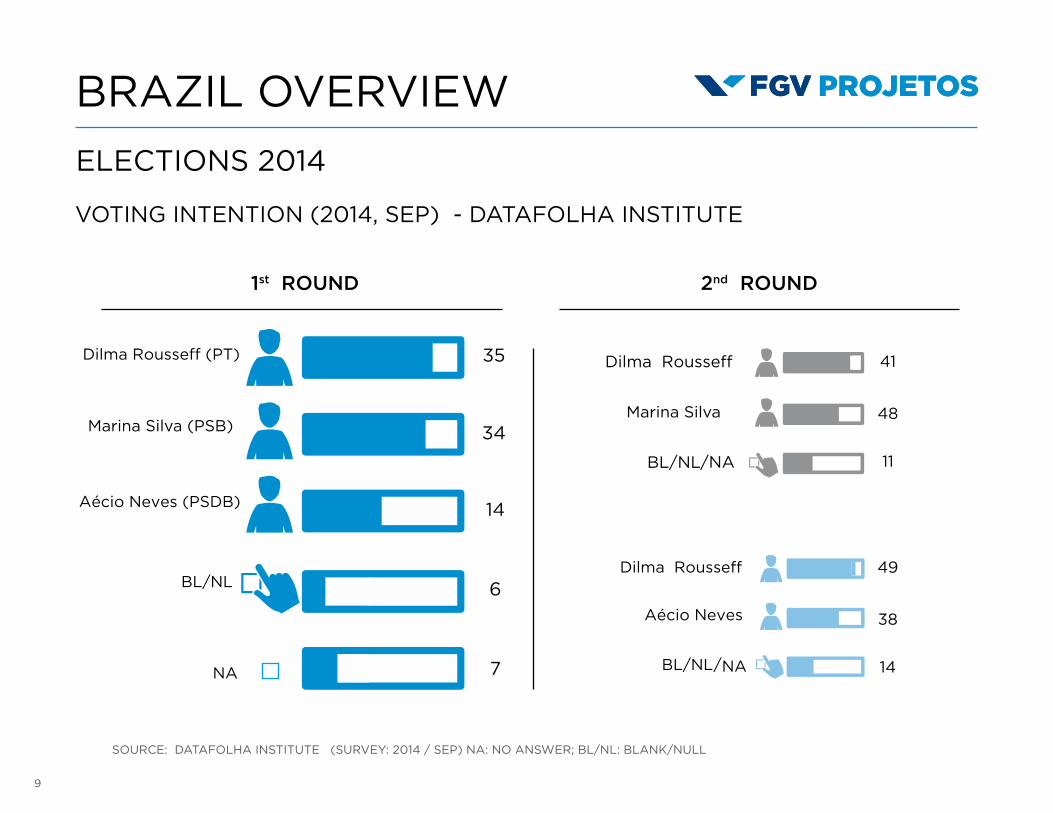
ELECTIONS 2014
VOTING INTENTION (2014, SEP) - DATAFOLHA INSTITUTE
1st ROUND 2nd ROUND
SOURCE: DATAFOLHA INSTITUTE (SURVEY: 2014 / SEP) NA: NO ANSWER; BL/NL: BLANK/NULL
34
35
48
38
11
14
41
49
6
7
14
Marina Silva (PSB)Marina Silva
10
BRAZIL OVERVIEW
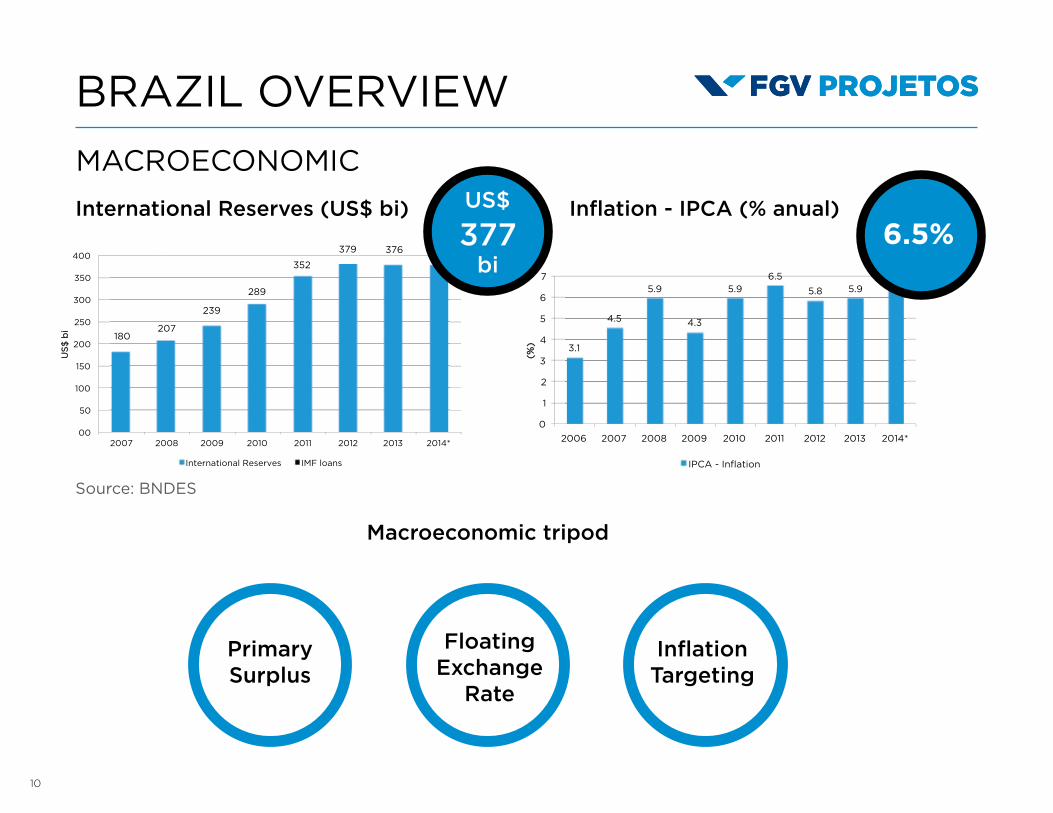
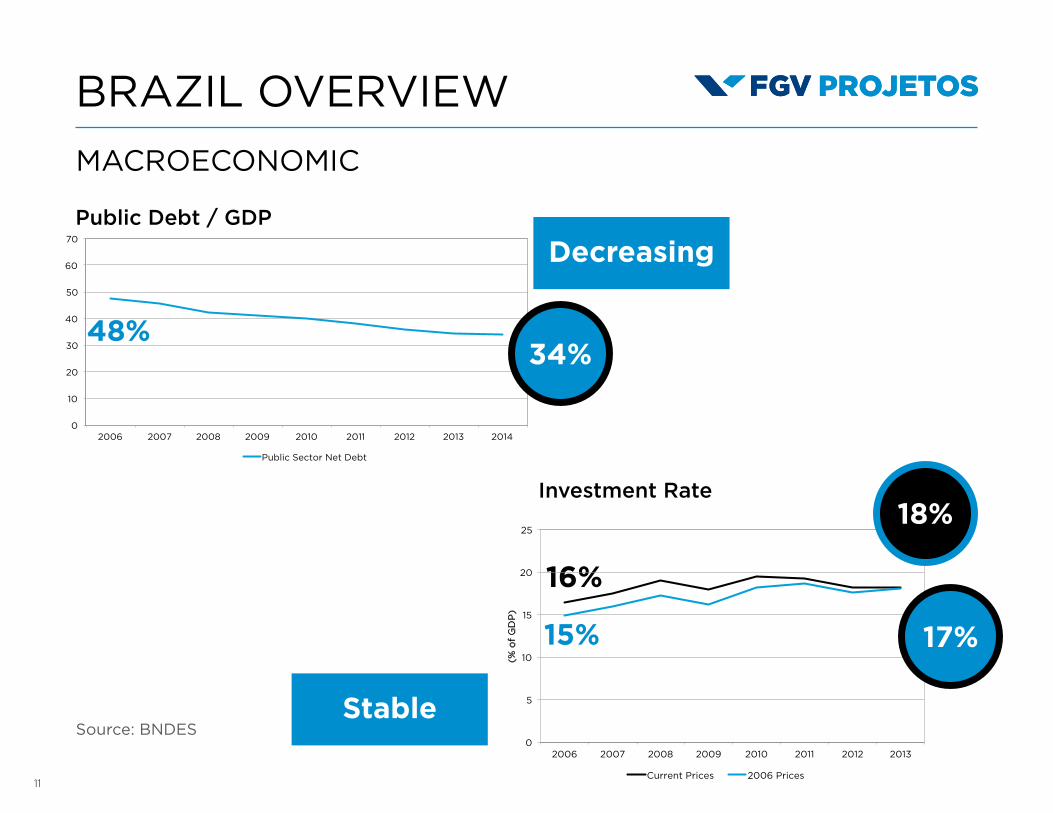
MACROECONOMIC
Source: BNDES
International Reserves (US$ bi)
Macroeconomic tripod
Inflation - IPCA (% anual)6.5%
FloatingExchange
Rate
PrimarySurplus
InflationTargeting
11
BRAZIL OVERVIEW
Investment Rate
Public Debt / GDP
MACROECONOMIC
Source: BNDES
16%
48%
15%
34%
18%
17%
Decreasing
Stable
12
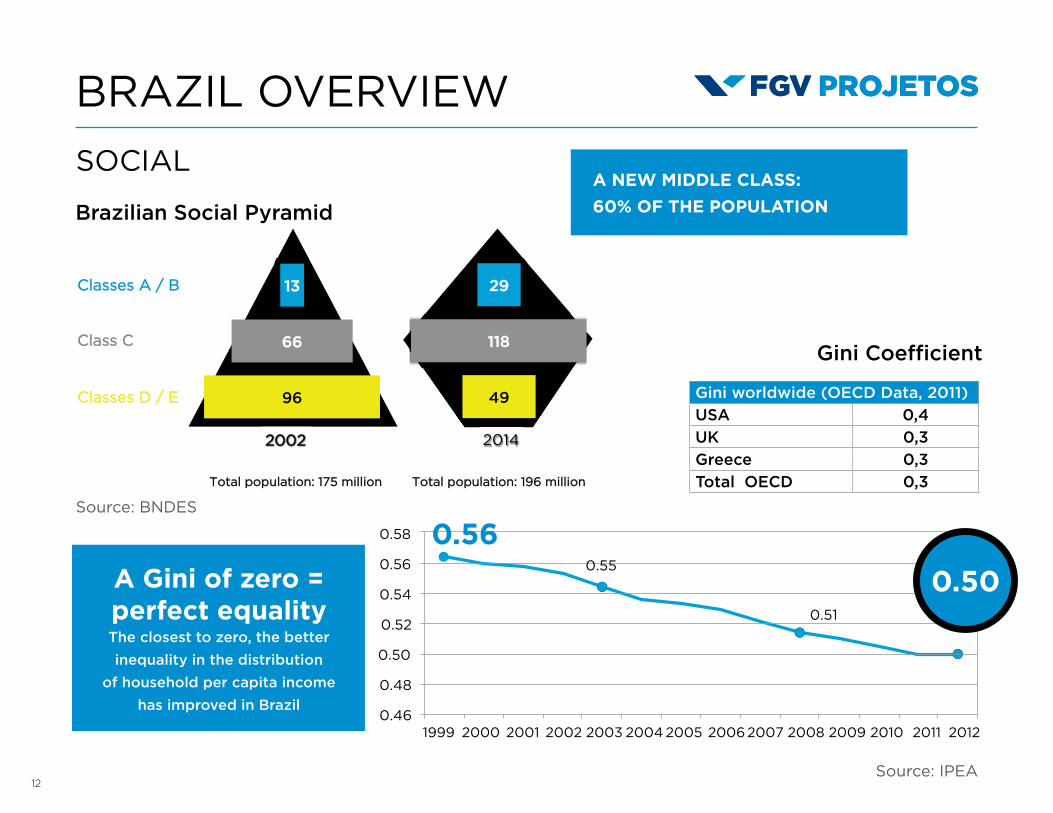
BRAZIL OVERVIEW
Brazilian Social Pyramid
Gini Coefficient
SOCIAL
Source: IPEA
Source: BNDES
0.56
0.50A Gini of zero =perfect equality The closest to zero, the better
inequality in the distribution
of household per capita income
has improved in Brazil
A NEW MIDDLE CLASS:
60% OF THE POPULATION
Gini worldwide (OECD Data, 2011)USA 0,4UK 0,3Greece 0,3Total OECD 0,3
13
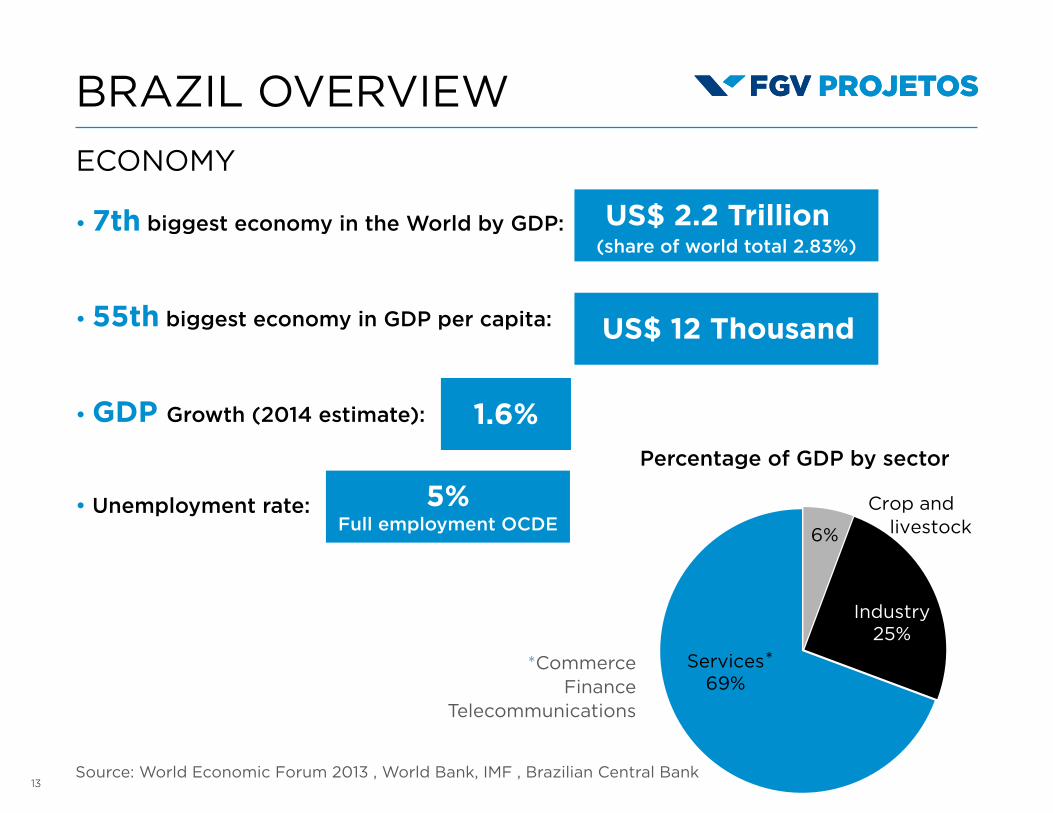
7th biggest economy in the World by GDP:
55th biggest economy in GDP per capita:
GDP Growth (2014 estimate):
Unemployment rate:
Source: World Economic Forum 2013 , World Bank, IMF , Brazilian Central Bank
US$ 2.2 Trillion
US$ 12 Thousand
(share of world total 2.83%)
Full employment OCDE
1.6%
5%
*CommerceFinance
Telecommunications
*
Percentage of GDP by sector
BRAZIL OVERVIEW
ECONOMY
14
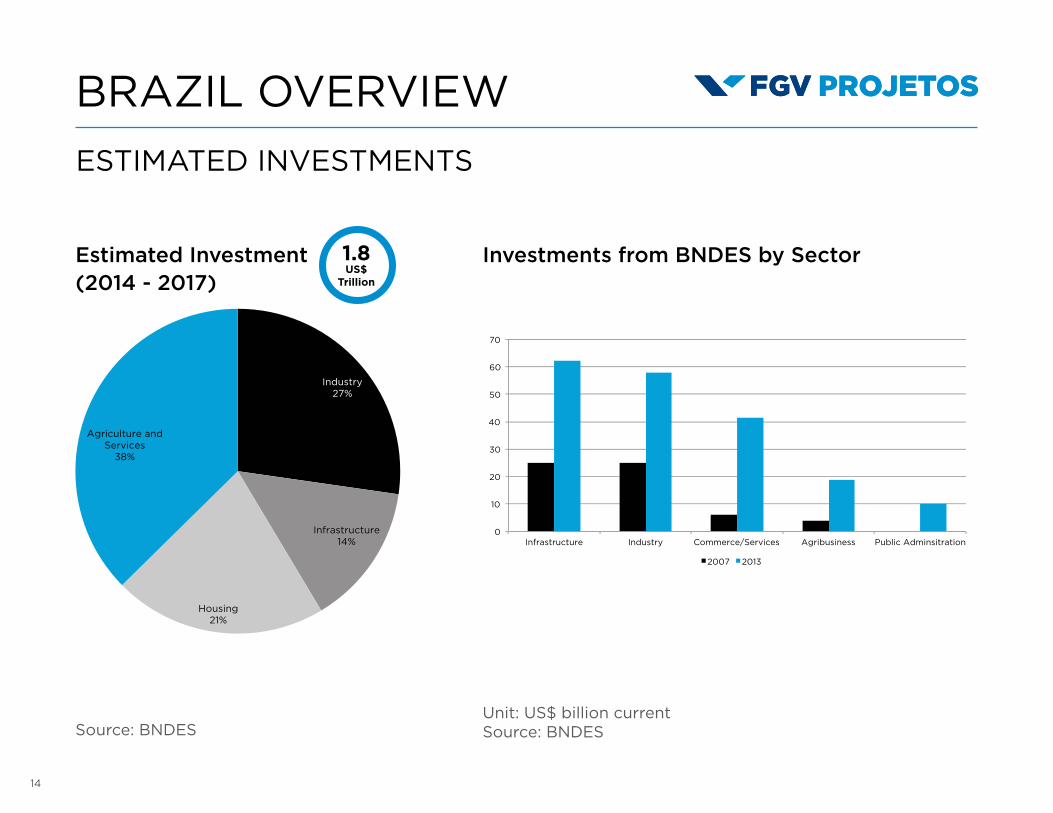
Estimated Investment(2014 - 2017)
Investments from BNDES by Sector
Source: BNDESUnit: US$ billion currentSource: BNDES
1.8US$
Trillion
BRAZIL OVERVIEW
ESTIMATED INVESTMENTS

15
During the period from 2014 to 2017, infrastructure investments amounting to US$ 261.4 billion are expected, with the following distribution amongst sectors:
The main energy-sector projects are hydroelectric plants, followed by nuclear and wind power
In telecommunications, third-generation mobile service and broadband wireless internet are at the forefront
Logistics investment is led by the railway segment followed by roadway and port projects
Infrastructure Investment Forecastedfor 2014 - 2017
Source: National Bank for Economic and Social Development (BNDES)
BRAZIL OVERVIEW
ESTIMATED INVESTMENTS
16
*
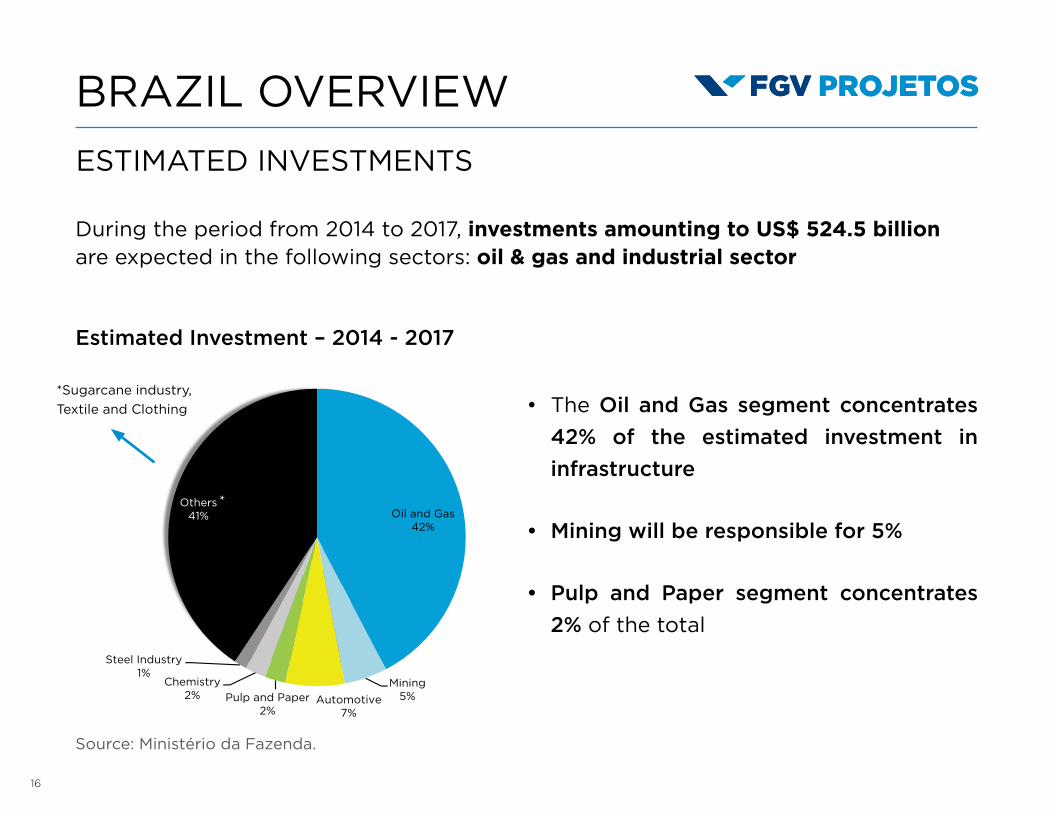
During the period from 2014 to 2017, investments amounting to US$ 524.5 billion are expected in the following sectors: oil & gas and industrial sector
Estimated Investment – 2014 - 2017
Source: Ministério da Fazenda.
The Oil and Gas segment concentrates
42% of the estimated investment in
infrastructure
Mining will be responsible for 5%
Pulp and Paper segment concentrates
2% of the total
*Sugarcane industry,
Textile and Clothing
BRAZIL OVERVIEW
ESTIMATED INVESTMENTS
17
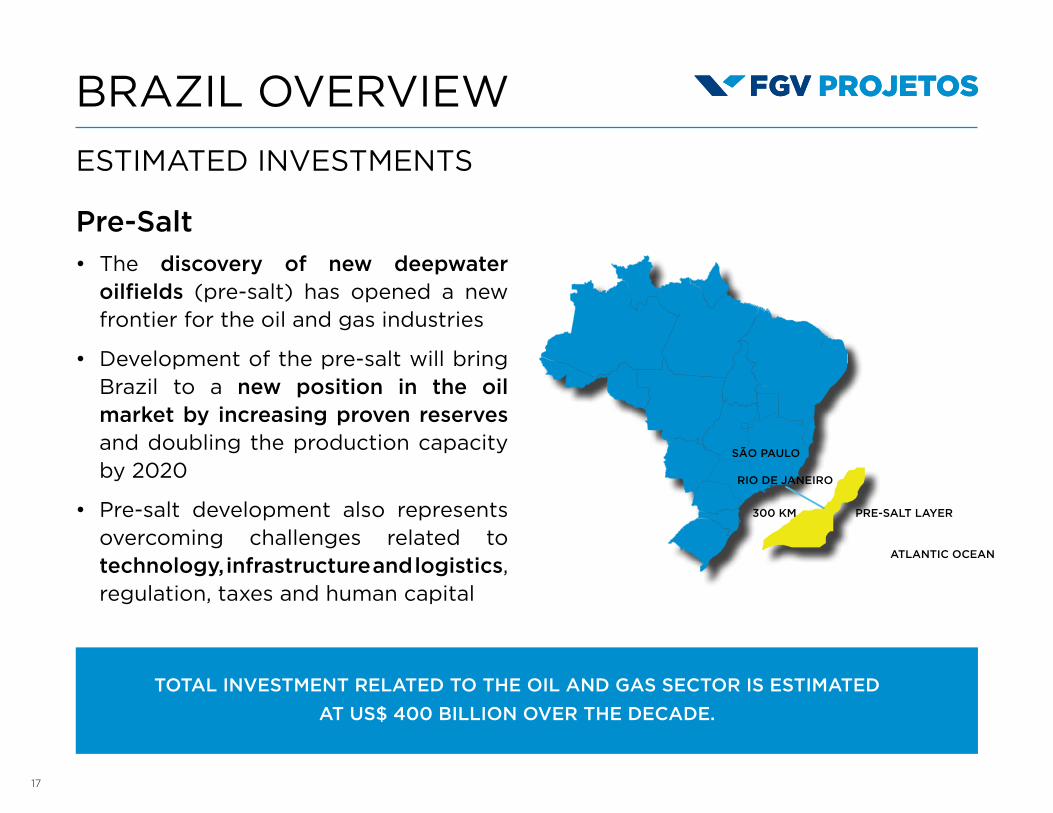
Pre-SaltThe discovery of new deepwater oilfields (pre-salt) has opened a new frontier for the oil and gas industries
Development of the pre-salt will bring Brazil to a new position in the oil market by increasing proven reserves and doubling the production capacity by 2020
Pre-salt development also represents overcoming challenges related to technology, infrastructure and logistics, regulation, taxes and human capital
TOTAL INVESTMENT RELATED TO THE OIL AND GAS SECTOR IS ESTIMATED
AT US$ 400 BILLION OVER THE DECADE.
SÃO PAULO
RIO DE JANEIRO
PRE-SALT LAYER300 KM
ATLANTIC OCEAN
BRAZIL OVERVIEW
ESTIMATED INVESTMENTS
18
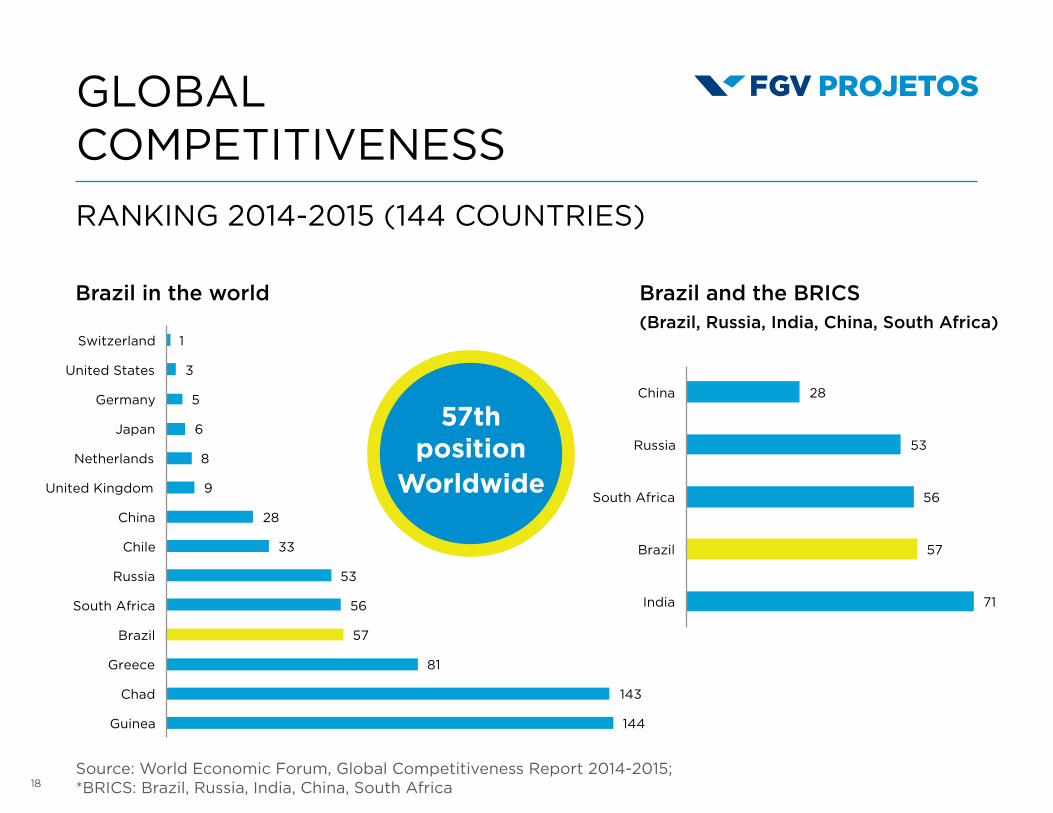
RANKING 2014-2015 (144 COUNTRIES)
GLOBALCOMPETITIVENESS
57thposition
Worldwide
Brazil in the world Brazil and the BRICS(Brazil, Russia, India, China, South Africa)
Source: World Economic Forum, Global Competitiveness Report 2014-2015;*BRICS: Brazil, Russia, India, China, South Africa
19
TAXATION
MAIN TAXES AND CONTRIBUTIONS
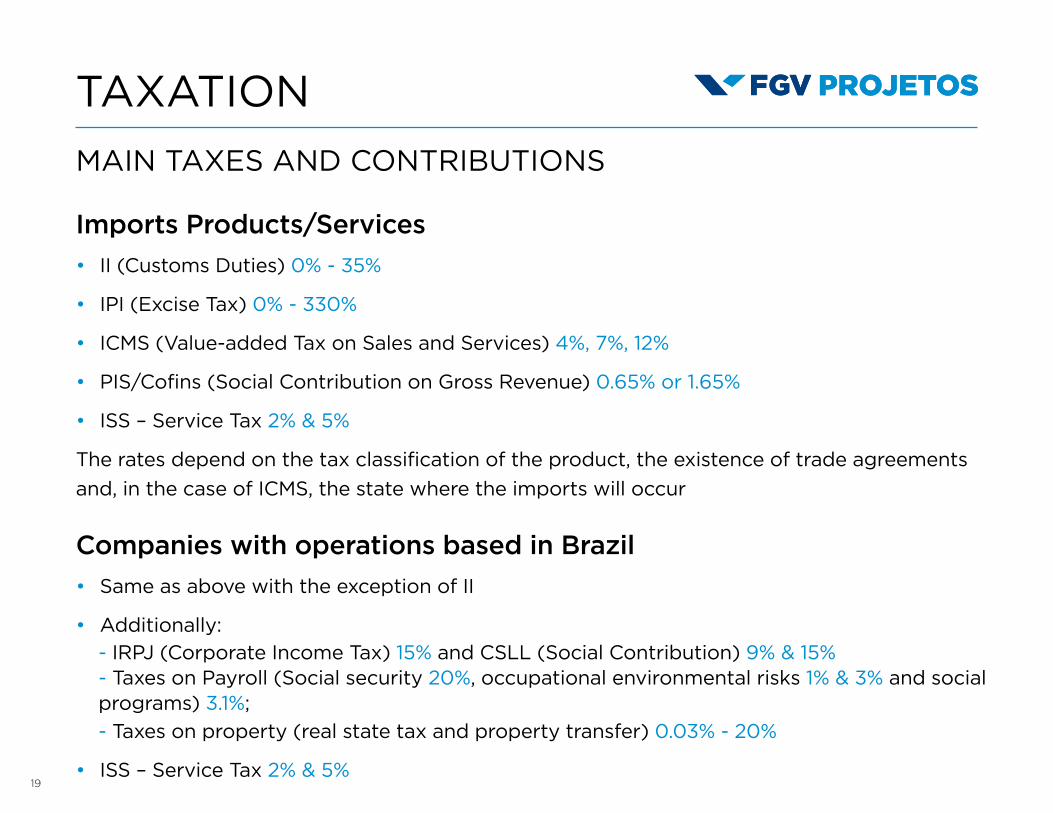
Imports Products/Services
II (Customs Duties) 0% - 35%
IPI (Excise Tax) 0% - 330%
ICMS (Value-added Tax on Sales and Services) 4%, 7%, 12%
PIS/Cofins (Social Contribution on Gross Revenue) 0.65% or 1.65%
ISS – Service Tax 2% & 5%
The rates depend on the tax classification of the product, the existence of trade agreements
and, in the case of ICMS, the state where the imports will occur
Companies with operations based in Brazil
Same as above with the exception of II
Additionally: - IRPJ (Corporate Income Tax) 15% and CSLL (Social Contribution) 9% & 15%- Taxes on Payroll (Social security 20%, occupational environmental risks 1% & 3% and social programs) 3.1%; - Taxes on property (real state tax and property transfer) 0.03% - 20%
ISS – Service Tax 2% & 5%
20
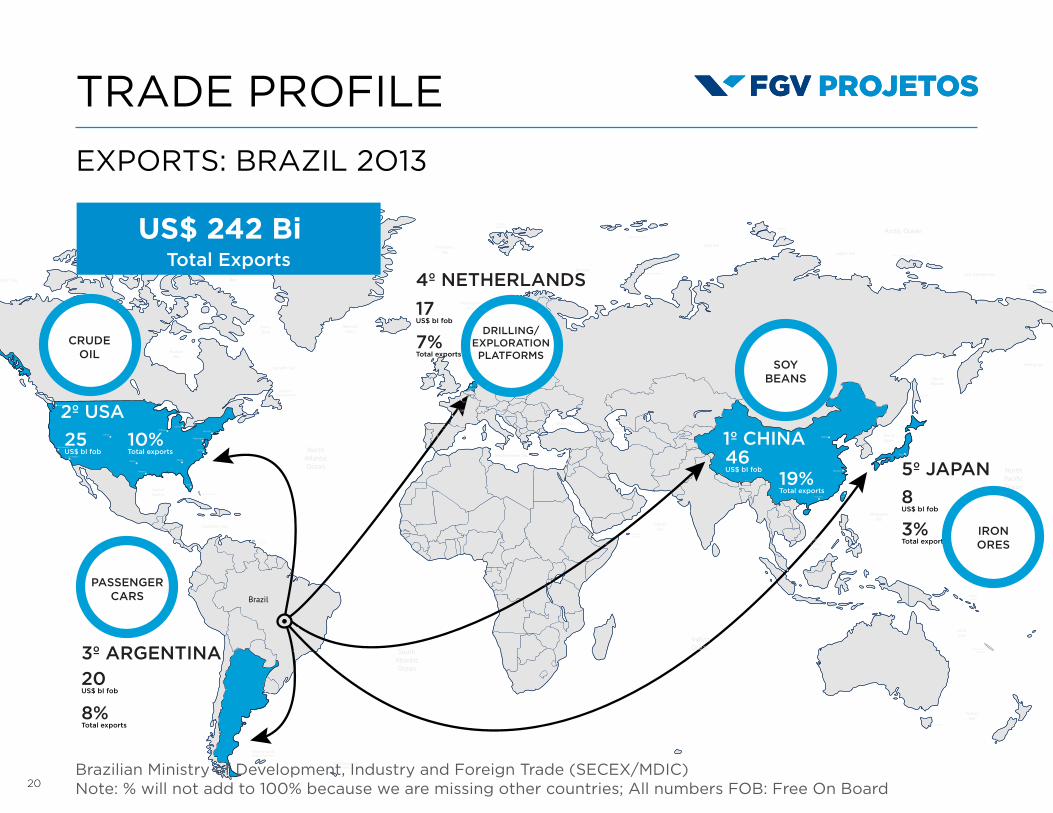
TRADE PROFILE
Brazilian Ministry of Development, Industry and Foreign Trade (SECEX/MDIC)Note: % will not add to 100% because we are missing other countries; All numbers FOB: Free On Board
EXPORTS: BRAZIL 2O13
US$ 242 BiTotal Exports
21
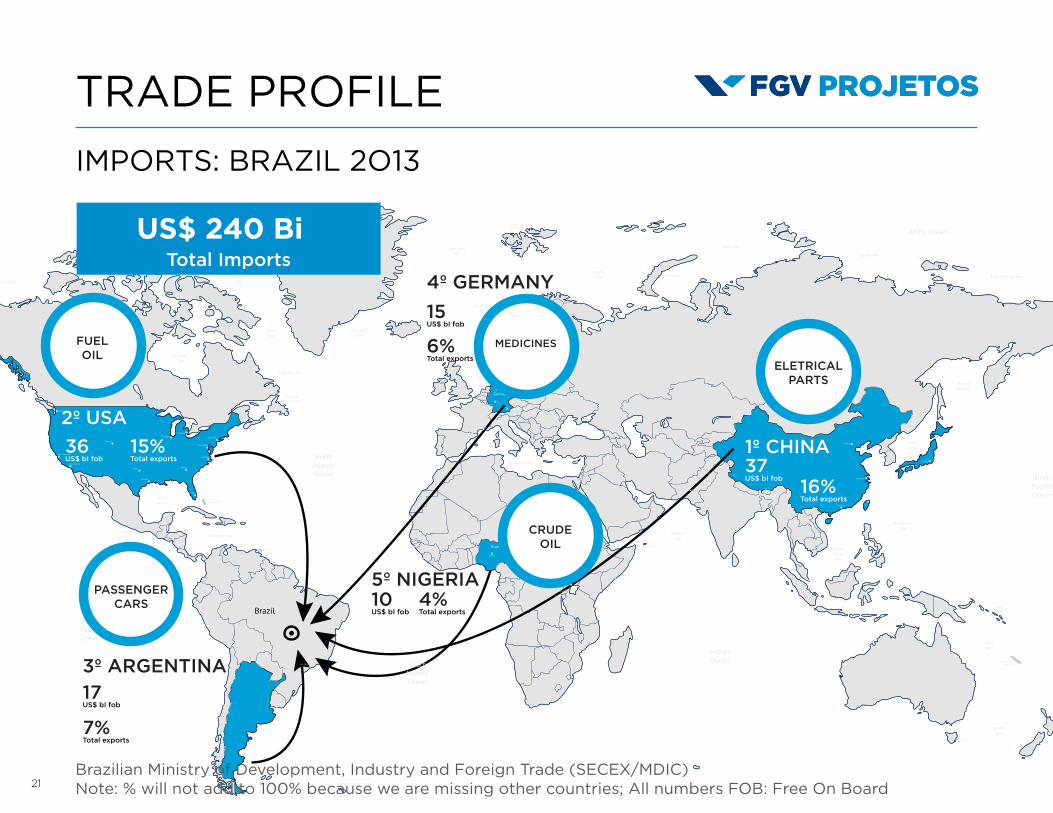
TRADE PROFILE
IMPORTS: BRAZIL 2O13
US$ 240 BiTotal Imports
Brazilian Ministry of Development, Industry and Foreign Trade (SECEX/MDIC)Note: % will not add to 100% because we are missing other countries; All numbers FOB: Free On Board
22
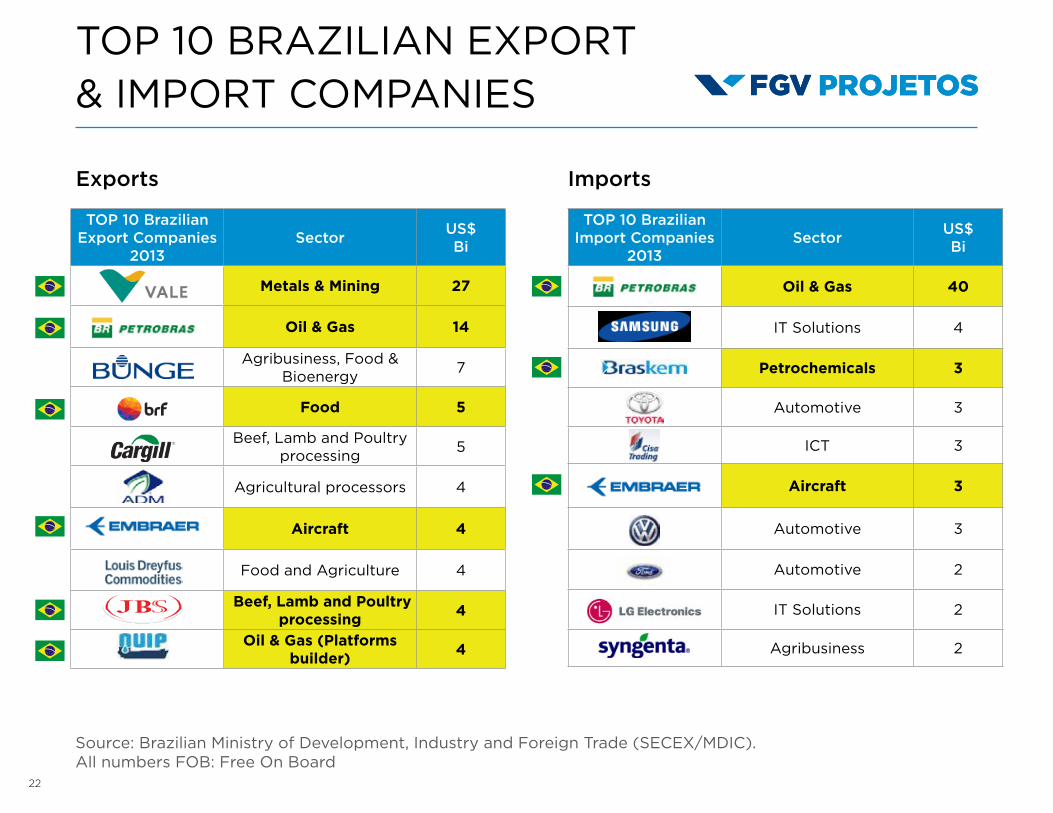
TOP 10 BRAZILIAN EXPORT& IMPORT COMPANIES
TOP 10 Brazilian Export Companies
2013Sector
US$Bi
Metals & Mining 27
Oil & Gas 14
Agribusiness, Food & Bioenergy
7
Food 5
Beef, Lamb and Poultry
processing5
Agricultural processors 4
Aircraft 4
Food and Agriculture 4
Beef, Lamb and Poultry processing
4
Oil & Gas (Platforms
builder)4
TOP 10 Brazilian Import Companies
2013Sector
US$Bi
Oil & Gas 40
IT Solutions 4
Petrochemicals 3
Automotive 3
ICT 3
Aircraft 3
Automotive 3
Automotive 2
IT Solutions 2
Agribusiness 2
Exports Imports
Source: Brazilian Ministry of Development, Industry and Foreign Trade (SECEX/MDIC). All numbers FOB: Free On Board

23
2. TRADE:BRAZIL,
EUROPEAN UNIONAND GREECE
24
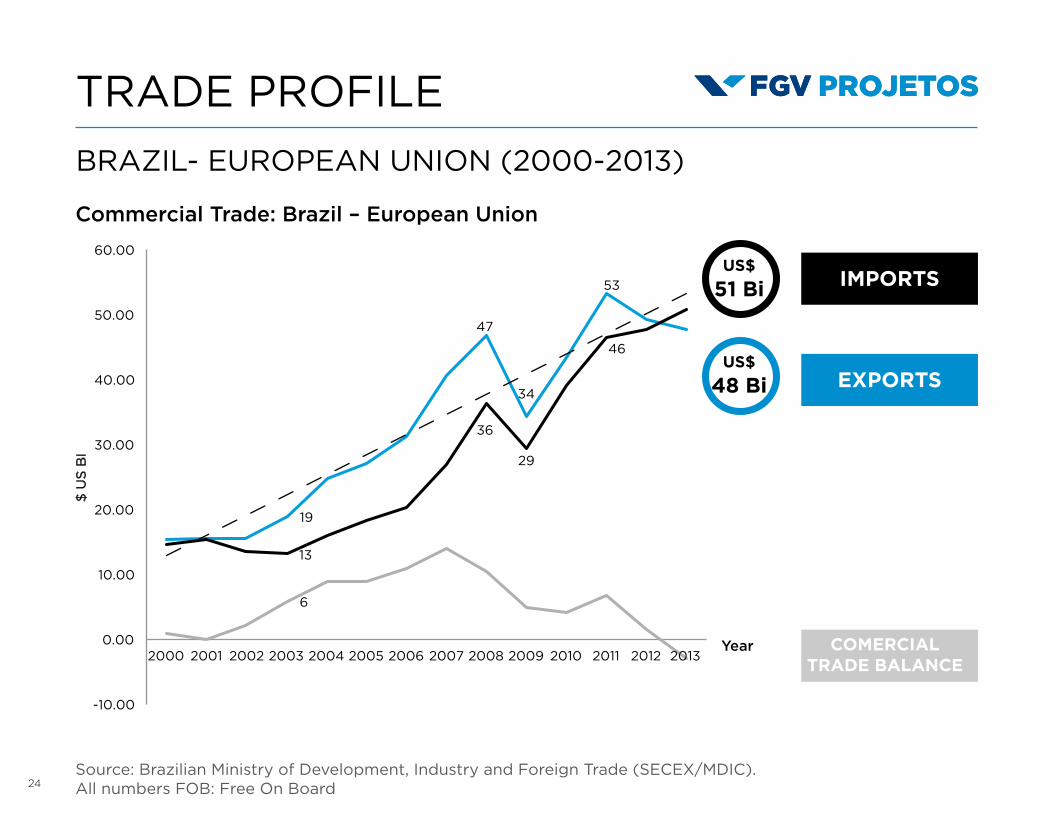
TRADE PROFILE
BRAZIL- EUROPEAN UNION (2000-2013)
Source: Brazilian Ministry of Development, Industry and Foreign Trade (SECEX/MDIC). All numbers FOB: Free On Board
Commercial Trade: Brazil – European Union
US$
51 Bi
US$
48 Bi
IMPORTS
EXPORTS
COMERCIALTRADE BALANCE
Year
25
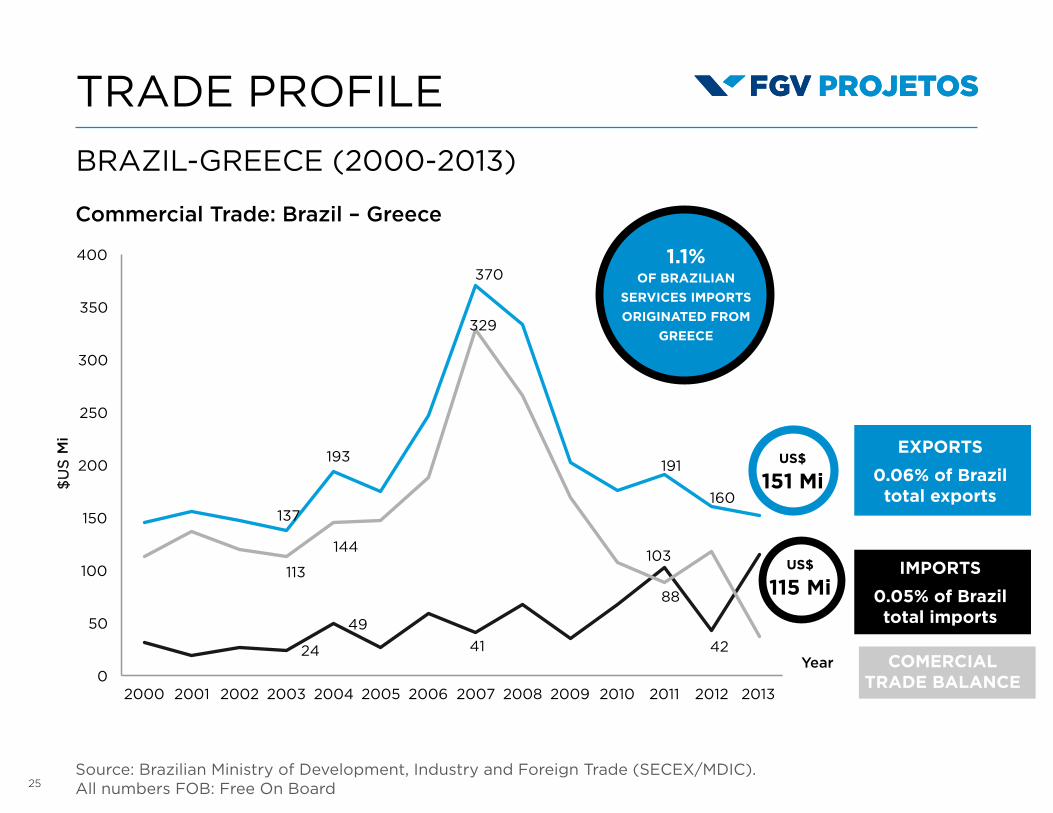
TRADE PROFILE
BRAZIL-GREECE (2000-2013)
Source: Brazilian Ministry of Development, Industry and Foreign Trade (SECEX/MDIC). All numbers FOB: Free On Board
COMERCIALTRADE BALANCE
1.1%OF BRAZILIAN
SERVICES IMPORTS
ORIGINATED FROM
GREECE
Year
Mi
Commercial Trade: Brazil – Greece
US$
151 Mi
US$
115 Mi
EXPORTS
0.06% of Braziltotal exports
IMPORTS
0.05% of Braziltotal imports
26
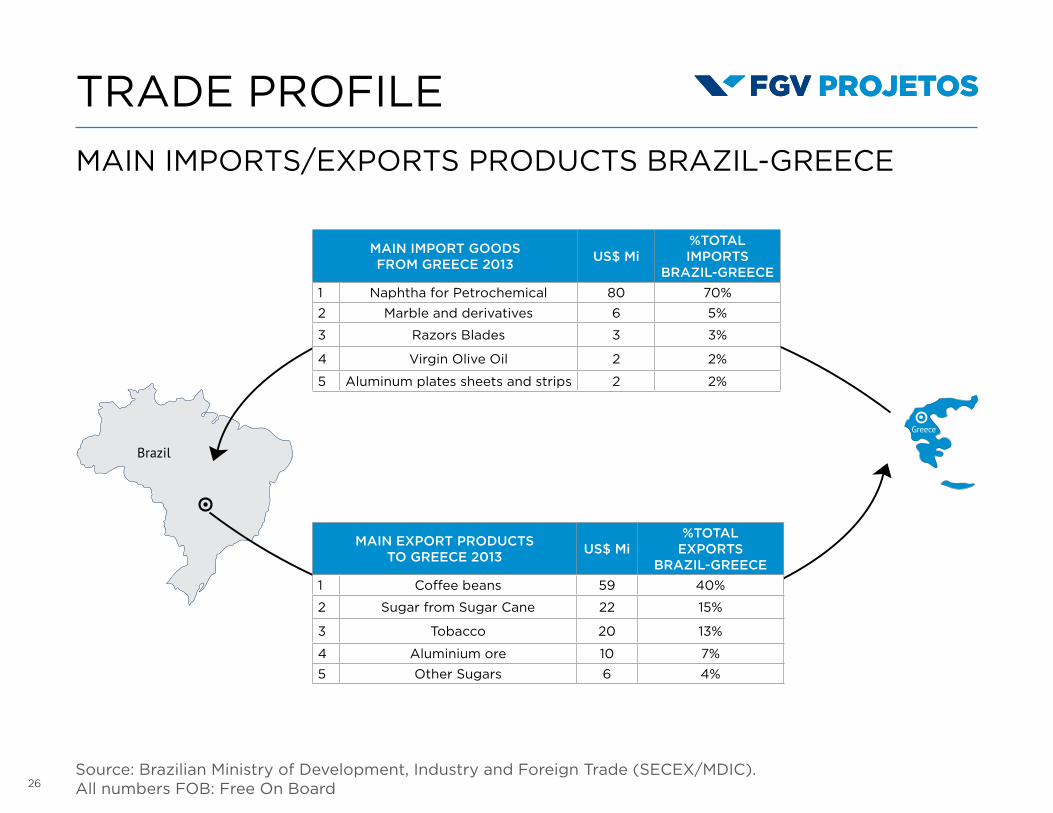
TRADE PROFILE
MAIN IMPORTS/EXPORTS PRODUCTS BRAZIL-GREECE
MAIN IMPORT GOODSFROM GREECE 2013
US$ Mi%TOTALIMPORTS
BRAZIL-GREECE
1 Naphtha for Petrochemical 80 70%
2 Marble and derivatives 6 5%
3 Razors Blades 3 3%
4 Virgin Olive Oil 2 2%
5 Aluminum plates sheets and strips 2 2%
MAIN EXPORT PRODUCTSTO GREECE 2013
US$ Mi%TOTAL
EXPORTSBRAZIL-GREECE
1 Coffee beans 59 40%
2 Sugar from Sugar Cane 22 15%
3 Tobacco 20 13%
4 Aluminium ore 10 7%
5 Other Sugars 6 4%
Source: Brazilian Ministry of Development, Industry and Foreign Trade (SECEX/MDIC). All numbers FOB: Free On Board
27
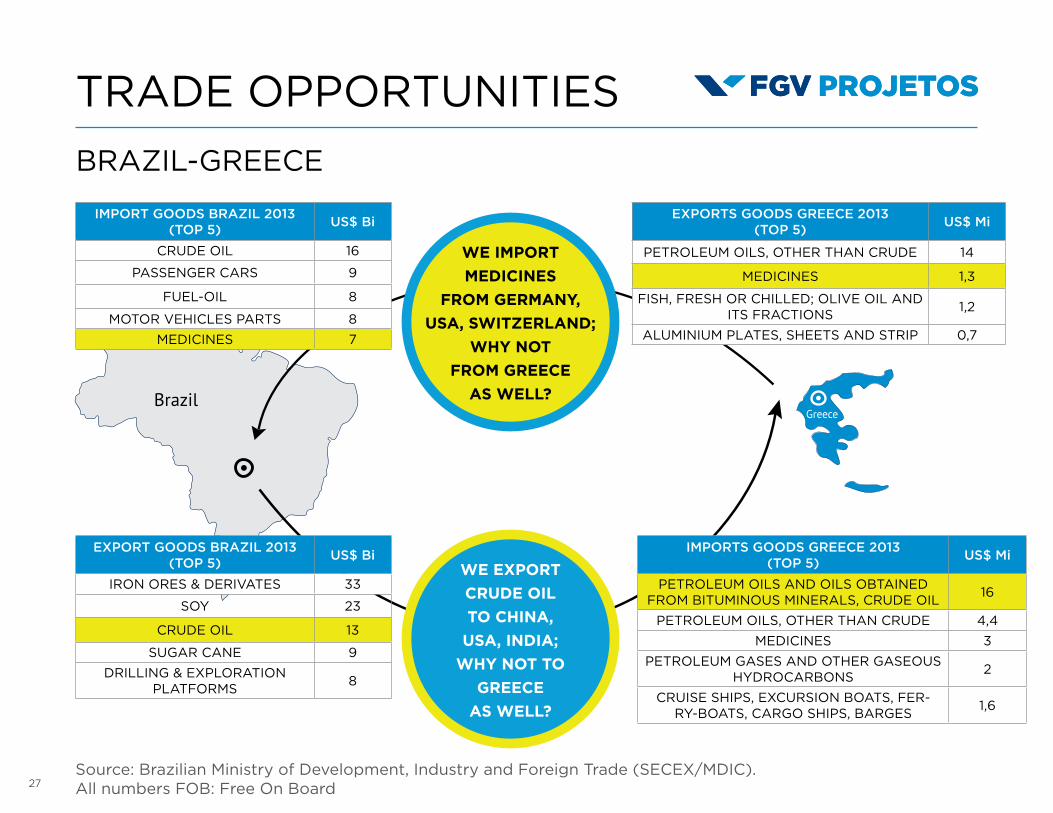
TRADE OPPORTUNITIES
BRAZIL-GREECE
IMPORT GOODS BRAZIL 2013 (TOP 5)
US$ Bi
CRUDE OIL 16
PASSENGER CARS 9
FUEL-OIL 8
MOTOR VEHICLES PARTS 8
MEDICINES 7
EXPORTS GOODS GREECE 2013(TOP 5)
US$ Mi
PETROLEUM OILS, OTHER THAN CRUDE 14
MEDICINES 1,3
FISH, FRESH OR CHILLED; OLIVE OIL AND ITS FRACTIONS
1,2
ALUMINIUM PLATES, SHEETS AND STRIP 0,7
IMPORTS GOODS GREECE 2013(TOP 5)
US$ Mi
PETROLEUM OILS AND OILS OBTAINED FROM BITUMINOUS MINERALS, CRUDE OIL
16
PETROLEUM OILS, OTHER THAN CRUDE 4,4
MEDICINES 3
PETROLEUM GASES AND OTHER GASEOUS HYDROCARBONS
2
CRUISE SHIPS, EXCURSION BOATS, FER-RY-BOATS, CARGO SHIPS, BARGES
1,6
EXPORT GOODS BRAZIL 2013 (TOP 5)
US$ Bi
IRON ORES & DERIVATES 33
SOY 23
CRUDE OIL 13
SUGAR CANE 9
DRILLING & EXPLORATIONPLATFORMS
8
WE IMPORT
MEDICINES
FROM GERMANY,
USA, SWITZERLAND;
WHY NOT
FROM GREECE
AS WELL?
WE EXPORT
CRUDE OIL
TO CHINA,
USA, INDIA;
WHY NOT TO
GREECE
AS WELL?
Source: Brazilian Ministry of Development, Industry and Foreign Trade (SECEX/MDIC). All numbers FOB: Free On Board
28
3. CONCLUSION
29
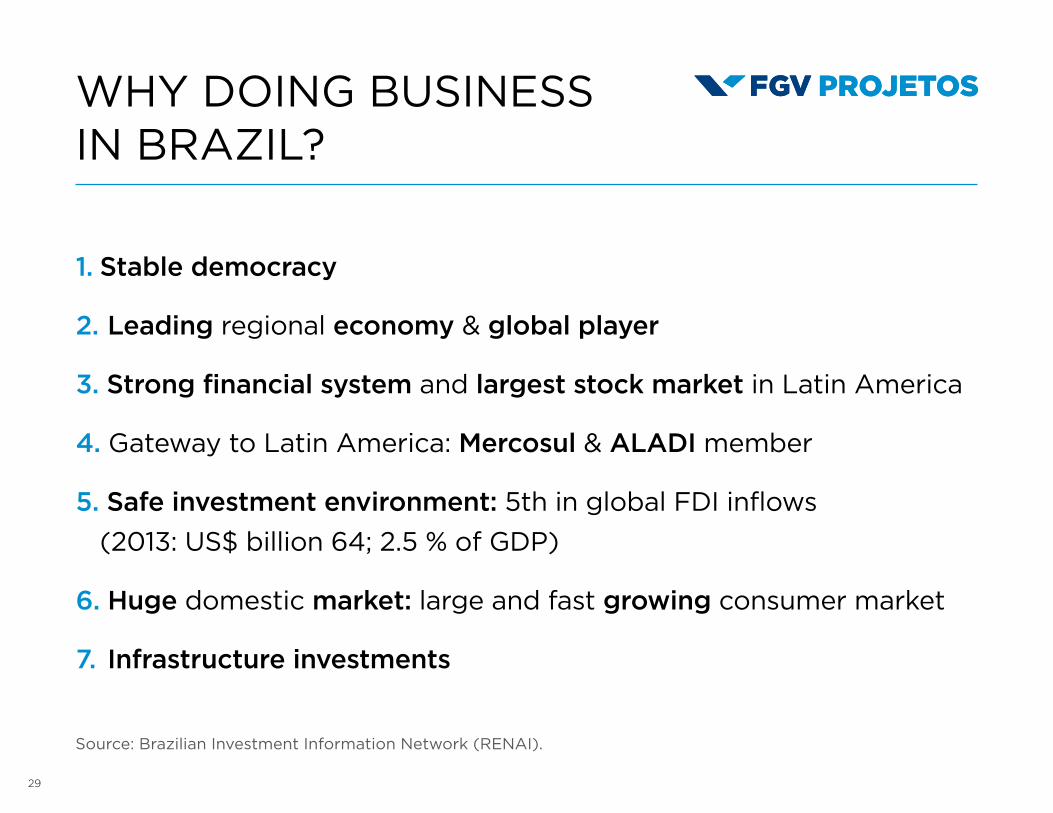
WHY DOING BUSINESSIN BRAZIL?
1. Stable democracy
2. Leading regional economy & global player
3. Strong financial system and largest stock market in Latin America
4. Gateway to Latin America: Mercosul & ALADI member
5. Safe investment environment: 5th in global FDI inflows
(2013: US$ billion 64; 2.5 % of GDP)
6. Huge domestic market: large and fast growing consumer market
7. Infrastructure investments
Source: Brazilian Investment Information Network (RENAI).
30
GOVERNMENTSUPPORT PARTNERS
In Brazil Local Partners
31
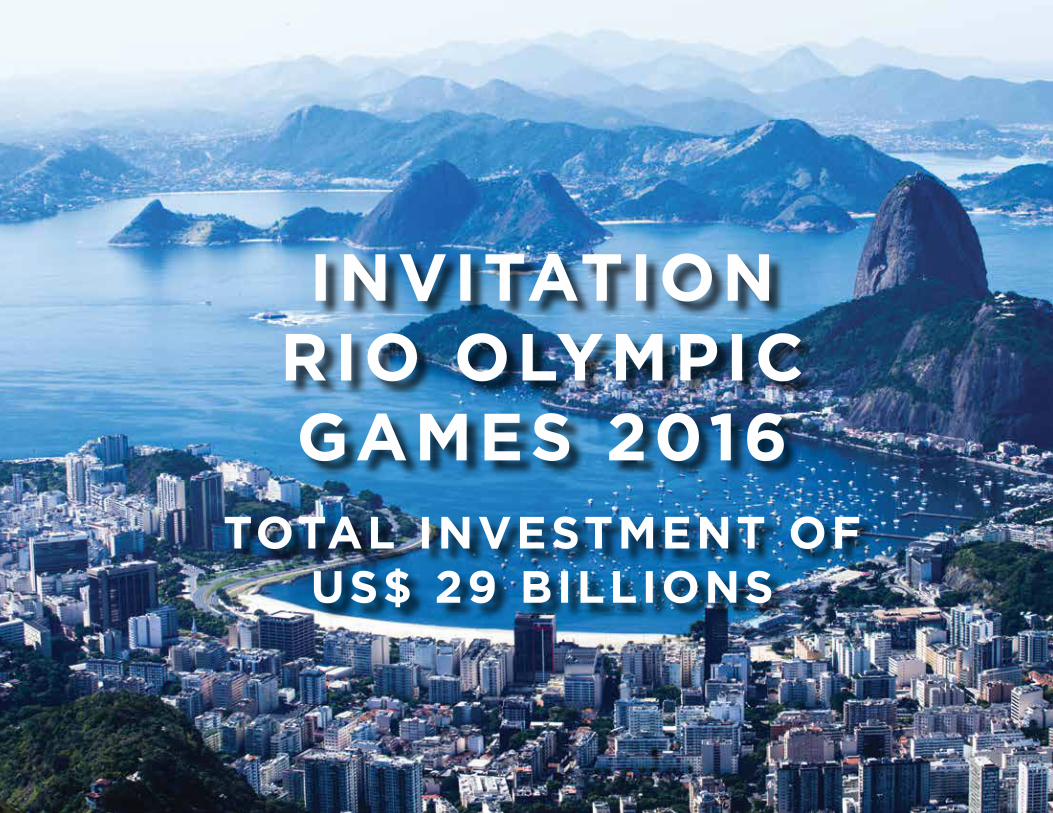
INVITATIONRIO OLYMPICGAMES 2016
TOTAL INVESTMENT OFUS$ 29 BILLIONS
32
CESAR CUNHA CAMPOS
Director, FGV Projetos
www.fgv.br/fgvprojetos
THANK YOU