does trade openness contribute to driving …partnerships). the mobilisation of domestic resources...
TRANSCRIPT

1
WTO Working Paper ERSD-2017-06 Date: 7 March 2017
World Trade Organization Economic Research and Statistics Division
Does Trade Openness contribute to driving
Financing Flows for Development?
Jean-François BRUN (UCA, CNRS, CERDI) Sèna Kimm GNANGNON (WTO)
Manuscript date: March 2017
Disclaimer: This is a working paper, and hence it represents research in progress. This paper represents the personal opinions of individual staff members and is not meant to represent the position or opinions of the WTO or its Members, nor the official position of any staff members. The authors would like to express their sincere gratitude to Priyadarshi Shishir and Hans-Peter Werner for their helpful comments on the previous version of this paper. Any errors or omissions are the fault of the authors. Development Division, World Trade Organization, rue de Lausanne 154, CH-1211 Geneva 21, Switzerland.

2
Does Trade Openness contribute to driving Financing Flows for Development?
Jean-François BRUN1 (UCA, CNRS) Sèna Kimm GNANGNON2 (WTO)
Abstract
Trade has been recognized in the 2030 development Agenda as well as in the Addis Ababa Agenda for Action as an important means for the implementation of the Sustainable Development Goals (SDGs). This paper questions whether trade openness could be an important driver of financing for development flows, notably development aid (ODA), Foreign Direct Investment (FDI) inflows, and government public revenue, the latter being the ultimate financing source for development for any country. The paper also takes advantage of the framework of analysis to investigate the interplay between these three types of financial flows. Relying on an unbalanced panel dataset comprising 125 countries, of which 37 are Least Developed Countries (LDCs), the empirical analysis uses the three stage least squares econometric approach and provides two important pieces of evidence: first, international trade openness is an important tool for driving financial flows for development, including government public revenue, development aid and FDI. As a result, it could contribute to mobilizing the substantial financial resources needed for development, including for the implementation of the SDGs. Second, there are strong interactions (complementarity and substitutability) between these three types of financing for development flows.
Keywords: Trade Openness, Government public revenue, ODA inflows, FDI Inflows Jel Classification: F13, F30, P33, O11
1 Université Clermont Auvergne, CNRS, CERDI, F-63000 Clermont-Ferrand, France.
Email: [email protected] 2 World Trade Organization (WTO), 154, Rue de Lausanne, CH-1211 Geneva 21. Email:
3
1. Introduction At the (September) 2015 United Nations Summit, Members of the United Nations (UN) adopted a
new set of development goals (the sustainable development goals –SDGs-) embedded in the so-called "2030 Agenda for sustainable development (also referred to as the 2030 Agenda) and referenced as A/RES/70/1 in United Nations documents. These goals replaced the millennium development goals (MDGs) that ran from 2000 to 2015, and are expected to be implemented by 2030.
The issue of how to finance the implementation of the post-2015 development goals was at the heart of the debate that took place prior to the adoption of these goals. It was particularly discussed at the third international conference on financing for development held in July 2015 in Addis Ababa (Ethiopia), and its outcome (called the Addis Ababa Action Agenda) fed into the debate leading up to the crafting of the 2030 Agenda.
Both the Addis Ababa Action Agenda and the 2030 Agenda for sustainable development recognize the prime importance of domestic public finance in contributing to meeting the SDGs.
In particular, Paragraph 20 of the Addis Ababa Action Agenda states that "For all countries, public policies and the mobilization and effective use of domestic resources, underscored by the principle of national ownership, are central to our common pursuit of sustainable development, including achieving the sustainable development goals". The same Agenda further states in its Paragraph 22, "We recognize that significant additional domestic public resources, supplemented by international assistance as appropriate, will be critical to realizing sustainable development and achieving the sustainable development goals."
Likewise, the 2030 Agenda stipulates, in particular through Goal 17, the importance to "strengthen the means of implementation and revitalize the global partnership for sustainable development". These means of implementation include finance, technology, capacity-building, trade and systemic issues (the latter encompasses policy and institutional coherence and multi-stakeholder partnerships). The mobilisation of domestic resources appears to be at the top of the finance-related means of implementation of SDGs, as highlighted in Goal 17.1 of the document: this goal provides that "domestic resource mobilisation should be strengthened, including through international support, to improve countries' domestic capacity for tax and other revenue collection".
By the way, Paragraph 41 provides that "……Public finance, both domestic and international, will play a vital role in providing essential services and public goods, and in catalysing other sources of finance….". UN Members further state in Paragraph 43 "We emphasize that international public finance plays an important role in complementing the efforts of countries to mobilize public resources domestically, especially in the poorest and most vulnerable countries with limited domestic resources. An important use of international public finance, including official development assistance (ODA), is to catalyse additional resource mobilization from other sources, public and private. ODA providers reaffirm their respective commitments, including the commitment by many developed countries to achieve the target of 0.7 per cent of gross national income for official development assistance (ODA/GNI) to developing countries and 0.15 per cent to 0.2 per cent of ODA/GNI to least developed countries".
Taken together, these different Paragraphs of the two Agendas highlight the chief role that domestic public finance would play in financing the implementation of the SDGs and the catalysing role of other financing for development flows, including international public finance flows and private capital flows, along with other key means of implementation such as trade. The prime importance accorded to government public revenue in these agendas reflects the idea that no country could be dependent ad

4
vitam aeternam on international resources to address its development challenges: domestic public finance remains, in the long term, the ultimate financing source for development.
The link between domestic public finance and other financing flows for development, including international public finance inflows (ODA) and international private inflows has been explored in the economic development literature (see for e.g., Grubert and Mutti, 1991; Brun et al., 2011a; Selaya and Sunesen, 2012; Morrissey, 2015; Yohou et al., 2016). In the meantime, many studies have been carried out on the effect of international trade openness on these different types of financing for development flows, notably government public revenue, development aid, and foreign investment (see for e.g., Dudley and Montmarquette, 1976; Neumayer, 2003a; Nashashibi and Bazoni, 1994; Alesina and Dollar, 2000; Khattry and Rao, 2002; Baunsgaard and Keen, 2010).
In the lead up to the first international conference on financing for development that took place in March 2002, the World Trade Organization (WTO) issued a research paper titled "Can Trade Policy help mobilize financial resources for economic development?" (see Drabek and Laird, 2001). This paper provided an overview on how trade policy could contribute to financing development in developing countries. In the same spirit, prior to the third international conference on financing for development, the Organization for Economic Cooperation and Development (OECD) and the WTO jointly developed the 2015 Aid for Trade Report titled "Aid for Trade at the Glance, 2015", of which one chapter (see chapter 9 of this report) was devoted to "Trade in the post-2015 Development Agenda". This chapter discussed four interesting issues, including how trade can be an effective means of implementing the SDGs; how trade can help least developed countries (LDCs) achieve the SDGs; and what will be the implications for the Aid for Trade initiative.
Despite all these attempts to either examine the interlinkages (in pairs) between financing for development flows or to explore how international trade openness could contribute to spurring each type of these financing inflows, there has not been, to the best of our knowledge, any study that has examined how international trade openness could affect all possible financing flows of development, while simultaneously assessing how these flows are inter-related. Such an analysis is all the more relevant that the international community has been contemplating to develop a statistical indicator that would encompass all support for development flows.
The current study focuses on three major financing for development flows, namely government public revenue, ODA inflows, and Foreign Direct Investment (FDI) inflows. Indeed, as our primary focus here is on the role of trade openness in directly contributing to financing development, we exclude remittances from our analysis, despite the importance of these inflows, specifically for developing countries. Although migrants' remittances have become important private flows (private transfers) for financing development in recipient-countries, they are not directly affected by international trade openness. We also exclude portfolio investment from our analysis for two main reasons: data on these inflows do not cover many of the poorest countries in our sample over the considered period, whereas these countries are of utmost importance in our study. Moreover, while portfolio investment inflows have increased during recent years, they are known to be highly volatile (and therefore far less stable than FDI).
The current study aims to contribute to the existing literature on the links between international trade openness and development finance, by exploring whether trade openness contributes to financing development in developing countries. More specifically, it relies on a framework of a system of
5
equations to assess how international trade openness affects the above-mentioned three types of financing flows cited above.
The rest of the paper is structured as follows: section 2 briefly discusses the financing needs for the implementation of SDGs and the current patterns of capital inflows; section 3 provides a brief overview of the theoretical and empirical literature on the effect of trade openness on the financing of development variables considered in the analysis; section 4 briefly reviews the literature on the interplay between government public revenue, development aid and FDI inflows; section 5 formulates the different equation specifications, while section 6 discusses the empirical strategy that would help perform the estimation of these equations. Section 7 interprets the estimations' results. Section 8 concludes.
2. Financing needs for the implementation of SDGs and the current patterns of capital inflows
In this section, we start by briefly providing the current estimates3 of the finance needs for implementing SDGs as well as the current patterns of capital inflows. Estimates of the finance needs for the SDGs appear to vary depending on the underlying assumptions and scenarios in the analysis. For example, McKinsey (2013) estimates that up to 2.5 trillion US$ is needed annually up to 2030 to finance the needs for global investment. The International Energy Agency (IEA, 2013) estimates that there would be a further need of 2.25 trillion US$ a year simply to maintain and upgrade the transport sector, depending on different climate change scenarios. Other studies focus for example on the finance needs for Small and Medium Enterprises (SMEs) and trade. For example, the IFC (2014) estimates that the credit finance gap for around the half (45-55%) of the 200-245 million Micro, Small and Medium Enterprises (MSMEs) in developing economies – which are either underserved or not served at all – amounts to 2.1-2.6 trillion.
Despite these huge financing needs for the implementation of the SDGs in the post-2015 era, the European Union Development Report (2015) cautioned against the finance-based supply driven approach, as too much finance could exert adverse effects on recipient economies. As a matter of fact, the development literature shows for example that misallocation of financial resources could generate crises (see for e.g., Beck, 2013, and Arcand et al., 2015) or too much ODA could even be associated with the "Dutch Disease" phenomenon (see for e.g., Rajan and Subramanian, 2009). These studies point out that in the event market failures (for e.g., externalities, public goods, and asymmetric information, moral hazard and transaction costs) are the major constraints to investment in a good policy and business environment, then finance might be an appropriate solution. However, if investment is lacking because of unsound policies and weak institutional environment, then finance might not be an appropriate means to address the lack of investment issue.
It is nonetheless worth providing here an insight into the current figures of ODA and FDI inflows. According to the Organization for Economic Cooperation and Development (OECD) development statistics, the total Net ODA received by all recipient-countries from all donors, including both Development Assistance Committee (DAC) and non-DAC donors amounted to billions US$ 205.1 in 2014, moving respectively from billions US$ 172.8 in 2012, and 193.6 billions US$ in 2013. This
3 Information on these estimates is drawn from the European Union 2015 Report on Development.

6
represents a 12.09% increase from 2012 to 2013 and a 5.9% increase from 2013 to 2014. In the meantime, the same source of information provides specifically for developing countries that, the increase in total net ODA was 13.6% from 2012 to 2013, and 6.8% from 2013 to 2014 (thereby moving from an amount of 132.7 billions US$ in 2012 to 150.8 billions US$ in 2013 and to 161.1 billions US$ in 2014).
According to the UNCTAD database, FDI inflows to developing countries amounted to 639.021 billions US$ in 2012, 670.8 billions US$ in 2013, and 681.4 billions US$ in 2014. This indicates a rise of these inflows to developing countries by approximately 5% from 2012 to 2013 and 1.6% from 2013 to 2014.
3. Brief theoretical and empirical literature on the effect of trade openness on financing of development flows
In this section, we provide a brief review of the theoretical and empirical literature that have examined the impact of trade openness on government public revenue as well as on the two types of financial flows for development, considered in this study, namely official development aid and foreign direct investment inflows. 3.1 Trade Openness and Government public revenue
The literature on the determinants of government public revenue, in particular in developing countries, has identified a number of structural factors, including the foreign trade sector of the economy (i.e., the degree of international trade openness of the economy) as a tax handle.
Indeed, the easy monetized nature of the international trade sector in any economy (given that imports and exports take place at specified locations), makes the collection of trade taxes easier than income taxes in developing countries, and particularly in Low-income countries. In line with this, Stotsky and WoldeMariam (1997) point out that certain features of international trade make it more amenable to taxation than domestic activities; Bornhorst et al., (2009) and Drummond et al., (2012) contend that countries could easily levy taxes at the border. Furthermore, by allowing increased productivity and steadier growth, trade openness generates higher government public revenue (Frankel, 1999). Nevertheless, the impact of trade openness on government public revenue hinges on several factors, including the structure of trade liberalization and the effect of the latter on each component of government public revenue. These factors could include the extent of replacement of quantitative restrictions with tariffs, how tariff reduction affects imports, the price elasticity of demand for imports, the price elasticity of supply of import substitutes and, how exports respond to trade liberalization measures (see for e.g., Ebrill et al., 1999; and Agbeyegbe et al., 2006 for more details).
- Trade openness and Trade Tax Revenue
There have been concerns among policymakers in developing countries that trade openness would lead to decline in custom revenues and consequently on government public revenue. Such concerns could be severely mitigated if trade reforms are appropriately sequenced so that initial effort to reduce import barriers focuses first on the tariffication of quantitative restrictions (notably in agricultural sector) and other non-tariff barriers (to reduce the potential revenue losses and avoid that imports increase to a level that could translate into balance of payments problems). Hence, after this
7
first stage and once the government implements a tax reform, including by improving domestic tax revenue collection, the government could engage in phasing-out tariffs. The replacement of quantitative restrictions by tariffs augments tax revenue, including trade tax revenue receipts (Khattry and Rao, 2002). At the same time, as per the Laffer curve, if the initial tariff is prohibitively high, then tariffs reductions necessarily increase revenue by reducing the incentives to evade taxes (Khattry and Rao, 2002). It is important to emphasize here that the effect of trade openness on government public revenue, including in developing countries depends on whether tariffs are ultimately eliminated or are reduced. If they are eliminated, governments should find alternative ways for collecting tax revenue, including through tax transition, i.e., by developing domestic sources of tax revenue. In the event tariffs are not eliminated but reduced, the resulting fiscal impact could be partially offset by an increase in imports.
The reduction of import duties in the framework of trade reforms would erode the trade tax base as well as other indirect taxes and should ultimately lead to lower trade tax revenue, in particular if imports remain unchanged at their pre-reform levels (see Hisali, 2012). Nonetheless, trade tax revenue may increase if lower tax rates enhance voluntary compliance (Ebrill et al., 1999). Likewise, lower import tariffs could be associated with higher trade tax revenue if the aggregate import elasticities are greater than unity. Theoretically, the effects of lower tariffs on trade tax revenue may be reinforced or even offset depending on the response of import competing industries to tariff and the implied price reduction (Hisali, 2012). By the way, the price elasticity of imported goods is not the only factor that matters for the impact of tariff reduction on imports, as competition also matters. The lack of competition would prevent domestic prices from being affected by tariff reduction and imports would likely remain unaffected. Indeed, if tariff liberalization does not lead to domestic price reductions due to the lack of competition or insufficient competition in the domestic market (which allows domestic companies to increase profits instead of lowering prices), then demand for imported goods would not increase (this would be the case when imports are somewhat price elastic). As a result, the revenue loss from tariff liberalization would not be offset by the increase in imports when a Value Added Tax (VAT) is levied on the imported goods. Incidentally, lower supply elasticity would imply a small reduction in output due to reduced import price and hence small increase in import values (Khattry and Rao, 2002).
- Trade openness and domestic tax revenue Trade openness does not affect government public revenue only through border taxes (tariff
revenue and VAT revenue from imports), but also through domestic tax revenue. This particularly takes place because of the impact of export receipts on domestic traders' wages and their domestic consumption. By generating export expansion, trade openness would likely induce higher export receipts for traders, including in both public (state trading enterprises) and private sectors (notably small and medium enterprises, as far as many developing economies are concerned) involved in international trade activities. In consequence, traders' profits and probably wages (notably employees' personal income) would increase and potentially generate a positive hiring dynamic of the concerned firms. This would imply a rise in direct tax revenue (deriving from taxes collected on corporate and individual income) and consequently an increase in total tax revenue. This positive income effect could translate into higher domestic consumption and hence higher indirect tax revenues (revenue coming from value added tax – VAT – and excise tax).

8
Improvement in traders' income thanks to export expansion could also generate higher trade tax revenue for governments if translated into higher imports. Similarly, trade openness could facilitate the development of new export products thanks to more imports of inputs that incorporate technology transfer and contribute to innovation. This would lead to higher trade tax revenue and consequently higher government public revenue, in particular if this additional tax revenue more than compensates the revenue losses associated with trade openness (due to the closing down of inefficient firms and possibly lower tariff revenue). Incidentally, countries that levy export taxes would benefit from higher tax revenue in the event of export expansion, thanks to higher export receipts. In such a situation, although export volumes may decrease, trade tax revenue may be positively affected thanks to higher export tax revenue, which could in turn positively influence total tax revenue.
- What does the empirical literature provide in terms of the impact of trade openness on
government public revenue? Many empirical studies have been conducted on the effect of trade openness/trade liberalization
on government public revenue, including total tax revenue (as the total government public revenue encompasses both tax revenue and non-tax revenue). These studies, by reflecting the inconclusive theoretical effect of trade openness on government public revenue discussed above, have revealed mixed results.
Blejer and Cheasty (1990), on the one hand, and Tanzi (1989) on the other hand, conclude that the net impact of trade reform on revenue is an empirical matter.
Nashashibi and Bazoni (1994) find that for SSA countries, import liberalization undermines the tax base, while Ebrill, Stotsky and Gropp (1999) provide evidence that tariff reforms have not resulted in lower trade tax revenue. Adam, Bevan and Chambas (2001) use a sample of SSA countries and find that trade openness raises overall tax revenue in CFA franc countries, but has little effect in non-CFA franc countries. However, the outcome on the disaggregated revenue suggests that trade openness improves trade tax revenues in CFA countries.
Khattry and Rao (2002) find empirical evidence that trade liberalization is negatively associated with total tax revenue and international trade tax revenues. More specifically, their results point out that structural characteristics of low-income and upper-middle income countries, - such as trade openness, the size of population, the age-dependency ratio, and the degree of urbanization- have significantly contributed to explaining the decline in tax revenue as a result of falling income and trade tax revenues.
Agbeyegbe, Stotsky and WoldeMariam (2006) show that for SSA economies in general trade
liberalization is not strongly linked to aggregate tax revenue or its components. Baunsgaard and Keen (2010) questioned whether countries were able to recover from domestic
taxes the revenues they lost from past episodes of trade liberalization. They observe that while high income countries are able to do so, middle-income countries show robust signs of strong replacement both concurrently with the revenue loss and essentially dollar-for-dollar in the long run. However, low-income countries do not show signs of significant recovery, although the experiences of these countries vary widely.
Hisali (2012) examines the long and short term relationships between trade policy reform and customs tax revenue in Uganda. The empirical results indicate that exchange rate depreciation has had pass through effects to the domestic market price of imports, which reduced trade tax revenue in the long-run, though trade tax revenue in the short term increased. Moreover, seasonal patterns have been

9
observed in the short term trade tax payment in Uganda. The author concludes that there is a scope to harness the benefits of trade liberalization without worrying a lot about its effects on trade (and total) tax revenue. This is because modest increases in trade tax revenue could be realized if the exemption regime were to be reviewed and if there was capacity to contain the disruptive impact of sharp exchange rate depreciations.
Cagé and Gadenne (2014) compare the fiscal costs of trade liberalization in developing countries and in today's rich countries at earlier stages of development. They observe that trade liberalization seems to have come at a larger fiscal cost in today's developing countries, possibly because the countries reduced taxes on trade before having developed tax administrations capable of taxing domestic transactions on a large scale. Moreover, they found that trade liberalization episodes led to larger and longer-lived decreases in total tax revenues in developing countries since the 1970s than in rich countries in the 19th and early 20th centuries.
A number of recent studies have also considered the effect of trade openness on non-resource tax revenue, though the role of trade openness in non-resource tax revenue mobilization was not at the heart of their study. The focus on non-resource tax revenue (i.e. the exclusion of resource tax revenue from total tax revenue) rather than total tax revenue lies in the fact that resource government public revenue is largely outside the reach of economic policy. Moreover, reliance on non-resource government public revenue as a dependent variable achieves much greater homogeneity than total government public revenue (see Brun, Chambas and Mansour, 2015: p206). For example, Thomas and Treviño (2013), and Brun, Chambas and Mansour (2015) observe a positive effect of trade openness on non-resource tax revenue. Crivelli and Gupta (2014) saw a mixed effect of non-resource trade openness (measured as the sum of non-resource exports plus imports, expressed relative to GDP) on the mobilization of domestic non-resource tax revenue over a sample of 35 resource-rich countries. 3.2 Trade Openness and Official Development Aid
The relationship between ODA and international trade in both recipient and donor countries has been explored from different perspectives.
- The first one addressed whether donors' allocation of aid depends on recipient-countries' degree of trade openness. For example, Alesina and Dollar (2000) provide evidence that donors allocate more aid to reward developing countries for the good quality of their economic policies, in particular their trade liberalization policies;
- the second examined whether aid allocation hinges on the imports of recipient-countries from donor-countries. Dudley and Montmarquette (1976), Neumayer (2003a), and Younas (2008) have demonstrated that higher total exports from donor countries to the recipient countries results in greater aid allocation. Lundsgaarde et al. (2007) provided empirical evidence that donors’ imports from developing countries as a share of donors’ GDP is significantly and negatively associated with the generosity of these donors, measured by the ratio of ODA provided by a donor to its gross national product (GNP).
In the context of the present study, we argue that openness to international trade would enhance competitiveness and provide signals to the international community of the country’s commitment to sound macroeconomic policies (see for e.g., Alesina and Dollar, 2000). Donors would, therefore, be
10
willing to reward countries that engage in international trade by extending higher development aid flows to them.
3.3 Trade Openness and Foreign Direct Investment Inflows According to the literature on international business theory, there are broadly four equations of FDI undertaken by multinational enterprises (MNEs): horizontal FDI equations; vertical FDI equations; export platform FDI equations; and complex-vertical FDI equations. The theory underlying horizontal FDI equations posit that MNEs are market-seeking and want to expand overseas to avoid trade costs (Markusen, 1984; Markusen and Venables, 1995). Hence, high trade barriers in any destination country allow MNEs engaged in horizontal-type FDI inflows to serve the local market and to benefit from the protection of their output from imports of foreign competitors (tariff-jumping hypothesis). These types of FDI inflows lead to a substitutionary relationship with trade. The theory associated with vertical FDI equations (see for e.g., Helpman, 1984; Helpman and Krugman, 1985) provides that FDI and trade could be complementary when vertical FDIs are involved due to the fragmentation of the production process geographically. Multinationals undertaking vertical FDIs are primarily motivated by low production costs in host countries and aim to serve both the domestic and foreign markets. As a result, the lower the parent country's tariffs, the stronger the complementarity between FDI and trade. Export platform FDI equations have recently emerged to explain the paradox - stemming from the theory underlying horizontal FDI equations - associated with the rise in world trade thanks to multilateral trade liberalization and the concomitant surge in FDI inflows (see for e.g., Neary, 2009; Collie, 2011). These types of FDI are undertaken by MNEs in a host country with a view to serving both the local market and the surrounding countries. Market access conditions experienced by the host country exporters in neighbouring countries appear to be relevant for these types of FDI (see Fugazza and Trentini, 2014). Moreover, high initial host country's tariffs discourage these types of FDI. Finally, complex-vertical FDI equations are the most advanced investment strategies, and are particularly motivated by the minimization of production costs. These FDIs entail the creation by MNEs of several production locations specialized in different phases of production. Complex-vertical FDIs require third countries' access to the host country and the host country's openness to the rest of the world. Based on this theoretical discussion, it is a priori difficult to anticipate the effect of trade openness on FDI inflows. Therefore, we conclude that the effect trade openness on FDI depends on the type of the FDI undertaken by MNEs (see for e.g., Asiedu, 2002).
4. Brief literature review on the interplay between government public revenue, development aid and FDI inflows
In this section, we examine how financial flows considered in the analysis affect domestic government public revenue as well as how they interact with each other. Moreover, the discussion involves the effect of government public revenue on each of these flows.
11
4.1 Interaction between development aid and government public revenue The effect of development aid flows on the mobilization of domestic public revenue has been
extensively discussed in the theoretical and empirical literature, without reaching a clear-cut conclusion. Three major trends have emerged from this literature: aid crowds out tax revenues; aid does not
lower tax performance, and the impact of aid on tax revenue depends upon the institutional quality. From the theoretical perspective, a number of arguments have been put forth to justify both the
negative and positive effect of development aid on tax performance. On the negative side, the possible adverse effects of aid on tax revenue can stem from adverse
incentives, economic instability and difficulties in public administration. Aid could be used by governments to avoid the social costs associated with the tax burden. For example, Azam et al. (1999) show theoretically that development aid could render recipient governments less inclined to adopt good policies and develop efficient institutions, i.e., to build efficient tax system. In the same spirit, Marteens et al. (2002) and Svensson (2006) argue that aid may lead the recipient government to privilege donor satisfaction at the expense of accountability towards citizens. As a result, the attention of the public administration may be directed towards aid projects, at the expense of the tax administration. The quality of provision of public services may then be adversely affected, as would be domestic tax compliance and tax revenue collected. Incidentally, the aforementioned adverse effects on public administration may be reinforced by the lack of coordination between multiple donors (see for e.g., Knack and Rahman, 2007; Brun et al., 2011a).
On the positive side, development aid can also directly affect government public revenue through incentives, impact on public administration, and indirectly through its impact on the economy. For example, the costs highlighted above could prompt governments of aid recipient countries to lower their aid dependence, including by raising tax effort (see for e.g.., Brun et al., 2011a). Aid related to technical assistance can contribute to strengthening tax and customs administration capacities and, therefore, facilitate tax reforms. On another note, development aid can contribute to enhancing the effectiveness of public expenditures, human development and tax compliance and, consequently, help mobilize higher government public revenue (Morrissey, 2015).
What about the empirical literature on this issue? As noted above, the outcome is also mixed here, reflecting both the inconclusive theoretical literature on the matter and sensitivities of the samples, econometric methodologies, and quality of data used in the different studies (on the latter point, see Moss et al., 2006). For example, Heller (1975) and Remmer (2004) find an adverse effect of aid on tax revenue, whereas Khan and Hoshino (1992) and Gupta (2007) obtain a positive effect. Ouattara (2006) observes a statistically nil effect. Many recent studies consider whether the tax revenue effect of development aid depends on the composition of such aid, i.e., grants versus loans. Even the outcome of these studies are inconclusive, and leads many scholars such as Brun et al. (2011a) to suggest that heterogeneity across countries and over time may matter for the relationship between aid and tax revenue. Clist and Morrissey (2011) provide evidence that when considered in lagged values, aid variables become statistically insignificant. Further, Morrissey et al., (2014) find evidence of no consistent cross-relationship between aid and tax effort.
Last, but not least, another strand of the empirical literature on this subject points out that the impact of aid on tax revenue could depend on governance quality (see for e.g., Gupta et al., 2003; Benedek et al., 2012; Brun et al., 2011a; Brun et al., 2011b). Clist (2014) has attempted to replicate the
12
results obtained by Benedek et al. (2012) and failed to obtain similar results. In particular, he obtained a modest but positive effect from foreign aid on domestic tax revenue.
However, Alonso and Garcimartin (2011) challenge this view and show evidence that the effect of aid on tax revenue is not conditional upon institutional quality. More recently, Yohou et al., (2016) find evidence – over a set of West African Countries-, that the impact of aid on tax revenue is gradual and varies across countries, depending on the level of government stability: aid appears to directly reduce tax revenue, but improves the latter for higher levels of government stability.
Although the impact of aid on government public finances has been extensively discussed in the literature, little is known about the causality in the other way around, i.e., the extent to which government public revenue in recipient countries influences donors' aid supply. Yet, this possible reverse causality has justified the consideration of ways to address endogeneity issues in many of the analyses highlighted above, but to the best of our knowledge, the topic in itself has not been so far explored. In this analysis, we argue that donors will likely reduce aid to recipient countries that experience higher tax revenue, but protect low income countries, by extending higher aid to them even if they enjoy higher tax performance. This rationale lies in the huge financial needs of these countries to address their development challenges in order to, at least, graduate from this category.
4.2 Interaction between ODA and FDI There is a growing literature on the interplay between ODA and FDI. From the theoretical
standpoint, development aid could be complementary to foreign investment. Harms and Lutz (2006) argue that appropriately targeted aid can have an "infrastructure effect", which in turn will attract foreign investors. Development aid inflows could also raise domestic firms' marginal productivity of capital, which in turn contributes to attracting FDI. Furthermore, Kimura and Todo (2010) claim that there is a vanguard effect associated with ODA, i.e., donor-countries that provide aid to a given host country tend to undertake FDI in this specific host economy, but not in other countries. The rationale for this argument is that development aid carries an "information effect" for host countries, i.e., it allows foreign investors to obtain private information on the host countries via development aid. Hence, by helping investors collect data and devise business strategies, aid programmes can add to the "financing effect" that directly improve the host country's balance of payments. On the other hand, aid may discourage FDI, i.e., acts as a substitute to foreign investment, notably FDI: the rent-seeking behaviour due to competition of local firms to access development aid may lead to further reliance on such aid and discourage FDI. Given the lesser focus on innovation, the marginal productivity of capital could be negatively affected, and, research and development spending hindered. This would result in efficiency loss (see for e.g., Svensson, 2000; and Harms and Lutz, 2006). According to Arellano et al. (2009), aid may discourage FDI through the "Dutch Disease" effect.
From the empirical standpoint, the work on the interplay between ODA and FDI is mixed and inconclusive in terms of whether these two types of development flows are complementary or substitutable. Harms and Lutz (2006) provide empirical evidence that the marginal effect of development aid on FDI is virtually zero. However, they obtain that development aid could act as a complement to FDI in countries where private agents face a substantial regulatory burden, i.e., countries with unfavourable institutional environment. Kosack and Tobin (2006) find that aid and FDI are not significantly related because development aid largely supports human capital, whereas FDI,
13
being private, supports physical capital. Karakaplan et al. (2005) find that aid is a substitute for FDI in developing countries.
Caselli and Feyrer (2007) obtained that the marginal productivity of capital is roughly the same in developing countries, and development aid inflows might generate an opposite flow of domestic capital to balance a falling rate of return on domestic capital. Hence, in this specific case, development aid seems to be more a substitute than a complement to FDI. Based on case studies on Japanese FDI and aid flows, Blaise (2005) finds that aid to infrastructure projects exerts a positive effect on FDI, while Kumura and Todo (2010) find no significant positive infrastructure impact, but rather a positive vanguard effect. Bhavan, Xu and Zhong (2011) show for South Asian countries that development aid drives FDI. Selaya and Sunesen (2012) provide evidence that over a large panel of developing countries, development aid directed at complementary inputs, acts as a complement to FDI, while aid invested in physical capital drives out FDI. Nonetheless, they obtain a positive effect of the combined aggregate development aid.
4.3 Interaction between FDI and Government public revenue
Investment tax incentives have been used by many governments to attract foreign investment. Indeed, in the context of increasing mobility of international capital, governments have been using corporate tax rates and rules over taxation in their country to attract foreign direct investment. While tax incentives could be effective in attracting investment flows, they could nonetheless induce adverse consequences for the host country. They could be associated with important losses of public revenues for the host government (see for e.g., Bellak et al., 2009). They could also be counterproductive by attracting investment that would not be genuinely beneficial to the host-country, or those with weak fundamentals. They could also provide disincentives to the development of competitive markets and sound policies. Likewise, one could argue that while tax incentives help attract FDI inflows, the latter could generate higher total government public revenue if its indirect effect on government public revenue outweighs its direct effect through tax incentives. The indirect effect on FDI inflows on government public revenue could occur for example through its jobs creation effects. By creating jobs, FDI inflows would increase income tax revenue as well as indirect tax revenue, notably through VAT and excise tax revenue, especially if those who get new jobs increase their domestic consumption. In the event these persons would increase their imports, this could also translate into higher tariff revenue for the government.
Tax policy could influence FDI inflows through several channels (see for e.g., Vo and Daly, 2007). First, corporations could shift their assets to countries with lower corporate income tax rates. Second, the implementation of lower tax rates would facilitate the engagement of foreign firms and international intermediaries in offshore transactions. Third, when facing higher income tax rates, investors would be forced to invest rather than keep income to avoid the tax burden. As a result, they would seek lower tax rates in other countries. Fourth, investors could hide income from domestic regulators by investing abroad (see Lane and Milesi-Ferretti, 2003).
One could also argue that capital flows will be attracted by countries with higher government public revenue as this would provide indication of the government's ability to generate sufficient revenue in the future to achieve fiscal sustainability.
14
A number of studies have been carried out to investigate the impact of taxation on foreign direct investment. This empirical work has been inconclusive on whether FDI may be sensitive to tax incentives. While some studies conclude that host country corporate taxes exert a negative and significant effect on DFI, other studies report the absence of significant effect of taxation on FDI flows. For example, Grubert and Mutti (1991), Hines and Rice (1994), Loree and Guisinger (1995), Cassou (1997), Edmiston, Mudd and Valev (2003) maintained that host country's corporate income taxes have a significant negative effect on attracting FDI flows. In contrast, studies such as Lim (1983), Wheeler and Mody (1992), Jackson and Markowski (1995), Porcano and Price (1996) conclude that taxes do not have a significant effect on FDI.
5. Formulation of the different equation specifications
5.1 Equation specification for Government public revenue Besides the foreign trade sector as an important tax source, the conventional literature on tax
effort has identified several other factors to explain tax shares (tax-to-GDP ratio). These factors include both supply factors (notably structural factors4), such as the overall level of development, the sectoral composition of domestic output and demographic characteristics; but also demand-side factors such as the level of corruption (see for e.g., Bird et al., 2008) and macroeconomic factors such as the real effective exchange rate (see for e.g., Agbeyegbe et al., 2006). It is important to underline here that in addition to all these factors, the equation includes the other two financial flows considered in this study.
- the overall level of development is proxied by the country's real GDP per capita, and represents the level of development of this country. It is expected to increase with a higher capacity to pay and collect taxes as well as with a higher relative demand for income elastic public goods and services5 (e.g., Chelliah, 1971; Balh, 1971).
- the sectoral composition of domestic output: this represents a direct tax handle and is relevant for tax mobilisation to the extent that, as noted above, certain sectors of the economy are more amenable to taxation than other sectors. For example, countries experiencing a high share of agriculture in the total output may find it difficult to tax domestic output. While some authors (e.g., Balh, 2003) argue that agriculture is not difficult to tax, others such as Tanzi (1992) contend that a relatively important share of agricultural sector in a country's economy would be associated with a lower need for governmental activities and services, as many public sector activities are city-based. Furthermore, Bird (2008) argues that for political reasons, some countries exempt a large share of agricultural activities from taxes. As a result, a higher non-agricultural share, in particular manufacturing share in GDP should be associated with a higher tax share.
- the demographic characteristics (the population size): Bahl (2003, p. 13) points out that in countries experiencing faster growing populations, tax systems may lag behind in their ability to capture new taxpayers. Accordingly, we could expect that the higher the size of the population, the lower the tax share. At the same time, one could argue that the rise in the population could lead to higher level of
4 We do not intend here to provide detailed literature review on the structural determinants of tax share, as such a literature could be found for example in Brun, Chambas and Guerineau (2007).
5 Wagner's law provides that the demand for government services is income-elastic, so the share of goods and services provided by the government is expected to rise with income.

15
imports and higher domestic consumption if the income of such a population experiences an increase. In this scenario, faster growing populations, even if making it difficult for the government to capture new taxpayers, may positively affect both trade tax revenue and domestic tax revenue. As a result, the overall effect on overall government public revenue is a priori unknown.
- the real effective exchange rate: the net effect of an appreciation/or a depreciation of the real effective exchange rate on government public revenue ultimately depends on the effect on the components of the latter, including international trade tax revenue, domestic direct tax revenue and domestic indirect tax revenue (see for e.g., Agbeyegbe, Stotsky and WoldeMariam, 2006 for a detailed analysis of the effect of changes in exchange rate on government public revenue, including through the components of the latter). This net effect is the outcome of the valuation effect and the volume effect of real exchange rate appreciation/depreciation on imports and exports. All in all, the net effect could be either positive or negative.
- Corruption: Some researchers like Bird and Martinez-Vazquez (2008) provide evidence that demand-side factors such as corruption matter equally for tax performance as supply-side factors (or tax handles). We expect here that lower level of corruption could be conducive to the mobilization of higher government public revenue, i.e., to higher government public revenue performance.
Against this background, we postulate the following equation:
ittiit
itititit
ititititit
REERLog
POPLogCORLogVANAGRILogRENTSLog
GDPCapLogFDILogNATLogOPENLogTOTREVLog
19
817615
143210
)(
)()()()(
)()()()()(
(1) where the pair of terms (i, t) expresses the transversal and temporal aspects of our unbalanced panel dataset, with i = 1, ..125 and the annual time-period, t = 1995-2012.
0 to 9 are parameters to be estimated. i are country-specific fixed effects; t temporal dummies.
it is an error term. The definition and source of variables are provided in Appendix 1.
By the way, to mitigate the heteroscedasticity problem and to facilitate interpretation of variables in terms of elasticity, we transform all variables that contain negative values using the procedure adopted in Dabla-Norris, Minoiu and Zanna (2015), as follows: Y = sign(X)*(log(1+abs(X))) where Y is the transformed variable and X is the variable that has been transformed. The variables "X" transformed here include: "NAT", "FDI", and "COR". Hence, the "Log" transformation of these variables allows us to retain information related to both zero entries as well as negative observations. Note however that the minimum value of all the other variables is higher than 0.
5.2 Equation specification for development aid flows
In this study, we consider the total ODA inflows received by a given country (in a given year) to perform the analysis. The determinants of these inflows are drawn from the literature on ODA determinants. In particular, apart from trade openness and financial flows (discussed above), the total aid received by recipients is determined by a range of other factors, including: the recipient-countries' per capita income; the size of recipients’ population; and the quality of institutions in recipient countries.
16
- The recipient-countries' per capita income: it acts as a proxy for recipients' needs (see for e.g. Berthelemy, 2006). Recipients that experience a higher level of development (proxied by per capita income) are expected to receive less aid. Nevertheless, if bilateral aid is guided by self-interest, the per capita income could exert a positive effect on donors' bilateral aid supply.
- The size of recipients’ population: it has been argued as an important factor in bilateral aid allocated by donors (see for e.g., Alesina and Dollar, (2000); Bandyopadhyay and Wall (2007); Dowling and Hiemenz, (1985); Isenman (1976); Trumbull & Wall (1994); Wall, (1995)). The arguments put forth are summarized by Younas (2008) as follows: (i) the marginal impact of aid decreases as the population increases; (ii) high population countries lack the administrative expertise to absorb large amounts of aid; (iii) it is relatively easier for donors to wield political influence over a smaller country than a large country.
- The quality of institutions in recipient countries: it also matters for donors' aid allocation (see for e.g., Alesina and Dollar (2000), Alesina and Weder (2002); Svensson (2000), Neumayer (2003a) and Bandyopadhyay and Wall, 2007). While some obtain empirical evidence of positive effect, others find negative effect, and even no significant effect (see more details for e.g., in In'airat, 2014). For example, Alesina and Weder (2002) show that among donors, corruption is a decisive factor for aid allocation only for Australian and Scandinavian donor countries. Svensson (2000) and Neumayer (2003a) find a weak role of corruption in the selection of recipient countries that will benefit from foreign aid. Alesina and Dollar (2000) found that apart from France, Italy, Belgium, and Austria, most donors provide more aid to recipients with better political and civil rights. Trumball and Wall (1994) observe that an altruistic donor may not necessarily provide more aid to poorer nations with the view to punishing the recipient government for political oppression. Bandyopadhyay and Wall (2007) provide evidence that an improvement in civil/political rights in recipient countries is associated with higher aid receipts. Against this background, we postulate the following equation:
ittiititit
ititititit
POLSTABLogPOPLogCORLog
GDPCAPLogFDILogTOTREVLogOPENLogNATLog
17615
143210
)()()(
)()()()()(
(2) where i represents the country's index; t denotes the annual time-period, t = 1995-2012, in the unbalanced panel dataset. The definition and source of variables could be found in Appendix 1.
0 to 7 are parameters to be estimated. i are country-specific fixed effects; t are annual
temporal dummies. As for equation (1), we transform all variables that contain negative values using the procedure
adopted in Dabla-Norris, Minoiu and Zanna (2015). These variables include here "NAT", "FDI", "COR", and "POLSTAB".
5.3 Equation specification for FDI Inflows The empirical literature on the determinants of FDI inflows is voluminous. In addition to the trade
openness, which as we mention above, is critical in explaining FDI inflows, other macroeconomic factors have been identified by the literature as important determinants of FDI inflows to host countries. They include inter alia, market seeking, resource seeking and efficiency-seeking factors.
17
Regarding market-seeking factor, we follow this literature and consider the real GDP per capita as a measure of the host-country's domestic market. For example, Asiedu (2002) argues that the size of the local market could be viewed by market-seeking FDIs as an opportunity to enter host market. Edison et al. (2002), Prasad et al. (2003), and Vo and Daly (2007) show evidence that rich countries tend to attract foreign investment inflows. The depth of financial market development has also been identified by the literature as an important factor to explain foreign investment inflows. This factor acts as a proxy for the imperfection of financial markets: the deeper a country's financial markets, the more capital flows it will attract. Alfaro et al. (2008) argue that deeper financial markets may allow FDI inflows to finance short- and long term transactions more easily and meet capital needs in the local market.
Concerning resource-seeking factor, we use resource rents to capture the availability of resources (see for e.g., Edison and Reinhart, 2001; and Prasad et al., 2003; Asiedu, 2006; Okafor et al., 2015). Important rents from natural resources indicate the availability of abundant and low cost natural resources in the host country. This particularly provides incentives for MNEs to undertake FDIs, notably in developing countries where they could serve both home and overseas markets (Kinoshita and Campos, 2002). Furthermore, Edison and Reinhart (2001), Prasad et al. (2003) and Vo (2005) suggest that the desire to exploit natural resources (usually crude oil and mineral ores) in developing countries is one of the most important reasons that attract foreign investors to these countries. All in all, we could expect resource rents to be associated with higher inward FDI.
We capture efficiency-seeking factors through institutional variables such as political stability (see for e.g., Asiedu, 2002; Busse and Hefeker, 2007), and real effective exchange rate, the latter reflecting inter alia macroeconomic stability in the host country. It is expected that better institutional quality, including lower corruption and political stability be associated with higher foreign investments, including FDI inflows. The impact of real exchange rate on inward FDI is not clear-cut. On the one hand, Tolentino (2010) documents that exchange rates can affect FDI through two main channels: the wealth effect channel through which the relative wealth of foreign investors compared to domestic investors would increase following the host country currency depreciation. This would encourage foreign investors to acquire more domestic assets, which become cheaper. The second channel is the relative production cost channel according to which the depreciation of the host country currency induces a reduction in local production costs, in terms of foreign currency, which raises the profit of export-oriented FDI and leads to further FDI inflows. On the other hand, Kish and Vasconcellos (1993) argues that the relationship may not be straightforward, given that when a country's currency strengthens, the future profits to be repatriated from the acquiring firm's subsidiary will have a lower discount value. This suggests that the price of the asset should not be the main consideration, but rather the nominal return that the asset generates in foreign currency (McCulloch, 1999). While previous empirical studies such as Caves (1989), Froot and Stein (1991) and Boateng et al. (2015) find that exchange rate depreciation is associated with higher FDI inflows, other studies such as Healy and Palepu (1993) have obtained little support for this theory. Overall, we could expect an appreciation of the real effective exchange rate to be negatively related to FDI inflows, although a positive effect may also be obtained. Against this background, we postulate the following equations:
18
ittiitititit
ititititit
CREDITLogREERLogCORLogRENTSLog
GDPCAPLogNATLogTOTREVLogOPENLogFDILog
18171615
143210
)()()()(
)()()()()(
(3) where i represents the country's index; t denotes the annual time-period, t = 1995-2012.
0 to 8 are parameters to be estimated. i are country-specific effects; and t are annual time-
period effects. it is an error term. Appendix 1 contains the definition and source of the variables
used in this equation. Similarly to equations (1) and (2), we transform, into logarithm the variables "NAT", "FDI", and
"COR" variables by means of the procedure used in Dabla-Norris, Minoiu and Zanna (2015). Before discussing the estimation strategy, it is important to note that for equations (1) to (3), we
provide descriptive Statistics on variables used in the analysis in Appendix 2, pairwise correlation between variables used in the analysis in Appendix 3 and finally the list of the 125 countries used in the analysis in Appendix 4.
6. Empirical strategy
We estimate equations (1) to (3) in a framework of system of simultaneous equations where the dependent variable of each equation appears to be a regressor of the other structural equations. It could be noted that each of our three equations contains the two other financial flows variables in order to take into account the interdependence between these financial flows variables.
As the use of ordinary least squares (OLS) to estimate this system of equations will generate inconsistent results, we make use of the three-stage least squares (3SLS) which corrects for the endogeneity of the dependent variables as well as the trade openness variable in the structural equations, and generate unbiased and efficient estimates (Wooldridge, 2002; Greene, 2008). In particular, the 3SLS procedure applies generalized least squares to account for the correlation in the error terms across the three equations, while estimating the system by the two-stage least squares (2SLS) procedure (Greene, 2008). According to Greene (2008), if the system is properly identified, the 3SLS technique is consistent and more asymptotically efficient than the 2SLS procedure. Moreover, it hinges on the use of instrument variables to control for endogeneity, with all exogenous variables in the equation being considered as instrument variables. It is important to note here that in the system of equations forming by equations (1) to (3), we have considered a number of covariates with a one-year lag (that is, as predetermined), with a view to mitigating the possible endogeneity problem relating to the reverse causality from the dependent variable to each of these covariates. These covariates include all variables except for the trade openness variable (which we consider as endogenous) and the dependent variable of each equation considered as a regressor in other equations.
Finally, in estimating the system of equations by means of 3SLS, we consider the first and second lags of each of the endogeneous regressors (i.e., the dependent variable of each equation considered as a regressor of the other structural equations, as well as the trade openness variable) as additional variable instrument variables. Since the introduction of country fixed-effects and year effects are equivalent to a procedure of a two-way fixed effects specification (country and year), we opt for the latter approach. In particular, we transform all the variables of the system of equations (1) to (3) by de-meaning them with respect to country fixed effects and time effects.
19
Note that in addition to estimating the system of simultaneous equations over the entire sample of 125 countries, we also undertake the estimation over sub-samples of LDCs and non-LDCs (i.e., countries of the sample that are not LDCs): the sample of 125 countries contains 37 LDCs and 88 non-LDCs.
7. Interpretation of estimations' results Before starting the discussion of estimations' results, we provide in Figures 1 to 3 the correlation
pattern between each financial flows for development considered in this study (NAT and FDI) and the degree of Trade Openness. Each Figure displays this correlation pattern for the entire sample, the sub-sample of LDCs and the sub-sample of non-LDCs.
Figure 1 shows that over the entire sample, there is a clear positive correlation pattern between total government public revenue and the degree of trade openness, on the one hand, and total government public revenue and FDI inflows on the other hand. However, the direction of the correlation between development aid inflows and trade openness is not clear-cut.
Figures 2 and 3 present similar correlation patterns to the ones observed in Figure 1 between ODA, FDI and trade openness, over respectively LDCs and non-LDCs.
Table 1 presents the results of the estimation of the system of simultaneous equations using the 3SLS technique. In general, when using the 3SLS procedure, the judgement of the significance of an equation is based on the significance of the Chi2 Statistic (p-value should be lower than 0.01 at the 10% level of statistical significance), rather than on the R-squares (Greene, 2008). The Chi2 statistics and the associated p-value reported at the bottom of Table 1 clearly indicate the joint significance of the variables included in the three specified equations and estimated over the entire sample as well as the sub-samples of LDCs and non-LDCs. Columns [1] to [3] present the outcome of the estimation of the system of equations respectively over the entire sample, the sub-samples of LDCs and non-LDCs. Hence, for example, column [1] reports the outcome of the estimation of the system of equations over the entire sample, i.e., the results obtained simultaneously for the structural equations on government public revenue, Net Aid Transfers, and FDI inflows. Columns [2] and [3] present similar structures.
For the interpretation of results, we consider each structural equation, while examining the outcome over the entire sample and the two sub-samples. To put it differently, we interpret results over government public revenue across columns [1] to [3], over NAT across the three columns and over FDI inflows across these three columns. Let us start with the outcome over the structural equation on government public revenue (across columns [1] to [3]). We find evidence that trade openness is consistently associated with higher government public revenue, irrespective of the sample (and sub-samples) considered. Specifically, a 1% increase in the degree of trade openness generates an increase of total government public revenue by 0.23% over the entire sample, 0.174% in LDCs, and 0.289% in non-LDCs.
Regarding the interplay between financing of development flows and government public revenue, we obtain evidence that:
- development aid does not significantly influence total government public revenue over the entire sample, as well as non-LDCs, but does exert a negative and significant effect on total government public revenue in LDCs. This tends to indicate that higher development aid is associated with a demobilization of the total government public revenue in LDCs. This peculiar

20
result on the sub-sample of LDCs may reflect some institutional weaknesses, including the lack of appropriate institutions in LDCs that prevent them from relying on higher development aid to generate higher government public revenue. It could also reflect positive and negative impact of aid on different components of total government public revenue, including total non-tax revenue, non-resource tax revenue and resource tax revenue.
- FDI inflows exert no significant impact on government public revenue over the entire sample; however, for LDCs, we find a strong positive and significant effect: a 1% increase in FDI inflows, in % GDP, induces a 0.146% increase in government public revenue in LDCs. For non-LDCs, we obtain a negative impact of FDI inflows on the total government public revenue. This result may be explained by the fact that government public revenue collected when multinationals set up FDI in these countries is not sufficiently high to compensate for the loss of government public revenue due to tax incentives provided to attract these FDI inflows. One explanation of the lower revenue collected from multinationals that set up FDI could be the tax evasion.
The outcome relating to control variables is equally interesting: for the entire sample, total
government public revenue is positively driven by higher per capita income, natural resource rents, higher value addition in the non-agricultural sector, lower corruption, increase in the size of population, and an appreciation of the real effective exchange rate. For LDCs, it is positively driven only by natural resource rents and low level of corruption; the other covariates do not exert a significant influence on government public revenue in these countries. For non-LDCs, the positive drivers of government public revenue include higher per capita income, an increase in the value addition of the non-agricultural sector, lower level of corruption, and higher size of population.
Let us now turn to the results obtained for the structural equation on NAT, across columns [1] to [3]. We find that a rise in the degree of trade openness is consistently associated with higher development aid inflows across the three columns. Indeed, a 1% increase in the degree of trade openness induces a rise in development aid inflows by a 0.518% over the entire sample, 0.78% over LDCs and 0.439% over non-LDCs. These results clearly show that as compared to non-LDCs, donors particularly encourage trade openness in LDCs by supplying them with higher aid flows.
FDI inflows induce higher development aid on the entire sample as well as in LDCs: a 1% rise in FDI inflows (% GDP) is associated with a 0.22% increase in development aid inflows for the full sample, and 0.381% increase in aid inflows that accrue to LDCs. In other words, FDI inflows and development aid are complementary in both the entire sample and LDCs. However, for non-LDCs, we find no significant impact of FDI inflows on development aid inflows.
Furthermore, development aid inflows are not sensitive to the level of government public revenue over the entire sample and in non-LDCs. In the meantime, we observe that the higher the level of government public revenue, the lower the development aid inflows to LDCs: a 1% increase in the government public revenue (% GDP) in LDCs is associated with a 0.96% decline in aid inflows.
Regarding control variables, we note that irrespective of the sample considered, a rise in per capita income and lower corruption level induce higher aid inflows. The increase in the size of the population is associated with lower development aid over the entire sample as well as over LDCs, but not over non-LDCs, as for the latter we obtain no significant effect.
21
Finally, across the three samples, we find no significant effect of political stability on development aid inflows.
Let us now take up the results of estimations associated with the structural equation on FDI inflows, across columns [1] to [3]. We find no evidence of significant impact of trade openness on FDI inflows on the entire sample. However, this impact is on average negative for LDCs and positive for non-LDCs. It is difficult to interpret these results as the total FDI inflows reflect several types of FDI on which trade openness can exert different effects.
Taxation, measured by the ratio of government public revenue to GDP exerts a positive impact on FDI inflows in LDCs (a 1% increase in total government public revenue, in percentage of GDP is associated with a 2.286% increase in FDI inflows to LDCs) and a negative effect on FDI inflows to non-LDCs (a 1% increase in total government public revenue, in percentage of GDP is associated with a 1.3% decline in FDI inflows to LDCs). Over the entire sample, we obtain no significant impact of government public revenue on FDI inflows.
Development aid inflows appear here to be complementary with FDI inflows on the full sample as well as on the sub-sample of LDCs: a 1% increase in development aid inflows generates a 0.26% increase in FDI inflows (% GDP) for the entire sample and a 0.84% increase in FDI inflows in LDCs. In other words, on the full sample as well as over the sub-sample of LDCs, aid inflows constitute an important catalyser for FDI inflows. In the meantime, development aid inflows do not exert a significant influence on FDI inflows in non-LDCs.
Results on control variables suggest the following: - over the entire sample, FDI inflows are (surprisingly) positively driven by lower per capita
income, a depreciation of the real effective exchange rate and the development of domestic financial markets. The other control variables appear to exert no significant influence on FDI inflows.
- Over LDCs, the factors that attract FDI include a depreciation of the real effective exchange rate, higher total government public revenue (in % GDP) and (surprisingly) lower natural resource rents. The other control variables are not significantly associated with FDI inflows.
- Over non-LDCs, FDI inflows seem to be driven by lower level of corruption, lower government public revenue (in % GDP) and the development of domestic financial markets.
8. Conclusion
The need to mobilize higher levels of financing flows for development to address development challenges has been highlighted in the 2030 Development Agenda adopted by UN Members states in September 2015, as well as in the Addis Ababa Action Agenda, the outcome of the third international conference on financing for development held in July 2015 in Addis Ababa, Ethiopia. The chief role that domestic public finance could play in financing the implementation of the SDGs and the catalysing role of other financing for development flows, including international public finance flows and private capital flows, along with other key means of implementation such as trade, have been well underlined in these two agendas.
In the meantime, the development literature (for e.g., Rajan and Subramanian, 2009; Beck, 2013, and Arcand et al., 2015) cautions against the fact that too much finance could exert adverse effects on recipient economies.

22
This paper contributes to the existing literature on the role of trade openness in financing development by focusing on three major financing flows for development, including government public revenue, ODA and FDI inflows. In that respect, it investigates empirically whether trade openness contributes to financing development, notably affecting government public revenue, ODA and FDI inflows. The empirical analysis also allows us to examine the interplay between these three types of financing for development flows.
The study is carried out by relying on a framework of a system of structural equations using an unbalanced panel dataset comprising 125 countries, over the annual period 1995-2012. Hence, we used the three-stage least squares technique to perform the analysis.
The results are as follows: - Trade openness is consistently associated with higher government public revenue, as well as
higher development aid inflows, including over the entire sample, LDCs and non-LDCs. Likewise, trade openness exerts no significant impact on FDI inflows over the entire sample, but does influence negatively FDI inflows in LDCs and positively FDI inflows in non-LDCs.
- Over the entire sample, development aid inflows exert no significant effect on total government public revenue. In the meantime, development aid inflows received by countries are insensitive to the level of government public revenue. Development aid inflows also appear to be a catalyser for FDI inflows, which in turn drive positively development aid. At the same time, the latter exerts no significant impact on government public revenue. Similarly, government public revenue does not matter for FDI inflows.
- Over LDCs, aid inflows influence negatively and significantly total government public revenue. In addition, higher the level of government public revenue positively drives FDI inflows and exerts a negative effect on development aid inflows. The latter and FDI inflows are complementary, and FDI inflows positively influence government public revenue in LDCs.
- Over non-LDCs, development aid inflows do not influence total government public revenue, and are also insensitive to the government public revenue to GDP ratio. In the meantime, there is no interplay between development aid inflows and FDI inflows, while the latter exert a negative and significant impact on the total government public revenue. Government public revenue itself affects negatively FDI inflows.
The policy implication of this analysis is that international trade openness could be an important tool for mobilizing financial resources for development, including for the implementation of SDGs, in light of its strong and positive effect on development aid flows and on government public revenue (the latter being ultimately the primary source for financing development) on all countries and its positive effects on FDI inflows in non-LDCs. Incidentally, these three types of financial flows do not appear to be necessarily independent of each other, as there exist some interactions between them that take the form of complementarity or substitutability. Although the current study has not covered all types of financial flows for development given that its main purpose is to examine the impact of trade openness on government revenue, ODA, and FDI inflows, it does show that the calculation of a statistical indicator encompassing all supports for development flows should take into account the fact that financial flows for development may not necessarily interact in a substitutable way. An interesting avenue for research could be to investigate in a more comprehensive way the interactions between all types of financial flows for development. This could provide a better guidance on how to compute the statistical indicator that would encompass all financing for development flows.
23
References Adam, C., D. Bevan, and Chambas, G. (2001). Exchange rate regimes and revenue performance in Sub-Saharan Africa. Journal of Development Economics, 64, 173–213. Agbeyegbe, T. D., Stotsky, J. and WoldeMariam, A. (2006). Trade liberalization, exchange rate changes, and tax revenue in Sub-Saharan Africa. Journal of Asian Economics, 17(2): 261-284. Alesina, A and Dollar, D. (2000). Who gives foreign aid to whom and why? Journal of Economic Growth, 5(1), 33–63. Alesina, A., and Weder, B. (2002). Do corrupt governments receive less foreign aid? American Economic Review, 92(4), 1126–1137. Alfaro, L., Chanda, A., Kalemli-Ozcan, S., and Volosovych, V. (2008). “Why doesn’t Capital Flow from Rich to Poor Countries? An Empirical Investigation,” Review of Economics and Statistics 90(2), pp.347-368. Alonso J. A. and Garcimartín C. (2011). Does Aid Hinder Tax Efforts? More Evidence. CREDIT Research Paper, 11/04. Arcand, J.L., Berkes, E., and Panizza, U. (2015). Too much finance? Journal of Economic Growth, 20(2), 105-148. Arellano, C., Bulírˇ, A., Lane, T. and Lipschitz, L. (2009). The Dynamic Implications of Foreign Aid and its Variability. Journal of Development Economics 88, 87–102. Asiedu, E. (2002). On the determinants of foreign direct investment to developing countries: Is Africa different? World Development, 30(1): 107–119. Asiedu, E. (2006). Foreign direct investment in Africa: The role of natural resources, market size, government policy, institutions and political instability. World Economy, 29(1): 63–77. Azam J.-P., Devarajan S., and O’Connell S. A. (1999). Aid Dependence Reconsidered. Policy Research Working Paper, 2144, Washington, D.C: World Bank. Bandyopadhyay, S and Wall, H. (2007). The determinants of aid in the Post Cold-War era. Federal Reserve Bank of St. Louis Review, 89(6), 533–547. Bahl, R. W. (1971). A Regression Approach to Tax Effort and Tax Ratio Analysis. International Monetary Fund Staff Paper, 18, 570-612. Bahl, R. W. (2003). 'Reaching the Hardest to Tax: Consequences and Possibilities'. Paper presented at the ‘Hard to Tax: An International Perspective’ conference, Andrew Young School of Policy Studies, Georgia State University, May 15-16. Baltagi, B.H. (2005). Econometric Analysis of Panel Data (John Wiley, Chichester). Baunsgaard, T., and Keen M. (2010). Tax Revenue and (or?) Trade Liberalization. Journal of Public Economics, 94(9-10), 563 – 577.

24
Beck, T. (2013). Finance for development: A research agenda. DFID ESRC Growth Research Programme. Available at: http://r4d.dfid.gov. uk/pdf/outputs/DEGRP/Finance-Development-Research-Report-September-2013.pdf Bellak, C., Leibrecht, M., and Stehrer, R. (2009). The role of public policy in closing foreign direct investment gaps: An empirical analysis. In Y. Wolfmayr-Schnitzer (Ed.), Empirica, Special Issue on FDI Policies, 37, 19–46. Benedek D., Crivelli E., Gupta S., Muthoora P. S. (2012). Foreign Aid and Revenue: Still a Crowding Out Effect? IMF Working Papers, WP/12/186. Berthélemy, J. C. (2006). Bilateral donors’ interest vs. recipients’ development motives in aid allocation: Do all donors behave the same?. Review of Development Economics, 10(2), 179–194. Bhavan, T., C. Xu and Zhong, C. (2011). The Relationship between Foreign Aid and FDI in South Asian Economies’, International Journal of Economics and Finance 3(2), 143–9. Bird, R. M., Martinez-Vazquez, J. and Torgler, B. (2008). Tax Effort in Developing Countries and High Income Countries: The Impact of Corruption, Voice and Accountability, Economic Analysis and Policy, 38(1), 55-71. Blaise, S. (2005). On the link between Japanese ODA and FDI in China: A microeconomic evaluation using Conditional Logit analysis. Applied Economics, 37, 51–55. Blejer, M., and Cheasty, A. (1990). “Fiscal Implications of Trade Liberalization,” in V. Tanzi (ed), Fiscal Policy in Open Developing Economies, Washington D.C. International Monetary Fund, pp. 66-81. Blundell, R. and Bond, S. (1998). Initial conditions and moment restrictions in dynamic panel data equations. Journal of Econometrics, 87, 115–143. Bornhorst, F., Gupta, S. and Thornton, J. (2009). Natural Resource Endowments and the Domestic Revenue Effort. European Journal of Political Economy 25, 439–446. Boateng, A., Hua, X., Nisar, S., and Wu, J. (2015). Examining the determinants of inward FDI: Evidence from Norway. Economic Equationing, 47,118-127. Brun J.F., Chambas, G., and Mansour, M. (2015). "Tax Effort of Developing Countries: An Alternative Measure", In: Financing Sustainable Development Addressing Vulnerabilities, Chapter 11. Edited by Boussichas, M., and Guillaumont, P., Economica. FERDI. Brun, J.F., Chambas, G. and Guerineau, S. (2007). Aide et mobilisation fiscale dans les pays en développement. Rapport Thématique N° 21, Agence Française de Développement. Brun J.-F., Chambas G., and Guerineau, S. (2011a). Aide et Mobilisation Fiscale dans les pays en Développement. Jumbo, 21: 1–53. Brun J.-F., Chambas G., Laporte, B. (2011b). IMF Programs and Tax Effort What Role for Institutions in Africa?. CERDI Etudes et Documents, 2010.33.

25
Busse, M., and Hefeker, C. (2007). Political risk, institutions and foreign direct investment. European Journal of Political Economy 23, 397–415. Cagé, J. and Gadenne, L. (2014). Tax Revenues, Development, and the Fiscal Cost of Trade Liberalization, 1792-2006, Working Paper. Caselli, F. and Feyrer, J. (2007). The Marginal Product of Capital. Quarterly Journal of Economics 122(2), 535–68. Cassou, S. P. (1997). The Link Between Tax Rates and Foreign Direct Investment. Applied Economics, 29, pp. 1295-1301. Caves, R.E., (1989). Mergers, takeover and economic efficiency. International Journal of Industrial Organization, 7, 151–175. Chelliah, R. J. (1971). Trends in Taxation in Developing Countries. IMF Staff Papers, 18, 254-332. Clist, P., and Morrissey, O. (2011). Aid and Tax Revenue: Signs of a Positive Effect Since the 1980s. Journal of International Development, 23: 165–80. Clist, P. (2014). Foreign Aid and Domestic Taxation: Multiple Sources, One Conclusion. ICTD Working Paper 20. Brighton: IDS. Collie, R.D. (2011). Multilateral trade liberalisation, foreign direct investment and the volume of world trade. Economics Letters, 113, 47–49. Crivelli, E. and Gupta, S. (2014). Resource Blessing, Revenue Curse? Domestic Revenue Effort in Resource-Rich Countries. IMF Working Paper, WP/14/5. Dabla-Norris, E., Minoiu, C., and Zanna, L.F. (2015). Business Cycle Fluctuations, Large Macroeconomic Shocks, and Development Aid. In: "Aid Policy and the Macroeconomic Management of Aid", Edited by Tony Addison and Finn Tarp. World Development, 69, 44–61. Davidson, R. and MacKinnon, J. G. (2004). Econometric Theory and Methods, Oxford University Press. Dowling, J.M., Hiemenz, U. (1985). Biases in allocation of foreign aid: some new evidence. World Development, 13(4), 535–541. Drummond, P., Daal, W. Srivastava, N. and Oliveira, L.E. (2012) Mobilizing Revenue in Sub-saharan Africa: Empirical Norms and Key Determinants. IMF Working Paper No. 12/108, Washington, DC. Dudley, L and Montmarquette, C. (1976). A Equation of the Supply of Bilateral Aid. American Economic Review, 66(1): 132-142. Ebrill, L., Stotsky, J. and Gropp, R. (1999). Revenue implications of trade liberalization, Occassional Paper, 180. International Monetary Fund, Washington, DC. Edmiston, K., Mudd, S., and Valev, N. (2003). Tax structure and FDI: The deterrent effects of complexity and uncertainty. Fiscal Studies, 24, 27–41.
26
Edison, H. and Reihnart, C. (2001). Stopping hot money. Journal of Development Economics, 66:533-553. Edison, H. J., Levine, R., Ricci, L. and Slok, T. (2002). International financial integration and economic growth. Journal of International Money and Finance, 21(6), 749-776. European Union, (2015). European Report on Development, 2015: Combining finance and policies to implement a transformative post-2015 development agenda. Joint Report of the ODI, ECDP, DiE, University of Athens, and Southern Voice. Fernandez-Arias, E. and Montiel, P. (1996). The Surge in Capital Inflows to Developing Countries: An Analytical Overview. World Bank Economic Review 10(1): 51-77. Frankel, J.A. (1999). No Single Currency Regime is Right for All Countries or At All Times. NBER Working Paper No. 7338, Cambridge, MA. Froot, K., and Stein, J.C. (1991). Exchange rates and foreign direct investment: an imperfect capital markets approach. Quarterly Journal of Economics, 106, 1191–1217. Fugazza, M. and Trentini, C. (2014). Empirical Insights on Market Access and Foreign Direct Investment. UNCTAD Policy Issues in International Trade and Commodities, Study Series, N°) 63. Gastanaga, V, Nugent, J. B., Pashamova, B. (1998). Host Country Reforms and FDI Inflows: How Much Difference Do They Make? World Development 26(7): 1299-1314. Greene, W.H. (2008). Econometric Analysis. Prentice Hall, New Jersey. Grubert, H., Mutti, J. (1991). Taxes, Tariffs and Transfer Pricing in Multinational Corporate Decision Making. Review of Economic Studies, 73, pp. 285-293. Gupta S., Clements B. J., Pivovarsky A., and Tiongson E. R. (2003). Foreign Aid and Revenue Response Does the Composition of Aid Matter? IMF Working Papers, WP/03/176. Gupta, S. (2007). Determinants of Tax Revenue Efforts in Developing Countries. IMF Working Paper 07/184. Washington: International Monetary Fund. Harms, P., and Lutz, M. (2006). Aid, governance and private foreign investment: Some puzzling findings for the 1990s. Economic Journal, 116, 773–790. Healy, P.M., and Palepu, K.G. (1993). International Corporate Equity Acquisitions: Who, Where and Why? In: Froot, Kenneth A. (Ed.), Foreign Direct Investment. The University of Chicago Press, Chicago and London. Heller P. S. (1975). A Equation of Public Fiscal Behaviour in Developing Countries: Aid, Investment and Taxation. American Economic Review, 65: 429–45. Helpman, E. (1984). A simple theory of international trade with multinational corporations. Journal of Political Economy. 92(3):451–471.

27
Helpman, E., Krugman, P. (1985). Market Structure and Foreign Trade. The MIT Press, Cambridge. Hines, J. R., Rice, E. M. (1994). Fiscal Paradise: Foreign Tax Havens and American Business. The Quarterly Journal of Economics, 109, pp. 149-182. Hisali, E. (2012). Trade policy reform and international trade tax revenue in Uganda. Economic Equationling, 29, 2144-2154. IEA (2013). Global Land Transport Infrastructure Requirements: Estimating road and railway infrastructure capacity and costs to 2050. Paris: International Energy Agency. International Finance Corporation (IFC) (2014). Access To Credit Among Micro, Small, And Medium Enterprises. International Finance Corporation. Available at: http://www.ifc.org/wps/wcm/connect/1f2c968041689903950bb79e78015671/Ac c e s s C re d i tMSME - B ro c h u re - F i n a l .pdf?MOD=AJPERES In'airat, M. (2014). Aid allocation, selectivity, and quality of governance. Journal of Economics, Finance and Administrative Science, 19, 63-68.
Isenman, P. (1976). Biases in aid allocation against poorer and large countries. World Development,
4(8), 631–641.
Jackson, S., Markowski, S. (1995). The Attractiveness of Countries to Foreign Direct Investment. Journal of World Trade, 29, pp. 159-180. Karakaplan, M. U., Neyapti, B., and Sayek, S. (2005). Aid and foreign investment: International evidence. Departmental Working Paper, Bilkent University. Kaufmann, D, Kraay, A. and Mastruzzi, M. (2010). The Worldwide Governance Indicators Methodology and Analytical Issues. World Bank Policy Research N° 5430 (WPS5430). Khan H. A., Hoshino E. (1992). Impact of Foreign Aid on the Fiscal Behaviour of LDC. World Development, 20: 1481–8. Khattry, B., and Mohan, J. R. (2002). Fiscal Faux Pas?: An analysis of the revenue implications of trade liberalization. World Development 30 (8), 1431–1444. Kimura, H. and Todo, Y. (2010). Is foreign aid a vanguard of FDI? A gravity equation approach. World Development, 38(4): 482–497. Kinoshita, Y., and Campos, N. F. (2002). The location determinants of foreign direct investment in transition economies. Center for Economic Policy Research.
28
Kish, R.J., and Vasconcellos, G. M. (1993). An empirical analysis of factors affecting cross-border acquisitions: US–Japan. Management International Review, 33 (3): 227–245. Kosack, S. and Tobin, J. (2006). Funding Self-Sustaining Development: the role of Aid, FDI and Government in Economic Success. International Organization 60, 205-243. Knack S., Rahman A. (2007). Donor Fragmentation and Bureaucratic Quality in Aid Recipients. Journal of Development Economics, 83: 176–97. Lane, P.R., and Milesi-Ferretti, G. M. (2003). International financial integration. Discussion Paper 03, Institute for International Integration Studies. Lane, P.R. and Milesi-Ferretti, G. M. (2007). The external wealth of nations mark II: Revised and extended estimates of foreign assets and liabilities, 1970–2004. Journal of International Economics 73, November, 223-250. Lim, D. (1983). Fiscal Incentive and Direct Foreign Investment in Less Developed Countries. The Journal of Development Studies, 19, pp. 207- 212. Loree, D., Guisinger, S. E. (1995). Policy and Non-Policy Determinants of U.S. Equity Foreign Direct Investment. Journal of International Business Studies, 26, pp. 281-300. Lundsgaarde, E., Breunig, C., and Prakash, A. (2007). Trade Versus Aid: Donor Generosity in an Era of Globalization. Policy Sciences 40 (2). 157-179. Martens B., Mummert U., Murrell P., Seabright P. (2002). The Institutional Economics of Foreign Aid. Cambridge: Cambridge University Press. Morrissey, O., Prichard, W. and Torrance, S. (2014). Aid and Taxation: Exploring the Relationship Using New Data, ICTD Working Paper 21, Brighton: International Centre for Tax and Development. Morrissey O. (2015). Aid and Government Fiscal Behavior: Assessing Recent Evidence. World Development, 69: 98–105. Moss T. J., Pettersson G., Van de Walle N. (2006). An Aid-institutions Paradox? A Review Essay on Aid Dependency and State Building in sub-Saharan Africa’, Center for Global Development Working Paper, 74. Nashashibi, K., and Bazoni, S. (1994). Exchange rate policies and fiscal performance in sub-Saharan Africa. IMF Staff Papers, 41 (1), 76–122. Neary, J. P. (2009). Trade costs and foreign direct investment. International Review of Economics and Finance, 18, 207–218. Neumayer, E (2003a). The determinants of aid allocation by regional multilateral development banks and United Nations agencies. International Studies Quarterly, 47(1),101–122. Okafor, G., Piesse, J., and Webster, A. (2015). The motives for inward FDI into Sub-Saharan African countries. Journal of Policy Equationing, 37: 875-890.
29
Ouattara, B. (2006). Foreign Aid and Government Fiscal Behaviour in Developing Countries: Panel Data Evidence. Economic Equationling, 23: 506–14. Porcano, T. M., Price, C. E. (1996). The Effects of Government Tax and Non-Tax Incentives on Foreign Direct Investment. Multinational Business Review, 4, pp. 9-20. Prasad, E., Rogoff, K., Wei, S-J., and Kose, M. A. (2003). Effect of financial globalization on developing countries: Some empirical evidence. Occasional Paper 220, IMF. Remmer K. L. (2004). Does Foreign Aid Promote the Expansion of Government?. American Journal of Political Science, 48: 77–92. Roodman, D. M (2009). A note on the theme of too many instruments. Oxford Bulletin of Economic and Statistics, 71 (1), 135–158. Roodman, D. (2011). Net aid Transfers Data Set 1960–2012. Center for Global Development, Washington, DC, http://www.cgdev.org/publication/net-aid-transfers-data-set-1960%E2%80%932012 Root, F., and Ahmed, A. (1979). Empirical determinants of manufacturing direct foreign investment in developing countries. Economic Development and Cultural Change 27(4): 751-767. Schneider, F. and Frey, B. (1985). Economic and political determinants of foreign direct investment. World Development 13(2): 161-175. Selaya, P. and Sunasen, E. R. (2012). Does Foreign Aid Increase Foreign Direct Investment?. World Development 40(11): 2155–76. Stotsky, J. G. and WoldeMariam, A. (1997). Tax effort in Sub-Saharan Africa. IMF Working Paper, WP/97/107. Svensson, J. (2000). Foreign aid and rent-seeking. Journal of International Economics, 51, 437-461. Development, 13(4), 535–541. Svensson J. (2006). The Institutional Economics of Foreign Aid. Swedish Economic Policy Review, 13: 115. Tanzi, V., (1989). "The Impact of Macroeconomic Policies on the Level of Taxation and the Fiscal Balance in Developing Countries,” The International Monetary Fund, Staff Paper, Vol. 36, pp. 633-56. Thomas, A., and Treviño, J.P. (2013). Resource Dependence and Fiscal Effort in Sub-Saharan Africa. IMF Working Paper, WP/13/188. Tolentino, P. E. (2010). Home country macroeconomic factors and outward FDI of China and India. Journal of International Management, 16, 102–120. Trumbull, W. N. and Wall, H. J. (1994). Estimating aid allocation criteria with panel data. Economic Journal, 104 (425), 876–882. Vo, X. V., and Daly, K. J. (2007). The determinants of international financial integration. Global Finance Journal, 18, 228-250.

30
Wall, H. J. (1995). The allocation of official development assistance. Journal of Policy Equationing,
17(3), 307–314.
Wheeler, D. and Mody, A. (1992). International Investment Location Decisions: The Case for U.S. Firms. Journal of International Economics, 33, pp. 57-76. Wooldridge, J. M. (2002). Econometric Analysis of Cross Section and Panel Data. MIT Press, Cambridge, MA. Younas, J. (2008). Motivation of Bilateral Aid Allocation: Altruism or Trade Benefits. European Journal of Political Economy. 24(3), 661-74. Yohou, H., Goujon, D., Michaël, M., and Ouattara, W. (2016). Heterogeneous Aid Effects on Tax Revenues: Accounting for Government Stability in WAEMU Countries. Journal of African Economies, 1–31.
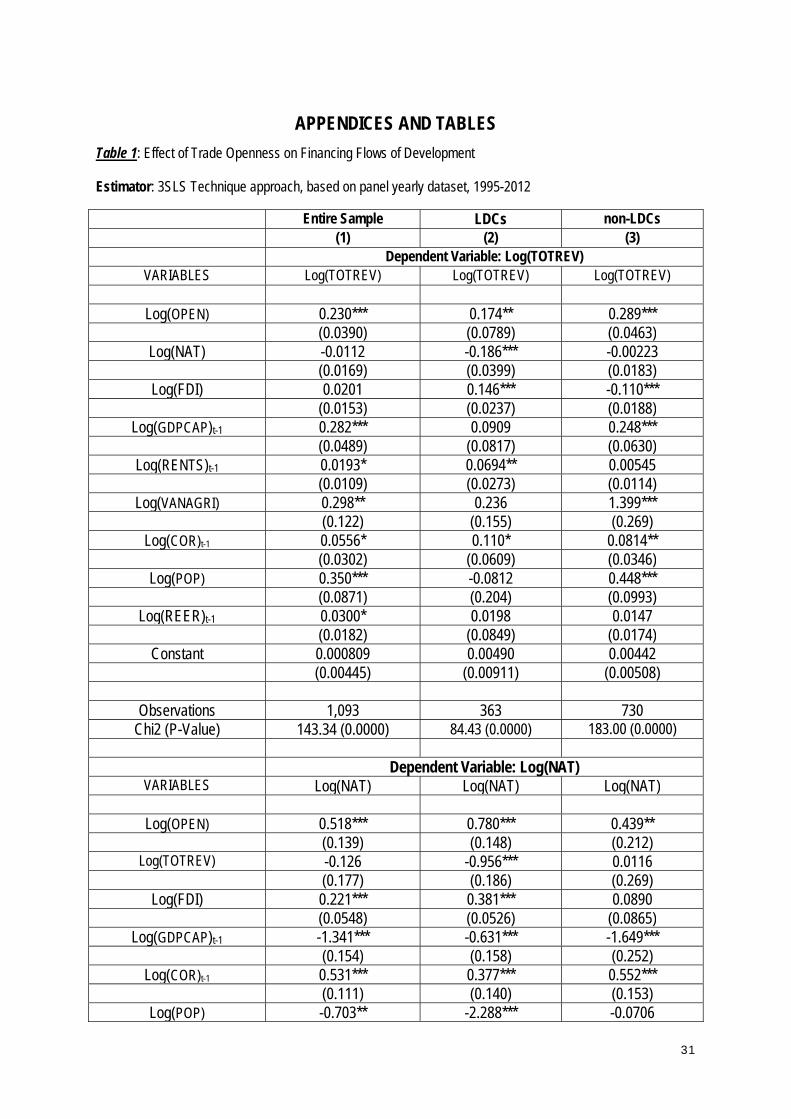
31
APPENDICES AND TABLES
Table 1: Effect of Trade Openness on Financing Flows of Development Estimator: 3SLS Technique approach, based on panel yearly dataset, 1995-2012
Entire Sample LDCs non-LDCs (1) (2) (3) Dependent Variable: Log(TOTREV)
VARIABLES Log(TOTREV) Log(TOTREV) Log(TOTREV)
Log(OPEN) 0.230*** 0.174** 0.289*** (0.0390) (0.0789) (0.0463)
Log(NAT) -0.0112 -0.186*** -0.00223 (0.0169) (0.0399) (0.0183)
Log(FDI) 0.0201 0.146*** -0.110*** (0.0153) (0.0237) (0.0188)
Log(GDPCAP)t-1 0.282*** 0.0909 0.248*** (0.0489) (0.0817) (0.0630)
Log(RENTS)t-1 0.0193* 0.0694** 0.00545 (0.0109) (0.0273) (0.0114)
Log(VANAGRI) 0.298** 0.236 1.399*** (0.122) (0.155) (0.269)
Log(COR)t-1 0.0556* 0.110* 0.0814** (0.0302) (0.0609) (0.0346)
Log(POP) 0.350*** -0.0812 0.448*** (0.0871) (0.204) (0.0993)
Log(REER)t-1 0.0300* 0.0198 0.0147 (0.0182) (0.0849) (0.0174)
Constant 0.000809 0.00490 0.00442 (0.00445) (0.00911) (0.00508)
Observations 1,093 363 730 Chi2 (P-Value) 143.34 (0.0000) 84.43 (0.0000) 183.00 (0.0000)
Dependent Variable: Log(NAT)
VARIABLES Log(NAT) Log(NAT) Log(NAT)
Log(OPEN) 0.518*** 0.780*** 0.439** (0.139) (0.148) (0.212)
Log(TOTREV) -0.126 -0.956*** 0.0116 (0.177) (0.186) (0.269)
Log(FDI) 0.221*** 0.381*** 0.0890 (0.0548) (0.0526) (0.0865)
Log(GDPCAP)t-1 -1.341*** -0.631*** -1.649*** (0.154) (0.158) (0.252)
Log(COR)t-1 0.531*** 0.377*** 0.552*** (0.111) (0.140) (0.153)
Log(POP) -0.703** -2.288*** -0.0706
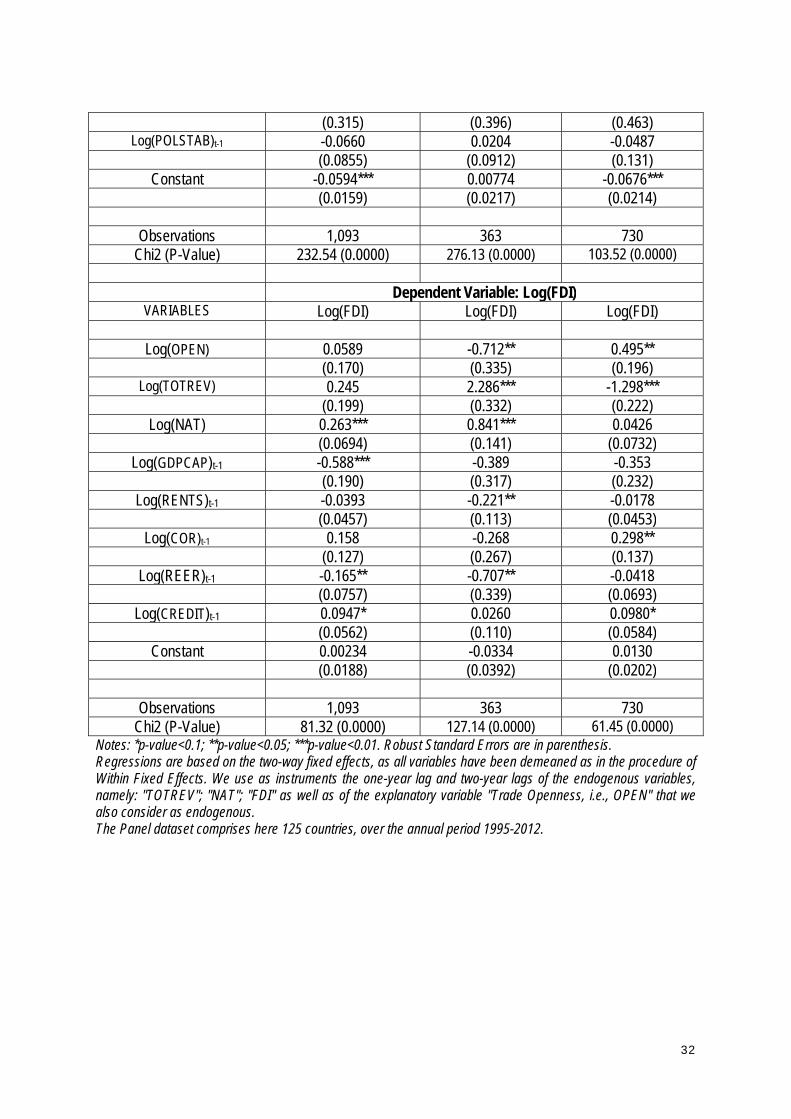
32
(0.315) (0.396) (0.463) Log(POLSTAB)t-1 -0.0660 0.0204 -0.0487
(0.0855) (0.0912) (0.131) Constant -0.0594*** 0.00774 -0.0676***
(0.0159) (0.0217) (0.0214)
Observations 1,093 363 730 Chi2 (P-Value) 232.54 (0.0000) 276.13 (0.0000) 103.52 (0.0000)
Dependent Variable: Log(FDI)
VARIABLES Log(FDI) Log(FDI) Log(FDI)
Log(OPEN) 0.0589 -0.712** 0.495** (0.170) (0.335) (0.196)
Log(TOTREV) 0.245 2.286*** -1.298*** (0.199) (0.332) (0.222)
Log(NAT) 0.263*** 0.841*** 0.0426 (0.0694) (0.141) (0.0732)
Log(GDPCAP)t-1 -0.588*** -0.389 -0.353 (0.190) (0.317) (0.232)
Log(RENTS)t-1 -0.0393 -0.221** -0.0178 (0.0457) (0.113) (0.0453)
Log(COR)t-1 0.158 -0.268 0.298** (0.127) (0.267) (0.137)
Log(REER)t-1 -0.165** -0.707** -0.0418 (0.0757) (0.339) (0.0693)
Log(CREDIT)t-1 0.0947* 0.0260 0.0980* (0.0562) (0.110) (0.0584)
Constant 0.00234 -0.0334 0.0130 (0.0188) (0.0392) (0.0202)
Observations 1,093 363 730 Chi2 (P-Value) 81.32 (0.0000) 127.14 (0.0000) 61.45 (0.0000)
Notes: *p-value<0.1; **p-value<0.05; ***p-value<0.01. Robust Standard Errors are in parenthesis. Regressions are based on the two-way fixed effects, as all variables have been demeaned as in the procedure of Within Fixed Effects. We use as instruments the one-year lag and two-year lags of the endogenous variables, namely: "TOTREV"; "NAT"; "FDI" as well as of the explanatory variable "Trade Openness, i.e., OPEN" that we also consider as endogenous. The Panel dataset comprises here 125 countries, over the annual period 1995-2012.

33
APPENDICES Appendix 1: Variables - Definitions and sources
Variable Definition Source
TOTREV Total government public revenue, excluding grants and social contributions, in % GDP
ICTD Government public revenue Dataset. See online: http://www.ictd.ac/index.php/dataset#core-dataset
FDI Foreign Direct Investment (FDI) Inflows, in % of GDP
UNCTAD Database
NAT
Net Aid Transfers (NAT), in % of GDP. This is the net Official Development
Assistance (ODA), from which are subtracted principal payments are received
on ODA loans, interest received on such loans and debt relief.
GDP data (in current prices) are extracted from the World Development Indicators of the World Bank (WDI), 2014. NAT data (in current prices) stem
from the Center for Global Development and have been calculated by Roodman (2011), who updated
them in 2014
OPEN Openness degree of a country, measured by the sum of exports and imports, as a share of
GDP World Development Indicators (WDI)
GDPCAP Real GDP per capita (constant 2005 prices) World Development Indicators (WDI) POP Total population World Development Indicators (WDI)
REER
Real effective exchange rate (CPI based), Index Base 2005. A rise in this index
indicates a real effective exchange rate appreciation, whereas a decrease means
the REER depreciation.
CERDI Database. CERDI = Centre d'Etudes et de Recherches sur le
Développement International
RENTS Total natural resources rents (% of GDP) World Development Indicators (WDI)
VANAGRI Non-Agricultural share of Total Value Added, i.e. (100 – Value Added in Agriculture, in % of
Total Value Added) United Nations Database
POLSTAB
It denotes the Political Stability and Absence of Violence/Terrorism. It reflects perceptions of the
likelihood that the government will be destabilized or overthrown by unconstitutional
or violent means, including politically-motivated violence and terrorism.
World Bank Governance Indicators developed by Kaufmann, Kraay and Mastruzzi (2010) and
updated in 2013. Data on this variable range from -2.5 to 2.5, with the lower values being associated
with higher political instability and Violence/Terrorism, and the higher values being associated with Political Stability and Absence of
Violence/Terrorism
COR It denotes the level of corruption
World Bank Governance Indicators developed by Kaufmann, Kraay and Mastruzzi (2010) and
updated in 2013. Data on this variable range from -2.5 to 2.5, with the lower values being associated
with higher level of corruption, and the higher values being associated with lower level of
corruption.
CREDIT Domestic credit to private sector by banks (% of
GDP) World Development Indicators (WDI)

34
Appendix 2: Descriptive Statistics on Variables used in the analysis
Variable Observations Mean Standard Deviation Minimum Maximum TOTREV 2124 22.302 10.356 1.014 81.545
NAT 2025 5.567 8.349 -2.685 106.600 FDI 2250 4.641 7.035 -65.411 90.456
OPEN 2179 88.030 48.059 14.933 531.737 GDPCAP 2232 4733.537 7847.856 50.042 60290.180 RENTS 2213 12.540 16.124 0.001 86.168
VANAGRI 2250 83.621 14.074 5.229 100.000 COR 1745 -0.337 0.716 -2.057 1.974 POP 2250 4.09E+07 1.53E+08 69660 1.35E+09
POLSTAB 1746 -0.316 0.911 -3.185 1.480 REER 2173 737.545 10706.440 44.235 251215.600
CREDIT 2168 34.778 33.568 0.198 311.985 Appendix 3: Pairwise Correlation between variables used in the analysis
TOTREV NAT FDI OPEN GDPCAP RENTS VANAGRI TOTREV 1.0000
NAT -0.2312* 1.0000 FDI 0.0798* 0.0233 1.0000
OPEN 0.2958* -0.0981* 0.4663* 1.0000 GDPCAP 0.4045* -0.3012* 0.0511* 0.3090* 1.0000 RENTS 0.3504* 0.0369* 0.0883* 0.0295 0.1552* 1.0000
VANAGRI 0.5470* -0.6185* 0.0316 0.3375* 0.4943* -0.0244 1.0000 COR 0.2576* -0.2035* 0.1106* 0.2775* 0.5702* -0.3098* 0.4851* POP -0.0940* -0.1298* -0.0786* -0.1845* -0.0911* -0.0465* -0.0033
POLSTAB 0.3135* -0.1185* 0.1506* 0.3685* 0.4020* -0.2123* 0.3931* REER -0.0160 -0.0491* -0.0409* 0.0271 -0.0229 0.0968* 0.0434*
CREDIT 0.1418* -0.3042* 0.1022* 0.3329* 0.3318* -0.2485* 0.4288* Notes: *p-value < 0.1. Appendix 3: Pairwise Correlation between variables used in the analysis (Continuous)
COR POP POLSTAB REER CREDIT COR 1.0000 POP -0.0734* 1.0000
POLSTAB 0.6541* -0.1548* 1.0000 REER -0.0685* -0.0070 -0.0729* 1.0000
CREDIT 0.5421* 0.1547* 0.3091* 0.0111 1.0000 Notes: *p-value < 0.1.
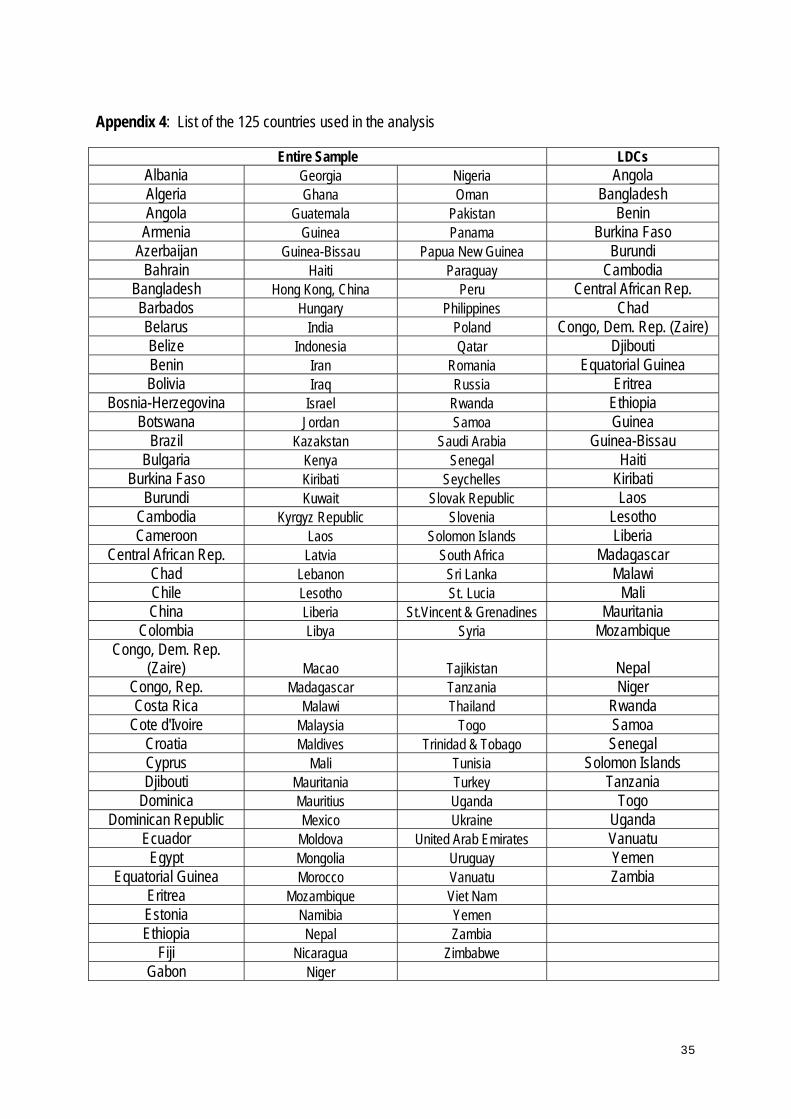
35
Appendix 4: List of the 125 countries used in the analysis
Entire Sample LDCs Albania Georgia Nigeria Angola Algeria Ghana Oman Bangladesh Angola Guatemala Pakistan Benin
Armenia Guinea Panama Burkina Faso Azerbaijan Guinea-Bissau Papua New Guinea Burundi
Bahrain Haiti Paraguay Cambodia Bangladesh Hong Kong, China Peru Central African Rep. Barbados Hungary Philippines Chad Belarus India Poland Congo, Dem. Rep. (Zaire) Belize Indonesia Qatar Djibouti Benin Iran Romania Equatorial Guinea Bolivia Iraq Russia Eritrea
Bosnia-Herzegovina Israel Rwanda Ethiopia Botswana Jordan Samoa Guinea
Brazil Kazakstan Saudi Arabia Guinea-Bissau Bulgaria Kenya Senegal Haiti
Burkina Faso Kiribati Seychelles Kiribati Burundi Kuwait Slovak Republic Laos
Cambodia Kyrgyz Republic Slovenia Lesotho Cameroon Laos Solomon Islands Liberia
Central African Rep. Latvia South Africa Madagascar Chad Lebanon Sri Lanka Malawi Chile Lesotho St. Lucia Mali China Liberia St.Vincent & Grenadines Mauritania
Colombia Libya Syria Mozambique Congo, Dem. Rep.
(Zaire) Macao Tajikistan Nepal Congo, Rep. Madagascar Tanzania Niger Costa Rica Malawi Thailand Rwanda
Cote d'Ivoire Malaysia Togo Samoa Croatia Maldives Trinidad & Tobago Senegal Cyprus Mali Tunisia Solomon Islands Djibouti Mauritania Turkey Tanzania
Dominica Mauritius Uganda Togo Dominican Republic Mexico Ukraine Uganda
Ecuador Moldova United Arab Emirates Vanuatu Egypt Mongolia Uruguay Yemen
Equatorial Guinea Morocco Vanuatu Zambia Eritrea Mozambique Viet Nam Estonia Namibia Yemen Ethiopia Nepal Zambia
Fiji Nicaragua Zimbabwe Gabon Niger

36
FIGURES Figure 1: Correlation Pattern between Financial Flows for Development (% GDP) and Trade Openness (% GDP)_Entire Sample
020
40
60
80
Gove
rnment Revenue, in %
GDP
0 100 200 30 0 4 00 500Trade Openness, % GDP
REVENUE Fitted values
020
40
60
80100
Net Aid Transfers, in %
GDP
0 100 2 00 300 400 500Trade Openne ss, % GDP
NAT Fitted values
-100
-50
050
100
FDI Inflows, in %
GDP
0 100 200 30 0 4 00 500Trade Openness, % GDP
FDI Fitted values
Source: Authors
Figure 2: Correlation Pattern between Financial Flows for Development (% GDP) and Trade Openness (% GDP)_Sub-Sample of LDCs
020
40
60
80
Gove
rnment Revenue, in %
GDP
0 100 200 30 0 4 00 500Trade Openness, % GDP
REVENUE Fitted values
020
40
60
80
100
Net Aid Transfers, in %
GDP
0 100 2 00 300 400 500Trade Openne ss, % GDP
NAT Fitted values
-100
-50
050
100
FDI Inflows, in %
GDP
0 100 200 30 0 4 00 500Trade Openness, % GDP
FDI Fitted values
Source: Authors
Figure 3: Correlation Pattern between Financial Flows for Development (% GDP) and Trade Openness (% GDP)_Sub-Sample of non-LDCs
020
40
60
80
Government Revenue, in %
GDP
0 100 20 0 30 0 4 00 5 00Trade Openness, % GDP
REVENUE Fitted values
010
20
30
40
50
Net Aid Transfers, in %
GDP
0 100 200 300 400 500Trade Openne ss, % GDP
NAT Fitted values
-20
020
40
60
FDI Inflows, in %
GDP
0 100 20 0 30 0 4 00 5 00Trade Openness, % GDP
FDI Fitted values
Source: Authors