does the presence of professional football cause crime … · 2016-11-16 · does the presence of...
TRANSCRIPT
Department of Economics
Working Paper Series
Does the Presence of Professional Football Cause Crime in a City? Evidence from Pontiac, Michigan Hyunwoong Pyun
Joshua C. Hall
Working Paper No. 16-02
This paper can be found at the College of Business and Economics Working Paper Series homepage:
http://be.wvu.edu/phd_economics/working-papers.htm
Does the Presence of Professional Football Cause Crime in a City?
Evidence from Pontiac, Michigan
Hyunwoong Pyun∗
West Virginia University
Joshua C. Hall†
West Virginia University
Abstract
We empirically explore the relationship between the National Football League (NFL) and crime
using daily panel data from Detroit. We exploit the natural experiment of the Detroit Lions
movement from Pontiac MI to downtown Detroit in 2002 to examine the impact of NFL games
on crime in a jurisdiction. Pontiac is used as a treatment city and other suburban cities are used
as a comparison group. Employing a triple difference-in-difference approach, we find little to no
change in crime on a home game day in Pontiac compared to other suburban cities. There is
no difference in crime between the football season and off-season, among the groups, after the
Lions moved. While not conclusive, our results are suggestive that professional football does
not create additional crime except for larceny.
Keywords: National Football League, stadium, National Incident-Based Reporting System,
crime, externality
∗Department of Economics, College of Business and Economics, PO Box 6025, Morgantown WV 26506-6025;email: [email protected]†Department of Economics, College of Business and Economics, PO Box 6025, Morgantown WV 26506-6025;
email: [email protected]; phone: 304-293-7870.
1

Introduction
In the early 1990s, professional sports teams in North America experienced a boom in the construc-
tion of professional sports stadiums and arenas. For example, from 2000 to 2010, 14 new National
Football League (NFL) stadiums were built. Approximately 44% of the total construction costs of
these facilities came from public funding (Fort, 2011). To justify these significant public subsidies,
a direct economic benefit from a new facility might be expected. A large number of carefully done
studies on this topic, however, find little or no economic benefits (Baade et al., 2008; Coates and
Humphreys, 2002, 2003; Siegfried and Zimbalist, 2000). Proponents of public funding for new sta-
diums also point to intangible benefits, such as civic pride from the presence of professional sports
franchises. Several papers estimate this benefit using contingent valuation methods, and largely
find that benefits, to the extent they exist, do not cover construction costs (Johnson et al., 2001;
Owen, 2006; Groothuis et al., 2004; Johnson et al., 2007).
In addition to any positive economic and social benefits professional sports might have to
metropolitan areas, the potential negative impact of sporting facilities and events needs to be
considered. Very few studies have done so, however, and those that have been conducted primarily
focus on American football and crime. There are are at least three possible reasons why professional
football games are associated with an increase in crime. First, because of the aggressive nature
of American football, games might make attendees or viewers more violent and therefore likely
to commit crime. Second, a large amount of alcohol is consumed during games and pre-game
tailgates. Excessive consumption of alcohol during games makes it more likely that football fans
will be involved in alcohol-related offenses and crimes such as assaults, vandalism, and disorderly
conduct. Third, criminals might face a lower opportunity cost of committing crimes on game day
as a large number of individuals are away from home and clustered together in a contained area.1
For example, Rees and Schnepel (2009) examine the relationship between crime and college
football games using the National Incident-Based Reporting System (NIBRS). They find sharp
increases in assaults, vandalism, arrests for disorderly conduct, and arrests for alcohol-related of-
fenses on game day in hosting communities. Using this same data, Card and Dahl (2011) explore
the impact of NFL games on family crime and they find that upset losses by the home team in-
1On this point but with data from college basketball, Yu et al. (2016) find that home games (but not away games)are associated with robberies.
2
crease domestic violence against women. Kalist and Lee (2014) also find that NFL home games are
associated with an increase in total crime, specifically, larceny and motor vehicle theft. All of these
studies use daily data and examine the changes in the number of crimes on game day compared to
other days. The only study not to find any effect between professional football and crime is Bau-
mann et al. (2012). Using annual data, they find little to no evidence supporting the relationship
between crime and NFL games. None of these studies provides evidence of a causal relationship,
rather they just report the statistical association (or lack thereof) between professional football and
crime.
These mixed results in the literature generate at least two hypotheses. It could be that profes-
sional football leads to more crime and that findings using annual data are too aggregated to find
the true effect. Conversely, it could be that professional football does not lead to crime and papers
using daily data are largely showing that crime concentrates on game days. Much like spending
on professional sports, which comes from reduced spending elsewhere in the local economy, crime
on game days might be the result of reduced behavior during the rest of the time. For example,
robberies committed on game days would instead be spread out throughout the week. If the latter
hypothesis is true, the total number of crimes annually in cities with professional football would
not differ from those without a team.
This paper examines the extent to which professional football causes more crime. We use the
Detroit Lions’ migration to a new stadium as a natural experiment to examine the true effect of
professional football on crime. If professional football causes crime in the city where the games are
played, there should be a decline in crime following a team’s departure. Using daily NIBRS data
and a triple difference-in-difference approach, we find little to no evidence for a causal relationship
between professional football and crime, with the exception of larceny. While our study has several
limitations, which we discuss in our summary, it is an important first step towards answering the
causal question and thereby possibly advancing the empirical literature on football and crime. In
addition, using Pontiac as a treatment city has an important advantage. Pontiac has a population
of less than 70,000. Average attendance per Detroit Lions game before the move was greater than
70,000. If the effect of football games on crime is positive, the case of Pontiac should show it. Urban
policymakers should also find our results of use, as a number of professional football franchises are
currently rumored to be moving or obtaining new stadiums.
3

Data and Empirical Approach
After 2000, 3 NFL teams migrated to new stadiums in a different jurisdiction in the same Metropoli-
tan Statistical Area (MSA). In 2002, the Detroit Lions migrated from Pontiac to Detroit. The
Arizona Cardinals migrated from Tempe to Glendale in 2006 and the Dallas Cowboys moved from
Irving to Arlington in 2009. Unfortunately, none of the jurisdictions housing the Arizona Cardinals
and Dallas Cowboys provided crime data to the NIBRS, so we were unable to include these two
cases in our study. Our need to use daily data causes us to focus solely on the Lions move from
Pontiac to Detroit. We set Pontiac, which lost the Lions in 2002, as our treatment city and other
available cities in Detroit MSA (Dearborn, Farmington Hills, Southfield, Taylor, Troy, and Warren)
are used as a comparison group.2 Characteristics of the sample cities are shown in Table 1. Warren
has the highest population (138,247), while the population in Pontiac and Taylor are under 70,000.
Pontiac and Southfield have the highest African-American percentage while other cities have less
than 10%. Pontiac also records the highest unemployment rate. Farmington Hills and Troy are top
two cities in terms of median income, education rate, and relatively low annual crime rate.
Table 1: General Characteristics for Sample Cities
Treatment Comparison groupgroup
Pontiac Dearborn Farmington Southfield Taylor Troy WarrenHills
Population 66,337 97,775 82,111 78,296 65,868 80,959 138,247Female% 51.3 50.3 51.6 54.1 51.8 50.5 51.1Median age 30.0 34.5 38.6 38.3 33.9 38.1 37.9Black% 49.9 1.5 6.9 54.2 8.7 2.1 2.7College grad or higher% 10.3 26.4 47.9 36.7 7.0 50.0 13.0Unemployment rate 10.3 5.3 2.9 4.6 6.5 3.3 4.7Median income 31,207 44,560 67,498 51,802 42,944 77,538 44,626Assaults 846 787 150 817 223 64 559Thefts 1,760 3,197 1,375 2,757 2,004 1,663 2,584Auto thefts 546 1,176 164 828 525 205 1,462
Data are from The U.S. Census 2000 and Uniform Crime Reports in 2001.
We employ data 3 years before and after migration day. Our sample period is therefore from 1999
to 2004. Following Rees and Schnepel (2009) and Card and Dahl (2011), we use daily NIBRS data in
this study and estimate the effect of professional football on assaults, vandalism, larceny and motor
2Detroit and Livonia are not included in this paper as they do not report crime data to the NIBRS during thesample period.
4
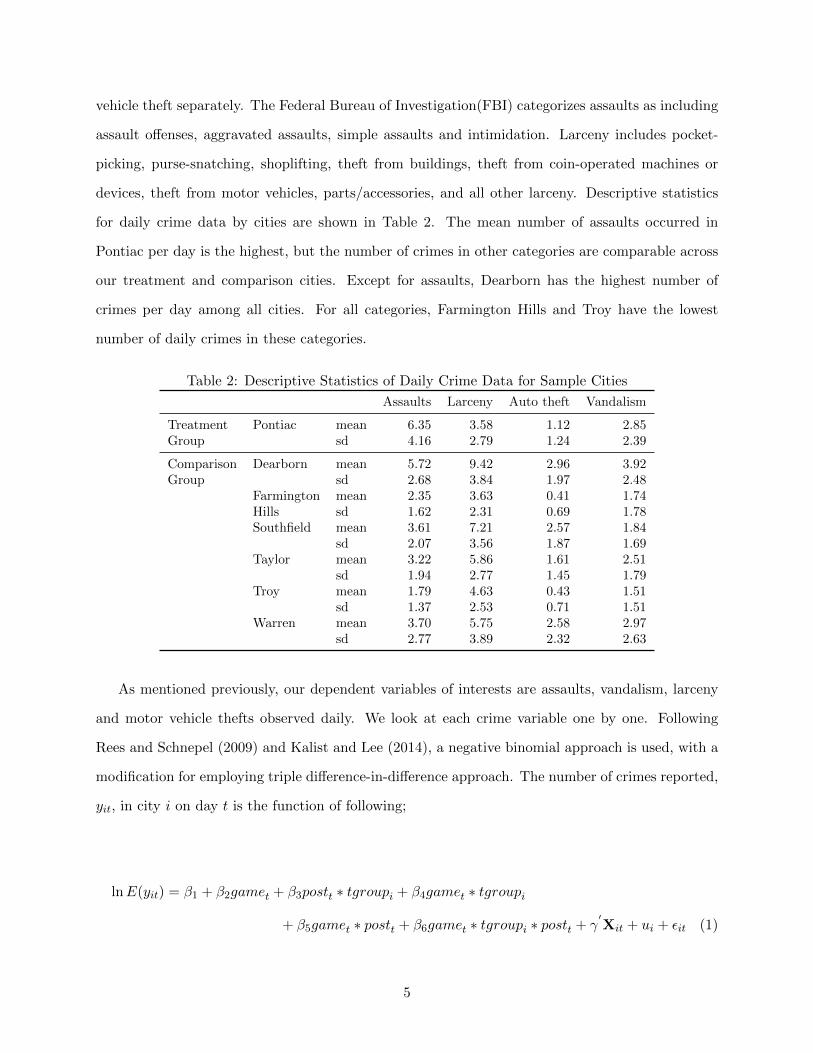
vehicle theft separately. The Federal Bureau of Investigation(FBI) categorizes assaults as including
assault offenses, aggravated assaults, simple assaults and intimidation. Larceny includes pocket-
picking, purse-snatching, shoplifting, theft from buildings, theft from coin-operated machines or
devices, theft from motor vehicles, parts/accessories, and all other larceny. Descriptive statistics
for daily crime data by cities are shown in Table 2. The mean number of assaults occurred in
Pontiac per day is the highest, but the number of crimes in other categories are comparable across
our treatment and comparison cities. Except for assaults, Dearborn has the highest number of
crimes per day among all cities. For all categories, Farmington Hills and Troy have the lowest
number of daily crimes in these categories.
Table 2: Descriptive Statistics of Daily Crime Data for Sample Cities
Assaults Larceny Auto theft Vandalism
Treatment Pontiac mean 6.35 3.58 1.12 2.85Group sd 4.16 2.79 1.24 2.39
Comparison Dearborn mean 5.72 9.42 2.96 3.92Group sd 2.68 3.84 1.97 2.48
Farmington mean 2.35 3.63 0.41 1.74Hills sd 1.62 2.31 0.69 1.78Southfield mean 3.61 7.21 2.57 1.84
sd 2.07 3.56 1.87 1.69Taylor mean 3.22 5.86 1.61 2.51
sd 1.94 2.77 1.45 1.79Troy mean 1.79 4.63 0.43 1.51
sd 1.37 2.53 0.71 1.51Warren mean 3.70 5.75 2.58 2.97
sd 2.77 3.89 2.32 2.63
As mentioned previously, our dependent variables of interests are assaults, vandalism, larceny
and motor vehicle thefts observed daily. We look at each crime variable one by one. Following
Rees and Schnepel (2009) and Kalist and Lee (2014), a negative binomial approach is used, with a
modification for employing triple difference-in-difference approach. The number of crimes reported,
yit, in city i on day t is the function of following;
lnE(yit) = β1 + β2gamet + β3postt ∗ tgroupi + β4gamet ∗ tgroupi
+ β5gamet ∗ postt + β6gamet ∗ tgroupi ∗ postt + γ′Xit + ui + εit (1)
5
where gamet is equal to 1 if the Detroit Lions has a game on day t; tgroupi is equal to 1 for
Pontiac, postt is equal to 1 after the Lions moves to a new stadium. X is a vector of control
variables, including dummy variables for whether the day is a holiday or a college bowl game, and
day, month, and year specific fixed effects. In addition, as the stadium in Pontiac have hosted
the Motor City Bowl during the sample period, we also include a bowl game dummy variable.
The variable ui indicates city specific fixed effects and εit is an error term. Note that tgroupi
and postt are excluded as the effect of these variable will be captured by city or year fixed effects.
The coefficient β6 will capture the change in crime on game day in Pontiac after the Lions moved
compared to other cities in the comparison group. Therefore, if the presence of professional football
games in a jurisdiction causes more crime, β6 is expected to be negative (i.e., crime will decrease
after the Lions moved from Pontiac compared to all other cities in the comparison group). We also
employ this same estimation except we use hgamet instead of gamet to see if crime is driven by
attendance at the game instead of non-attendance game day behaviors. In this estimation, hgamet
is equal 1 if Detroit Lions has a home game on day t.
It is possible that some portion of game attendees commit football-related crimes before or
after game day. For example, assaults following a Sunday night game that occur in the early hours
of Monday morning. This effect is not captured with equation (1). A dummy variable for the
NFL season could be used as an additional comparison group because the NFL season is relative
short (September to December usually). Therefore, if football games cause more crime, we should
observe more crimes being committed during the football season compared to the off-season. This
approach has the advantage of avoiding the possible aggregation issue of annual data. To estimate
this effect, a triple difference-in-difference approach is used to see the difference in daily crime
between season and non-season, between Pontiac and other comparison cities, between before and
after team moving, and difference in all three differences. seast is equal to 1 if NFL season is
progressing. Other variables are exactly same with those in equation (1). The equation for our
triple difference-in-difference is:
6
lnE(yit) = δ1 + δ2seast + δ3seast ∗ tgroupi + δ4seast ∗ postt + δ5tgroupi ∗ postt
+ δ6seast ∗ tgroupi ∗ postt + γ′Xit + ui + εit (2)
Similar to equation (1), if the presence of a professional football game in a city causes more
crime in that city, δ6 is expected to be negative.
Empirical Results
The results for Equation (1) are shown in Table 3. Columns (1), (3), (5), and (7) use game while
the even columns use hgame for the target explanatory variable.3 For all dependent variables, the
coefficients on game and hgame are not statistically significant except vandalism (on game) and
larceny (on hgame). Vandalism is reduced on days with home games while vandalism goes up.
Recall, however, that the coefficients on game and hgame in this paper estimate change in crime
on a game day in every sample city, not just in a city with a football stadium. The interaction terms
between post and game or hgame, tgroup and game or hgame are not significant for all models.
Theses coefficients capture the change in crime on a game day in sample cities, and treatment city
(Pontiac) specific effects on crime on a game day. One notable result from the interaction terms
between post and tgroup is that they are all positive and statistically significant for every model,
except auto theft which is negative and statistically significant. These interaction terms capture
changes in crime on a game day in Pontiac after the Lions moved. Our results show that daily
crimes such as assaults, larceny, and vandalism increased after the Lions moved, while auto thefts
fell.
These results suggest that losing the Lions to Detroit was bad for Pontiac in terms of measured
assaults, larceny, and vandalism. The decline in auto thefts following the Lions’ move could be
related to the loss of professional football in Pontiac. However, the coefficient on game∗post∗tgroup
is positive and not statistically significant, suggesting that auto thefts on game days in Pontiac after
the Lions move to Detroit did not decline. This makes it less likely that the decline in auto thefts in
3Note that all coefficients for daily, monthly, yearly, and city specific fixed effects are jointly significant but notreported in Table 3 in the interests of space.
7
Pontiac post-departure are due to fewer automobiles coming to Pontiac for football games. Looking
at the coefficients on game ∗ post ∗ tgroup and hgame ∗ post ∗ tgroup they are not statistically
significant except for larceny during home games. This coefficient, suggests that there was less
larceny in Pontiac compared to other cities on days with a Lions home game after the Lions moved
to Detroit.
Table 4 shows the results of equation (2).4 As theory would predict, the impacts of holidays on
crime is negative as all dependent variables are negatively related to holidays, although the results
are statistically significant only for larceny and auto theft. The presence of the Motor City Bowl
actually lowers vandalism in a statistically significant manner. Presumably, this could be the result
of heightened policing events with a number of out-of-town fans in attendance. For all dependent
variables, coefficients on seas are positive and significant except auto theft. This suggests that
these crimes are higher during football season. The interaction terms, seas∗post and seas∗ tgroup
captures time trend in crime or treatment city-specific effects, respectively, which are not expected
to be related to football games. Similar with the result from the equation (1), the interaction terms
between post and tgroup are statistically significant for every model, with assaults, larceny, and
vandalism increasing and auto thefts declining.
4Similar to the results of Table 3, all coefficients for daily, monthly, yearly, and city specific fixed effects are jointlysignificant respectively though they are not shown in Table 4.
8
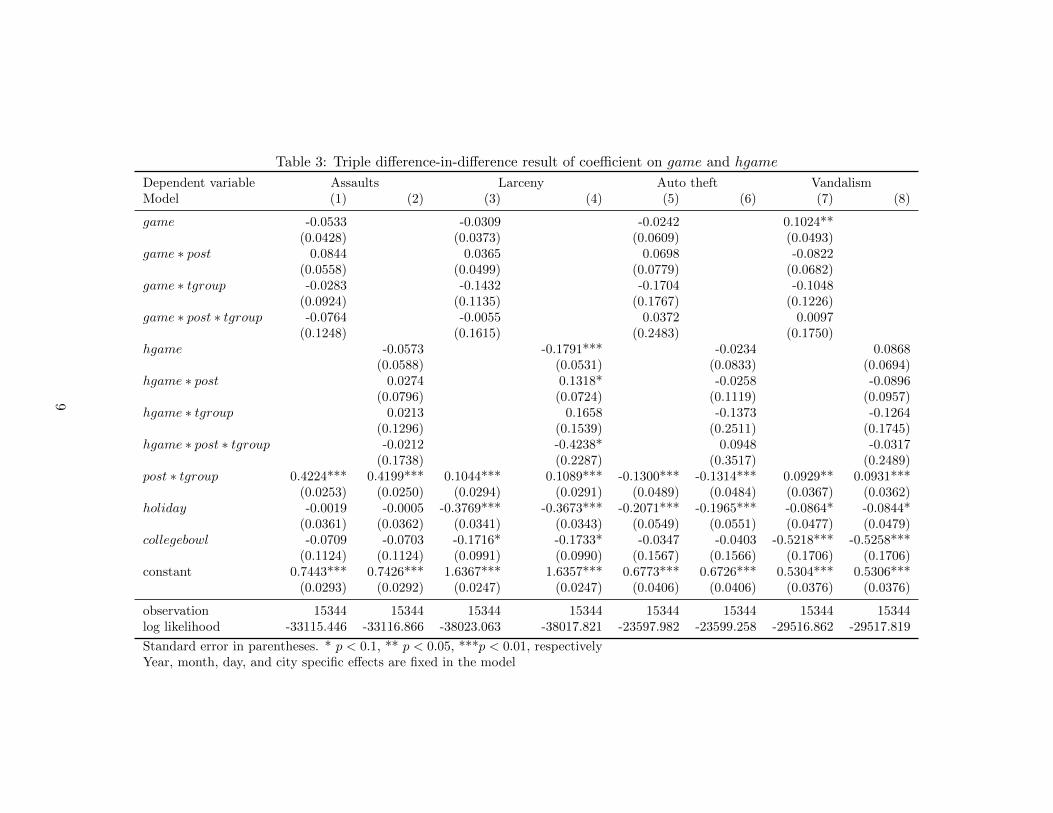
Table 3: Triple difference-in-difference result of coefficient on game and hgame
Dependent variable Assaults Larceny Auto theft VandalismModel (1) (2) (3) (4) (5) (6) (7) (8)
game -0.0533 -0.0309 -0.0242 0.1024**(0.0428) (0.0373) (0.0609) (0.0493)
game ∗ post 0.0844 0.0365 0.0698 -0.0822(0.0558) (0.0499) (0.0779) (0.0682)
game ∗ tgroup -0.0283 -0.1432 -0.1704 -0.1048(0.0924) (0.1135) (0.1767) (0.1226)
game ∗ post ∗ tgroup -0.0764 -0.0055 0.0372 0.0097(0.1248) (0.1615) (0.2483) (0.1750)
hgame -0.0573 -0.1791*** -0.0234 0.0868(0.0588) (0.0531) (0.0833) (0.0694)
hgame ∗ post 0.0274 0.1318* -0.0258 -0.0896(0.0796) (0.0724) (0.1119) (0.0957)
hgame ∗ tgroup 0.0213 0.1658 -0.1373 -0.1264(0.1296) (0.1539) (0.2511) (0.1745)
hgame ∗ post ∗ tgroup -0.0212 -0.4238* 0.0948 -0.0317(0.1738) (0.2287) (0.3517) (0.2489)
post ∗ tgroup 0.4224*** 0.4199*** 0.1044*** 0.1089*** -0.1300*** -0.1314*** 0.0929** 0.0931***(0.0253) (0.0250) (0.0294) (0.0291) (0.0489) (0.0484) (0.0367) (0.0362)
holiday -0.0019 -0.0005 -0.3769*** -0.3673*** -0.2071*** -0.1965*** -0.0864* -0.0844*(0.0361) (0.0362) (0.0341) (0.0343) (0.0549) (0.0551) (0.0477) (0.0479)
collegebowl -0.0709 -0.0703 -0.1716* -0.1733* -0.0347 -0.0403 -0.5218*** -0.5258***(0.1124) (0.1124) (0.0991) (0.0990) (0.1567) (0.1566) (0.1706) (0.1706)
constant 0.7443*** 0.7426*** 1.6367*** 1.6357*** 0.6773*** 0.6726*** 0.5304*** 0.5306***(0.0293) (0.0292) (0.0247) (0.0247) (0.0406) (0.0406) (0.0376) (0.0376)
observation 15344 15344 15344 15344 15344 15344 15344 15344log likelihood -33115.446 -33116.866 -38023.063 -38017.821 -23597.982 -23599.258 -29516.862 -29517.819
Standard error in parentheses. * p < 0.1, ** p < 0.05, ***p < 0.01, respectivelyYear, month, day, and city specific effects are fixed in the model
9

What is the impact on Pontiac compared to the comparison cities after losing the Lions? To
answer that question we look at the coefficients on seas ∗ post ∗ tgroup. None of the coefficients are
negative, and auto-theft is positive and statistically significant. A positive coefficient is interpreted
that there is an increase in auto theft during football season in Pontiac after the Lions moved
compared to other cities. Other results of target variables show no evidence for supporting the
causal relationship between football games in a jurisdiction and crime in that jurisdiction.
Table 4: Triple difference-in-difference of coefficient on seas
Dependent variable Assaults Larceny Auto theft Vandalism
seas 0.0810** 0.0692** 0.0516 0.1204***(0.0333) (0.0291) (0.0489) (0.0439)
seas ∗ post -0.0317 0.0009 0.0743** -0.0768***(0.0238) (0.0199) (0.0331) (0.0299)
seas ∗ tgroup -0.1361*** -0.1403*** -0.1684** -0.0889*(0.0384) (0.0425) (0.0701) (0.0522)
post ∗ tgroup 0.4249*** 0.1002*** -0.1918*** 0.0779*(0.0300) (0.0353) (0.0598) (0.0442)
seas ∗ post ∗ tgroup 0.0361 0.0533 0.1921* 0.0777(0.0542) (0.0629) (0.1028) (0.0775)
holiday -0.0000 -0.3731*** -0.1919*** -0.0743(0.0361) (0.0342) (0.0549) (0.0478)
collegebowl -0.0565 -0.1621 -0.0392 -0.5056***(0.1123) (0.0992) (0.1569) (0.1708)
constant 0.7278*** 1.6295*** 0.6812*** 0.5093***(0.0296) (0.0249) (0.0411) (0.0381)
observation 15344 15344 15344 15344log likelihood -33106.083 -38016.160 -23591.218 -29513.067
Standard error in parentheses. * p < 0.1, ** p < 0.05, ***p < 0.01, respectivelyYear, month, day, and city specific effects are fixed in the model
Robustness Check
Table 1 shows that there is considerable heterogeneity among the cities in our sample. Specially,
Farmington Hills and Taylor have relatively high median income, low unemployment rate, and
highly educated residents compared to the other cities. This heterogeneity might deter us from
finding the true relationship between crime and the presence of a football stadium in Pontiac. For
a robustness check, we employ the same empirical approach as earlier but excluding Farmington
Hills and Taylor. These robustness results are shown in Table 5, with only our primary explanatory
variables presented. Coefficients on game ∗ post ∗ tgroup and hgame ∗ post ∗ tgroup are from the
10
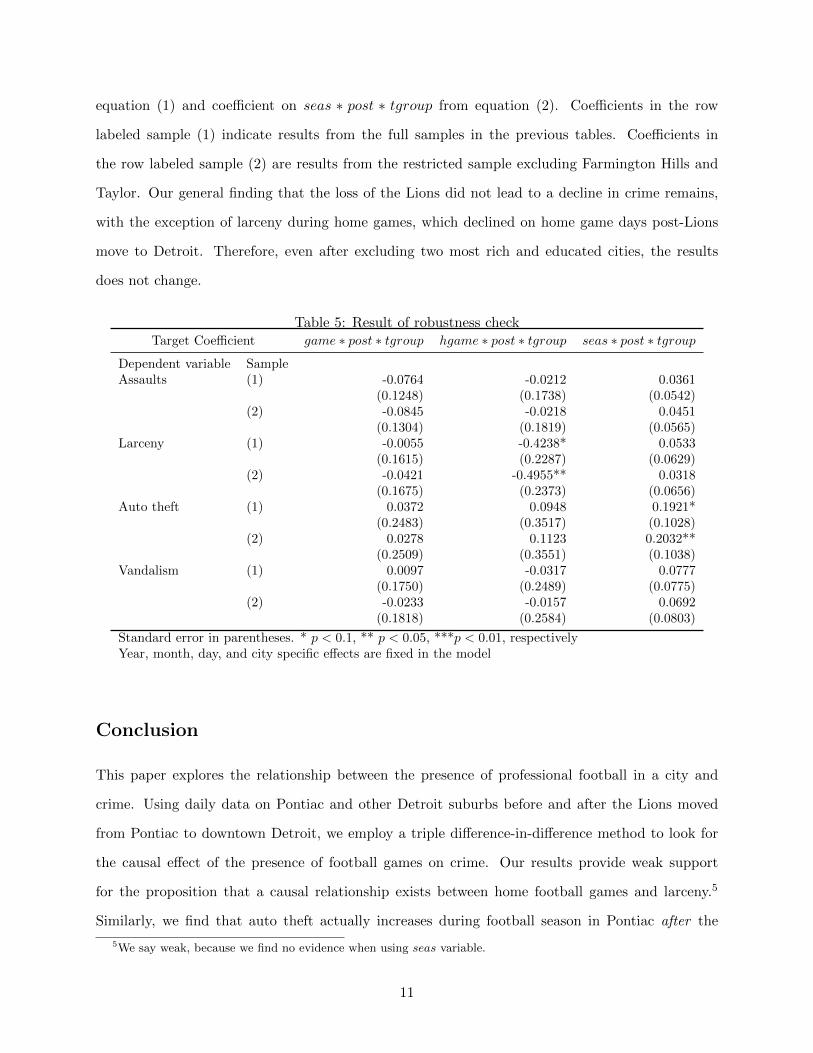
equation (1) and coefficient on seas ∗ post ∗ tgroup from equation (2). Coefficients in the row
labeled sample (1) indicate results from the full samples in the previous tables. Coefficients in
the row labeled sample (2) are results from the restricted sample excluding Farmington Hills and
Taylor. Our general finding that the loss of the Lions did not lead to a decline in crime remains,
with the exception of larceny during home games, which declined on home game days post-Lions
move to Detroit. Therefore, even after excluding two most rich and educated cities, the results
does not change.
Table 5: Result of robustness checkTarget Coefficient game ∗ post ∗ tgroup hgame ∗ post ∗ tgroup seas ∗ post ∗ tgroup
Dependent variable SampleAssaults (1) -0.0764 -0.0212 0.0361
(0.1248) (0.1738) (0.0542)(2) -0.0845 -0.0218 0.0451
(0.1304) (0.1819) (0.0565)Larceny (1) -0.0055 -0.4238* 0.0533
(0.1615) (0.2287) (0.0629)(2) -0.0421 -0.4955** 0.0318
(0.1675) (0.2373) (0.0656)Auto theft (1) 0.0372 0.0948 0.1921*
(0.2483) (0.3517) (0.1028)(2) 0.0278 0.1123 0.2032**
(0.2509) (0.3551) (0.1038)Vandalism (1) 0.0097 -0.0317 0.0777
(0.1750) (0.2489) (0.0775)(2) -0.0233 -0.0157 0.0692
(0.1818) (0.2584) (0.0803)
Standard error in parentheses. * p < 0.1, ** p < 0.05, ***p < 0.01, respectivelyYear, month, day, and city specific effects are fixed in the model
Conclusion
This paper explores the relationship between the presence of professional football in a city and
crime. Using daily data on Pontiac and other Detroit suburbs before and after the Lions moved
from Pontiac to downtown Detroit, we employ a triple difference-in-difference method to look for
the causal effect of the presence of football games on crime. Our results provide weak support
for the proposition that a causal relationship exists between home football games and larceny.5
Similarly, we find that auto theft actually increases during football season in Pontiac after the
5We say weak, because we find no evidence when using seas variable.
11

Lions’ move. Whether this reflects new behavior by Pontiac residents and visitors or increased
attention to auto theft by Pontiac police during football season following the Lions departure
cannot be determined by our data. While we fail to find a strong relationship between crime and
the presence of professional football, clearly additional research is needed. Much like the literature
on casinos and crime, different approaches are likely to yield different results (Grinols and Mustard,
2006; Walker, 2008; Reece, 2010).
There are three important caveats to make with respect to our results. First, as we focus only
on Detroit suburbs it might be difficult to generalize this to all NFL cities. Our results in this paper
might explain specific features of Pontiac rather than the presence of professional football. Second,
since our paper does not include data on Detroit and Livonia due to a lack of daily data, we cannot
speak to the overall effect of professional football in the Detroit MSA. Our findings only relate to
the direct impact of professional football on crime in a hosting city, not externalities in criminal
activities due to football games. Third, our approach assumes that criminal activities are unrelated
to the Lions moving. While our comparison group and robustness check attempt to minimize this
problem, our empirical approach cannot adequately deal with this concern.
12

References
Baade, R. A., Baumann, R., and Matheson, V. A. (2008). Selling the game: Estimating the
economic impact of professional sports through taxable sales. Southern Economic Journal,
74(3):794–810.
Baumann, R., Ciavarra, T., Englehardt, B., and Matheson, V. A. (2012). Sports franchises, events,
and city livability: an examination of spectator sports and crime rates. Economic and Labour
Relations Review, 23(2):83–97.
Card, D. and Dahl, G. B. (2011). Family violence and football: The effect of unexpected emotional
cues on violent behavior. Quarterly Journal of Economics, 126(1):103–143.
Coates, D. and Humphreys, B. R. (2002). The economic impact of postseason play in professional
sports. Journal of Sports Economics, 3(3):291–299.
Coates, D. and Humphreys, B. R. (2003). The effect of professional sports on earnings and em-
ployment in the services and retail sectors in US cities. Regional Science and Urban Economics,
33(2):175–198.
Fort, R. D. (2011). Sports Economics (3rd ed.). Upper Saddle River, NJ: Prentice Hall.
Grinols, E. L. and Mustard, D. B. (2006). Casinos, crime, and community costs. Review of
Economics and Statistics, 88(1):28–45.
Groothuis, P. A., Johnson, B. K., and Whitehead, J. C. (2004). Public funding of professional
sports stadiums: Public choice or civic pride? Eastern Economic Journal, 30(4):515–526.
Johnson, B. K., Groothuis, P. A., and Whitehead, J. C. (2001). The value of public goods generated
by a major league sports team: The CVM approach. Journal of Sports Economics, 2(1):6–21.
Johnson, B. K., Mondello, M. J., and Whitehead, J. C. (2007). The value of public goods generated
by a National Football League team. Journal of Sport Management, 21(1):123.
Kalist, D. E. and Lee, D. Y. (2014). The national football league does crime increase on game day?
Journal of Sports Economics.
13
Owen, J. G. (2006). The intangible benefits of sports teams. Public Finance and Management,
6(3):321–345.
Reece, W. S. (2010). Casinos, hotels, and crime. Contemporary Economic Policy, 28(2):145–161.
Rees, D. I. and Schnepel, K. T. (2009). College football games and crime. Journal of Sports
Economics, 10(1):68–87.
Siegfried, J. and Zimbalist, A. (2000). The economics of sports facilities and their communities.
Journal of Economic Perspectives, 14(3):95–114.
Walker, D. M. (2008). Evaluating crime attributable to casinos in the US: A closer look at Grinols
and Mustard’s “Casinos, Crime, and Community Costs”. Journal of Gambling Business and
Economics, 2(3):23–51.
Yu, Y., Mckinney, C. N., Caudill, S. B., and Mixon Jr, F. G. (2016). Athletic contests and individual
robberies: An analysis based on hourly crime data. Applied Economics, 48(8):723–730.
14