does social capital matter? evidence from a five-country … · 2016-04-28 · question through an...
TRANSCRIPT

Does social capital matter? Evidence from afive-country group lending experiment
By Alessandra Cassar* and Bruce Wydicky
*Department of Economics, University of San Francisco;e-mail: [email protected] of Economics, University of San Francisco, 2130 Fulton Street,San Francisco, CA 94117, USA; e-mail: [email protected]
Does social capital matter to economic decision-making? We address this broad
question through an artefactual group lending experiment carried out in five countries:
India, Kenya, Guatemala, Armenia, and the Philippines, obtaining data on 10,673
contribution decisions from 1,554 subjects in 259 experimental borrowing groups.
We carry out treatments for social homogeneity, group monitoring, and borrowing
group self-selection. Results show that societal trust positively and significantly
influences group loan contribution rates, that group lending appears to create as
well as harness social capital, and that peer monitoring can have perverse as well as
beneficial effects.
JEL classifications: O12, O16, C92, Z13.
1. IntroductionEconomists have become increasingly fascinated by the role that social capital playsin facilitating economic transactions. Particularly in communities that are relativelyhomogeneous and close-knit, social capital may facilitate a general sense of trustand goodwill surrounding economic exchange. Social capital may also facilitate theflow of information, serving a screening function that curtails adverse selection.Further, it may help hold people more accountable for their actions, mitigatingmoral hazard as economic decisions are placed within the context of long-termrelationships.
Understanding the effect of social capital on economic decision-making has beenthe subject of a broad literature. This literature has pointed to the positive effects ofsocial capital on economic growth (Knack and Keefer, 1997), reducing corruption(LaPorta et al., 1997), community governance (Bowles and Gintis, 2002), prevent-ing crime (Case and Katz, 1991), curtailing moral hazard in the workplace (Ichinoand Maggi, 2000), and financial development (Guiso et al., 2004).
! Oxford University Press 2010All rights reserved
Oxford Economic Papers (2010), 1 of 25doi:10.1093/oep/gpq010
Oxford Economic Papers Advance Access published May 26, 2010 at University of San Francisco on M
ay 27, 2010oep.oxfordjournals.org
Downloaded from
Yet it is often the case that social capital variables are endogenous to outcomevariables, presenting a challenge to causal inferences. Some rigorous studies on theeconomic effects of social capital have used instrumental variables to address pro-blems of correlated unobservables (e.g. Knack and Keefer, 1997) or exploited dif-ferences in regional social capital within a country to identify its effects (e.g.Putnam, 1993; Ichino and Maggi, 2000). Our study addresses the challenge ofcausal inference through experimental methods. We carry out a group lendingexperiment in five countries with five different cultural contexts to test the effectthat different types of social capital have on an individual propensity to contributeto a joint liability loan.
Our experiments were carried out in Armenia, Guatemala, Kenya, India, and thePhilippines among a total of 1,554 participants in 259 simulated borrowing groupsacross these five countries. In our group lending experiment, each subject in agroup is given a loan and then must draw a ball at random from a black bagthat contains five green balls and one red ball. Drawing a green ball means asuccessful investment from which the subject earns a positive return, giving thesubject the opportunity to contribute to the repayment of the group loan. Drawingthe red ball implies a negative shock to the borrower in which the borrower isunable to pay her share of the group loan. Subjects choose balls with replacement,so that there is a one-sixth probability that any of the subjects draws the red ball,even after it has already been drawn. If at least half of the subjects in a groupcontribute, group lending continues for a subsequent round. This process of grouprepayment, if sustained for more than a few rounds, can make each member betteroff relative to non-repayment because non-repayment increases the likelihood ofgroup loan termination. Consequently, each individual faces a trade-off betweencontributing to the group loan (to help the group to continue to receive loans) andwithholding her contribution (increasing her individual payoff for a particularround).1 Because each group lasted an average of 6.86 rounds before breakdownfrom insufficient repayment occurred, our study generated 10,673 observationsfrom which to draw in our analysis.
Information about other people, about what they are doing, and the potential toinfluence their behavior each represents a different facet of social capital.Accordingly, we designed our treatments in our group lending experimentaround these phenomena in a between-subjects design. We implemented groupself-selection treatments as part of our work in three of our countries, allowingsubjects to bring to the experimental site a self-selected group of friends or acquain-tances who formed their partners in the experiment. These self-selected groupscomprised 16.1% of the groups in Guatemala, 50% in Kenya, and 45.5% in the
..........................................................................................................................................................................1While this group lending game retains some of the flavor of the public good game, it departs from it insubstantial ways by having dynamic incentives in the payoffs structure and introducing individualshocks (see our more detailed description in Section 2).
2 of 25 social capital and microfinance
at University of San Francisco on May 27, 2010
oep.oxfordjournals.orgDownloaded from

Philippines. In India (52.9%) and the Philippines (11.0%) a portion of our experi-mental groups were comprised of actual self-selected group borrowers from a localmicrofinance institution (MFI).
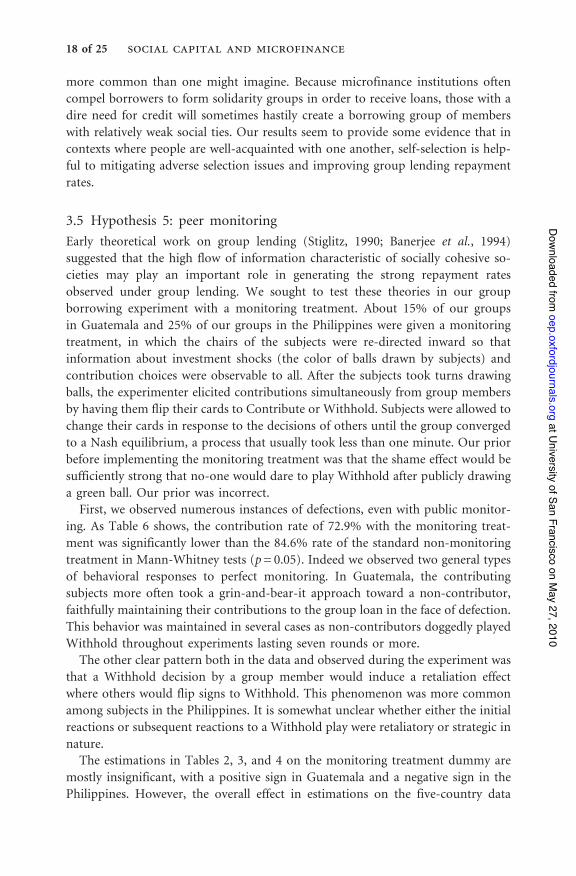
In two countries we implemented a monitoring treatment, comprising 14.5% ofthe groups in Guatemala and 25.5% in the Philippines. In our normal set-up, chairswere facing away from the other subjects around a circle, so that subjects chose ballsand made contributions choices privately with the experimenter. In the monitoringtreatment, subjects performed both of these tasks in front of the group so thatothers could observe not only what color ball each drew, but whether or notanother member drawing a green ball was choosing to use her good fortune tocontribute to the group loan. After observing contributions of the other members,we allowed subjects to alter their decisions by flipping contribution decision cardsuntil subject decisions converged to a Nash equilibrium.
To test for the importance of social homogeneity, we exogenously formed theremaining groups in terms of homogeneity and heterogeneity over key socialreference groups. In our 26 groups in Armenia, we formed groups exogenouslyover a main source of social conflict in that country, between pre-Perestroika andpost-Perestroika generations. In Guatemala we formed homogeneous and hetero-geneous groups based on religion (Evangelical and Catholic), and residence in oneof two rival adjacent towns. In 23 of our 46 groups in Kenya we did the same withMuslims and Christians, and similarly in 30 of our 55 groups in the Philippineswith homogeneous and heterogeneous groups of Muslims and Christians. InChennai (India) our most religiously diverse site, among 33 of our 70 groups inChennai were homogeneous groups of Hindus, Muslims, and Christians along withgroups of half Hindus and Christians and half Hindus and Muslims. Each subjectannounced his or her residence and religion to the others before the experiment aspart of the treatment.
In each of our country sites we had subjects fill out a survey in which theyanswered questions about the depth of their relationship with others in thegroup, how long they had lived in the area, the depth of their religious commit-ment, their views of people from other groups, their answers to the three standardquestions on societal trust from the General Social Survey, and information onother standard control variables.
Our research finds some basic factors to influence contribution decisions invirtually every context. We find strong evidence of reciprocity: subjects victim toa greater number of negative shocks (red balls) contribute more often when theydraw a green ball and have the opportunity to contribute. In virtually all of ourestimations across countries we find a significant and positive correlation between aperson being more trusting of others in society (based on their answers to thestandard GSS questions) and group loan contribution decisions. We find thiseffect across groups, within groups (using group-level fixed effects), and positivepoint estimates in virtually every type of country estimation. We also find in ourgroup self-selection treatments that when subjects self-selected with borrowers withwhom they knew, contribution rates increased.
a. cassar and b. wydick 3 of 25
at University of San Francisco on May 27, 2010
oep.oxfordjournals.orgDownloaded from

But there are also a number of surprising results, some of which yield new insightsinto the relationship between social capital and economic decision-making. One ofthese regards the dramatically lower rates of individual contribution rates and lend-ing group duration in the Kenya experiments, 41.8% among the 276 subjects inNairobi compared with 87.5% for the 1,278 subjects in the other four countries(p-value = 0.000). This was driven by a lack of confidence that other members wouldcontribute to the group loan, a result that we discuss more fully in Section 3.
We observe furthermore that the effects of different types of social capital arehighly contextualized. That different aspects of social capital appear to exhibitdiverse effects across cultures suggests that the external validity of work in behav-ioral economics and social capital carried out in a single context may be quitelimited. In this respect our results support existing research such as Henrichet al. (2001), in which the authors found substantial differences in plays of theultimatum game when carried out in 15 different small-scale societies across Africa,Asia, and Latin America.
We also discover that certain types of social capital may exhibit surprising effectswhen isolated experimentally. An example from our study concerns the effects ofmonitoring. We find that there appear to be two counteracting effects from peermonitoring: a shame effect, which tends to encourage members to contribute theirshare (especially when others in the group are contributing), and a retaliationeffect, in which other members retaliate in response to a defection. While peermonitoring results in higher repayment conditional upon every other member inthe group contributing, when even a single other individual in the group refuses torepay after drawing a green ball, the repayment rate quickly becomes lower thanwith no peer monitoring at all. All told, we find that the retaliation effect at leastcounteracts the shame effect, and if anything outweighs it.
Following this introduction, Section 2 of our paper presents a description of ourgroup lending experiment, subjects and experimental settings. (A more detaileddescription of our five experimental sites and a mathematical derivation of theincentives in our game are provided in Appendices 1 and 2, which is availableonline at the OUP website) Section 3 presents our experimental results andSection 4 summarizes and concludes.
2. The experimentOur experiment sought to test the following hypotheses regarding the effect ofsocial capital on group lending from the microfinance literature:
Hypothesis 1 Homogeneity of groups and greater social trust among borrowersleads to a higher level of social capital and hence group loan repayment.Interpersonal trust, which is critical for successful group borrowing, may be stron-ger in a socially homogeneous group. Moreover, the greater potential for sanctionsbetween homogeneous members may also help mitigate moral hazard problems injoint liability lending contracts when borrowers enjoy a social leverage with one
4 of 25 social capital and microfinance
at University of San Francisco on May 27, 2010
oep.oxfordjournals.orgDownloaded from

another that extends beyond the lending contract (Floro and Yotopolous, 1991;Besley and Coate, 1995; Zeller, 1998; Wydick, 1999; Cassar et al., 2007). We carryout homogeneity treatments in all five of our country sites.
Hypothesis 2 Group lending does not only harness social capital, but creates it.Much of the academic literature emphasizes the ability of the group lending toharness the social capital that exists naturally in traditional societies. Howevermany microfinance institutions claim that group lending actually creates socialcapital rather than merely harnessing the social capital that already exists. Wetest this in India, where we experiment among both newly formed groups andexperienced borrowers.
Hypothesis 3 Reciprocity plays an important role in facilitating group loan repay-ment. As borrowers are subject to individual idiosyncratic shocks within groups, theymust rely on others to help them repay so that the group is able to maintain access tocredit. The study of reciprocity among the poor has a long history beginning with theseminal work of Scott (1976). We predict that a borrower will be more likely tocontribute in a given round if he or she has received a shock in the recent past.
Hypothesis 4 Borrower self-selection increases repayment by mitigating adverseselection problems. Work by Van Tassel (1999) and Ghatak (1999) argues thatself-selection of borrowing groups generates an assortative matching processbased on local information in which safe borrowers join with other safe borrowersin borrowing groups, mitigating adverse selection in the lending relationship andboosting loan repayment. The borrower self-selection treatment was implementedin Guatemala, Kenya, and the Philippines.
Hypothesis 5 Monitoring between borrowers reduces moral hazard and increasesgroup loan repayment. Theoretical models by Stiglitz (1990), Banerjee et al. (1994),and Wydick (2001) posit that peer monitoring between jointly liable borrowinggroup members helps mitigate the hidden action that spawns moral hazard incredit transactions. We carried out our monitoring treatment in Guatemala andthe Philippines.
2.1 Sites and subjects
Our experiment was carried out in five country sites by our team of faculty andgraduate students: Armenia (Berd, population: 8,700), Guatemala (San Pedro andSan Juan La Laguna, both approximately pop. 4,000), India (Chennai, formerlyknown as Madras, pop. 4.3 million), Kenya (Nairobi, pop. 3 million), and thePhilippines (Davao City, pop. 1.4 million, Panabo City, pop. 134,000, andCotabato City, pop. 162,000). Details of these sites are given in the onlineAppendix 1. In Appendix 1 we also describe some small differences in the detailsof the experiment as it was carried out in the different countries. Although anyimpacts of these differences are subsumed by the country fixed effect, any specif-ically cross-country comparison of results should take these into consideration.
a. cassar and b. wydick 5 of 25
at University of San Francisco on May 27, 2010
oep.oxfordjournals.orgDownloaded from
In each of our country sites our subjects were borrowers who fit the typicalprofile of a microfinance borrower: living in a relatively poor neighborhood withrelatively low levels of formal schooling, average age about 34 years old, and dis-proportionately women (80.8%). Subjects were typically recruited in collaborationwith local NGOs (non-government organizations). In India and the Philippines weran a large fraction of our experiments on actual microfinance borrowers who werecurrent borrowers with a local MFI, such that real microfinance borrowers make up16.6% of our subjects in the study as a whole. Some of the non-microfinanceborrowers had participated in programs of the local NGO or were recruited offthe street for the experiment. When we ran treatments allowing for self-selection ofborrowers, we spread the word generally among a segment of the local populationfitting our profile, giving a rough description of the activity, and encouraged sub-jects to arrive at the experiment site in self-selected groups of six.
Table 1 shows that the mean age of our subjects varied little between the fivecountries, ranging from 30.2 years in Kenya to 36.1 years in Armenia. The fractionof female subjects ranged from 0.41 in Kenya, 0.70 in the Philippines, and 0.90 inGuatemala, to entirely female in Armenia and India. The average fraction of asubject’s life lived in the region of the experiment varied from 0.44 in Kenya,where many slum dwellers had relocated to Nairobi from outlying areas, to 0.95in Guatemala, in which there is traditionally very little mobility between ruraltowns. Roughly half of our sample subjects operated their own enterprises andabout one-quarter were wage workers.
We compiled a simple index of societal trust for each subject based on thenumber of yes (trusting) answers to the three standard GSS questions. OverallHindu subjects made up 17.1% of our total sample (coming only from India),Muslims made up 16.7% of our sample (coming from India, Kenya, and thePhilippines), Catholics 28.1% (in Guatemala and the Philippines), andEvangelical Protestants 25.2% (in Guatemala, India, and Kenya).
2.2 Experimental design
The group lending experiment that we employ in each of our five country sites isthe group lending game originally developed by Abbink et al. (2006) with somemodifications and adjustments for particular treatments. We favor the game becauseit contains three important properties that capture key aspects of group lending: thefirst is that it incorporates dynamic incentives. Field research has indicated thata major reason borrowers repay group loans is to maintain access to futureloans.2 The second is that it incorporates an important form of moral hazard:difficultly in eliciting repayment even when a project yields a sufficient return.The third is that the structure of the game allows for private information; investment
..........................................................................................................................................................................2See for example, Wydick (2001) which reports that 86% of microfinance borrowers when asked whythey choose to repay their share of a group loan respond that they do so to maintain access to MFIcredit.
6 of 25 social capital and microfinance
at University of San Francisco on May 27, 2010
oep.oxfordjournals.orgDownloaded from

Table
1Su
mmarystatistics
Variable
Arm
enia
Guatem
ala
India
Kenya
Philippines
5Cou
ntries
Num.of
grou
ps
2662
7046
55259
Num.of
subjects
156
372
420
276
330
1,554
Total
num.of
observations
666
3,450
3,449
498
2,610
10,673
Experim
entalvariables
Num.of
roundsexp.lasted
4.269
9.242
8.214
1.804
7.909
6.861
Avg.subjectcontribution
rate
0.754
0.903
0.854
0.387
0.740
0.755
Meanshocks
received—self
0.187
0.182
0.199
0.156
0.153
1.176
Dem
ographicvariables
Age
36.141
(13.831)
34.215
(10.661)
35.325
(10.005)
30.228
(8.914)
34.019
(10.572)
33.955
(10.702)
Femalefraction
1.000(0.000)
0.901(0.300)
1.000(0.000)
0.413(0.493)
0.698(0.460)
0.808(0.394)
Meaneducation
(1=primary.,2=
mid.,3=
highschoo
l)1.984(0.144)
0.934(0.665)
!1.618(0.770)
2.234(0.802)
1.606(0.864)
Economicvariables
Businessow
ner
fraction
0.154(0.362)
0.411(0.493)
0.688(0.464)
0.482(0.501)
0.476(0.500)
0.486(0.450)
Wagew
orkerfraction
!0.161(0.368)
0.145(0.353)
0.322(0.468)
0.37
(0.483)
0.237(0.426)
Fraction
withloan
inpast
0.051(0.221)
0.338(0.474)
0.523(0.381)
0.100(0.301)
0.424(0.495)
0.241(0.428)
Social
variables
Fraction
oflifelived
inarea
0.486(0.305)
0.946(0.178)
0.793(0.296)
0.439(0.346)
0.503(0.332)
0.675(0.355)
Num.of
acqu
aintances
1.436(1.296)
3.847(1.506)
3.468(2.202)
3.202(1.830)
3.492(1.388)
3.306(1.855)
MeanGSS
question
s(num.of
positiverepliesou
tof
3)1.686(1.002)
1.341(0.868)
1.724(1.029)
1.337(0.813)
1.877(0.903)
1.592(0.952)
Treatments
Fraction
inself-selecttreatm
ent
0.000(0.000)
0.161(0.368)
0.000(0.000)
0.500(0.501)
0.455(0.499)
0.224(0.417)
Fraction
inmon
itoringtreatm
ent
0.000(0.000)
0.145(0.353)
0.000(0.000)
0.000(0.000)
0.255(0.436)
0.089(0.285)
Fraction
ofreal
MFbo
rrow
er0.000(0.000)
0.000(0.000)
0.529(0.450)
0.000(0.000)
0.11
(0.313)
0.166(0.372)
Num.of
otherssamereligion
3.4871
(1.505)
3.459(1.479)
3.457(1.595)
4.21
(1.324)
3.852(1.535)
3.68
(1.526)
Religious
variables
Religiousfrequency
0.000
2.3
2.171
1.854
1.5
1.785
Fraction
Catholic
0.000
0.618
0.000
0.000
0.6242
0.281
Fraction
Evangelicals
0.000
0.366
0.2572
0.533
0.000
0.252
Fraction
Hindu
0.000
0.000
0.629
0.000
0.000
0.171
Fraction
Muslim
s0.000
0.000
0.086
0.467
0.288
0.167
Meanswithstandarddeviation
sin
parentheses.
Notes:1Ofsamepre-or
post-Perestroika
generationin
Arm
enia.
2Datadid
not
differentiatebetweenChristiandenom
inationsin
IndiaandthePhilippines,butChristiansubjectsin
Indiawerebelievedto
bemorethan
90%
EvangelicalProtestant
while
inthePhilippines
morethan
90%
Catholic.
a. cassar and b. wydick 7 of 25
at University of San Francisco on May 27, 2010
oep.oxfordjournals.orgDownloaded from

shocks are private information in the standard execution of the game, but the gamecan easily be adapted to allow for a peer monitoring treatment.
Our experimental setup consisted of a circle of chairs facing away from the centerof the circle (except for the monitoring treatments, in which the chairs facedinward.) Each member of the group gave a clear statement of his or her religion3
to the other five members of the borrowing group. The experimenter then readdirections, answered clarifying questions, and carried out three pre-determined trialruns of the experiment, asking questions to the subjects after the trial runs toascertain their knowledge of how the experiment would work.
In the experiment each of the six subjects is given a loan equal to approximatelyUS$0.50. For example, in India the initial loan to each subject was 20 rupees.This created a jointly liable loan for 120 rupees that must have been repaid at20% interest for a total of 144 rupees. The experimenter then passes a black bagwith six colored ping-pong balls to each subject, who draws one ball, notes thecolor of the ball with the experimenter, and then returns the ball to the bag. Thecolor of the ball is then marked with ink on a card held by the subject. There are sixballs in the bag, five green and one red. Except for the monitoring treatment, onlythe experimenter and the individual subject know the color of the ball he hasrandomly chosen. After all six subjects have drawn their balls, the experimentermakes another trip around the circle to record the contribution of each groupmember to the joint liability loan. If the subject draws a red ball, the subject receivesa negative shock on her investment; she loses her principal and cannotrepay her share of the group loan. If she receives a green ball, then she mustchoose whether or not to contribute to repayment of the loan by displaying adecision card privately to the experimenter. For example in India, the payoff to asuccessful investment was 48 rupees. With all six members contributing to a loan,each member would have to contribute 24 rupees to pay off the 144 due on the loanand could keep 24 rupees. However, if the number of contributors was smaller,as with real-world group lending, the contribution of the repaying memberswas larger.
Continuing with the India example, if the number of contributors ended upbeing four, each would have to contribute 36 rupees, while keeping only 12rupees as a payoff from that round. Since it requires 144 rupees to pay off thegroup loan, full repayment is impossible if fewer than three borrowers contribute torepayment. Thus if three or more borrowers contribute, the group receives anotherloan in a subsequent round, but if less than three contribute, lending ceases and theexperiment ends with subjects receiving their payoffs accrued from each round.Subsequent to each round, the experimenter informed players about the totalnumber of contributors (but not their identities), and if repayment was sufficient
..........................................................................................................................................................................3Religious introductions were performed in Guatemala, Kenya, India, and the Philippines.
8 of 25 social capital and microfinance
at University of San Francisco on May 27, 2010
oep.oxfordjournals.orgDownloaded from

to foster another loan.4 After the experiment, subjects filled out a questionnairewith approximately 50 questions pertaining to demographic, social, religious vari-ables, and societal trust.5
In Appendix 2 we present formally the strategic conditions under which it isoptimal for a player to contribute to the group loan, taking into account thebenefits from withholding contribution in the present round with the addedrisk this brings to loan termination. Carrying out a set of computer simulationexercises based on the formal model, we demonstrate that when three otherplayers contribute, n= 3, the expected whole-game payoff is higher playing theWithhold strategy than Contribute. With n= 4, Contribute begins to pullmarginally ahead of Withhold, and at n= 5, the Contribute strategy yields anexpected whole-game payoff about twice as high as Withhold. Trust betweenmembers is thus crucial to strategy, sustainability of the exercise, and, ultimately,payoffs.
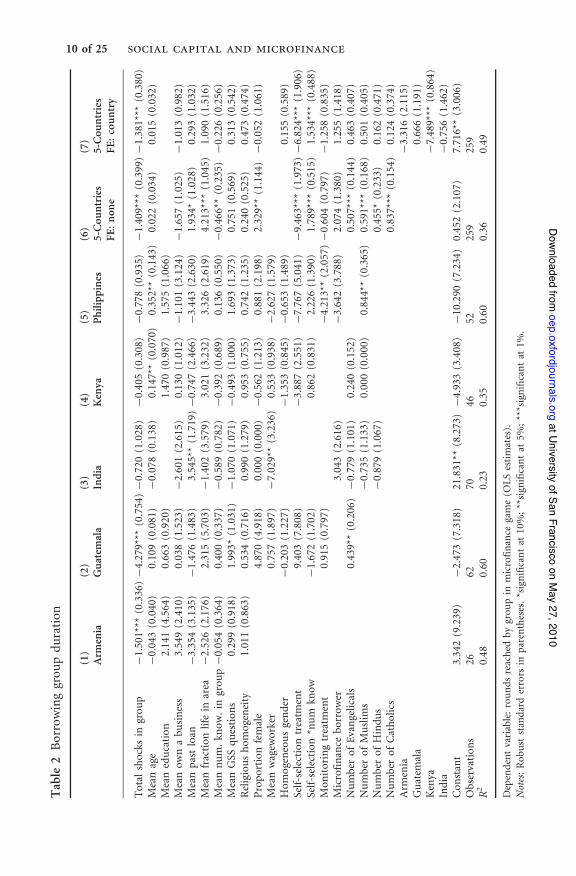
3. Results: does social capital matter?We present here three basic sets of estimations: (i) On the duration of the experi-mental groups in terms of number of lending rounds, where higher contributionrates generally lead to more rounds of borrowing; (ii) On individual contributionsby round given that a subject had a successful investment and had the opportunityto contribute, an estimation that allows us to incorporate round-level fixed effects;and (iii) On the total number of contributions by each subject divided by thenumber of opportunities to contribute. Each estimation offers distinct advantagesin yielding insight into the effects of social capital variables and group interactionon group loan contributions. Table 2 shows regressions based on group longevity inthe experiment. The advantage with these estimations is that in some sense they docapture the success of a group based on individual and social characteristics andtreatments. However, because a random confluence of negative shocks may play aleading role in terminating lending in any particular round, the estimated effect ofsocial capital variables on decision-making is less precise. The advantage of thepooled logit estimations on individual contributions by round in Table 3 is thatthey are able to incorporate situation-specific attributes in the experiment such as
..........................................................................................................................................................................4In cases where the experiment lasted more than ten rounds, to avoid the potential pitfalls of finitelyrepeated games, we announced to the subjects that we would artificially hastened the end of the experi-ment by flipping a coin to determine if another round would be played or by increasing the probabilityof a negative shock from 1/6 to 1/2. (See Appendix 2).5We used the three standard GSS questions that included the question on trust, ‘‘Generally speaking,would you say that most people can be trusted or that you can’t be too careful in dealing with people?’’,the question on fairness, ‘Do you think most people would try to take advantage of you if they got thechance, or would they try to be fair?’, and the question on helpfulness, ‘Would you say that most of thetime people try to be helpful, or that they are mostly just looking out for themselves?’. Because thesequestions are highly related, in our estimations we create a composite index equal to the number ofanswers reflective of a positive level of societal trust from the three questions.
a. cassar and b. wydick 9 of 25
at University of San Francisco on May 27, 2010
oep.oxfordjournals.orgDownloaded from
Table
2Borrowinggrou
pduration
(1)
(2)
(3)
(4)
(5)
(6)
(7)
Arm
enia
Guatem
ala
India
Kenya
Philippines
5-Cou
ntries
5-Cou
ntries
FE:non
eFE:country
Total
shocks
ingrou
p!1.501***
(0.336)!4.279***
(0.754)!0.720(1.028)
!0.405(0.308)
!0.778(0.935)
!1.409***
(0.399)!1.381***
(0.380)
Meanage
!0.043(0.040)
0.109(0.081)
!0.078(0.138)
0.147**(0.070)
0.352**(0.143)
0.022(0.034)
0.015(0.032)
Meaneducation
2.141(4.564)
0.663(0.920)
1.470(0.987)
1.575(1.066)
Meanow
nabu
siness
3.549(2.410)
0.038(1.523)
!2.601(2.615)
0.130(1.012)
!1.101(3.124)
!1.657(1.025)
!1.013(0.982)
Meanpastloan
!3.354(3.135)
!1.476(1.483)
3.545**(1.719)!0.747(2.466)
!3.443(2.630)
1.934*
(1.028)
0.293(1.032)
Meanfraction
lifein
area
!2.526(2.176)
2.315(5.703)
!1.402(3.579)
3.021(3.232)
3.326(2.619)
4.213***
(1.045)
1.090(1.516)
Meannum.kn
ow.in
grou
p!0.054(0.364)
0.400(0.337)
!0.589(0.782)
!0.392(0.689)
0.136(0.550)
!0.466**(0.235)
!0.226(0.256)
MeanGSS
question
s0.299(0.918)
1.993*
(1.031)
!1.070(1.071)
!0.493(1.000)
1.693(1.373)
0.751(0.569)
0.313(0.542)
Religioushom
ogeneity
1.011(0.863)
0.534(0.716)
0.990(1.279)
0.953(0.755)
0.742(1.235)
0.240(0.525)
0.473(0.474)
Proportion
female
4.870(4.918)
0.000(0.000)
!0.562(1.213)
0.881(2.198)
2.329**(1.144)
!0.052(1.061)
Meanwagew
orker
0.757(1.897)
!7.029**(3.236)
0.533(0.938)
!2.627(1.579)
Hom
ogeneousgender
!0.203(1.227)
!1.353(0.845)
!0.653(1.489)
0.155(0.589)
Self-selection
treatm
ent
9.403(7.808)
!3.887(2.551)
!7.767(5.041)
!9.463***
(1.973)!6.824***
(1.906)
Self-selection
*num
know
!1.672(1.702)
0.862(0.831)
2.226(1.390)
1.789***
(0.515)
1.534***
(0.488)
Mon
itoringtreatm
ent
0.915(0.797)
!4.213**(2.057)!0.604(0.797)
!1.258(0.835)
Microfinance
borrow
er3.043(2.616)
!3.642(3.788)
2.074(1.380)
1.255(1.418)
Numberof
Evangelicals
0.439**(0.206)
!0.779(1.101)
0.240(0.152)
0.507***
(0.144)
0.463(0.407)
Numberof
Muslim
s!0.735(1.133)
0.000(0.000)
0.844**(0.365)
0.591***
(0.168)
0.501(0.405)
Numberof
Hindus
!0.879(1.067)
0.455*
(0.233)
0.162(0.471)
Numberof
Catholics
0.837***
(0.154)
0.124(0.374)
Arm
enia
!3.316(2.115)
Guatem
ala
0.666(1.191)
Kenya
!7.489***
(0.864)
India
!0.756(1.462)
Con
stant
3.342(9.239)
!2.473(7.318)
21.831**
(8.273)
!4.933(3.408)
!10.290
(7.234)
0.452(2.107)
7.716**(3.006)
Observation
s26
6270
4652
259
259
R2
0.48
0.60
0.23
0.35
0.60
0.36
0.49
Dependentvariable:roundsreached
bygrou
pin
microfinance
game(O
LSestimates).
Notes:Rob
uststandarderrors
inparentheses.*significantat
10%;**significantat
5%;***significantat
1%.
10 of 25 social capital and microfinance
at University of San Francisco on May 27, 2010
oep.oxfordjournals.orgDownloaded from

Table
3Individual
repaymentdecisions
Variable
(1)
(2)
(3)
(4)
(5)
(6)
(7)
(8)
Arm
enia
Guatem
ala
India
Kenya
Philippines
5-Cou
ntry
5-Cou
ntry
5-Cou
ntry
FE:non
eFE:country
FE:grou
p
Lag
subjectshock
0.079(0.351)
0.092(0.259)
0.369*
(0.210)
!0.670(0.452)
!0.330(0.224)
0.058(0.109)
0.032(0.113)
!0.101(0.115)
Lag
shocks
others
!0.130(0.121)
!0.153(0.127)
!0.004(0.103)
!0.055(0.320)
!0.038(0.091)
0.021(0.052)
!0.013(0.052)
!0.149***
(0.056)
Age
0.011(0.014)
0.002(0.022)
0.001(0.012)
0.065*
(0.037)
0.006(0.009)
0.010(0.006)
0.010*
(0.006)
0.013***
(0.005)
Education
!0.133(1.034)
!0.105(0.218)
!0.004(0.300)
!0.210(0.146)
Female
0.432(0.759)
!0.063(0.413)
0.042(0.185)
0.589***
(0.147)
0.099(0.158)
0.209(0.147)
Wageworker
!0.785*
(0.450)
!0.841***
(0.277)
0.249(0.453)
!0.217(0.183)
Ownbu
siness
!0.169(0.425)
0.216(0.358)
!0.095(0.245)
!0.355(0.623)
0.070(0.231)
!0.014(0.125)
0.009(0.140)
0.091(0.116)
Pastloan
!0.239(0.609)
0.428(0.434)
!0.040(0.334)
!0.578(0.594)
!0.450*
(0.246)
!0.046(0.172)
!0.041(0.175)
0.182(0.125)
Frac.of
lifein
area
0.135(0.375)
!0.957(1.221)
!0.245(0.371)
0.504(0.940)
0.435*
(0.236)
0.637***
(0.173)
0.054(0.153)
!0.069(0.158)
Num
know
.in
grou
p!0.030(0.099)
0.305*
(0.169)
0.034(0.062)
0.107(0.128)
!0.124***
(0.046)
0.037(0.039)
0.016(0.039)
0.026(0.035)
GSS
0.117(0.143)
0.471*
(0.250)
0.100(0.135)
0.597**(0.249)
0.141(0.118)
0.127*
(0.068)
0.184***
(0.070)
0.221***
(0.050)
Relig.as
selfttmt.
0.013(0.107)
0.054(0.150)
0.131(0.087)
0.383(0.334)
!0.232***
(0.079)
!0.034(0.053)
0.024(0.053)
0.139***
(0.054)
Tow
nas
selfttmt.
0.272(0.194)
Self-selection
ttmt.
!1.744(1.083)
!1.183(1.087)
!1.193*
(0.632)
!1.69***(0.492)
!1.46***(0.432)
Self-sel*numkn
ow!0.033(0.243)
!0.040(0.242)
0.348**(0.156)
0.214*
(0.118)
0.191*
(0.100)
0.042(0.086)
Mon
itoringttmt.
!0.426(0.985)
!0.373(0.349)
0.060(0.297)
0.186(0.298)
Microf.bo
rrow
er1.044***
(0.383)
0.791(0.693)
0.794**(0.321)
0.977***
(0.320)
Evangelical
!1.027*
(0.540)
0.726***
(0.259)
0.653(0.427)
0.713***
(0.220)
!0.939**(0.467)
Muslim
0.985***
(0.378)
0.317(0.231)
0.748***
(0.218)
!0.287(0.420)
Catholic
1.056***
(0.246)
!0.349(0.401)
Hindu
0.231(0.276)
!1.47***(0.519)
Con
stant
0.762(2.218)
1.300(1.698)
0.961(0.745)
!4.374*
(2.393)
2.662***
(0.703)
!0.280(0.365)
0.927**(0.447)
Observation
s436
2,093
2,183
149
1,360
6,640
6,640
5,088
Dependentvariable:1=individual
contributesin
roundx.
Binarylogiton
poo
ledpanel
data,
clustered
standarderrors
atgrou
plevel.
Notes:*Significantat
10%;**significantat
5%;***significantat
1%.Clustered
standarderrors
atthegrou
plevelin
parentheses.
a. cassar and b. wydick 11 of 25
at University of San Francisco on May 27, 2010
oep.oxfordjournals.orgDownloaded from

responses to previous period shocks to self and others. Uncorrected, however, theseestimations would overweight the contribution decisions of individuals in success-ful groups that were able to receive loans for more rounds resulting from theunbalanced panel. The OLS estimations on average individual contribution rates(given in Table 4) don’t allow for a study of dynamic responses during the experi-ment, but offer something akin to a between estimator where the analysis is carriedout at the individual level rather than the round level. In each of our five-countryestimations we show results without fixed effects, with fixed effects at the countrylevel, and fixed effects at the group level. We incorporate robust standard errors inour estimations on experimental group longevity, and clustered standard errors atthe experimental group level in our estimations on individuals.
3.1 Hypothesis 1: homogeneity and trust
While in Cassar et al. (2007) we found that clan homogeneity in South Africadisplayed a significant effect on group loan repayment, here we find only mildevidence that group homogeneity fosters either higher contribution rates or grouplongevity. Our treatments for homogeneity are oriented around what were per-ceived as the greatest social divisions in each particular country context. In Armeniaour treatments incorporated the significant societal tensions between the pre- andpost-Perestroika generations. In Guatemala one of our treatments incorporatedresidency between one of two rival towns, San Pedro Atitlan and San JuanAtitlan, where serious conflict has emerged over problems associated with tourism,drug trafficking, and the ownership of coffee plantations. We also created groupsthat were homogeneously Catholic, homogeneously Evangelical, and mixed groupswith three of each. We carried out similar homogeneous and heterogeneous bor-rowing group treatments among Muslims, Hindus, and Christians in India,Muslims and Christians in Kenya, and Muslims and Christians in the Philippines.
While we find hints of a mild importance of homogeneity on contribution ratesand group longevity, we cannot find any consistent pattern of significance acrosscountries for groups homogeneous by religion or residence for individual contri-bution rates. In Table 2 point estimates are positive for group homogeneity in everycountry, yet all coefficients are statistically insignificant. In Table 3 we find homo-geneity to have a positive coefficient in four of five countries, but significantlynegative in the Philippines. In our five-country estimation using fixed effects atthe group level, we find that subjects increase their contributions the greater thenumber of other subjects with the same religion as themselves, a significant effect atthe 1% level, but our estimations on individual contribution rates in Table 4 revealno statistical significance or consistency of sign. Consequently, while we find hintsthat homogeneity matters to group performance, the evidence across our fivecountries indicates that homogeneity may not be as important to group perform-ance as other factors.
Three of our control variables attempted to capture other aspects of social capitalamongst our subjects: fraction of a subject’s life lived in the region of the
12 of 25 social capital and microfinance
at University of San Francisco on May 27, 2010
oep.oxfordjournals.orgDownloaded from

Table
4Individual
repaymentdecisions
Variable
(1)
(2)
(3)
(4)
(5)
(6)
(7)
(8)
Arm
enia
Guatem
ala
India
Kenya
Philippines
5-Cou
ntry
5-Cou
ntry
5-Cou
ntry
FE:non
eFE:country
FE:grou
p
Avg
subjectshock
0.286(0.179)
0.080(0.100)
0.194**(0.103)
!0.108(0.243)
0.069(0.156)
0.245***
(0.067)
0.167***
(0.062)
0.040(0.738)
Avg
shocks
others
!0.033(0.036)
!0.143***
(0.050)
!0.008(0.036)
0.063(0.040)
0.040(0.051)
!0.008(0.020)
!0.006(0.019)
!0.003(0.732)
Age
0.001(0.002)
0.002(0.002)
!0.001(0.001)
0.015***
(0.003)
0.002(0.002)
0.003***
(0.001)
0.002**(0.001)
0.002**(0.001)
Education
!0.084(0.186)
0.004(0.018)
0.043(0.038)
!0.018(0.021)
Female
0.033(0.053)
0.076(0.078)
0.030(0.032)
0.122***
(0.033)
0.026(0.030)
0.001(0.045)
Wageworker
!0.032(0.038)
!0.130***
(0.045)
0.054(0.062)
!0.023(0.041)
Ownbu
siness
!0.044(0.090)
0.036(0.022)
0.029(0.035)
!0.013(0.072)
0.022(0.049)
!0.011(0.021)
0.007(0.020)
0.016(0.027)
Pastloan
0.047(0.125)
0.046(0.028)
!0.0680
(0.067)
!0.010(0.120)
!0.138***
(0.049)
0.018(0.023)
!0.005(0.022)
0.005(0.029)
Frac.of
lifein
area
0.060(0.066)
0.005(0.094)
!0.052(0.039)
!0.004(0.098)
0.102(0.063)
0.113***
(0.030)
0.009(0.031)
0.013(0.039)
Num.kn
ow.in
grou
p0.004(0.016)
0.030**(0.012)
!0.022***
(0.008)
0.001(0.029)
!0.016(0.011)
!0.005(0.006)
!0.002(0.006)
0.004(0.008)
GSS
0.031(0.026)
0.042**(0.016)
0.016(0.014)
0.044(0.043)
0.023(0.020)
0.026***
(0.010)
0.027***
(0.009)
0.028**(0.012)
Relig.as
selfttmt.
!0.003(0.017)
!0.002(0.014)
0.009(0.009)
0.023(0.022)
!0.016(0.016)
!0.001(0.007)
0.008(0.006)
0.003(0.013)
Tow
nas
selfttmt.
0.006(0.015)
Self-selection
ttmt.
0.052(0.101)
!0.216(0.134)
!0.247**(0.118)
!0.350***
(0.081)
!0.207***
(0.076)
Self-sel*numkn
ow!0.024(0.022)
0.017(0.036)
0.049(0.031)
0.036*
(0.019)
0.026(0.017)
Mon
itoringttmt.
0.014(0.030)
!0.107*
(0.062)
!0.004(0.037)
!0.045(0.039)
Microf.bo
rrow
er0.092**(0.042)
0.025(0.104)
0.089**(0.041)
0.060(0.041)
Funded
borrow
er0.143**(0.071)
Evangelical
!0.019(0.038)
0.077**(0.032)
0.107(0.081)
0.029(0.033)
!0.053(0.073)
Muslim
0.093**(0.046)
0.031(0.049)
!0.038(0.043)
!0.060(0.073)
Catholic
0.133***
(0.034)
!0.059(0.067)
Hindu
!0.008(0.040)
!0.138*
(0.078)
Con
stant
0.798*
(0.420)
0.731***
(0.139)
0.707***
(0.080)
!0.361**(0.145)
0.752***
(0.147)
0.431***
(0.064)
0.662***
(0.086)
0.579(0.732)
Observation
s152
302
378
207
244
1,354
1,354
1,354
R2
0.05
0.16
0.10
0.12
0.16
0.20
0.27
0.01
Dependentvariable:fraction
oftimes
repaiddivided
byop
portunitiesto
repay.
Notes:Clustered
standarderrors
atgrou
plevelin
parentheses.
*Significantat
10%;**significantat
5%;***significantat
1%.
a. cassar and b. wydick 13 of 25
at University of San Francisco on May 27, 2010
oep.oxfordjournals.orgDownloaded from

experiment, number of acquaintances within the experimental borrowing group,and general societal trust as measured by responses to three standard questionsfrom the General Social Survey (GSS). Results from the estimations yield no iden-tifiable pattern across countries for the first two variables.
We do, however, find positive responses to the GSS social trust questions to havea consistently positive effect on contribution rates across all countries. The variablewe create is a simple index of the number of affirmative answers to the three GSSquestions that concern whether they generally believe that others in society are (i)trustworthy, (ii) fair, and (iii) helpful. The GSS coefficients have the expectedpositive sign for every country in every estimation, and are statistically significanton the individual round estimations (Table 3) and contribution rates (Table 4) inall three five-country estimation specifications. This result holds despite the factthat country fixed effects almost certainly absorb some of the measures of trustcaptured by the GSS questions.
General trust is important to cooperative play because across our five experimentsites, subjects were somewhat acquainted with about 2/3 of the other subjects. Evenif a subject were to believe every subject whom she knows to be a contributor, asubject must possess some degree of trust in the contributions of the unknownremaining 1/3 to rationalize her own decision to play Contribute.
The GSS variable is significant even when we carry out contribution estimationsusing group-level fixed effects. This is significant because to avoid issues of framing,our survey necessarily took place after our experiment. Thus without corroboratingour estimations using fixed effects at the group level, we could not be certain thatstatements of trust resulted from a subject’s experience with her borrowing groupin the experiment. By using group-level fixed effects in column 8 in Tables 3 and 4,we control for the experience of the group, and obtain the effects of differences intrust within borrowing groups in individual contribution rates. In fact in Table 3our point estimates are highest and results most highly significant when usinggroup-level fixed effects, and in Table 4 our point estimates are virtually identicalin the absence of fixed effects (column 6), using country-level fixed effects (column7), and using group-level fixed effects (column 8).
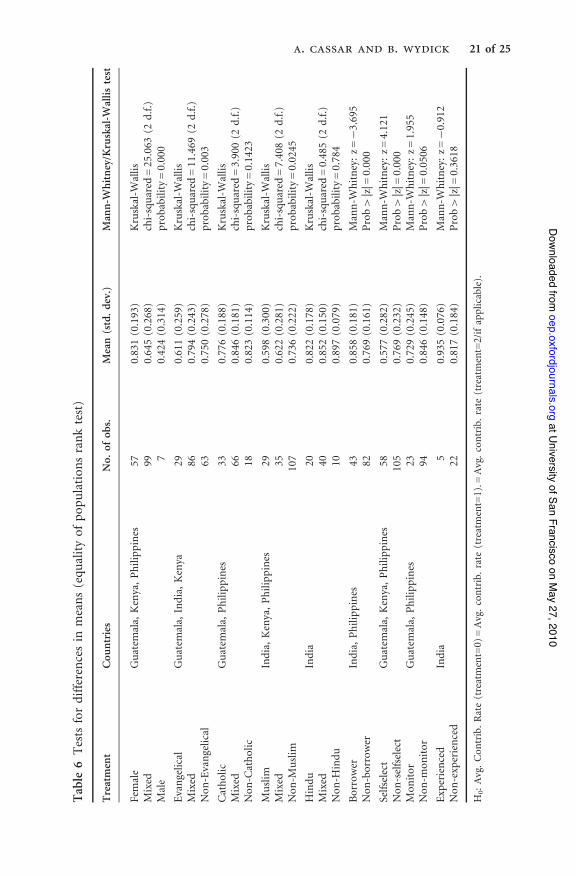
Trust seems to be one reason that women have dramatically higher rates ofcontribution than men. The Kruskal-Wallis test in Table 6 show overall meancontribution rates of women in the study to be dramatically higher, twice ashigh in fact, than men, 83.1% to 42.4%, a finding entirely consistent with theestablished wisdom that women repay microfinance loans at higher rates thanmen. Interestingly, however, the coefficient on gender has an insignificant sign invirtually every estimation, because the trust measures absorb much of the higherrepayment performance of women.
As seen in the country duration rates in Fig. 1 and the average country contribu-tion rates in Table 1, there are substantial country differences in outcomes betweenour country sites. Contribution rates were 90.3% in Guatemala, 75.4% in Armenia,85.4% in India, 74.0% in the Philippines, but only 38.7% in Kenya. These differ-ences seem to be consistent with the expectations that group members took into the
14 of 25 social capital and microfinance
at University of San Francisco on May 27, 2010
oep.oxfordjournals.orgDownloaded from

experiment about the behavior of other members. Based on our simulation detailedin Appendix 2, group members should contribute to the loan if they believe at leastfour of the other five members will contribute to the loan when they draw a greenball. In four of the five countries, this generally appeared to be the case, although atany point in the experiment, a confluence of red balls drawn in one round mayhave caused those expectations to be revised downward. However, in each countrywe randomly carried out exit interviews with subjects asking them to tell us toexplain their repayment strategy for the game.
It was clear from these exit interviews in the Nairobi sites that subjects frequentlyplayed the Withhold strategy from the onset of the game because they believedother group members would do likewise. Our experiment in Kenya was carried outat two experimental sites: Kibera, an inner-city slum of Nairobi and Ongata Rongai,located outside the city. The population inflow from outlying areas in Kenya andeven from other countries has caused considerable civil unrest in the area. Kiberaitself was an epicenter of much of the violence that took place in Kenya as a result ofthe disputed December 2007 elections. The lack of trust by subjects in their coun-terparts coming into the group lending game appeared to create a set of self-ful-filling prophesies that resulted in 32 of the 46 groups terminating after the firstround.
3.2 Hypothesis 2: social capital creation in group borrowing
To see if social capital trust increases with group borrowing experience, we carriedout a portion of our experiments with actual microfinance borrowing groups inIndia and the Philippines. These borrowers were affiliated with Panao Multi-Purpose Cooperative and Growing Opportunity Finance, respectively, two well-established microfinance institutions in their respective countries. Our estimations
Group Duration Rates by Round: Five Countries
0%
10%
20%
30%
40%
50%
60%
70%
Armenia Guatemala Kenya India Philippines
1 2 3 4 5 6 7 8 9 10 11 12 13 14 15 16 17 18 19 20
Fig. 1 Group duration rates by round and country
a. cassar and b. wydick 15 of 25
at University of San Francisco on May 27, 2010
oep.oxfordjournals.orgDownloaded from
across countries yield positive point effects in all instances. In estimations on con-tribution rates, we find the coefficient on a subject being an actual microfinanceborrower to be positive in both countries and significant at the 5% level and 1%level in our five-country estimation in Table 3, and significant at the 5% in ourspecification in column (6) of Table 4. We then ask the question whether thispositive effect appear to come from some type of self-selection of trustworthypeople into microfinance or from the cumulative experience of repaying actualmicrofinance loans together in a borrowing group, i.e. does group borrowing ac-tivity harness existing social capital or perhaps create social capital?
In India we purposely selected some of our subjects from microfinance borrow-ing groups that were newly formed, but in various stages of their eight-week orien-tation course. They had not yet received actual loans. Other groups of realmicrofinance borrowers were veteran microfinance borrowing groups with betweenone and five six-month loans under their belts. Contribution rates were higheramong the funded borrowers, 93.5% to 81.7% although the Mann-Whitney testin Table 6 for differences in contribution rates cannot reject the null of equalrepayment rates. In Table 4, we include a separate term for funded borrower,where we separate out borrowers from experienced groups that had actually bor-rowed together from those who were merely in training. This estimation in column(3) shows that while the contribution rates of microfinance borrowers in generalwere 9.2 percentage points higher in India, the contribution rate of funded bor-rowers was an additional 14.3 percentage points higher.
One possible explanation for this result could have been that nascent borrowinggroups include those that have not yet failed due to non-repayment, while veterangroups survive because they have been able to repay, and moreover have beenpurged of bad borrowers. However, borrowing groups in the particular branchwe worked with in Chennai had exhibited virtually perfect repayment rates andextremely low levels of attrition, essentially ruling out a difference caused by bor-rowing group failure or dropout. The more likely explanation is that group bor-rowing builds trust and positive habits in group cooperation.
The results of our experiments are consistent, for example, with those ofCharness et al. (2007), who demonstrate in a series of experiments that groupmembership and group identity have powerful effects on economic behavior, es-pecially when play is manifest to the relevant group, leading subjects to selectoptions that favor the group. Much previous microfinance literature has empha-sized the role of group lending in harnessing existing social capital (Zeller, 1998;Wydick, 1999; Karlan 2005). But it indeed may be the case that group lendingcreates as much social capital as it harnesses, or perhaps more. There are importantimplications for microfinance if this is so, because it suggests that not all of thebenefits of microfinance may be found simply through impact studies on individualhousehold consumption and welfare, but that there are significant externalitiesfrom group lending in the creation of social capital that spill over into the largercommunity.
16 of 25 social capital and microfinance
at University of San Francisco on May 27, 2010
oep.oxfordjournals.orgDownloaded from

3.3 Hypothesis 3: reciprocity and repayment
As seen in Table 2, negative shocks to investment (random drawings of red balls)have a strong and significant effect on the longevity of groups. Especiallywhen a random cluster of red balls are drawn in a single round it can eitherterminate the game on its own accord (especially when combined with one ormore group members playing Withhold), or result in a downward revision ofpriors about the rate of contribution among other members. Based on the latterphenomenon, we would expect the propensity to contribute to decline based on thenumber of shocks to others in previous rounds when there is imperfectinformation.
Consistent with the theory of reciprocity put forth by Scott (1976) and others, wefind evidence of reciprocity in our experimental data. It appears that the morenegative shocks a subject receives, the more likely she is to contribute to the grouploan when she has an opportunity to contribute. In Table 4 the coefficient onAverage Subject Shocks is positive in every country (except Kenya), and significantat the 1% level in two of the three five-country estimations. We were surprised,however, at the rationale some subjects used to justify their decisions in exit inter-views. One subject in India maintained that she played Withhold subsequent toreceiving a negative investment shock to make up for the lost income from theprevious round.
3.4 Hypothesis 4: self-selection
In Guatemala, Kenya, and the Philippines, we allowed subjects to form their ownself-selected experimental borrowing groups. These are distinct from the actualborrowing groups that took part in the experiment in India and the Philippines.Our desire was to test whether self-selection would be likely to increase contribu-tion rates (Ghatak, 1999; Van Tassel, 1999), and whether acquaintanceship is im-portant in the self-selection process. An original implementation of the grouplending game, among a population of university students, showed that self-selectedgroups displayed greater volatility in outcomes, higher contribution rates in earlyrounds, but with contribution rates falling (and groups collapsing) more rapidly inlater rounds (Abbink et al., 2006).
What we find in our self-selection treatments is that self-selection alone does notyield an improvement in contribution rates or group performance, and in fact byitself seems to have a significantly negative effect (p< 0.01 in all five-countryestimations). However, when we interact the self-selection treatment with acquaint-ance between individuals, we find a strongly significant and positive associationwith contribution rates and group performance: when subjects select others whomthey know to become their fellow group members, rather than randomly selectingstrangers off the street, it matters.
One might ask why borrowers would form a borrowing group with others whomthey do not know well. However, as group lending is carried out in many parts ofthe world, borrowing groups comprised of members with relatively weak ties are
a. cassar and b. wydick 17 of 25
at University of San Francisco on May 27, 2010
oep.oxfordjournals.orgDownloaded from
more common than one might imagine. Because microfinance institutions oftencompel borrowers to form solidarity groups in order to receive loans, those with adire need for credit will sometimes hastily create a borrowing group of memberswith relatively weak social ties. Our results seem to provide some evidence that incontexts where people are well-acquainted with one another, self-selection is help-ful to mitigating adverse selection issues and improving group lending repaymentrates.
3.5 Hypothesis 5: peer monitoring
Early theoretical work on group lending (Stiglitz, 1990; Banerjee et al., 1994)suggested that the high flow of information characteristic of socially cohesive so-cieties may play an important role in generating the strong repayment ratesobserved under group lending. We sought to test these theories in our groupborrowing experiment with a monitoring treatment. About 15% of our groupsin Guatemala and 25% of our groups in the Philippines were given a monitoringtreatment, in which the chairs of the subjects were re-directed inward so thatinformation about investment shocks (the color of balls drawn by subjects) andcontribution choices were observable to all. After the subjects took turns drawingballs, the experimenter elicited contributions simultaneously from group membersby having them flip their cards to Contribute or Withhold. Subjects were allowed tochange their cards in response to the decisions of others until the group convergedto a Nash equilibrium, a process that usually took less than one minute. Our priorbefore implementing the monitoring treatment was that the shame effect would besufficiently strong that no-one would dare to play Withhold after publicly drawinga green ball. Our prior was incorrect.
First, we observed numerous instances of defections, even with public monitor-ing. As Table 6 shows, the contribution rate of 72.9% with the monitoring treat-ment was significantly lower than the 84.6% rate of the standard non-monitoringtreatment in Mann-Whitney tests (p= 0.05). Indeed we observed two general typesof behavioral responses to perfect monitoring. In Guatemala, the contributingsubjects more often took a grin-and-bear-it approach toward a non-contributor,faithfully maintaining their contributions to the group loan in the face of defection.This behavior was maintained in several cases as non-contributors doggedly playedWithhold throughout experiments lasting seven rounds or more.
The other clear pattern both in the data and observed during the experiment wasthat a Withhold decision by a group member would induce a retaliation effectwhere others would flip signs to Withhold. This phenomenon was more commonamong subjects in the Philippines. It is somewhat unclear whether either the initialreactions or subsequent reactions to a Withhold play were retaliatory or strategic innature.
The estimations in Tables 2, 3, and 4 on the monitoring treatment dummy aremostly insignificant, with a positive sign in Guatemala and a negative sign in thePhilippines. However, the overall effect in estimations on the five-country data
18 of 25 social capital and microfinance
at University of San Francisco on May 27, 2010
oep.oxfordjournals.orgDownloaded from
reveals a modestly negative relationship (p< 0.10) between monitoring and grouplongevity. Interestingly, other recent experimental work has hinted at similar phe-nomena. Gine et al. (2010) carry out microfinance games among 491 subjects inPeru, finding, in a treatment allowing for communication between members ofexperimental borrowing groups, that the rate of risky (but potentially high yielding)investment behavior increased strikingly, from 47% to 58%.
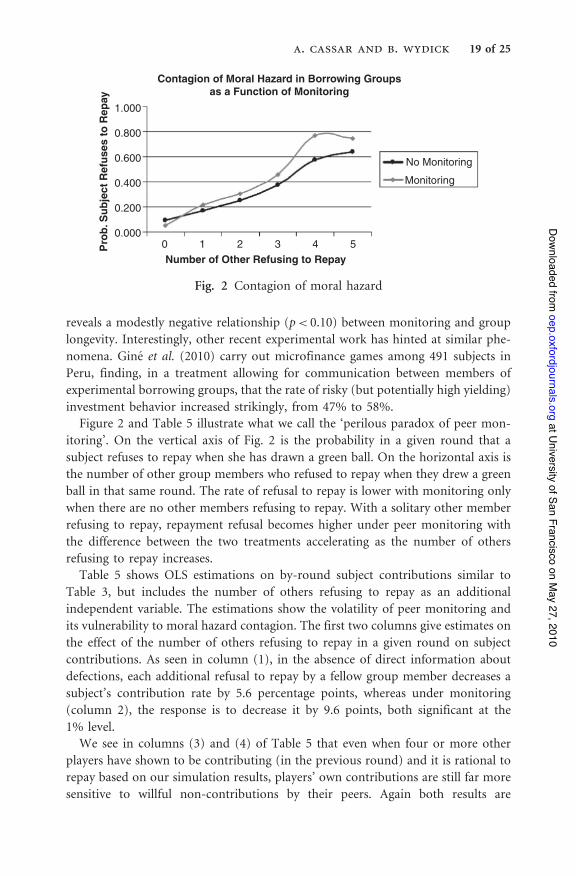
Figure 2 and Table 5 illustrate what we call the ‘perilous paradox of peer mon-itoring’. On the vertical axis of Fig. 2 is the probability in a given round that asubject refuses to repay when she has drawn a green ball. On the horizontal axis isthe number of other group members who refused to repay when they drew a greenball in that same round. The rate of refusal to repay is lower with monitoring onlywhen there are no other members refusing to repay. With a solitary other memberrefusing to repay, repayment refusal becomes higher under peer monitoring withthe difference between the two treatments accelerating as the number of othersrefusing to repay increases.
Table 5 shows OLS estimations on by-round subject contributions similar toTable 3, but includes the number of others refusing to repay as an additionalindependent variable. The estimations show the volatility of peer monitoring andits vulnerability to moral hazard contagion. The first two columns give estimates onthe effect of the number of others refusing to repay in a given round on subjectcontributions. As seen in column (1), in the absence of direct information aboutdefections, each additional refusal to repay by a fellow group member decreases asubject’s contribution rate by 5.6 percentage points, whereas under monitoring(column 2), the response is to decrease it by 9.6 points, both significant at the1% level.
We see in columns (3) and (4) of Table 5 that even when four or more otherplayers have shown to be contributing (in the previous round) and it is rational torepay based on our simulation results, players’ own contributions are still far moresensitive to willful non-contributions by their peers. Again both results are
Contagion of Moral Hazard in Borrowing Groupsas a Function of Monitoring
Number of Other Refusing to Repay
Pro
b. S
ubje
ct R
efus
es to
Rep
ay1.000
0.800
0.600
0.400
0.200
0.0000 1 2 3 4 5
No Monitoring
Monitoring
Fig. 2 Contagion of moral hazard
a. cassar and b. wydick 19 of 25
at University of San Francisco on May 27, 2010
oep.oxfordjournals.orgDownloaded from

Table
5Effectsof
peermon
itoringon
repaymentvolatility
(1)
(2)
(3)
(4)
(5)
(6)
No
mon
itoring
Mon
itoring
Nomon
itor
"4lagcon
tMon
itoring
"4lagcon
tNomon
itor
"4contrib
Mon
itor
"4contrib
Lag
contribution
sothers
0.013*
(0.007)
0.009(0.011)
0.009(0.013)
0.020(0.033)
0.017*
(0.009)
0.006(0.018)
Othersrefuse
!0.056***
(0.013)
!0.096***
(0.029)
!0.058***
(0.019)
!0.130***
(0.028)
!0.065(0.043)
!0.129(0.116)
Shocks
other
!0.004(0.006)
!0.004(0.011)
!0.001(0.007)
!0.006(0.012)
!0.018(0.018)
0.008(0.039)
Observation
s2,937
517
1,910
313
1,785
293
R2
0.07
0.24
0.09
0.30
0.09
0.25
Dependentvariable:1=subjectcontributedin
roundj>1.
OLSestimates,clustered
standarderrors.
Notes:C
lustered
standarderrors
(atgrou
plevel)in
parentheses
withfixedeffectsforcountry,round,andreligion,andcontrolsforsubjectcharacteristics,socialvariables,
andtreatm
ents.
*Significantat
10%;**significantat
5%;***significantat
1%.
20 of 25 social capital and microfinance
at University of San Francisco on May 27, 2010
oep.oxfordjournals.orgDownloaded from
Table
6Testsfordifferencesin
means(equ
alityof
pop
ulation
sranktest)
Treatment
Cou
ntries
No.
ofob
s.Mean(std.dev.)
Mann-W
hitney/Kruskal-W
allistest
Female
Guatem
ala,
Kenya,Philippines
570.831(0.193)
Kruskal-W
allis
Mixed
990.645(0.268)
chi-squared
=25.063
(2d.f.)
Male
70.424(0.314)
probability=0.000
Evangelical
Guatem
ala,
India,Kenya
290.611(0.259)
Kruskal-W
allis
Mixed
860.794(0.243)
chi-squared
=11.469
(2d.f.)
Non
-Evangelical
630.750(0.278)
probability=0.003
Catholic
Guatem
ala,
Philippines
330.776(0.188)
Kruskal-W
allis
Mixed
660.846(0.181)
chi-squared
=3.900(2
d.f.)
Non
-Catholic
180.823(0.114)
probability=0.1423
Muslim
India,Kenya,Philippines
290.598(0.300)
Kruskal-W
allis
Mixed
350.622(0.281)
chi-squared
=7.408(2
d.f.)
Non
-Muslim
107
0.736(0.222)
probability=0.0245
Hindu
India
200.822(0.178)
Kruskal-W
allis
Mixed
400.852(0.150)
chi-squared
=0.485(2
d.f.)
Non
-Hindu
100.897(0.079)
probability=0.784
Borrower
India,Philippines
430.858(0.181)
Mann-W
hitney:z=!3.695
Non
-borrower
820.769(0.161)
Prob>|z|=
0.000
Selfselect
Guatem
ala,
Kenya,Philippines
580.577(0.282)
Mann-W
hitney:z=4.121
Non
-selfselect
105
0.769(0.232)
Prob>|z|=
0.000
Mon
itor
Guatem
ala,
Philippines
230.729(0.245)
Mann-W
hitney:z=1.955
Non
-mon
itor
940.846(0.148)
Prob>|z|=
0.0506
Experienced
India
50.935(0.076)
Mann-W
hitney:z=!0.912
Non
-experienced
220.817(0.184)
Prob>|z|=
0.3618
H0:Avg.Con
trib.Rate(treatment=0)
=Avg.contrib.rate
(treatment=1).=
Avg.contrib.rate
(treatment=2/ifapplicable).
a. cassar and b. wydick 21 of 25
at University of San Francisco on May 27, 2010
oep.oxfordjournals.orgDownloaded from

significant at the 1% level, the point estimate actually increasing in column (4) to13.0 percentage points. Although statistically insignificant, columns (5) and (6)yield an essentially identical pair of point estimates with four or more other playerscontributing in the current round. Because we demonstrate that subjects have anincentive to contribute when four or more others have contributed, what we appearto observe is an emotionally based retaliation effect rather than a calculated stra-tegic response to non-contribution. In short what we find is that peer monitoringseems to outperform no peer monitoring only until any type of malfeasanceemerges within a borrowing group. When malfeasance does begin to occur, co-operation unravels more quickly under peer monitoring.
These experimental results on our monitoring treatment contrast with thetheoretical literature on microfinance, which has often underscored the import-ance of peer monitoring for reducing risky borrower behavior (Stiglitz, 1990;Banerjee et al., 1994). But with imperfect information about true contributiondecisions, a negative decision by one member may fail to trigger a downwardspiral of defections because other players may attribute non-repayment tounavoidable mishap. In the context of group lending, coordination on thenon-repayment equilibrium may ultimately yield the greatest disadvantage tothe lender, a point originally made by Besley and Coate (1995) about grouplending in a full information context. Imperfect information may thus servesome (ironic) purpose as a buffer against the contagion of malfeasance withingroups.
4. Summary and conclusionsDoes social capital matter? Results from our five-country group lending experimentsuggest that it does, though occasionally in unexpected ways. We present inter-national results from an experiment in which subjects have an incentive to con-tribute to a joint-liability loan to improve the likelihood that their group continuesto receive additional loans. However, any member can fair better individually in agiven round by withholding contribution. The stakes were high in our game relativeto the income earned in our five countries; subjects could earn up to two days’wages in less than two hours depending on their own performance and their groupperformance in the experiment. We demonstrate formally that trust is important inthe group lending game: a subject has an incentive to contribute if she believes acritical number of other group members will also contribute, at least four out offive other members in a group of six. We believe that there are five central findingsfrom our five-country group lending experiment:
(i) Trust matters. Individuals with greater trust in their society (as revealed bytheir responses to GSS questions) displayed higher contribution rates, yield-ing benefits that spilled over to other members of their group. We founddifferences in societal trust both across groups and within groups to fostersignificantly higher contribution rates.
22 of 25 social capital and microfinance
at University of San Francisco on May 27, 2010
oep.oxfordjournals.orgDownloaded from

(ii) When people lack confidence in the behavior of others, bad outcomes for allare likely to result. This we observed in Kenya, where the average contribu-tion rate was only 38.7%, and where lending was terminated with borrowinggroups after only 1.8 rounds. Low contribution rates were explained by lowexpectations about the behavior of others. Tragic events that took place inKenya have brought to light the dearth of social trust that we observe in ourexperimental data, obtained less than 12 months prior to the outbreak ofviolence in Nairobi.
(iii) The effects of social and religious homogeneity on group loan repayment,even where societal tensions exist between rival groups, are not as strong aswe expected, are difficult to generalize, and are context-specific. We find mildevidence that religious homogeneity fosters better borrowing group perform-ance, but overall the evidence is underwhelming. General expectations andtrust regarding cooperation matter more.
(iv) Social capital does not just exist innately in developing countries, but can becreated through repetitive and cooperative group effort. Contribution rateswere higher among those with experience taking and repaying loans as part ofreal-world microfinance borrowing groups compared to borrowing groupsthat had already been formed by the MFI and were in orientation, but hadnot yet been funded. Those who were members of experienced borrowinggroups had higher levels of social trust than new borrowers from as yetunfunded groups or the general population of subjects.
(v) The ability of people to monitor one other in group lending environments,and possibly in other situations such as work in teams, can yield negative aswell as positive effects on behavior. When information is imperfect, moralhazard is not as contagious within a group because others may attributepoor performance to unavoidable shocks. However, with perfect monitoringin our experiment, willful non-contribution may trigger either retaliation oroptimal defections by other agents, quickly unraveling group trust andperformance.
In addition the results of our five-country experiment often reveal large andsignificant differences between the five countries in economic behavior andthe effect of identical treatments on economic behavior. This cannot help butre-emphasize the caveats regarding the external validity of experiments and fromdrawing general inferences from experimental and non-experimental results abouteconomic behavior drawn from a single cultural context, especially in researchdevoted to understanding the relationship between social variables and economicoutcomes.
Supplementary materialSupplementary material (Appendices 1 and 2) is available online at the OUPwebsite.
a. cassar and b. wydick 23 of 25
at University of San Francisco on May 27, 2010
oep.oxfordjournals.orgDownloaded from

AcknowledgementsBoth authors wish to thank Luke Crowley, Jean-Paul Petraud, Jason Trimiew, DavidThompson, Ill Hong Yoo, Justus Shoyero, and Chris Wendell for outstanding help withexperiments and data collection, along with Chris Ahlin, Jenny Aker, Alain de Janvry, EstherDuflo, Dan Friedman, Xavier Gine, Michael Jonas, Craig McIntosh, Dean Karlan, MichaelKevane, Stefan Klonner, Travis Lybbert, Ashok Rai, Elizabeth Sadoulet, and DeanScrimgeour for helpful comments and input on this research. Grant funding from theJesuit Foundation, USF Faculty Development Fund and the McCarthy Foundation is grate-fully acknowledged.
FundingUniversity of San Francisco Jesuit Foundation; University of San Francisco FacultyDevelopment Fund; Leo T. McCarthy Center for the Common Good.
ReferencesAbbink, K., Irlenbusch, B., and Renner, E. (2006) Group size and social ties in microfinanceinstitutions, Economic Inquiry, 44, 614–28.
Banerjee, A., Besley, T., and Guinnane, T. (1994) Thy neighbor’s keeper: design of a creditcooperative with theory and a test, Quarterly Journal of Economics, 102, 491–515.
Besley, T. and Coate, S. (1995) Group lending, repayment incentives and social collateral,Journal of Development Economics, 46, 1–18.
Bowles, S. and Gintis, H. (2002) Social capital and community governance, EconomicJournal, 112, F419–36.
Cassar, A., Crowley, L., and Wydick, B. (2007) The effect of social capital on group loanrepayment: evidence from field experiments, Economic Journal, 117, F85–106.
Case, A. and Katz, L. (1991) The company you keep: the effect of family and neighborhoodon disadvantaged youth, Working Paper No. 3705, NBER, Cambridge, MA.
Charness, G., Rigotti, L., and Rustichini, A. (2007) Individual behavior and group mem-bership, American Economic Review, 97, 1140–60.
Floro, M. and Yotopoulos, P. (1991) Informal Credit Markets and the New InstitutionalEconomics, Westview Press, Boulder, CO.
Ghatak, M. (1999) Group lending, local information and peer selection, Journal ofDevelopment Economics, 60, 27–50.
Gine, X., Jakiela, P., Karlan, D., and Morduch, J. (2010) Microfinance games, AmericanEconomic Journal: Applied Economics, forthcoming.
Guiso, L., Sapienza, P., and Zingales, L. (2004) The role of social capital in financial devel-opment, American Economic Review, 94, 526–56.
Henrich, J., Boyd, R., Bowles, S., Camerer, C., Fehr, E., Gintis, H., and McElreath, R. (2001)In search of homo-economicus: behavioral experiments in 15 small-scale societies, AmericanEconomic Review Papers and Proceedings, 91, 73–8.
Ichino, A. and Maggi, G. (2000) Work environment and individual background: explainingregional shirking differentials in a large Italian firm, Quarterly Journal of Economics, 115,1057–90.
24 of 25 social capital and microfinance
at University of San Francisco on May 27, 2010
oep.oxfordjournals.orgDownloaded from

Karlan, D. (2005) Using experimental economics to measure social capital and predictfinancial decisions, American Economic Review, 95, 1688–99.
Knack, S. and Keefer, P. (1997) Does social capital have an economic payoff? A cross-country regression, Quarterly Journal of Economics, 112, 1251–88.
LaPorta, R., Lopez-de-Salanes, F., Shleifer, A., and Vishny, R. (1997) Trust in large orga-nizations, American Economic Review Papers and Proceedings, 87, 333–8.
Putnam, R. (1993) Making Democracy Work: Civic Traditions in Modern Italy, PrincetonUniversity Press, Princeton, NJ.
Stiglitz, J. (1990) Peer monitoring and credit markets, The World Bank Economic Review, 4,351–66.
Scott, J. (1976) The Moral Economy of the Peasant, Yale University Press, New Haven, CT.
Van Tassel, E. (1999) Group lending under asymmetric information, Journal of DevelopmentEconomics, 60, 3–25.
Wydick, B. (1999) Can social cohesion be harnessed to mitigate market failures? Evidencefrom group lending in Guatemala, Economic Journal, 109, 463–75.
Wydick, B. (2001) Group lending under dynamic incentives as a borrower discipline device,Review of Development Economics, 5, 406–20.
Zeller, M. (1998) Determinants of repayment performance in credit groups: the role ofprogram design, intra-group risk-pooling, and social cohesion, Economic Development andCultural Change, 46, 599–620.
a. cassar and b. wydick 25 of 25
at University of San Francisco on May 27, 2010
oep.oxfordjournals.orgDownloaded from