does skin in the game matter?
TRANSCRIPT

Yale ICF Working Paper No. 0634
December 2006
Does Skin in the Game Matter? Director Incentives and Governance in the Mutual Fund
Industry Martijn Cremers, Yale University School of Management, International
Center for Finance
Joost Driessen, University of Amsterdam Finance Group, Faculty of Economics and Econometrics
Pascal Maenhout, INSEAD, Finance Department
David Weinbaum, Cornell University, Johnson Graduate School of Management
This paper can be downloaded without charge from the Social Science Research Network Electronic Paper Collection:
http://ssrn.com/abstract=686167

Does Skin in the Game Matter? Director Incentives and Governance
in the Mutual Fund Industry* Martijn Cremers† Joost Driessen§ Pascal Maenhout¶ David Weinbaum**
This draft: December 2006 We thank Sanjai Bhagat, Bruno Biais, Francesca Cornelli, Alexei Goriaev, Martin Gruber, Jerome Hass, Roger Ibbotson, Steven Kaplan, Owen Lamont, Urs Peyer, Martin Shubik, Matthew Spiegel, Paula Tkac, Heather Tookes, An Yan, and seminar participants at the Yale School of Management, the 2005 meeting of the European Finance Association, the 2005 Burridge Center Conference, the 2006 meeting of the Western Finance Association, and the 2006 meeting of the European Financial Management Association for helpful comments and discussions. † Yale School of Management, International Center for Finance, Box 20820, 135 Prospect Street, New Haven, CT 06520. Email: [email protected]. § University of Amsterdam, Finance Group, Faculty of Economics and Econometrics, Roetersstraat 11, 1018 WB Amsterdam, the Netherlands. Email: [email protected]. ¶ INSEAD, Finance Department, Boulevard de Constance, 77305 Fontainebleau Cedex, France. Email: [email protected]. ** Cornell University, Johnson Graduate School of Management, 375 Sage Hall, Ithaca NY 14853-6201. Email: [email protected].

Does Skin in the Game Matter? Director Incentives and Governance
in the Mutual Fund Industry
Abstract We use a unique database on the ownership stakes of equity mutual fund directors to analyze whether the directors’ incentive structure is related to fund performance. We find that the ownership stakes of both independent and non-independent directors play an economically substantial and statistically significant role. Specifically, funds in which directors have low ownership stakes, or “skin in the game”, significantly underperform. We posit two economic mechanisms to explain this relation. First, a lack of ownership could lead directors to be less active monitors, increasing agency costs between fund shareholders and fund managers. Second, directors may have superior private information on future mutual fund performance, choosing not to invest in those funds that they expect to underperform. We find evidence in support of the monitoring mechanism and against the private information mechanism. In particular, we find no evidence that directors are able to avoid funds that underperform. Finally, our results cannot be explained by the previously documented relation between fund governance and mutual fund fees.
1

1. Introduction While conflicts of interest in mutual funds between managers, fund sponsors and shareholders have recently attracted much popular, academic, political and even legal attention, relatively little is known about the importance of director incentives in mutual funds, or the extent to which effective corporate governance is related to mutual fund performance. Most studies of corporate governance have focused on industrial corporations, and the evidence thus far has been mixed. For example, Weisbach (1988), Byrd and Hickman (1992), Cotter, Shivdasani and Zenner (1997), and Brickley, Coles and Terry (1994) find evidence that more independent boards of directors make decisions that maximize shareholder value, but Baysinger and Butler (1985), Hermalin and Weisbach (1991), and Klein (1998) find no evidence of a relation between board composition and firm performance. In the context of investment companies, Tufano and Sevick (1997) find that the fees charged by open-end funds are lower when the funds’ boards have characteristics that are consistent with effective governance, and Del Guercio, Dann and Partch (2003) find that board structures conducive to effective board independence are associated with lower expense ratios and value-enhancing restructurings, but their results on the relation between governance and discounts from net asset value are mixed. In this paper, we ask whether effective governance, particularly director ownership, is associated with superior mutual fund performance, and if so, what economic mechanism could explain that. Disclosure by mutual fund directors of ownership stakes in the funds they oversee is a relatively new requirement under a final rule passed by the SEC in January 2001 to help “a mutual fund shareholder to evaluate whether the independent directors can, in fact, act as an independent, vigorous, and effective force in overseeing fund operations” (SEC, 2001). To the best of our knowledge the link between the performance of mutual funds and their director’s stakes has not been previously investigated in the academic literature.1 To answer these questions, we assemble a unique database on the fund holdings of the members of the largest equity mutual fund boards of directors, and investigate whether mutual fund performance is related to the ownership stakes of the directors overseeing those same funds. Specifically, for all the funds in the largest equity mutual fund families, we collect information on the ownership stakes of all independent and non-independent directors. Our main finding is that effective governance matters a great deal for fund performance. Specifically, funds in which directors have low ownership stakes, or “skin in the game”, significantly underperform. 1 Upon completion of this paper, we became aware of independent work by Meschke (2004) and Chen, Goldstein and Jiang (2005), who also study the governance of mutual funds. Although neither paper focuses directly on the relation between performance and ownership, they both consider this relation. Using different data, ownership definitions and methodology, they find less evidence that director ownership is related to fund performance. However, among other things, neither paper forms governance-sorted portfolios of funds as we do. Instead, these papers look at individual fund performance, which greatly increases the estimation risk in short time series.
2
We posit two hypotheses to explain this relation between director ownership and fund performance. First, a lack of ownership could lead directors to be less active monitors, thereby increasing agency costs between fund shareholders and fund managers (see e.g. Mahoney (2004) and Zitzewitz (2003)) or even between fund shareholders and the family (see Gaspar, Massa and Matos (2006) and Guedj and Papastaikoudi (2004)). Second, directors may have superior, private information on future mutual fund performance, choosing not to invest in those funds that they expect to perform poorly. Both mechanisms could potentially explain the observed relation. We present a simple model that allows us to distinguish between the two mechanisms. Specifically, if the underperformance of the low ownership funds is driven by directors’ private information, then directors should on average pick funds that outperform the funds that they do not invest in. On the other hand, if the underperformance is due to a lack of needed monitoring, then no such relation would exist at the director level, even though it would still be observed at the fund level. Intuitively, this happens because director holdings are correlated if they are driven by superior information. On the other hand, if directors do not act on superior information, but rather pick funds based on their idiosyncratic risk profile, then there should be little correlation in holdings across directors. Empirically, we find no evidence that directors pick funds that outperform the funds that they do not invest in. This stands in stark contrast to the predictions of the private information hypothesis. Note that this result is not inconsistent with our finding that funds with low director ownership underperform. That result holds at the fund level and is different from this analysis, which focuses on the patterns at the director level to distinguish between the two economic mechanisms. Since there is considerable variation in ownership across directors, we obtain very different results at the director level. Having ruled out private information, we further argue that if the underperformance of low ownership funds is due to a lack of needed monitoring, then the underperformance should be most severe in funds where ownership is low and monitoring could bring greater value. We consider several proxies for the difficulty of monitoring to show that this is the case. Specifically, we argue that monitoring is more important and could bring greater value for funds that pursue more risky strategies or that are more actively managed, as measured by their idiosyncratic volatility and turnover, respectively. In addition, we use the finding of Chen et al. (2004) that fund performance tends to decline with fund size, which they attribute to liquidity and organizational diseconomies. As a result, monitoring may have more value for larger funds. Finally, monitoring may also have more value in funds that have less independent boards. Using these four proxies for the importance of monitoring, we find that the link between ownership and performance is stronger when monitoring is more difficult. We also find that ownership is higher in funds where monitoring is more important.
3

We make several contributions with this paper. Our first contribution is to the literature on equity mutual funds: we identify a previously overlooked, yet economically intuitive, important determinant of mutual fund performance, namely director ownership. Our second contribution is to the corporate governance literature. This paper is the first to relate director ownership to performance in the context of mutual funds. While others have done this for industrial corporations, see, e.g., Morck, Shleifer and Vishny (1998), McConnell and Servaes (1990), and Hermalin and Weisbach (1991), the issues in the mutual fund context are quite different.2 This paper is also the first to directly relate governance and fund performance, as the previous literature focuses almost exclusively on fees. We build on the work of Tufano and Sevick (1997) and Del Guercio, Dann and Partch (2003) by not only introducing a new board characteristic, namely fund director ownership, but also by relating ownership to performance directly. An interesting by-product of our approach is that it enables us to quantify the extent to which the relation between governance and performance is due to the relation between governance and fees. Our third contribution is to the individual investor. Following the recent mutual fund scandals, individual investors may wish to know whether a fund is likely to put its shareholders first. Our results suggest that investors should pay close attention to the incentive structure of their funds’ boards of directors, and to the information disclosed in a seemingly little known document, the “Statement of Additional Information,” which has a wealth of information on directors, including ownership stakes. Our fourth contribution is to the current policy debate. Here interpretation is treacherous because our results only imply association, not necessarily causation. Still, our results indicate that the disclosure requirements brought about by the 2001 SEC rules were warranted. The latest SEC proposals require even greater transparency, as well as boards chaired by independent directors, and a proportion of at least 75% of independent directors. Our findings suggest fund ownership as a mechanism to ensure that directors’ interests are aligned with those of the shareholders. We document that this mechanism is especially important for non-independent directors. Our main findings are easily summarized. First, directors’ ownership stakes in the funds they oversee are related to the subsequent performance of the funds: funds with low director ownership perform poorly. This underperformance has sizeable statistical significance and is economically large. This is true for ownership both at the fund family level and at the individual fund level. Funds in mutual fund families in which ownership by independent directors is low
2 For example, there is evidence in this literature of a non-monotonic relation between manager and director ownership and Tobin’s Q, with Q increasing at low levels of ownership and then decreasing. This is not unexpected in the context of an industrial corporation, where high management ownership insulates management from board discipline and the threat of takeovers (Demsetz, 1983) but it does not apply in the mutual fund context.
4

generate average annual abnormal returns of -2.54%. Similarly, funds with low ownership by non-independent directors generate average annual abnormal returns of -2.48%, and funds with low ownership by independent directors generate annual abnormal returns of -2.01%. The relation between ownership and performance is not linear, rather it is driven by the significant underperformance of low (and often zero) ownership funds. We do not find significant underperformance for funds with intermediate or high ownership. Second, in order to interpret our results, we distinguish between the monitoring and private information hypotheses by considering the performance of directors’ investments in the funds they oversee. In contrast to the results at the fund level, we find no link between lack of ownership and underperformance at the director level, which is evidence against the private information hypothesis. Further, we use various proxies for the importance of monitoring to show that the relation between director ownership and fund performance is driven by the underperformance of funds where monitoring is important, but ownership by directors is low. Third, we investigate the extent to which our results are driven by fees. We find that while fees are indeed higher in low director-ownership funds, and this does explain part of our results, it in fact explains a surprisingly small fraction of the results. This suggests that the role of mutual fund boards of directors extends well beyond fee negotiations. The rest of this paper is organized as follows. Section 2 discusses the legal roles of mutual fund boards of directors and the main economic hypotheses. Section 3 describes our data on mutual fund boards. Section 4 reports our results on how director ownership is related to mutual fund performance. Section 5 distinguishes between the monitoring hypothesis and the private information hypothesis. Section 6 analyzes to what extent our results can be explained by fees. Section 7 concludes. 2. The Roles of Mutual Fund Directors We briefly review some of the insights of the recent literature on the roles of mutual fund directors and develop the main hypotheses concerning the economic mechanisms through which director ownership may be related to fund performance. 2.1. Structure of the Mutual Fund Industry Mandated by the Investment Company Act of 1940, the organizational structure of the mutual fund industry is unlike that of any other sector of the economy. Mutual fund management companies run a variety of individual mutual funds. Mutual funds are investment companies that are owned by their customers, i.e., the investors. As owners, fund shareholders have voting rights
5

and a separate, legally empowered board of directors that represents their interests. Management companies (also referred to as fund sponsors, or advisory firms) are separate corporate entities. Management companies start up mutual funds: initially they own all the fund shares and select the directors that serve on the initial board. Thereafter, the primary responsibility of mutual fund boards is to contract for fund management services: mutual funds have no employees and all management activities are outsourced. The role of mutual fund directors in negotiating fees with the sponsor is the subject of much prior research, see, e.g., Tufano and Sevick (1997). Importantly however, Phillips (2003) argues that the role of mutual fund directors (and most notably of independent directors) is substantially more extensive and comprehensive than the negotiation and approval of investment advisory contracts and fees and includes for instance the selection of auditors, monitoring of compliance with regulatory requirements and especially “the responsibilities (…) to oversee many other transactions involving potential conflicts of interest between the fund’s shareholders and the investment advisor.” The importance of directors monitoring on behalf of the shareholders to mitigate potential conflicts of interest is made clear by the recent fund trading scandals and the allegations made by the SEC that some fund managers themselves had participated in the improper trading.3 Zitzewitz (2003) finds that agency problems may be the root cause of the alleged fund trading activities. Khorana, Tufano and Wedge (2005) show that independent boards show less tolerance of poor performance before they initiate a merger. Several recent papers also point out that differences might arise between the interests of the shareholders of a fund, and those of the fund family. For example, Gaspar, Massa and Matos (2006) show that mutual fund families use trades across member funds to strategically transfer performance across the funds (see also Guedj and Papastaikoudi, 2004). Regulations dealing with these matters require that boards of directors implement detailed policies that protect the fund’s shareholders. Within the mutual fund industry, some have argued that mutual fund boards of directors fail to adequately fulfill the monitoring and advisory roles assigned to them under the 1940 Act. This critique seems based upon the belief that mutual fund directors, even legally independent ones, may have interests that are more aligned with those of the mutual fund sponsor than those of the shareholders. Effectively, according to this argument, mutual fund boards have become captured by their funds’ sponsors: in practice, mutual fund directors serve on the boards of many funds within a fund family and often receive significant compensation for their services; therefore they may wish to develop a reputation for not rocking the boat and thus take actions aimed at
3 For example, the SEC has alleged that some portfolio managers had market timed their own funds, and that a fund manager had allowed a hedge fund he had invested in to trade improperly in the fund he managed. In other instances, fund management companies and fund managers were on opposing sides, see Mahoney (2004).
6

protecting their compensation for sitting on the board, as opposed to maximizing the fund’s returns to its shareholders.4 In sum, directors have the important responsibility to monitor conflicts of interest and to ensure that transactions with affiliates are in the best interest of the fund and its shareholders. These responsibilities extend beyond fee negotiations and cannot be dismissed simply because investment advisors are fired infrequently (Phillips (2003)). These conflict and compliance oversight responsibilities of directors occupy a major part of their role under the 1940 Act and provide significant protection for shareholders. Nevertheless, there has been virtually no research on the economic role of mutual fund boards beyond their impact on fees and on the extent to which they successfully fulfill their roles of fiduciaries of mutual fund investors. One of the goals of this paper is to attempt to fill this gap in the literature. 2.2. Theory and Hypotheses This section develops the main hypotheses concerning the economic mechanisms through which director ownership may be related to performance. Director ownership may be related to fund performance through two economic channels. First, a lack of ownership could prevent directors from monitoring actively. Jensen and Meckling (1976) suggest that ownership can assist in resolving the moral hazard problem by aligning directors’ interests with those of the shareholders. In the context of mutual funds, this would mean that directors without ownership might not have the incentive to serve as effective monitors, thereby increasing agency costs between fund shareholders and fund managers (see e.g. Mahoney (2004) and Zitzewitz (2003)) or even between fund shareholders and the family (see Gaspar, Massa and Matos (2006) and Guedj and Papastaikoudi (2004)). Second, directors may have superior, private information on future mutual fund performance resulting from being insiders. Using their private information, directors would then choose to avoid the funds they expect to perform poorly. Both mechanisms suggest a positive relation between director ownership and subsequent fund performance at the fund level, but generate opposite predictions at the director level, as we now illustrate by means of a simple, stylized model. Assume that there are d directors who each oversee 2f funds, with each director investing in f funds and not investing in the other f funds. Consider the following two scenarios. In the first scenario where directors have superior, private information, some funds are high type (α = H) and others are low type (α = L). Investors cannot tell the difference between the two, but
4 While fund sponsors have no direct legal means of removing independent directors, as Tufano and Sevick (1997) point out, they may pressure them into resigning or not seeking reelection. See Carter (2001) for a specific example.
7

directors can, by virtue of their private information. Directors invest in the high type funds and avoid the low type funds. In this world, the spread in abnormal fund performance (alpha)5 at the fund level is H – L, and the spread in alpha at the director level is also H - L. In the second scenario where director monitoring improves performance, all funds are ex ante identical. If at least one director invests in a fund, the director monitors and the fund becomes a type H fund. If on the other hand all directors happen not to invest in a fund, it gets no monitoring benefits and becomes a type L fund. This nonlinear effect of monitoring is actually consistent with our empirical finding that ownership only impacts performance at low ownership levels (section 4). The directors’ investment decisions are random and independent of each other,6 because they are not driven by information, but rather by each director’s own preferences and other assets in their portfolios besides the funds they oversee. Clearly, in this second scenario, the spread in alpha at the fund level is again H - L. The spread in alpha at the director level is the expected alpha on the funds invested in minus the expected alpha on the funds not invested in. The expected alpha on the funds invested in is simply H, because if one director invests, the fund becomes an H fund. The probability that a fund has an alpha of L given that the director does not invest in it is the probability that the other d-1 directors also do not invest, i.e. (1/2) d-1. The probability that the alpha is H given that the director does not invest is 1-(1/2) d-1, so the expected spread in alpha at the director level is given by
)(2
12
12
11 111 LHLHH ddd −=⎥⎦
⎤⎢⎣
⎡−⎟
⎠⎞
⎜⎝⎛ −−
−−−,
which tends to zero as the number of directors increases. Thus, if directors have access to better information about the funds they oversee, and are acting on this information by avoiding funds that they expect to underperform, then one would expect that individual director portfolios earn positive risk adjusted returns. On the other hand, the monitoring hypothesis would be consistent with directors picking funds that do not necessarily outperform the funds that they do not invest in. In the empirical work in section 5, we first rule out the private information hypothesis by considering the director level portfolios suggested by our model, and then we use proxies for the difficulty of monitoring to show that the relation between director ownership and fund performance is indeed concentrated in those funds in which monitoring is difficult. We measure the difficulty of monitoring of mutual funds by considering how risky the funds’ investment
5 Throughout this paper, we consider long/short portfolios of mutual funds as a convenient way to calculate differences in performance. Since it is not possible to literally short funds, the long/short strategies should not be viewed as trading strategies. 6 Some fund families have policies regarding director ownership, but these policies do not dictate that directors invest in specific funds.
8

strategies are, or how actively managed the funds are, as proxied by their idiosyncratic volatility and turnover. We also use the finding of Chen et al. (2004) that fund returns tend to decline with fund size, which they attribute to liquidity and organizational diseconomies of scale. Finally, monitoring may also be more beneficial in funds with less independent boards. 3. Fund Boards and Director Ownership 3.1. Data Collection Our sources of mutual fund data are (1) the Center for Research in Security Prices (CRSP) Mutual Fund database and (2) the SEC Edgar database. The CRSP database contains monthly data on net returns and net asset values, and annual data on expense ratios, total load fees, turnover and proportion of assets allocated to stocks for virtually all mutual funds since January 1, 1962. This database is essentially free of survivorship bias, see, e.g., Elton, Gruber and Blake (2001) and Evans (2004). The SEC Edgar database contains electronic versions of all the forms that mutual funds are required, by law, to file with the SEC. We purchased access to a large data vendor’s depositary of SEC filings for the period 1996-2004. We use the SEC Edgar database to create a new database of mutual fund director holdings in the funds they oversee. Starting January 31, 2002, mutual funds are required to disclose in a Statement of Additional Information (SAI) detailed information about each member of their board of directors, including the term of office and the length of time served, whether or not the director is independent, the number of portfolios in the fund complex overseen by the director, the dollar range of equity securities in the fund (beneficially) owned by the director, the aggregate dollar range of equity securities in all registered investment companies overseen by the director in the family of investment companies, and the total dollar amount of cash compensation received by each independent director for the fund complex. This information must be disclosed in any SAI filed by the fund; it is available to the public through the SEC, but it is typically not furnished by the funds to their shareholders except upon their explicit request. The SEC provides strict formatting standards that mutual funds must abide by in the above described disclosure obligations. Unfortunately, the vast majority of mutual funds do not follow these formatting standards and consequently there is no formatting consistency across mutual funds. This means that the SEC forms that contain SAIs cannot be parsed electronically, such that we collected the relevant information by hand. First, because of the labor intensity of hand-collecting this data, we limit ourselves to the actively managed equity funds that belong to the top 25 equity mutual fund families as of January 1996.
9
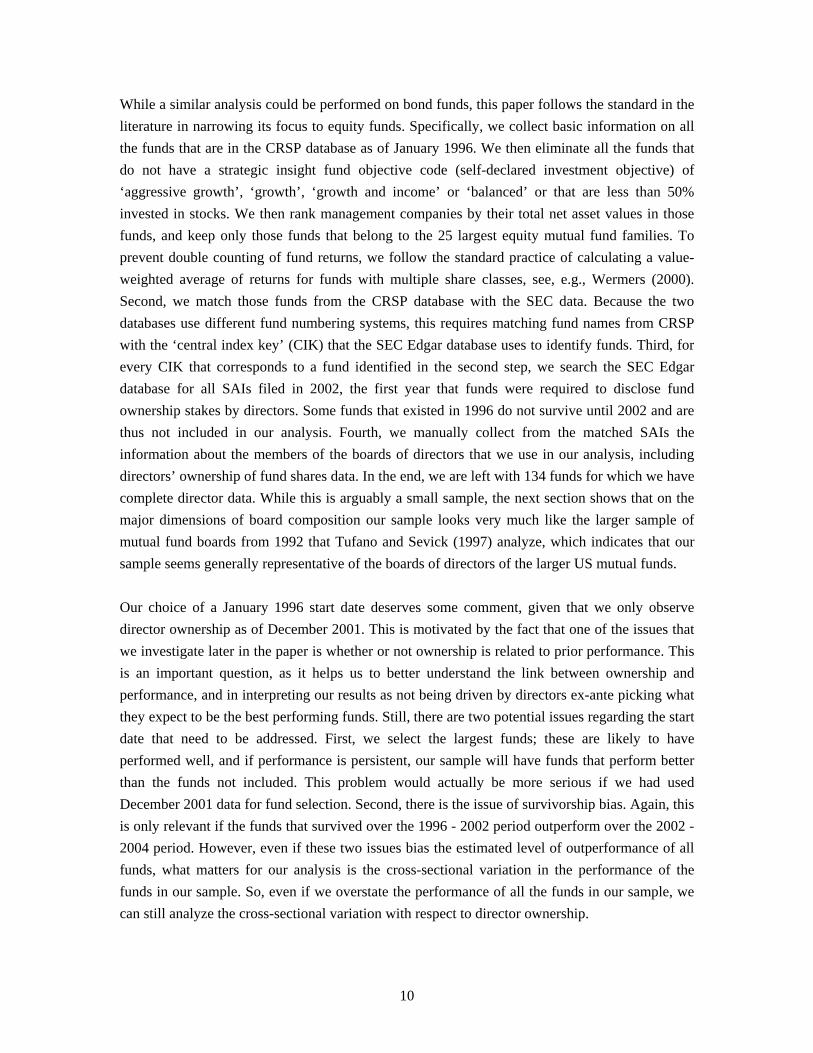
While a similar analysis could be performed on bond funds, this paper follows the standard in the literature in narrowing its focus to equity funds. Specifically, we collect basic information on all the funds that are in the CRSP database as of January 1996. We then eliminate all the funds that do not have a strategic insight fund objective code (self-declared investment objective) of ‘aggressive growth’, ‘growth’, ‘growth and income’ or ‘balanced’ or that are less than 50% invested in stocks. We then rank management companies by their total net asset values in those funds, and keep only those funds that belong to the 25 largest equity mutual fund families. To prevent double counting of fund returns, we follow the standard practice of calculating a value-weighted average of returns for funds with multiple share classes, see, e.g., Wermers (2000). Second, we match those funds from the CRSP database with the SEC data. Because the two databases use different fund numbering systems, this requires matching fund names from CRSP with the ‘central index key’ (CIK) that the SEC Edgar database uses to identify funds. Third, for every CIK that corresponds to a fund identified in the second step, we search the SEC Edgar database for all SAIs filed in 2002, the first year that funds were required to disclose fund ownership stakes by directors. Some funds that existed in 1996 do not survive until 2002 and are thus not included in our analysis. Fourth, we manually collect from the matched SAIs the information about the members of the boards of directors that we use in our analysis, including directors’ ownership of fund shares data. In the end, we are left with 134 funds for which we have complete director data. While this is arguably a small sample, the next section shows that on the major dimensions of board composition our sample looks very much like the larger sample of mutual fund boards from 1992 that Tufano and Sevick (1997) analyze, which indicates that our sample seems generally representative of the boards of directors of the larger US mutual funds. Our choice of a January 1996 start date deserves some comment, given that we only observe director ownership as of December 2001. This is motivated by the fact that one of the issues that we investigate later in the paper is whether or not ownership is related to prior performance. This is an important question, as it helps us to better understand the link between ownership and performance, and in interpreting our results as not being driven by directors ex-ante picking what they expect to be the best performing funds. Still, there are two potential issues regarding the start date that need to be addressed. First, we select the largest funds; these are likely to have performed well, and if performance is persistent, our sample will have funds that perform better than the funds not included. This problem would actually be more serious if we had used December 2001 data for fund selection. Second, there is the issue of survivorship bias. Again, this is only relevant if the funds that survived over the 1996 - 2002 period outperform over the 2002 - 2004 period. However, even if these two issues bias the estimated level of outperformance of all funds, what matters for our analysis is the cross-sectional variation in the performance of the funds in our sample. So, even if we overstate the performance of all the funds in our sample, we can still analyze the cross-sectional variation with respect to director ownership.
10

3.2. Director Holdings Table 1 contains the basic descriptive statistics of the variables of interest: board composition and director holdings. Panel A shows that the average board in our sample has 9.47 members, only 1.94 of whom are not independent. We confirm the finding in Tufano and Sevick (1997) that there is substantial variation in these basic board characteristics across funds, with boards ranging from 3 to 25 members and non-independents ranging from 0 to 6. Non-independent members of the board account for about 20% of the total on average in our sample, and the percentage of independents always exceeds 50%. Thus, while we use a different sample than Tufano and Sevick (1997), board size and composition in our sample is very much in line with theirs. The main difference is that the average proportion of independent board members is 71% in their (1992) sample, which reflects the move toward greater independence of mutual fund boards in recent years. Funds are not required to disclose the exact dollar amount of director holdings, but only a range: either no investment, or an investment of $1 to $10,000, $10,001 to $50,000, $50,001 to $100,000 or more than $100,000. We convert these ranges into dollar amounts by assuming that the lowest possible dollar amount is always invested, e.g., we record an investment in the range of $10,001 to $50,000 as an investment of $10,001.7 Therefore these numbers are clearly very conservative estimates of the ownership stakes. Panel B contains basic information on director holdings in both individual fund shares and aggregate fund family shares. In the average mutual fund, independent directors hold an average of $8,058 in each fund overseen, for a total of $67,170 invested in all the funds overseen by the directors in the family of mutual funds. For the average non-independent director, these amounts are even larger: $23,027 and $88,075 respectively. On average therefore, the stakes of non-independent directors are more substantial, which is consistent with the conjecture that non-independent directors may need stronger ownership incentives if there is indeed an economic meaning to the legal distinction between independent and non-independent directors. Importantly, there is substantial variation in some, but not all, of these amounts across funds. Specifically, both the average independent director fund family holdings and the average non-independent director individual fund holdings vary significantly, ranging from $0 to over $100,000, while the cross sectional variation in average fund family holdings by non-independent directors is much less pronounced. Panel C shows that a substantial number of directors do not invest at all in the funds they oversee: in the average individual mutual fund, 68.36% of independent directors and 59.04% of non-independent directors have no shares. In the average fund family, we find that the percentages of
7 The results that follow are robust to using different breakpoints, different numbers of portfolios, and different ways of computing the average ownership measures.
11

independent and non-independent directors without any shares in any funds in the family are 20.76% and 6.28% respectively. There is a great deal of variation across funds in the proportion of directors with zero holdings; this is true for both independent and non-independent directors. There is also variation across fund families in the proportion of independent directors holding nothing, but the variation in the proportion of non-independents holding nothing is much smaller. In addition to what is described in panel C, it is worth pointing out that in 31.82% (35.53%) of the individual funds in our sample no independent (non-independent) director holds anything, and that in 10.61% (17.11%) of the funds all independent (non-independent) directors have at least a dollar invested. At the fund family level, in 3.82% (0%) of fund families all independent (non-independent) directors hold nothing, and in 48.85% (88.31%) all independent (non-independent) directors have at least a dollar invested. 4. Board Characteristics and Fund Performance In this section, we analyze the returns of various portfolios created by sorting funds according to different board characteristics. Director ownership is measured as of December 31st, 2001. Performance is measured using monthly fund returns from January 2002 to June 2004, for a total of 30 months. We categorize funds in our sample according to three variables: (1) average fund family ownership by independent directors, (2) average individual fund ownership by independent directors, and (3) average individual fund ownership by non-independent directors. Table 1 reports some summary statistics on these three variables, and on an additional variable, namely the average family ownership of the non-independent directors. As was pointed out earlier, there is almost no variation across funds in this additional variable, as most non-independent directors have family ownership in the highest range, so we do not consider this variable further. For each variable, we sort funds into four groups based on the quartiles of the variable (see Table 1, Panel B). Thus funds in which the average family level investment by independent directors is greater than $95,000 are classified as funds with high independent family ownership, and funds in which the average family level investment by independent directors is less than $38,334 are considered funds with low independent family ownership. Funds with independent family ownership between $38,334 and $72,857 and those with independent family ownership between $72,858 and $95,000 are the other two categories. Similarly, we also divide funds into four quartiles based on the other two variables.
12

We construct three separate sets of four NAV-weighted portfolios8 (one set per governance variable) and three long/short portfolios that buy funds with high values of the particular governance variable (fourth quartile) and sell funds with low values of that governance variable (first quartile). We note that, since it is not possible to literally short funds, the long/short strategies should not be viewed as trading strategies, but merely as a convenient way to calculate differences in performance. To ensure that our results are not driven by differences in risk or ‘style’ we calculate abnormal returns using a four factor model that includes the three Fama-French (1993) factors and a momentum factor, as in Carhart (1997) and Jegadeesh and Titman (1993). The estimated abnormal return is the constant α in the regression
tttttt UMDHMLSMBMKTR εββββα +⋅+⋅+⋅+⋅+= 4321 ,
where Rt is the excess return over the risk free rate to a portfolio in month t, and MKTt, SMBt, HMLt and UMDt are, respectively, the excess return on the market portfolio and the return on three long/short portfolios that capture size, book-to-market, and momentum effects. In addition to standard t-statistics, we also calculate bootstrap empirical p-values, lest we overly rely on the standard statistical assumptions for our relatively short sample. For each sorting, we run 1,000 bootstraps, each time randomly assigning funds to portfolios, and we compare the actual t-statistics to the empirical distribution of the t-statistics from these bootstraps. Non-normality of mutual fund returns may drive a wedge between the bootstrap and asymptotic p-values and we therefore conservatively require statistical significance at the 5% level according to the bootstrap empirical p-values. Table 2 contains our results on the relation between mutual fund performance and the three board characteristics. In addition, it also considers the proportion of independent directors on the board. Panel A considers the performance of portfolios formed on the basis of average ownership in fund family shares by independent directors. We find that, over the period January 2002 to June 2004, funds with low independent family ownership have earned annual abnormal returns (alphas) of -2.54%, with a t-statistic of -2.95 and a bootstrap empirical p-value of 0.02. This abnormal underperformance is very significant, both economically and statistically. Panels B and C consider the performance of portfolios formed on the basis of average ownership in individual fund shares by non-independent directors (panel B) and independent directors (panel C). Funds with low non-independent director fund ownership have earned annual abnormal
8 Using equally weighted portfolios as opposed to NAV weighted portfolios gives very similar results except for independent director fund ownership, which becomes insignificant, consistent with ownership being more important for larger funds, which is confirmed in Section 5.
13

returns of -2.48% with a t-statistic of -2.63 (bootstrap empirical p-value of 0.07), again economically large and statistically significant. Similarly, funds with low independent director fund ownership have earned annual abnormal returns of -2.01%, with a t-statistic of -3.01 and a bootstrap empirical p-value of 0.02. In sum, for independent directors we find evidence for both an individual fund effect and a fund family effect. For non-independent directors, we identify a significant individual-fund ownership effect. This is an important finding in light of the emphasis that regulators and researchers have placed on the role of independent directors. This finding makes good economic sense, since non-independent directors are, by the very nature of their legal classification, much more involved in the life of the fund and more likely to need incentives in order to be effective monitors. Our results point to an important role for non-independent directors, as long as the incentives are in place to make their interests aligned with those of the shareholders of the funds they oversee. Analyzing the abnormal returns of the individual quartiles, we do not find a monotonic relation between ownership and performance. Our results are primarily driven by the very poor performance of the funds in the lowest ownership category: funds in which no directors own any shares (quartile 1 according to Panel B in Table 1) earn robustly large and statistically significant negative alphas between -2% and -2.5% per year, regardless of the specific measure of director ownership. Besides the lowest-quartile portfolios, none of the other abnormal returns are statistically significant according to the bootstrap empirical p-values. While we devise further tests in the subsequent analysis to attempt to distinguish between the two mechanisms and alternative interpretations of our findings, it is clear that information of zero or low director ownership should be viewed as an alarming signal for mutual fund investors, regardless of the hypothesis and interpretation. Finally, given the recent SEC rule requiring that 75% of board members be independent and the debate that this has sparked in the industry, it may be of interest to examine whether sorting funds according to the proportion of independent directors produces a spread. Panel D clearly shows that there is little evidence that the proportion of independent directors matters unconditionally for risk-adjusted performance: the alpha of the long/short portfolio is only 85 basis points, with a t-statistic of 0.63. We revisit this issue below in more detail. 5. Testing the Economic Mechanisms The results so far provide evidence of a strong link between director ownership and risk-corrected fund performance. Economically speaking, this relation may be driven by two distinct mechanisms as described in section 2, namely the monitoring mechanism and the private-
14

information mechanism. According to the monitoring mechanism, directors with stakes in the funds they oversee have direct incentives for monitoring in a way that benefits outside fund shareholders by ultimately improving the performance of the fund. In contrast, the private-information hypothesis involves directors ex ante selecting and investing in funds that, according to their private signals and information, are expected to provide superior performance. 5.1. Private Information An important implication of the model presented in section 2 is that, while both the private information mechanism and the monitoring mechanism predict the underperformance of low ownership funds at the fund level, the two mechanisms generate opposite predictions at the director level. Specifically, the model shows that the private information channel implies that directors, on average, choose funds that outperform the funds they do not invest in. To test this hypothesis, we form two portfolios for each director who owns shares in at least some, but not all, of the funds he or she oversees. The first portfolio is an equally-weighted investment in the funds in which the director has invested, and the second is an equally-weighted investment in the funds in which the director has not invested. For each director, we then compare the average returns and the alphas of these two portfolios. We have data on 307 directors, out of which 113 have ownership in some, but not all, of the funds they oversee. This requirement is added to allow us to focus on testing the private information mechanism, and differentiate from the previous results. On average, each of these directors oversees 6.5 funds and has zero ownership in 3.4 funds. Table 3 reports the mean performance measures between the two director-level portfolios, averaged across all directors. In stark contrast to the predictions of the private information hypothesis, the average difference in both alphas and raw returns is negative, implying that on average directors pick funds that underperform the funds that they do not invest in (though in the case of raw returns the difference is not statistically significant). These results are clearly not inconsistent with our earlier finding that funds with lowest-quartile director ownership underperform, as highlighted by the model in section 2. Those results hold at the fund level and are different from the analysis here, which focuses on the patterns at the director level. Since there is considerable variation in ownership across directors, we obtain very different results at the director level. In particular, the underperformance at the fund level was driven by funds in the lowest quartile for director ownership, i.e., funds with zero ownership. The analysis in Table 3 on the other hand specifically focuses on the subset of directors that have
15
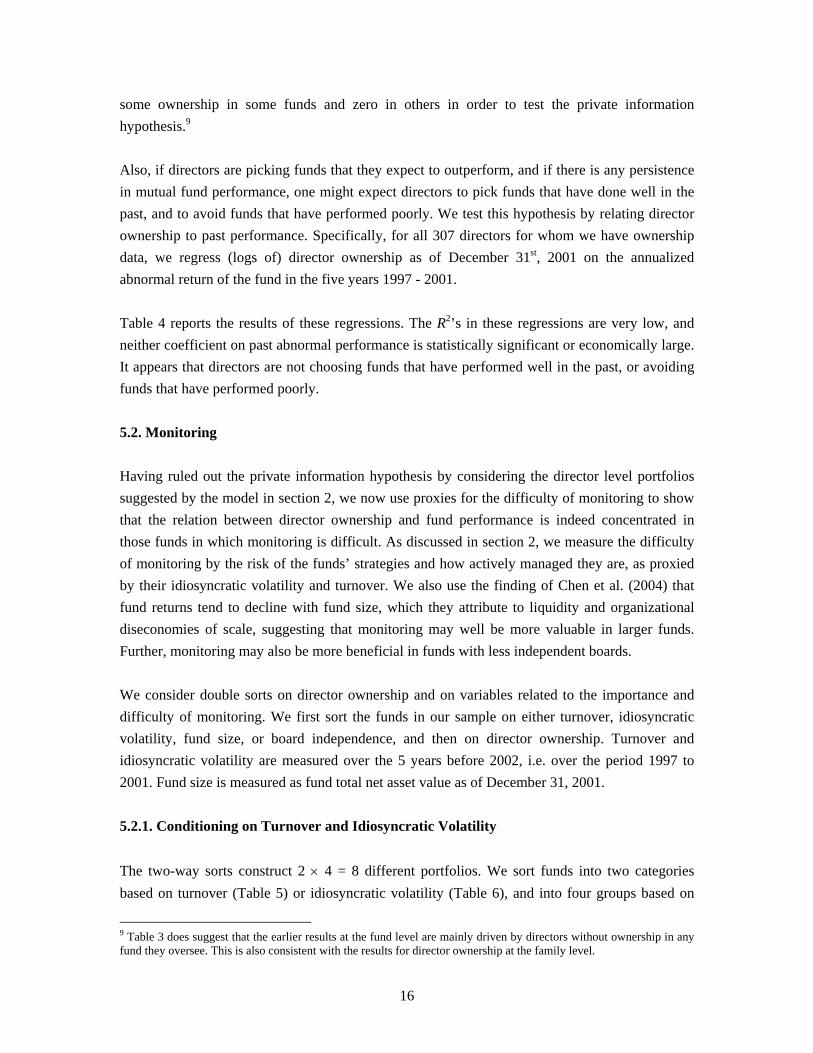
some ownership in some funds and zero in others in order to test the private information hypothesis.9 Also, if directors are picking funds that they expect to outperform, and if there is any persistence in mutual fund performance, one might expect directors to pick funds that have done well in the past, and to avoid funds that have performed poorly. We test this hypothesis by relating director ownership to past performance. Specifically, for all 307 directors for whom we have ownership data, we regress (logs of) director ownership as of December 31st, 2001 on the annualized abnormal return of the fund in the five years 1997 - 2001. Table 4 reports the results of these regressions. The R2’s in these regressions are very low, and neither coefficient on past abnormal performance is statistically significant or economically large. It appears that directors are not choosing funds that have performed well in the past, or avoiding funds that have performed poorly. 5.2. Monitoring Having ruled out the private information hypothesis by considering the director level portfolios suggested by the model in section 2, we now use proxies for the difficulty of monitoring to show that the relation between director ownership and fund performance is indeed concentrated in those funds in which monitoring is difficult. As discussed in section 2, we measure the difficulty of monitoring by the risk of the funds’ strategies and how actively managed they are, as proxied by their idiosyncratic volatility and turnover. We also use the finding of Chen et al. (2004) that fund returns tend to decline with fund size, which they attribute to liquidity and organizational diseconomies of scale, suggesting that monitoring may well be more valuable in larger funds. Further, monitoring may also be more beneficial in funds with less independent boards. We consider double sorts on director ownership and on variables related to the importance and difficulty of monitoring. We first sort the funds in our sample on either turnover, idiosyncratic volatility, fund size, or board independence, and then on director ownership. Turnover and idiosyncratic volatility are measured over the 5 years before 2002, i.e. over the period 1997 to 2001. Fund size is measured as fund total net asset value as of December 31, 2001. 5.2.1. Conditioning on Turnover and Idiosyncratic Volatility The two-way sorts construct 2 × 4 = 8 different portfolios. We sort funds into two categories based on turnover (Table 5) or idiosyncratic volatility (Table 6), and into four groups based on
9 Table 3 does suggest that the earlier results at the fund level are mainly driven by directors without ownership in any fund they oversee. This is also consistent with the results for director ownership at the family level.
16

the ownership stakes of directors (ownership of individual fund shares by independent directors in Panel A and non-independent directors in Panel B). When conditioning on turnover in Table 5, we find large abnormal returns for long/short portfolios based on director ownership of individual fund shares, but only when turnover is high. The alphas are 2.59% and 3.99% for independent and non-independent director ownership, respectively. Although economically significant for both measures of ownership, the bootstrap empirical p-values indicate that statistical significance only obtains for non-independent directors. If there is an economically meaningful distinction between independent and non-independent directors, then the monitoring mechanism would predict the strongest impact of incentives for non-independent directors, which is exactly what we find. The alphas of the individual fund portfolios are also interesting: for funds where monitoring is important (high turnover) but incentives for monitoring are absent (lowest ownership quartile) we find very negative abnormal returns of -3.35% and -3.40% for both types of directors. For non-independent directors, conditioning on idiosyncratic volatility in Table 6 yields even stronger results. Funds with high idiosyncratic volatility and zero non-independent director ownership (quartile 1) are characterized by an abnormal return of -4.32%. The portfolio that sells these funds and simultaneously buys funds with high idiosyncratic volatility and highest-quartile ownership earns a statistically and economically very significant abnormal return of 5.22%. In contrast, the abnormal return for the corresponding long/short portfolio for low-volatility funds is less than 1% and insignificant. Funds where monitoring is important, but where non-independent directors have no ownership incentives to be effective monitors, underperform substantially. The abnormal returns for the long/short portfolios based on independent director ownership go in the right direction (larger abnormal return when idiosyncratic volatility is high, i.e. when monitoring is expected to be most important and difficult), but we do not obtain statistical significance. As in Table 5, the evidence is stronger for non-independent directors. It should be noted that these findings are potentially consistent with both the monitoring and the private information mechanisms, as the private information mechanism may also suggest that director ownership should be more strongly related to performance in funds where private information is likely to be more valuable, e.g., in funds with high turnover and idiosyncratic volatility (actively managed funds). Recall however that the director level results suggested by the model in section 2 rule out the private information mechanism. Further, there is no difference in persistence when conditioning on either of these variables (turnover and idiosyncratic volatility). Hence directors could not have exploited information about these variables in an effort to chase return persistence. Also, we find no significant unconditional relation between fund
17

performance and idiosyncratic volatility or fund size. In both cases, the abnormal return on a long/short portfolio is statistically insignificant. In isolation therefore, these proxies for the difficulty and importance of monitoring are not related to fund performance, so that any significant alphas reported in Tables 5 and 6 must be driven by director ownership. 5.2.2. Conditioning on Fund Size If effective monitoring is more difficult or important for larger funds (e.g., because of diseconomies of scale) the link between director ownership and performance should be strongest for larger funds. The results in Panels A and B of Table 7 support this prediction, as is clear from the significant alphas for long/short portfolios of large funds, for both independent and non-independent directors. The long/short portfolios for small funds have statistically insignificant abnormal returns and the point estimate for independent directors in Panel A is even negative. Consistent with the other findings and with the monitoring mechanism, the long/short results are primarily driven by the poor performance of large funds with zero ownership (alphas of -2.05% and -2.54% for independent and non-independent directors, respectively). 5.2.3. Conditioning on Board Independence We conduct a two-way sort on the percentage of non-independent directors and on the fund ownership by all directors (both independent and non-independent). Table 8 shows that director ownership only matters when the percentage of non-independent directors is high. A portfolio that buys funds with the highest director ownership and sells funds with the lowest director stakes earns an economically and statistically significant abnormal return of 2.81%, but only when the percentage of non-independent directors is high. This long-short result is again driven by the very substantial underperformance (alpha of -3.25%) of funds that have a high fraction of non-independent directors and where ownership is in the lowest quartile. Thus the lack of incentives in the form of ownership is most problematic when there are few independents. Relating to the recent change in SEC policy, it seems that adequately incentivizing non-independent directors is as important as regulating the fraction of independent directors. Our finding of economically and statistically very significant underperformance of funds that lack monitoring incentives (even though they are funds most likely to benefit from monitoring) begs the question of how these funds can survive in equilibrium. In particular, why would investors continue to provide capital to fund managers that make value-destroying investment decisions and that apparently are not being scrutinized or monitored by directors, since the latter lack the incentives to do so? Interestingly, this ‘anomaly’ of a lack of responsiveness of mutual fund investors to the information of poorly incentivized directors that fail to monitor underperforming
18

fund managers is closely related to the well-documented puzzle in the mutual fund literature that some investors in underperforming funds fail to react to the underperformance by withdrawing from those funds, see, e.g., Berk and Xu (2004). In fact, Berk and Xu (2004) demonstrate empirically that it is precisely this heterogeneity in investor responsiveness that generates persistence of negative performance, even in a rational model without agency problems (Berk and Green (2004)). Understanding the reasons for the lack of responsiveness on the part of some investors is certainly an interesting topic for future research, with frictions and suboptimal behavior as obvious explanations. 5.2.4. Director Ownership and the Difficulty of Monitoring If mutual fund shareholders benefit from director ownership because of the improved monitoring incentives, then one would expect ownership to be optimally determined in equilibrium to alleviate agency problems. Ownership should then vary across funds according to cross-sectional differences in these funds in terms of the marginal costs and benefits of improved monitoring. In Table 9, we regress (logs of) director ownership as of December 31st, 2001 on fund size, turnover and idiosyncratic volatility (both computed over the 1997-2001 period), as well as several control variables (the size of the family, the number of funds in the family, the expense ratio of the fund, and the annualized abnormal return of the fund in the five years 1997 – 2001). If board characteristics, including director ownership, are endogenously and optimally determined, one would expect a positive relation between fund size, past turnover or idiosyncratic volatility on the one hand, and current director ownership. Several interesting results emerge. First, these fund characteristics jointly explain a significant portion of the variation in ownership across funds: the R2’s in the ownership regressions are close to 25%. Second, consistent with a performance maximizing optimum, fund size is an important determinant of fund ownership: the individual fund-level ownership of both independent and non-independent directors is significantly related to the individual fund size but not to the family size. Third, and again consistent with a performance maximizing optimum, director ownership is positively related to idiosyncratic volatility (though in the case of non-independent director ownership this is not statistically significant). Fourth, past turnover does not appear to matter10.
10 These results are robust to using raw rather than abnormal mutual fund performance, and to using raw rather than idiosyncratic fund return volatility. Also, the correlation between turnover measured over the 1997-2001 time period, and turnover measured over 2002-2004 is only 54%.
19

6. Board Characteristics, Shareholder Fees and Fund Performance An important finding in the mutual fund literature is that shareholder fees are a major determinant of mutual fund performance. Among others, Blake, Elton and Gruber (1993), Carhart (1997), Elton et al. (1993), Jensen (1968), and Malkiel (1995) document this empirical regularity over various time periods, types of funds and methods of accounting for risk and style. The result that emerges from this literature is that a 1% increase in annual expense ratios typically lowers performance by 0.8% to 2.2% per annum. Wermers (2000) finds that the stocks held by mutual funds outperform a broad market index by 1.3% per year even though, on a net return basis, funds underperform by 1% annually. He decomposes the 2.3% difference, and finds that 0.7% is due to the underperformance of non-stock holdings, while the remaining 1.6% is split evenly between expenses and trading costs. The evidence thus suggests that fund shareholders are well served when directors negotiate lower fees. Our findings so far support the claim that effective governance is related to fund performance. In this section we ask to what extent this effect is driven by fees. This is an important question, because one of our objectives in this paper is to better understand the economic role of mutual fund boards of directors. Previous research in this area has focused almost exclusively on the cross-sectional relation of board characteristics and shareholder fees. This is perhaps not surprising, given the literature on the relation between performance and fees, and the fact that boards of directors do play the important role of negotiating the terms of the advisory contract. However, as we have argued earlier in the paper, there is reason to believe that directors do more. Specifically directors have the important monitoring role of resolving a wide array of conflicts of interests between the advisory firm and the fund’s shareholders. In this section, we attempt to quantify the role of effective governance beyond its relation to shareholder fees. Our analysis proceeds in two parts. In the first part, we examine the relation between fund fee levels and our governance variables, after controlling for fund specific factors and fund board characteristics known to affect fees. In the second part we then investigate to what extent the relation between director ownership and fund performance is driven by fees. 6.1. Expense Ratio Regressions Following Tufano and Sevick (1997) and Del Guercio, Dann and Partch (2003), we test whether effective governance is associated with lower expense ratios. We begin by replicating their result that expense ratios are negatively related to assets under management, positively related to board size11, and negatively related to the proportion of independent members on the board of directors.
11 This result is also consistent with Yermack’s (1996) finding that small boards are more effective than large ones in large U.S. industrial corporations.
20

Column 1 in Table 10 contains the evidence. We also find evidence that even after controlling for assets under management, the number of funds in the family matters, as does the average turnover. The negative coefficients on fund assets, family assets and number of funds in the family point to economies of scale in the mutual fund industry, and it appears that at least part of these savings are passed on to investors in the form of lower fees. The positive relation between fees and turnover is consistent with that identified by Wermers (2000). Overall the evidence in Table 10 is entirely consistent with the results of Tufano and Sevick (1997) and Del Guercio, Dann and Partch (2003) that effective governance is associated with lower shareholder fees. We then add the measures of director ownership as explanatory variables, adding first independent director fund ownership, non-independent director fund ownership and independent family director ownership, each separately, and then all three ownership measures together. Several important results emerge from this analysis. First, independent director ownership (both at the fund and family level) has no impact on expenses. In contrast, non-independent director ownership is highly significant, both economically and statistically. Adding log non-independent director fund ownership increases the R2 from 33.4% to 56.3%. Economically, a one-standard deviation increase in the log of non-independent director fund ownership (equal to 5.4) is associated with a decrease in the expense ratio of 9.8 basis points, or about 8.4% of the average expense ratio of 116 basis points. Second, once the ownership stakes of the non-independent directors are included in the regression as an explanatory variable, the proportion of independent directors on the board flips sign and loses statistical significance. Third, controlling for non-independent director ownership, none of the other governance variables except board size remain significant or even have the expected sign. Consistent with earlier results, incentivizing non-independent directors to be effective monitors is found to have major implications for fund performance, while independent director ownership seems less important and in fact unrelated to expense ratios across funds. 6.2. Before-Fee Fund Performance To assess the importance of our governance variables beyond their relation to fees, we again form portfolios by sorting funds on the governance variables. This is reminiscent of our analysis in Table 2, but the difference is that we now consider gross, i.e., before-fee, returns, whereas in the previous sections we were looking at returns net of fees. This is a simple approach that has the advantage that any performance differential identified in gross returns cannot, by definition, be due to the association between our governance variables and shareholder fees. To calculate the returns before expenses, we first calculate a monthly expense ratio by using the annual expense
21

ratio reported by CRSP for that year and dividing it by 12.12 Second, for each fund we add the monthly expense ratio back to each monthly net return and then estimate abnormal returns exactly as we do in the previous sections, using the Fama-French (1993) three-factor model augmented by a momentum factor (Carhart, 1997).13 Our results are reported in Table 11. Panel A considers the before-fee performance of portfolios of funds sorted on the basis of average ownership in fund family shares by independent directors. Panels B and C report results on the before-fee performance of portfolios of funds sorted on average individual fund ownership by non-independent directors and independent directors, respectively. The average annual expense ratio for each portfolio is also reported. Two important results emerge from this analysis. First, looking at the average expense ratios, we find that funds whose non-independent directors have zero ownership stakes (quartile 1 in Panel B) indeed have substantially higher expense ratios than funds whose directors have some ownership, consistent with the results of the fee regressions. We now also find some evidence of a negative relationship between average expense ratios and independent director ownership (either at the family or at the fund level), unlike in Table 10. Second, the long/short portfolios that buy funds in which directors have high ownership and sell funds in which they have little ownership still generate economically large average abnormal before-fee returns. For example, a long/short portfolio constructed by sorting funds by the average ownership of non-independent directors of individual fund shares produces average before-fee abnormal returns of 1.73% per year, with a t-statistic of 2.00 and a bootstrap empirical p-value of 0.06. Based on net returns, the same portfolio generates average abnormal returns of 2.11% per year with a t-statistic of 2.44 and a bootstrap empirical p-value of 0.03 (see Table 2). Therefore, of the 211 basis point spread, only about 38 basis points, or 18% of the spread, can be attributed to fees. For independent directors, the fraction of the long/short abnormal return that can be attributed to fees is only 11% when sorting by fund ownership and 22% when considering family ownership. The long/short abnormal before-fee returns are highly statistically significant in this case, with bootstrap empirical p-values of 0.03 (independent director family ownership) and 0.04 (independent director fund ownership). Summarizing, fees account for part of the performance of the director ownership based long/short portfolios, but they clearly do not explain the spread exhaustively, and in fact only explain a remarkably small portion of it. These results are consistent with the view that directors have roles that extend beyond negotiating advisory fees with the fund sponsor.
12 We continue to follow the standard practice of calculating a value-weighted average of returns for funds with multiple share classes as in, e.g., Wermers (2000). Fees are thus added back to each share class. 13 We verified that expense ratios are not affected by these factors, by adding betas with respect to the four factors of our asset pricing model to the expense ratio regression, and find that none of these are statistically significant.
22

7. Conclusion The much publicized allegations of mutual fund trading improprieties have brought mutual fund governance practices into the spotlight. While the specific details of the allegations vary, the basic issue invariably involves some conflict of interest between a fund management firm and a fund’s shareholders. For example, allowing some large investors to engage in market timing activities may increase a fund’s assets under management (and thus the advisory firm’s fee income) but only at the expense of other fund investors. The SEC has proposed several new rules designed to improve the governance of mutual funds. There is significant disagreement in the mutual fund industry, and even within the SEC itself, about the potential costs and benefits of the new governance rules. The mutual fund industry’s Investment Company Institute has proposed its own set of best practices and several industry leaders have voiced strong opposition and proposed alternative strategies to improve mutual fund governance. Fidelity Asset Management went so far as to commission a study, the Bobroff and Mack (2004) Report, that found no evidence that funds chaired by a non-independent director perform worse or charge higher fees than those chaired by an independent director. In the words of Fidelity Chairman Edward Johnson, “a government mandate to have an independent fund chairman would be like requiring a ship to have two captains. He said he would rather have one, and if he owned the ship, so much the better” (Damato and Burns, 2004).14 For all this disagreement, there is a consensus that conflicts of interest exist and that mutual fund governance practices are important and need to be improved. In this paper, we focus on the question of whether director ownership, as a proxy for effective governance, is associated with superior mutual fund performance. To that end, we use a unique database on the ownership stakes of directors in the funds they oversee to analyze whether effective mutual fund governance is related to fund performance. The main result is that the directors’ ownership stakes are important for fund performance. In particular, funds in which directors have no ownership significantly underperform other funds. We show that funds with higher ownership by non-independent directors have lower fees. However, this can only explain a small part of the relation between ownership and performance. We posit two hypotheses to explain the link between low director ownership and poor fund performance: lack of monitoring by directors that increases agency costs and private information used by directors when deciding in which funds to hold investments. We show that directors on average invest in funds that do not outperform the funds that they do not invest in, which renders the private information explanation untenable. We further show that the link between director ownership and fund performance is driven by the underperformance of funds that would benefit
14 Emphasis added.
23

from increased monitoring incentives in the form of director ownership, but where those incentives are missing.
24

References Baysinger, B., Butler, H., 1985. Corporate governance and the board of directors: performance effects of changes in board composition. Journal of Law, Economics and Organization 1, 101-124. Berk, J., Green, R., 2004. Mutual fund flows and performance in rational markets. Journal of Political Economy 112, 1269-1295. Berk, J., Xu, J., 2004. Persistence and Fund Flows of the Worst Performing Mutual Funds. University of California Working Paper. Blake, C., Elton, E., Gruber, M., 1993. The performance of bond mutual funds. Journal of Business 66, 370-403. Bobroff, G., Mack, T., 2004. Assessing the significance of mutual fund board independent chairs. Unpublished paper. Brickley, J., Coles, J., Terry, R., 1994. Outside directors and the adoption of poison pills. Journal of Financial Economics 35, 371-390. Byrd, J., Hickman, K., 1992. Do outside directors monitor managers? Evidence from tender offer bids. Journal of Financial Economics 32, 195-222. Carhart, M., 1997. On persistence in mutual fund performance. Journal of Finance 52, 57-82. Capon, N., Fitzsimons, G., Prince, R., 1996. An individual level analysis of the mutual fund investment decision. Journal of Financial Services Research 10, 59-68. Carter, D., 2001. Mutual fund boards and shareholder action. Villanova Journal of Law and Investment Management 3, 6-39. Chen, J., Hong, H., Huang, M., Kubik, J., 2004. Does fund size erode mutual fund performance? The role of liquidity and organization. American Economic Review 94, 1276–1302. Chen, Q., Goldstein, I., Jiang, W., 2005. Director Ownership in the U.S. Mutual Fund Industry. University of Pennsylvania Working Paper.
25

Cotter, J., Shivdasani, A., Zenner, M., 1997. Do independent directors enhance target shareholders’ wealth during tender offers? Journal of Financial Economics 43, 195-218. Damato, K., Burns, J., 2004. Mutual funds quarterly review: Cleaning up the fund industry. The Wall Street Journal (April 5, 2004). Del Guercio, D., Dann, L., Partch, M., 2003. Governance and boards of directors in closed-end investment companies. Journal of Financial Economics 69, 111-152. Deli, D., 2002. Mutual fund advisory contracts: an empirical investigation. Journal of Finance 57, 109-133. Demsetz, H., 1983. The structure of ownership and the theory of the firm. Journal of Law and Economics, 375-393. Elton, E., Gruber, M., Blake, C., 2001. A first look at the accuracy of the CRSP mutual fund database and a comparison of the CRSP and Morningstar mutual fund databases, Journal of Finance 56, 2415–2430. Elton, E., Gruber, M., Das, S., Hlavka, M., 1993. Efficiency with costly information: a reinterpretation of evidence from managed portfolios. Review of Financial Studies 6, 1-22. Elton, E., Gruber, M., Green, C., 2006. The Impact of Mutual Fund Family Membership on Investor Risk. Forthcoming in Journal of Financial and Quantitative Analysis. Evans, R., 2004. Does alpha really matter? Evidence from mutual fund incubation, termination and manager change. Unpublished working paper. Boston College. Fama, E., K. French, 1993. Common risk factors in the returns on bonds and stocks. Journal of Financial Economics 33, 3-53. Gaspar, J.M., Massa, M., Matos, P., 2006. Favoritism in mutual fund families? Evidence on strategic cross-fund subsidization. Journal of Finance 61, 73-104. Guedj, I., Papastaikoudi, J., 2004. Can mutual fund families affect the performance of their funds? MIT Sloan School of Management Working Paper. Hermalin, B., Weisbach, M., 1991. The effects of board composition and direct incentives on firm performance. Financial Management 20, 101-112.
26

Jegadeesh, N., Titman, S., 1993. Returns to buying winners and selling losers: Implications for stock-market efficiency. Journal of Finance 48, 65-91. Jensen, M., 1968. The performance of mutual funds in the period 1945-1964. Journal of Finance 23, 389-416. Jensen, M., Meckling, W., 1976. Theory of the Firm: Managerial Behavior, Agency Costs and Ownership Structure. Journal of Financial Economics 3, 305–360. Klein, A., 1998. Firm performance and board committee structure. Journal of Law and Economics 41, 137-165. Khorana, A. and Servaes, H., 1999. The Determinants of Mutual Fund Starts. Review of Financial Studies 12, 1043-1074. Khorana, A., Tufano, P., Wedge, L., 2005. Board structure, mergers and shareholder wealth: A Study of the Mutual Fund Industry. Harvard Business School Working Paper. Kuhnen, C., 2004. Dynamic contracting in the mutual fund industry. Stanford Graduate School of Business, working paper. Mahoney, P., 2004. Manager-investor conflicts in mutual funds. Journal of Economic Perspectives, forthcoming. Massa, M. 2003. How do family strategies affect fund performance? When performancemaximization is not the only game in town. Journal of Financial Economics 67(2), 249-304. Malkiel, B., 1995. Returns from investing in equity mutual funds 1971 to 1991. Journal of Finance 53, 549-572. Meschke, F., 2005. An Empirical Examination of Mutual Fund Boards. Arizona State University Working Paper. McConnell, J., Servaes, H., 1990. Additional evidence on equity ownership and corporate value. Journal of Financial Economics 27, 595-612. Morck, R., Shleifer, A., Vishny, R., 1988. Management ownership and market valuation: An empirical analysis. Journal of Financial Economics 20, 293-315.
27

Nanda, V., Wang, J. and Zheng. L., 2003. Family Values and the Star Phenomenon. University of Michigan Working Paper. Phillips, R., 2003. Mutual fund independent directors: A model for corporate America? Investment Company Institute Perspective 9, 1-12. Securities and Exchange Commission, 2001. Final Rule: Role of Independent Directors of Investment Companies. Investment Company Act Release No. 24816 (January 2, 2001) [66 FR 3734 (January 16, 2001)]. Tufano, P., Sevick, M., 1997. Board structure and fee-setting in the U.S. mutual fund industry. Journal of Financial Economics 46, 321-355. Weisbach, M., 1988. Outside directors and CEO turnover. Journal of Financial Economics 20, 431-460. Wermers, R., 2000. Mutual fund performance: An empirical decomposition into stock-picking talent, style, transactions costs, and expenses. Journal of Finance 55, 1655-1695. Yermack, D., 1996. Higher market valuation of companies with a small board of directors. Journal of Financial Economics 40, 185-211. Zitzewitz, E., 2003. Who cares about shareholders? Arbitrage-proofing mutual funds. Journal of Law, Economics and Organization 19, 245-280.
28
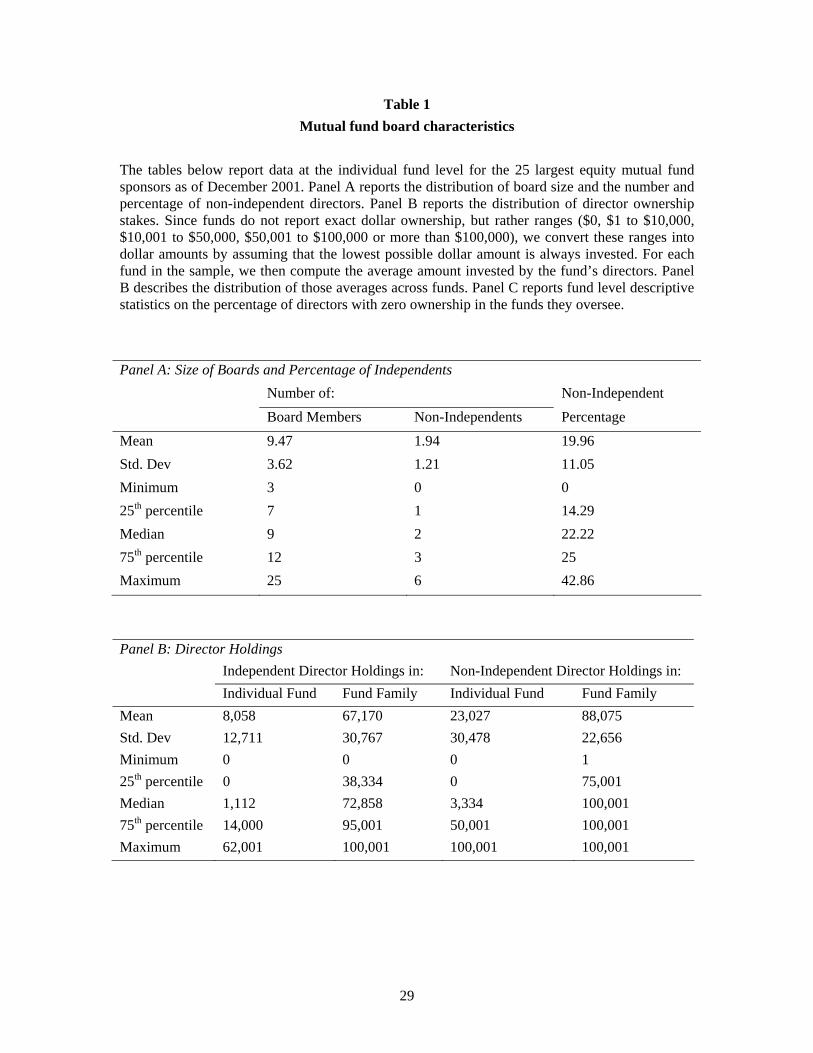
Table 1 Mutual fund board characteristics
The tables below report data at the individual fund level for the 25 largest equity mutual fund sponsors as of December 2001. Panel A reports the distribution of board size and the number and percentage of non-independent directors. Panel B reports the distribution of director ownership stakes. Since funds do not report exact dollar ownership, but rather ranges ($0, $1 to $10,000, $10,001 to $50,000, $50,001 to $100,000 or more than $100,000), we convert these ranges into dollar amounts by assuming that the lowest possible dollar amount is always invested. For each fund in the sample, we then compute the average amount invested by the fund’s directors. Panel B describes the distribution of those averages across funds. Panel C reports fund level descriptive statistics on the percentage of directors with zero ownership in the funds they oversee. Panel A: Size of Boards and Percentage of Independents Number of: Non-Independent Board Members Non-Independents Percentage Mean 9.47 1.94 19.96 Std. Dev 3.62 1.21 11.05 Minimum 3 0 0 25th percentile 7 1 14.29 Median 9 2 22.22 75th percentile 12 3 25 Maximum 25 6 42.86 Panel B: Director Holdings Independent Director Holdings in: Non-Independent Director Holdings in: Individual Fund Fund Family Individual Fund Fund Family Mean 8,058 67,170 23,027 88,075 Std. Dev 12,711 30,767 30,478 22,656 Minimum 0 0 0 1 25th percentile 0 38,334 0 75,001 Median 1,112 72,858 3,334 100,001 75th percentile 14,000 95,001 50,001 100,001 Maximum 62,001 100,001 100,001 100,001
29

Table 1, continued Panel C: Directors with Zero Holdings Per Individual Fund: Percent of
Directors Holding Nothing Per Fund Family: Percent of Directors Holding Nothing
Independent Non-Independent Independent Non-Independent Mean 68.36 59.04 20.76 6.28 Std. Dev 32.93 36.51 27.29 17.53 Minimum 0 0 0 0 25th percentile 50 33.33 0 0 Median 78.57 50 10 0 75th percentile 100 100 33.33 0 Maximum 100 100 100 66.67
30

Table 2 Portfolios formed on governance variables: One-way sorts
Annualized mean return (in %), abnormal return (in %), its t-statistic and bootstrap empirical p-value for portfolios formed on three measures of director incentives (panels A through C), and the proportion of independent directors on the board (panel D). For each governance variable, we sort funds into portfolios based on the quartiles of the variable and report the performance of the four portfolios and a long/short portfolio. The indices (1), (2), (3), and (4) refer to the sorted portfolios, with higher values of the indices designating portfolios of funds with higher values of the indicated governance variable, e.g., ‘(1)’ designates the portfolio of funds in the first quartile of the variable (with low values of the variable). The long/short portfolio is long ‘(4)’ and short ‘(1)’.
Panel A: Portfolios formed on the basis of average ownership in fund family shares by independent directors
Mean Return Alpha t-stat p-value (1) 0.35 -2.54 -2.95 0.02 (2) 1.63 -1.21 -1.50 0.38 (3) 0.17 -2.07 -2.22 0.13 (4) 1.76 -0.24 -0.47 0.76 Lg/Short 1.41 2.30 2.88 0.01
Panel B: Portfolios formed on the basis of average ownership in individual fund shares by non-independent directors
Mean Return Alpha t-stat p-value (1) 0.21 -2.48 -2.63 0.07 (2) 3.38 0.23 0.14 0.93 (3) 3.09 0.24 0.20 0.90 (4) 1.11 -0.37 -0.51 0.76 Lg/Short 0.90 2.11 2.44 0.03
Panel C: Portfolios formed on the basis of average ownership in individual fund shares by independent directors
Mean Return Alpha t-stat p-value (1) 0.14 -2.01 -3.01 0.02 (2) 0.61 -1.17 -1.31 0.45 (3) 2.91 -0.21 -0.19 0.90 (4) 1.32 -0.60 -1.17 0.50 Lg/Short 1.18 1.42 2.27 0.05
Panel D: Portfolios formed on the basis of proportion of independent directors on the board
Mean Return Alpha t-stat p-value (1) 0.97 -1.01 -2.35 0.10 (2) 0.33 -2.13 -2.90 0.03 (3) 1.46 -0.36 -0.57 0.73 (4) 3.20 -0.16 -0.11 0.94 Lg/Short 2.24 0.85 0.63 0.68
31

Table 3
Performance of Directors’ Investments
We form two portfolios for each director who owns shares in at least some, but not all, of the funds he or she oversees. The first portfolio is an equally-weighted investment in the funds in which the director has invested, and the second is an equally weighted investment in the funds in which the director has not invested. For each director, we then compare the average returns and the alphas of these two portfolios (ownership portfolio minus no-ownership portfolio). Column 1 reports the average difference across all directors in the performance measures (raw returns and alphas), column 2 reports the standard deviations, and column 3 the t-statistics.
Performance Variables
Mean Std. Dev. t-stat
Raw returns -0.71 8.61
-0.88
Alphas -0.52
2.37
-2.31
Table 4 Performance Chasing
OLS regressions of log director ownership as of December 31, 2001 on the annualized abnormal return of the fund in the five years 1997 - 2001.
Independent Variables
Log Independent director
fund ownership
Log Non-independent
director fund ownership
Intercept 4.55 (8.48)
3.96 (3.77)
Past abnormal return 0.07 (0.81)
0.27 (1.46)
R2 0.005 0.030
32

Table 5 Portfolios formed on turnover and ownership: Two-way sorts
This table analyzes how turnover interacts with different measures of the ownership stakes of directors (ownership in individual fund shares by independent (non-independent) directors in Panel A (B)). Turnover is measured over the 5-year period 1997-2001. We sort funds into 2 × 4 = 8 different portfolios, first sorting funds into two groups based on turnover, and then into four groups based on ownership. These double sorts are independent sorts. For each double sort we report the annualized return (in %), abnormal return (in %), its t-statistic and bootstrap empirical p-value for the 8 portfolios as well as two long/short portfolios. The indices (1), (2), (3), (4), and (1), (2) refer to the sorted portfolios, with higher values of the indices designating portfolios of funds with higher values of the indicated variable. The long/short portfolios are denoted ‘(4) - (1)’. Panel A: Performance of portfolios formed on turnover and average ownership in individual fund shares by independent directors
Ownership in individual fund shares Turnover (1) (2) (3) (4) (4) – (1)
(1) 0.19 -0.91 2.62 0.99 0.80 Mean Return (2) -0.04 1.97 4.07 2.04 2.08
(1) -1.53 -1.85 -0.21 -0.52 1.01 Alpha
(2) -3.35 -0.43 -0.67 -0.77 2.59 (1) -2.36 -1.76 -0.19 -1.10 1.35 t-stat (2) -2.95 -0.30 -0.56 -0.70 1.93 (1) 0.10 0.24 0.91 0.50 0.29 p-value (2) 0.04 0.85 0.73 0.67 0.10
Panel B: Performance of portfolios formed on turnover and average ownership in individual fund shares by non-independent directors Ownership in individual fund shares Turnover (1) (2) (3) (4) (4) – (1)
(1) -0.41 4.22 3.12 -0.44 -0.04 Mean Return (2) 1.02 2.55 2.87 3.36 2.34
(1) -1.83 0.68 0.46 -1.07 0.75 Alpha
(2) -3.40 -0.15 -0.51 0.58 3.99 (1) -1.92 0.26 0.38 -1.57 0.90 t-stat (2) -2.24 -0.13 -0.27 0.44 2.52 (1) 0.19 0.86 0.81 0.29 0.53 p-value (2) 0.13 0.93 0.86 0.77 0.05
33

Table 6 Portfolios formed on idiosyncratic volatility and ownership: Two-way sorts
This table analyzes how idiosyncratic volatility interacts with different measures of the ownership stakes of directors (ownership in individual fund shares by independent (non-independent) directors in Panel A (B)). Idiosyncratic volatility (defined as the standard deviation of the residuals from the four factor model) is measured over the 5-year period 1997-2001. We sort funds into 2 × 4 = 8 different portfolios, first sorting funds into two groups based on idiosyncratic volatility, and then into four groups based on ownership. These double sorts are independent sorts. For each double sort we report the annualized return (in %), abnormal return (in %), its t-statistic and bootstrap empirical p-value for the 8 portfolios as well as two long/short portfolios. The indices (1), (2), (3), (4), and (1), (2) refer to the sorted portfolios, with higher values of the indices designating portfolios of funds with higher values of the indicated variable. The long/short portfolios are denoted ‘(4) - (1)’. Panel A: Performance of portfolios formed on idiosyncratic volatility and average ownership in individual fund shares by independent directors
Ownership in individual fund shares Idios. Volat. (1) (2) (3) (4) (4) – (1)
(1) 0.98 0.35 2.05 0.74 -0.24 Mean Return (2) -0.39 3.03 4.00 2.52 2.90
(1) -1.71 -1.42 -0.35 -0.58 1.14 Alpha
(2) -2.21 1.56 -0.22 -0.57 1.64 (1) -1.91 -1.71 -0.50 -1.14 1.47 t-stat (2) -2.03 0.41 -0.11 -0.54 1.43 (1) 0.20 0.26 0.77 0.49 0.26 p-value (2) 0.17 0.81 0.95 0.75 0.28
Panel B: Performance of portfolios formed on idiosyncratic volatility and average ownership in individual fund shares by non-independent directors
Ownership in individual fund shares Idios. Volat. (1) (2) (3) (4) (4) – (1)
(1) 0.20 -0.36 3.82 -0.91 -1.11 Mean Return (2) 0.05 4.38 1.49 4.45 4.40
(1) -2.12 -2.34 1.24 -1.18 0.94 Alpha
(2) -4.32 0.92 -2.02 0.90 5.22 (1) -2.38 -1.97 0.94 -1.41 0.91 t-stat (2) -2.13 0.50 -1.31 0.60 2.68 (1) 0.12 0.19 0.57 0.35 0.51 p-value (2) 0.16 0.75 0.40 0.71 0.04
34

Table 7 Portfolios formed on fund size and fund ownership: Two-way sorts
This table analyzes how fund size interacts with different measures of the ownership stakes of directors (ownership in individual fund shares by independent directors in Panel A and by non-independent directors in Panel B). Fund size is measured as fund total net asset value as of December 31 2001. We sort funds into 2 × 4 = 8 different portfolios, first sorting funds into two groups based on fund size, and then into four groups based on ownership. These double sorts are independent sorts. For each double sort we report the annualized return (in %), abnormal return (in %), its t-statistic and bootstrap empirical p-value for the 8 portfolios as well as two long/short portfolios. The indices (1), (2), (3), (4), and (1), (2) refer to the sorted portfolios, with higher values of the indices designating portfolios of funds with higher values of the indicated variable. The long/short portfolios are denoted ‘(4) - (1)’. Panel A: Performance of portfolios formed on fund size and average ownership in individual fund shares by independent directors
Ownership in individual fund shares Fund size (1) (2) (3) (4) (4) – (1)
(1) 0.99 -0.06 0.86 3.02 2.03 Mean Return (2) 0.06 0.76 2.99 1.30 1.24
(1) -1.54 -2.11 -2.65 -3.39 -1.85 Alpha
(2) -2.05 -0.92 -0.11 -0.56 1.49 (1) -1.97 -2.42 -2.41 -2.06 -1.32 t-stat (2) -2.99 -0.94 -0.09 -1.09 2.26 (1) 0.18 0.09 0.09 0.16 0.32 p-value (2) 0.04 0.58 0.96 0.52 0.06
Panel B: Performance of portfolios formed on fund size and average ownership in individual fund shares by non-independent directors Ownership in individual fund shares Fund size (1) (2) (3) (4) (4) – (1)
(1) 2.28 -1.96 1.76 2.09 -0.19 Mean Return (2) -0.02 3.59 3.15 1.09 1.12
(1) -1.87 -3.38 -2.12 -0.56 1.31 Alpha
(2) -2.54 0.37 0.35 -0.36 2.17 (1) -1.31 -2.63 -1.63 -0.39 0.66 t-stat (2) -2.71 0.22 0.29 -0.49 2.51 (1) 0.40 0.08 0.27 0.80 0.66 p-value (2) 0.07 0.89 0.85 0.75 0.05
35

Table 8 Portfolios formed on board independence and fund ownership: Two-way sorts
This table analyzes how board independence interacts with director ownership. We sort funds into 2 × 4 = 8 different portfolios, first sorting funds into two groups based on the percentage of board members who are not independent, and then into four groups based on the combined ownership of both independent and non-independent directors. These double sorts are independent sorts. For each double sort we report the annualized return (in %), abnormal return (in %), its t-statistic and bootstrap empirical p-value for the 8 portfolios as well as two long/short portfolios. The indices (1), (2), (3), (4), and (1), (2) refer to the sorted portfolios, with higher values of the indices designating portfolios of funds with higher values of the indicated variable. The long/short portfolios are denoted ‘(4) - (1)’.
Performance of portfolios formed on percentage of non-independent directors (two groups) and average ownership in individual fund shares by all directors (four groups)
Ownership in individual fund shares % non-indep. (1) (2) (3) (4) (4) – (1)
(1) 0.17 -0.36 2.15 0.99 0.82 Mean Return (2) -1.53 3.91 3.23 1.26 2.79
(1) -1.45 -2.23 -0.90 -1.13 0.32 Alpha
(2) -3.25 0.45 0.30 -0.43 2.81 (1) -1.19 -2.45 -0.86 -2.32 0.30 t-stat (2) -2.59 0.21 0.26 -0.66 2.44 (1) 0.46 0.10 0.61 0.11 0.84 p-value (2) 0.08 0.89 0.87 0.69 0.04
36

Table 9 Governance Variables and the Importance of Monitoring
OLS regressions log ownership and log compensation on fund and family characteristics. The first two columns regress log director ownership in fund shares as of December 31, 2001 on fund characteristics that proxy for the difficulty or the importance of monitoring, namely log fund size, idiosyncratic volatility, and turnover (both computed over 1997-2001). Control variables are log family size, number of funds in family, expense ratio, and past abnormal return. Column 3 regresses log non-independent director family level compensation on log family assets, and the same control variables.
Independent Variables
Log Independent director fund
ownership
Log Non-independent
director fund ownership
Log Compensa-
tion
Intercept -3.62 (-1.05)
5.46 (0.80)
8.23 (15.76)
Log of fund assets 1.26 (4.84)
0.83 (2.16)
0.04 (0.93)
Past return volatility 3.53 (2.22)
2.82 (1.16)
0.01 (0.04)
Turnover -0.30 (-0.40)
-0.63 (-0.57)
-0.08 (-0.69)
Log of family assets -0.14 (-0.33)
-0.30 (-0.32)
0.24 (3.65)
Number of funds in family
-0.09 (-0.95)
0.05 (0.19)
0.04 (2.79)
Expense ratio 0.22 (0.22)
-4.44 (-2.34)
0.43 (2.72)
Past abnormal return -0.06 (-0.74)
0.07 (0.38)
-0.02 (-1.26)
R2 0.242 0.237 0.360
37

Table 10 Expense ratio regressions
Analysis of expense ratios charged by the top 25 equity mutual fund sponsors as a function of fund and sponsor characteristics, as well as the incentive structure of the board of directors. The table reports results of OLS regressions. The dependent variable is the expense ratio, measured as the average annual expense ratio of a fund over the period January 2002 to June 2004. Sponsor- and fund- assets under management are both taken as of December 2001. Board size, proportion of independent directors, director ownership, and the number of funds in the fund family are as of December 2001. The average turnover is computed over the 5-year period 1997-2001.
Independent Variables (1) (2) (3) (4) (5) Intercept 2.53
(10.82) 2.50
(10.68) 2.67
(7.06) 2.43
(9.57) 2.61
(6.13) Log of individual fund assets -0.00
(-0.10) -0.01
(-0.33) 0.04
(2.00) -0.00
(-0.11) 0.04
(2.03) Log of fund family assets -0.16
(-4.28) -0.16
(-4.25) -0.24
(-5.11) -0.17
(-4.40) -0.28
(-6.14) Number of funds in family -0.02
(-2.12) -0.02
(-1.96) 0.00
(0.24) -0.02
(-1.99) 0.01
(0.94) Average turnover 0.23
(3.79) 0.23
(3.73) 0.13
(1.96) 0.24
(3.92) 0.22
(3.66) Board size 0.03
(3.48) 0.03
(3.43) 0.05
(3.60) 0.03
(3.04) 0.05
(3.68) Proportion of independent directors -0.54
(-1.63) -0.46
(-1.42) 0.27
(0.41) -0.50
(-1.48) 0.66
(0.96) Log of independent director fund ownership
0.00 (0.61)
0.01 (1.43)
Log of non-independent director fund ownership
-0.02 (-2.60)
-0.02 (-3.01)
Log of independent director family ownership
0.02 (0.97)
0.01 (0.49)
R2 0.334 0.338 0.563 0.369 0.595
38

Table 11 Board characteristics and before-fee returns
Annualized mean before-fee return (in %), abnormal before-fee return (in %), its t-statistic and bootstrap empirical p-value for portfolios formed on three measures of director ownership (panels A through C). For each ownership measure, we sort funds into portfolios based on the quartiles of the measure and report the performance of the four portfolios and a long/short portfolio. The indices (1), (2), (3), and (4) refer to the sorted portfolios, with higher values of the indices designating portfolios of funds with higher director ownership, e.g., ‘(1)’ designates the portfolio of funds in the first quartile of ownership (with low ownership). The long/short portfolio is long ‘(4)’ and short ‘(1)’.
Panel A: Portfolios formed on the basis of average ownership in fund family shares by independent directors
Returns Before Fees Fees Mean Return Alpha t-stat p-value
(1) 1.50 -1.38 -1.60 0.03 1.14 (2) 2.80 -0.04 -0.05 0.96 1.18 (3) 1.42 -0.81 -0.87 0.36 1.23 (4) 2.43 0.41 0.80 0.40 0.69
Long/Short 0.93 1.78 2.22 0.03 -0.45
Panel B: Portfolios formed on the basis of average ownership in individual fund shares by non-independent directors
Returns Before Fees Fees Mean Return Alpha t-stat p-value
(1) 1.42 -1.27 -1.35 0.14 1.22 (2) 4.17 0.86 0.52 0.60 0.78 (3) 3.89 1.04 0.89 0.36 0.80 (4) 1.93 0.45 0.63 0.53 0.85
Long/Short 0.52 1.73 2.00 0.06 -0.37
Panel C: Portfolios formed on the basis of average ownership in individual fund shares by independent directors
Returns Before Fees Fees Mean Return Alpha t-stat p-value
(1) 1.00 -1.13 -1.70 0.02 0.86 (2) 1.63 -0.07 -0.07 0.94 1.03 (3) 3.83 0.58 0.53 0.60 0.93 (4) 2.05 0.13 0.26 0.80 0.76
Long/Short 1.05 1.26 2.03 0.04 -0.10
39