does size matter only?
TRANSCRIPT

DISCLOSURE APPENDIX CONTAINS IMPORTANT DISCLOSURES, ANALYST CERTIFICATIONS, INFORMATION ON TRADE ALERTS, ANALYST MODEL PORTFOLIOS AND THE STATUS OF NON-U.S ANALYSTS. U.S. Disclosure: Credit Suisse does and seeks to do business with companies covered in its research reports. As a result, investors should be aware that the Firm may have a conflict of interest that could affect the objectivity of this report. Investors should consider this report as only a single factor in making their investment decision.
18 October 2011Americas/United States
Equity ResearchSoftware (Software/Software & Services) / OVERWEIGHT/OVERWEIGHT
Does Size Matter Only? THEME
Big Data’s Complexity (Not Just Volume) + Fast Data = Dynamic Data Vive la Data Révolution! As the amount of data generated by businesses continues to grow at exponential rates, organizations are struggling with how to manage these vast and diverse datasets that include not only traditional structured but also faster-growing unstructured data types. These large, untapped datasets define a category of information, known as “Big Data.”
The growing need for large-volume, multi-structured “Big Data” analytics, as well as the emergence of in-memory data architectures that characterize “Fast Data” (as detailed in our report titled The Need for Speed), have positioned the industry at the cusp of the most radical revolution in database architectures in 20 years, and we believe that the economics of data (not just the economics of applications) will increasingly drive competitive advantage—resulting in high, sustained growth in the data warehouse and analytics markets.
Google’s “Big Data” Gift. Although multi-structured data offers tremendous potential for deep analytics, organizations struggle to provide timely insights, as existing business intelligence tools and relational databases (RDBMS) are simply not engineered to handle these types of high-volume, diverse datasets.
Google pioneered a software framework called MapReduce for processing petabyte-scale volumes of multi-structured data. Since Google published a white paper on MapReduce in 2004, several software vendors have incorporated proprietary implementations of MapReduce as the foundation of their “Big Data” solutions (e.g., Aster Data), while Hadoop, an Apache open source project, has become the most popular implementation of MapReduce, with several vendors offering distributions (e.g., Cloudera, Greenplum, and IBM).
Threat or Opportunity? Although many on Wall Street are concerned that Hadoop-based architectures could replace the traditional RDBMS in certain data warehousing scenarios, we view MapReduce and Hadoop as opening up new data analytics scenarios that were previously not achievable or economically practical. As such, we expect existing vendors to supplement data warehouses to support MapReduce to optimize for larger and more diverse datasets, while new in-memory architectures are leveraged to enable rapid cross-correlation between different types of data (e.g., in-memory MapReduce).
We believe existing RDBMS vendors can leverage MapReduce and/or Hadoop via two primary models: (1) in-database MapReduce and (2) Hadoop as an ETL processing engine. For example, similar to classic ETL, Hadoop can transform unstructured or semi-structured data into a relational data form that can then be more easily loaded into a traditional database. This triaged data can then be easily correlated with existing structured data in that RDBMS, while leveraging the enterprise-class features for security, auditing, availability, etc., that traditional databases have refined over decades of development. We ultimately view Oracle, IBM, and Teradata as the publicly traded vendors best positioned to monetize the forecasted growth in “Big Data” analytics.
Research Analysts Philip Winslow, CFA
212 325 6157 [email protected]
Dennis Simson, CFA 212 325 0930
Sitikantha Panigrahi 415 249 7932
Daniel Morrison 212 325 9827

18 October 2011
Does Size Matter Only? 2
Table of Contents The Download… 3 Executive Summary 4 What Are Big Data Technologies? 14
What Is MapReduce? 14 What Is Hadoop? 16
Hadoop Platform and Ecosystem 17 From Data Warehousing to Big Data 23
The Evolution of Business Intelligence, Business Analytics, and Data Warehousing 23 How Does a Traditional Data Warehouse Work? 27 What Are the Drawbacks of Traditional Data Warehouses for Big Data That MapReduce/Hadoop Can Overcome? 31 What Applications Can MapReduce/Hadoop Enable/Improve? 37
What Are MapReduce/Hadoop’s Roles in the Enterprise? 38 The Next Evolutions of Business Intelligence, Business Analytics, and Data Warehousing 38 Is Hadoop the End of the RDBMS as We Know It? No! It’s Actually More Additive/Complementary 42 How MapReduce/Hadoop Can Be Deployed in the Enterprise? 47
MapReduce in an MPP Data Warehouse 48 MapReduce/Hadoop as an ETL Engine 52 Direct Analytics over MapReduce/Hadoop 53
Which Vendors Have What? 56 Amazon 56 Cloudera 57 EMC 61
Greenplum 61 Hewlett-Packard 65
Vertica 65 Hortonworks 68 IBM 70
IBM InfoSphere BigInsights 71 IBM InfoSphere Streams 74
Informatica 76 Informatica 9.1 Platform 76 Informatica PowerExchange for Hadoop 79
MapR 80 Microsoft 83
Project Daytona 83 Oracle 84
Oracle Big Data Appliance 84 Oracle Exalytics Business Intelligence Machine 88 In-Database MapReduce with Oracle Table Functions 91 In-Memory MapReduce with Parallel Execution (PX) 92 In-Database MapReduce with External Tables 93 Hadoop Processing from Oracle Table Functions and Advanced Queuing 94 Oracle Grid Engine 97
Pentaho 97 Quest Software 99
Toad for Cloud 99 Quest Data Connector for Hadoop 101
Teradata 101 Aster Data nCluster 101
Sources & References 108

18 October 2011
Does Size Matter Only? 3
The Download… What’s the Call? ■ Even with the continued innovation delivered by the database industry,
organizations are struggling with an ever-increasing amount and variety of data that they must handle, sift, and either retain and/or dispose of every day.1
■ Although existing business intelligence tools and data warehouses have a long history of giving businesses the information/analytics they need to optimize their operations and make critical decisions, these solutions have not been engineered to handle the type of high-volume, variable, and dynamic data associated with Big Data.2
What’s Consensus Missing? ■ Many on Wall Street worry that Hadoop could replace a traditional RDBMS in certain data warehousing scenarios and will likely be more competitive in the medium to long term as the open source projects advance and evolve and as the ecosystems around Hadoop grow,3
both of which we view as fair concerns.
■ However, we expect existing vendors to supplement data warehouses to support MapReduce and/or Hadoop to optimize for larger and morediverse datasets, while new data architectures will enhance in-memory analytics for complex models (i.e., rapid cross-correlation between different types of unstructured and structured data), thereby expanding the addressable market of these vendors by a larger degree than MapReduce/Hadoop will cannibalize existing revenue.4
What’s the Stock Thesis? ■ Although multiple vendors are positioning their technologies as solutions for Big Data (e.g., Quest Software, Informatica, EMC, Hewlett-Packard), we view Outperform-rated Oracle, Neutral-rated IBM, and Teradata, which is not currently covered by Credit Suisse, as the publicly traded vendors with the technology roadmaps and product portfolios best-positioned to monetize the forecasted growth in Big Data analytics.
What’s the Impact to the Model? ■ The most recent annual survey on data warehousing by the Independent Oracle Users Group (IOUG) found that approximately 48% of enterprises expect a significant or moderate increase in the unstructured data analysis over the next five years. (See Exhibit 3.)
■ As such, we expect increased usage of the MapReduce frameworkand/or Hadoop for triaging unstructured data within enterprises to drive an increased amount of data stored in and processed by data warehouses (e.g., Oracle, IBM, Teradata), which, in turn, drives demand for more storage and server compute capacity, generatingincreased hardware systems sales, as well as database software license revenue.
What’s the Next Catalyst/Data Point? ■ Hadoop World runs November 8-9 in New York, NY.
18 October 2011
Does Size Matter Only? 4
Executive Summary The database market has finally gotten interesting again.
— James Markarian, CTO of Informatica
Innovation in the database software industry remains extremely vibrant. In just the past few years, new scalability and storage capabilities have revolutionized the performance that database systems can deliver. These include the use of very large, multi-terabyte flash memories; compression that can dramatically increase the amount of data cached in memory and the speed of disk scans for large queries; and the movement of select database logic into storage, to speed functions such as row selection, compression, encryption, and more.5
Even with the continued innovation delivered by the database industry, organizations are struggling with an ever-increasing amount and variety of data that they must handle, sift, and either retain and/or dispose of every day.1 In fact, IDC estimates that the amount of information created and replicated will surpass 1.8 zettabytes, which equals 1.8 trillion gigabytes, in 2011, growing by a factor of 9 in just five years.
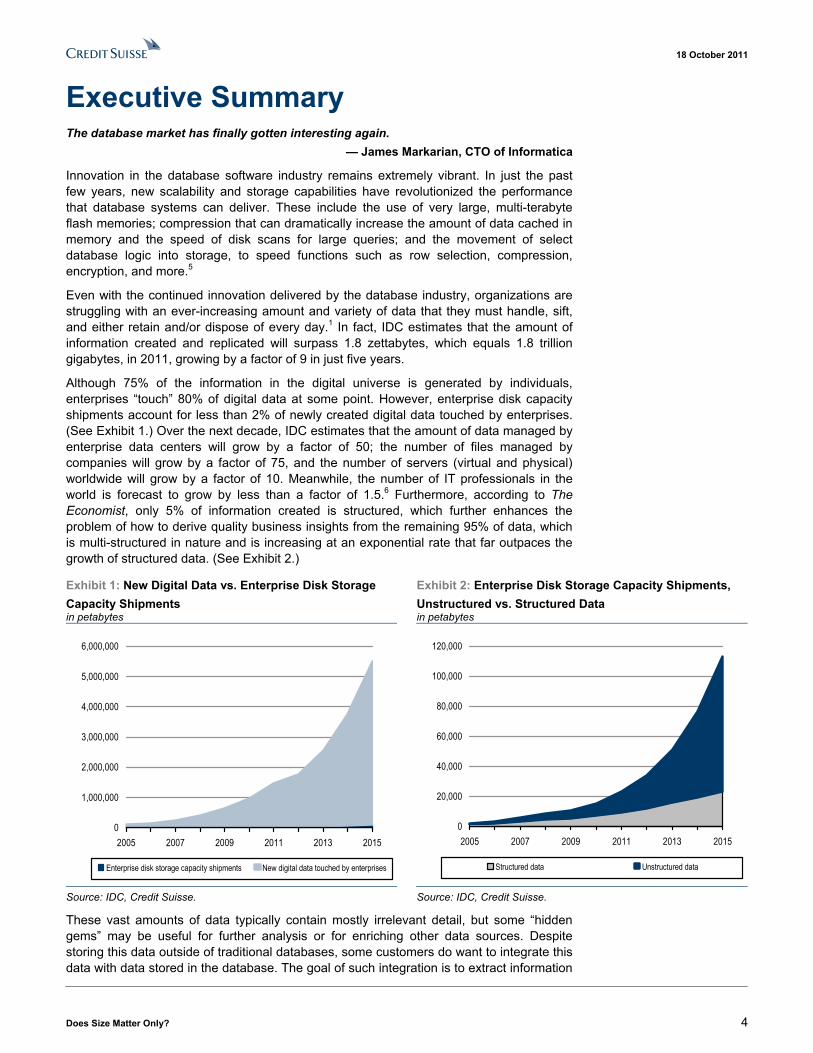
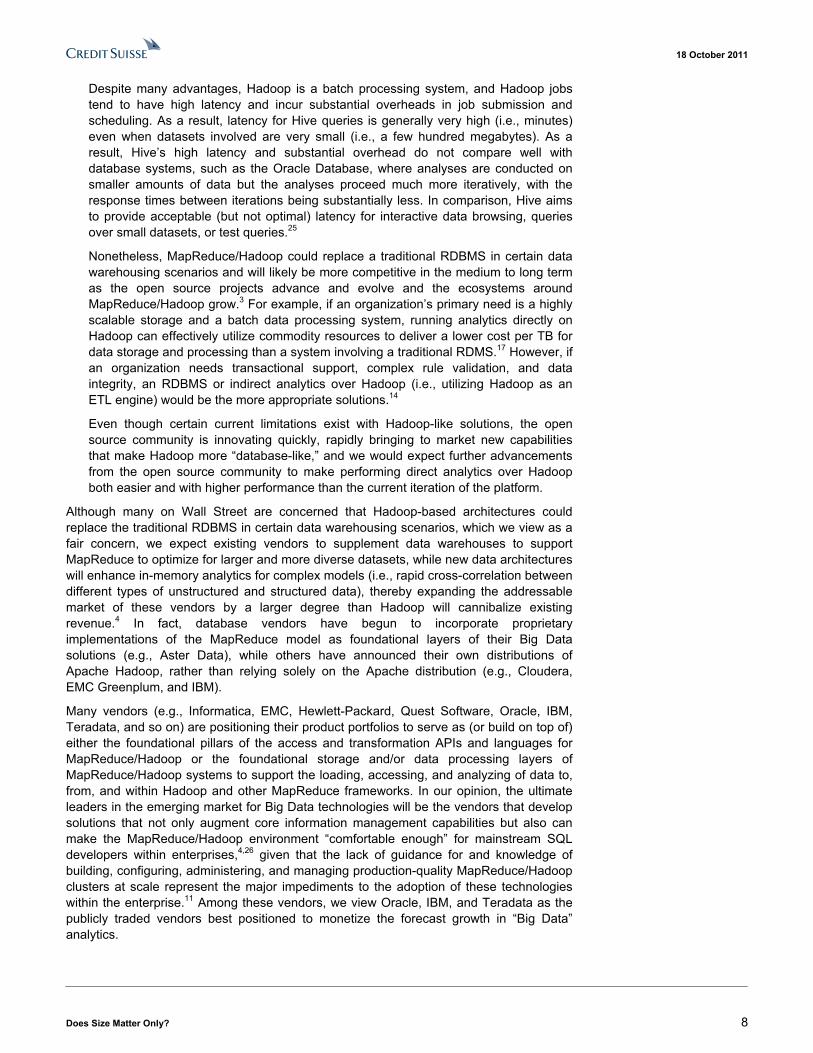
Although 75% of the information in the digital universe is generated by individuals, enterprises “touch” 80% of digital data at some point. However, enterprise disk capacity shipments account for less than 2% of newly created digital data touched by enterprises. (See Exhibit 1.) Over the next decade, IDC estimates that the amount of data managed by enterprise data centers will grow by a factor of 50; the number of files managed by companies will grow by a factor of 75, and the number of servers (virtual and physical) worldwide will grow by a factor of 10. Meanwhile, the number of IT professionals in the world is forecast to grow by less than a factor of 1.5.6 Furthermore, according to The Economist, only 5% of information created is structured, which further enhances the problem of how to derive quality business insights from the remaining 95% of data, which is multi-structured in nature and is increasing at an exponential rate that far outpaces the growth of structured data. (See Exhibit 2.)
Exhibit 1: New Digital Data vs. Enterprise Disk Storage Capacity Shipments in petabytes
Exhibit 2: Enterprise Disk Storage Capacity Shipments, Unstructured vs. Structured Data in petabytes
0
1,000,000
2,000,000
3,000,000
4,000,000
5,000,000
6,000,000
2005 2007 2009 2011 2013 2015
Enterprise disk storage capacity shipments New digital data touched by enterprises
0
20,000
40,000
60,000
80,000
100,000
120,000
2005 2007 2009 2011 2013 2015
Structured data Unstructured data
Source: IDC, Credit Suisse. Source: IDC, Credit Suisse.
These vast amounts of data typically contain mostly irrelevant detail, but some “hidden gems” may be useful for further analysis or for enriching other data sources. Despite storing this data outside of traditional databases, some customers do want to integrate this data with data stored in the database. The goal of such integration is to extract information

18 October 2011
Does Size Matter Only? 5
that is of value to the business users.7 In fact, studies show that a sophisticated algorithm and little data is less accurate than a simple algorithm and large volume of data.8
In addition to sheer volume, the vast majority of data an organization generates today is either neglected or not utilized, as the data is often non-standard, time-series, and/or constantly changing. Nonetheless, this data can provide useful operational insights into user behavior, security risks, capacity consumption, peak usage times, fraudulent activity, customer experience, and so on.1 As such, organizations are struggling with how to manage these vast and diverse datasets that include traditional structured data as well as semi-structured or unstructured data types, including sensor data, Webpages, Web log files, click-streams, AVI files, search indexes, text messages, email, etc.9 For example, social networking alone could bring huge external unstructured datasets into the enterprise either as actual data or metadata, as well as links from blogs, communities, Facebook, YouTube, Twitter, LinkedIn, and others. Too much information is a storage issue, certainly, but too much and too many types of data are also massive analysis issues.4 These large, untapped datasets define a new category of information, which is increasingly known as “Big Data.”9
The term “Big Data” puts an inordinate focus on the issue of information volume to the exclusion of the many other dimensions of information management.4 Big Data is structured, semi-structured, unstructured, and raw data in many different formats, data, which to a large degree, is fundamentally different than the clean scalar numbers and text the database industry has been storing in data warehouses for decades.10 As such, the complexity/variety of data represents as sizeable a challenge for enterprises as its volume.
Nonetheless, analysis of Big Data can provide actionable insight into customers, customer buying patterns, and supply chains, leading to more timely situational awareness, lower costs, and increased agility (e.g., Amazon mining click-stream data to drive sales, Netflix mining customer preferences, and consumer package goods manufacturers analyzing point-of-sale data to gain insight into customer buying patterns to better manage pricing and supply chains). In other words, Big Data analysis must increasingly be viewed as a competitive advantage.11 In fact, the most recent annual survey on data warehousing by the Independent Oracle Users Group (IOUG) found that approximately 48% of enterprises expect a significant or moderate increase in the unstructured data analysis over the next five years. (See Exhibit 3.)
Exhibit 3: Expected Increase in Unstructured Data Analysis over the Next Five Years
Signif icant increase19%
Moderate increase29%
Minimal increase26%
Don't know/unsure26%
Source: IOUG, Credit Suisse.
Traditional business intelligence tools and data warehouses have a long history of giving businesses the information/analytics they need to optimize their operations and make critical decisions. They are designed with specific questions in mind and are defined by database schemas, business rules, industry standards, laws, and regulations. These
In addition to sheer volume, the vast majority of data an organization generates today is either neglected or not utilized, as the data is often non-standard, time-series, and/or constantly changing. Nonetheless, this data can provide useful operational insights into user behavior, security risks, capacity consumption, peak usage times, fraudulent activity, customer experience, and so on.1 As such, organizations are struggling with how to manage these vast and diverse datasets that include traditional structured data as well as semi-structured or unstructured data types.9

18 October 2011
Does Size Matter Only? 6
existing business intelligence tools and data warehouses, however, have not been engineered to handle the type of high-volume, variable, and dynamic data associated with Big Data.2 For example, although non-transactional data is sometimes stored in a data warehouse, approximately 95-99% of the data is usually transactional data. Furthermore, vertical scaling (i.e., scaling up) of a RDBMS, which involves running on the most powerful single server available, is both very expensive and limiting.5 Therefore, although Big Data offers tremendous potential for deep insights that drive faster, clearer, and more nuanced decision-making, companies need an approach that allows this information to be effectively understood and analyzed.9
As the data footprints of Internet-scale applications became prohibitive using traditional SQL database engines, the Internet community, in particular, has been driving innovation in new ways of processing information.3 Google, one of the first companies to face the challenge of analyzing petabyte-scale data, pioneered a software framework called MapReduce, which when combined with a highly disrupted file system in the form of the Google File System (GFS), can utilize commodity hardware to process petabyte-scale volumes of data that would be technically challenging and/or prohibitively expensive to store and analyze in a traditional relational data warehouse.12 Since Google published a white paper on MapReduce in 2004, MapReduce has been increasingly evolving into the de facto standard for Big Data computational frameworks—with Hadoop, an Apache open source project, becoming the most popular, well known implementation of MapReduce.12
Several enterprises, including Facebook and Korea Telecom, have implemented large data warehouse systems using MapReduce/Hadoop technologies rather than a RDBMS.13 Although MapReduce/Hadoop could replace a traditional RDBMS in certain circumstances (and will likely be more competitive in the medium to long term as open source projects advance and evolve and the ecosystems around MapReduce/Hadoop grow), we view MapReduce/Hadoop as opening up new data analytics scenarios that were previously not achievable or practical with existing technologies.3 Specifically, MapReduce/Hadoop and SQL databases (e.g., Oracle Database, IBM DB2, Microsoft SQL Server) solve different sets of problems,14 and as a result, many enterprises are looking for ways to deploy MapReduce/Hadoop technologies alongside their current IT systems, which would allow these companies to combine old data and new datasets in powerful new ways.15
For example, an enterprise could combine customer demographic data from a CRM system and purchase history across channels from an order management system found in traditional SQL-based data warehouses with click-stream data stored in a Hadoop-based system to obtain a more holistic understanding of customers in order to better determine how the customer will likely respond to an online promotional campaign. Furthermore, by bringing in social media conversations, companies can better identify how customers are influencing each other’s buying decisions.16
We therefore believe that the commercial RDBMS and MapReduce/Hadoop complement versus compete against each other more often than not in the enterprise IT environment.5 In fact, Pentaho estimates that 90% of new Hadoop use cases are for the transformation of semi-structured data in batch processes without real-time or near-real-time requirements, whereas RDBMSs offer time-critical analysis of structured data combined with enterprise-class, production-quality transactional support, complex rule validation, and data integrity. For example, if an enterprise needs transactional support, complex rule validation, and data integrity, then an RDBMS is the more appropriate solution.14 However, if that organization needs to process data in parallel, perform batch analysis, or perform computationally expensive transformations over large quantities of data, which would be prohibitively expensive to store on a traditional RAID storage array, then a MapReduce/Hadoop system may be more applicable.14

18 October 2011
Does Size Matter Only? 7
In terms of MapReduce/Hadoop’s ability to complement, replace, and/or perform new functions that would not be possible with a traditional RDBMS, we have created a classification of various systems into three primary categories:
■ MapReduce in an MPP Data Warehouse. If an enterprise needs indexes, relationships, transactional guarantees, and lower latency, a database is needed. If a database is needed, a massively parallel processing (MPP) data warehouse that supports MapReduce will allow for more expressive analysis than one that does not.17 Hadoop’s file system allows users to store very large unstructured datasets and perform MapReduce computations on that data over clusters built of commodity hardware.18 However, the MapReduce paradigm can work on top of any distributed data store.19
In recent years, a significant amount of research and commercial activity has focused on integrating MapReduce and relational database technology. There are two approaches to this problem: (1) starting with a parallel database system and adding MapReduce features (e.g., Aster Data, Greenplum, Oracle Database 11g’s Table Functions) or (2) starting with MapReduce and adding database system technology (e.g., HadoopDB and Hadapt).20
The extended RDBMS systems cannot, however, be the only solution for Big Data analytics. At some point, tacking on non-relational data structures and non-relational processing algorithms to the basic, coherent RDBMS architecture will become unwieldy and inefficient.10
■ MapReduce/Hadoop as an ETL Engine. For parallel RDBMSs, many products perform extract, transform, and load (ETL), including Informatica, Ascential Software (acquired by IBM), DataMirror (acquired by IBM), Embarcadero Technologies, Sunopsis (acquired by Oracle), Trillium (which is part of Harte-Hanks), Jaspersoft, Pentaho, Talend, etc., and many of these ETL vendors have implemented or announced bidirectional interfaces for moving data in and out of Hadoop.21 ETL systems add significant value by cleaning, conforming, and arranging the data into a series of dimensional schemas,10 and almost all major enterprises use ETL systems to load large quantities of data into data warehouses.13 Sometimes, however, data generates at a faster pace than the ability of the ETL tool to structure it.18
While ETL tools and bulk load applications work well with smaller datasets, few can approach the data volume and performance that Hadoop can, especially at a similar price/performance point.3 Similar to classic ETL, MapReduce and/or Hadoop are able to extract or capture large batches of data, transform unstructured or semi-structured data, and perform aggregations or logical data consolidation.22 For example, by using Hadoop as an ETL processing engine, an organization can take Twitter feeds, triage them with a MapReduce/Hadoop infrastructure, and create a relational data form that would work well when loaded into a relational database.8 Such a solution would provide the flexibility in terms of the structure of the data and allows for real-time analytics over data once loaded into the RDBMS.18
■ Direct Analytics over MapReduce/Hadoop. MapReduce/Hadoop can be a key enabler of a number of interesting scenarios that can considerably increase flexibility, fault tolerance, scalability, and the ability to tackle complex analytics over unstructured data that were not technically and/or economically feasible with a traditional RDBMS.3 Furthermore, despite being originally designed for a largely different application (i.e., unstructured text data processing), MapReduce can nonetheless be used to process structured data.23 Specifically, Apache Hive is an open source data warehouse infrastructure built on top of Apache Hadoop that facilitates data summarization, ad hoc queries, and the analysis of large datasets stored in Hadoop-compatible file systems. Hive provides a mechanism to project structure onto data (i.e., ETL) and query the data using an SQL-like language called HiveQL and executes ad hoc queries against data stored in the Hadoop Distributed File System (HDFS).24
18 October 2011
Does Size Matter Only? 8
Despite many advantages, Hadoop is a batch processing system, and Hadoop jobs tend to have high latency and incur substantial overheads in job submission and scheduling. As a result, latency for Hive queries is generally very high (i.e., minutes) even when datasets involved are very small (i.e., a few hundred megabytes). As a result, Hive’s high latency and substantial overhead do not compare well with database systems, such as the Oracle Database, where analyses are conducted on smaller amounts of data but the analyses proceed much more iteratively, with the response times between iterations being substantially less. In comparison, Hive aims to provide acceptable (but not optimal) latency for interactive data browsing, queries over small datasets, or test queries.25
Nonetheless, MapReduce/Hadoop could replace a traditional RDBMS in certain data warehousing scenarios and will likely be more competitive in the medium to long term as the open source projects advance and evolve and the ecosystems around MapReduce/Hadoop grow.3 For example, if an organization’s primary need is a highly scalable storage and a batch data processing system, running analytics directly on Hadoop can effectively utilize commodity resources to deliver a lower cost per TB for data storage and processing than a system involving a traditional RDMS.17 However, if an organization needs transactional support, complex rule validation, and data integrity, an RDBMS or indirect analytics over Hadoop (i.e., utilizing Hadoop as an ETL engine) would be the more appropriate solutions.14
Even though certain current limitations exist with Hadoop-like solutions, the open source community is innovating quickly, rapidly bringing to market new capabilities that make Hadoop more “database-like,” and we would expect further advancements from the open source community to make performing direct analytics over Hadoop both easier and with higher performance than the current iteration of the platform.
Although many on Wall Street are concerned that Hadoop-based architectures could replace the traditional RDBMS in certain data warehousing scenarios, which we view as a fair concern, we expect existing vendors to supplement data warehouses to support MapReduce to optimize for larger and more diverse datasets, while new data architectures will enhance in-memory analytics for complex models (i.e., rapid cross-correlation between different types of unstructured and structured data), thereby expanding the addressable market of these vendors by a larger degree than Hadoop will cannibalize existing revenue.4 In fact, database vendors have begun to incorporate proprietary implementations of the MapReduce model as foundational layers of their Big Data solutions (e.g., Aster Data), while others have announced their own distributions of Apache Hadoop, rather than relying solely on the Apache distribution (e.g., Cloudera, EMC Greenplum, and IBM).
Many vendors (e.g., Informatica, EMC, Hewlett-Packard, Quest Software, Oracle, IBM, Teradata, and so on) are positioning their product portfolios to serve as (or build on top of) either the foundational pillars of the access and transformation APIs and languages for MapReduce/Hadoop or the foundational storage and/or data processing layers of MapReduce/Hadoop systems to support the loading, accessing, and analyzing of data to, from, and within Hadoop and other MapReduce frameworks. In our opinion, the ultimate leaders in the emerging market for Big Data technologies will be the vendors that develop solutions that not only augment core information management capabilities but also can make the MapReduce/Hadoop environment “comfortable enough” for mainstream SQL developers within enterprises,4,26 given that the lack of guidance for and knowledge of building, configuring, administering, and managing production-quality MapReduce/Hadoop clusters at scale represent the major impediments to the adoption of these technologies within the enterprise.11 Among these vendors, we view Oracle, IBM, and Teradata as the publicly traded vendors best positioned to monetize the forecast growth in “Big Data” analytics.

18 October 2011
Does Size Matter Only? 9
■ Oracle. Oracle’s relational database technology supports transactional systems that handle structured data with complex validation and data integrity rules, and we expect Oracle to expand its technology portfolio to deal with the burgeoning amount of unstructured data within enterprise IT systems. Although Hadoop and Oracle are two different technologies that process data very differently, the two technologies, in our opinion, complement each other. As enterprises explore opportunities to extract value from the exploding volumes of unstructured data, as we had expected, Oracle announced products and features that expand Oracle’s capabilities to handle both structured and unstructured data and implement MapReduce and Hadoop frameworks with Oracle’s technology.
In our opinion, Oracle views MapReduce and Hadoop, in particular, not only as a viable data processing framework that can be used in run-time to return query data within the Oracle Database, but also as a pre-processing engine for incoming data that transforms and stores that as structured output data in Oracle’s databases. In fact, there are several ways Oracle could achieve integration of MapReduce/Hadoop with several Oracle technologies (e.g., External Tables, Parallel Pipelined Table Functions, Advanced Queuing, Oracle Grid Engine, and MapReduce with In-Memory Parallel Execution) to process Big Data.
In fact, as we previewed in September 2011, Oracle announced an expansion to the family of Exaseries appliances to support Hadoop to provide seamless processing of both structured and unstructured data at Oracle OpenWorld in October 2011, in addition to specific integration points with the Oracle Database and Oracle middleware software. Specifically, Oracle unveiled the Oracle Big Data Appliance as an adjunct to the Oracle Database and/or Exadata that includes several components of standard open source Hadoop software, as well as multiple proprietary Oracle technologies. At a high level, the Big Data Appliance involves using a Hadoop cluster to pre-partition, sort, and transform unstructured data into an Oracle-ready format for fast and efficient loading. Once the MapReduce processes in the Big Data Appliance’s Hadoop clusters are completed, only the relevant and useful data from the Hadoop procedure will be loaded into the Oracle Database or Exadata for query and analytics. In our opinion, the Oracle Big Data Appliance, in conjunction with Exadata and Exalytics, offers customers an end-to-end solution allowing customers to maximize the value of Big Data with their existing investment in the Oracle Database. (See Exhibit 4.)
Exhibit 4: Oracle’s “Engineered Systems” for Big Data
Source: Oracle.
By triaging multi-structured data in the Oracle Big Data Appliance and then feeding the structured output data to the database for further analysis, enterprises can gain more insight by correlating this data from a Hadoop cluster with their traditional, structured data already residing in an Oracle Database running on Exadata. Specifically, by leveraging Hadoop processing in a more integrated manner, customers can take
In our opinion, the Oracle Big Data Appliance, in conjunction with Exadata and Exalytics, offers customers an end-to-end solution allowing customers to maximize the value of Big Data with their existing investment in the Oracle Database.

18 October 2011
Does Size Matter Only? 10
advantage of the power of the Oracle Database while at the same time simplify the analysis of unstructured data stored in a Hadoop cluster by streaming output data over Oracle’s low latency and high aggregate bandwidth InfiniBand interconnect directly from the Oracle Big Data Appliance into Exadata.28 The finished dataset then can even be piped into Exalytics for real-time analytic dashboards and reports.133
The nature and amount of the data, the type of workloads, and the number of servers, manpower skills, and service level requirements from the end user will dictate several approaches to leveraging MapReduce and Hadoop with Oracle’s product portfolio. As such, in addition to the Oracle Big Data Appliance, we expect Oracle to promote multiple options for integrating the Oracle Database and/or Oracle middleware with MapReduce and Hadoop, including:
MapReduce programs can be implemented within the Oracle Database using Parallel Pipelined Table Functions and parallel operations. Pipelined PL/SQL table functions declaratively specify (with a few keywords) how a parallel query should do the “map” process and then the procedural body does the “reduce.”
Parallel Execution (PX) in Oracle Database 11gR2 enables in-memory MapReduce processing for real-time analytics on structured and unstructured data.27
Complex queries can be supported using Hadoop or the Oracle Database operating upon data residing in the Oracle NoSQL Database, a NoSQL database using a key/value paradigm.134
By integrating WebLogic, Coherence, and Oracle Grid Engine, Oracle can enable massively parallel processing of applications/jobs using the MapReduce framework.
In the end, the technical nature of the MapReduce framework with the requirement to develop Java code, the lack of institutional knowledge on how to architect the Hadoop infrastructure, and the lack of analysis tool support for data residing within HDFS, Hive, and/or HBase is causing enterprises to delay the adoption of many of these technologies.11 Because of Oracle’s expertise in Java, large installed base of database and middleware technologies, and integrated “Engineered Systems” appliance strategy, we believe that Oracle is uniquely positioned to drive increased usage of the MapReduce framework and Hadoop within enterprises while also increasing the amount of data that can be stored in and processed by the Oracle Database, which, in turn, drives demand for more CPU cores, which leads to increased database license revenue.
■ IBM. The Big Data platform from IBM, which is covered by Credit Suisse IT Hardware Analyst Kulbinder Garcha, includes two major technologies: (1) IBM InfoSphere BigInsights and (2) IBM InfoSphere Streams. IBM InfoSphere BigInsights is a Big Data analysis platform powered by Hadoop. The product is essentially a bundled package of open source products with specific technologies from IBM that enables easy deployment, development, and monitoring of Hadoop. Additionally, BigInsights integrates with IBM’s data warehouse solutions (DB2 and Netezza), using Jaql modules that allow BigInsights to read and write from those products while running data processing jobs. This also includes a set of DB2 user-defined functions that enable invocation of Hadoop jobs through SQL, and easy exchange of data between the Hadoop File System and DB2 tables.29 In comparison, while similar to complex event processing (CEP) systems, InfoSphere Stream enables continuous analysis of massive volumes of streaming data (both structured and unstructured) with sub-millisecond response times.30 IBM has developed InfoSphere Streams for real-time analytic processing to provide raw data pre-processing, feature extraction, data representation, filtering, aggregation, data (event) correlation, and anomaly detection and prediction.31

18 October 2011
Does Size Matter Only? 11
With a product portfolio consisting of database and analytics software, as well as server and storage hardware platforms, combined with recent acquisitions of SPSS and Netezza, which IBM suggested capped off more than 23 analytics-related acquisitions over the prior four years, IBM maintains a broad product set to bring to bear to deliver Big Data technologies to the enterprise. For example, by combining with InfoSphere BigInsights, InfoSphere Streams, and InfoSphere Warehouse, IBM can extend analysis to cover both structured and multi-structure data, encompassing both data-in-motion and data accumulated over a long period of time.29 As such, we view IBM as one of the best-positioned competitors in the market.
■ Teradata. On March 3, 2011, Teradata announced the acquisition of Aster Data, an advanced analytics database and platform provider. The nCluster analytics platform, Aster Data’s flagship product, provides a massively parallel (MPP) hybrid row- and column-oriented analytical database architecture for large-scale data management and advanced analytics by taking advantage of the MapReduce framework for parallelization and scalable data processing. Aster Data runs MapReduce in-database and combines MapReduce with SQL via the company’s SQL-MapReduce interface to allow developers to take advantage of MapReduce within standard SQL.32
Aster Data’s combination of MapReduce parallelization, SQL-MapReduce, its pre-packaged library of SQL-MapReduce functions, and in-database processing of both data and procedural code make nCluster particularly suitable for applications that analyze click-streams, mine online customer transaction data for interesting patterns of behavior, or analyze connections and social networks for marketing, fraud detection, and behavior analysis.33 Furthermore, as we detail later in this report, RDBMSs with MapReduce support, such as Aster Data, have broader ecosystem support because of the fact that they support SQL.19
Although Aster Data’s software revenue represented less than 5% of Teradata’s software revenue at the time of the acquisition,34 Aster Data is the vendor furthest ahead in terms of developing an ecosystem, as a result of the company’s SQL-MapReduce interface (which is by far the most elegant bridge between SQL and MapReduce currently on the market).19 Furthermore, Aster Data has already garnered a number of noteworthy customers, including Gilt Groupe, Barnes & Noble, MySpace, LinkedIn, Mzinga, and comScore. In addition to the company’s traction on a standalone basis, Teradata’s acquisition of Aster Data adds the backing of one of the market’s leading data warehousing and analytics vendors with a broad customer base, as well as global sales and customer support reach.34
Going forward, we expect Teradata to introduce Aster Data as an additional data warehouse hardware appliance on the Teradata Platform Family, as well as utilize Aster Data’s approach to MapReduce across other existing Teradata products. Furthermore, building on the company’s acquisition of Aprimo, a marketing automation software provider, we expect Teradata to develop customer-oriented analytic applications that access the rich dataset in Aster Data as well as the historical and current transactional data in Teradata data warehouses.34
Ultimately, at several points in the history of enterprise IT, the ongoing evolution of hardware technologies reaches a critical mass that results in a radical paradigm shift in software architectures (e.g., from mainframe to client/server). We believe the emergence of large-volume, multi-structured Big Data computational frameworks, as well as in-memory data architectures that characterize Fast Data (as detailed in our report titled The Need for Speed, published on March 30, 2011), have positioned the industry at the cusp of the most significant revolution in database architectures in 20 years. (See Exhibit 5.)

18 October 2011
Does Size Matter Only? 12
Exhibit 5: The Evolution of Business Intelligence, Business Analytics, and Data Warehousing
Source: TDWI, HighPoint Solutions, DSSResources.com, Credit Suisse.
Although the majority of this report focuses on the volume and complexity of Big Data and Hadoop-based systems, enterprises still want to keep the latency of the analytical queries as low possible, with the goal of reducing processing times from hours into minutes and minutes into seconds. Therefore, enterprise IT departments are having to deal with two contradictory forces: (1) the volume of and complexity of the types of data is continuously increasing, while (2) the processing of data into usable business analytics needs to be more real-time to react to fast-changing business needs.18
The Fast Data and Big Data revolutions are about finding new value within and outside conventional data sources to respond to dynamic business trends, and over time, because of two aforementioned contradictory pressures on IT departments, we expect the lines between Fast Data and Big Data begin to blur into a new category that we are referring to as “Dynamic Data,” as we anticipate existing vendors will supplement data warehouses to support MapReduce in order to optimize for larger and more diverse datasets, while new data architectures will enhance in-memory analytics for complex models (i.e., rapid cross-correlation between different types of unstructured and structured data).4 (See Exhibit 6.)
Enterprise IT departments are having to deal with two contradictory forces: (1) the volume of and complexity of the types of data is continuously increasing, while (2) the processing of data into usable business analytics needs to be more real-time to react to fast-changing business needs.18

18 October 2011
Does Size Matter Only? 13
Exhibit 6: Fast Data + Big Data = Dynamic Data
BIGDATA
+ =
Source: Credit Suisse.
An example of the value structured and multi-structured data analysis in real-time would be sentiment monitoring. Specifically, an organization would leverage information sources such as call center software, click-streams from the corporate Website, news feeds, social media Websites, and so on to identify strongly positive or negative sentiment regarding organization, product categories, specific items, as well as potential failures and risks. A Dynamic Data system would look for variances in behavior, including an increase in specific text patterns, occurrence of key words/phrases, Web traffic trends, point-of-sales data to determine sentiment changes and then take action by alerting key public relations staff, sending customers automated updates/responses, informing the customer service organization to directly contact individuals, or alerting a marketing automation system to send out promotions based on historical purchase and current and past behavior.
In the end, we firmly agree with the assertion first made by Dave Newman, Research Vice President of Gartner, that the economics of data (not just the economics of applications) will drive competitive advantage, resulting in high, sustained growth in the data warehouse and analytics markets.11

18 October 2011
Does Size Matter Only? 14
What Are Big Data Technologies? One morning, I shot an elephant in my pajamas. How he got in my pajamas, I don’t know. Then, we tried to remove the tusks...but they were embedded in so firmly that we couldn’t budge them.
— Groucho Marx, 1930
What Is MapReduce? Google, one of the first companies to face the challenge of analyzing petabyte-scale data, pioneered a software framework, called MapReduce, for processing large amounts of unstructured data using commodity hardware. After its success with unstructured data, Google progressed to using MapReduce for analyzing and transforming structured and unstructured data. In 2004, Google published the paper that introduced MapReduce to the world.12
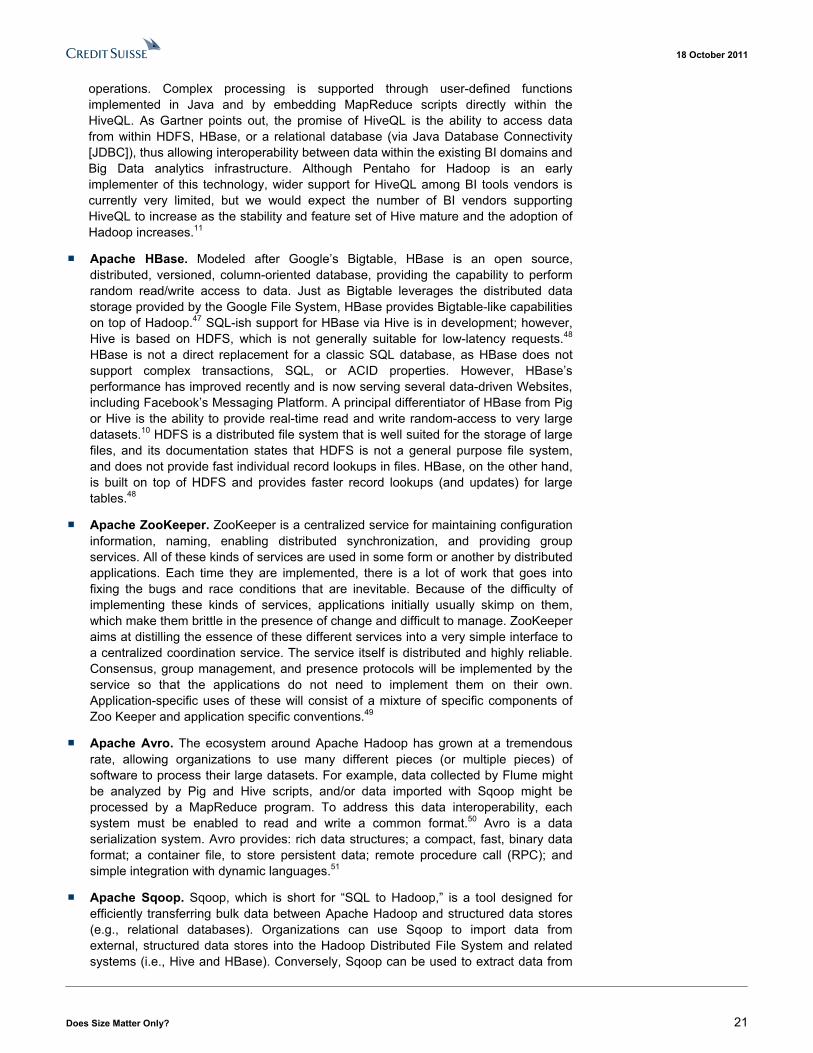
The actual algorithms used by search engines, including Google and Yahoo!, to determine the relevance to search terms and quality of Webpages are very specialized, sophisticated, and highly proprietary. These algorithms are the “secret sauce” of search. The application of the algorithms to each Webpage and the aggregation of the results into indexes to enable search are done through MapReduce processes. The map function identifies each use of a potential search parameter in a Webpage. The reduce function aggregates this data (e.g., determining the number of times a search parameter is used in a page).5 (See Exhibit 7 and Exhibit 8.)
Exhibit 7: MapReduce Structure Exhibit 8: MapReduce Example
Source: sundar5.wordpress.com. Source: http://blog.jteam.nl/2009/08/04/introduction-to-Hadoop.
When processing massive datasets, the implementation of MapReduce is quickly becoming the de facto performance and scalability model for parallel processing executed over large clusters of commodity hardware. Out of MapReduce, several languages and frameworks have evolved: Google Sawzall, Yahoo! Pig, the Apache Software Foundation’s open source research projects under the umbrella name of Hadoop, and so on.35
MapReduce consists of two steps:
■ Map. The master node takes the input, partitions it up into smaller sub-problems, and distributes those to worker nodes. A worker node may do this again in turn, leading to a multi-level tree structure. The worker node processes that smaller problem, and passes the answer back to its master node.36 The map function takes two arguments: (1) a key value and (2) a resource against, which the key is to be applied. The function code applies the key to the resource to yield a block of data and then emits a list of key-value pairs based on its user coding.37 At its most basic, the map phase has to transform the input data into something meaningful that the reduce phase can aggregate on.38

18 October 2011
Does Size Matter Only? 15
■ Reduce. The master node then takes the answers to all the sub-problems and combines them in some way to get the output, namely the answer to the problem it was originally trying to solve.36 The reduce function is called iteratively (one for each unique key emitted by the map function) and also takes two arguments: (1) the key value and (2) the list emitted by the map function. The output is a single value based on the result of some user calculation driven by the values found; it could be an aggregation function sum, average, or mean, or it could be a string function (e.g., a concatenation).37
In actuality, a third step exists in the MapReduce process known as shuffling. After an individual map job has completed, the data needs to be stored in such a way that one reducer job has all the values for one key. This process is called shuffling, which, if not done, would not allow the reduce phase to be executed in parallel, meaning that only one reduce job will run and aggregate the outputs of many map jobs.38 (See Exhibit 9.)
Exhibit 9: MapReduce Example
Source: http://www.thilo-fromm.de/~t-lo/Hadoop/mapred.png.
Google’s abstraction was inspired by the map and reduce primitives present in LISP programming and many other functional languages. Google realized that most of its computations involved applying a map operation to each logical “record” in their input in order to compute a set of intermediate key/value pairs, and then applying a reduce operation to all the values that shared the same key, in order to combine the derived data appropriately. Google’s use of a functional model with user-specified map and reduce operations allows Google to parallelize large computations easily and to use re-execution as the primary mechanism for fault tolerance.39 All resource management, including memory allocation, file I/O operations, iteration, and hold intermediate results, are handled by the environment.37
Because map and reduce functions could be used for numeric data or text, this environment is equally valuable for performing statistical analysis and text analysis; inputs are whatever the user specifies: indexed files, CSV files, documents, Webpages, formatted record streams, and so forth. The ultimate output could be a single number or string, a report, a list, or even a series of normalized tables. This environment is very useful for large-scale data analysis but is not appropriate for transaction processing.37

18 October 2011
Does Size Matter Only? 16
Because the map function invocations that are not serially dependent in any way, they can be done in parallel. The MapReduce environment can scatter partition the input data and invoke the function on as many processors as are available, rolling up the result sets and delivering them to the reduce function, which is also not serially dependent and may be executed in parallel. Partitioning and massively parallel processing are the functionalities that give MapReduce its power.37
What Is Hadoop? Although often used interchangeably, MapReduce and Hadoop are not synonymous with each other. Hadoop is an open source implementation of the MapReduce paradigm, which is different from other implementations of MapReduce by Google, Aster Data, Greenplum, and so on. Hadoop, an open source project under the Apache Software Foundation, is the most popular, well known implementation of MapReduce. The Hadoop platform consists of two key services: reliable data storage using the Hadoop Distributed File System (HDFS) and high-performance parallel data processing using a technique called Hadoop MapReduce.15
Hadoop, created by Doug Cutting and named after his son’s toy elephant, is a software framework for running applications that process vast amounts of data in-parallel on large clusters of commodity hardware (potentially thousands of nodes) in a reliable, fault-tolerant manner.40 Hadoop is a generic processing framework designed to execute queries and other batch read operations against massive datasets that can be tens or hundreds of terabytes and even petabytes in size.5
Hadoop allows organizations to achieve storage and high-quality query abilities on large datasets in an efficient and relatively inexpensive manner by leveraging the aforementioned MapReduce computational paradigm over a distributed file system, known as Hadoop Distributed File System (HDFS), which can easily scale out. As a result, the popularity of Hadoop has grown in the last few years, especially with organizations that require analysis of multi-structured data, including highly unstructured/text-based data as well as machine-generated logs.40
Hadoop implements MapReduce, where the application is divided into many small fragments of work, each of which may be executed or re-executed on any node in the cluster of commodity server machines, and HDFS provides a distributed file system that stores data on the compute nodes, providing high scalability, fault tolerance, and efficiency in processing operations on large quantities of unstructured data (e.g., text and Web content) and semi-structured data (e.g., log records, social graphs).40 In as much as a computer exists to process data, Hadoop in effect transforms lots of cheap little computers into one big computer that is especially good for analyzing indexed text.36
Hadoop has been particularly useful in environments where massive server farms are being used to collect the data. Hadoop is able to process parallel queries as big, background batch jobs on the same server farm. This saves the user from having to acquire additional hardware for a traditional database system to process the data. Most importantly, Hadoop also saves the user from having to load the data into another system. The huge amount of data that needs to be loaded can make this impractical.5
Many of the ideas behind the open source Hadoop project originated from the Internet search community, most notably Google and Yahoo!. Search engines employ massive farms of inexpensive servers that crawl the Internet retrieving Webpages into local files. They then process this data using massive parallel queries to build indexes to enable search.5
The actual algorithms used by search engines to determine the relevance to search terms and quality of Webpages are very specialized, sophisticated, and highly proprietary. These algorithms are the secret sauce of search. The application of the algorithms to each Webpage and the aggregation of the results into indexes to enable search is done through MapReduce processes and is more straightforward (although done on a massive scale).

18 October 2011
Does Size Matter Only? 17
The map function identifies each use of a potential search parameter in a Webpage. The reduce function aggregates this data (e.g., determining the number of times a search parameter is used in a page).5
Some large Websites use Hadoop to analyze usage patterns from log files or click-stream data that is generated by hundreds or thousands of their Web servers. The scientific community can use Hadoop on huge server farms that monitor natural phenomena and/or the results of experiments. The intelligence community needs to analyze vast amounts of data gathered by server farms monitoring phone, email, instant messaging, travel, shipping, etc. to identify potential terrorist threats.5
Hadoop Platform and Ecosystem
The term “Hadoop” commonly refers to the main components of the base platform, the ones from which others offer higher-level services. These components include the storage framework with the processing framework, formed by (1) the Hadoop Distributed File System library and (2) the MapReduce library, both of which work together with a core library (known as Hadoop Common, a set of utilities that contain the necessary JAR files and scripts needed to start Hadoop and also provide source code, documentation, and a contribution section which includes projects from the Hadoop Community) to enable the higher-level services of Hadoop. These represent the first Hadoop project that would establish a foundation for the others to work.66 (See Exhibit 10.)
Exhibit 10: Hadoop Base Platform and Ecosystem
Source: http://1.bp.blogspot.com/_mbMKzl2KhSc/TON--PePutI/AAAAAAAABbI/rDxMEoM4dt0/s1600/B-Hadoop-Project+Stack.png.
■ Hadoop MapReduce. Hadoop MapReduce implements the MapReduce functionality over HDFS. A MapReduce job usually splits the input dataset into independent chunks that are processed by the map tasks in a completely parallel manner. (See Exhibit 11.) The framework sorts the outputs of the maps, which are then inputted into the reduce tasks. Typically, both the input and the output of the job are stored in a file system. The framework takes care of scheduling tasks, monitoring them, and re-executing the failed tasks.42

18 October 2011
Does Size Matter Only? 18
Exhibit 11: Hadoop MapReduce Lifecycle
Source: http://2.bp.blogspot.com/_mbMKzl2KhSc/TOOF6OQp5fI/AAAAAAAABb8/l2gyhVhQw9Y/s1600/D-Hadoop+MapReduce+Architecture.png.
■ Hadoop Distributed File System (HDFS). The Hadoop Distributed File System (HDFS) is a distributed file system designed to run on commodity hardware. HDFS has many similarities with existing distributed file systems. However, the differences from other distributed file systems are significant. HDFS is highly fault-tolerant and is designed to be deployed on low-cost hardware. HDFS provides high throughput access to application data and is suitable for applications that have large datasets. HDFS relaxes a few POSIX requirements to enable streaming access to file system data. HDFS was designed with these goals in mind:43
(1) Hardware Failure. Hardware failure is the norm rather than the exception. The system recovers quickly from nodes that do not return results in a timely fashion.43
(2) Large Datasets. Applications that run on HDFS have large datasets. A typical file in HDFS is gigabytes to terabytes in size. Thus, HDFS is tuned to support large files, providing high aggregate data bandwidth and scale to hundreds of nodes in a single cluster. HDFS should support tens of millions of files in a single instance.43
(3) “Moving Computation Is Cheaper than Moving Data.” A computation requested by an application is much more efficient if it is executed near the data it operates on. This is especially true when the size of the dataset is huge. HDFS provides interfaces for applications to move themselves closer to where the data is located.43
HDFS is designed to reliably store very large files across machines in a large cluster. HDFS stores each file as a sequence of blocks, and all blocks in a file except the last block are the same size. The blocks of a file are replicated for fault tolerance. The block size and replication factor are configurable per file. An application can specify the number of replicas of a file. The replication factor can be specified at file creation time and can be changed later. Files in HDFS are write-once and have strictly one writer at any time.43

18 October 2011
Does Size Matter Only? 19
HDFS has a master/slave architecture. An HDFS cluster consists of a single NameNode, a master server that manages the file system namespace and regulates access to files by clients; thus, a NameNode is a single point of failure in a given cluster. In addition, there are a number of DataNodes, usually one per node in the cluster, which manage storage attached to the nodes that they run on. HDFS exposes a file system namespace and allows user data to be stored in files. Internally, a file is split into one or more blocks, and these blocks are stored in a set of DataNodes. (See Exhibit 12.)
A Hadoop client is a user’s terminal into the Hadoop cluster that initiates processing, but no actual code is run here. The NameNode executes file system namespace operations like opening, closing, and renaming files and directories. It also determines the mapping of blocks to DataNodes. A single master JobTracker serves as the query coordinator, handing out the tasks to one slave TaskTracker per cluster-node. The master is responsible for scheduling the jobs’ component tasks on the slaves, monitoring them and re-executing the failed tasks. The slaves execute the tasks as directed by the master.44 The DataNodes are responsible for serving read and write requests from the file system’s clients. The DataNodes also perform block creation, deletion, and replication upon instruction from the NameNode.43 (See Exhibit 13.)
Exhibit 12: HDFS Cluster Architecture Exhibit 13: Querying Data from HDFS Cluster
Source: Oracle, Credit Suisse. Source: Oracle, Credit Suisse.
A typical deployment has a dedicated machine that runs only the NameNode software. Each of the other machines in the cluster runs one instance of the DataNode software. The architecture does not preclude running multiple DataNodes on the same machine, but in a real deployment that is rarely the case.43
The NameNode makes all decisions regarding replication of blocks. The NameNode periodically receives a Heartbeat and a Blockreport from each of the DataNodes in the cluster. Receipt of a Heartbeat implies that the DataNode is functioning properly. A Blockreport contains a list of all blocks on a DataNode.43
In addition to the Hadoop core, an ecosystem of multiple Hadoop subprojects exist that rely on HDFS for input and output data and on MapReduce for processing in a specific way for different needs and focuses. Some of these, which are subject to the availability of the platform, include: HBase (columnar database), Hive (data warehouse/data mining), Pig (scripting), and Chuckwa (log analysis). Conversely, ZooKeeper (coordination service) is independent of Hadoop availability and is used from HBase, and Avro (serialization/deserialization) is designed to support the main service component requirements.66

18 October 2011
Does Size Matter Only? 20
Exhibit 14: Hadoop Ecosystem and Processes
Source: http://1.bp.blogspot.com/_mbMKzl2KhSc/TON--PePutI/AAAAAAAABbI/rDxMEoM4dt0/s1600/B-Hadoop-Project+Stack.png.
■ Apache Pig. In MapReduce frameworks such as Hadoop, the user must break any distinct retrieval task into the map and reduce functions. For this reason, both Google and Yahoo! have built layers on top of a MapReduce infrastructure to simplify this for end users. Google’s data processing system is called Sawzall, and Yahoo!’s is called Pig. A program written in either of these languages can be automatically converted into a MapReduce task and can be run in parallel across a cluster. These layered alternatives are certainly easier than native MapReduce frameworks, but they all require writing an extensive amount of code.35
Apache Pig is a platform for analyzing large datasets that consists of a high-level language for expressing data analysis programs, coupled with infrastructure for evaluating these programs. The salient property of Pig programs is that their structure is amenable to substantial parallelization, which in turns enables them to handle very large datasets. This high-level language for ad hoc analysis allows developers to inspect HDFS stored data without the need to learn the complexities of the MapReduce framework, thus simplifying the access to the data.45
The Pig Latin scripting language is not only a higher-level data flow language but also has operators similar to SQL (e.g., FILTER and JOIN) that are translated into a series of map and reduce functions. Pig Latin, in essence, is designed to fill the gap between the declarative style of SQL and the low-level procedural style of MapReduce.46
■ Apache Hive. Hive is an open source data warehouse system for Hadoop that facilitates easy data summarization, ad hoc queries, and the analysis of large datasets stored in Hadoop compatible file systems. Hive provides a mechanism to project structure onto this data, query the data using an SQL-like language called HiveQL, and execute these statement against data stored in the Hadoop Distributed File System (HDFS).24 The execution of the HiveQL statement generates a MapReduce job to transform the data as required.11 At the same time, this language also allows traditional MapReduce programmers to plug in their custom mappers and reducers when it is inconvenient or inefficient to express this logic in HiveQL.24 Two differentiators between HiveQL and SQL are that HiveQL jobs are optimized for scalability (i.e., all rows returned) not latency (i.e., first row returned), and Hive QL implements a subset of the SQL language.11
In the MapReduce/Hadoop world, Pig and Hive are widely regarded as valuable abstractions that allow the programmer to focus on database semantics rather than programming directly in Java.10 HiveQL is designed for the execution of analysis queries and supports aggregates and sub-queries in addition to select and join
18 October 2011
Does Size Matter Only? 21
operations. Complex processing is supported through user-defined functions implemented in Java and by embedding MapReduce scripts directly within the HiveQL. As Gartner points out, the promise of HiveQL is the ability to access data from within HDFS, HBase, or a relational database (via Java Database Connectivity [JDBC]), thus allowing interoperability between data within the existing BI domains and Big Data analytics infrastructure. Although Pentaho for Hadoop is an early implementer of this technology, wider support for HiveQL among BI tools vendors is currently very limited, but we would expect the number of BI vendors supporting HiveQL to increase as the stability and feature set of Hive mature and the adoption of Hadoop increases.11
■ Apache HBase. Modeled after Google’s Bigtable, HBase is an open source, distributed, versioned, column-oriented database, providing the capability to perform random read/write access to data. Just as Bigtable leverages the distributed data storage provided by the Google File System, HBase provides Bigtable-like capabilities on top of Hadoop.47 SQL-ish support for HBase via Hive is in development; however, Hive is based on HDFS, which is not generally suitable for low-latency requests.48 HBase is not a direct replacement for a classic SQL database, as HBase does not support complex transactions, SQL, or ACID properties. However, HBase’s performance has improved recently and is now serving several data-driven Websites, including Facebook’s Messaging Platform. A principal differentiator of HBase from Pig or Hive is the ability to provide real-time read and write random-access to very large datasets.10 HDFS is a distributed file system that is well suited for the storage of large files, and its documentation states that HDFS is not a general purpose file system, and does not provide fast individual record lookups in files. HBase, on the other hand, is built on top of HDFS and provides faster record lookups (and updates) for large tables.48
■ Apache ZooKeeper. ZooKeeper is a centralized service for maintaining configuration information, naming, enabling distributed synchronization, and providing group services. All of these kinds of services are used in some form or another by distributed applications. Each time they are implemented, there is a lot of work that goes into fixing the bugs and race conditions that are inevitable. Because of the difficulty of implementing these kinds of services, applications initially usually skimp on them, which make them brittle in the presence of change and difficult to manage. ZooKeeper aims at distilling the essence of these different services into a very simple interface to a centralized coordination service. The service itself is distributed and highly reliable. Consensus, group management, and presence protocols will be implemented by the service so that the applications do not need to implement them on their own. Application-specific uses of these will consist of a mixture of specific components of Zoo Keeper and application specific conventions.49
■ Apache Avro. The ecosystem around Apache Hadoop has grown at a tremendous rate, allowing organizations to use many different pieces (or multiple pieces) of software to process their large datasets. For example, data collected by Flume might be analyzed by Pig and Hive scripts, and/or data imported with Sqoop might be processed by a MapReduce program. To address this data interoperability, each system must be enabled to read and write a common format.50 Avro is a data serialization system. Avro provides: rich data structures; a compact, fast, binary data format; a container file, to store persistent data; remote procedure call (RPC); and simple integration with dynamic languages.51
■ Apache Sqoop. Sqoop, which is short for “SQL to Hadoop,” is a tool designed for efficiently transferring bulk data between Apache Hadoop and structured data stores (e.g., relational databases). Organizations can use Sqoop to import data from external, structured data stores into the Hadoop Distributed File System and related systems (i.e., Hive and HBase). Conversely, Sqoop can be used to extract data from

18 October 2011
Does Size Matter Only? 22
Hadoop and export it to external structured data stores, including relational databases and enterprise data warehouses.52
■ Apache Mahout. Mahout’s goal is to build scalable machine learning libraries. Mahout’s core algorithms for clustering, classification, and batch-based collaborative filtering are implemented on top of Apache Hadoop using the MapReduce paradigm. Currently, Mahout supports mainly four use cases: (1) recommendation mining takes user behavior and from that tries to find items users might like; (2) clustering takes text documents, for example, and groups them into groups of topically related documents; (3) classification learns from existing categorized documents what documents of a specific category look like and is able to assign unlabelled documents to the (hopefully) correct category; and (4) frequent item-set mining takes a set of item groups (e.g., terms in a query session, shopping cart content) and identifies which individual items usually appear together.53
■ Apache Chukwa. Log processing was one of the original purposes of MapReduce. Unfortunately, using Hadoop for MapReduce processing of logs is somewhat troublesome. Logs are generated incrementally across many machines, but Hadoop MapReduce works best on a small number of large files. HDFS does not currently support appends, making it difficult to keep the distributed copy fresh. Chukwa is a Hadoop subproject devoted to bridging that gap between logs and MapReduce. Chukwa is a scalable distributed monitoring and analysis system, particularly for logs from Hadoop and other large systems.54
■ Apache Flume. Flume is a distributed, reliable, and available service for efficiently collecting, aggregating, and moving large amounts of log data from applications to Hadoop’s HDFS. Flume has a simple and flexible architecture based on streaming data flows. Flume uses a simple extensible data model that allows for online analytic applications.55 Flume was developed after Chukwa and has many similarities, as both have the same overall structure and do agent-side replay on error. However, there are some notable differences as well. In Flume, there is a central list of ongoing data flows, stored redundantly in Zookeeper. Whereas Chukwa does this end-to-end, Flume adopts a more hop-by-hop model. In Chukwa, agents on each machine are responsible for deciding what to send.56

18 October 2011
Does Size Matter Only? 23
From Data Warehousing to Big Data It is no longer acceptable to be limited to queries like “show me the list of customers that haven’t purchased a new pair of shoes in the last year.” We now need to know what the geo-correlation is between likes, comments, and replay views of the Dos Equis guy commercial...One can visualize an SQL-style query here, but the underlying architectures of prevalent relational databases are not set up to handle that kind of data. This is where technologies like MapReduce, document databases, in-memory caching, and key-value pair structures lead the way.
— Frank Artale, Ignition Partners
The Evolution of Business Intelligence, Business Analytics, and Data Warehousing In the 1970s and 1980s, computer hardware was expensive and computer processing power was limited. A medium-sized business typically operated a handful of large mainframe-based application systems that were designed for operational, data entry purposes. Information needs were addressed through paper reports. However, report programs were expensive to write and generally inflexible. A computer programmer was required to write the report programs, although salaries for programmers were relatively low during this period.57
In the 1980s, relational databases became popular, and data was stored in database tables with rows and columns, similar to Excel spreadsheets of today. While relational databases were much more intuitive for developers, complex logic was often needed to join multiple database tables to obtain the information that was needed. Although it was possible for end users to write simple reports, the queries were often inefficient and had to be run after normal business hours, to avoid any impact on online transactions.57
However, with the emergence of PC and mini computers in the late 1980s, many businesses migrated from mainframe computers to client servers. Business people were assigned a personal computer with Microsoft Word, Excel, and Access installed. The PC empowered end users to develop their own applications and present data in a manner that was meaningful to them, such as in tabular or graph format. Excel spreadsheets could easily be tweaked as business needs changed, without the assistance from the IT department. Unfortunately, corporate data remained centralized and was generally not directly accessible to end users.57
Over the past two decades, reporting and analytics tools have evolved from static reports in the 1980s to data warehousing and data marts technology in the 1990s. While data warehousing enabled heterogeneous data sources to be centralized, the implementation projects were often grossly over budget and performance was far below expectations. As technologies have matured and the advent of service-oriented architectures has become more prominent, data warehousing reinvented itself and emerged as business intelligence (BI), which enhances the flexibility in reporting and analytics tools, which became very popular in the early 2000s.58
The adoption of enterprise applications began in the 1980s and gained momentum in the 1990s and 2000s. Over the decades, organizations have accumulated large piles of historical transaction data, which they process using analytics systems to obtain insightful information about their businesses. This gave rise to the idea of the data warehouse as a relevant platform where data could be held for completing strategic reports for management. However, data warehousing dealt with the more strategic aspects of the business, as most executives were less concerned with the day-to-day operations than they were with a more holistic look at the business model and functions.58

18 October 2011
Does Size Matter Only? 24
As organizations began to need more timely data about their business, they realized that traditional information systems technology was simply too cumbersome to provide relevant data efficiently and quickly. Power BI users traditionally depend upon IT departments to provide them the relevant reports in a certain format. Completing reporting requests could take hours, days, or weeks using old reporting tools that were designed more or less to “report on” the business rather than “run” the business.58
In the late 1980s and 1990s, increased numbers and types of databases emerged along with other technologies. Many large businesses found themselves with data scattered across multiple platforms and variations of technology, making it almost impossible for any one individual to use data from multiple sources. The main idea within data warehousing is to extract data from multiple disparate platforms/applications (e.g., spreadsheets, DB2 or Oracle databases, IDMS records, and VSAM files) and aggregate them in a common location that uses a common querying tool. This separates the operational data from strategic information. In this way, transactional databases (OLTP) could be held on whatever system was most efficient for the operational business, while the reporting/strategic information could be held in a common location using a common language. Data warehouses take this even a step further by giving the data itself commonality by defining what each term means and keeping it standard (e.g., gender, which can be referred to in many ways, should be standardized on a data warehouse with one common, consistent manner of referring to each sex).58
Exhibit 15: Evolution of Business Intelligence, Business Analytics, and Data Warehousing
Source: TDWI, HighPoint Solutions, DSSResources.com, Credit Suisse.
The evolution of analytics, business intelligence, and data warehousing to date can be broadly categorized into five stages: (1) data management; (2) reporting; (3) data analysis; (4) modeling and predicting; and (5) complex event processing (CEP). (See Exhibit 15.) Although each stage of BI evolution has brought new features and new ways to use

18 October 2011
Does Size Matter Only? 25
analytics data, these features are not mutually exclusive. Customers still use all these tools as these features cater to different needs of business users, answering questions ranging from “what happened?” to “why did it happen?” to “what will happen?”
■ Data Management. In the 1990s, the technology industry experienced huge technological changes. The Internet emerged as a popular technology, and companies started to develop e-business and e-commerce applications with a hope to reduce cost, improve efficiency, and to reach wider audiences. During this period, the volume of applications systems in customer environments increased significantly with the implementation of self-service applications with full service back-end legacy or packaged applications. However, the integration between applications systems remained a big challenge, and corporate data remained fragmented and inconsistent. As the number of applications systems and databases had multiplied, companies realized that their systems were poorly integrated and their data was inconsistent across the systems. More importantly, businesses discovered that they had a significant amount of fragmented data, but not the integrated information that was required for critical decision making in a rapidly changing, competitive, global economy. During the data management and data integration phase, companies began to consolidate data from disparate systems/databases. Although, during this phase most of the solutions were custom built by IT developers using native database features (e.g., SQL programming language), this gave rise to the emergence of EAI (Enterprise Applications Integration) and ETL tools, such as Informatica, Ascential Software (acquired by IBM), DataMirror (acquired by IBM), Embarcadero Technologies, Sunopsis (acquired by Oracle), and Trillium (which is part of Harte-Hanks).
■ Reporting. The accumulation and integration of data from disparate systems into a single centralized data repository enabled companies to analyze data in a report format. Reporting tools have evolved from static reports in the 1980s to reporting tools built on top of data warehousing and data marts technology in the 1990s. During this stage, companies typically focused on reporting from a single view of the business to drive decision-making across functional and/or product boundaries.59 Typically, the questions in a reporting environment are known in advance. Thus, database structures can be optimized to deliver good performance even when queries require access to huge amounts of information.60 Business users typically come up with predefined reports/queries and IT developers work on improving the performance of the underlying database query.
Data integration has always been the biggest challenge during the reporting stage. The challenges in constructing a repository with consistent, cleansed data cannot be overstated. There can easily be hundreds of data sources in a legacy computing environment, each with a unique domain value standard and underlying implementation technology. The well integrated repository system becomes the foundation for all subsequent stages of data warehouse deployment.61 Some of the popular reporting tools used in the reporting stage are Oracle Reports, SAP Crystal Reports, and several other reporting tools embedded and pre-integrated into BI software.
■ Data Analysis. The data analysis stage enables decision-makers to focus less on what happened and more on why something happened (e.g., why sales went down or discovering patterns in customer buying habits). Analysis activities are concerned with drilling down beneath the numbers on a report to slice and dice data at a detailed level. Users perform ad hoc analysis, slicing and dicing the data at a detailed level, and questions are typically not known in advance.59 Most of the analytics vendors started including executive dashboards in their tools, which gained momentum as senior executives found dashboards increasingly helpful for obtaining a holistic view of

18 October 2011
Does Size Matter Only? 26
their businesses in different dimensions. In short, executive dashboards provide a very summarized view of information in a presentable format.
Performance is also a lot more important during this stage of data warehouse implementation because the information repository is used much more interactively. Whereas reports are typically scheduled to run on a regular basis with business calendars as a driver for timing, ad hoc analysis is fundamentally a hands-on activity with iterative refinement of questions in an interactive environment. Business users require direct access to the data warehouse via GUI tools without the need for programmer intermediaries. Support for concurrent query execution and large numbers of users against the warehouse is typical of a data analysis implementation. Performance has been critical to the wider adoption of analytics tools, and it must provide response times measured in seconds or minutes for drill-downs in an OLAP (online analytical processing) environment. Performance management relies a lot more on advanced optimizer capability in the RDBMS because query structures are not as predictable as they are in a pure reporting environment. The database optimizer’s ability to determine efficient access paths, using indexing and sophisticated join techniques, and plays a critical role in allowing flexible access to information within acceptable response times.61 BusinessObjects Explorer, Hyperion, Cognos, and MicroStrategy were the leading providers of software tools for data analysis.
■ Modeling and Predicting. In the next phase of BI evolution, analysts utilize the analytics system to leverage information to predict what will happen next in the business to proactively manage the organization’s strategy. As an organization becomes well entrenched in quantitative decision-making techniques and experiences the value proposition for understanding the “whats” and “whys” of its business dynamics, the next step is to leverage information for predictive purposes. Understanding what will happen next in the business has huge implications for proactively managing the strategy for an organization. As such, the predictive modeling stage requires data mining tools for building predictive models using historical detail. For example, users can model customer demographics for target marketing.62
The term “predictive analytics” has become an increasingly common word in the business intelligence (BI) world these days.62 According to Gartner, predictive analytics focuses on predicting future business probabilities and business trends. Multiple predictors are combined in one predictive model, which can be used to forecast future business probabilities with an acceptable level of confidence.62
As an example, “Predictive Analytics for IT” provides information to justify strategic capacity planning, tactical performance management and operational workload management decisions, and generate proactive actions required to support business needs. Predictive analytics can support modeling multitier distributed IT infrastructures with mixed workloads and can predict the impact of the expected growth and planned changes, compare different options, and generate proactive alerts and recommendations, enabling a continuous proactive performance management process.62 Predictive analytics incorporates statistical methods, regression analysis, and statistical process control, as well as analytical queuing network models and optimization technology.62
The number of end users who will apply the advanced analytics involved in predictive modeling is relatively small. However, the workloads associated with model construction and scoring are intense. Model construction typically involves derivation of hundreds of complex metrics for hundreds of thousands (or more) observations as the basis for training the predictive algorithms for a specific set of business objectives. Scoring is frequently applied against a larger set of observations (probably in the

18 October 2011
Does Size Matter Only? 27
millions) because the full population is scored rather than the smaller training sets used in model construction.60
Advanced data mining methods often employ complex mathematical functions such as logarithms, exponentiation, trigonometric functions, and sophisticated statistical functions to obtain the predictive characteristics desired. Access to detailed data is essential to the predictive power of the algorithms. Tools from vendors, such as SAS, SPSS (acquired by IBM), Sybase (acquired by SAP), and Quadstone, provide a framework for development of complex models and require direct access to information stored in the relational structures of the data warehouse. The business end users in the data mining space tend to be a relatively small group of very sophisticated analysts with market research or statistical backgrounds. However, this small quantity of end users can easily consume 50% or more of the machine cycles on the data warehouse platform during peak periods. This heavy resource utilization is due to the complexity of data access and volume of data handled in a typical data mining environment.60
■ Complex Event Processing. Every organization has an increasing flow of live data representing the changing state of the business on its network. Complex event processing (CEP) software analyzes and delivers a constant flow of in-the-moment intelligence from this live data (i.e., applying complex logic to streams of incoming data cached in an in-memory store) either to front-line decision makers via dashboards or to applications that execute in-the-moment actions (e.g., high-frequency trading). Complex event processing is different from traditional transaction processing technologies, which process individual transactions, because CEP operates on events in the context of other events. Furthermore, traditional data analysis tools collect event data in a database to analyze as historical data, whereas CEP performs the analysis as soon as each event arrives, continually updating and outputting results. Specifically, traditional batch analytics do not deliver intelligence fast enough on live streams of incoming data.63 Traditional business analytic tools use a structured set of processing steps (e.g., data capture, data cleansing, data integration, staging tables, metric/KPI generation, and user delivery), and CEP solutions use similar analytic processing steps but on live data streams instead of batch processes.64 Online analytical processing (OLAP) software integrates with CEP to accumulate historical event data, which can be queried as the data receives continuously updated feeds.63
Exhibit 16: Hadoop Processing Exhibit 17: CEP Processing
Source: http://blog.cubrid.org/. Source: http://blog.cubrid.org/.
How Does a Traditional Data Warehouse Work? Enterprise applications (e.g., ERP, CRM, supply chain management) include day-to-day operational data related to business activities. In contrast, a data warehouse does not include all business data from operational systems but rather keeps only relevant data that will assist decision makers in making strategic decisions relative to the organization’s overall mission.58 Although non-transactional data is sometimes stored in a data warehouse, approximately 95-99% of the data usually is transactional data. The

18 October 2011
Does Size Matter Only? 28
primary purpose of designing analytics systems separated from transactional systems is to make decision support more readily available and without affecting day-to-day operations. While operational systems process the transactions (e.g., taking orders, processing invoices and purchase orders, making payments), the main output from data warehouse systems typically are either tabular listings (e.g., queries) with minimal formatting or highly formatted “formal” reports.
Most of the data an enterprise collects is initially captured by the operational systems that run the business (e.g., ERP, CRM, HCM). For example, as a new employee starts work or a new order is placed, the relevant data is created or amended. The operational systems typically use relational databases management systems (RDBMS). Although operational systems built on relational databases are very efficient to store and process transaction records, these systems are incapable of answering business-specific complex questions. Therefore, in order to implement analytics systems that would address those complex questions, a data warehouse primary aggregates data from multiple systems and provides a foundation for business analytics applications.58 Specifically, companies pull a copy of the data from the operational systems and aggregate/move it to a data warehouse, which acts as a centralized repository of relevant operational data, and analytics or online analytics processing (OLAP) applications subsequently run analyses on the data from the data warehouse. (See Exhibit 18.)
Exhibit 18: Centralized Data Warehouse
Source: Kognitio Pablo.
In the traditional BI model, the underlying analytical OLAP database remains separated from transactional OLTP databases. Typically, transactional data from multiple and often disparate systems gets loaded into analytics databases using extract, transform, and load (ETL) tools from vendors, such as Informatica. Traditionally, data in the analytics systems does not include real-time data; rather, data is extracted and loaded through scheduled batch programs that mostly run during off-peak hours. (See Exhibit 19.)

18 October 2011
Does Size Matter Only? 29
Exhibit 19: Traditional Business Intelligence/Data Warehousing Processing
Source: TDWI, Credit Suisse.
ETL tools usually extract data from its source application or repository, transform the data to the format needed for the data warehouse, and then load the data into the data warehouse. Building a data warehouse is not a simple task of extracting the operational data and entering it into the data warehouse. Extracting data from various data sources is a complex problem, and significant operational problems can occur with improperly designed ETL systems. Many inconsistency issues need to be dealt with while integrating the data, given that data comes from multiple disparate systems, which have adopted different functional and technical architectures (e.g., SAP ERP, Oracle Financials, Siebel CRM). Furthermore, accessing the existing system data efficiently has always been a challenge for data warehousing experts. Due to such complexity, sophisticated ETL tools are in demand to ease the process of building a data warehouse. ETL software has been improved over the traditional methods, which extract using the SQL command manually. ETL software includes tools that help IT organizations in designing and scheduling ETL processes.65
Exhibit 20: Business Intelligence Value Chain
Source: SAP, “Intelligent Choices for ERP Data Access and Analysis.”
During the extraction process, data is extracted from the different data sources (including different databases and data formats). After extracting the data, transformation is needed to ensure the data consistency. In order to transform the data into the data warehouse properly, the external data sources are mapped to the data warehouse fields, and data sometimes gets derived based on various logic implemented in the ETL tool. Transformation can be performed during data extraction or while loading the data into the data warehouse. This integration can be a complex issue as the number of data sources increases.

18 October 2011
Does Size Matter Only? 30
Once the extraction, transformation, and cleansing have been done, the data is loaded into the data warehouse. The loading of data can be categorized into two types: (1) the loading of data that currently is contained in the operational database, or (2) the loading of the updates to the data warehouse from the changes that have occurred in the operational database. As to guarantee the freshness of data, data warehouses need to be refreshed periodically, typically either monthly, weekly, or daily. Many issues need to be considered, especially during loading of the updates to the data warehouse. While updating the data warehouse, it has to be ensured that no data is lost in the process.65
Analytics databases are often referred to as “data warehouses” in a large-scale implementation site or smaller “data marts” for departmental BI needs. BI applications typically include predefined query reports, and when users run the query in a BI application, the database fetches data from storage in the analytics system, the query is processed in the database, and the results are sent to the BI applications to display in visual report format.
Common functions of business intelligence technologies are reporting, online analytical processing, analytics, data mining, business performance management, benchmarking, text mining, and predictive analytics. Most query and reporting tools in BI systems allow users to perform historical, “slice-and-dice” analysis against information stored in a relational database. This type of analysis answers “what?” and “when?” inquiries. A typical query might be, “what was the total revenue for the eastern region in the third quarter?” Often, users take advantage of pre-built queries and reports.66
OLAP, which is part of the broad category of business intelligence, offers an approach to swiftly answer multidimensional analytical queries.67,68 OLAP databases, created as a slight modification of the traditional, online transaction processing (OLTP) database, use a multidimensional data model, allowing for complex analytical and ad hoc queries with a rapid execution time.69,70 The output of an OLAP query is typically displayed in a matrix (or pivot) format. OLAP analytical engines and data mining tools allow users to perform predictive, multidimensional analysis, also known as “drill-down” analysis. These tools can be used for forecasting, customer profiling, trend analysis, and even fraud detection. This type of analysis answers “what if?” and “why?” questions, such as “what would be the effect on the eastern region of a 15% increase in the price of the product?”66
The core feature of OLAP is cubes, which are the physical data structure that stores data within a highly optimized multidimensional format. Cubes primarily include a fact table surrounded by dimension tables. The fact table contains the facts/measurements of the business (e.g., sales order), and the dimension table contains the context of measurements or the attributes that describe the facts or the dimensions on which the facts are calculated (e.g., sales regions/territory, products, customers, months/years). Cubes provide scalable and compressed storage of dimensional data, fast incremental update, query performance, and the ability to compute or store advanced analytics calculations.66
Typically, a report is a two-dimensional representation of data (i.e., a table using columns and rows). Two-dimensional cubes are sufficient only when two factors need to be considered, but analyses using multiple factors are often required. Data cubes can be visualized as multidimensional extensions of two-dimensional tables, just as in geometry a cube is a three-dimensional extension of a square. In other words, a cube is a set of similarly structured two-dimensional tables stacked on top of one another. (See Exhibit 21 and Exhibit 22.)

18 October 2011
Does Size Matter Only? 31
Exhibit 21: Three-Dimensional Data Structure Exhibit 22: Example of OLAP Cube
Source: ComputerWorld. Source: Kognitio Pablo.
What Are the Drawbacks of Traditional Data Warehouses for Big Data That MapReduce/Hadoop Can Overcome? New applications, such as Web searches, recommendation engines, sensors, and social networking, generate vast amounts of data in the form of click-streams, call logs, social media, RSS feeds, GPS readings, weather data, fleet locators, blogs, email, and other multi-structured information streams. This data needs to be processed and correlated to gain insight into today’s business processes.28
Parallel databases have been proven to scale well into the tens of nodes (and near linear scalability is not uncommon). However, there are very few known parallel databases deployments consisting of more than one hundred nodes, and to the best of our knowledge, there exists no published deployment of a parallel database with nodes numbering into the thousands.23
MapReduce/Hadoop are rapidly becoming the technologies of choice by many organizations, including many of the world’s leading consumer Websites and financial services organizations, to cost-effectively collect, store, and process large amounts of multi-structured data.71
Exhibit 23: Comparison of Relational DBMSs and MapReduce/Hadoop Relational DBMS MapReduce/Hadoop Data size Terabytes Petabytes Access Interactive and batch Batch Structure Fixed schema Unstructured schema Language SQL Procedural (Java, C++, Ruby, etc.) Integrity High Low Scaling Near-linear Linear Updates Read and write Write once, read many times Latency Low High
Source: http://www.ebizq.net/blogs/enterprise/2009/09/10_ways_to_complement_the_ente.php.
At a high level, MapReduce/Hadoop exhibit six characteristics versus traditional RDBMS systems, which make the technologies attractive alternatives to address the emerging Big Data trend:
MapReduce/Hadoop are rapidly becoming the technologies of choice by many organizations, including many of the world’s leading consumer Websites and financial services organizations, to cost-effectively collect, store, and process large amounts of multi-structured data.71

18 October 2011
Does Size Matter Only? 32
■ Scale. Organizations are facing an ever-increasing amount of data that they must handle, sift, and either retain and/or dispose of every day. Yet, the vast majority of data an organization generates today is either neglected or not utilized, as the data is often non-standard, time-series, and/or constantly changing. Although this data can provide useful operational insights,1 organizations are struggling with how to manage these vast diverse datasets.9
Existing business intelligence tools and data warehouses are simply not engineered to handle this type of high-volume, variable, and dynamic data.2 Vertical scaling (i.e., scaling up) of a RDBMS, which involves running on the most powerful single server available, is both very expensive and limiting. There is no single server available today or in the foreseeable future that has the necessary power to process so much data in a timely manner.5 Clustering beyond a handful of RDBMS servers is notoriously hard,5 and even the most modern massively parallel processing (MPP) RDBMS system would still struggle with petabytes of data commonly associated with genetics, physics, aerospace, counter intelligence, and other scientific, medical, and government applications.3
In comparison to one large MPP RDBMS systems, hundreds or thousands of small, inexpensive, commodity servers have the power to handle petabyte-scale data if the processing can be horizontally scaled and executed in parallel. Hadoop operates on massive, petabyte-sized datasets by horizontally scaling (i.e., scaling out) the processing across very large numbers of servers through MapReduce. The Hadoop Distributed File System can be used to hold extremely large datasets safely on commodity hardware in the long term that otherwise could not be stored or handled easily in a relational database.3 Using the MapReduce approach, Hadoop splits up a problem, sends the sub-problems to different servers, and lets each server solve its sub-problem in parallel. Hadoop then merges all the sub-problem solutions together and writes out the solution into files, which may in turn be used as inputs into additional MapReduce steps.5
Furthermore, most benchmarks have shown that SQL-based processing of data tends not to scale linearly after a certain ceiling, usually just a handful of nodes in a cluster. In comparison, MapReduce is a powerful method for processing and analyzing extremely large, multi-petabyte datasets, as users can consistently achieve performance gains in the MapReduce framework by simply increasing the size of the cluster.3
■ Data Structure. At its heart, the Big Data revolution is about finding new value outside of conventional data sources. Big Data is structured, semi-structured, unstructured, and raw data in many different formats, and these multi-structured data types are fundamentally different than the scalar, structured numbers and text that organizations have been storing data warehouses the past three decades.10 (See Exhibit 24, Exhibit 25, and Exhibit 26.)
Exhibit 24: Classification of Data Definition Description Structured Relational database (i.e., full ACID support, referential integrity, strong type and schema support) Semi-structured Structured data files that include metadata and are self describing (e.g., netCDF and HDF5) Semi-structured XML data files self describing and defined by an XML schema Quasi-structured Data that contains some inconsistencies in data values and formats (e.g., Web click-stream data) Unstructured Text documents amenable to text analytics Unstructured Images and video
Source: Gartner, Credit Suisse.

18 October 2011
Does Size Matter Only? 33
Exhibit 25: Structured Data Example Exhibit 26: Quasi-Structured Data Example
Source: http://www.alistapart.com/articles/zebrastripingdoesithelp/. Source: Company data.
According to The Economist, only 5% of the information that is created is structured, which further enhances the problem of how to derive quality business insights from the remaining 95% of data, which is multi-structured in nature and is increasing at an exponential rate that far outpaces the growth of structured data. At some point, tacking on non-relational data structures and non-relational processing algorithms to the basic, coherent RDBMS architecture will become unwieldy and inefficient.10 For example, traditional RDBMS are inadequate when interpreting and analyzing the massive quantity of machine-generated IT data. To anticipate what the data might yield and pre-define a matching database structure is a daunting if not impossible task.1
A key differentiator between the RDBMS approach and the MapReduce/Hadoop approach is the deferral of the data structure declaration until query time in the MapReduce/Hadoop systems.10 While an RDBMS stores data in a set of tables with rows and columns, a Hadoop programmer is free to structure data in any manner desired. More specifically, an RDBMS enforces a strict structure when loading data (i.e., tables and columns), whereas Hadoop data loads simply store without any predefined structure. The advantage of the Hadoop approach is that more formats can be handled.28
Data warehouses typically use star or snowflake schemas. The star schema consists of one or more fact tables referencing any number of dimension tables. A star schema can be simple or complex. A simple star consists of one fact table, and a complex star can have more than one fact table. The fact table holds the main data, whereas dimension tables include the attributes that describe the facts and are usually smaller than fact tables. For example, a data warehouse may have a company’s payroll OLTP data as the fact table as illustrated in Exhibit 27, whereas Exhibit 28 illustrates an OLAP star schema with the different dimensions being employee, time, salary, etc. The lines between the fact table and dimension tables indicate the relationship between the tables.

18 October 2011
Does Size Matter Only? 34
Exhibit 27: OLTP Data (i.e., Source Data) Exhibit 28: OLAP Data (i.e., Star Schema)
Source: Pentaho. Source: Pentaho.
The RDBMS and the rules of database normalization identify precise laws for preserving the integrity of structured data.3 Conversely, because of its schema-less design, Hadoop and MapReduce work well on any type of data. MapReduce interprets data at run time based on the keys and values defined in the MapReduce program. Thus, a developer can design the program to work against structured, semi-structured, or even unstructured data.21
■ Cost. We estimate that the market for server and disk storage hardware underneath database workloads for OLTP and data warehousing equals $25.9 billion annually, and the database software market represents another $16.8 billion in annual spending. This $42.7 billion combined market consists of rather expensive database software solutions (particularly parallel DBMSs) and high-end server and storage systems. However, as previously stated, only 5% of the information that is created is structured, and organizations are looking for technologies to tap into the potentially massive source of business value from the remaining 95% data.
MapReduce/Hadoop shines as an infinitely scalable data processing environment for handling large volumes of data that would be prohibitively expensive to store and analyze in a traditional relational database or even a data warehousing appliance.21 Specifically, a strength of MapReduce systems is that most are open source projects available for free, and users with modest budgets or requirements often find open source systems more attractive.13 Open source database technologies have been used to build and successfully run some of the most innovative new applications that have emerged in recent years. Developers with new ideas have been able to quickly develop and then deploy these applications at a low cost with open source databases.5

18 October 2011
Does Size Matter Only? 35
Not only does a Hadoop system require no software licensing fees (i.e., Linux is free, as is Hadoop), but Hadoop is also deployed on commodity servers using local disks. For example, an organization can write a MapReduce program for batch operations, which would be distributed across all of the nodes in a cluster and then run in parallel using local storage and resources. Instead of hitting a single SAN across 8 or 16 parallel execution threads, the MapReduce/Hadoop system might have 20 commodity servers all processing 1/20th of the data simultaneously. Each server is going to process 50 GB. The same batch operation with an RDBMS would involve buying an expensive SAN, a high-end server system with a lot of RAM, and licensing fees to Microsoft, Oracle, or IBM, as well as any other vendors involved. In the end, Hadoop can cost 10 times less to store 1 TB of data than a comparable RDBMS.14
■ Loading Data. RDBMSs are substantially faster than a Hadoop-based system once the data is loaded, but loading the data takes considerably longer in the database systems.13 Many organizations have a data warehouse that stores a version of their transactional data that is then made available for queries and analysis. As previously described, data warehouses are updated with periodic snapshots of operational data from multiple disparate systems through extract, transform, and load (ETL) processes, which can take multiple hours to complete. Loading of data into analytics systems involves index creation, which requires sorting of data. Given the amount of data used in typical loads, the fastest possible sorting algorithms are necessary. As a result, the data in the warehouse can be at least a day or two out of date (or even a week or a month) behind the transactional source systems. While this latency generally is acceptable for trend analysis and forecasting, traditional data warehouses simply cannot keep pace with today’s analytics requirements for fast and accurate data.58
While ETL tools and bulk load applications work well with smaller datasets, few can approach the data volume and performance that Hadoop can, especially at a similar price/performance point.3 MapReduce/Hadoop does not require specialized schema or normalization to capture and store data or a special language to access that data, making it possible to perform high-speed reads and writes.21 Hadoop allows companies to capture and store all their data—structured, semi-structured, and unstructured—without having to archive or summarize the data.21
Hadoop has been particularly useful in environments where massive server farms are being used to collect the data. Hadoop is able to process parallel queries as big, background batch jobs on the same server farm. This saves the user from having to acquire additional hardware for a database system to process the data. Most importantly, Hadoop can also save the user from having to load the data into another system. The massive amount of data that needs to be loaded can make this impractical.5
■ Fault Tolerance. Fault tolerance is the ability of a system to continue to function correctly and not lose data even after some components of that system have failed.72 Fault tolerance in the context of analytical data workloads is measured differently than fault tolerance in the context of transactional workloads. For transactional workloads, a fault-tolerant RDBMS can recover from a failure without losing any data or updates from recently committed transactions, and in the context of distributed databases, can successfully commit transactions and make progress on a workload even in the face of worker node failures. For read-only queries in analytical workloads, there are neither write transactions to commit, nor updates to lose upon node failure. Hence, a fault-tolerant analytical RDBMS is simply one that does not have to restart a query if one of the nodes involved in query processing fails.23
Given the proven operational benefits and resource consumption savings of using cheap, unreliable commodity hardware to build a cluster of database servers, and the trend toward extremely low-end hardware in data centers, the probability of a node failure occurring during query processing is increasing rapidly. This problem only gets
18 October 2011
Does Size Matter Only? 36
worse at scale, given that the larger the amount of data that needs to be accessed for analytical queries, the more nodes are required to participate in query processing. This further increases the probability of at least one node failing during query execution.23
Although traditional MPP database fault-tolerance techniques have been suitable for environments with less than 100 servers, the total cost of ownership increases dramatically beyond that scale.73 In comparison, HDFS is designed to reliably store very large files as a sequence of blocks across machines in a large cluster, and the blocks of a file are replicated for fault tolerance.43 HDFS’s fault resiliency does not impose the requirement of RAID (redundant array of independent disks) drives on individual nodes in a Hadoop compute cluster, allowing the use of truly low-cost commodity hardware.3
■ Java, C++, etc. SQL (structured query language) is by design targeted at structured data; SQL databases tend to refer to a whole set of legacy technologies optimized for a historical set of applications. Under SQL, a DBA utilizes query statements, whereas under MapReduce, a developer needs to write scripts and codes. MapReduce allows users to process data in a more general fashion than SQL queries, and programmers can build complex statistical models from data or reformat an organization’s image data. SQL is not well designed for such tasks.74 Instead, SQL is designed for retrieving data and performing relatively simple transformations on it but not for complex programming tasks.75
There are a large number of programming problems that cannot be easily solved in an SQL dialect, as SQL is designed for retrieving data and performing relatively simple transformations on it, not for complex programming tasks.14 Although the framework is written in Java, Hadoop allows developers to deploy custom-written programs coded in Java, C++, or another imperative programming language to process data in a parallel fashion across hundreds or thousands of commodity servers.28 This makes it easy to solve computationally intensive operations in MapReduce programs.14
While support for Java, C++, and other programming languages instead of SQL may have more limited benefit to larger organizations with large numbers of trained, professional database developers, Hadoop can be a boon to organizations that have strong Java environments with good architecture, development, and testing skills.3 Although developers can use languages such as Java and C++ to write stored procedures for an RDBMS, Dion Hinchcliffe points out that such activity is not widespread.

18 October 2011
Does Size Matter Only? 37
What Applications Can MapReduce/Hadoop Enable/Improve? There are use cases for MapReduce/Hadoop in many industries. For example, some large Websites use MapReduce/Hadoop to analyze usage patterns from log files or click-stream data that is generated by hundreds or thousands of their Web servers. The scientific community can use Hadoop on huge server farms that monitor natural phenomena and/or the results of experiments. The intelligence community needs to analyze vast amounts of data gathered by server farms monitoring phone, email, instant messaging, travel, shipping, etc. to identify potential terrorist threats.5,76 Other fields where Hadoop-based solution can become “killer apps” include, but are not limited to:
■ Advertising and Promotion Targeting
■ Astometry
■ Customer Churn
■ eDiscovery
■ FISMA Compliance
■ Fraud Detection
■ Infrastructure and Operating Management
■ IT Security
■ Log Analysis and Management
■ Network Analysis
■ PCI Compliance
■ Recommendation Engines
■ Risk Analysis
■ Sales Analysis
■ Search Quality
■ SOX Compliance
■ Surveillance

18 October 2011
Does Size Matter Only? 38
What Are MapReduce/Hadoop’s Roles in the Enterprise? dy·nam·ic (adj) \dī-na-mik\ [from French dynamique, from Greek dunamikos, powerful, from dunasthai, to be able] a : marked by usually continuous and productive activity b : an interactive system or process, especially one involving competing forces.
— Merriam-Webster Dictionary and The American Heritage Dictionary
The Next Evolutions of Business Intelligence, Business Analytics, and Data Warehousing Over the past two decades, reporting and analytics tools have evolved from static reports in the 1980s to data warehousing and data marts technology in the 1990s. While data warehousing enabled heterogeneous data sources to be centralized, the implementation projects were often grossly over budget and performance was far below expectations. As technologies have matured and the advent of service-oriented architectures has become more prominent, data warehousing reinvented itself and emerged as business intelligence (BI), which enhances the flexibility in reporting and analytics tools, became very popular in the 2000s.58 (See Exhibit 29.)
Exhibit 29: Next Evolutions of Business Intelligence, Business Analytics, and Data Warehousing
Source: TDWI, HighPoint Solutions, DSSResources.com, Credit Suisse.
As organizations began to need more timely data about their business, they realized that traditional information systems technology were simply too cumbersome to provide relevant data efficiently and quickly. Power BI users traditionally depend upon IT

18 October 2011
Does Size Matter Only? 39
departments to provide them the relevant reports in certain formats. Completing reporting requests could take hours, days, or weeks using old reporting tools that were designed more or less to “execute” the business rather than “run” the business.58
In the late 1980s and 1990s, increased numbers and types of databases emerged along with other technologies. Many large businesses found themselves with data scattered across multiple platforms and variations of technology, making it almost impossible for any one individual to use data from multiple sources. The main idea within data warehousing is to extract data from multiple disparate platforms/applications (e.g., spreadsheets, DB2 or Oracle databases, IDMS records, and VSAM files) and aggregate them in a common location that uses a common querying tool. This separates the operational data from strategic information. In this way, transactional databases (OLTP) could be held on whatever system was most efficient for the operational business, while the reporting/strategic information could be held in a common location using a common language. Data warehouses take this even a step farther by giving the data itself commonality by defining what each term means and keeping it standard (e.g., gender, which can be referred to in many ways, but should be standardized on a data warehouse with one common way of referring to each sex).58
There is an information revolution happening in the BI/analytics/data warehouse environment today. Changing business requirements have placed demands on data warehousing technology to do more things faster and to extract value from more types of data that organizations collected outside of traditional transactional systems. Data warehouses have moved from back-room strategic decision support systems to operational, business-critical functions of the enterprise.59 Use of the data warehouse for strategic decision support creates demand for tactical decision support to execute the business strategy. However, supporting tactical decision making also requires a new approach to architecting data warehouses designed to support extreme real-time service levels in terms of performance, availability, and data freshness.60 Faster data storage technologies, such as DRAM and NAND flash, could enable companies to respond in near real-time to market events by dramatically improving query response and the end user’s experience.77
Furthermore, the amount of data that needs to be stored and processed by analytical database systems is also exploding. This is partly due to the increased automation with which data can be produced (i.e., more business processes are becoming digitized), the proliferation of sensors and data-producing devices, Web-scale interactions with customers, and government compliance demands along with strategic corporate initiatives requiring more historical data to be kept online for analysis.23
■ Fast Data. As we highlighted in our Fast Data report, titled The Need for Speed, published on March 30, 2011, real-time, operational analytics represents one of the next stage of business intelligence/data warehousing, shifting business intelligence to tactical use, geared toward short-term horizons and utilizing information as it is made available to players out “on the field” conducting day-to-day operations. This model for business intelligence is juxtaposed against the first four stages of BI/data warehousing, as detailed in Exhibit 29, which focused on strategic decision support for longer-term goals and company initiatives. Whereas strategic BI looks to the future and centers on decision-making in advance or anticipation of certain outcomes, tactical and operational BI focuses on continuous or frequent data updates and insights that impact the immediate environment and support ongoing, tactical decision-making. As such, the adoption of real-time, operational analytics represents a shift to active data warehousing.60 Real-time, operational decision making has essentially been unattainable because of the time delay in getting data produced by business applications into and then out of traditional disk-based data warehouses. However, applying in-memory and NAND flash technology removes the growing performance barrier caused by the existing disk-based business intelligence/data warehousing architectures.

18 October 2011
Does Size Matter Only? 40
Whereas a strategic decision support environment can use data that is loaded often once per month or once per week, the lack of data freshness due to the performance limitations of traditional, disk-based data warehouses is unacceptable for tactical decision support. Furthermore, to enable real-time, operational analytics, which we view as the next evolution of business intelligence, the response time for queries must be measured in a small number of seconds in order to accommodate the realities of decision-making in an operational field environment.60 (See Exhibit 29.)
The core differentiating element of real-time, operational analytics is the provisioning of up-to-date operational data for immediate use and implementation. Common examples of this include just-in-time inventory management and delivery routing. Both involve a series of complex decisions contingent upon several frequently shifting variables, including sales levels and inventory-on-hand for the former and travel delays and load balancing for the latter. In this operating environment, tactical BI can be used, in effect, to solve optimization problems as per the specific strategic objective. Traditional business intelligence tools, which mainly utilize historical data, do not suffice for these tasks that require consistent, reliably up-to-date data that is applicable to the current business environment. As such, tactical BI requires a data warehouse capable of continuous data acquisition with high query responsiveness and an architecture designed to prevent bottlenecking, latency, and data loss.60
■ Big Data. Organizations are facing an ever-increasing amount of data that they must handle, sift, and either retain and/or dispose of every day. Yet the vast majority of data an organization generates today is either neglected or not utilized, as the data is often non-standard, time-series, and/or constantly changing. Nonetheless, this data can provide useful operational insights into user behavior, security risks, capacity consumption, peak usage times, fraudulent activity, customer experience, and so on.1 As such, organizations are struggling with how to manage these vast and diverse datasets that include traditional structured data as well as semi-structured or unstructured data types, including sensor data, Webpages, Web log files, click-streams, AVI files, search indexes, text messages, email, and so on. These large, untapped datasets define a new category of information, which is increasingly known as “Big Data.” This data offers tremendous potential for deep insights that drive faster, clearer, and more nuanced decision-making. Companies need an approach that allows this information to be effectively understood and analyzed.9
■ Dynamic Data. Regardless of the volume or complexity of data, enterprises still want to keep the latency of the analytical queries to be as low as possible, with the goal of reducing processing times from hours into minutes and minutes into seconds. Therefore, enterprise IT departments are having to deal with two contradictory forces: (1) the volume of and complexity of the types of data is continuously increasing, while (2) the processing of data into usable business analytics needs to be more real-time to react to fast-changing business needs.18
The Fast Data and Big Data revolutions are about finding new value within and outside conventional data sources to respond to dynamic business trends, and over time, because of the two aforementioned contradictory pressures on IT departments, we expect the lines between Fast Data and Big Data begin to blur into a new category that we are referring to as “Dynamic Data,” as we expect existing vendors to supplement data warehouses to support MapReduce to optimize for larger and more diverse datasets, while new data architectures will enhance in-memory analytics for complex models (i.e., rapid cross-correlation between different types of unstructured and structured data).4

18 October 2011
Does Size Matter Only? 41
Exhibit 30: Fast Data + Big Data = Dynamic Data
BIGDATA
+ =
Source: Credit Suisse.
In other words, we expect traditional batch processing platforms to be surpassed by real-time, Big Data analytics that will be able to provide superior performance over live streams of data (as well as accumulated historical event data, which can be queried as the data receives these continuously-updated feeds), given that traditional batch analytics do not deliver intelligence fast enough on incoming data.63 The pattern-based output of applying complex logic to streams of incoming data as well as stored historical data (both structured and multi-structured) can either by delivered to front-line decision makers via dashboards or to applications that execute in-the-moment actions based on event triggers.
Dynamic Data further shifts away from strategic BI tools’ reliance on historical data toward the automation of decision-making processes based on event-driven triggers based on real-time data. The basic concept is to continuously discover what’s happening by leveraging structured and multi-structured data while it’s happening, correlate it with large-scale historical data, and deliver it to decision makers or to applications via event triggers in time to take appropriate actions.
This stage requires data management/analytics technologies that can execute several simultaneous queries within seconds or less across both structured and multi-structured data. An example of this technology is in the retail industry, with electronic shelf labels that do not require manual price and inventory updates. Instead, the electronic shelf labels enact new price changes based on data related to sales, demand, and inventory that guide the automated mark-down strategy decision. Additionally, the shift in pricing strategy may also activate new promotional messaging to buttress the strategy and best respond to consumers. As such, pricing decisions can be made almost immediately on an extremely granular basis based on event triggers and decision support capabilities enabled by an active data warehouse.60
Another example of the value of real-time structured and multi-structured data analysis would be sentiment monitoring. Specifically, an organization would leverage information sources such as call center software, click-streams from corporate Websites, news feeds, social media Websites, and so on to identify strongly positive or negative sentiment regarding organization, product categories, specific items, as well as potential failures and risks. A Dynamic Data system would look for variances in behavior, including an increase in specific text patterns, occurrence of key words/phrases, Web traffic trends, point-of-sales data to determine sentiment changes, and then take action by alerting key public relations staff, sending customers automated updates/responses, informing the customer service organization to directly contact individuals, or alerting a marketing automation system to send out promotions based on historical purchase and current and past behavior.

18 October 2011
Does Size Matter Only? 42
An academic effort, known as continuous query language (CQL), has made impressive progress in defining the requirements for streaming data processing, including clever semantics for dynamically moving time windows on the streaming data. The Kimball Group, for example, expects language extensions and streaming data query capabilities in the load programs to emerge for both RDBMSs and HDFS deployed datasets.10
Is Hadoop the End of the RDBMS as We Know It? No! It’s Actually More Additive/Complementary As previously discussed, large, multi-structured datasets, which typify the Big Data paradigm, are very challenging and expensive to take on with a traditional RDBMS using standard bulk load and ETL approaches. However, despite enormous strengths in distributed data processing and analysis, MapReduce/Hadoop is not effective in some key areas, for which the traditional RDMS is extremely strong.3 (See Exhibit 31.)
Exhibit 31: Comparison of Relational DBMSs and MapReduce/Hadoop Relational DBMS MapReduce/Hadoop Proprietary, mostly Open source Expensive Less expensive Data requires structuring Data does not require structuring Great for speedy indexed lookups Great for massive full data scans Deep support for relational semantics Indirect support for relational semantics (e.g., Hive) Indirect support for complex data structures Deep support for complex data structures Indirect support for iteration, complex branching Deep support for iteration, complex branching Deep support for transaction processing Little or no support for transaction processing
Source: Kimball Group.
At a basic level, Hadoop is not a database; Hadoop is a distributed file system (Hadoop Distributed File System) that scales linearly across commodity servers as well as a programming model (MapReduce) that enables developers to build applications that run in parallel across large clusters.21 In fact, the Apache Website states, “Hadoop is not a substitute for a database.”78 At a high level, traditional RDBMS systems exhibit several characteristics versus MapReduce/Hadoop, which continue to make this long-standing technology an attractive platform for data management:
■ Intermediate/Real-time vs. Batch. An RDBMS can process data in near real-time or in real-time, whereas MapReduce/Hadoop systems typically process data in a batch mode. Some MapReduce implementations have moved some processing to near real-time, however.28 Hadoop is a batch processing system, and Hadoop jobs tend to have high latency and incur substantial overheads in job submission and scheduling. For example, Hive does not offer real-time queries. As a result, latency for Hive queries is generally very high (i.e., minutes), even when datasets involved are very small (i.e., a few hundred megabytes). Therefore, Hive cannot be compared with traditional database systems (e.g., the Oracle Database), where analyses are conducted on a significantly smaller amount of data but the analyses proceed much more iteratively with the response times between iterations being less than a few minutes. In comparison, Hive aims to provide acceptable (but not optimal) latency for interactive data browsing, queries over small datasets or test queries. Hive also does not provide sort of data or query cache to make repeated queries over the same dataset faster.25
■ Single vs. Multiple Access Strategy. The biggest issue with Hadoop is performance. Research from Yale University and the University of Wisconsin-Madison revealed that many of Hadoop’s problems with performance on structured data, in particular, can be attributed to a suboptimal storage layer. The default Hadoop storage layer, HDFS, is the distributed file system.20

18 October 2011
Does Size Matter Only? 43
For a Hadoop job to process a user request, all data is always scanned in parallel (i.e., Hadoop does not support random data access). Although this allows a Hadoop system to scale by simply adding more nodes, if there is ever a need to process a subset of the data, or access some data randomly, then a full scan is still required. At that point, a single data access strategy becomes a limitation. Within the Oracle Database, for example, there are various specialized access strategies to ensure certain operations can be done very quickly (e.g., by index lookup).28 Conversely, because Hive is deployed on top of a distributed file system, Hive is unable to use hash-partitioning on a join key for the collocation of related tables, which is a typical strategy that parallel databases exploit to minimize data movement across nodes. Moreover, Hive workloads are very I/O heavy due to the lack of native indexing.20
Hadoop stores data in files but does not index them. If a user wants to find something, he/she has to run a MapReduce job going through all the data. This takes time and means that one cannot directly use Hadoop as a substitute for a database as a blanket case. Where Hadoop works is where the data is too big for a database (i.e., a user has reached the technical limits), given that the cost of regenerating indexes with very large datasets is so high that a RDBMS cannot easily index changing data. Specifically, in a traditional data warehouse, to preserve consistency within the database, operations that modify data must be allowed to complete without interruption, thereby blocking other read or write operations until the modification is complete.79 However, with many machines trying to write to the database, locking becomes an issue. This is where the idea of vaguely related files in a distributed file system can work.78 In other words, the RDBMS excels at point queries and updates, while Hadoop may be best when data is written once and read many times.3
Nonetheless, by not requiring the user first to model and load data before processing, many of the performance enhancing tools used by traditional database systems (e.g., careful layout of data on disk, indexing, sorting, shared I/O, buffer management, compression, and query optimization) are not possible. Traditional business data analytical processing, which have standard reports and many repeated queries, is particularly poorly suited for the one-time query processing model of Hadoop.23
Basically, RDBMSs are substantially faster than the a Hadoop-based system once the data is loaded and when data is of a certain size, but loading the data takes considerably longer in the database systems, and regenerating indexes of RDBMSs with very large datasets is challenging.13
■ Maybe Structure Is Good Sometimes? The advantage of the MapReduce/Hadoop approach is that more data formats can be handled. While an RDBMS stores data in a set of tables with rows and columns, a MapReduce programmer is free to structure data in any manner desired. This means that an RDBMS enforces a strict structure when loading data, whereas MapReduce/Hadoop data loads simply store without any predefined structure. Because an RDBMS has a structure (i.e., tables and columns), expressing what information should be retrieved from that table is quite easy. Within Hadoop, the programmer has to interpret and write that interpretation in the MapReduce program itself. This also explains why loading data into Hadoop can be faster than loading data into an RDBMS. Nonetheless, with more complexity comes a greater need for expertise in handling such data in a programming language. These programs are typically meaningfully more involved than the general SQL statements used in an RDBMS.28
■ Maybe SQL Is Good Sometimes? Structured query language was one of the first commercial declarative languages designed for managing data in relational database management systems and is essentially the standard query language for requesting information from a database. Under SQL, a DBA utilizes query statements, whereas under MapReduce, a developer needs to write scripts and codes.74 For example, when a DBA issues a simple SQL SELECT call against an indexed/tuned database,
RDBMSs are substantially faster than the a Hadoop-based system once the data is loaded and when data is of a certain size, but loading the data takes considerably longer in the database systems, and regenerating indexes of RDBMSs with very large datasets is challenging.13

18 October 2011
Does Size Matter Only? 44
the response comes back in milliseconds, or if that DBA wants to change that data, he/she issues an SQL UPDATE and the change is made. Hadoop does not offer this simple level of interaction,78 and those who are accustomed to the SQL paradigm may find the generation of MapReduce jobs challenging.74
Specifically, Hadoop provides a command line interface (CLI) to write queries that requires extensive Java programming to function as an analytic solution.16 While the main components of Hadoop provide a flexible framework, most Hadoop-based applications are very specific. Each program is custom written and specifically set up to do a certain task. Access to Hadoop data was not originally intended for traditional business users, as Hadoop does not support such basic functions as indexing or an SQL interface. However, open source projects (e.g., Pig and Hive) are underway to provide an easier interface for users to access Hadoop data through a very basic SQL-like syntax.5 For example, NexR is migrating Korea Telecom’s data from the Oracle Database to Hadoop and converting numerous existing Oracle PL/SQL queries to Hive HQL queries. Though HQL supports a similar syntax to ANSI-SQL, HQL lacks a large portion of basic functions and does not support numerous Oracle analytic functions such as rank(), which are utilized mainly in statistical analysis.80 Despite its similarity to SQL, under the covers, Hive HQL query formulations are converted to a series of MapReduce jobs to run in the Hadoop cluster. An RDBMS, on the other hand, is intended to store and manage data and provide access for a wide range of users (i.e., not just those with extensive programming skills).28
Ultimately, ability to define database operations in terms of higher-level languages simplifies development and is easier to learn. MapReduce, however, is a step in exactly the opposite direction.81 As noted by database experts such as Michael Stonebraker, relational DBMSs have been successful in pushing programmers to a higher, more productive level of abstraction, where they simply state what they want from the system, rather than writing an algorithm for how to get what they want from the system. In a benchmark study, Stonebraker found that writing the SQL code for each task was substantially easier than writing MapReduce code.13
■ Limited Transaction Processing. Hadoop is designed for offline processing and analysis of large-scale data and does not work for random reading and writing of a few records, which is the type of load for online transaction processing. HDFS handles continuous updates (i.e., write-many) less well than a traditional relational database management system. Hadoop is best used as a write-once, read-many-times type of data store, which is similar to data warehouses in the SQL world.74 The Hadoop approach tends to have high latency, which is not suitable for real-time transaction processing compared to relational databases and is strongest at processing large volumes of write-once data where most of the dataset needs to be processed at one time.3
RDBMSs excel at high-volume, real-time transaction processing, while Hadoop excels at more batch-oriented analytical solutions. Hive, for example, is not designed for online transaction processing and does not offer real-time queries and row-level updates and is best used for batch jobs over large sets of immutable data (e.g., Web logs). What Hive values most is scalability (i.e., scale out with more machines added dynamically to the Hadoop cluster), extensibility (i.e., the MapReduce framework and UDF/UDAF/UDTF), fault tolerance, and loose-coupling with its input formats.25 Furthermore, HBase has limited atomicity and transaction support and only supports multiple batched mutations of single rows only.82
■ Embryonic Ecosystem. Most commercial database products are very advanced, having been produced and refined over decades of development in an extremely competitive marketplace, and offer many capabilities that Hadoop does not, including many powerful performance optimizations, sophisticated analytic functions, and ease of use features, including rich declarative features that allow even very complex

18 October 2011
Does Size Matter Only? 45
analysis to be done by non-programmers. Other enterprise class features also exist for security, auditing, maximum availability, disaster recovery, etc. For example, a modern SQL database has available all of the following classes of tools (as well as others):
Database design tools (e.g., Sybase PowerDesigner, Embarcadero, or Toad) to assist the user in constructing a database.83
Replication tools (e.g., Oracle Golden Gate) to allow a user to replicate data from on DBMS to another.83
Data mining tools (e.g., Oracle Data Mining, IBM DB2 Intelligent Miner, SPSS Modeler, SAS Enterprise Miner) to allow a user to discover structure in large datasets.83
Report writers (e.g., SAP Crystal Reports) and visualization tools (e.g., Tableau Software) to design and generate reports and interactive dashboards for human visualization.83
Business intelligence solutions (e.g., Business Objects, Cognos, Hyperion, MicroStrategy) that work with database software and aid in the visualization, ad hoc query generation, result dashboarding, and advanced data analysis. These tools are an important part of analytical data management, since business analysts are often not technically advanced and do not feel comfortable directly interfacing with the database.23 Facebook, for example, uses MapReduce/Hadoop in combination with Scribe and Hive for daily and hourly summaries of its +1 billion monthly visitors.3 However, the summary of the log data is still loaded into an Oracle RAC cluster to be accessed by business intelligence tools.75 (See Exhibit 32.)
Exhibit 32: Data Flow Architecture at Facebook
Source: http://blog.redfin.com/devblog/files/2010/06/facebook.png.
Hadoop cannot use these aforementioned tools.84 For example, business intelligence tools typically connect to databases using ODBC or JDBC, so databases that want to work with these tools must accept SQL queries through these interfaces.23 Until Hadoop becomes more SQL-compatible or until software vendors or internal software developers write all of these tools, Hadoop will remain more difficult to use in an end-to-end task when compared with a more mature RDBMS ecosystem,84 and MapReduce/Hadoop vendors will have a hard time gaining widespread enterprise adoption.19

18 October 2011
Does Size Matter Only? 46
■ API Incompatibility. Although software vendors may be interested in creating tools for MapReduce implementations, the lack of a standardized MapReduce API is a significant limiting factor in both the adoption of MapReduce platforms and the development of a robust ecosystem.19 Specifically, many vendors are creating solutions that are based on non-standard and incompatible APIs and reduce portability,81 and because of this incompatibility, programmers and data scientists using a given MapReduce implementation cannot easily transfer their analytics between platforms.19 For example, Aster Data and Greenplum have both integrated MapReduce into their respective MPP shared-nothing data warehouse DBMSs.85 However, code written for SQL-MapReduce will only work with Aster Data, while code written for use with Greenplum MapReduce will only execute within Greenplum’s parallel dataflow engine.81 Similarly, one cannot execute code written for Hadoop MapReduce on Aster Data, Greenplum, Hadapt, etc.19
Although a typical enterprise will likely have one or two MapReduce-capable platforms and, therefore, internal developers will not be as pressured to move code written from one platform to another, because of the lack of compatibility between MapReduce implementations, ecosystem vendors (e.g., business intelligence, ETL) cannot easily optimize their products across all MapReduce platforms, and library vendors cannot easily create sets of functions that support all MapReduce platforms.19
RDBMSs with MapReduce support, such as Aster Data and Greenplum, have broader ecosystem support because of the fact that they support SQL. However, the support for their enhanced MapReduce capabilities is, in general, still a work in progress. For example, as highlighted by Chris Nuemann, former Director of Business Development at Aster Data, although Aster Data is the furthest ahead in terms of developing an ecosystem as a result of the company’s SQL-MapReduce interface (which is by far the most elegant bridge between SQL and MapReduce currently on the market), even Aster Data has some MapReduce-related features that cannot easily be accessed via most ecosystem tools.19
To grow support for MapReduce by ecosystem vendors, MapReduce-based technologies will likely need to converge on a common set of interfaces:
Programming API. The programming API would determine how one writes MapReduce functions, with the obvious candidate being Apache Hadoop’s interface, since this MapReduce platform has by far the most deployments worldwide, and this number is likely to increase at a rate higher versus other vendors. Therefore, we would expect RDBMS vendors, including Oracle, Aster Data, and Greenplum, to eventually support the Apache Hadoop API, either directly or through a translation layer.
SQL-MapReduce Bridge. An SQL-MapReduce bridge describes how one invokes MapReduce functions from within SQL.19 Because traditional SQL-based tools (e.g., business intelligence) are unlikely to support invocation of MapReduce functions directly, a common bridge interface between SQL and MapReduce is, therefore, a requirement for widespread enterprise adoption. Although Aster Data’s SQL-MapReduce interface is by far the most elegant SQL-MapReduce bridge, we would expect an open source equivalent to eventually become a de facto standard.19
For example, the main driving force behind Hadoop’s Hive project was to facilitate integration with SQL-based ecosystem tools needed before Hadoop could reasonably be used for data warehousing.19 The promise of HiveQL is the ability to access data from within HDFS, HBase, or a relational database via Java Database Connectivity (which is an API for the Java programming language that defines how a client may query and update data in a database), thus allowing interoperability between data within the existing BI domains and Big Data analytics infrastructure. Wide support for HiveQL among BI tools vendors is

18 October 2011
Does Size Matter Only? 47
currently very limited, but we would expect the number of BI vendors supporting HiveQL to increase as the stability and feature set of Hive mature and the adoption of Hadoop increases.11
Ultimately, proponents of parallel databases argue that the strong emphasis on performance and efficiency of parallel databases makes them well suited to perform enterprise-class analytical data management. On the other hand, others argue that MapReduce-based systems are better suited due to their superior scalability, fault tolerance, and flexibility to handle unstructured data.23 In our opinion, the Hadoop framework is not the death of the traditional enterprise RDBMS, and while Hadoop could replace a traditional RDBMS in certain circumstances (and will likely be more competitive in the medium to long term as open source projects advance and evolve and the ecosystem around Hadoop grows), we view MapReduce/Hadoop as opening up new data analytics scenarios that were previously not achievable or practical with existing technologies.3
How MapReduce/Hadoop Can Be Deployed in the Enterprise? In our opinion, MapReduce/Hadoop and SQL databases (e.g., Oracle Database, IBM DB2, Microsoft SQL Server) solve different sets of problems.14 In fact, one could make the case that the commercial RDBMS and MapReduce/Hadoop complement each other.5 For example, if an enterprise needs transactional support, complex rule validation, and data integrity, then an RDBMS is the more appropriate solution.14 However, if that organization needs to process data in parallel, perform batch analysis, or perform computationally expensive transformations over large quantities of data, which would be prohibitively expensive to store on a traditional RAID storage array, then a MapReduce/Hadoop system may be more appropriate.5
In terms of MapReduce/Hadoop’s ability to complement, replace, and/or perform new functions that would not be possible with a traditional RDBMS, we have created a classification of various systems into three primary categories:
■ MapReduce in an MPP Data Warehouse. If an enterprise needs indexes, relationships, transactional guarantees, and lower latency, a database is needed. If a database is needed, a massively parallel processing (MPP) data warehouse that supports MapReduce will allow for more expressive analysis than one that does not.17
■ MapReduce/Hadoop as an ETL Engine. ETL systems add significant value by cleaning, conforming, and arranging the data into a series of dimensional schema.10 Similar to classic ETL, Hadoop is able to extract or capture large batches of data, transform unstructured or semi-structured data, and perform aggregations or logical data consolidation.22 By using Hadoop as an ETL processing engine, an organization can, for example, take Twitter feeds, triage them with a MapReduce/Hadoop infrastructure, and create a relational form that would then work well when loaded into a relational database.8 Such a solution would provide the flexibility in terms of the structure of the data and allows for real-time analytics over data once loaded into the RDBMS.18
■ Direct Analytics over MapReduce/Hadoop. MapReduce/Hadoop can be a key enabler of a number of interesting scenarios that can considerably increase flexibility, fault tolerance, scalability, and the ability to tackle complex analytics over unstructured data were not technically and/or economically feasible with a traditional RDBMS.3 Furthermore, despite being originally designed for a largely different application (i.e., unstructured text data processing), MapReduce can nonetheless be used to process structured data.23 Therefore, if an organization’s primary need is a highly scalable storage and a batch data processing system, running analytics directly on Hadoop can

18 October 2011
Does Size Matter Only? 48
effectively utilize commodity resources to deliver a lower cost per TB for data storage and processing than a system involving a traditional RDMS.17
Ultimately, there are many ways to massively process data in parallel outside of a relational database. Hadoop follows the MapReduce programming paradigm to write programs to process the data. While Hadoop provides flexibility, the solution is very specific and requires software development skills to build a query to access the data. On the other hand, an RDBMS is intended to store and manage mostly structured data and uses standard SQL language to provide access for a wide range of users.28 Ultimately, we believe that larger corporations that have already developed data warehouse and analytics infrastructures must understand how to use MapReduce/Hadoop in order to deal with the data volumes and data types being collected in the context of their existing infrastructures.86
MapReduce in an MPP Data Warehouse
Hadoop’s file system allows users to store very large unstructured datasets and perform MapReduce computations on that data over clusters built of commodity hardware.18 However, the MapReduce paradigm can work on top of any distributed data store.19
In recent years, a significant amount of research and commercial activity has focused on integrating MapReduce and relational database technology. There are two approaches to this problem: (1) starting with a parallel database system and adding some MapReduce features (e.g., Aster Data, Greenplum, Oracle Database 11g’s Table Functions) and (2) starting with MapReduce and adding database system technology (e.g., HadoopDB and Hadapt).20
In terms of the first approach, Greenplum and Aster Data, for example, have added the ability to write MapReduce functions (instead of or, in addition to, SQL) over data stored in their parallel database products. In comparison, HDFS is Hadoop’s version of the Google File System (GFS), a distributed file system. HDFS can exist without Hadoop MapReduce, but Hadoop MapReduce usually requires HDFS. Aster Data’s MapReduce does not require HDFS; instead, Aster Data uses an extensible MPP database for data storage and persistence. Specifically, Aster Data’s SQL-MapReduce is the combination of yet another implementation of the MapReduce paradigm, which is different than both Google’s and Hadoop’s implementations, and Aster Data’s nCluster distributed relational data store.19 (See Exhibit 33.)
Exhibit 33: MapReduce Architectures
Source: baconwrappeddata.com, Credit Suisse.
This approach is often referred to as “in-database analytics,” which essentially entails performing in-database MapReduce by entirely replacing HDFS with an MPP database, whether distributed or just instanced at each node.87 By loading data directly into an RDBMS (even when the primary data payloads are not conventional scalar measurements), the data can be analyzed with specially crafted, user-defined functions from the BI layer or passed to a downstream MapReduce application.10 Furthermore, perhaps the key differentiator to running MapReduce on top of an RDBMS (particularly from a database appliance perspective) instead of HDFS, is that users can exploit the large computational power and I/O capabilities of these higher-performance platforms.8
In recent years, a significant amount of research and commercial activity has focused on integrating MapReduce and relational database technology. There are two approaches to this problem: (1) starting with a parallel database system and adding some MapReduce features (e.g., Aster Data, Greenplum, Oracle Database 11g’s Table Functions) and (2) starting with MapReduce and adding database system technology (e.g., HadoopDB and Hadapt).20
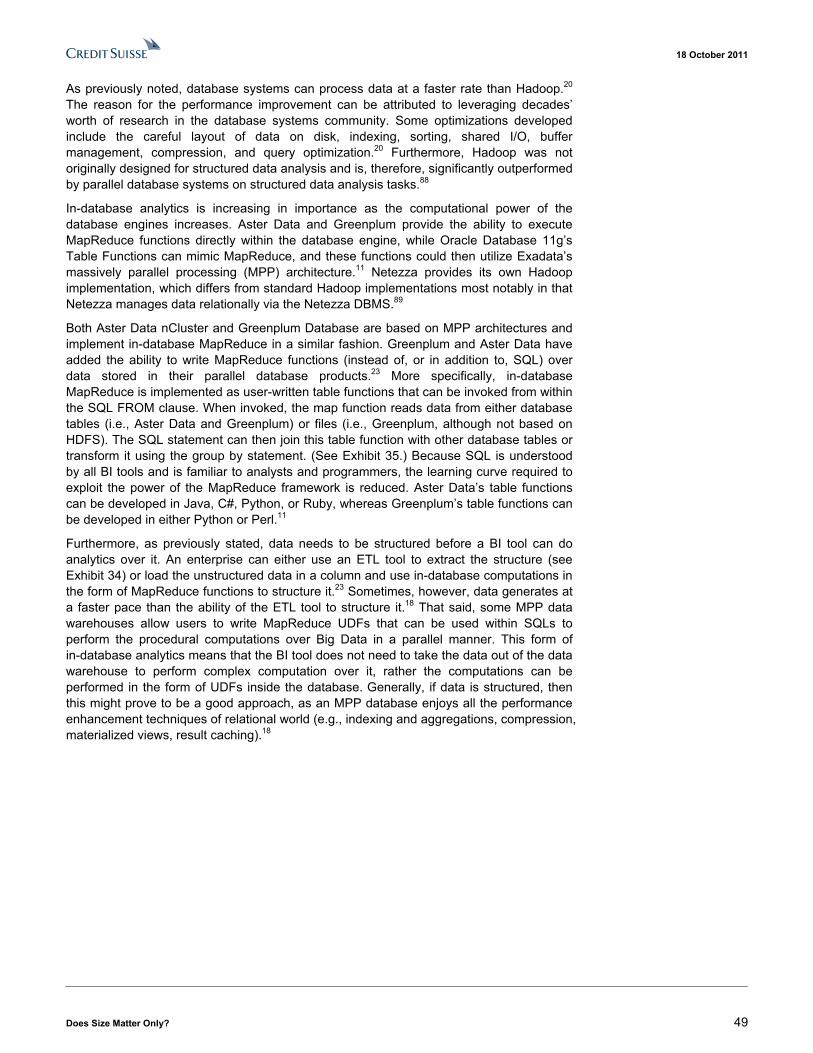
18 October 2011
Does Size Matter Only? 49
As previously noted, database systems can process data at a faster rate than Hadoop.20 The reason for the performance improvement can be attributed to leveraging decades’ worth of research in the database systems community. Some optimizations developed include the careful layout of data on disk, indexing, sorting, shared I/O, buffer management, compression, and query optimization.20 Furthermore, Hadoop was not originally designed for structured data analysis and is, therefore, significantly outperformed by parallel database systems on structured data analysis tasks.88
In-database analytics is increasing in importance as the computational power of the database engines increases. Aster Data and Greenplum provide the ability to execute MapReduce functions directly within the database engine, while Oracle Database 11g’s Table Functions can mimic MapReduce, and these functions could then utilize Exadata’s massively parallel processing (MPP) architecture.11 Netezza provides its own Hadoop implementation, which differs from standard Hadoop implementations most notably in that Netezza manages data relationally via the Netezza DBMS.89
Both Aster Data nCluster and Greenplum Database are based on MPP architectures and implement in-database MapReduce in a similar fashion. Greenplum and Aster Data have added the ability to write MapReduce functions (instead of, or in addition to, SQL) over data stored in their parallel database products.23 More specifically, in-database MapReduce is implemented as user-written table functions that can be invoked from within the SQL FROM clause. When invoked, the map function reads data from either database tables (i.e., Aster Data and Greenplum) or files (i.e., Greenplum, although not based on HDFS). The SQL statement can then join this table function with other database tables or transform it using the group by statement. (See Exhibit 35.) Because SQL is understood by all BI tools and is familiar to analysts and programmers, the learning curve required to exploit the power of the MapReduce framework is reduced. Aster Data’s table functions can be developed in Java, C#, Python, or Ruby, whereas Greenplum’s table functions can be developed in either Python or Perl.11
Furthermore, as previously stated, data needs to be structured before a BI tool can do analytics over it. An enterprise can either use an ETL tool to extract the structure (see Exhibit 34) or load the unstructured data in a column and use in-database computations in the form of MapReduce functions to structure it.23 Sometimes, however, data generates at a faster pace than the ability of the ETL tool to structure it.18 That said, some MPP data warehouses allow users to write MapReduce UDFs that can be used within SQLs to perform the procedural computations over Big Data in a parallel manner. This form of in-database analytics means that the BI tool does not need to take the data out of the data warehouse to perform complex computation over it, rather the computations can be performed in the form of UDFs inside the database. Generally, if data is structured, then this might prove to be a good approach, as an MPP database enjoys all the performance enhancement techniques of relational world (e.g., indexing and aggregations, compression, materialized views, result caching).18

18 October 2011
Does Size Matter Only? 50
Exhibit 34: ETL and MPP Data Warehouse for Big Data
Source: bigdataanalytics.blogspot.com.
However, the cost of such a solution is greater than a Hadoop-based system.18 Although supporting UDFs inside of an MPP data warehouse provides an easier way for programmers to create more expressive queries than SQL allows (while not introducing any of the additional performance limitations of Hadoop’s file system), MapReduce alone does not address the fundamental challenge of scaling out a RDBMS in a horizontal manner.17
Exhibit 35: Aster Data SQL-MapReduce Exhibit 36: HadoopDB Structure
Source: http://www.asterdata.com/blog/2008/08/27/how-asters-in-database-mapreduce-takes-udfs-to-the-next-level/.
Source: http://blog.cubrid.org/.
In terms of the second approach, researchers at Yale University and Brown University suggest that the scalability advantages of MapReduce could be combined with the performance and efficiency advantages of parallel databases to achieve a hybrid system that is well suited from a performance perspective for the analytical DBMS market and can handle the future demands of data intensive applications. For example, the basic idea

18 October 2011
Does Size Matter Only? 51
behind HadoopDB,23 one of the noteworthy open source projects that combine Hadoop and RDBMS technologies,90 is to use MapReduce as the communication layer above multiple nodes running single-node DBMS instances. Queries are expressed in SQL and then translated into MapReduce by extending existing tools, and as much work as possible is pushed into the higher-performing single-node databases.23
HadoopDB is an open source stack that includes PostgreSQL, Hadoop, and Hive, along with some “glue” between PostgreSQL and Hadoop, a catalog, a data loader, and an interface that accepts queries in MapReduce or SQL and generates query plans that are processed partly in Hadoop and partly in different PostgreSQL instances spread across many nodes in a shared-nothing cluster of machines.88 While HadoopDB adds the SQL functions on top of the MapReduce engine, Aster Data uses the MapReduce functions inside an SQL query, the previously described method called “in-database MapReduce.”90 Unlike Aster Data, Greenplum, Pig, and Hive, HadoopDB is not a hybrid simply at the language/interface level but rather at a deeper, systems implementation level.88 To be more precise, HadoopDB uses the functions provided by Hive, a scripting engine developed by Facebook that can execute pseudo-SQL queries in the HDFS/Hadoop system, while using an RDBMS file, instead of an HDFS file, to execute the map function.90
Exhibit 37: HadoopDB Reduce and Map Phases
Source: http://blog.cubrid.org/.
Hadapt, a commercialization of HadoopDB, looks to provide a MapReduce interface atop two distributed data stores.19 Hadapt’s core architecture puts a DBMS on every node and uses MapReduce to “talk” to the whole database. The idea is to get the same SQL/MapReduce integration as Hive but with much better performance and better SQL functionality.91 (See Exhibit 36 and Exhibit 37.) By combining the job scheduler, task coordination, and parallelization layer of Hadoop, with the storage layer of the DBMS, Hadapt is able to retain the best features of both systems.20

18 October 2011
Does Size Matter Only? 52
MapReduce/Hadoop as an ETL Engine
As discussed throughout this report, one of the biggest challenges to performing analytics on Big Data is multi-structured data. Structured data is inherently relational and record-oriented with a defined schema, which makes this type of data easy to query and analyze.18 Additionally, more often than not, unstructured data contains lots of irrelevant material (often 95% or more of the data is useless) that may not be practical or economical to store in an Oracle Database, for example. However, correlating multi-structured data from Hadoop with data in an Oracle-based data warehouse can yield interesting results.28 Therefore, although we expect unstructured and semi-structured data to be increasingly tapped for data warehousing, this does not mean that much of this raw data will actually go directly into a data warehouse. In most cases, the source data will need to be parsed for entity extraction or otherwise transformed into structures that are meaningful in a data warehouse or to a reporting tool.92 For example, relevant and useful data from the Hadoop process can be loaded into Oracle Database for query and analytics.
In other words, to analyze unstructured and/or semi-structured data, some form of structure must first be extracted from it.18 Despite the many advantages of the system, an extended RDBMS cannot be the only solution for Big Data analytics. At some point, tacking on non-relational data structures and non-relational processing algorithms to the basic, coherent RDBMS architecture will become unwieldy and inefficient.10 Systems leveraging MapReduce/Hadoop may not replace commercial databases (e.g., the Oracle Database) but rather coexist with them.5
At its most basic, MapReduce is a process to combine data from multiple inputs (i.e., create a “map”) and then “reduce” that data using a supplied function that will distill and extract the desired results.3 MapReduce is more like an extract-transform-load (ETL) system than a DBMS, as MapReduce quickly loads and processes large amounts of data in an ad hoc manner. Conversely, DBMSs are substantially faster than a MapReduce system once the data is loaded, but that loading the data takes considerably longer in database systems.13
The sheer magnitude of data involved in Big Data makes using the “cheap cycles” of Hadoop server farms very sensible in order to transform masses of unstructured data with low information density into smaller amounts of information-dense, structured data that could then be easily loaded into a traditional DBMS.5 ETL procedures and complex analytics are amenable to MapReduce systems, whereas parallel DBMSs excel at query-intensive workloads over large datasets. Neither is good at what the other does well, and many complex analytical problems require the capabilities provided by both systems. Therefore, a potentially complementary solution would be to interface a MapReduce framework to a DBMS, so that MapReduce can do complex analytics and interface to a DBMS to do embedded queries. The result is a much more efficient overall system than if one tries to do the entire application in either system.13
For example, Michael Stonebraker, a noted database expert, characterizes the canonical use of MapReduce by the following template of five operations: (1) read logs of information from several different sources; (2) parse and clean the log data; (3) perform complex transformations (e.g., “sessionalization”); (4) decide what attribute data to store; and (5) load the information into a DBMS.13 Since the data is usually structured by the time it arrives in the data warehouse environment, adjustments to accommodate the structured data coming from unstructured data sources should be slight,92 and a traditional BI tool would then be able work with the DBMS for conventional structured querying with SQL to provide the analytics.18 (See Exhibit 38.)
To analyze unstructured and/or semi-structured data,some form of structure must first be extracted from it.18 Despite the many advantages of the system, an extended RDBMS cannot be the only solution for Big Data analytics. At some point, tacking on non-relational data structures and non-relational processing algorithms to the basic, coherent RDBMS architecture will become unwieldy and inefficient.10 Systems leveraging MapReduce/Hadoop may not replace commercial databases (e.g., the Oracle Database) but rather coexist with them.5

18 October 2011
Does Size Matter Only? 53
Exhibit 38: MapReduce/Hadoop as ETL Engine for Big Data
Source: bigdataanalytics.blogspot.com.
These steps are analogous to the extract, transform, and load phases in ETL systems, as the Hadoop system is essentially “cooking” raw data into useful information that is consumed by another storage system. Therefore, a MapReduce/Hadoop system can be deployed as a general-purpose parallel ETL system that would reside directly upstream from a DBMS.13
Direct Analytics over MapReduce/Hadoop
As previously discussed, Apache Hive is an open source data warehouse infrastructure built on top of Apache Hadoop that facilitates easy data summarization, ad hoc queries, and the analysis of large datasets stored in Hadoop compatible file systems. Hive provides a mechanism to project structure onto data (i.e., ETL) and query the data using an SQL-like language called HiveQL and executes ad hoc queries against data stored in the Hadoop Distributed File System (HDFS). At the same time, this language also allows traditional MapReduce programmers to plug in their custom mappers and reducers when inconvenient or inefficient to express this logic in HiveQL.24 In the Hadoop world, Pig and Hive are widely regarded as valuable abstractions that allow the programmer to focus on database semantics rather than programming directly in Java.10
For example, certain organizations may want to run business intelligence tools over top of Hadoop, which will execute MapReduce jobs over data placed into the HDFS data store. The complication with this approach, however, is how a BI tool connects to a Hadoop system, given that MapReduce jobs are the only way to process the data in Hadoop, whereas business intelligence supports SQL. In the Hadoop ecosystem, components such as Hive and Pig allow one to connect to Hadoop using high level interfaces. Hive allows users to define the structured metadata layer over Hadoop and also implements an interface (e.g., JDBC), to which a BI tool can easily use to connect. Hive is also extensible enough to allow implementing custom UDFs to work on data and SerDe classes to structure data at run time.18 (See Exhibit 39.)

18 October 2011
Does Size Matter Only? 54
Exhibit 39: Direct Analytics over MapReduce/Hadoop for Big Data
Source: bigdataanalytics.blogspot.com.
Hadoop is a batch processing system, and Hadoop jobs tend to have high latency and incur substantial overheads in job submission and scheduling. As a result, latency for Hive queries is generally very high (i.e., minutes) even when datasets involved are very small (i.e., a few hundred megabytes). As a result, Hive’s high latency and substantial overhead do not compare well with traditional database systems, such as the Oracle Database, where analyses are conducted on smaller amounts of data but the analyses proceed much more iteratively with the response times between iterations being substantially less. In comparison, as previously mentioned, Hive aims to provide acceptable (but not optimal) latency for interactive data browsing, queries over small datasets, or test queries. Hive also does not provide sort of data or query cache to make repeated queries over the same dataset faster.25
Nonetheless, Hadoop could replace a traditional RDBMS in certain data warehousing scenarios and will likely be more competitive in the medium to long term ,as the open source projects advance and evolve and the ecosystems around Hadoop grow.3 However, Hadoop, in its raw form, lacks easy-to-use interfaces for timely and cost-effective analysis.71 Specifically, although Hadoop offers a good out-of-the-box experience and IT organizations could benefit from the scalability and fault tolerance of Hadoop running on a cluster of commodity servers (which do not necessarily need to be homogeneous),18 tuning Hadoop to obtain maximum performance is an arduous task.13 Furthermore, as previously discussed, a pure Hadoop approach will have low cost but will also suffer from high latency, as Hadoop’s architecture transforms and extract structure out of data at run time. Although structuring data at read time rather than write time could be viewed as a positive, given that one does not need to worry about the data schema and modeling until he/she is clear about the analytics needed, direct analytics over Hadoop would be an attractive solution only if batch analysis can suffice. Specifically, while Hadoop allows users to perform deep analytics with complex computations, the fixed initial time taken for each Hive query makes Hadoop unusable for real-time multidimensional analytics because Hive structures the data at read time.18 Although Hive does not offer real-time queries and row level updates, what the developers of Hive value most are scalability (i.e., scale out with more machines added dynamically to the Hadoop cluster), extensibility (i.e., with the MapReduce framework and UDF/UDAF/UDTF), fault tolerance, and loose coupling with its input formats.

18 October 2011
Does Size Matter Only? 55
Despite certain current limitations of Hadoop, the open source community is innovating quickly, rapidly bringing to market new capabilities that make Hadoop more “database-like.” For example, as previously mentioned, the community has introduced Hive, an SQL-like language that generates MapReduce programs “under the covers” and makes Hadoop appear more like a relational engine, and has also released Pig,21 a dataflow language that addresses complex data transformations procedurally, which enable programmers to more easily create MapReduce transformation logic rather than writing low-level Java.21 We would expect further advancements from the open source community to make performing direct analytics over Hadoop both easier and higher performance than the current iteration of the platform.
Ultimately, Hadoop and SQL databases (e.g., Oracle Database, IBM DB2, Microsoft SQL Server) solve different sets of problems and could be deployed in a complementary nature. If an organization needs transactional support, complex rule validation, and data integrity, an RDBMS or indirect analytics over Hadoop (i.e., utilizing Hadoop as an ETL engine) would be the more appropriate solutions. However, if that organization needs to process data in parallel, perform batch and ad hoc analysis, or execute computationally expensive transformations over a massive datasets, then direct analytics over Hadoop would be the more effective architecture.14
Hadoop and SQL databases (e.g., Oracle Database, IBM DB2, Microsoft SQL Server) solve different sets of problems and could be deployed in a complementary nature. If an organization needs transactional support, complex rule validation, and data integrity, an RDBMS or indirect analytics over Hadoop (i.e., utilizing Hadoop as an ETL engine) would be the more appropriate solutions. However, if that organization needs to process data in parallel, perform batch and ad hoc analysis, or execute computationally expensive transformations over a massive datasets, then direct analytics over Hadoop would be the more effective architecture.14

18 October 2011
Does Size Matter Only? 56
Which Vendors Have What? The economics of data (not the economics of applications, software, or hardware) will drive competitive advantage.
— Dave Newman, Research Vice President of Gartner
Amazon Amazon, which is covered by Credit Suisse Media & Internet Analyst Spencer Wang, has expanded its AWS services to include Amazon Elastic MapReduce, which is a hosted Hadoop framework on the Amazon Elastic Compute Cloud (Amazon EC2) and Amazon Simple Storage Service (Amazon S3). Amazon prices the framework as an added cost over regular EC2 instances. Currently, network bandwidth between EC2 and S3 are free of charge.93 The growth of MapReduce usage might change that, however, as the load on Amazon’s internal network grows.
To create a new job, a developer only needs to define input and output location on Amazon S3, a map function and a reduce function. Following those, the developer needs to define the cluster size and simply run the job.93 (See Exhibit 40.)
Exhibit 40: Amazon Elastic MapReduce
Source: http://rww.readwriteweb.netdna-cdn.com/images/amazon-MapReduce-apr09.jpg.
Amazon supports both Java and non-Java MapReduce functions. Non-Java languages such as Python, Ruby, Perl and others can be used to define the MapReduce. For the non-Java languages, the functions of a streaming job flow read the input data from stdin and send the output to stdout. Therefore, data flows in and out of the functions as strings, and, by convention, a tab separates the key and value of each input line.94

18 October 2011
Does Size Matter Only? 57
Exhibit 41: Amazon S3 Mapper and Reducer Job Flow Creation
Source: http://www.infoworld.com/sites/infoworld.com/files/media/image/mapreduce_lg.gif.
Exhibit 42:Amazon EC2 and Amazon Elastic MapReduce Pricing
Source: http://rww.readwriteweb.netdna-cdn.com/images/aws-mapreduce-pricing-apr09.jpg.
Cloudera Cloudera is a leading vendor of enterprise-level Hadoop implementation and support. Cloudera’s Distribution, including Apache Hadoop (CDH), offers an integrated Apache Hadoop-based stack containing all the components needed for production use, tested and packaged to work together.95
The company has not only been one of the major contributors to the Hadoop open source project but has also built a unique analytics tool set over the platform, an SQL-to-Hadoop translator, and RDBMS connectors to Oracle. Cloudera also offers enterprise support for Hadoop clusters running Cloudera’s distribution, providing access to the company’s knowledge base and support team, as well as problem resolution subject to an SLA agreement for mission-critical requirements.95 At a high level, one can think of Cloudera trying to position itself to Hadoop as Red Hat is to Linux. In fact, Cloudera markets itself as the “#1 Apache Hadoop-based distribution in commercial and non-commercial environments.”

18 October 2011
Does Size Matter Only? 58
Cloudera Enterprise 3.5, which was released in June 2011, includes new automated configuration and monitoring tools and what the company describes as “one-click” security for clusters of machines running Hadoop. Cloudera Enterprise 3.5 is a subscription service and includes a management suite, production support, and a monitoring dashboard, that offers a real-time view of the performance of workloads in Hadoop.96
Exhibit 43: Cloudera’s Distribution including Apache Hadoop (CDH) Components
Source: Cloudera.
Many open source products are difficult to install and lack support for a production environment. Cloudera has taken open source software and wrapped the code with a toolset and API to manage a Hadoop cluster. Cloudera has also advanced Amazon Machine Instances for Amazon EC2 and VMware vCloud API support to setup a Hadoop cluster in the cloud. Cloudera has created a suite of tools aimed at enterprise users who want to collect, store, and analyze data from a variety of sources.97 Because community support is often not sufficient enough for most enterprises, Cloudera brings a commercially viable distribution and tools to the market while still being one of the primary contributors to the open-source Apache project.97
Cloudera Enterprise is a subscription service, comprising Cloudera Support and a portfolio of software including Cloudera Management Suite. By combining the support with a software layer that delivers visibility into and across Hadoop clusters, Cloudera Enterprise gives operators a way to provision and manage cluster resources. Cloudera Enterprise also allows organizations to apply business metrics (e.g., SLAs and chargebacks) to Hadoop environments. Additionally, Cloudera Enterprise includes built-in predictive capabilities that anticipate shifts in the Hadoop infrastructure to ensure reliable operation.95 Cloudera Management Suite includes:
■ Cloudera Distribution including Apache Hadoop (CDH). CDH is Cloudera’s free solution and is an easy to install and fully integrated Cloudera Hadoop stack that includes apache Hadoop, Apache Hive (SQL-like language and metadata repository), Apache Pig (high-level language for expressing data analysis programs), Apache HBase (Hadoop database for random, real-time read/write access), Apache Zookeeper (highly reliable distributed coordination service for large clusters), Apache Whirr (library for running Hadoop in the cloud), Flume (distributed service for collecting

18 October 2011
Does Size Matter Only? 59
and aggregating log and event data), Hue (browser-based desktop interface for interacting with Hadoop), Oozie (server-based workflow engine for Hadoop activities), and Sqoop (service for integrating Hadoop with RDBMS).95
■ Service and Configuration Manager (SCM). SCM simplifies the deployment and management of a range of Hadoop services available in Cloudera’s Distribution, including Apache Hadoop (CDH). Users can now get, install, and configure Apache Hadoop in minutes from a central dashboard and continue to make configuration updates while the system is running. Developed from Cloudera’s many years of experience with enterprise Hadoop systems in production, SCM automates best practices for several Hadoop operations and includes a library of validations that prevent misconfiguration. SCM also automates tedious manual administrative processes to save time and reduce errors. For example, SCM automates the enablement of Hadoop security for a multi-node cluster in just one click.98
■ Activity Monitor. Activity Monitor provides a deep, real-time view into Hadoop systems. The Activity Monitor is the only tool on the market today that consolidates all user activities (e.g., MapReduce, Pig, Hive, Streaming, Oozie) into a single, real-time view of what is happening across a Hadoop cluster at both a macro and micro level. With Activity Monitor, not only can administrators monitor their entire Hadoop infrastructure, they can also intervene, since it provides the granular intelligence required to enact the proper changes via SCM. Moreover, a built-in historical view of Hadoop jobs enables administrators to compare current activities to the past to gauge aspects like speed, efficiency, and health of the system.98
Exhibit 44: Cloudera Service & Configuration Manager Exhibit 45: Cloudera Activity Monitor
Source: Cloudera. Source: Cloudera.
■ Resource Manager and Authorization Manager. Resource Manager and Authorization Manager enable organizations to track historical usage of disk space, automate the administration of ACLs, and better synchronize with their existing LDAP systems.95

18 October 2011
Does Size Matter Only? 60
Exhibit 46: Cloudera Enterprise Components
Source: Cloudera.
Cloudera Enterprise combines support with software that provides transparency and management capabilities. As a company’s use of Hadoop grows and an increasing number of groups and applications move into production, an IT department’s internal customers will expect greater levels of performance and consistency, for which Cloudera’s proactive production-level support provides expertise and responsiveness. Cloudera’s highly trained Hadoop support team, which is backed by the company’s engineering organization, includes contributors and committers to the various open source packages that are part of Cloudera’s Distribution including Apache Hadoop (CDH). When Cloudera delivers a patch or workaround, for example, for the open source code to a support customer, the company also prepares and submits the fix to the appropriate project. This ensures the Apache project will include the fix to a user’s specific problem in a future release.99 Cloudera Support includes:
■ Flexible Support Windows. 8x5 or 24x7 to meet SLA requirements.
■ Configuration Checks. Verify that Hadoop cluster is fine-tuned for environment.
■ Escalation and Issue Resolution. Resolve support cases.
■ Knowledgebase. Expand Hadoop knowledge with articles and tech notes.
■ Support for Certified Integration. Connect Hadoop cluster to existing data analysis tools.
■ Proactive Notification. Operators up to speed with new developments and events.

18 October 2011
Does Size Matter Only? 61
In addition to the Cloudera Management Suite, Cloudera SCM (Service and Configuration Manager) Express, a free, 500K download, simplifies the installation and configuration of a complete Hadoop stack, including configuration changes, restarts, adding new servers, etc.96 SCM Express is an install tool for rapid, automated installation of a fully functional Hadoop cluster and can bring up a Hadoop cluster of up to 50 nodes without editing a single configuration file or even having to know what a Hadoop configuration file looks like. Additionally, the cluster can be tuned to reflect the hardware on which it is running. Many of the best practices and recommendations from Cloudera’s Solutions Architects have been codified into SCM Express so that services deployed can immediately benefit from their experience and insights.100
Cloudera also provides Cloudera Desktop, a unified and extensible graphical user interface for Hadoop. The product is free to download and can be used with either internal clusters or clusters in public clouds. Cloudera Desktop targets beginning developers and non-developers in an organization that would like to get value from data stored in their Hadoop cluster. Since Cloudera Desktop is Web-based, users avoid the installation and upgrade cycle, and system administrators avoid custom firewall configurations. Cloudera worked closely with the MooTools community to create a desktop environment inside of a Web browser that should be familiar to navigate for most users. The desktop environment is extensible to hundreds of applications and allows for data to be shared between applications.95 (See Exhibit 47.)
Exhibit 47: Cloudera Desktop
Source: Cloudera.
Additionally, Cloudera offers professional services to customers through a team of Solutions Architects who provide guidance and hands-on expertise to address unique enterprise challenges related to Hadoop. For example, as previously discussed, deploying a new Hadoop cluster requires configuring the system to enterprise-grade standards, and Cloudera’s New Hadoop Deployment service assists in setting up a high-performance, tuned, and tested Hadoop cluster that is ready for production.95
EMC Greenplum
EMC, which is covered by Credit Suisse IT Hardware Analyst Kulbinder Garcha, acquired privately held Greenplum on July 29, 2010 for an undisclosed amount. Greenplum develops database software for business intelligence and data warehousing applications. Greenplum’s MPP data warehouse DBMS is based on open source DBMS PostgreSQL

18 October 2011
Does Size Matter Only? 62
running on Linux and Unix and primarily served the telecommunications and financial services industries.101
Greenplum Database utilizes a shared-nothing MPP (massively parallel processing) architecture that has been designed for BI and analytical processing using commodity hardware. In this architecture, data is automatically partitioned across multiple “segment” servers, and each segment owns and manages a distinct portion of the overall data. The system automatically distributes data and parallelizes query workloads across available hardware. All communication is via a network interconnect and, thus, is a shared-nothing architecture (i.e., there is no disk-level sharing or contention to be concerned with).73
Exhibit 48: Greenplum Database
Source: EMC.
The shared-nothing MPP architecture enables data storage, loading, and processing with significant linear scalability. Adaptive services provide enterprises with high availability, workload management, and online expansion of capacity. Key product features enable petabyte-scale loading, hybrid storage (row or column), and embedded support for SQL, MapReduce, and programmable analytics. Additionally, major third-party analytic and administration tools are supported through standard client interfaces.102
The core principle of the EMC Greenplum Database is to move the processing closer to the data and its users, enabling the computational resources to process queries in a parallel manner, use storage connections simultaneously, and flow data efficiently between resources. This results in complex processing pushed down closer in proximity to the data for increased efficiency and performance.102
The database architecture consists of:
■ Core Massively Parallel Processing Architecture. The architecture provides automatic parallelization of data and queries so that all data is automatically partitioned across all nodes of the system, and queries use all nodes working together.73
■ Parallel Query Optimizer. The parallel query optimizer converts SQL or MapReduce into a physical execution plan by using a cost-based optimization algorithm.73

18 October 2011
Does Size Matter Only? 63
■ Petabyte-Scale Loading. High-performance loading uses MPP Scatter/Gather Streaming technology.73
■ Polymorphic Data Storage and Execution. DBAs can select the storage, execution, and compression settings that suit the way that table will be accessed. With this feature, customers have the choice of row- or column-oriented storage and processing.73
■ Anywhere Data Access. Anywhere data access enables queries to be executed from the database against external data sources, returning data in parallel regardless of location, format, or storage medium.73
Greenplum is one of the first vendors not only to supports both row-store and column-store tables in the same database but also to implement MapReduce internally for large-scale analytics and to offer external file processing integrated with the DBMS, enabling Greenplum to manage complex, unstructured data and to connect other implementations of Hadoop MapReduce.101
In terms of in-database analytics, Greenplum natively executes both MapReduce and SQL directly within Greenplum’s parallel dataflow engine and supports PL/Java, optimized C, and Java function support. Greenplum Database external tables support reading files from and writing files to a Hadoop File System (HDFS), which allows administrators to load data in parallel from HDFS as well as use Greenplum MapReduce jobs to access data on HDFS using the SQL and Greenplum advanced analytic functions.102
Exhibit 49: Greenplum MapReduce + SQL
Source: Greenplum.
In May 2011, as a step in more formally integrating Hadoop with the EMC Greenplum Database, EMC introduced the EMC Greenplum HD product family, including the EMC Greenplum HD Data Computing Appliance (which integrates Apache Hadoop with the Greenplum Database), as well as EMC Greenplum HD Community Edition and EMC Greenplum HD Community Edition. Greenplum HD software includes global support and value add beyond a simple packaging of the Apache distribution. The Community Edition is a 100% open source certified and supported version of the Apache Hadoop stack comprising HDFS, MapReduce, Zookeeper, Hive, and HBase. EMC Greenplum provides fault tolerance for the Name Node and Job Tracker, both single points of failure in standard Hadoop implementations. The Enterprise Edition is a 100% interface-compatible implementation of the Apache Hadoop stack and includes advanced features, such as snapshots, wide area replication, automatic failure detection, and so on, to deliver improved performance as compared with the standard packaged versions of the Apache Hadoop distribution.103

18 October 2011
Does Size Matter Only? 64
Exhibit 50: Example of Greenplum MapReduce
Source: http://blog.cubrid.org/.
EMC Greenplum offers the ability to present Hadoop Distributed File System data to the Greenplum Database as external tables, allowing for the reading from and writing to the Hadoop Distributed File System directly from the Greenplum Database, with the Hadoop Distributed File System supporting full SQL syntax. This combination leverages the full parallelism of the Greenplum Database and HDFS, utilizing the resource of all Greenplum segments when reading and writing data with HDFS. Data is read into the Greenplum Database as an external table directly from the Hadoop Distributed File System DataNode, and it is written out from the Greenplum Database Segment Servers to the Hadoop Distributed File System. This relies on the Hadoop Distributed File System to distribute data load evenly across the DataNodes.104 (See Exhibit 51.)
Exhibit 51: Example of Read from HDFS into the Greenplum Database
Source: Greenplum.
18 October 2011
Does Size Matter Only? 65
Hewlett-Packard Vertica
On February 14, 2011, Hewlett-Packard, which is covered by Credit Suisse IT Hardware Analyst Kulbinder Garcha, announced the acquisition of privately held Vertica, a real-time analytics platform vendor, for an undisclosed amount. The Vertica Analytics Database is a column-based database that provides users near real-time loading and querying abilities. The database is a software-only solution and, as such, allows customers to deploy it to the Amazon Cloud or to host it in-house.105
HP stated that the acquisition would enhance the company’s capabilities for information optimization, adding sophisticated, real-time business analytics for large and complex datasets in physical, virtual, and cloud environments. Vertica’s platform helps customers analyze massive amounts of data resulting in “just-in-time” business intelligence.105
Vertica attributes its performance scalability, reliability, and usability advantages to the following:
■ Column-Based Orientation. Vertica organizes data on disk as columns of values from the same attribute, as opposed to storing it as rows of records. When a query needs to access only a few columns of a particular table, only those columns need to be read from disk. Conversely, in a row-oriented database, all values in a table are typically read from disk, which wastes I/O bandwidth.106
■ Compression. Vertica uses aggressive compression of data on disk, as well as a query execution engine that is able to keep data compressed while it is operated on. Values within a column tend to be quite similar to each other and, therefore, compress very well. In a row-based database, values within a row of a table are not likely to be similar, and hence are unlikely to compress well. Columnar compression and direct operation on compressed data shift the bottleneck in query processing from disks to CPUs.106
■ Table Decomposition. Because data is compressed so aggressively, Vertica has sufficient space to store multiple copies of the data to ensure fault tolerance and to improve concurrent and ad hoc query performance. Logical tables are decomposed and physically stored as overlapping groups of columns, which are sorted on different attributes for optimal query processing.106
■ Shared Nothing, Grid-based Architecture. A shared-nothing, grid-based database architecture that allows Vertica to scale effectively on clusters of commodity CPUs.106
■ Hybrid Data Store. Newly inserted records are added to a write optimized portion of the database to allow continuous, high-performance insert operations concurrently with querying to enable real-time analytics.106
■ Automated Physical Database Design Tools. These tools recommend how data should be organized both locally on each node in a cluster, as well as horizontally partitioned across a cluster. These tools ensure that all data is replicated on multiple nodes so that node failures can be tolerated by the system without interrupting functionality. The tools are designed to reduce administrative costs by simplifying physical database design decisions.106
■ High-Performance, ACID-compliant Database. The database system has a light-weight transaction and concurrency control scheme that is optimized toward loading and querying data. Vertica’s failure recovery model is based on replication rather than traditional log-based methods.106

18 October 2011
Does Size Matter Only? 66
■ Flexible Deployment Options. Deployment options include downloaded and installed on Linux servers, pre-configured and shipped on HP BladeSystem hardware, and licensed and used on an on-demand basis, hosted in the Amazon EC2.106
■ Administration Tools. Monitoring and administration tools and APIs control performance, backup, disaster recovery, etc.106
Exhibit 52: Vertica Analytic Database Architecture and System Overview
Source: Vertica.
Exhibit 52 illustrates the basic system architecture of Vertica on a single node. As in a traditional relational database, queries are issued in SQL to a front end that parses and optimizes queries. Vertica is internally organized into a hybrid store consisting of two distinct storage structures. The Write-Optimized Store (WOS) is a data structure that generally fits into main memory and is designed to support insert and update operations. The data within the WOS is unsorted and uncompressed. Conversely, the Read-Optimized Store (ROS) contains the bulk of the data in the database, which is both sorted and compressed.106
Both the WOS and ROS are organized into columns, with each column representing one attribute of a table. For example, for a table of sales data with the schema (e.g., order-id, product-id, sales-date, customer-id, sales-price), Vertica would store this as at least five distinct columns, though they would logically appear as one table to the user. (See Exhibit 53.) By storing these columns separately, Vertica is able to access only those columns that are needed to answer a particular query. If certain columns are always read together, then these can be grouped together so they are retrieved in a single I/O.106

18 October 2011
Does Size Matter Only? 67
Exhibit 53: Logical Tables Stored as Columns
Source: Vertica.
The Vertica Database Designer (DB Designer) recommends a physical database design, including projections, compression, and partitioning, that will provide good performance for the queries that the customer most commonly issues over the database and covers ad hoc queries that users may run. The database administrator is able to override any of the decisions made by the DB Designer, but in many cases, the designer can do a good job of optimizing performance, thus reducing the time administrators spend on physical database tuning. Based on the logical schema, a set of sample data from the tables, and a set of typical queries, the DB Designer recommends a physical schema consisting of a set of projections and a partitioning of those projections across multiple machines that provides good performance on the training set.106

18 October 2011
Does Size Matter Only? 68
Exhibit 54: Vertica Database Designer
Source: Vertica.
Vertica was the first to add connectivity to Cloudera’s distribution of Hadoop MapReduce, enabling users to take advantage of Hadoop MapReduce without implementing it inside the DBMS.101 Cloudera and Vertica have integrated the two products so that data can be moved easily between them and so that Hadoop’s MapReduce operators can work on data stored directly in the Vertica parallel RDBMS. Users can work with large-scale unstructured data directly in Hadoop, explore relational data in real-time using Vertica, and exploit the complex algorithmic processing power of Hadoop’s MapReduce over relational data stored natively in Vertica.22
As a data source for tools such as Hadoop, Vertica provides near linearly scalable, structured storage and a bridge between large batch data processing and high speed data analytics. Because the Vertica Analytic Database runs on a grid of shared-nothing machines, Vertica can scale to large numbers of nodes, all operating in parallel. Vertica communicates using SQL over standard protocols such as JDBC for Java and ODBC for other languages.22
Each Vertica and Hadoop instance is able to store and process data on its own. Vertica excels at capturing structured data with a well-defined schema, and Hadoop handles high-volume and unstructured feeds where schemas need not be enforced until processing time. Each delivers analysis and processing services. Vertica concentrates on high-speed interactive analyses, and Hadoop delivers exhaustive batch-style complex processing.22
The Vertica cluster is optimized for data density, high-speed predicates, moving aggregates and relational analytics. These queries run in seconds and can stream out terabytes of data in parallel to multiple Hadoop clusters. Each Hadoop cluster is sized independently for the scale and timeliness of computation. The results can stream back into Vertica, and the storage is automatically optimized.22
Data is logged into HDFS and processed in batches across thousands of machines using Hadoop. The output of this processing is stored in a Vertica cluster, represented in a highly efficient format, optimized for ad hoc analysis and real-time dashboards. As data grows the Vertica cluster scales out to improve load speeds, manage more data, and accommodate more users running more complex analyses.22
Unstructured and some semi-structured data is processed by Hadoop then loaded into the Vertica database. Structured and some semi-structured data streams directly into Vertica. Data streams between the database and MapReduce for processing.22
Hortonworks On June 28, 2011, Yahoo! announced that it had joined with Benchmark Capital, an early-stage investment firm, to create Hortonworks. Hortonworks was formed by key

18 October 2011
Does Size Matter Only? 69
members of Yahoo!’s Hadoop software engineering team to accelerate the development and adoption of Apache Hadoop. After spinning out from Yahoo!, Hortonworks announced that it will continue to focus on support and development of the Hadoop open source project, making the platform more stable and manageable. The team is committed to pushing Hadoop to an “enterprise-ready” state, which, in turn, will further boost adoption by organizations that are currently skeptical of the IT costs of running Hadoop clusters.107
Exhibit 55: Hortonworks’ Mission and Strategy
Source: Hortonworks.
While at Yahoo!, the team led the efforts to design and deliver every major Apache Hadoop release from 0.1 to the most current, stable release. The company devotes itself to further developing Hadoop, while offering training and support to a growing base of users. Over 70% of Hadoop code was developed originally at Yahoo!, which settled on Hadoop as the best direction to take as it implemented MapReduce and a new architecture for massively scalable clustered storage.107
Exhibit 56: Hortonworks’ Technology Roadmap
Source: Hortonworks.
Hortonworks main objectives include:
■ Making Apache Hadoop Projects Easier to Install, Manage, and Use. The company intends to implement regular sustaining releases, compiling code for each product and testing at scale.107
■ Making Apache Hadoop More Robust. Hortonworks believes they can improve performance gains, high availability, as well as administration and monitoring.107
■ Making Apache Hadoop Easier to Integrate and Extend. The company has committed to open APIs for extension and experimentation.107

18 October 2011
Does Size Matter Only? 70
All of these objectives will be implemented within the Apache Hadoop community. The company has stated its intention to develop collaboratively with the community with complete transparency and that all code will be contributed back to Apache.107 Hortonworks’ announced business model will be nearly identical to Cloudera’s, providing support contracts and educational courses over an open source platform.
IBM IBM’s platform to address Big Data opportunity includes two major technologies: (1) IBM InfoSphere BigInsights and (2) IBM InfoSphere Streams. IBM InfoSphere BigInsights is mainly the solution for managing and analyzing large volume of structured and unstructured data and provides developer- and user-friendly solution for large-scale analytics. On the other hand, IBM InfoSphere Streams addresses the real-time streaming of massive volumes of data and enables sub-millisecond response times. InfoSphere Streams provides scalable infrastructure to support continuous analysis of both structured and unstructured data and enable response to events in real-time.
Exhibit 57: IBM Big Data Ecosystem Exhibit 58: IBM Big Data Platform
Source: IBM. Source: IBM.
Although both products are built to run on large-scale distributed systems, designed to scale from small to very large data volumes, handling both structured and unstructured data analysis, IBM InfoSphere Streams and IBM InfoSphere BigInsights are designed to address this class of problems, namely data-in-motion (i.e., current, streaming data) and data-at-rest (i.e., historical data). In addition to separate use cases, an application developer can create an application spanning the two platforms to give timely analytics on data-in-motion while maintaining full historical data for deep analysis. At a high level, the main interactions between IBM InfoSphere Streams and IBM InfoSphere BigInsights would be: (1) data is ingested into BigInsights from Streams; (2) Streams triggers deep analysis in BigInsights; and (3) BigInsights updates the Streams analytical model.108
For example, deep analysis is performed using BigInsights to detect patterns on data collected over a long period of time. Statistical analysis algorithms or machine-learning algorithms are compute-intensive and run on the entire historical dataset to generate models to represent the observations. Once the model has been built, it is used by a corresponding component on Streams to apply the model on the incoming data in a lightweight operation to take appropriate action in real-time. Furthermore, after the model is created in BigInsights and incorporated into the Streams analysis, operators on Streams continue to observe incoming data to update and validate the model. If the new observations deviate significantly from the expected behavior (i.e., the real world has deviated sufficiently from the model’s prediction that a new model needs to be built), the online analytic on Streams may determine that a new model building process needs to be triggered on BigInsights based on the combination of the new and previous datasets.108 (See Exhibit 59.) This interaction between Big Data (i.e., IBM InfoSphere BigInsights) and
The main interactions between IBM InfoSphere Streams and IBM InfoSphere BigInsights would be: (1) data is ingested into BigInsights from Streams; (2) Streams triggers deep analysis in BigInsights; and (3) BigInsights updates the Streams analytical model.108

18 October 2011
Does Size Matter Only? 71
Fast Data (i.e., IBM InfoSphere Streams) aligns as closely to our vision of Dynamic Data as we have seen to date from any vendor.
Exhibit 59: IBM InfoSphere Streams and IBM InfoSphere BigInsights Interaction
Source: IBM.
IBM InfoSphere BigInsights
IBM InfoSphere BigInsights is a Big Data analysis platform powered by Hadoop. The product is essentially a bundled package of open source products that enable easy deployment, development, and monitoring of Hadoop. InfoSphere BigInsights allows organizations to run large-scale, distributed analytics jobs on clusters of cost-effective server hardware. This infrastructure can be leveraged to tackle very large datasets by breaking up the data into chunks and coordinating the processing of the data across a massively parallel environment. Once the raw data has been stored across the nodes of a distributed cluster, queries and analysis of the data can be handled efficiently, with dynamic interpretation of the data format at read time. This enables organizations to get their arms around massive amounts of untapped data and mine that data for valuable insights in a more efficient, optimized, and scalable way. While BigInsights supports unstructured or semi-structured information, the solution does not require schema definitions or data preprocessing and allows for structure and associations to be added on the fly across information types. The BigInsight platform runs on commonly available, low-cost hardware in parallel, supporting linear scalability that allows organizations to add more commodity hardware as information grows.29
Exhibit 60: IBM InfoSphere BigInsights Architecture
Source: www.smartercomputingblog.com.

18 October 2011
Does Size Matter Only? 72
Additionally, BigInsights integrates with IBM’s data warehouse solutions (DB2 and Netezza), using Jaql modules that allow BigInsights to read and write from those products while running data processing jobs. This also includes a set of DB2 user-defined functions (UDF) that enable invocation of Hadoop jobs through SQL and easy exchange of data between Hadoop File System and DB2 tables. Given the tighter integration between BigInsights and data warehousing system, BigInsights can also act like an ETL tool that enables filtering of Big Data and feeding into the data warehousing systems for analysis. (See Exhibit 61.)
Exhibit 61: IBM InfoSphere BigInsights as an ETL Engine for a Data Warehouse
Source: IBM.
The product allows administrators easily to shield their private Hadoop cluster from an organization’s intranet by setting up Lightweight Directory Access Protocol (LDAP) credential store and allows easy mapping of LDAP users to BigInsights roles (e.g., System Administrator, Data Administrator, Application Administrator, and User).109
Exhibit 62: IBM Big Data Platform Vision
Source: IBM.
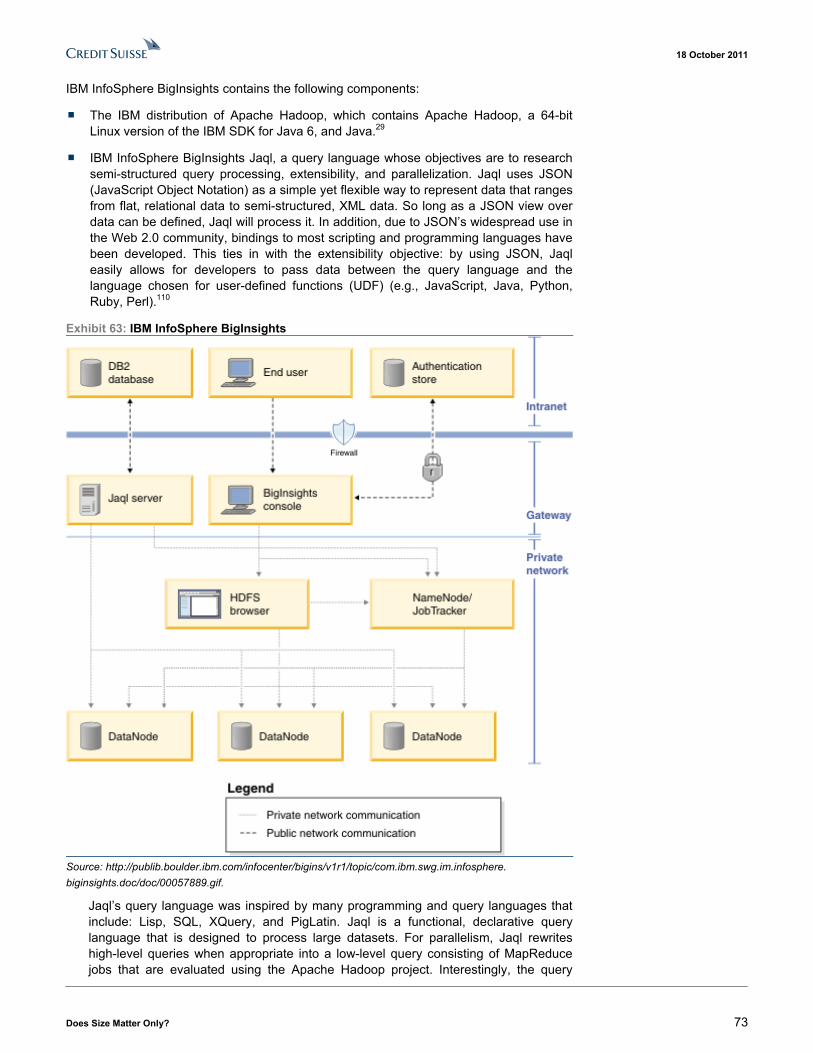
18 October 2011
Does Size Matter Only? 73
IBM InfoSphere BigInsights contains the following components:
■ The IBM distribution of Apache Hadoop, which contains Apache Hadoop, a 64-bit Linux version of the IBM SDK for Java 6, and Java.29
■ IBM InfoSphere BigInsights Jaql, a query language whose objectives are to research semi-structured query processing, extensibility, and parallelization. Jaql uses JSON (JavaScript Object Notation) as a simple yet flexible way to represent data that ranges from flat, relational data to semi-structured, XML data. So long as a JSON view over data can be defined, Jaql will process it. In addition, due to JSON’s widespread use in the Web 2.0 community, bindings to most scripting and programming languages have been developed. This ties in with the extensibility objective: by using JSON, Jaql easily allows for developers to pass data between the query language and the language chosen for user-defined functions (UDF) (e.g., JavaScript, Java, Python, Ruby, Perl).110
Exhibit 63: IBM InfoSphere BigInsights
Source: http://publib.boulder.ibm.com/infocenter/bigins/v1r1/topic/com.ibm.swg.im.infosphere. biginsights.doc/doc/00057889.gif.
Jaql’s query language was inspired by many programming and query languages that include: Lisp, SQL, XQuery, and PigLatin. Jaql is a functional, declarative query language that is designed to process large datasets. For parallelism, Jaql rewrites high-level queries when appropriate into a low-level query consisting of MapReduce jobs that are evaluated using the Apache Hadoop project. Interestingly, the query

18 October 2011
Does Size Matter Only? 74
rewriter produces valid Jaql queries which illustrates a departure from the rigid, declarative-only approach (but with “hints”) of most relational databases. Instead, developers can interact with the low-level queries if needed and can add in their own low-level functionality, such as indexed access or hash-based joins that are missing from MapReduce platforms.110
■ IBM BigInsights scheduler, an extension to Hadoop fair scheduler, which ensures that all jobs get an appropriate share of resources over time.29
■ IBM Orchestrator, an advanced MapReduce job control system that uses a JSON format to describe job graphs and the relationships between them. Multiple Jaql actions and the data flows among them are organized into a graph that the orchestrator can process and coordinate as a workflow. Through the graph definition, the orchestrator is able to understand which actions need to run at any given point in time. The triggers for these actions can be time- or data-dependent. The orchestrator also manages how data flows between actions, using both permanent and temporary directories. Permanent directories, which contain the results of workflow actions, are available after a workflow is complete. Temporary directories, which contain transient data that is produced by the workflow’s actions, are removed.29
■ IBM Optim Development Studio, which provides a Java integrated development environment (IDE) based on the Eclipse platform, one of the most popular environments for developing Java applications.29
■ Apache Avro, a data serialization system.29
■ Cloudera Flume, a distributed, reliable, and highly available service for efficiently moving large amounts of data around a cluster.29
■ Apache HBase, a non-relational distributed database written in Java.29
■ Apache Hive, a data warehouse infrastructure that facilitates both data extraction, transformation, and loading (ETL) and the analysis of large datasets that are stored in the Hadoop Distributed File System (HDFS).29
■ Apache Lucene, a high-performance, full-featured text search engine library written entirely in Java.29
■ Yahoo!’s open-sourced Oozie, a workflow coordination manager.29
■ Apache Pig, a platform for analyzing large datasets, consists of a high-level language for expressing data analysis programs and an infrastructure for evaluating those programs.29
■ Apache ZooKeeper, a centralized service for maintaining configuration information, providing distributed synchronization, and providing group services.29
IBM InfoSphere BigInsights can be used with other products for advanced analytics and a more comprehensive information strategy, enabling companies to combine traditional data warehouse analysis with dynamic insights from unstructured and semi-structured data and resulting in a more complete view of the business not possible before. Combined with IBM InfoSphere Streams and IBM InfoSphere Warehouse, IBM InfoSphere BigInsights can extend analysis to encompass information-in-motion and information accumulated over a long period of time.29
IBM InfoSphere Streams
InfoSphere Streams supports high-volume, structured, and unstructured streaming data sources such as numbers, text, images, audio, voice, VoIP, video, TV, financial news, radio, police scanners, web traffic, email, chat, GPS data, financial transaction data, satellite data, sensors, badge swipes, and any other type of digital information that could

18 October 2011
Does Size Matter Only? 75
be relevant to businesses. With InfoSphere Streams, organizations can react to events and trends immediately while it is still possible to improve business outcomes. Government, telecommunications, healthcare, energy and utilities, finance, manufacturing, or any data-driven industry will benefit whenever there is a requirement for immediate and accurate analysis and decisions based on what is happening in real-time.30
The InfoSphere Streams architecture represents a significant change in computing system organization and capability. While similar to complex event processing (CEP) systems, InfoSphere Streams supports higher data rates and a more data types. InfoSphere Streams also provides infrastructure support to address the needs for scalability and dynamic adaptability, like scheduling, load balancing, and high availability. In InfoSphere Streams, continuous applications are composed of individual operators, which interconnect and operate on one or more data streams. Data streams normally come from outside the system or can be produced internally as part of an application.30
Exhibit 64: Static Data vs. Streaming Data
Source: IBM.
Streaming data sources from outside InfoSphere Streams can make their way into the core of the system, which can be analyzed in different fashions by different pieces of the application, flow through the system, and produce results. These results can be used in a variety of ways, including display on a dashboard, driving business actions, or storage in enterprise databases or warehouses for further historic analysis. For example, Exhibit 65 illustrates how multiple sources and varieties of streaming data can be filtered, classified, transformed, correlated, and/or fused to make equities trade decisions, using dynamic earnings calculations, adjusted according to earnings-related news analyses and real-time risk assessments (e.g., the impact of impending hurricane damage).30
Exhibit 65: IBM InfoSphere Streams
Source: IBM.
InfoSphere Streams’ infrastructure supports very large clusters of x86 architecture computers. Data from input data streams representing a myriad of data types and modalities flow into the system. Management services communicate using the Streams

18 October 2011
Does Size Matter Only? 76
Data Fabric over a physical transport layer. The physical transport can be high-speed ethernet, such as 10G Ethernet, or even-faster InfiniBand transport. Streams management services continually monitors performance of each operator, processing element, job, and node on the runtime to optimize deployment of jobs. This information is especially important for the development phase of applications when saved performance information is used by the compiler to optimize operator fusion.30
Informatica Informatica 9.1 Platform
On June 6, 2011, Informatica announced the Informatica 9.1 Platform. The company stated that Informatica 9.1 is a unified data integration platform designed to realize the full business potential of Big Data and empower the data-centric enterprise. Informatica 9.1 also targets the growing number of information types that get lumped under the “Big Data” umbrella. Along with connections to transactional databases like IBM DB2 and Oracle, as well as analytic-focused data platforms such as Netezza and Teradata, the new release can also pull in data from social sites like Facebook, Twitter, and LinkedIn.111
Exhibit 66: Informatica Platform
ApplicationApplicationApplication Partner Data
SWIFT NACHA HIPAA …
Partner DataPartner Data
SWIFTSWIFT NACHANACHA HIPAAHIPAA ……
Cloud ComputingCloud ComputingCloud Computing UnstructuredUnstructuredUnstructuredDatabaseDatabaseDatabase
Data Warehouse
DataMigration
Test DataManagement& Archiving
Master DataManagement
Data Synchronization
B2B DataExchange
DataConsolidation
ComplexEventProcessing
UltraMessaging
Source: Informatica.
Other aspects of Informatica’s platform, such as MDM (master data management), data quality, and self-service tools, are also getting a range of updates as part of the 9.1 release. The platform delivers an open data integration platform for Big Data initiatives with interoperability including:111
■ Connectivity for Big Transaction Data. Informatica 9.1 delivers connectivity to big transaction data from traditional transaction databases, such as Oracle and IBM DB2, to analytic databases, such as EMC Greenplum, Teradata, Aster Data, HP Vertica, and IBM Netezza.112
■ Connectivity to Big Interaction Data Including Social Data. Informatica 9.1 supports connectivity to social networking services including: Facebook, Twitter, and LinkedIn. Enterprises can benefit across a variety of business initiatives by enriching enterprise transaction data with social interaction data.112
■ Connectivity to Hadoop. Informatica 9.1 features connectivity to the Hadoop file system. Using the connector, enterprises can leverage MapReduce by moving data into Hadoop for Big Data processing and moving the results to a target data store for consumption.112

18 October 2011
Does Size Matter Only? 77
Exhibit 67: Informatica 9.1
Source: Informatica.
Informatica 9.1 supplies master data management (MDM) and data quality technologies to enable organizations to deliver authoritative, trusted data to business processes, applications, and analytics, regardless of the diversity or scope of Big Data. Universal MDM capabilities allow management, consolidation, and reconciliation of all master data, regardless of type or location, in a single, unified solution. Universal MDM has four main characteristics:112
■ Multi-domain. Master data on customers, suppliers, products, assets, and/or locations can be managed, consolidated, and accessed.112
■ Multi-style. A flexible solution may be used in any style: registry, analytical, transactional, or co-existence.112
■ Multi-deployment. The solution may be used as a single-instance hub or in federated, cloud, or service architectures.112
■ Multi-use. The MDM solution interoperates seamlessly with data integration and data quality technologies as part of a single platform.112
Universal MDM eliminates the risk of standalone, single MDM instances by flexibly adapting to different data architectures and changing business needs, starting small in a single domain and extending the solution to other enterprise domains, and cost-effectively reusing skill sets and data logic by repurposing the MDM solution.112

18 October 2011
Does Size Matter Only? 78
Exhibit 68: Unified Data Integration, Data Quality, and MDM with Informatica 9.1
Source: Informatica.
Additionally, Informatica 9.1 enables organizations to empower business analysts and project owners to do more themselves without IT involvement. In a collaborative framework with IT, business users can implement rules for data integration and quality in role-based, nontechnical interfaces through Informatica 9.1. Analysts can assume a greater role in defining specifications, promoting a better understanding of the data, and improving productivity for business and IT.112
Exhibit 69: Informatica 9.1 Self-Service Capabilities
Source: Informatica.
Informatica has also enhanced its B2B Data Exchange Transformation product to make it easier to connect to other interaction data gleaned from call detail records (CDR), device/sensor data and scientific data (genomic and pharmaceutical), and large image files (through managed file transfer). Although the initial set of social media adapters are prescriptive to certain sites, Ovum expects Informatica to eventually offer a software development kit (SDK) approach that provides flexible connectivity to broader social media data sources.26

18 October 2011
Does Size Matter Only? 79
In 2010, Informatica announced a partnership with Cloudera to provide Informatica connectivity with Hadoop to leverage the Sqoop interfaces to provide a highly optimized and scalable connector from the Informatica Platform to the Hadoop Distributed File System. Extension of the Informatica Platform support hybrid deployments on Hadoop will enable data integration mappings defined within the Informatica development environment to be intelligently converted into a combination of MapReduce functions and user-defined functions (UDFs) for execution on the data-intensive distributed computing environment of Hadoop. The adoption of Hadoop by the larger integration vendors, such as Informatica, will help build the ecosystem, integration, packaged functionality and resources needed to accelerate broader of Hadoop by enterprises. For example, enterprises can develop and manage data integration tasks to move data into and out of Hadoop using the Informatica graphical environment and rich, packaged functionality in place of custom code. The integration also enables enterprises to apply data quality, data profiling, and other sophisticated data processing techniques out of the box to data stored in Hadoop.113 Customers can use Informatica data quality, data governance, and other tools both pre- or post-writing the data into HDFS, including parsing and transforming structured and unstructured data, data cleansing, identity resolution, data masking, and master data management.114
Exhibit 70: Informatica for Big Data Integration
Source: Cloudera.
Informatica PowerExchange for Hadoop
With PowerExchange for Hadoop, IT organizations can bring any and all enterprise data into Hadoop for integrating and processing Big Data. Data can be easily moved into and out of Hadoop in batch or real-time using universal connectivity to all data, including mainframe, databases, and applications. PowerExchange for Hadoop is fully integrated with Informatica PowerCenter to provide rapid development, ease of administration, high performance, security, and complete auditability.115 The benefit is being able to reuse existing Informatica development skills in Hadoop environments. In fact, Informatica’s focus on Big Data is a natural corollary to the company’s strategy for Informatica to emerge as both a data source target and a platform.26

18 October 2011
Does Size Matter Only? 80
Exhibit 71: Informatica and Hadoop
Source: Informatica.
PowerExchange for Hadoop provides native, high-performance connectivity to the Hadoop Distributed File System (HDFS), enabling IT organizations to take advantage of the Hadoop’s processing power using their existing IT infrastructure and resources. With PowerExchange for Hadoop, IT organizations can bring any and all enterprise data into Hadoop for integrating and processing Big Data. IT organizations can easily move data into and out of Hadoop in batch or real-time using universal connectivity to all data. With PowerExchange for Hadoop, IT organizations can also engage Hadoop to deliver Big Data projects faster with universal data access and a fully integrated development environment.115
In the next release, Informatica plans to build a more robust offering that includes a graphical integrated development environment (IDE) for Hadoop; codeless and metadata-driven development; the ability to prepare and integrate data directly inside Hadoop environments; and end-to-end metadata lineage across the Informatica, Hadoop, and target environments.26
MapR Based in San Jose, CA, MapR is a privately held company that built a proprietary version of Hadoop. MapR comes with snapshots and no NameNode single point of failure. MapR is API-compatible with HDFS so it can be a drop-in replacement. The company states that MapR significantly advances the Hadoop platform by adding innovation to the open-source version. MapR is initially focused on addressing the needs of customers using Hadoop and HBase APIs.116

18 October 2011
Does Size Matter Only? 81
Exhibit 72: MapR Complete Distribution for Apache Hadoop
Source: MapR.
MapR is a complete distribution that is API compatible with Apache Hadoop (i.e., MapReduce, HDFS, and HBase). MapR supports the complete distribution, combining MapR’s intellectual property with that of the Hadoop community. Specifically, MapR provides: 116
■ Language access components (Hive and Pig)
■ Database components (HBase)
■ Workflow management libraries (Oozie)
■ Application-building libraries (Mahout)
■ SQL to Hadoop database import/export (Sqoop)
■ Log collection (Flume)
■ The entire MapReduce layer
■ Underlying storage services functionality
MapR Direct Access NFS provides real-time read/write data flows via the Network File System (NFS) protocol. With MapR Direct Access NFS, any remote client can mount the cluster. Application servers can write their log files and other data directly into the cluster, rather than writing it first to direct- or network-attached storage. The company states that MapR Direct Access NFS makes Hadoop easier and less expensive to use.117

18 October 2011
Does Size Matter Only? 82
The MapR Distribution for Apache Hadoop provides automatic compression that offers performance acceleration and storage savings. The compression saves both network I/O bandwidth and storage footprint. The MapR Distribution for Apache Hadoop is designed to work with multiple clusters and provides direct access, remote mirroring, and multi-cluster management. MapR Volumes make cluster data easy to manage by grouping related files and directories into a single tree structure so they can be organized, managed, and secured. MapR volumes provide the ability to apply policies including replication, snapshots, mirroring, quotas, data placement control, administration permissions, and data access.117
Additionally, the MapR Control System (MCS) provides visibility into cluster resources and activity for easy administration. The MCS includes the MapR Hadoop Heatmap that provides insight into node health, service status, and resource utilization, organized by cluster topology. Filters and group actions are also provided to select specific components and perform administrative actions directly.117
Exhibit 73: MapR Control System
Source: MapR.
In Hadoop, the NameNode tracks where all of the data is located in the cluster. In other Hadoop distributions, the NameNode runs on a single server. The MapR distribution provides a Distributed NameNode that alleviates certain potential shortcomings.117
■ No Single Point of Failure. A single NameNode results in a single point of failure. If the name node goes down, the entire cluster becomes unavailable. With MapR, every node in the cluster stores and serves metadata, so that there is no loss or downtime even in the face of multiple disk or node failures.117
■ Unlimited Number of Files. The NameNode in other Hadoop distributions is limited to approximately 70 million files. Many large Hadoop sites actively run Hadoop jobs to walk through the cluster and concatenate files to attempt to work around this limitation. MapR’s distributed NameNode scales linearly with the number of nodes, which alleviates this file limitation.117

18 October 2011
Does Size Matter Only? 83
■ Performance. In other Hadoop distributions, all metadata operations in the cluster have to go through a single NameNode. This could affect performance and restrict the workloads that can run on the cluster. With MapR, every node in the cluster stores and serves metadata, resulting in performance that scales with the size of the cluster.117
Microsoft Project Daytona
At Microsoft’s Research Faculty Summit in Redmond, WA, in July 2011, Microsoft unveiled its Project Daytona initiative. At the event, Microsoft announced new software tools and services designed to let researchers use its Windows Azure cloud platform to analyze extremely large datasets from a diverse range of disciplines. Project Daytona uses a runtime version of Google’s MapReduce programming model for processing very large datasets. On July 18, 2011, Microsoft Research announced the availability of a free technology preview of Project Daytona MapReduce Runtime for Windows Azure.118
The Daytona tools deploy MapReduce to Windows Azure virtual machines, which dissect the information into smaller chunks for processing. The data is then recombined for output. Daytona is primarily targeted to researchers in healthcare, education, environmental sciences, and other fields where people need powerful computing resources to analyze large datasets.118
Through the service, users can upload prebuilt research algorithms to the Azure cloud, which Microsoft sees as an ideal host for extremely large datasets. The Project Daytona architecture breaks data into chunks for parallel processing, and the cloud environment allows users to dynamically turn on and off virtual machines depending on the required processing power. Microsoft stated that Project Daytona remains a research effort that is far from complete, but the company plans to make ongoing enhancements to the service.119
To use and deploy Project Daytona built on existing Azure compute and data services, users will need to follow these steps:
■ Develop Data Analytics Algorithms. Project Daytona enables a data analytics algorithm to be authored as a set of Map and Reduce tasks, without users having to have in-dept knowledge of distributed computing or Azure.120
■ Data Libraries. Users need to upload data and data analytics routines into Azure.120
■ Deploy the Daytona Runtime. Users need to deploy the Daytona runtime to a Windows Azure account. Users are able to configure the number of virtual machines for the deployment and configure the storage account on Windows Azure for the analysis results.120
■ Launch Data Analytics Algorithms. The Daytona release package provides users with source code for a simple client application that can select and launch a data analytics model against a dataset on Project Daytona.120
Project Daytona breaks up data into smaller chunks so it can be processed after it has deployed the MapReduce runtime to all the machines concerned. When the simultaneous analysis of the data is finished, the results are combined into results that are easy for users to interpret.120 Some properties of Project Daytona include:
■ Designed for the Cloud. Designed for Azure, Daytona connects virtual machines regardless of infrastructure.120
■ Designed for Cloud Storage Services. Daytona can consume data with minimum overheads and with the ability to recover from failures, using the automatic persistence and replication that comes with Azure storage services.120
18 October 2011
Does Size Matter Only? 84
■ Horizontally Scalable and Elastic. Analysis of data is done in parallel, so to scale a large data-analytics computation, users can easily add more machines to the deployment.120
■ Optimized for Data Analytics. Daytona was designed to provide support for iterative computations in its core runtime and caches data between computations to reduce communication overheads.120
Oracle While Oracle’s relational database technology supports transactional systems that handle structured data with complex validation and data integrity rules, Oracle has been expanding its product portfolio to deal with the burgeoning amount of unstructured data in enterprise IT environments. Although Hadoop and Oracle are two different technologies that process data differently, both the technologies, in our opinion, complement each other. As enterprises explore opportunities to extract value from the exploding volumes of unstructured data, Oracle has released new products and features that expand the company’s capabilities to handle both structured and unstructured data and implement the MapReduce framework into Oracle’s technology.
Oracle could deploy various methods to access data stored in a Hadoop cluster from and within an Oracle Database. Some Oracle Database features, notably External Tables, Parallel Pipelined Table Functions, and Advanced Queuing, provide ways to integrate Hadoop and the Oracle Database. In addition, Oracle Grid Engine provides the means to harness the power of a Hadoop deployment through efficient workload management. Oracle Coherence is a very complimentary solution to Hadoop and offers clustering of data outside of a database engine, since Hadoop Java objects can be clustered using the Oracle Coherence solution. In the end, the nature of the data, the type of workload, the number of servers, manpower skills, and service level requirements from the end user will dictate the optimal approach and, as such, we expect the following integrations of the Oracle Database and/or Oracle middleware with MapReduce and Hadoop, specifically:
■ By triaging multi-structured data in the Oracle Big Data Appliance and then feeding the structured output data to the database for further analysis, enterprises can gain more insight by correlating this data from a Hadoop cluster with their traditional, structured data already residing in an Oracle Database. By leveraging Hadoop processing in a more integrated manner, customers can take advantage of the power of the Oracle Database, while at the same time to simplify the analysis of unstructured data stored in a Hadoop cluster by streaming output data directly from Hadoop with Advanced Queuing, Table Functions, and/or External Tables.28
■ MapReduce programs can be implemented within the Oracle Database using Parallel Pipelined Table Functions and parallel operations. Pipelined PL/SQL table functions declaratively specify (with a few keywords) how a parallel query should do the map process and then the procedural body does the reduce. PL/SQL is Oracle’s procedural extension language for SQL and the Oracle relational database. PL/SQL is one of three key programming languages embedded in the Oracle Database, along with SQL itself and Java.
■ Parallel Execution (PX) in Oracle Database 11gR2 enables in-memory MapReduce processing for real-time analytics on structured and unstructured data.
■ By integrating Oracle Grid Engine with Hadoop, Oracle enables massively parallel processing of applications/jobs using the MapReduce framework.
Oracle Big Data Appliance
Oracle views MapReduce platforms and Hadoop, in particular, as a viable data processing framework that can be used in run-time to return query data and also as a pre-processing
Although Hadoop and Oracle are two different technologies that process data differently, both the technologies, in our opinion, complement each other. As enterprises explore opportunities to extract value from the exploding volumes of unstructured data, Oracle has released new products and features that expand the company’s capabilities to handle both structured and unstructured data and implement the MapReduce framework into Oracle’s technology.

18 October 2011
Does Size Matter Only? 85
engine for incoming data that transforms and stores it as structured data in the Oracle Database, and, at Oracle OpenWorld in October 2011, Oracle unveiled the Oracle Big Data Appliance, which processes unstructured data in enterprise IT environments by integrating Hadoop with the Oracle Database and other Oracle technologies.
Exhibit 74: Oracle Big Data Appliance Hardware and Software Components Oracle Big Data Appliance Hardware Oracle Big Data Appliance Software 18 Sun X4270 M2 Servers Oracle Linux - 48 GB memory per node = 864 GB memory Java Hotspot VM - 12 Intel cores per node = 216 cores Apache Hadoop Distribution - 24 TB storage per node = 432 TB storage R Distribution 40 Gb p/sec InfiniBand Oracle NoSQL Database 10 Gb p/sec Ethernet Oracle Data Integrator for Hadoop Oracle Loader for Hadoop
Source: Oracle.
The Oracle Big Data Appliance is an engineered system that includes several components of open source software (e.g., open source distributions of Apache Hadoop and R), as well as multiple proprietary Oracle technologies (e.g., Oracle NoSQL Database, Oracle Data Integrator, Application Adapter for Hadoop, and Oracle Loader for Hadoop) to speed up the MapReduce process and enable more streamlined integration with the Oracle Database and/or Exadata. (See Exhibit 75.)
Exhibit 75: Oracle Multi-Structured Data Ecosystem Solutions
Source: Oracle.
■ Oracle NoSQL Database. Oracle NoSQL Database is an enterprise-ready, general-purpose NoSQL database using a key/value paradigm, which allows organizations to handle massive quantities of data, manage changing data formats, and submit simple queries. Complex queries are supported using Hadoop or Oracle Database operating upon Oracle NoSQL Database data. Oracle NoSQL Database delivers scalable throughput with bounded latency and a simple programming model. Oracle states that the database scales horizontally to hundreds of nodes with high

18 October 2011
Does Size Matter Only? 86
availability and transparent load balancing. Customers can use the database to support Web applications, acquire sensor data, scale authentication services, or support online serves and social media.
NoSQL emerged as companies, such as Amazon, Google, LinkedIn, and Twitter, struggled to deal with unprecedented data and operation volumes under tight latency constraints. Analyzing high-volume, real-time data (e.g., Website click streams) provides significant business advantage by harnessing unstructured and semi-structured data sources to create more business value. However, because traditional relational databases were not up to the task, enterprises built upon a decade of research on distributed hash tables (DHTs) and either conventional relational database systems or embedded key/value stores (e.g., Oracle’s Berkeley DB) to develop highly available, distributed key-value stores.134
Exhibit 76: Oracle NoSQL Database Flexibility Spectrum
Source: Oracle.
Until recently, integrating NoSQL solutions with an enterprise application architecture required manual integration and custom development. In contrast, Oracle’s NoSQL Database provides the desirable features of NoSQL solutions necessary for seamless integration into an enterprise’s application architecture. Oracle-provided adapters allow the Oracle NoSQL Database to integrate with a Hadoop MapReduce framework or with the Oracle Database in-database MapReduce, Data Mining, R-based analytics, or whatever business needs demand.134
■ Oracle Data Integrator Application Adapter for Hadoop. The Hadoop adapter simplifies data integration between Hadoop and an Oracle Database through Oracle Data Integrator’s interface.135
■ Oracle Loader for Hadoop. Oracle Loader for Hadoop enables customers to use Hadoop MapReduce processing to create optimized datasets for efficient loading and analysis in Oracle Database 11g. The loader generates Oracle internal formats to load data quickly and use less database system resources.135
■ Oracle R Enterprise. Oracle R Enterprise integrates the open source statistical environment R with Oracle Database 11g. Users can run existing R applications and use the R client directly against data stored in Oracle Database 11g. The combination of Oracle Database 11g and R provides an environment for advanced analytics. Users can also use analytical sandboxes, where they can analyze data and develop R scripts for deployment while results stay managed inside Oracle Database.135
Oracle NoSQL Database, Oracle Data Integrator Application Adapter for Hadoop, Oracle Loader for Hadoop, and Oracle R Enterprise will also be available as standalone software products independent of the Oracle Big Data Appliance.135

18 October 2011
Does Size Matter Only? 87
Exhibit 77: Oracle NoSQL Database Exhibit 78: Oracle Data Integrator
Source: Oracle. Source: Oracle.
Exhibit 79: Oracle Loader for Hadoop Exhibit 80: Oracle R Enterprise
Source: Oracle. Source: Oracle.
Additionally, because few hardware vendors provide a Hadoop cluster as a single stock-keeping unit (SKU) and because tuning Hadoop to obtain maximum performance is an arduous task, consistency of build is important, which could, in turn, make a pre-integrated Hadoop appliance, such as the Big Data Appliance, an attractive option for enterprise customers.11,13
In our opinion, the Oracle Big Data Appliance, in conjunction with Exadata and Exalytics, offers customers an end-to-end solution allowing customers to maximize the value of Big Data with their existing investment in the Oracle Database. Specifically, the Big Data Appliance is optimized to acquire, organize, and load unstructured data into the Oracle Database.135 By leveraging Hadoop in an integrated, ETL-like manner, customers can simplify the analysis of unstructured data by streaming output data from a Hadoop cluster into the Oracle Database and/or Exadata for real-time analysis with structured data. (See Exhibit 81.) Furthermore, network bandwidth may become an issue with Hadoop deployments. However, Hadoop is rack-aware, which reduces network bandwidth as the framework moves data around during the reduce functions. Therefore, instead of needing to consider if the cost of increasing the network bandwidth or provisioning additional nodes is the best approach,11 deploying a Hadoop cluster on the Oracle Big Data Appliance connected to the Oracle Exadata Database Machine and Oracle Exalytics Business Intelligence Machine, all three of which are built around InfiniBand for RAC connectivity, would provide low latency and reduce network bandwidth concerns, given the very high aggregate bandwidth provided across the clustered appliances.11

18 October 2011
Does Size Matter Only? 88
Exhibit 81: Oracle Big Data Appliance
Source: Oracle.
Oracle Exalytics Business Intelligence Machine
At OpenWorld 2011, Oracle launched a new Exaseries product containing a large main memory footprint, which the company positioned as a competitive alternative to SAP’s HANA appliance. The Oracle Exalytics Business Intelligence Machine utilizes the Oracle TimesTen In-Memory Database for Exalytics and Oracle Essbase with in-memory optimizations for Exalytics, as well as other adaptive in-memory tools and a highly scalable server designed specifically for in-memory business intelligence. (See Exhibit 82.) As highlighted in our report on Fast Data (titled The Need for Speed, published on March 30, 2011), we believe that in-memory database appliance such as Exalytics can enable a new class of intelligent applications, including yield management, pricing optimization, rolling forecasting, and so on.
Exhibit 82: Oracle Exalytics Business Intelligence Machine
Source: Oracle.
Oracle described how Exalytics fits into the company’s Big Data strategy at OpenWorld 2011. Specifically, the company suggested that users can create an ETL model using the Oracle Integrator ETL tool and then deploy that on Oracle’s Big Data Appliance platform. After preprocessing is done, the Oracle Loader for Hadoop moves the dataset into Exadata, after which the finished dataset can be piped into Exalytics for analytic dashboards and reports.133 (See Exhibit 83.)
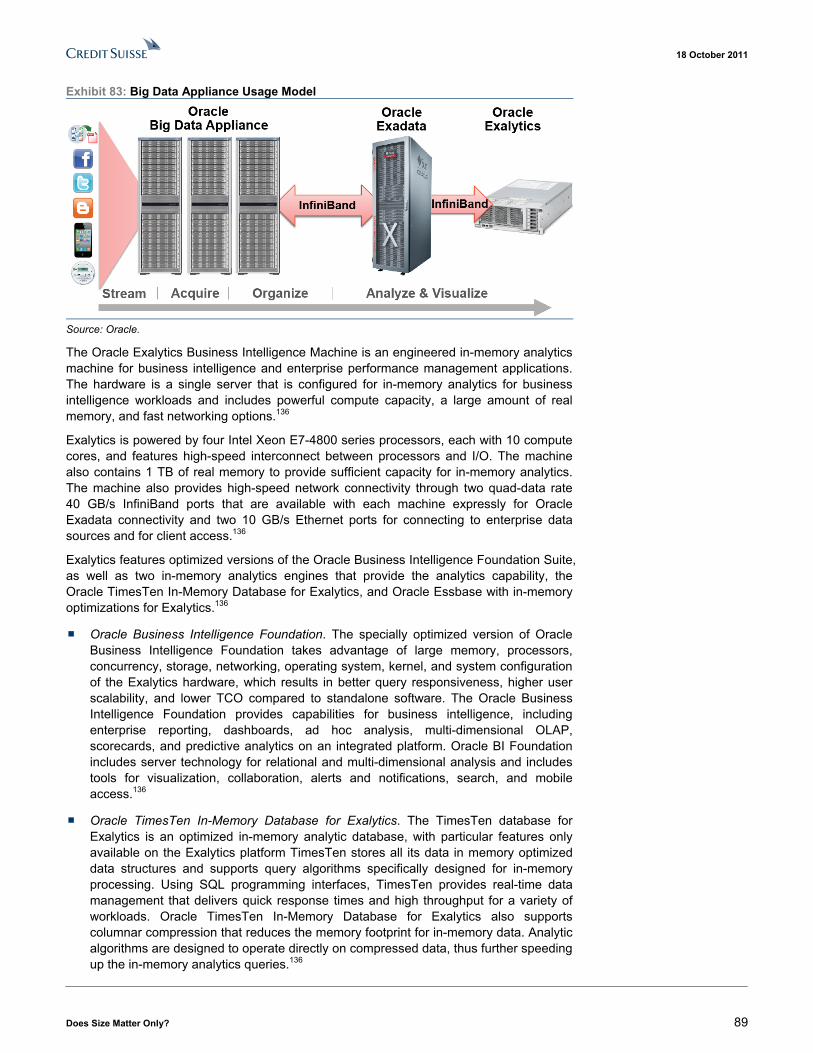
18 October 2011
Does Size Matter Only? 89
Exhibit 83: Big Data Appliance Usage Model
Source: Oracle.
The Oracle Exalytics Business Intelligence Machine is an engineered in-memory analytics machine for business intelligence and enterprise performance management applications. The hardware is a single server that is configured for in-memory analytics for business intelligence workloads and includes powerful compute capacity, a large amount of real memory, and fast networking options.136
Exalytics is powered by four Intel Xeon E7-4800 series processors, each with 10 compute cores, and features high-speed interconnect between processors and I/O. The machine also contains 1 TB of real memory to provide sufficient capacity for in-memory analytics. The machine also provides high-speed network connectivity through two quad-data rate 40 GB/s InfiniBand ports that are available with each machine expressly for Oracle Exadata connectivity and two 10 GB/s Ethernet ports for connecting to enterprise data sources and for client access.136
Exalytics features optimized versions of the Oracle Business Intelligence Foundation Suite, as well as two in-memory analytics engines that provide the analytics capability, the Oracle TimesTen In-Memory Database for Exalytics, and Oracle Essbase with in-memory optimizations for Exalytics.136
■ Oracle Business Intelligence Foundation. The specially optimized version of Oracle Business Intelligence Foundation takes advantage of large memory, processors, concurrency, storage, networking, operating system, kernel, and system configuration of the Exalytics hardware, which results in better query responsiveness, higher user scalability, and lower TCO compared to standalone software. The Oracle Business Intelligence Foundation provides capabilities for business intelligence, including enterprise reporting, dashboards, ad hoc analysis, multi-dimensional OLAP, scorecards, and predictive analytics on an integrated platform. Oracle BI Foundation includes server technology for relational and multi-dimensional analysis and includes tools for visualization, collaboration, alerts and notifications, search, and mobile access.136
■ Oracle TimesTen In-Memory Database for Exalytics. The TimesTen database for Exalytics is an optimized in-memory analytic database, with particular features only available on the Exalytics platform TimesTen stores all its data in memory optimized data structures and supports query algorithms specifically designed for in-memory processing. Using SQL programming interfaces, TimesTen provides real-time data management that delivers quick response times and high throughput for a variety of workloads. Oracle TimesTen In-Memory Database for Exalytics also supports columnar compression that reduces the memory footprint for in-memory data. Analytic algorithms are designed to operate directly on compressed data, thus further speeding up the in-memory analytics queries.136

18 October 2011
Does Size Matter Only? 90
■ Oracle Essbase. Oracle Essbase, a multi-dimensional OLAP Server for analytic applications, has a number of optimizations for in-memory operations for Exalytics, including improvements to overall storage layer performance, enhancements to parallel operations, enhanced MDX syntax, and a high-performance MDX query engine. These enhancements are particularly important for advanced use cases such as planning and forecasting, providing faster cycle times and supporting more number of users.136
Oracle TimesTen In-Memory Database for Exalytics and Oracle Essbase with in-memory optimizations for Exalytics uses the following four techniques to provide high performance in-memory analytics for various BI scenarios:
■ In-Memory Data Replication. In cases in which business intelligence implementations may be able to fit entirely in memory, the Oracle Business Intelligence Server can replicate the entire data warehouse into the TimesTen In-Memory database, which allows for in-memory analytics for all use cases including ad-hoc analysis and interactive dashboarding.136
■ In-Memory Adaptive Data Mart. Most business intelligence deployments have workload patterns that focus on a specific collection of “hot” data from their enterprise data warehouse. In cases where business intelligence deployments have workload patterns that focus on “hot” data from their enterprise data warehouse, the most efficient way to provide sub-second interactivity is by identifying and creating a data mart for the relevant data. Exalytics reduces tuning costs by providing automation that identifies, creates, and maintains the best fit in-memory data mart for a specific business intelligence deployment.136
■ In-Memory Intelligent Result Cache. Exalytics Result Cache is a reusable in-memory cache that is populated with results of previous logical queries generated by the server. In addition to providing data for repeated queries, any result set in the result cache is treated as a logical table and is able to satisfy any other queries that require a sub-set of the cached data.136
■ In-Memory Cubes. Oracle Essbase with its in-memory optimizations provides another dimension for accelerating queries on specified subject areas, which contrasts with other in-memory techniques in that the cubes may be writable as well. The BI Server provides ways to create cubes out of data extracted from the semantic layer to provide advanced scenario modeling and what-if analysis, delivering an unprecedented and seamless modeling and reporting framework.136
Exalytics also allows information to be delivered through dashboards, scorecards, or reports, within enterprise portals and collaboration workspaces, business applications, Microsoft Office tools, and mobile devices. Exalytics features a number of user interface enhancements to promote interactivity and responsiveness. For example, Exalytics features new micro charts and multi-panel trellis charts to visualize dense multi-dimensional, multi-page data on a single screen, which are particularly effective at displaying multiple visualizations across a common axis scale for easy comparison.136 (See Exhibit 84 and Exhibit 85.)

18 October 2011
Does Size Matter Only? 91
Exhibit 84: Oracle Exalytics Presentation Suggestion Engine
Exhibit 85: Oracle Exalytics Trellis Charts View
Source: Oracle. Source: Oracle.
In-Database MapReduce with Oracle Table Functions
MapReduce programs can be implemented within the Oracle Database using Parallel Pipelined Table Functions and parallel operations. Pipelined Table Functions were introduced in Oracle 9i as a way of embedding procedural logic within a data flow. At a logical level, a Table Function is a function that can appear in the “FROM” clause and therefore functions as a table returning a stream of rows. Table Functions can also take a stream of rows as an input. Since Pipelined Table Functions are embedded in the data flow, they allow data to be “streamed” to an SQL statement, avoiding intermediate materialization in most cases. Additionally, Pipelined Table Functions can be parallelized. To parallelize a Table Function the programmer specifies a key to repartition the input data. Table Functions can be implemented natively in PL/SQL, Java, and C.121
Exhibit 86: Running MapReduce within Oracle Database
Source: Oracle.
Oracle Table Functions are used by many internal and external parties to extend Oracle Database 11g. Pipelined Table Functions have been used by customers for several releases and are a core part of Oracle’s extensibility infrastructure. Both external users and Oracle Development have used Table Functions as an efficient and easy way of extending the database kernel. Examples of table functions being used within Oracle are the implementation of a number of features in Oracle Spatial and Oracle Warehouse

18 October 2011
Does Size Matter Only? 92
Builder. Oracle Spatial usages include spatial joins and several spatial data mining operations. Oracle Warehouse Builder allows end users to leverage Table Functions to parallelize procedural logic in data flows such as the Match-Merge algorithm and other row-by-row processing algorithms.121
Oracle Table Functions are a robust, scalable way to implement MapReduce within the Oracle Database and leverage the scalability of the Oracle Parallel Execution framework. Using this in combination with SQL provides an efficient and simple mechanism for database developers to develop Map-Reduce functionality within the environment they understand and with the languages they know.121
In-Memory MapReduce with Parallel Execution (PX)
In the Oracle Database 11gR2 release, Oracle changed the behavior of data that resides in memory across a RAC cluster, introducing the ability to read data blocks in the shared memory (SGA) of all instances in a RAC cluster, whereas in previous versions, those data blocks would have had to move to a single instance of the SGA to be read. Specifically, Oracle Database previously used to restrict the data size to the size of the memory in a single node in the cluster. However, Oracle has enhanced the database features in the 11gR2 release to allow the database to see the memory as a large pool. Instead of using Cache Fusion to replicate all pieces of data in an object to all nodes (see Exhibit 87), Oracle allows the buffer cache as a grid and pin data onto the memory of a node based on some internal algorithm. Parallel Execution (PX) keeps track of where data lives and shuffles the query to that node (rather than using Cache Fusion to move data around). Due to this enhanced feature, any code running within the database leveraging Parallel Execution can now use the data hosted in the machine’s main memory. Instead of developers having to figure out how to create a system that allows for MapReduce code to run in memory (whether across the grid or not), developers can now write the code to leverage MapReduce processing, and the Oracle Database will leverage memory instead of disk based on the data type.122 (See Exhibit 88.)
Exhibit 87: Cache Fusion Diagram Exhibit 88: In-Memory Parallel Execution Diagram
Source: Oracle. Source: Oracle.
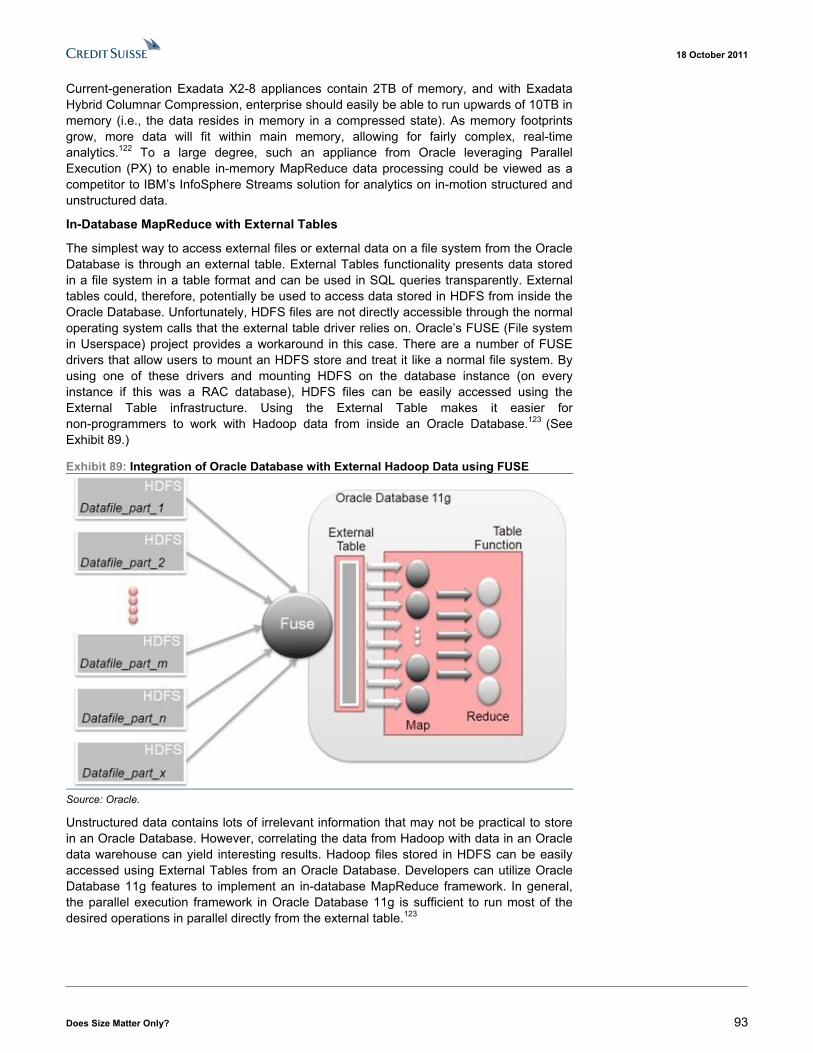
18 October 2011
Does Size Matter Only? 93
Current-generation Exadata X2-8 appliances contain 2TB of memory, and with Exadata Hybrid Columnar Compression, enterprise should easily be able to run upwards of 10TB in memory (i.e., the data resides in memory in a compressed state). As memory footprints grow, more data will fit within main memory, allowing for fairly complex, real-time analytics.122 To a large degree, such an appliance from Oracle leveraging Parallel Execution (PX) to enable in-memory MapReduce data processing could be viewed as a competitor to IBM’s InfoSphere Streams solution for analytics on in-motion structured and unstructured data.
In-Database MapReduce with External Tables
The simplest way to access external files or external data on a file system from the Oracle Database is through an external table. External Tables functionality presents data stored in a file system in a table format and can be used in SQL queries transparently. External tables could, therefore, potentially be used to access data stored in HDFS from inside the Oracle Database. Unfortunately, HDFS files are not directly accessible through the normal operating system calls that the external table driver relies on. Oracle’s FUSE (File system in Userspace) project provides a workaround in this case. There are a number of FUSE drivers that allow users to mount an HDFS store and treat it like a normal file system. By using one of these drivers and mounting HDFS on the database instance (on every instance if this was a RAC database), HDFS files can be easily accessed using the External Table infrastructure. Using the External Table makes it easier for non-programmers to work with Hadoop data from inside an Oracle Database.123 (See Exhibit 89.)
Exhibit 89: Integration of Oracle Database with External Hadoop Data using FUSE
Source: Oracle.
Unstructured data contains lots of irrelevant information that may not be practical to store in an Oracle Database. However, correlating the data from Hadoop with data in an Oracle data warehouse can yield interesting results. Hadoop files stored in HDFS can be easily accessed using External Tables from an Oracle Database. Developers can utilize Oracle Database 11g features to implement an in-database MapReduce framework. In general, the parallel execution framework in Oracle Database 11g is sufficient to run most of the desired operations in parallel directly from the external table.123

18 October 2011
Does Size Matter Only? 94
Hadoop Processing from Oracle Table Functions and Advanced Queuing
We expect Oracle to leverage Hadoop to process unstructured data, essentially utilizing Hadoop as an ETL process to transform and load the valuable outputs into an Oracle Database so that the relevant unstructured data can be combined with structured data to render business value to the users. Using External Tables and Table Functions are two different ways Oracle could preprocess unstructured data to feed outputs from Hadoop to Oracle Database.
Exhibit 90: Oracle Database as a Target for Hadoop Processing
Exhibit 91: Hadoop Processing from the Oracle Database
Source: Oracle. Source: Oracle.
The aforementioned External Tables approach may not be suitable in some cases (if FUSE is unavailable). (See Exhibit 90.) Instead, Oracle Table Functions and Oracle’s Advanced Queuing features provide an alternate way to fetch data from Hadoop. (See Exhibit 91.) At a high level, developers can implement a table function that uses the DBMS_SCHEDULER framework to asynchronously launch an external shell script that submits a Hadoop MapReduce job. The table function and the mapper communicate using Oracle’s Advanced Queuing feature. The Hadoop mapper en-queues data into a common queue, while the table function de-queues data from it. Since this table function can be run in parallel, additional logic is used to ensure that only one of the slaves submits the External Job. The queue provides load balancing since the table function could run in parallel while the Hadoop streaming job will also run in parallel with a different degree of parallelism and outside the control of Oracle’s Query Coordinator.123
The following diagrams are technically more accurate and more detailed representations of the original schematic in Exhibit 91, explaining where and how Oracle uses the pieces of actual code:123

18 October 2011
Does Size Matter Only? 95
Exhibit 92: Integration of Hadoop using Oracle Table Functions and Advanced Queuing
Source: Oracle.
(1) The database figures out who gets to be the query coordinator. For this, the Oracle Database uses a simple mechanism that writes records with the same key value into a table. The first insert wins and will function as the query coordinator (QC) for the process. Additionally, the QC table function invocation does play a processing role as well.123
(2) This table function invocation (QC) starts an asynchronous job using dbms_scheduler, the Job Monitor.
(3) The Job Monitor, in turn, runs launcher, the synchronous bash script on the Hadoop cluster.123
(4) The launcher starts the mapper processes on the Hadoop cluster.123
(5) Hadoop Mappers process data and write to a queue. The developers would choose a queue as it is available cluster wide. Hadoop Mappers simply chose to write any output directly into the queue. However, performance can be improved by batching up the outputs and then moving them into the queue. Other options include pipes and relational tables.123
(6) The de-queuing process is done by parallel invocations of the table function running in the database. These parallel invocations process data that then gets served up to the query requesting the data. The table function leverages both the Oracle data and the data from the queue and, thereby, integrates data from both sources in a single result set for the end user(s).123

18 October 2011
Does Size Matter Only? 96
Exhibit 93: Integration of Hadoop using Oracle Table Functions and Advanced Queuing
Source: Oracle.
After the Hadoop side processes (i.e., the mappers) are kicked off, the job monitor process keeps an eye on the launcher script. Once the mappers have finished processing data on the Hadoop cluster, the bash script finishes as shown in Exhibit 93. As long as data is present in the queue, the table function invocations keep on processing that data (i.e., step 6).123
(7) The job monitor monitors a database scheduler queue and will notice that the shell script has finished.123
(8) The job monitor checks the data queue for remaining data elements.123
Exhibit 94: Integration of Hadoop using Oracle Table Functions and Advanced Queuing
Source: Oracle.
(9) When the queue is fully de-queued by the parallel invocations of the table function, the job monitor terminates the queue ensuring the table function invocations in Oracle stop. At that point, all the data has been delivered to the requesting query.123

18 October 2011
Does Size Matter Only? 97
Oracle Grid Engine
All computing resources allocated to a Hadoop cluster are used exclusively by Hadoop, which can result in underutilized resources when Hadoop is not running. Oracle Grid Engine (OGE) enables a cluster of computers to run Hadoop with other data-oriented compute application models, such as Oracle Coherence, Message Passing Interface (MPI), Open Multi-Processing (OpenMP), etc. This approach brings the benefit of not having to maintain a dedicated cluster for running only Hadoop applications.28
Exhibit 95: Oracle Grid Engine with Hadoop
Source: Oracle.
Oracle Grid Engine provides an enterprise environment to deploy a Hadoop cluster along with other applications. OGE is a powerful business-driven workload manager that creates a layer of abstraction between applications and the computing resources to provide an efficient way to match a workload to available resources and schedule jobs according to business policies, thereby providing further scalability, flexibility, and full-accounting of resource utilization. In addition, Oracle Grid Engine has the capacity to scale out to cloud resources on demand, as well as set idle or underutilized machines into a reduced power mode to conserve energy.28
By driving enterprise-level operational efficiency of a Hadoop infrastructure with Oracle Grid Engine, customers can gain efficiency and return on assets by repurposing specialized cluster frameworks for other non-Hadoop workloads.28 With its native understanding of HDFS data locality and direct support for Hadoop job submission, Oracle Grid Engine allows customers to run Hadoop jobs within exactly the same scheduling and submission environment used for traditional scalar and parallel loads.124
Hadoop has become a popular tool to facilitate parallel data processing. However, given that Hadoop is still in a nascent stage, particularly in the context of enterprise technical computing, the framework falls short in certain areas, such as advanced scheduling capabilities, accounting and reporting, and sharing resources with other applications. Oracle Grid Engine enhances those capabilities for Hadoop-based solutions. By running a Hadoop environment on top of Oracle Grid Engine, customers get all of the benefits of Hadoop for data analysis while at the same time leveraging Oracle Grid Engine as the higher-level resource manager. The net result is that Hadoop environments become less expensive to run and maintain.125
Pentaho Pentaho provides broad enterprise data integration services for Big Data analytics and reporting. Pentaho is a commercial, open-source business intelligence company that offers enterprise reporting, analysis, dashboard, data mining, workflow, and ETL capabilities for customers’ BI needs. Pentaho provides its users with open source BI capabilities that enable businesses to develop and track individualized data sources to increase efficiencies, contain cost and drive revenue.71

18 October 2011
Does Size Matter Only? 98
The Pentaho BI Suite provides data integration and business intelligence (BI) capabilities including ETL, OLAP, query and reporting, interactive analysis, dashboards, data mining, and a BI platform.71 (See Exhibit 96.)
Exhibit 96: Pentaho BI Suite
Source: www.pentaho.com.
Pentaho uses Kettle, its data integration product, to directly connect to Hadoop for running ETL jobs for SQL queries or to integrate with Hive to extend queries to the Hadoop platform, thereby allowing business users to receive the same advantages of the BI platform over Hadoop. Users can connect Hadoop data sources into the report creating process and communicate with Hadoop without requiring knowledge of MapReduce programming or even how Hadoop process their request. Pentaho currently integrates with three versions of Hadoop: Apache Hadoop, Cloudera’s Hadoop distribution, and Greenplum Hadoop distribution.126
Pentaho enables users to reap the benefits of Hadoop by making it easier and faster to create BI applications. Pentaho delivers a unified visual design environment for ETL, report design, analytics, and dashboards, providing an enterprise friendly environment for using Hadoop. Hadoop users can load, transform, manipulate, and aggregate files and data using the full functionality of Pentaho’s graphical designer and ETL engine. Pentaho for Hadoop adds production and ad hoc reporting and analysis via Hive, including integration with the Pentaho metadata layer, so Hive users do not need to know SQL.126
The Pentaho BI Platform provides a metadata layer designed to centralize and streamline maintenance of business intelligence systems. While the BI metadata layer provides integrated security, query optimization, broad database connectivity, and reduced maintenance, its most basic function is to provide an abstraction layer between non-technical business users and sophisticated underlying database schemas. Pentaho’s BI metadata layer automates query generation, allowing business users to create reports using familiar business terms like “Customers,” “Products,” and “Orders,” without any knowledge of SQL.126

18 October 2011
Does Size Matter Only? 99
Exhibit 97: Pentaho Hadoop Integration Exhibit 98: Pentaho Hadoop Integration
Source: Pentaho. Source: Pentaho.
The BI metadata layer in Pentaho Open BI Suite is also designed to allow IT professionals to create reusable metadata maps of underlying relational databases. Beyond abstracting business users from database complexity, the BI metadata layer provides a central place to graphically control security and end user data access, and to manage ongoing changes in the data infrastructure without disrupting BI applications.126
Pentaho Reporting provides an ad hoc reporting interface that allows non-technical business users to create their own reports based on the centralized metadata definitions. The AJAX-based, wizard-driven interface walks business users through the process of selecting templates, connecting to the business views provided by the Pentaho BI metadata layer, and then selecting and filtering the data that they need for their report.126
The Pentaho On-Demand BI Subscription combines the Enterprise Edition BI suite of products with on-demand options to support BI deployments. The Pentaho On-Demand BI Subscription provides customers with dedicated hardware and software resources that enable them to choose and combine infrastructure management and professional services while maintaining the option to expand or contract services as needs change. Pentaho’s On-Demand BI Subscription also includes an Agile BI data wizard that enables users to upload, stage, and analyze data. The functionality includes the new data upload wizard and automatic generation of reporting and OLAP metadata, which enables immediate access to end user, self-service BI.127
Quest Software Toad for Cloud
Quest Software’s Toad for Cloud Databases provides an SQL-based interface that makes it simple for developers to generate queries, migrate, browse, and edit data, as well as create reports and tables in a familiar SQL view. Additionally, with Toad for Cloud Databases, users can load and export data from cloud databases to a variety of external data sources, including RDBMS. Basically, Toad for Cloud enables integration with some of emerging NoSQL databases for cloud and non-relational data stores (e.g., Table Services, SimpleDB, Cassandra, and Hadoop). While programming for these databases is incredibly complex and requires deep expertise, Toad for Cloud simplifies access and management of these non-relational databases.128
Toad for Cloud puts NoSQL databases within reach of RDBMS developers and DBAs. This tool allows developers and DBAs to easily browse and edit data, as well as create tables using the SQL language or the familiar Toad graphical interfaces. This Toad solution also allows developers to load and export cloud data to a variety of external sources, including RDBMSs.129

18 October 2011
Does Size Matter Only? 100
Exhibit 99: Toad for Cloud Graphical User Interface
Source: Quest.
Toad for Cloud includes various components, although there are two key components of Toad for Cloud Databases: (1) Toad Client and (2) Toad Data Hub.
■ Toad Client. Toad Client contains the intuitive user interface through which remote cloud database access is easily configured and SQL statements are written and executed. Toad Client provides all of the standard Toad features and includes:
SQL Editor. SQL Editor is mainly used for creating, executing, modifying and saving queries, as well as viewing and editing data and processing DDL commands.129
Query Builder. Query Builder is the component for constructing the framework for an SQL statement, including selecting tables and views, selecting and joining columns, and adding conditions; it also allows users to query and join data across multiple database platforms.129
Schema Report Generator. Schema Report Generator is used for producing HTML reports of selected databases and objects, including the source code for each object and links that display details for the object when selected.129
Database Browser. This browser component is meant for displaying and managing all database objects graphically, with single-click access to object details, data, and underlying DDL.129
■ Toad Data Hub. Toad for Hub receives the SQL statements submitted by the user through Toad, translates them into the appropriate API calls to fetch or update data in the designated cloud database, and returns the results in the familiar tabular format of rows and columns. This server is installed with the Toad client and can be run on the local PC or deployed out in the Amazon cloud.129

18 October 2011
Does Size Matter Only? 101
Quest Data Connector for Hadoop
Quest Data Connector for Hadoop is a connector between Oracle and Apache Hadoop that allows for fast, scalable data transfer between Oracle databases and Hadoop. Quest Data Connector is designed as a freeware plug-in to Sqoop, Cloudera’s existing open-source framework. Quest claims that Quest Data Connector for Hadoop is five times faster than Sqoop alone. As previously described, Sqoop is a tool designed Hadoop open source community to easily import information from SQL databases into Hadoop cluster. Sqoop gives the ability to import individual tables or entire databases to files in HDFS and to import from SQL databases straight into Hive. Sqoop also provides a framework for development that allows for the creation of specialized high-performance connectors to Cloudera’s Distribution for Hadoop (CDH). Quest Data Connector for Oracle and Hadoop inspects each Sqoop job and assumes responsibility for the ones it can perform better than the Oracle manager built into Sqoop.130
Exhibit 100: Quest Data Connector for Oracle and Hadoop
Source: Quest Software.
Quest Data Connector for Oracle and Hadoop supports many Oracle data types. However, some of the media, spatial data types are not supported.129
Teradata Aster Data nCluster
On March 3, 2011, Teradata announced the acquisition of Aster Data, an advanced analytics database and platform provider. The nCluster analytic platform, Aster Data’s flagship product, is comprised of an analytics engine integrated with a massively parallel hybrid row- and column-oriented database.32

18 October 2011
Does Size Matter Only? 102
Exhibit 101: Aster Data nCluster Diagram
Source: Aster Data.
Aster Data nCluster, an MPP hybrid row and column analytical database architecture, runs on commodity hardware clusters, for large-scale data management and advanced analytics by taking advantage of the MapReduce framework for parallelization and scalable data processing. In particular, Aster Data uses a different approach to implementing MapReduce by running it in-database and combining it with SQL to allow developers to take advantage of MapReduce within standard SQL. This architectural approach combined with its ability to run application processing in the database makes Aster Data nCluster well suited for complex analysis on massive datasets, especially those in the petabyte range.32
nCluster operates on x86 commoditized hardware and is compatible with Linux OSs as well as standard drivers and APIs, including SQL, OLE DB, ADO.NET, ODBC, and JDBC. According to Aster Data, nCluster can drive 10 to 1000x better performance versus alternative approaches for data volumes up to several petabytes. Key features driving nCluster’s performance include:
■ Hybrid Row and Columnar Architecture. nCluster’s hybrid architecture optimizes the system for diverse query loads, featuring both columnar orientation (which is best for business intelligence reporting) and row-based records (which is best for advanced analytics).131
■ Massively Parallel Processing (MPP). MPP enables end-to-end parallelism of data and analytics processing, data loading, querying, exports, backups, recoveries, installs, and upgrades.131 Aster Data’s nCluster is built on an “Always Parallel” data warehouse architecture that leverages the power of massive parallelism to provide high performance and scalability across all MPP database operations. All operations in nCluster are automatically parallelized across servers of the cluster and across all processor cores of each server. Massive parallelization on tens to hundreds of servers and thousands of their processor cores results in tremendous performance gains and enables the system to scale efficiently.132 In particular:
Queries are planned at a global level by the Queen servers and executed on Worker servers in a massively parallel manner.132
Data loads and exports are massively parallelized on Loader/Exporter servers.132
Backups are massively parallelized on Backup servers. Worker servers establish direct links with Backup servers and send massively parallel streams of data in a many-to-many fashion, reducing backup time.132
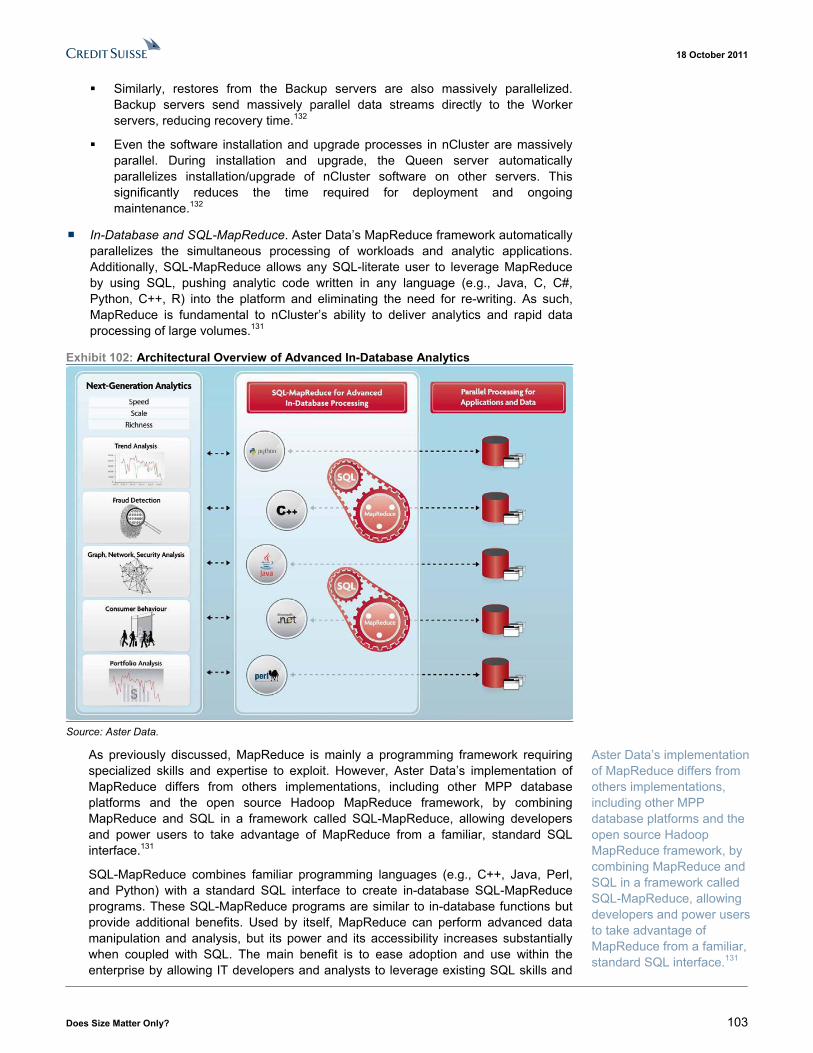
18 October 2011
Does Size Matter Only? 103
Similarly, restores from the Backup servers are also massively parallelized. Backup servers send massively parallel data streams directly to the Worker servers, reducing recovery time.132
Even the software installation and upgrade processes in nCluster are massively parallel. During installation and upgrade, the Queen server automatically parallelizes installation/upgrade of nCluster software on other servers. This significantly reduces the time required for deployment and ongoing maintenance.132
■ In-Database and SQL-MapReduce. Aster Data’s MapReduce framework automatically parallelizes the simultaneous processing of workloads and analytic applications. Additionally, SQL-MapReduce allows any SQL-literate user to leverage MapReduce by using SQL, pushing analytic code written in any language (e.g., Java, C, C#, Python, C++, R) into the platform and eliminating the need for re-writing. As such, MapReduce is fundamental to nCluster’s ability to deliver analytics and rapid data processing of large volumes.131
Exhibit 102: Architectural Overview of Advanced In-Database Analytics
Source: Aster Data.
As previously discussed, MapReduce is mainly a programming framework requiring specialized skills and expertise to exploit. However, Aster Data’s implementation of MapReduce differs from others implementations, including other MPP database platforms and the open source Hadoop MapReduce framework, by combining MapReduce and SQL in a framework called SQL-MapReduce, allowing developers and power users to take advantage of MapReduce from a familiar, standard SQL interface.131
SQL-MapReduce combines familiar programming languages (e.g., C++, Java, Perl, and Python) with a standard SQL interface to create in-database SQL-MapReduce programs. These SQL-MapReduce programs are similar to in-database functions but provide additional benefits. Used by itself, MapReduce can perform advanced data manipulation and analysis, but its power and its accessibility increases substantially when coupled with SQL. The main benefit is to ease adoption and use within the enterprise by allowing IT developers and analysts to leverage existing SQL skills and
Aster Data’s implementation of MapReduce differs from others implementations, including other MPP database platforms and the open source Hadoop MapReduce framework, by combining MapReduce and SQL in a framework called SQL-MapReduce, allowing developers and power users to take advantage of MapReduce from a familiar, standard SQL interface.131
18 October 2011
Does Size Matter Only? 104
combine this with MapReduce programs into packages that can be parallelized without the need to have a deep understanding of MapReduce programming or parallel programming concepts.33
Furthermore, nCluster’s ability to push both SQL and SQL-MapReduce analytical processing down to the data enables computations to be distributed across massively parallel processing nodes while minimizing the need for data movement across the cluster nodes. Furthermore, because developers do not need to use MapReduce to leverage the scale and performance of nCluster, the data analytics server natively supports any application written in Java, .NET, Perl, Python, C, or C++, which can then be pushed down to the database for processing and take advantage of its parallelization and scale. Similarly, Aster Data has partnered with the SAS Institute to natively support SAS applications to run inside the database. This approach is of particular benefit to organizations that have invested time and effort in developing custom analytic applications and want to be able to scale the applications but do not want to rewrite their applications to take advantage of the parallelism that SQL-MapReduce enables.33
■ Linear Scalability. nCluster scales linearly, enabling expansion for massive data volumes without compromising performance. nCluster’s Online Precision Scaling ensures linear scaling across workloads, queries, and backups. Additionally, the system dynamically load balances across virtualized partitions.131
nCluster employs four different node types (i.e., Queens, Workers, Loaders/Exporters, and Backup nodes), providing flexibility in the configuration of systems. (See Exhibit 103.) Some applications may require more data loading or backup/recovery capacity and others may require more computation or query processing capacity. This configuration flexibility means that a greater range of requirements can be satisfied within a given hardware budget.33
The Aster Data nCluster architecture is unique in that it provides dedicated server groups for specific purposes. Separating workloads according to the nature of the task enhances performance by eliminating resource contention and enables independent scalability for different server groups:33
Queen Servers. Queen servers are responsible for accepting user queries, globally optimized query planning, coordinating query execution among Worker servers, and sending the final response back to users.33
Worker Servers. Worker servers are responsible for storing data partitions, doing locally-optimized query planning, and executing queries according to the global plan generated by the Queen servers.33
Loader/Exporter Servers. Loader/exporter servers are responsible for processing incoming data and distributing it across Worker servers. They can also be used for data exports.33
Backup Servers. Backup servers receive data from Worker servers, store backups, and send data to the Workers when recovery is required.33

18 October 2011
Does Size Matter Only? 105
Exhibit 103: Multi-Tiered Architecture Aster Data nCluster for Independent Scaling
Source: Aster Data.
■ Analytic Application Development Tools. nCluster simplifies the development of analytic applications. In addition to embedding applications in-database, nCluster also provides a visual development environment for SQL and MapReduce applications. All applications, data, and infrastructure can be managed through a centralized management console with an intuitive user interface, summary dashboards, and drill-down to gain more granular insights about data.32
To reduce the development time of analytic applications, Aster Data has also developed a suite of pre-packaged, parallelized SQL-MapReduce analytics, including those for text, statistical, cluster, and graph analysis as well as data transformation. The benefit of this approach is to allow organizations to build and deploy sophisticated analytics that would otherwise be very difficult to express in standard SQL. Even though SQL is a popular standard interface for analytic queries, SQL lacks the expressive power for more advanced analytic operations, such as data mining and clustering algorithms, and has much steeper scalability limits. To assist in the development of analytic applications, Aster Data also offers a visual integrated

18 October 2011
Does Size Matter Only? 106
development environment (IDE) called Aster Data Developer Express that supports the creation of SQL-MapReduce analytics. While the SQL-MapReduce analytics are aimed at those proficient in SQL, Aster Data has also created a set of parallelized MapReduce packages with functions in Java or C, aimed at application developers. Functions include those for Monte Carlo simulation, histogram, statistics, and linear algebra. Functions from these packages can be used on their own or in conjunction with one another, with standard SQL, and/or with custom SQL-MapReduce functions. In addition to SQL-MapReduce and MapReduce analytics delivered directly by Aster Data, the company has partnered with a number of vendors, including Fuzzy Logix and Cobi Systems, to offer specialized SQL-MapReduce analytics for a variety of industries.33
Exhibit 104: Aster Data Architecture
Source: Aster Data.
■ Optimizations for Debottlenecking the Inter-Server Network. Massively parallel processing (MPP) databases use horizontal scaling to address the scalability limitations of the traditional SMP-based RDBMS architecture. However, the full power of parallelization can only be realized when the most scarce resource, the inter-server network, is optimally used. In MPP databases, data is partitioned across servers at load time, but a meaningful amount of inter-server network traffic is generated by queries involving joins, aggregations, etc. Such traffic limits the performance and scalability of other MPP databases. nCluster includes patent-pending network optimizations not only to minimize such traffic, but also to make efficient use of the network when such traffic is necessary.132 nCluster’s database leverages these network optimizations to deliver high performance and scale to a very large number of servers without being slowed by the network bottleneck:

18 October 2011
Does Size Matter Only? 107
Network-Optimized Query Planning. nCluster’s network-optimized global query planner uses innovative techniques to create execution plans that significantly reduce inter-server data shuffling required by queries involving multi-table joins, aggregations, etc.132
Efficient Data Transport. When data shuffling is necessary, nCluster uses its Optimized Transport feature for network data compression and parallel streaming for manifold improvement in network performance.132
Network-Optimized Data Loading and Export. Separation of loads and exports to dedicated Loader and Exporter servers allows them to be placed strategically in the cluster such that the network traffic is minimized.132
Network Aggregation. nCluster has the capability to leverage multiple network cables/ports in parallel for manifold increase in the network bandwidth for each server. Using the Network Aggregation feature, all links on a server can be seamlessly used by all partitions, providing true sharing of network bandwidth for all queries.132
■ High-Performance Data Storage Strategies. Delivering high performance predictably and consistently so that analysts can focus on the content of their queries rather than response times requires system optimization across a number of dimensions, including the physical storage of data. Aster Data nCluster is a hybrid row and column DBMS, supporting equally both row and column physical storage with unified data access across both stores provided by SQL-MapReduce. Deployed on off-the-shelf commodity servers, Aster Data also leverages direct-attached storage on commodity servers for fast data access.131
Administrators can select row, column, or a combination of both storage techniques to optimize performance for their business’ particular workloads.132
Aster Data’s Data Model Express is a recommendation tool which suggests the optimal data model, row, column, or a combination of both, based on actual query workloads.132
Use of direct-attached storage significantly improves I/O throughput, such that servers in the cluster can collectively read data at very high rates. For example, a 100-server cluster can read data at 100 * 400 MBps = 40 gigabytes per second (assuming 400 MBps disk controller throughput). This is much higher than a costly SAN used by many other database systems, which can serve data only at a few gigabits per second.132
Ultimately, Aster Data’s combination of MapReduce parallelization, SQL-MapReduce, and in-database processing of both data and procedural code enables nCluster to serve as a powerful platform for large-scale data warehousing and analytics that allows more data types and sources to be included within an analytic application framework. Aster Data’s implementation of MapReduce and its pre-packaged library of SQL-MapReduce functions make nCluster particularly suitable for analytic applications that analyze click-streams, mine online customer transaction data for interesting patterns of behavior, or analyze connections and social networks for marketing, fraud detection, and behavior analysis.33

18 October 2011
Does Size Matter Only? 108
Sources & References 1) Splunk – “Splunk for Big Data”
2) Splunk – “Splunk for Business Analytics”
3) Dion Hinchcliffe – “10 Ways To Complement the Enterprise RDBMS Using Hadoop”
4) Gartner – “‘Big Data’ Is Only the Beginning of Extreme Information Management”
5) Oracle – “Hadoop and NoSQL Technologies and the Oracle Database”
6) IDC – “Extracting Value from Chaos”
7) Oracle – “Integrating Hadoop Data with Oracle Parallel Processing”
8) Gartner – “Trends and Solutions in Business Intelligence and Data Analytics”
9) IBM – “IBM InfoSphere BigInsights Enterprise Edition”
10) Kimball Group – “The Evolving Role of the Enterprise Data Warehouse in the Era of Big Data Analytics”
11) Gartner – “Hadoop and MapReduce: Big Data Analytics”
12) Aster Data – “Deriving Deep Insights from Large Datasets with SQL-MapReduce”
13) Michael Stonebraker, Daniel Abadi, David J. DeWitt, Sam Maden, Erik Paulson,Andrew Pavlo, and Alexander Rasin – “MapReduce and Parallel DBMSs: Friends or Foes?”
14) http://nosqlpedia.com/wiki/Hadoop
15) http://www.cloudera.com/what-is-Hadoop
16) http://datameer.com/products/overview.html
17) http://www.cloudera.com/blog/2009/05/5-common-questions-about-Hadoop
18) http://bigdataanalytics.blogspot.com/2010/10/business-insights-from-big-data.html
19) http://www.baconwrappeddata.com/2011/06/22/its-the-api-stupid-part-2
20) Hadapt Inc., Yale University, University of Wisconsin-Madison – “Efficient Processing of Data Warehousing Queries in a Split Execution Environment”
21) http://tdwi.org/Blogs/Wayne-Eckerson/2010/10/Hadoop-World.aspx
22) Vertica – “Managing Big Data with Hadoop & Vertica”
23) Yale University, Brown University – “HadoopDB: An Architectural Hybrid of MapReduce and DBMS Technologies for Analytical Workloads”
24) http://hive.apache.org
25) https://cwiki.apache.org/confluence/display/Hive/Home
26) Ovum – “Big Data integration is the big deal in Informatica 9.1”
27) http://blogs.oracle.com/datawarehousing/entry/big_data_in_memory_mapreduce
28) Oracle – “Leveraging Massively Parallel Processing in an Oracle Environment for Big Data Analytics”
29) IBM – “BigInsights Datasheet”
30) IBM – “IBM InfoSphere Streams: Enabling complex analytics with ultra-low latencies on data in motion”
31) http://www.smartercomputingblog.com/2011/05/25/509

18 October 2011
Does Size Matter Only? 109
32) www.Asterdata.com
33) MWD Advisors – “Aster Data nCluster: where analytics meets Big Data”
34) IDC – “Teradata Readies Itself for the Next Wave of Demand in Business Analytics: Acquisition of Aster Data Systems Combines Traditiional Data Warehousing with MapReduce Functionality”
35) Splunk – “Large-Scale, Unstructured Data Retrieval and Analysis Using Splunk”
36) http://oracle.sys-con.com/node/1860458
37) IDC – “The Big Deal About Big Data”
38) http://blog.jteam.nl/2009/08/04/introduction-to-Hadoop
39) Google – “MapReduce: Simplified Data Processing on Large Clusters”
40) http://wiki.apache.org/Hadoop
41) http://Hadooper.blogspot.com
42) http://Hadoop.apache.org/mapreduce
43) http://Hadoop.apache.org/hdfs
44) http://Hadoop.apache.org
45) http://pig.apache.org
46) Macalster College – “Comparison Study Between MapReduce (MR) and Parallel Data Management Systems (DBMs) in Large Scale Data Analysis”
47) http://wiki.apache.org/Hadoop/Hbase?action=show&redirect=HBase
48) http://hbase.apache.org/book.html
49) http://wiki.apache.org/Hadoop/ZooKeeper
50) http://www.cloudera.com/blog/2011/07/avro-data-interop
51) https://cwiki.apache.org/confluence/display/AVRO/Index
52) https://cwiki.apache.org/confluence/display/SQOOP/Home
53) http://mahout.apache.org
54) http://incubator.apache.org/chukwa/docs/r0.4.0/index.html
55) https://cwiki.apache.org/FLUME
56) Ariel Rabkin, Randy Katz – “Chukwa: A system for reliable large-scale log collection”
57) data-warehouses.net
58) Yellowfin – “Making Business Intelligence Easy”
59) http://banglahouse.tripod.com/tutorial/intro2td.htm – “Introduction to the Teradata Database”
60) DSSResources.com, S. Brobst & J. Rarey – “Five Stages of Data Warehouse Decision Support Evolution”
61) Monash Information Systems – “Index-Light MPP Data Warehousing”
62) Boris’s Blog on Predictive Analytics for IT
63) SAP – “Sybase Aleri Streaming Platform 3.1”
64) SAP – “Sybase CEP Implementation Methodology for Continuous Intelligence”
65) Teh Ying Wah et al – “Building Data Warehouse”

18 October 2011
Does Size Matter Only? 110
66) BITPIPE – “Business Intelligence Overview”
67) Codd & Date, Inc. – “Providing OLAP On-line Analytical Processing to User-Analysts: An IT Mandate”
68) Deepak Pareek – “Business Intelligence for Telecommunications”
69) OLAP Council – “OLAP Council White Paper”
70) Data Warehousing Review – “Introduction to OLAP - Slice, Dice and Drill!”
71) Pentaho – “Pentaho for Hadoop”
72) Jared Evans – “Fault Tolerance in Hadoop for Work Migration”
73) http://www.greenplum.com/sites/default/files/EMC_Greenplum_Database_DS_0.pdf
74) Chuck Lam – “Hadoop in Action”
75) http://www.dbms2.com/2009/04/15/cloudera-presents-the-mapreduce-bull-case/#more-751
76) http://blog.mikepearce.net/2010/08/18/10-Hadoop-able-problems-a-summary
77) ComputerWeekly.com – “CIOs use real-time analytics for better business decisions”
78) http://wiki.apache.org/Hadoop/HadoopIsNot
79) http://publib.boulder.ibm.com/infocenter/rbhelp/v6r3/index.jsp?topic=%2Fcom.ibm.redbrick.doc6.3%2Fwag%2Fwag80.htm
80) http://www.sdec.kr/m/talks/6;jsessionid=DFB191FE6807CEE2AD560FD12B3D8537
81) http://hypecycles.wordpress.com/2009/10/03/mapreduce-2
82) www.jiahenglu.net/course/cloudcomputing20102/slides/Lec07.ppt
83) http://craig-henderson.blogspot.com/2009/11/dewitt-and-stonebrakers-mapreduce-major.html
84) http://databasecolumn.vertica.com/database-innovation/mapreduce-a-major-step-backwards
85) http://www.dbms2.com/2008/08/25/mapreduce-sound-bites
86) http://blog.tridentcap.com/2011/04/Hadoop-is-many-things-including-the-ideal-etl-tool-for-big-data-analytics.html
87) http://www.dbms2.com/2011/05/14/Hadoop-mapreduce-data-storage-management
88) http://dhammacitta.org/forum/index.php?topic=12010.0
89) http://www.dbms2.com/2011/04/17/netezza-twinfin-i-class-overview
90) http://blog.cubrid.org/web-2-0/database-technology-for-large-scale-data
91) http://www.dbms2.com/2011/03/23/hadapt-commercialized-Hadoopdb
92) http://www.information-management.com/specialreports/20070515/1082028-1.html
93) aws.amazon.com/s3
94) http://www.infoworld.com/d/cloud-computing/first-look-amazon-brings-mapreduce-the-elastic-cloud-616?page=0,1
95) www.cloudera.com
96) http://allthingsd.com/20110629/everyone-loves-hadoop-so-cloudera-makes-it-easier-to-manage
97) Gartner – “Cool Vendors in data Management and Integration, 2010”

18 October 2011
Does Size Matter Only? 111
98) http://www.cloudera.com/company/press-center/releases/cloudera_unveils_industry_first_full_lifecycle_management_and_automated_security_solution_for_apache_Hadoop_deployments
99) Cloudera – “Cloudera Enterprise Datasheet”
100) http://www.cloudera.com/blog/2011/07/scm-express-now-anyone-can-experience-the-power-of-apache-Hadoop
101) Gartner – “Magic quadrant for data warehouse Database Management Systems”
102) http://www.greenplum.com
103) http://www.greenplum.com/news/press-releases/emc-delivers-Hadoop-big-data-analytics-to-the-enterprise
104) Greenplum – “Data Sharing between Database and the Hadoop Distributed File System”
105) http://www.hp.com
106) http://www.vertica.com/wp-content/uploads/2011/01/VerticaArchitectureWhitePaper.pdf
107) Hortonworks-HadoopSummit
108) IBM – “Designing Integrated Applications Across InfoSphere Streams and InfoSphere BigInsights”
109) http://publib.boulder.ibm.com/infocenter/bigins/v1r1/index.jsp
110) http://www.almaden.ibm.com/cs/projects/jaql
111) CIO – “Informatica adds support for ‘Big Data’ Hadoop”
112) Informatica.com
113) http://www.cloudera.com/company/press-center/releases/informatica_and_cloudera_announce_partnership_to_help_companies_leverage_large-scale_data
114) http://blogs.informatica.com/perspectives/index.php/2011/08/23/dating-with-data-part-4-in-hadoop-series/) (Cloudera – “Informatica and Cloudera Unleash the Power of Hadoop”
115) Informatica – “Informatica PowerExchange for Hadoop”
116) http://www.mapr.com
117) MapR – “MapR White Paper”
118) http://www.readwriteweb.com/cloud/2011/07/mapreduce-for-microsoft-azure.php
119) http://www.informationweek.com/news/windows/microsoft_news/231002161
120) http://www.cmswire.com/cms/information-management/microsoft-to-challenge-ibm-oracle-in-big-data-space-using-project-daytona-azure-012064.php?pageNum=2
121) http://blogs.oracle.com/datawarehousing/entry/in-database_map-reduce
122) http://blogs.oracle.com/datawarehousing/entry/big_data_in_memory_mapreduce
123) http://blogs.oracle.com/datawarehousing/entry/integrating_Hadoop_data_with_o
124) Ahrono & Associates – “What is Hadoop?”
125) http://blogs.oracle.com/oem/entry/oracle_grid_engine_a_quick_upd
126) http://www.pentaho.com/docs/pentaho_open_bi_suite_1_6_whats_new.pdf
127) www.pentaho.com

18 October 2011
Does Size Matter Only? 112
128) Quest – “Quest Software Unlocks Cloud Data with Toad for Cloud Databases”
129) Toadforcloud.com
130) Quest – “Quest Data Connector for Hadoop”
131) Aster Data – “nCluster Data Sheet”
132) http://www.asterdata.com/resources/assets/tb_Aster_Data_nCluster_PerformanceScalability.pdf
133) GigaOM – “Oracle Big Data Appliance stakes big claim”
134) Oracle – “Oracle NoSQL Database”
135) www.oracle.com
136) Oracle – “Oracle Exalytics Business Intelligence Machine: A Brief Introduction”

18 October 2011
Does Size Matter Only? 113
Companies Mentioned (Price as of 13 Oct 11) Amazon.com Inc. (AMZN, $236.15, NEUTRAL, TP $210.00) EMC Corp. (EMC, $22.72, OUTPERFORM, TP $27.00) Google, Inc. (GOOG, $558.99, OUTPERFORM, TP $700.00) Hewlett-Packard (HPQ, $25.63, NEUTRAL, TP $30.00) Informatica (INFA, $47.44) International Business Machines (IBM, $186.82, NEUTRAL, TP $175.00) Microsoft Corp. (MSFT, $27.18, OUTPERFORM, TP $35.00) Oracle Corporation (ORCL, $31.14, OUTPERFORM, TP $42.00) Quest Software, Inc. (QSFT, $18.12, NEUTRAL, TP $19.50) SAP (SAPG.F, Eu40.48, OUTPERFORM, TP Eu52.00) Teradata Corp. (TDC) Yahoo Inc. (YHOO, $15.93, NEUTRAL, TP $19.00)
Disclosure Appendix Important Global Disclosures I, Philip Winslow, CFA, certify that (1) the views expressed in this report accurately reflect my personal views about all of the subject companies and securities and (2) no part of my compensation was, is or will be directly or indirectly related to the specific recommendations or views expressed in this report. See the Companies Mentioned section for full company names. 3-Year Price, Target Price and Rating Change History Chart for IBM IBM Closing
Price Target
Price
Initiation/ Date (US$) (US$) Rating Assumption 7/17/09 115.42 110 1/20/10 130.25 130 5/25/10 124.52 NC 3/16/11 153 175 N X
110
130
175
16-Mar-11
N
NC
71
91
111
131
151
171
10/14/08
12/14/08
2/14/09
4/14/09
6/14/09
8/14/09
10/14/09
12/14/09
2/14/10
4/14/10
6/14/10
8/14/10
10/14/10
12/14/10
2/14/1
14/14/1
16/14/1
18/1
4/11
Closing Price Target Price Initiation/Assumption Rating
US$
O=Outperform; N=Neutral; U=Underperform; R=Restricted; NR=Not Rated; NC=Not Covered
3-Year Price, Target Price and Rating Change History Chart for ORCL ORCL Closing
Price Target
Price
Initiation/ Date (US$) (US$) Rating Assumption 12/15/08 16.45 15.5 3/19/09 17.37 16.25 4/20/09 18.82 R 2/1/10 23.22 30 O 3/26/10 25.69 31 6/14/10 22.7 30 9/17/10 27.46 32 12/17/10 31.463 38 3/25/11 32.64 42
16 16
30 31 3032
38
42
O
R
13
18
23
28
33
38
43
10/14/08
12/14/08
2/14/09
4/14/09
6/14/09
8/14/09
10/14/09
12/14/09
2/14/10
4/14/10
6/14/10
8/14/10
10/14/10
12/14/10
2/14/1
14/14/1
16/14/1
18/1
4/11
Closing Price Target Price Initiation/Assumption Rating
US$
O=Outperform; N=Neutral; U=Underperform; R=Restricted; NR=Not Rated; NC=Not Covered
The analyst(s) responsible for preparing this research report received compensation that is based upon various factors including Credit Suisse's total revenues, a portion of which are generated by Credit Suisse's investment banking activities. Analysts’ stock ratings are defined as follows: Outperform (O): The stock’s total return is expected to outperform the relevant benchmark* by at least 10-15% (or more, depending on perceived risk) over the next 12 months.

18 October 2011
Does Size Matter Only? 114
Neutral (N): The stock’s total return is expected to be in line with the relevant benchmark* (range of ±10-15%) over the next 12 months. Underperform (U): The stock’s total return is expected to underperform the relevant benchmark* by 10-15% or more over the next 12 months. *Relevant benchmark by region: As of 29th May 2009, Australia, New Zealand, U.S. and Canadian ratings are based on (1) a stock’s absolute total return potential to its current share price and (2) the relative attractiveness of a stock’s total return potential within an analyst’s coverage universe**, with Outperforms representing the most attractive, Neutrals the less attractive, and Underperforms the least attractive investment opportunities. Some U.S. and Canadian ratings may fall outside the absolute total return ranges defined above, depending on market conditions and industry factors. For Latin American, Japanese, and non-Japan Asia stocks, ratings are based on a stock’s total return relative to the average total return of the relevant country or regional benchmark; for European stocks, ratings are based on a stock’s total return relative to the analyst's coverage universe**. For Australian and New Zealand stocks, 12-month rolling yield is incorporated in the absolute total return calculation and a 15% and a 7.5% threshold replace the 10-15% level in the Outperform and Underperform stock rating definitions, respectively. The 15% and 7.5% thresholds replace the +10-15% and -10-15% levels in the Neutral stock rating definition, respectively. **An analyst's coverage universe consists of all companies covered by the analyst within the relevant sector. Restricted (R): In certain circumstances, Credit Suisse policy and/or applicable law and regulations preclude certain types of communications, including an investment recommendation, during the course of Credit Suisse's engagement in an investment banking transaction and in certain other circumstances. Volatility Indicator [V]: A stock is defined as volatile if the stock price has moved up or down by 20% or more in a month in at least 8 of the past 24 months or the analyst expects significant volatility going forward.
Analysts’ coverage universe weightings are distinct from analysts’ stock ratings and are based on the expected performance of an analyst’s coverage universe* versus the relevant broad market benchmark**: Overweight: Industry expected to outperform the relevant broad market benchmark over the next 12 months. Market Weight: Industry expected to perform in-line with the relevant broad market benchmark over the next 12 months. Underweight: Industry expected to underperform the relevant broad market benchmark over the next 12 months. *An analyst’s coverage universe consists of all companies covered by the analyst within the relevant sector. **The broad market benchmark is based on the expected return of the local market index (e.g., the S&P 500 in the U.S.) over the next 12 months. Credit Suisse’s distribution of stock ratings (and banking clients) is:
Global Ratings Distribution Outperform/Buy* 49% (61% banking clients) Neutral/Hold* 39% (56% banking clients) Underperform/Sell* 9% (54% banking clients) Restricted 2%
*For purposes of the NYSE and NASD ratings distribution disclosure requirements, our stock ratings of Outperform, Neutral, and Underperform most closely correspond to Buy, Hold, and Sell, respectively; however, the meanings are not the same, as our stock ratings are determined on a relative basis. (Please refer to definitions above.) An investor's decision to buy or sell a security should be based on investment objectives, current holdings, and other individual factors.
Credit Suisse’s policy is to update research reports as it deems appropriate, based on developments with the subject company, the sector or the market that may have a material impact on the research views or opinions stated herein. Credit Suisse's policy is only to publish investment research that is impartial, independent, clear, fair and not misleading. For more detail please refer to Credit Suisse's Policies for Managing Conflicts of Interest in connection with Investment Research: http://www.csfb.com/research-and-analytics/disclaimer/managing_conflicts_disclaimer.html Credit Suisse does not provide any tax advice. Any statement herein regarding any US federal tax is not intended or written to be used, and cannot be used, by any taxpayer for the purposes of avoiding any penalties. See the Companies Mentioned section for full company names. Price Target: (12 months) for (IBM) Method: Our target price of $175 for IBM implies a P/E multiple of 11.9x our 2012 EPS estimate of $14.65. We believe this is in line with the market and appropriate in our view given the quality of earnings growth (we project over 50% of incremental EPS will come from M&A and buybacks over the next five years). Risks: Risks to achievement of our $175 target price for International Business Machines Corp. include declining Information Technology spending as a result of macroeconomic downturn, increased competitive risks within server, storage, and services, as well as merger and acquisition integration risks as IBM remains acquisitive. Price Target: (12 months) for (ORCL) Method: Our price target of $42.00 for Oracle represents a next twelve months price to earning multiple of 16.9x and enterprise value to unlevered free cash flow multiple of 15.3x using our next twelve months EPS and UFCF estimates of $2.48 and $13.06 billion respectively. These multiples are below the stock's historical valuation average. Risks: Over the next twelve months, we believe Oracle faces a number of risks that could impede the stock's continued outperformance relative to the software sector and prevent it from achieving our $42.00 target price, including an uncertain macroeconomic environment that could negatively impact the company's applications business, competition with large, established companies such as Microsoft, IBM, and SAP, and an ambitious product development initiative could extend through the remainder of 2011. Please refer to the firm's disclosure website at www.credit-suisse.com/researchdisclosures for the definitions of abbreviations typically used in the target price method and risk sections.

18 October 2011
Does Size Matter Only? 115
See the Companies Mentioned section for full company names. The subject company (IBM, ORCL) currently is, or was during the 12-month period preceding the date of distribution of this report, a client of Credit Suisse. Credit Suisse provided investment banking services to the subject company (IBM, ORCL) within the past 12 months. Credit Suisse provided non-investment banking services, which may include Sales and Trading services, to the subject company (IBM) within the past 12 months. Credit Suisse has managed or co-managed a public offering of securities for the subject company (IBM) within the past 12 months. Credit Suisse has received investment banking related compensation from the subject company (IBM, ORCL) within the past 12 months. Credit Suisse expects to receive or intends to seek investment banking related compensation from the subject company (IBM, ORCL) within the next 3 months. Credit Suisse has received compensation for products and services other than investment banking services from the subject company (IBM) within the past 12 months. As of the date of this report, Credit Suisse Securities (USA) LLC makes a market in the securities of the subject company (IBM, ORCL). Important Regional Disclosures Singapore recipients should contact a Singapore financial adviser for any matters arising from this research report. The analyst(s) involved in the preparation of this report have not visited the material operations of the subject company (IBM, ORCL) within the past 12 months. Restrictions on certain Canadian securities are indicated by the following abbreviations: NVS--Non-Voting shares; RVS--Restricted Voting Shares; SVS--Subordinate Voting Shares. Individuals receiving this report from a Canadian investment dealer that is not affiliated with Credit Suisse should be advised that this report may not contain regulatory disclosures the non-affiliated Canadian investment dealer would be required to make if this were its own report. For Credit Suisse Securities (Canada), Inc.'s policies and procedures regarding the dissemination of equity research, please visit http://www.csfb.com/legal_terms/canada_research_policy.shtml. The following disclosed European company/ies have estimates that comply with IFRS: MSFT, SAPG.F. As of the date of this report, Credit Suisse acts as a market maker or liquidity provider in the equities securities that are the subject of this report. Principal is not guaranteed in the case of equities because equity prices are variable. Commission is the commission rate or the amount agreed with a customer when setting up an account or at anytime after that. CS may have issued a Trade Alert regarding this security. Trade Alerts are short term trading opportunities identified by an analyst on the basis of market events and catalysts, while stock ratings reflect an analyst's investment recommendations based on expected total return over a 12-month period relative to the relevant coverage universe. Because Trade Alerts and stock ratings reflect different assumptions and analytical methods, Trade Alerts may differ directionally from the analyst's stock rating. The author(s) of this report maintains a CS Model Portfolio that he/she regularly adjusts. The security or securities discussed in this report may be a component of the CS Model Portfolio and subject to such adjustments (which, given the composition of the CS Model Portfolio as a whole, may differ from the recommendation in this report, as well as opportunities or strategies identified in Trading Alerts concerning the same security). The CS Model Portfolio and important disclosures about it are available at www.credit-suisse.com/ti. Taiwanese Disclosures: Reports written by Taiwan-based analysts on non-Taiwan listed companies are not considered recommendations to buy or sell securities under Taiwan Stock Exchange Operational Regulations Governing Securities Firms Recommending Trades in Securities to Customers. To the extent this is a report authored in whole or in part by a non-U.S. analyst and is made available in the U.S., the following are important disclosures regarding any non-U.S. analyst contributors: The non-U.S. research analysts listed below (if any) are not registered/qualified as research analysts with FINRA. The non-U.S. research analysts listed below may not be associated persons of CSSU and therefore may not be subject to the NASD Rule 2711 and NYSE Rule 472 restrictions on communications with a subject company, public appearances and trading securities held by a research analyst account. For Credit Suisse disclosure information on other companies mentioned in this report, please visit the website at www.credit-suisse.com/researchdisclosures or call +1 (877) 291-2683. Disclaimers continue on next page.

18 October 2011Americas/United States
Equity Research
SS0081.doc
This report is not directed to, or intended for distribution to or use by, any person or entity who is a citizen or resident of or located in any locality, state, country or other jurisdiction where such distribution, publication, availability or use would be contrary to law or regulation or which would subject Credit Suisse AG, the Swiss bank, or its subsidiaries or its affiliates (“CS”) to any registration or licensing requirement within such jurisdiction. All material presented in this report, unless specifically indicated otherwise, is under copyright to CS. None of the material, nor its content, nor any copy of it, may be altered in any way, transmitted to, copied or distributed to any other party, without the prior express written permission of CS. All trademarks, service marks and logos used in this report are trademarks or service marks or registered trademarks or service marks of CS or its affiliates. The information, tools and material presented in this report are provided to you for information purposes only and are not to be used or considered as an offer or the solicitation of an offer to sell or to buy or subscribe for securities or other financial instruments. CS may not have taken any steps to ensure that the securities referred to in this report are suitable for any particular investor. CS will not treat recipients as its customers by virtue of their receiving the report. The investments or services contained or referred to in this report may not be suitable for you and it is recommended that you consult an independent investment advisor if you are in doubt about such investments or investment services. Nothing in this report constitutes investment, legal, accounting or tax advice or a representation that any investment or strategy is suitable or appropriate to your individual circumstances or otherwise constitutes a personal recommendation to you. CS does not offer advice on the tax consequences of investment and you are advised to contact an independent tax adviser. Please note in particular that the bases and levels of taxation may change. CS believes the information and opinions in the Disclosure Appendix of this report are accurate and complete. Information and opinions presented in the other sections of the report were obtained or derived from sources CS believes are reliable, but CS makes no representations as to their accuracy or completeness. Additional information is available upon request. CS accepts no liability for loss arising from the use of the material presented in this report, except that this exclusion of liability does not apply to the extent that liability arises under specific statutes or regulations applicable to CS. This report is not to be relied upon in substitution for the exercise of independent judgment. CS may have issued, and may in the future issue, a trading call regarding this security. Trading calls are short term trading opportunities based on market events and catalysts, while stock ratings reflect investment recommendations based on expected total return over a 12-month period as defined in the disclosure section. Because trading calls and stock ratings reflect different assumptions and analytical methods, trading calls may differ directionally from the stock rating. In addition, CS may have issued, and may in the future issue, other reports that are inconsistent with, and reach different conclusions from, the information presented in this report. Those reports reflect the different assumptions, views and analytical methods of the analysts who prepared them and CS is under no obligation to ensure that such other reports are brought to the attention of any recipient of this report. CS is involved in many businesses that relate to companies mentioned in this report. These businesses include specialized trading, risk arbitrage, market making, and other proprietary trading. Past performance should not be taken as an indication or guarantee of future performance, and no representation or warranty, express or implied, is made regarding future performance. Information, opinions and estimates contained in this report reflect a judgement at its original date of publication by CS and are subject to change without notice. The price, value of and income from any of the securities or financial instruments mentioned in this report can fall as well as rise. The value of securities and financial instruments is subject to exchange rate fluctuation that may have a positive or adverse effect on the price or income of such securities or financial instruments. Investors in securities such as ADR’s, the values of which are influenced by currency volatility, effectively assume this risk. Structured securities are complex instruments, typically involve a high degree of risk and are intended for sale only to sophisticated investors who are capable of understanding and assuming the risks involved. The market value of any structured security may be affected by changes in economic, financial and political factors (including, but not limited to, spot and forward interest and exchange rates), time to maturity, market conditions and volatility, and the credit quality of any issuer or reference issuer. Any investor interested in purchasing a structured product should conduct their own investigation and analysis of the product and consult with their own professional advisers as to the risks involved in making such a purchase. Some investments discussed in this report have a high level of volatility. High volatility investments may experience sudden and large falls in their value causing losses when that investment is realised. Those losses may equal your original investment. Indeed, in the case of some investments the potential losses may exceed the amount of initial investment, in such circumstances you may be required to pay more money to support those losses. Income yields from investments may fluctuate and, in consequence, initial capital paid to make the investment may be used as part of that income yield. Some investments may not be readily realisable and it may be difficult to sell or realise those investments, similarly it may prove difficult for you to obtain reliable information about the value, or risks, to which such an investment is exposed. This report may provide the addresses of, or contain hyperlinks to, websites. Except to the extent to which the report refers to website material of CS, CS has not reviewed the linked site and takes no responsibility for the content contained therein. Such address or hyperlink (including addresses or hyperlinks to CS’s own website material) is provided solely for your convenience and information and the content of the linked site does not in any way form part of this document. Accessing such website or following such link through this report or CS’s website shall be at your own risk. This report is issued and distributed in Europe (except Switzerland) by Credit Suisse Securities (Europe) Limited, One Cabot Square, London E14 4QJ, England, which is regulated in the United Kingdom by The Financial Services Authority (“FSA”). This report is being distributed in Germany by Credit Suisse Securities (Europe) Limited Niederlassung Frankfurt am Main regulated by the Bundesanstalt fuer Finanzdienstleistungsaufsicht ("BaFin"). This report is being distributed in the United States by Credit Suisse Securities (USA) LLC ; in Switzerland by Credit Suisse AG; in Canada by Credit Suisse Securities (Canada), Inc.; in Brazil by Banco de Investimentos Credit Suisse (Brasil) S.A. or its affiliates; in Mexico by Banco Credit Suisse (México), S.A. (transactions related to the securities mentioned in this report will only be effected in compliance with applicable regulation); in Japan by Credit Suisse Securities (Japan) Limited, Financial Instrument Firm, Director-General of Kanto Local Finance Bureau (Kinsho) No. 66, a member of Japan Securities Dealers Association, The Financial Futures Association of Japan, Japan Securities Investment Advisers Association, Type II Financial Instruments Firms Association; elsewhere in Asia/Pacific by whichever of the following is the appropriately authorised entity in the relevant jurisdiction: Credit Suisse (Hong Kong) Limited, Credit Suisse Equities (Australia) Limited , Credit Suisse Securities (Thailand) Limited, Credit Suisse Securities (Malaysia) Sdn Bhd, Credit Suisse AG, Singapore Branch, Credit Suisse Securities (India) Private Limited regulated by the Securities and Exchange Board of India (registration Nos. INB230970637; INF230970637; INB010970631; INF010970631), having registered address at 9th Floor, Ceejay House,Dr.A.B. Road, Worli, Mumbai - 18, India, T- +91-22 6777 3777, Credit Suisse Securities (Europe) Limited, Seoul Branch, Credit Suisse AG, Taipei Securities Branch, PT Credit Suisse Securities Indonesia, Credit Suisse Securities (Philippines ) Inc., and elsewhere in the world by the relevant authorised affiliate of the above. Research on Taiwanese securities produced by Credit Suisse AG, Taipei Securities Branch has been prepared by a registered Senior Business Person. Research provided to residents of Malaysia is authorised by the Head of Research for Credit Suisse Securities (Malaysia) Sdn. Bhd., to whom they should direct any queries on +603 2723 2020. In jurisdictions where CS is not already registered or licensed to trade in securities, transactions will only be effected in accordance with applicable securities legislation, which will vary from jurisdiction to jurisdiction and may require that the trade be made in accordance with applicable exemptions from registration or licensing requirements. Non-U.S. customers wishing to effect a transaction should contact a CS entity in their local jurisdiction unless governing law permits otherwise. U.S. customers wishing to effect a transaction should do so only by contacting a representative at Credit Suisse Securities (USA) LLC in the U.S. Please note that this report was originally prepared and issued by CS for distribution to their market professional and institutional investor customers. Recipients who are not market professional or institutional investor customers of CS should seek the advice of their independent financial advisor prior to taking any investment decision based on this report or for any necessary explanation of its contents. This research may relate to investments or services of a person outside of the UK or to other matters which are not regulated by the FSA or in respect of which the protections of the FSA for private customers and/or the UK compensation scheme may not be available, and further details as to where this may be the case are available upon request in respect of this report. Any Nielsen Media Research material contained in this report represents Nielsen Media Research's estimates and does not represent facts. NMR has neither reviewed nor approved this report and/or any of the statements made herein. If this report is being distributed by a financial institution other than Credit Suisse AG, or its affiliates, that financial institution is solely responsible for distribution. Clients of that institution should contact that institution to effect a transaction in the securities mentioned in this report or require further information. This report does not constitute investment advice by Credit Suisse to the clients of the distributing financial institution, and neither Credit Suisse AG, its affiliates, and their respective officers, directors and employees accept any liability whatsoever for any direct or consequential loss arising from their use of this report or its content. Copyright 2011 CREDIT SUISSE AG and/or its affiliates. All rights reserved.
CREDIT SUISSE SECURITIES (USA) LLC United States of America: +1 (212) 325-2000