bank performance: does bank size matter?
TRANSCRIPT

BANK PERFORMANCE: DOES BANK SIZE MATTER?
BY
PAUL KIBATHI KAGECHA
REG NO:X50/75112/2014
SUPERVISOR:
DR. P. MURIU
Research paper submitted to the School of Economics, University of Nairobi, in Partial
Fulfillment of the Requirement for the Degree of Master of Arts in Economics

i
DECLARATION
This research paper is my original work and has not been presented for a degree in any other
university.
Mr. Paul Kibathi Kagecha
Signature:………………………………..
This research paper has been submitted for examination with our approval as university
supervisors
Dr. Peter Muriu
Signature:…………………………………………
Date:………………………………………………

ii
ACKNOWLEDGEMENT
I am greatly indebted to my supervisor Dr. Peter Muriu. May I take this opportunity to thank him
for his advice, constructive criticism and valuable suggestions that helped me a lot in writing this
research paper.
The support of my family was pivotal in the completion of this research paper. My sincere
gratitude goes to my wife Mary and my parents Mr. Peter Kagecha and Mrs. Hannah Njeri who
gave me moral support, hope and encouragement in the course of my studies. Nevertheless, I
take full responsibility for any errors and omissions in this research paper.

iii
ABSTRACT
Economic theory suggests that if larger banks have a greater control of the domestic market, and
operate in a non-competitive environment, lending rates may remain high while deposit rates for
larger institutions remain lower because they are perceived to be safer. Thus, larger banks may
enjoy higher profits but empirical evidence remains inconclusive. This study sought to establish
the impact of bank size on commercial bank performance in Kenya. Using panel data for the
period 2007-2014 we employed system generalized method of moment (GMM) estimation
technique in order to overcome the endogeneity problem. The empirical findings show that for
the case of commercial banks in Kenya, size does not matter in determining bank profitability.
This implies that although scale economies are important for profitability, local markets in
Kenya do not always allow such scale economies to translate to higher profitability. The control
variables lagged profitability, market concentration, GDP growth and inflation were all
significant in explaining bank profitability.

iv
LIST OF ABBREVIATIONS
AR (1) Arellano and Bond test for First Order Serial Correlation
AR (2) Arellano and Bond test for First Second Serial Correlation
FE Fixed Effect
GDP Gross Domestic Product
GMM Generalized Method of Moment
OLS Ordinary Least Squares
RE Random Effect
ROA Return on Asset
ROE Return on Equity

v
Contents
DECLARATION............................................................................................................................ I
ACKNOWLEDGEMENT ........................................................................................................... II
ABSTRACT ................................................................................................................................. III
LIST OF ABBREVIATIONS .................................................................................................... IV
CHAPTER ONE: INTRODUCTION ......................................................................................... 1
1.1 BACKGROUND OF THE STUDY ................................................................................................. 1
1.1.1 Kenya Banking Sector .................................................................................................... 2
1.2 STATEMENT OF THE PROBLEM. ............................................................................................... 4
1.3 OBJECTIVES OF THIS STUDY .................................................................................................... 4
1.4 SIGNIFICANCE OF THE STUDY ................................................................................................. 5
CHAPTER TWO: LITERATURE REVIEW ............................................................................ 6
2.1 INTRODUCTION ....................................................................................................................... 6
2.2 THEORETICAL REVIEW ........................................................................................................... 6
2.3 EMPIRICAL REVIEW ................................................................................................................ 6
2.3.1 Bank size ......................................................................................................................... 7
2.3.2 Control Variables. .......................................................................................................... 8
2.4 OVERVIEW OF LITERATURE .................................................................................................. 10
CHAPTER THREE: METHODOLOGY ................................................................................ 11
3.1 INTRODUCTION ..................................................................................................................... 11
3.2 THEORETICAL FRAMEWORK ................................................................................................. 11
3.3 MODEL SPECIFICATION ........................................................................................................ 11
3.4 ESTIMATION AND TESTING PROCEDURES .............................................................................. 12
3.5 DATA SET AND MEASUREMENT OF VARIABLES ..................................................................... 14
3.5.1 Data Sources................................................................................................................. 14
3.5.2 Dependent Variables .................................................................................................... 14
3.5.3 Bank Specific characteristics ........................................................................................ 14
3.5.4 Industry Specific Variables ........................................................................................... 16
3.5.5 Macroeconomic Factors ............................................................................................... 17
CHAPTER FOUR: EMPIRICAL RESULTS AND DISCUSSION ....................................... 18
4.1 INTRODUCTION. .................................................................................................................... 18
4.2 DESCRIPTIVE STATISTICS ...................................................................................................... 18
4.3 CORRELATION ANALYSIS ...................................................................................................... 19
CHAPTER FIVE: SUMMARY, CONCLUSION AND POLICY IMPLICATIONS .......... 24
5.0 INTRODUCTION ..................................................................................................................... 24

vi
5.2 CONCLUSION ........................................................................................................................ 24
5.3 POLICY RECOMMENDATIONS ................................................................................................ 24
5.4 AREAS FOR FURTHER RESEARCH........................................................................................... 25
REFERENCES ............................................................................................................................ 26
APPENDICES ............................................................................................................................. 29

1
CHAPTER ONE
INTRODUCTION
1.1 Background of the study
Commercial banks play a crucial role in supporting financial markets and have a substantial
bearing on the success of an economy(Samad A. et al., 2006). The core function of financial
intermediaries is to help the movement of funds to the borrowers from the savers. Boyd and
Prescott (1986), postulates that financial intermediaries borrow from one set of agents in the
economy and lend to another; deal with borrowers whose information may be different from
theirs; produce expensive information on the qualities of would-be borrowers and use it to assign
loans and set terms; are well diversified to the extent that the subsets of borrower and lenders are
typically large and issue securities which have pay-offs that are different from the ones they
hold. The Kenyan financial sector is dominated by commercial banks which implies that a slight
failure in this sector will have adverse effect on a country‟s economic growth (Ongore and Kusa,
2013). Additionally, Adusei (2015) argues that the collapse of one bank has widespread impact
to the financial system and a country‟s economy as a whole. Its therefore important to design an
indicator framework for monitoring vulnerability in the financial sector. One of the most
important indicators is bank profitability. According to Athanasoglou et al. (2008) a banking
sector that is profitable has a higher capability to meet adversaries and also enhance the financial
systems‟ strength.
Determinants of bank performance can be put into three groups: variables that are induced by
management decision and policy objectives (bank-specific factors), variables that capture the
industry structure and market growth (industry-specific factors) and elements that reflect the
economic atmosphere under which the bank operates (macroeconomic factors). Some of the
bank characteristics include: bank size, credit risk, asset quality, management efficiency,
liquidity, default risk and capital adequacy. Industry-specific variables include market
concentration and market growth. The most commonly used macroeconomic variables include
GDP and inflation.
Large banks should take advantage of economies of scale to get cost advantages which coupled
with improved operational efficiency will lead to more profits ( Adusei, 2015 and Samad A. et

2
al., 2006).However, there exist mixed results on the effect of bank size on profitability. In
presence of considerable economies of scale, bank size will have a positive relationship with
bank profitability (Akhavein et al., 1997). There is also a possibility to have a negative link
between the size of a bank and its profitability (Sufian and Habibullah, 2009 and Košak and Čok,
2008). Goddard et al., (2004) observed no statistically significant association between the size of
a bank and its profitability. In all, it is right to say that evidence on the impact of size on
profitability of a bank is not conclusive. This study was meant to establish the association
between commercial bank size and commercial bank performance in Kenya.
1.1.1 Kenya Banking Sector
As of year 2015,there were 42 listed commercial banks in Kenya, 39 of which were privately
owned while Kenyan Government had controlling stake in the other 3 commercial bank(Central
Bank of Kenya). Four of these commercial banks have been put under receivership with the most
recent one being Chase bank limited.
Table 1: Commercial bank size in Kenya, Uganda and Tanzania: 2007-2014
Bank Size (Total Assets) Million Kshs
Year Kenya Uganda Tanzania
2007 797,237.00 205,606.06 405,412.86
2008 934,197.00 298,364.18 522,525.83
2009 1,074,617.00 344,314.60 593,579.26
2010 1,374,460.00 395,901.15 710,861.27
2011 1,602,573.00 439,991.87 821,420.17
2012 1,834,549.00 494,797.97 966,483.51
2013 2,136,656.00 593,710.15 1,097,065.80
2014 2,522,742.00 640,510.22 1,070,255.34
Source: Central bank of Kenya, Bank of Uganda and Bank of Tanzania bank supervision reports and statistical
bulletin
All figures are in Kenya Shillings based on the rate exchange at the close of each period.
One of the most commonly used measure of the size of a bank is total assets (Marinković and
Radović, 2014). The table above shows total commercial banks assets for the period 2007-2014
in Kenya, Uganda and Tanzania. It‟s evident that bank size in the three East African Countries
had a positive growth over the study period. The size of commercial banks in Kenya as measured
by the total assets increased by 68.40% from 797,327 Million in 2007 to 2,522,742 Million

3
Kenya Shillings in 2014. In Uganda, bank size grew by 67.90% from 205,606.06 Million in 2007
to 640,510.22 Million Kenya Shillings in 2014. Lastly, in Tanzania, the size of commercial
banks grew by 62.12% from 405,412.86 Million in 2007 to 1,070,255.34 Million Kenya
Shillings in 2014. From the table, it‟s evident that Kenya has the largest commercial banks,
followed by Tanzania and Uganda has the smallest.
The performance measures of commercial banks have several dimensions. One of the most
essential dimensions is profit. Profits as a measure of performance can be analyzed into two
ways: return on equity (ROE) and return on asset (ROA). Return on asset illustrates profits
gained per dollar of assets, most crucially, echoes management‟s capability to create revenue
from the assets at their disposal. ROE shows how efficiently the management of the bank is
making use of shareholders‟ funds.
Table 2: Commercial bank performance in Kenya, Uganda and Tanzania: 2007-2014
Commercial Bank Performance
Kenya Uganda Tanzania
Year ROA ROE ROA ROE ROA ROE
2007 2.70% 28.00% 3.80% 30.70% 2.90% 25.00%
2008 2.60% 26.50% 3.50% 24.80% 3.83% 23.25%
2009 2.60% 25.00% 3.00% 18.80% 3.22% 18.44%
2010 3.80% 28.20% 2.70% 18.00% 2.16% 12.13%
2011 4.40% 30.90% 4.00% 27.30% 2.53% 14.47%
2012 4.70% 30.00% 3.90% 24.20% 2.58% 13.88%
2013 4.70% 29.20% 2.50% 15.20% 2.55% 13.08%
2014 3.40% 26.70% 2.60% 16.10% 2.51% 12.56%
Source: Central Bank of Kenya, Bank of Uganda and Bank of Tanzania Bank Supervision Annual Reports: 2007-
2014
Table 2 shows commercial banks performance in Kenya, Uganda and Tanzania in terms of ROA
and ROE. In the year 2007, Ugandan commercial banks had the best performance. In 2008 and
2009, Tanzanian commercial banks had the best performance in terms of ROA while Kenyan
commercial banks had the best performance in terms of ROE. From 2010 to 2014, Kenyan
commercial banks had the best performance. From table 1, the size of the banks in the three

4
countries had a positive growth each year. However, bank performance within the same period as
shown in table 2 was a little volatile.
1.2 Statement of the problem.
Ever since the world emerged from the 2007/08 crisis, the debate on optimal bank size has
heightened (Viñals et al., 2008). Many institutions have become too large in absolute size.
However, a review of bank performance literature showed that the research on the impact of
bank size on commercial bank profitability in Kenya had not been incorporated in previous
studies. Most of the studies focused on the determinant of commercial bank profitability. Susan
Moraa Onuonga, (2014) studied the impact of internal factors on bank profitability. Ongore and
Kusa, (2013) reviewed the factors affecting commercial banks financial performance. Kiganda,
(2014) investigated the impact of macroeconomic factors on profitability of Equity Bank Ltd.
This study sought to fill this knowledge gap by exploring the effect of bank size on commercial
bank performance in Kenya.
Consistent with the research problem, this study raised the following research questions:
What is the impact of bank specific-factors on commercial bank performance in Kenya?
What is the impact of industry-specific factors on commercial bank performance in
Kenya?
What is the impact of macroeconomic conditions on commercial bank performance in
Kenya?
1.3 Objectives of this study
The main objective of this study was to investigate the effect of bank size on commercial bank
performance in Kenya. With specific objectives being:
i. To analyze the effect of bank-specific factors on commercial bank performance in Kenya.
ii. To analyze the effect of industry-specific factors on commercial bank performance in
Kenya.
iii. To analyze the effect of macroeconomic factors on commercial bank performance in
Kenya.
iv. To provide policy recommendations based on the findings in (i), (ii) and (iii) above.

5
1.4 Significance of the Study
The stability of the financial system heavily depends on profitability of banks and the factors
affecting this profitability (Mörttinen et al., 2005; Borio, 2003). The banking sector assembles
and allocates savings, sustains trade, assists in diversification of risk thus promoting economic
growth (Levine, 1997). Therefore, finding answers to the above research questions would be
important to single out the factors that determine a successful commercial bank so as to draft
policies to enhance bank performance.
This study contributed to prevailing literature by presenting new empirical evidence on the
impact of bank size on bank profitability in Kenya. Furthermore, currently, this kind of study has
not been done in the Kenyan banking sector.

6
CHAPTER TWO
LITERATURE REVIEW
2.1 Introduction
This chapter reviews iterated literature on the subject under study as presented by various
scholars, authors, researchers and analysts. The chapter is organized based on the specific
objectives in order to ensure relevance of the problem. The chapter provides a distinct
comprehension of prevailing knowledge on the topic under study. The specific areas covered
include the theoretical underpinning of the study and the empirical review which include bank
size, liquidity, capital adequacy, asset quality, age, market concentration, GDP and inflation.
2.2 Theoretical Review
The agency theory, stewardship theory and the inverted U-curve theory can help explain the link
between commercial bank size and profitability. Agency theory of the firm suggests that the
interests of shareholders and managers are in constant conflict. The actions and decisions of
managers are skewed towards personal gain. This implies that the managers can increase the size
of the bank to gain more power and earn higher salaries. According to this theory, bank size will
have a negative influence on bank profitability. Stewardship theory suggests that managers are
naturally trustworthy and hence are not susceptible to misuse firm‟s resources (Davis et al.,
1997). Stewardship theory postulates that managers are good stewards of the corporate assets.
The inverted U-curve theory suggests that profitability will first rise as the bank size increases,
eventually level-off overtime, and then begin to fall as the bank becomes extremely large. A
large financial institution can contract with a huge number of borrowers which results in
diversification which further reduces the anticipated cost of overcoming information
asymmetries. This results in cost savings which leads to higher profits. In other words, a large
bank will be able to take advantage of economies of scale. The counter argument is that as the
bank becomes too large, profits will start to fall because of bureaucratic reasons thus exhibiting a
nonlinear relationship.
2.3 Empirical Review
There are three major categories of factors determining bank profitability which include bank-
specific factors, macroeconomic environment and industry-specific factors. This section will

7
discuss five bank-specific factors (Bank size, Age, Liquidity, Capital adequacy and Asset
quality) one industry specific variable (Concentration) and two macroeconomic factors (Inflation
and GDP).
2.3.1 Bank size
In the banking industry, the size of a bank is used to capture economies and diseconomies of
scale. The size of a bank is computed as the logarithm of total assets. We also include size
squared (S2
) in the model so as to account for potential nonlinearities due to diseconomies of
scale as the bank becomes extremely large.
Using panel data analysis, Pervan et al., (2015) studied profit persistence and factors determining
bank profitability in Croatia within the period 2002 to 2010 and realized a positive and
significant association between bank size and profitability. Total assets were log transformed to
capture bank size and applied the Arellano and Bond, (1991) GMM estimation technique. Their
results postulate that banks should make use of their size to exploit cost advantages whose
realization together with improved management would contribute to further increases in
efficiency which would result into higher profitability. This is in conformity with earlier studies
that realized a significantly positive association between bank size and profitability (Adusei,
2015;Pervan and Pervan, 2010; Flamini et al., 2009 and Kosmidou, 2008)
The above findings are however in sharp contrast with the findings of Naceur and Goaied,
(2008) who studied the impact of macroeconomic environment, financial structure and bank
specific characteristics on the profitability of Tunisian bank‟s from 1980-2000.The study found
out that bank size had a negative influence on profitability. This study applied Fixed effect (FE)
model, Random coefficient model and Random effect (RE) model. According to Košak and Čok,
(2008), the negative relationship can be as a result of diseconomies of scale that are associated
with large banks especially after accelerated growth periods.
Heffernan and Fu, (2008) used system GMM to study the profitability of different Chinese banks
from 1999-2006 and found that bank size had no statistically significant influence on bank
performance. Their findings are in conformity with the outcomes of Goddard, (2004) and
Athanasoglou, (2008).
8
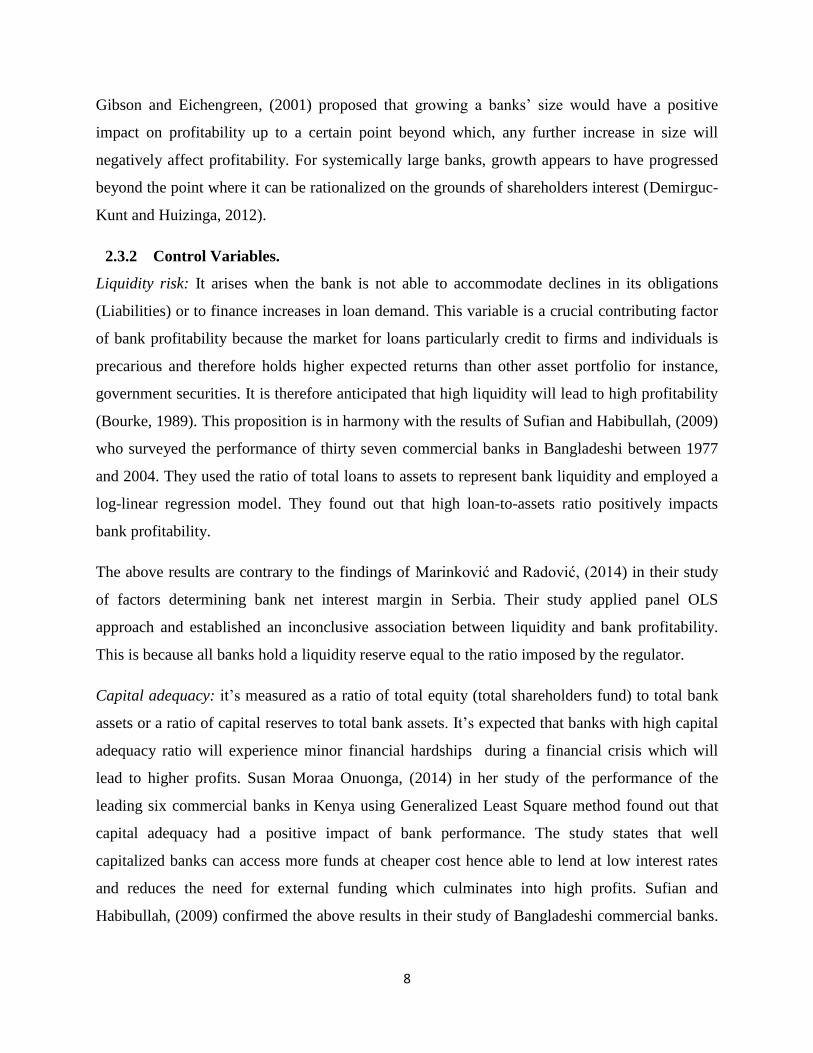
Gibson and Eichengreen, (2001) proposed that growing a banks‟ size would have a positive
impact on profitability up to a certain point beyond which, any further increase in size will
negatively affect profitability. For systemically large banks, growth appears to have progressed
beyond the point where it can be rationalized on the grounds of shareholders interest (Demirguc-
Kunt and Huizinga, 2012).
2.3.2 Control Variables.
Liquidity risk: It arises when the bank is not able to accommodate declines in its obligations
(Liabilities) or to finance increases in loan demand. This variable is a crucial contributing factor
of bank profitability because the market for loans particularly credit to firms and individuals is
precarious and therefore holds higher expected returns than other asset portfolio for instance,
government securities. It is therefore anticipated that high liquidity will lead to high profitability
(Bourke, 1989). This proposition is in harmony with the results of Sufian and Habibullah, (2009)
who surveyed the performance of thirty seven commercial banks in Bangladeshi between 1977
and 2004. They used the ratio of total loans to assets to represent bank liquidity and employed a
log-linear regression model. They found out that high loan-to-assets ratio positively impacts
bank profitability.
The above results are contrary to the findings of Marinković and Radović, (2014) in their study
of factors determining bank net interest margin in Serbia. Their study applied panel OLS
approach and established an inconclusive association between liquidity and bank profitability.
This is because all banks hold a liquidity reserve equal to the ratio imposed by the regulator.
Capital adequacy: it‟s measured as a ratio of total equity (total shareholders fund) to total bank
assets or a ratio of capital reserves to total bank assets. It‟s expected that banks with high capital
adequacy ratio will experience minor financial hardships during a financial crisis which will
lead to higher profits. Susan Moraa Onuonga, (2014) in her study of the performance of the
leading six commercial banks in Kenya using Generalized Least Square method found out that
capital adequacy had a positive impact of bank performance. The study states that well
capitalized banks can access more funds at cheaper cost hence able to lend at low interest rates
and reduces the need for external funding which culminates into high profits. Sufian and
Habibullah, (2009) confirmed the above results in their study of Bangladeshi commercial banks.

9
Other studies in support of the above findings include Molyneux and Forbes, 1995 and Berger,
1995.
Asset quality: This is measured by the ratio of non-performing loans to total loans. This is
because loan is a key income generating asset for commercial banks. A lower ratio shows a
healthy loan portfolio and it‟s expected to impact positively on bank profitability (Sangmi and
Nazir, 2010).
Age: Large amounts of empirical research has been generated to explain the importance of age
in firms‟ performance. Beck et al (2005) shows that older institutions perform worse than new
entrants. This results are confirmed by Hsiu-Ling et al (2007) who established that the older the
bank, the worse the ROA.
Market concentration: According to economic theory, there is a likelihood that market
concentration will ether positively or negatively affect bank profitability. Pervan, (2015) in their
study of factors determining profitability and persistence of profits in the Croatian banking sector
within the period 2002-2010 found out that concentration (CR4d) had a positive and statistically
significant influence on profitability. Their study employed Generalized Methods of Moments
estimation technique and used the deposit shares of the four largest commercial banks to
compute the concentration ratio. The above findings are in conformity with Demirguc-Kunt and
Huizinga, (1999),Gilbert, (1984) and Rhoades, (1982). They suggest a monotonic link between
the concentration of a firm and superior performance.
Macroeconomic factors: The two most commonly used macroeconomic variables include GDP
and inflation. GDP measures the overall health of the economy. The intuition is that with
economic growth, business environment is improved and barriers to entry are lowered, this leads
to high competition which causes profitability reduction(Tan and Floros, 2012). On the other
hand, increasing GDP suggests an improvement in the general income in an economy and thus
profit enhancing (Kosmidou, 2008).Other researchers who established a positive impact of GDP
growth on bank performance include Pervan et al., (2015) and Sufian and Habibullah, (2009).
Inflation can either be anticipated or unexpected. If it‟s anticipated, bank management will have
a chance to adjust interest rates appropriately which enhances profitability (Perry, 1992). The
above positive link is supported by Guru et al., (2002), who studied profitability determinants in

10
the Malaysian banking sector from 1986-1995. On the other hand, unexpected inflation causes
cash flow problems to borrowers leading to abrupt abrogation of loan arrangements negatively
affecting bank profitability. Pervan et al., (2015) in their study of profit persistence and factors
determining bank profitability in Croatia found out that inflation had a negative influence on
bank performance. The negative link is supported by Sufian and Habibullah, (2009).
2.4 Overview of Literature
A review of previous literature in the former section shows that the effect of a variety of factors
that determine bank performance is inconclusive. Most of the studies done in Kenya examined
the determinants of bank profitability (Susan Moraa Onuonga, 2014;Kiganda, 2014;Ongore and
Kusa, 2013). From the literature review, the key determinants of profitability include bank
characteristics (bank size, liquidity, capital adequacy, asset quality, default risk, management
efficiency and bank age), industry characteristics (market growth and market concentration) and
macroeconomic environment (economic growth and inflation rate). It‟s worthwhile to note that
no study in Kenya has focused entirely on the effect of commercial bank size on commercial
bank profitability. Therefore, this study aims at filling this gap.

11
CHAPTER THREE
METHODOLOGY
3.1 Introduction
The methodology employed in determining how bank profitability is influenced by bank size is
presented in this chapter. The variables used in the study are explained, including sources of data
and diagnostic tests to be performed on the data.
3.2 Theoretical Framework
We discussed the impact of commercial bank size on profitability as we controlled for other
factors that influence bank profitability which include: liquidity, capital adequacy, age, asset
quality, market concentration and macroeconomic factors. We employed three sets of theories
which include: stewardship theory, agency theory and inverted U-curve theory. Stewardship
theory forecasts that bank size will have a positive impact on bank profitability. The agency
theory predicts that bank size will negatively affect bank performance. Alternatively, the inverted
U-curve theory suggests that bank profitability will first rise as the bank size increases,
eventually level-off overtime, and then begin to fall as the bank becomes extremely large.
Establishing the link that exist between commercial bank size and profitability will enable policy
makers to formulate policies that will enhance profitability of commercial banks.
3.3 Model Specification
Considering the dynamic nature of commercial bank profits, a model with dynamic specification
was formulated. The previous period‟s profit is included in the model as a determinant of
profitability in the present period. The model takes the form:
= ∑
∑
∑
12
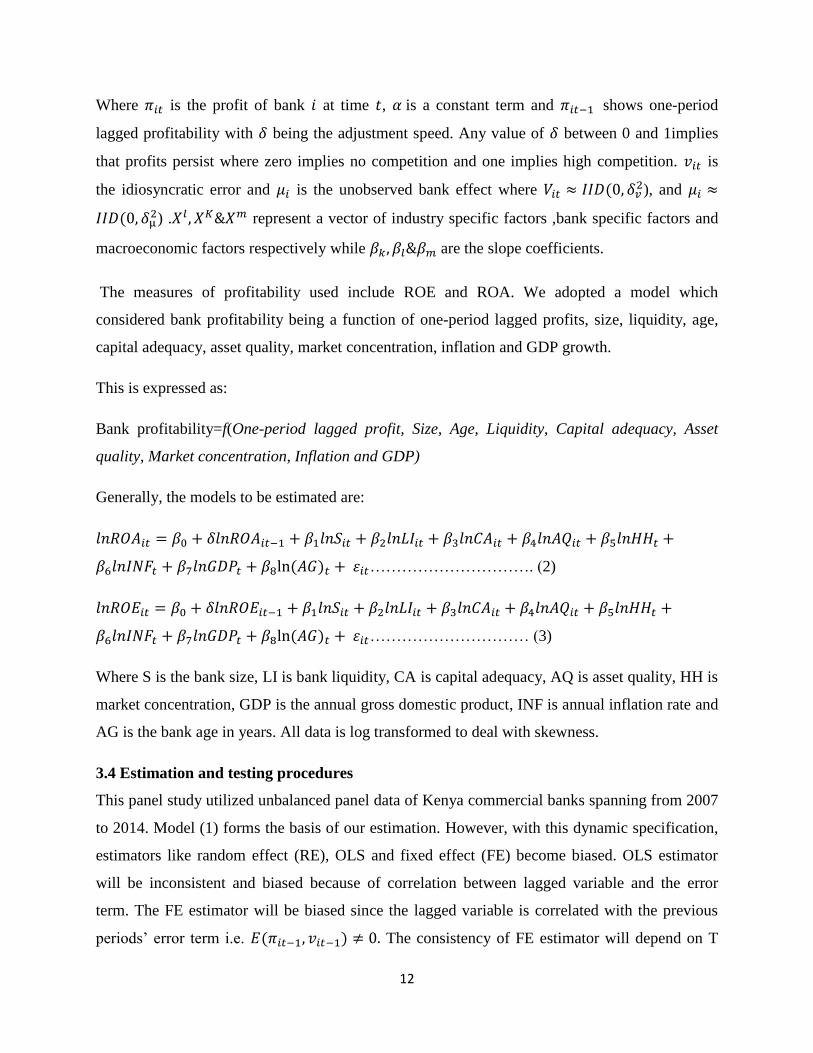
Where is the profit of bank at time , is a constant term and shows one-period
lagged profitability with being the adjustment speed. Any value of between 0 and 1implies
that profits persist where zero implies no competition and one implies high competition. is
the idiosyncratic error and is the unobserved bank effect where ), and
) . represent a vector of industry specific factors ,bank specific factors and
macroeconomic factors respectively while are the slope coefficients.
The measures of profitability used include ROE and ROA. We adopted a model which
considered bank profitability being a function of one-period lagged profits, size, liquidity, age,
capital adequacy, asset quality, market concentration, inflation and GDP growth.
This is expressed as:
Bank profitability=f(One-period lagged profit, Size, Age, Liquidity, Capital adequacy, Asset
quality, Market concentration, Inflation and GDP)
Generally, the models to be estimated are:
…………………………. (2)
………………………… (3)
Where S is the bank size, LI is bank liquidity, CA is capital adequacy, AQ is asset quality, HH is
market concentration, GDP is the annual gross domestic product, INF is annual inflation rate and
AG is the bank age in years. All data is log transformed to deal with skewness.
3.4 Estimation and testing procedures
This panel study utilized unbalanced panel data of Kenya commercial banks spanning from 2007
to 2014. Model (1) forms the basis of our estimation. However, with this dynamic specification,
estimators like random effect (RE), OLS and fixed effect (FE) become biased. OLS estimator
will be inconsistent and biased because of correlation between lagged variable and the error
term. The FE estimator will be biased since the lagged variable is correlated with the previous
periods‟ error term i.e. The consistency of FE estimator will depend on T

13
being large. RE generalized least square estimator will be biased since after quasi-demeaning is
performed, ̅ and ̅ will be correlated. The instrumental variable
estimator will be consistent but not necessarily efficient since it doesn‟t consider each and every
moment condition. As proposed by Arellano and Bond, (1991), GMM estimation can overcome
the above problems. Some of the greatest advantages of GMM is that it does not need
distributional assumptions such as normality and can permit for heterogeneity of unfamiliar form
(Marno Verbeek, 2004).
However, Arellano and Bond estimator is inefficient when applied to panel data with small T and
with weak instruments. We therefore adopt system GMM estimator proposed by Blundell and
Bond (1998). The system GMM estimator reduces the finite sample bias, improves the accuracy
of the estimates and controls for unobserved heterogeneity. We use two-step GMM estimation.
The two-step GMM estimator uses the first step GMM estimator errors to construct
heteroscedasticity-consistent standard errors while one-step estimator assumes homoscedastic
errors. Therefore, the two-step estimator is more efficient than one-step estimator even when the
error term is homoscedastic. However, the standard errors of the two-step estimator are
downward biased due to estimation of the weighting matrix and hence we used corrected
standard errors as proposed by Windmeijer (2005).
The tests performed on the econometric model (1) are as follows: First, we test for over-
identification of the model. Second, we test for first and second-order serial correlation.
We test the validity of our model using Hansen test of over-identification. The value of Hansen J
test should exceed 0.05 in order to exclude the possibility of endogenous instrumental variables
(Pervan et al., 2015). If we do not reject null hypothesis, it means that all moment conditions are
met and all the instrumental variables are accepted.
Serial correlation (First and Second order) is tested by computing Arellano and
Bond tests. will test for the independence of residual difference while will test for
lack of second-order serial correlation in the first difference residuals (Arellano and Bond, 1991).

14
3.5 Data set and measurement of Variables
3.5.1 Data Sources
Annual data on bank specific variables and industry specific variables was pulled together from
annual financial statements of Kenya‟s commercial banks within the period 2007-2014. This data
is available in the bank supervision reports of Central Bank of Kenya. Macroeconomic variables
are retrieved from Kenya National Bureau of Statistics database.
3.5.2 Dependent Variables
The study uses two measures of bank profitability which include ROE and ROA. ROA is
computed as follows:
The ratio shows the profits earned per a dollar of asset, most essentially, it indicates
management‟s ability to utilize banks resources to make profits (Dietrich and Wanzenried,
2011).
ROE is another measure of profitability and its calculated as follows:
3.5.3 Bank Specific characteristics
Bank Size (S): It captures economies and diseconomies of scale. The log transformed total assets
represents bank size (Amindu and Wolf, 2013). It can also be computed as natural logarithm of
customer deposits. Some of the studies that use logarithm of total assets to represent bank size
include: (Sufian and Habibullah, 2009; Adusei, 2015and Demirguc-Kunt and Huizinga, 2012).
Empirical results on the bearing of bank size on bank profitability are mixed. To account for
potential nonlinearities due to diseconomies of scale as the bank becomes extremely large, we
include size squared (S2) in the model. Therefore, we predict an indeterminate link between bank
size and bank profitability.

15
Asset Quality (AQ): It‟s measured as the ratio of non-performing loans to total loans. It shows
the quality of a banks‟ loan portfolio (Samad A. et al., 2006). We therefore postulate a positive
link between asset quality and bank profitability.
Table 3: Summary of variables and measurements
Variable Measure Expected sign effect Source
ROA Ratio of Net profit before tax
to total assets
CBK
ROE Ratio of Net profit before tax
and interest to total assets
CBK
Bank Specific
Characteristics
Bank size
S
Natural log of total assets Indeterminate CBK
Capital Adequacy
CA
Total equity to total assets
ratio
Positive CBK
Liquidity
LI
Total loans to total assets
ratio
Positive CBK
Age
AG
Number of years Negative CBK
Asset Quality
AQ
Non-performing loans to total
loans ratio
Positive CBK
Industry Specific
Variables
Market Concentration
(HH)
Herfindahl Hirshman Index
(Crd4)
Positive CBK

16
Macroeconomic
Condition
Gross Domestic
Product (GDP)
Annual GDP growth Positive KNBS
Inflation (INF) Growth in consumer price
index
Negative KNBS
Capital Adequacy (CA): It‟s measured as a ratio of total equity to total bank assets. This ratio
reflects the financial leverage degree of a bank. A greater equity asset ratio implies high risk
aversion and safeguard to bank default risk. Molyneux, 1993 postulates that high amount of
equity reduces capital cost thus triggering a positive effect on profitability. Other studies that
support the positive link between high capitalization and profitability include: Berger, 1995;
Sufian and Habibullah, 2009 and Pervan et al., 2015. We therefore postulate that capital
adequacy will have a positive influence on bank profitability.
Liquidity (LI): This shows bank‟s capability to accommodate its financial liabilities when they
fall due. Total loans to assets ratio represents bank liquidity. Some of the studies that have used
this ratio to represent bank liquidity include: Sufian and Habibullah, 2009 and Bourke, 1989. A
higher ratio shows that the bank has more of its assets in loans. This implies a high credit risk
exposure which implies a higher rate of interest to be charged hence high profits earned (Curak
et al., 2012). It‟s therefore expected that high liquidity will lead to high bank profitability.
Age (AG): The total number of years that a bank has been in operation will be used to capture the
age of the bank. Age captures learning effect. We expect a negative association between bank
age and performance.
3.5.4 Industry Specific Variables
Market Concentration (HH): It is computed as the deposits share of the four biggest commercial
banks in overall bank deposits. It‟s measured by the Herfindahl-Hirschman index. The smaller
the index, the higher the competition and the smaller the concentration. Pervan et al., 2015 in
their study of profit persistence and profitability determinants of Croatian commercial banks
used the deposits share of the largest four banks to compute the concentration ratio. Most of the

17
studies suggest a monotonic association between firm‟s concentration and superior performance
(see Gilbert, 1984, Rhoades, 1982 and Heggestad and Mingo, 1977). We therefore expect that
market concentration to positively influence profitability.
3.5.5 Macroeconomic Factors
Gross domestic product (GDP) growth: This measures the overall health of the economy. The
variable has different results in different studies. Some studies suggest an inverse association
between growth of GDP and bank profitability (Tan and Floros, 2012) while others suggest a
direct relationship (Pervan et al., 2015;Sufian and Habibullah, 2009). We therefore expect GDP
growth to positively influence profitability.
Inflation (INF): This is used as a measure of macroeconomic stability and its computed by the
annual consumer price index. The Fishers equation is the rational for including annual inflation
rate. Fishers equation postulates that based on market expectations of inflation rates in the future,
that nominal interest rates will be adjusted thus increasing the difference between interest
expense and interest revenue (Marinković and Radović, 2014). High inflation rates threaten firms
and household liquidity, reducing their ability to pay back loans hence negatively affecting
profitability. We therefore postulate that inflation will negatively influence bank profitability.

18
CHAPTER FOUR
EMPIRICAL RESULTS AND DISCUSSION
4.1 Introduction.
This chapter presents the findings of the study. This includes the summary statistics, GMM
estimation results and diagnostic tests.
4.2 Descriptive statistics
Table 4 presents summary statistics. The mean and the standard deviation for ROA and ROE are
within the expected range. However, there is a wide range between the minimum and the
maximum ROA and ROE. ROE ranges from -17% to approximately 30% with a median of 2.9%
and a mean of 2.7% implying that a few observations fell above the mean while a majority of
observations were clustered below the mean. ROE ranges from -17% to approximately 45% with
a mean of 6.4% and a median of 6.6%. The positive average ROA and ROE implies that the
Kenyan banking sector is moderately profitable. This is consistent with Ongore and Kusa, (2013)
who found positive average ROA and ROE in their study of the determinants of financial
performance of commercial banks in Kenya.
Table 4: Summary Statistics.
Variable Notation Obs Mean Median Std Dev Max Min
Return on asset ROA 333 0.0272 0.0292 0.0343 0.3066 -0.1752
Return on equity ROE 333 0.0641 0.0663 0.0488 0.4494 -0.1743
Capital adequacy CA 333 0.1753 0.1490 0.1185 1.1241 0.0271
Asset quality AQ 331 0.0864 0.0527 0.1090 1.0510 0
Liquidity ratio LI 333 0.5692 0.5504 0.4663 6.3791 0

19
Log size S 333 23.6615 23.4063 1.3633 26.6554 20.0120
Age AG 333 28.1832 18 25.686 118 1
Market concentration HH 336 0.0493 0.0469 0.0103 0.0653 0.0372
GDP growth (%) GDP 336 5.0594 5.5076 2.3104 8.4028 0.2323
Inflation rate (%) INF 336 9.6702 8.5996 4.3374 18.3055 3.8104
4.3 Correlation analysis
Table 5 shows the correlation analysis. According to Kennedy (2008), multicollinearity becomes
a problem if the correlation coefficient is more than 0.7. There is a positive correlation between
bank profitability (ROA) and banks size (S), capital adequacy (CA), GDP growth and bank age
(AG). As the bank size increases, bank profitability tends to increase. Banks that are well
capitalized face lesser cost of funding and hence as capitalization increases, bank profitability
increases as well. As the banks become older, their profitability tends to increase. This confirms
the learning effect. However, there is a negative correlation between ROE and capital adequacy.
This implies that banks operate too carefully and ignoring lucrative investment prospects. The
banks face a high cost of funding due to low capitalization and hence the negative correlation
with bank performance (ROE).
Asset quality (AQ) and market concentration (HH) have a negative correlation with bank
performance (ROE & ROA). The negative correlation between asset quality and bank
performance implies that as the level of non-performing loans increases, bank profitability
decreases. The negative correlation between market concentration and bank performance implies
that high competition negatively affects bank profitability.
Table 5: Correlation Matrix
ROA ROE CA AQ LI AG HH INF GDP S
ROA 1
ROE
0.5634
1
CA 0.1542 -0.0801 1
AQ -0.3736 -0.2352 0.0995 1
LI -0.089 0.082 0.1018 -0.0539 1
AG 0.3906 0.1396 -0.1221 -0.1414 -0.1378 1
HH -0.039 -0.1445 -0.0105 -0.0089 0.1004 -0.1038 1

20
INF -0.0417 0.0504 -0.0332 -0.0537 0.0775 -0.0091 0.1685 1
GDP 0.0293 0.0407 -0.0233 -0.0005 -0.0577 0.0374 -0.517 -0.6841 1
S 0.4232 0.2656 -0.2896 -0.3282 -0.055 0.4645 -0.290 -0.0098 0.1127 1
4.4 Estimation results and discussion
Determining the extent to which bank performance depends on bank size was the key objective
of this study. A more comprehensive model specification to test further this link, was guided by
the summary statistics in the previous sub-section. Table 6 shows estimation results using system
GMM as discussed in chapter three. The regression results for ROA were not plausible as
indicated by AR (2) test and hence not discussed here (see in the appendix).
The estimated equation fits the panel reasonably well as indicated by the F test. The test has a p
value of less than 5% thus rejecting the null hypothesis that all coefficients in our regression are
equal to zero. The results show the presence of negative first-order autocorrelation. However,
this does not imply inconsistent results because this case is rejected by AR (2) tests for the null
hypothesis that there is no serial correlation in the first difference residuals. The p-value for the
second order autocorrelation implies that the moment conditions of the model are valid. This
further implies that the estimates of the model are consistent (Arellano and Bond, 1991). The
Hansen J test of over identifying restrictions shows a p-value of 0.468. This test has the null
hypothesis that the instruments as a group are exogenous. The results show a p-value greater than
0.05 implying that our instruments choice is valid.
The speed of adjustment is highly significant confirming the dynamic nature of the model. It
takes the value of approximately 0.65 implying that profits persist in the Kenyan banking sector.
This further implies that the Kenyan banking sector is not competitive. The results confirm the
findings of Pervan et al., (2015). The findings signal barriers to competition reflecting either
impediments to market competition or informational asymmetry, Berger et al., (2000). This may
also indicate the existence of market power in the industry.

21
Table 6: Two-step system GMM estimation results (dependent variable: ROE)
Variant model specification
Variable Notation 1 2
Lagged ROE 0.6451*
(7.68)
0.6451*
(7.68)
Bank size S 0.0856
(1.56)
Size squared S2
0.0428
(1.56)
Capital adequacy CA 0.0845
(0.34)
0.0845
(0.34)
Asset quality AQ -0.0759
(-1.09)
-0.0759
(-1.09)
Liquidity LI -0.1639
(-1.01)
-0.1639
(-1.01)
Age AG -0.1031
(-1.34)
-0.1031
(-1.34)
Market concentration HH 0.5219*
(2.06)
0.5219*
(2.06)
Inflation INF 0.1251*
(2.41)
0.1251*
(2.41)
GDP growth GDP 0.0755*
(2.25)
0.0755*
(2.25)
F -test F(9, 42)=135.26
Prob>F =0.000
F(9, 42)=135.26
Prob>F =0.000
Hansen Ja χ2(8) = 7.65
Prob>chi2=0.468
χ2(8) = 7.65
Prob>chi2=0.468

22
AR(1)b z=-2.86
p-value=0.004
z=-2.86
p-value=0.004
AR(2)c
z=1.19
p-value=0.233
z=1.19
p-value=0.233
This table shows regression results to determine the impact of bank size on performance while controlling for
macroeconomic, industry specific and bank specific factors.
Estimations were performed using two-step system GMM.
T-statistics are in parenthesis and significance at 1% is noted by *.
Estimation at 5% and 10% produced no changes in significance of estimates hence not included.
Bank Size
Contrary to theory, the impact of bank size on bank performance is positive but not statistically
significant. We also did not find evidence of non-linear effects on bank size. This implies the
absence of significant economies of scale in the Kenyan banking sector. The results confirm the
findings of Heffernan and Fu, (2008) in their study of profitability of different Chinese banks for
the period 1996-2006. The insignificant link between bank size and bank performance confirms
the agency theory of the firm. A growth strategy in the Kenyan banking sector may not be to the
best interest of the shareholders. The results can further be elucidated by the fact that small sized
and new banks place a lot of emphasis on growing faster than improving profitability.
The results show that the effect of capital adequacy on bank profitability is positive but
statistically insignificant. We cannot confirm the results of Ongore and Kusa, (2013) who found
a positive and statistically significant association between capital adequacy and bank
performance in Kenya. Our results show that capital adequacy does not matter in determining
bank profitability. This implies that most profitable banks neither finance their operations with
debt instruments nor equity.
Asset quality shows negative but insignificant impact on bank profitability implying that it
doesn‟t matter in determining bank profitability. Liquidity is negatively related with bank
profitability but the relationship is statistically insignificant. This is supported by the fact that
liquidity management is more related to fulfilling depositors obligations which is consistent with
Ongore and Kusa, (2013). Bank age had a negative and statistically insignificant impact of bank
profitability. This fails to confirm the learning effect in Kenyan banking sector.

23
Market concentration had a positive and significant relationship with bank profitability. As
concentration increases, competition decreases and profitability increases. One of the paradigm
that advocates for this relationship is structure conduct performance paradigm which postulates
that the most important profitability determinant is increased market power driven by increased
market growth and concentration. A profitability enhancing market growth ensues when demand
for bank products and services rises as a result of better quality services and acceptable price.
The results confirm the findings of Pervan et al., (2015), Gilbert, (1984) and Rhoades, (1982).
The level of inflation, measured by CPI had a positive and significant effect on bank
profitability. This implies that inflation was anticipated and hence the bank management had a
chance to adjust interest rates accordingly further increasing the spread between interest revenue
and interest expense causing a positive effect on profitability. The results are in conformity with
the findings of Guru et al., (2002) who studied profitability determinants in the Malaysian
banking sector from 1986-1995 and found a positive link between inflation and bank
performance. The results do not however confirm the findings of Pervan et al., (2015) and Sufian
and Habibullah, (2009) who found a negative link between inflation and bank performance.
GDP growth has a positive and significant impact on bank performance. This suggests an
improvement in the general income in the economy is profit enhancing. GDP growth positively
affects loan demand and supply of deposits hence the positive impact on bank profitability. The
positive relationship is supported by Pervan et al., (2015), Sufian and Habibullah, (2009) and
Kosmidou, (2008).The results did not confirm the findings by Tan and Floros, 2012) that with
economic growth, business environment is improved and barriers to entry are lowered leading to
high competition which reduces profitability.

24
CHAPTER FIVE
SUMMARY, CONCLUSION AND POLICY IMPLICATIONS
5.1 Introduction
This study investigates the impact of bank size on bank performance in Kenya‟s commercial
banks. The impact of bank size on bank profitability is analyzed by specifying a framework that
uses macroeconomic factors, industry specific factors and bank specific factors. The study uses
dynamic panel data of Kenyan commercial banks spanning from 2007-2014.
5.2 Summary of findings
Estimation results show that bank size doesn‟t matter towards bank profitability. Bank size has a
positive and statistically insignificant impact on bank profitability. The impact of inflation on
bank performance is positive and significant. The implication is that commercial banks in Kenya
properly anticipate inflation and adjust prices of their services accordingly. GDP growth has a
positive impact on commercial bank profitability in Kenya. Market concentration has a positive
and significant on profitability. This implies that banking industry in Kenya is not competitive.
The previous period profitability was positive and statistically significant implying that profits
persist in the Kenyan banking sector which also points to non-competitive banking industry.
5.3 Conclusion
From the results of the study, we have established that bank size, capital adequacy, liquidity, age
and asset quality do not count in determining bank profitability in Kenya. Additionally, we have
established that previous period‟s profit, GDP growth, inflation and market concentration have a
positive and statistically significant effect on bank profitability in Kenya. To the extent that
market concentration positively affects bank profitability, commercial banks should intensify
their deposit mobilization efforts in order to increase profitability.
5.4 Policy Recommendations
The research results have implications for both the bank management and the policy makers.
Since bank size is insignificant in determining bank profitability, banks should not purse
strategies for increased growth. The results do not show the presence of significant economies of
scale to warrant increased profitability through increased growth.
25
Policy makers should come up with policies that enhance GDP growth and macroeconomic
stability so as to enhance profitability in the banking sector in Kenya. GDP growth positively
affects various factors of demand for and supply of loans thereby promoting profitability in the
banking sector while a monetary policy that enhances price stability would reduce the
household‟s liquidity risk and subsequently their default risk thereby improving banks
profitability. Considering the positive and significant link between concentration and bank
profitability, policy makers should also come up with policies that enhance fair competition in
the financial sector. This is because as the bank increases its share of customer deposits, its
profitability increases and this can lead to monopoly power.
5.5 Areas for further research
This study has established an insignificant link between bank size and bank performance but
further studies needs to be done to establish the optimal bank size while incorporating market
value measures of performance. Additionally, some variables used in other studies were
excluded in this study such as management efficiency and technological development. Therefore,
further research that includes these variables should be done to establish if and why there may be
changes in estimated parameters.

26
References
Adusei, M. (2015). Bank profitability: Insights from the rural banking industry in Ghana. Cogent
Econ. Finance3, 1078270.
Akhavein, J. D., Berger, A. N., and Humphrey, D. B. (1997). The Effects of Megamergers on
Efficiency and Prices: Evidence from a Bank Profit Function. Rev. Ind. Organ.12, 95–
139.
Arellano, M. and Bond, S. (1991). Some Tests of Specification for Panel Data: Monte Carlo
Evidence and an Application to Employment Equations. Rev. Econ. Stud.58, 277–297.
Athanasoglou, P. P., Brissimis, S. N., and Delis, M. D. (2008). Bank-specific, industry-specific
and macroeconomic determinants of bank profitability. J. Int. Financ. Mark. Inst.
Money18, 121–136.
Berger, A. N. (1995). The Relationship between Capital and Earnings in Banking. J. Money
Credit Bank.27, 432–456.
Berger, A.N., Bonime, S.D., Covitz, D.M., Hancock, D., (2000), „„Why are bank profits so
persistent? The roles of product market competition, information opacity and regional
macroeconomic shocks‟‟, Journal of Banking and Finance, 24:1203–1235
Blundell, R and Bond, S. (1998), „„Initial conditions and moment restrictions in dynamic panel
data models‟‟, Journal of Econometrics, 87:115-143.
Bond, S and Windmeijer, F. (2002), „„Finite Sample inference for GMM estimators in Linear
Panel Data Models‟‟, Cemmap Working paper series No. CWP04/02, Institute for
Fiscal studies, London
Borio, C. (2003). Towards a Macroprudential Framework for Financial Supervision and
Regulation? CESifo Econ. Stud.49, 181–215.
Bourke, P. (1989). Concentration and other determinants of bank profitability in Europe, North
America and Australia. J. Bank. Finance13, 65–79.
Boyd, J. H. and Prescott, E. C. (1986). Financial intermediary-coalitions. J. Econ. Theory38,
211–232.
Central Bank of Kenya Bank Supervision Reports.
Curak, M., Poposki, K., and Pepur, S. (2012). Profitability Determinants of the Macedonian
Banking Sector in Changing Environment. Procedia - Soc. Behav. Sci.44, 406–416.
Davis, J. H., Schoorman, F. D., and Donaldson, L. (1997). Toward a Stewardship Theory of
Management. Acad. Manage. Rev.22, 20–47.
Demirguc-Kunt, A. and Huizinga, H. (2012). “Do we need big banks ? evidence on performance,
strategy and market discipline,” Rep. No. WPS5576. The World Bank.

27
Demirguc-Kunt, A. and Huizinga, H. (1999). Determinants of commercial bank interest margins
and profitability : some international evidence. World Bank Econ. Rev.13, 379–408.
Dietrich, A. and Wanzenried, G. (2011). Determinants of bank profitability before and during the
crisis: Evidence from Switzerland. J. Int. Financ. Mark. Inst. Money21, 307–327.
Eichengreen, B. and Gibson, H. D. (2001). “Greek Banking at the Dawn of the New
Millennium,” Rep. No. ID 269391. Social Science Research Network, Rochester, NY.
Flamini, V., Schumacher, M. L., and McDonald, M. C. A. (2009). “The Determinants of
Commercial Bank Profitability in Sub-Saharan Africa.” International Monetary Fund.
Gilbert, R. A. (1984). Bank Market Structure and Competition: A Survey. J. Money Credit
Bank.16, 617–645.
Goddard, J., Molyneux, P., and Wilson, J. O. S. (2004). The profitability of European banks: A
cross-sectional and dynamic panel analysis. Manch. Sch., 363–381.
Guru, Staunton, and Shanmugam (2002). Determinants of Commercial Bank Profitability in
Malaysia. In “Working Paper, Multimedia University.”
Heffernan, S. and Fu, M. (2008). “The Determinants of Bank Performance in China,” Rep. No.
ID 1247713. Social Science Research Network, Rochester, NY.
Heggestad, A. A. and Mingo, J. J. (1977). The Competitive Condition of U.S. Banking Markets
and the Impact of Structural Reform. J. Finance32, 649–661.
Hsiu-Ling W, Chien-Hsun., and Fang-Ying S (2007), „„The impact of financial development
and bank characteristics on the operational performance of commercial banks in the
Chinese transitional economy‟‟, Journal of Economic Studies, 34:401-414
Kiganda, E. O. (2014). Effect of Macroeconomic Factors on Commercial Banks Profitability in
Kenya: Case of Equity Bank Limited. J. Econ. Sustain. Dev.5, 46–56.
Kennedy, P. 2008. A Guide to Econometrics. Sixth edition. Malden, Massachusetts:
Blackwell Publishing.
Košak, M. and Čok, M. (2008). Ownership structure and profitability of the banking sector: The
evidence from the SEE region. Zb. Rad. Ekon. Fak. U Rijeci Časopis Za Ekon. Teor.
Praksu26, 93–122.
Kosmidou, K. (2008). The determinants of banks‟ profits in Greece during the period of EU
financial integration. Manag. Finance34, 146–159.
Levine, R. (1997). Financial Development and Economic Growth: Views and Agenda. J. Econ.
Lit.35, 688–726.
Maddala, G. S. and Wu, S. (1999). A Comparative Study of Unit Root Tests with Panel Data and
a New Simple Test. Oxf. Bull. Econ. Stat.61, 631–652.

28
Marinković, S. and Radović, O. (2014). Bank net interest margin related to risk, ownership and
size: an exploratory study of the Serbian banking industry. Econ. Res.-Ekon.
Istraživanja27, 134–154.
Molyneux, P. and Forbes, W. (1995). Market structure and performance in European banking.
Appl. Econ.27, 155–159.
Molyneux, P. and Thornton, J. (1993). Determinants of European bank profitability: A note. J.
Bank. Finance16, 1173–1178.
Mörttinen, L. M., Poloni, P., Sandars, P., and Vesala, J. M. (2005). “Analysing Banking Sector
Conditions: How to Use Macro-Prudential Indicators,” Rep. No. ID 752086. Social
Science Research Network, Rochester, NY.
Naceur, S. B. and Goaied, M. (2008). The Determinants of Commercial Bank Interest Margin
and Profitability: Evidence from Tunisia. SSRN Electron. J.
Ongore, V. O. and Kusa, G. B. (2013). Determinants of financial performance of commercial
banks in Kenya. Int. J. Econ. Financ. Issues3, 237.
Pervan, M., Pelivan, I., and Arnerić, J. (2015). Profit persistence and determinants of bank
profitability in Croatia. Econ. Res.-Ekon. Istraživanja28, 284–298.
Pervan, M. and Pervan, I. (2010). Market Structure and Profitability of Croatian Commercial
Banks. Bus. Rev.20, 209–216.
Rhoades, S. A. (1982). Welfare loss, redistribution effect, and restriction of output due to
monopoly in banking. J. Monet. Econ.9, 375–387.
Samad A., F., Glenn, L. M., and Samad, A. (2006). Inter-Temporal Performance: Does Bank-
Size Matter? An Analysis Of Utah Banks.
Sangmi, P. D. M.-D. and Nazir, D. T. (2010). Analyzing Financial Performance of Commercial
Banks in India: Application of CAMEL Model. ResearchGate.
Sufian, F. and Habibullah, M. S. (2009). Determinants of bank profitability in a developing
economy: Empirical evidence from Bangladesh. J. Bus. Econ. Manag.10, 207–217.
Susan Moraa Onuonga (2014). The Analysis of Profitability of Kenya ` s Top Six Commercial
Banks: Internal Factor Analysis.
Tan, Y. and Floros, C. (2012). Bank profitability and GDP growth in China: a note. J. Chin.
Econ. Bus. Stud.10, 267–273.
Viñals et al. (2008). Creating a Safer Financial System: Will the Volcker, Vickers, and Liikanen
Structural Measures Help? IMF Staff Discussion Note 14/03;

29
APPENDICES
Appendix 1: Estimation results using GMM (dependent variable: ROA)
Variant model specification
Variable Notation 1 2
Lagged ROA 0.3530
(1.62)
0.3530
(1.62)
Bank size S 0.1469
(1.45)
Size squared S2
0.0734
(1.45)
Capital adequacy CA 1.3459
(1.94)
1.3459
(1.94)
Asset quality AQ 0.0031
(0.02)
0.0031
(0.02)
Liquidity LI -0.2201
(-0.73)
-0.2201
(-0.73)
Age AG 0.1400
(1.19)
0.1400
(1.19)
Market concentration HH 1.1182*
(2.23)
1.1182*
(2.23)
Inflation INF 0.00381
(0.05)
0.00381
(0.05)
GDP growth GDP 0.1094
(1.47)
0.1094
(1.47)
F -test F (9, 42) =369.59
Prob>F =0.000
F (9, 42) =369.59
Prob>F =0.000
Hansen Ja χ2(8) = 15.41
Prob>chi2=0.05
χ2(8) = 15.41
Prob>chi2=0.05
AR (1)b z=-2.20
p-value=0.028
z=-2.20
p-value=0.028
AR (2)c
z=-1.86
p-value=0.044
z=-1.86
p-value=0.044
This table shows regression results to determine the impact of bank size on performance while
controlling for macroeconomic, industry specific and bank specific factors. The results were not
discussed since the Hansen J test did not reject the null hypothesis hence invalidating the choice
of our instruments. The results were not plausible.