does islam promote authoritarianism? · does islam promote authoritarianism?∗ raj arunachalam...
TRANSCRIPT

Does Islam Promote Authoritarianism?∗
Raj ArunachalamUniversity of Michigan
Sara WatsonThe Ohio State University
June 2014
Abstract
What effect do religion and culture have on the dueling forces of democracy and authori-tarianism? Motivated by a series of single-country case studies, a recentslew of quantitativework implementing cross-country regressions has consistently found a strong negative effectof Islam on political freedoms and other measures of democracy, even when controlling forother factors. In this paper we revisit the relationship between Islam and democracy. First, weoffer a new instrumental variables strategy stemming from historical demographic movementsthat allows us to isolate the effect of Islam on political regime type. Second, we assemblenew sources of historical data to construct a panel dataset, enabling usto employ fixed ef-fects models that control for country-specific correlates of both Islam and authoritarianism.Implementing these two strategies largely eliminates the estimated negative effect of Islamon democracy. In fact, in most of our specifications the point estimates of Islam’s effect ondemocracy are actually large and positive, indicating that correcting for omitted variables, Is-lam’s effect is to actually increase democracy. However, our estimates arenot statisticallysignificant.
∗Preliminary and incomplete; please do not cite. Contact: Arunachalam [email protected] and Watsonat [email protected]. We thank Jiwon Suh, Amanda Yates, Emilie Esmont, Noelle Bruno, Katelyn Vitek andAlexandra Peponis for excellent research assistance; Steve Fish, Daniela Donno and Bruce Russett, Caleb Galle-more, Pippa Norris and Jean-Philippe Stijns for making their data available; and Jeremy Wallace, William Liddle andAmaney Jamal for helpful comments on an early iteration of this paper.

Are all, or only some, of the world’s religious systems politically compatible with
democracy? This is, of course, one of the most important and heatedly debated questions of
our times.
—Alfred Stepan, “Religion, Democracy, and the ‘Twin Tolerations’ ”
1 Introduction
What effect do religion and culture have on the dueling forcesof democracy and authoritarianism?
This classic question in the social sciences has generated intense controversy in recent years. In
the wake of 9/11 and subsequent developments in the Middle East, scholars have focused their at-
tention on the potential effect of Islam on democracy. Motivated by a series of single-country case
studies, a recent slew of quantitative work implementing cross-country regressions has consistently
found a strong negative effect of Islam on political freedoms and other measures of democracy,
even when controlling for resource endowment and other factors.
In this paper we revisit the relationship between Islam and democracy. We start by noting
that existing work suffers from a potentially serious omitted variables problem: any unobserved
correlates of Islam that are correlated with authoritarianism will bias estimates of the relationship
between religion and political regime. Furthermore, sincethe direction of bias is unknown a priori,
there is no way to bound existing estimates as too high or too low—although we provide suggestive
evidence that estimates are biased toward finding a relationship between Islam and authoritarian-
ism.
We tackle the problem of omitted variables by employing two complementary empirical strate-
gies. First, we offer a new instrumental variables strategystemming from historical demographic
movements that allows us to isolate the effect of Islam on political regime type. Second, we assem-
ble new sources of historical data to construct a panel dataset, enabling us to employ fixed effects
models that control for country-specific correlates of bothIslam and authoritarianism. Implement-
ing these two strategies largely eliminates the estimated negative effect of Islam on democracy.
2

In fact, in most of our specifications the point estimates of Islam’s effect on democracy are actu-
ally large and positive, indicating that correcting for omitted variables, Islam’s effect is to actually
increase democracy. However, throughout, our estimates are not statistically significant.
The remainder of this paper is organized as follows. Section2 starts with a discussion of the
debate on the relationship between Islam and democracy. In sections 3 and 4, we outline our
empirical strategies for assessing the impact of Islam on political regime type. Section 5 reports
our empirical results, while the conclusion discusses future avenues of research.
2 Situating the Study of Islam and Democracy
2.1 Culture’s Effect on Political and Economic Development
Our research question falls within a long intellectual tradition on the effect of religion and culture
on economic and political development. While such discussion can be found in the writings of
Locke (and others to fill in), modern assessments of the causal effect of culture date atleast from
Tocqueville (1966 [1832]) and Weber (1935 [1905]). Tocqueville emphasized culture’s potentially
salutory effect on democratic politics, linking the healthof 19th century America’s republican
institutions to the cultural values (‘habits of the heart’)and religious beliefs which reined in self-
interest and enabled the recognition of the public good. Similarly, in Weber’s interpretation of the
early years of European capitalist development, the valuesinherent in Protestantism fostered work
ethic, thrift, and other behaviors conducive to industrialization. During other periods, and in other
cultures, social and religious ethics inhibited industrial takeoff.1
More recently, the notion that culture has important effects on development resurfaced in the
1950s and 1960s with modernization theory. Identifying ‘modern’ (as distinct from ‘traditional’)
value clusters, one variant of modernization theory analyzed the implications of different sets value
1Weber’s early insights on the importance of values for economic growth have been extended by subsequent schol-ars to a range of settings. For example, Pye (2000) and Landes(1998, 2000), among others, have attributed rapideconomic growth in East Asia since the 1960s to Confucianism’s emphases on achievement and interdependence.Slow growth in Latin America since the 19th century, in contrast, has been blamed on ‘particularistic’ and ‘ascriptive’values held by entrepreneurial classes (Cochran, 1960; Lipset, 1967). More recent analyses of the economic effectsof culture include North (1990); Putnam (1993); Greif (1994); Fukuyama (1995); Barro and McCleary (2003), andTabellini (2010).
3
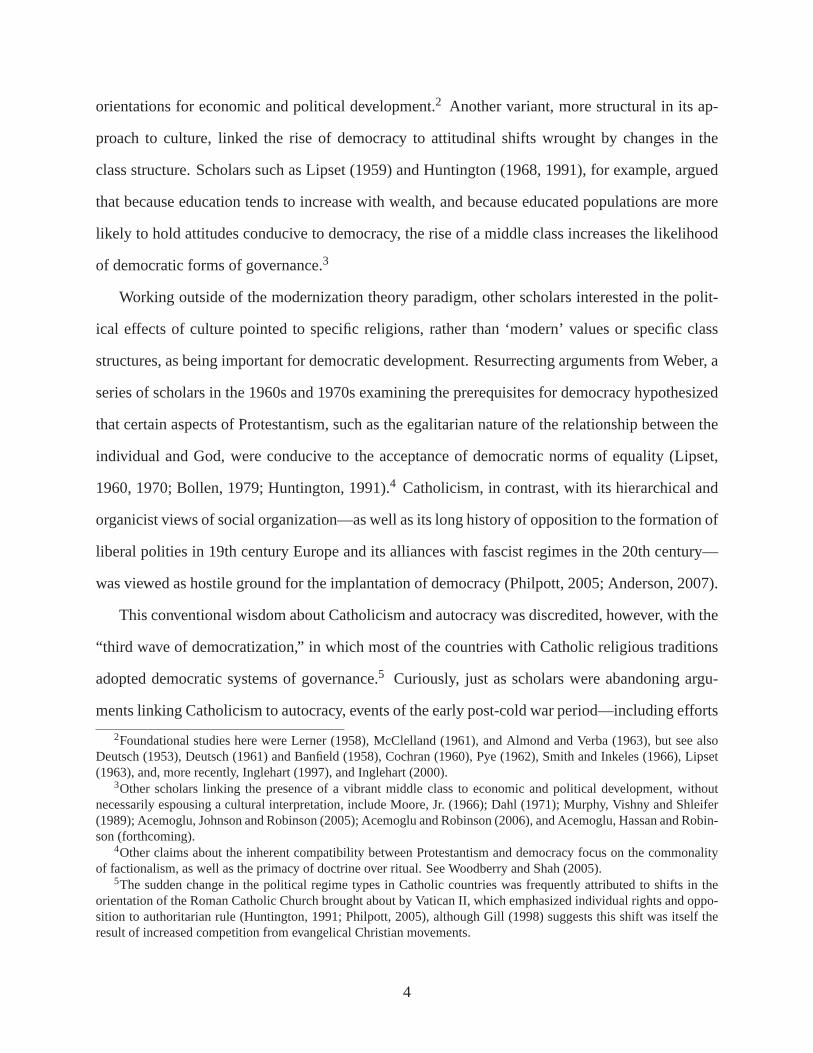
orientations for economic and political development.2 Another variant, more structural in its ap-
proach to culture, linked the rise of democracy to attitudinal shifts wrought by changes in the
class structure. Scholars such as Lipset (1959) and Huntington (1968, 1991), for example, argued
that because education tends to increase with wealth, and because educated populations are more
likely to hold attitudes conducive to democracy, the rise ofa middle class increases the likelihood
of democratic forms of governance.3
Working outside of the modernization theory paradigm, other scholars interested in the polit-
ical effects of culture pointed to specific religions, rather than ‘modern’ values or specific class
structures, as being important for democratic development. Resurrecting arguments from Weber, a
series of scholars in the 1960s and 1970s examining the prerequisites for democracy hypothesized
that certain aspects of Protestantism, such as the egalitarian nature of the relationship between the
individual and God, were conducive to the acceptance of democratic norms of equality (Lipset,
1960, 1970; Bollen, 1979; Huntington, 1991).4 Catholicism, in contrast, with its hierarchical and
organicist views of social organization—as well as its longhistory of opposition to the formation of
liberal polities in 19th century Europe and its alliances with fascist regimes in the 20th century—
was viewed as hostile ground for the implantation of democracy (Philpott, 2005; Anderson, 2007).
This conventional wisdom about Catholicism and autocracy was discredited, however, with the
“third wave of democratization,” in which most of the countries with Catholic religious traditions
adopted democratic systems of governance.5 Curiously, just as scholars were abandoning argu-
ments linking Catholicism to autocracy, events of the early post-cold war period—including efforts
2Foundational studies here were Lerner (1958), McClelland (1961), and Almond and Verba (1963), but see alsoDeutsch (1953), Deutsch (1961) and Banfield (1958), Cochran(1960), Pye (1962), Smith and Inkeles (1966), Lipset(1963), and, more recently, Inglehart (1997), and Inglehart (2000).
3Other scholars linking the presence of a vibrant middle class to economic and political development, withoutnecessarily espousing a cultural interpretation, includeMoore, Jr. (1966); Dahl (1971); Murphy, Vishny and Shleifer(1989); Acemoglu, Johnson and Robinson (2005); Acemoglu and Robinson (2006), and Acemoglu, Hassan and Robin-son (forthcoming).
4Other claims about the inherent compatibility between Protestantism and democracy focus on the commonalityof factionalism, as well as the primacy of doctrine over ritual. See Woodberry and Shah (2005).
5The sudden change in the political regime types in Catholic countries was frequently attributed to shifts in theorientation of the Roman Catholic Church brought about by Vatican II, which emphasized individual rights and oppo-sition to authoritarian rule (Huntington, 1991; Philpott,2005), although Gill (1998) suggests this shift was itself theresult of increased competition from evangelical Christian movements.
4

at democracy-building in the Middle East and the rise of Islamic fundamentalism—stimulated the
emergence of a new debate on religion and regime type, this one centered on the inherent compat-
ibility between Islam and democracy.
2.2 Islam and Democracy: Debate and Evidence
Before the 20th century, argued Said (1978), western discussions of political Islam explicitly but
more often implicitly accepted that Islam “tended toward despotism” and saw Muslims as unfit for
self-governance. Thus, Chateaubriand (1969) breezily argued that the western conquest of the Ori-
ent brought the promise of liberation to a backward people. Serious scholarly speculation on the
prospects for democracy in Islamic countries only appearedwith the proliferation of independence
movements during and immediately following World War Two. Pessimists argued that democracy
was unlikely to develop in these countries because Islam does not allow for the separation of spiri-
tual and temporal authority (Najjar, 1958) and because, at its core, the religion was fundamentally
supportive of tyrannical (or even communist) forms of government (Lewis, 1954). Optimists coun-
tered that the scriptural basis for theocracy in the Koran was weak (Fakhry, 1954; Syed, 1954), and
that autocratic polities instead stem from structural factors (such as the existence of large minor-
ity nationalist movements) which—largely due to colonial legacies—happen to occur with greater
frequency in Islamic countries (Issawi, 1956).
In the 1990s, a series of influential works reframed earlier debates in the context of the rise of
Islamic fundamentalism and theorized threats to international security (Huntington, 1993, 1996;
Fukuyama, 1989, 1992; Lewis, 1996). Perhaps the most influential of these writings, Huntington
(1996), viewed civilizational conflict between Islam and the West as inevitable because Islam is
inherently opposed to the ideas of individual liberty and democratic freedoms. As Huntington so
provocatively put it: “The fundamental problem for the Westis not Islamic fundamentalism. It is
Islam, a different civilization whose people are convincedof the superiority of their culture and
are obsessed with the inferiority of their power” (p. 217). With respect to democracy in particular,
Elie Kedourie (1992) similarly argues that notions of pluralism, accountable political institutions,
5
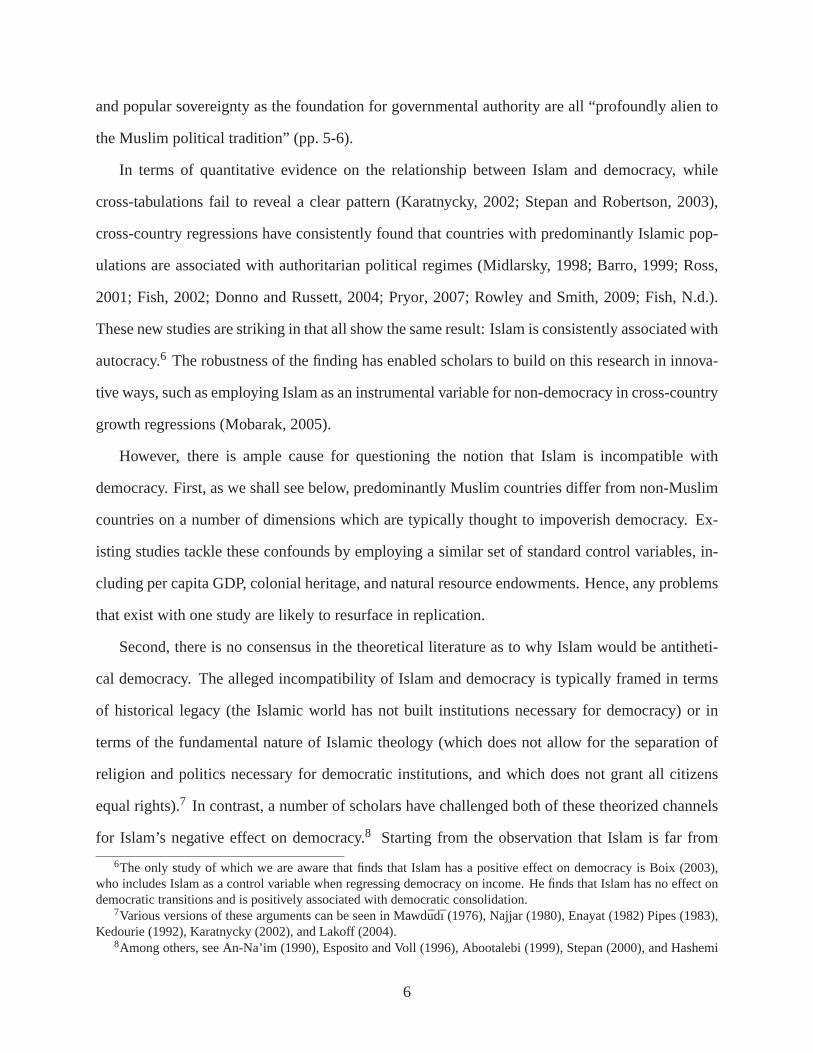
and popular sovereignty as the foundation for governmentalauthority are all “profoundly alien to
the Muslim political tradition” (pp. 5-6).
In terms of quantitative evidence on the relationship between Islam and democracy, while
cross-tabulations fail to reveal a clear pattern (Karatnycky, 2002; Stepan and Robertson, 2003),
cross-country regressions have consistently found that countries with predominantly Islamic pop-
ulations are associated with authoritarian political regimes (Midlarsky, 1998; Barro, 1999; Ross,
2001; Fish, 2002; Donno and Russett, 2004; Pryor, 2007; Rowleyand Smith, 2009; Fish, N.d.).
These new studies are striking in that all show the same result: Islam is consistently associated with
autocracy.6 The robustness of the finding has enabled scholars to build onthis research in innova-
tive ways, such as employing Islam as an instrumental variable for non-democracy in cross-country
growth regressions (Mobarak, 2005).
However, there is ample cause for questioning the notion that Islam is incompatible with
democracy. First, as we shall see below, predominantly Muslim countries differ from non-Muslim
countries on a number of dimensions which are typically thought to impoverish democracy. Ex-
isting studies tackle these confounds by employing a similar set of standard control variables, in-
cluding per capita GDP, colonial heritage, and natural resource endowments. Hence, any problems
that exist with one study are likely to resurface in replication.
Second, there is no consensus in the theoretical literatureas to why Islam would be antitheti-
cal democracy. The alleged incompatibility of Islam and democracy is typically framed in terms
of historical legacy (the Islamic world has not built institutions necessary for democracy) or in
terms of the fundamental nature of Islamic theology (which does not allow for the separation of
religion and politics necessary for democratic institutions, and which does not grant all citizens
equal rights).7 In contrast, a number of scholars have challenged both of these theorized channels
for Islam’s negative effect on democracy.8 Starting from the observation that Islam is far from
6The only study of which we are aware that finds that Islam has a positive effect on democracy is Boix (2003),who includes Islam as a control variable when regressing democracy on income. He finds that Islam has no effect ondemocratic transitions and is positively associated with democratic consolidation.
7Various versions of these arguments can be seen in Mawdudı (1976), Najjar (1980), Enayat (1982) Pipes (1983),Kedourie (1992), Karatnycky (2002), and Lakoff (2004).
8Among others, see An-Na’im (1990), Esposito and Voll (1996), Abootalebi (1999), Stepan (2000), and Hashemi
6

monolithic, these authors argue that important elements ofIslamic scripture and tradition, rather
than buttressing authoritarian institutions, may in fact serve as the foundation for democratic de-
velopment. They point out that Islamic tradition strongly disapproves of arbitrary rule,9 and that
there exist important elements of consent in the classical Muslim view of government. Islamic
concepts ofshura(consultation),ijma (consensus), andijtihad (informed, independent judgment),
for example, are compatible with democratic ideals (Esposito and Voll, 1996), andshurain partic-
ular can be interpreted as a democratic principle, since it demands open debate among elites and
the community at large on issues that concern the public (Abootalebi, 1999). Scholars additionally
argue that the democratic ideal of pluralism is both upheld in Islamic scripture—Muhammed him-
self declared that “Differences of opinion within my community are a sign of God’s mercy”—and
exemplified in practice by orthodox Sunni Muslims’ acceptance of four different schools of Islamic
jurisprudence. Given these facets of Islamic doctrine and tradition, then, there is no unambiguous
theoretical reason to suspect that Islam is inherently hostile to democracy.
A third reason to question the results of the macro-quantitative studies on the effect of Islam
on democracy is that public opinion polling consistently demonstrates that support for democratic
institutions is no more strongly held by non-Muslims than Muslims and is at least as strong in
Muslim-majority countries than elsewhere. These findings hold both in studies analyzing mass
publics in specific geographical regions such as Central Asiaand the Arab world (Rose, 2002;
Tessler, 2002, 2003; Hoffman, 2004; Tessler and Gao, 2005; Jamal and Tessler, 2008) as well
as in larger global samples (Norris and Inglehart, 2004; Rowley and Smith, 2009; Fish, N.d.).
Moreover, several studies analyzing the effects of macro-level religious contexts on individual
attitudes also find no evidence that Islam has a negative effect on democratic values. Using World
Values Survey data, for example, al Braizat (2002) analyzes the relationship between average per
country religiosity and average per country support for democracy, and finds that Arab and other
Muslim countries are supportive of both democracy and religiosity. Similarly, in a hierarchical
(2009). Ehteshami (2004) offers an excellent overview of current debates.9As even Bernard Lewis—no optimist about the prospects for democracy in the Arab world—observes, the cen-
tral institution of sovereignty in the traditional Islamicworld (the caliphate) was defined by Sunni scholars to havecontractual and consensual features that distinguished caliphs from despots (Lewis, 1996).
7

linear analysis of the same dataset, Meyer, Tope and Price (2008) find that it is Islam, more than
any other major religion, which promotes individual-levelsupport for democracy.
Perhaps more importantly, the nature of the historical spread of Islam suggests possible rea-
sons for a spurious positive association between Islam and authoritarianism. Below, we briefly
trace patterns of Muslim expansion between the 7th and 16th centuries. This short history has
two analytic purposes. First, it establishes that Islam spread to many (although not all) Muslim-
majority countries through conquest. If successful conquest was indicative or generative of ex-
tractive institutions—and if (as many theoretical and empirical studies hold) such institutions tend
to persist over centuries (e.g. Acemoglu, Johnson and Robinson (2002))—Islam may be spuri-
ously blamed for poor democratic outcomes today. Second, the overview motivates our empirical
strategy aimed at overcoming historical legacies and otherpossible omitted variables—one itself
grounded in the geographical pattern of the historical spread of Islam.
2.3 Spread of Islam
Islam arose in the Arabian Peninsula in the early seventh century. In 610, Muhammad ibn Abdul-
lah, on a spiritual retreat outside his home town of Mecca, awoke to a vision from the archangel
Gabriel who announced that Muhammad was the messenger of God. Over the next twenty-three
years, Muhammed received messages in serial form from God (Allah), and began sharing these
messages publicly. Although he attracted converts from within his clan, as well as from other
low-status groups in Mecca, resistance from Meccan elites led him to flee to the northern town of
Medina in 622. After several years of warfare between Medinaand Mecca, Mecca surrendered to
Muslim armies in 630. By the time of his death in 632, Islam dominated the western part of the
Arabian peninsula known as the Hijaz (Watt, 1970).
The spread of Islam beyond the confines of the Arabian peninsula can be linked to two sources:
conquest and commerce. A first wave of Islamic expansion tookplace in the 8th century via the
Arab conquests (Holt, Lambton and Lewis, 1970; Donner, 1981). In the century following the
death of Muhammad, Arab Muslims carved out a vast empire extending from Western Europe
8

to South Asia. The first series of conquests involved the taking of the territories to the north of
the Arabian peninsula. Within ten years, Arab Muslims controlled Iraq, Syria, Palestine, Egypt
and western Iran. Soon after these conquests, they turned their attentions further afield. To the
west, Arab ships sailed into the Mediterranean Sea, conquering Cyprus (649), Carthage (698),
Tunis (700), Gibraltar and Spain (711), and raiding as far north as the Pyrenees. To the east,
Arab armies marched across the Iranian plateau and conquered the Sassanian (Persian) empire. By
712, Arab armies had taken control of major outposts within Central Asia and were waging war
with Chinese armies, leading to the conversion of Turkish tribes in Central Asia. To the south,
Muslim warships sailed to the western coasts of India, wherein 711 they conquered the Hindu-
Buddhist society of Sind (present-day Pakistan and Punjab).Thus, within 120 years after the death
of Muhammad, Arab Muslims controlled territories extending from Lisbon to the Indus delta, and
had made inroads in both central Europe and China.10
The second wave of Islamic expansion took place not through militant conquest by nomadic
armies but via commercial links. Starting in the 11th century, Muslim traders—and the saints or
sufies who accompanied them as spiritual advisors—carried Islam across the steppes to central
Asia, through the desert to sub-Saharan Africa and across the ocean to the southern Philipinnes,
Malaysia, Indonesia, as well as to East Africa (Levtzion, 1979; Jones, 1979; Vryonis, 1971). In
southeast Asia, Islam appealed to the rulers of coastal principalities who were engaged in intense
rivalries with other local rulers; conversion to Islam gavelocal rulers both access to larger trading
networks and social and administrative support vis-a-vis their rivals (Reid, 1988; Ricklefs, 2008).
Conversion in East Africa occured unevenly, but also startedin coastal trading towns, and sub-
sequently followed the route of the Nile (Trimingham, 1964). The influence of Muslim traders
in these regions led to the doubling of the size of the Muslim world between the eleventh and
sixteenth centuries (Voll, 1998).
10Although the Arab conquests made vast swaths of territoriesnominally Muslim, conquest of a given area did notautomatically lead to rapid conversion of subject populations. Conversion rates were especially slow during the earlyArab conquests, and for some time afterwards, in much of the Islamic empire. Nevertheless, there is general agreementthat by 1300, Muslim-majority populations existed in the region spanning from North Africa to Iran (Levtzion, 1979;Bulliet, 1979).
9

As this brief treatment of the spread of Islam reflects, at least a subset of countries that are today
of Muslim majority became so through a legacy of conquest. Ofcourse, as we have seen, this his-
tory does not hold for all Muslim-majority countries; neither is it the case that medieval institutions
affect contemporary institutions in the same way. However,a number of studies have found that
early political institutions have long-run effects on bothpolitical and economic outcomes, even in
cases of long intervening periods of colonial rule (Herbst,2000; Englebert, 2000; Boone, 2003;
Gennaioli and Rainier, 2006, 2007). In this way, such common trends in historical legacy at the
very least contaminate causal inference, in that scholars attempting to gauge the causal effect of
Islam on contemporary outcomes may actually be measuring the latent effect of legacies of polities
built from conquest.11
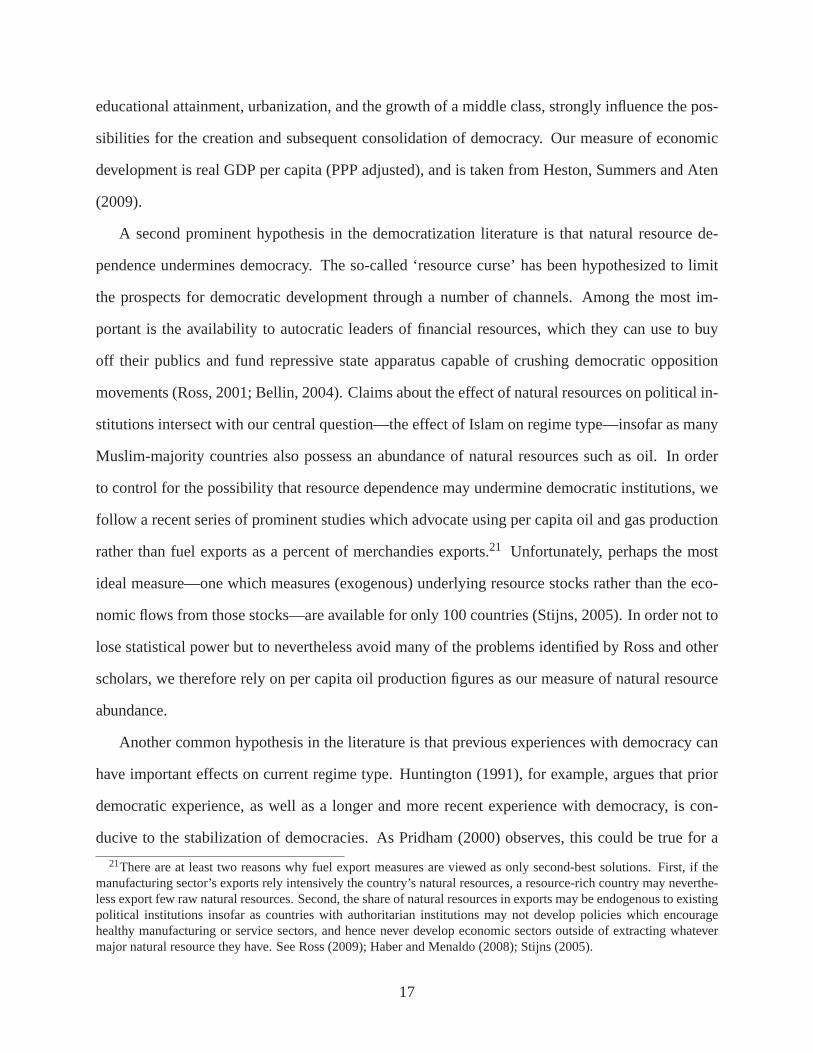
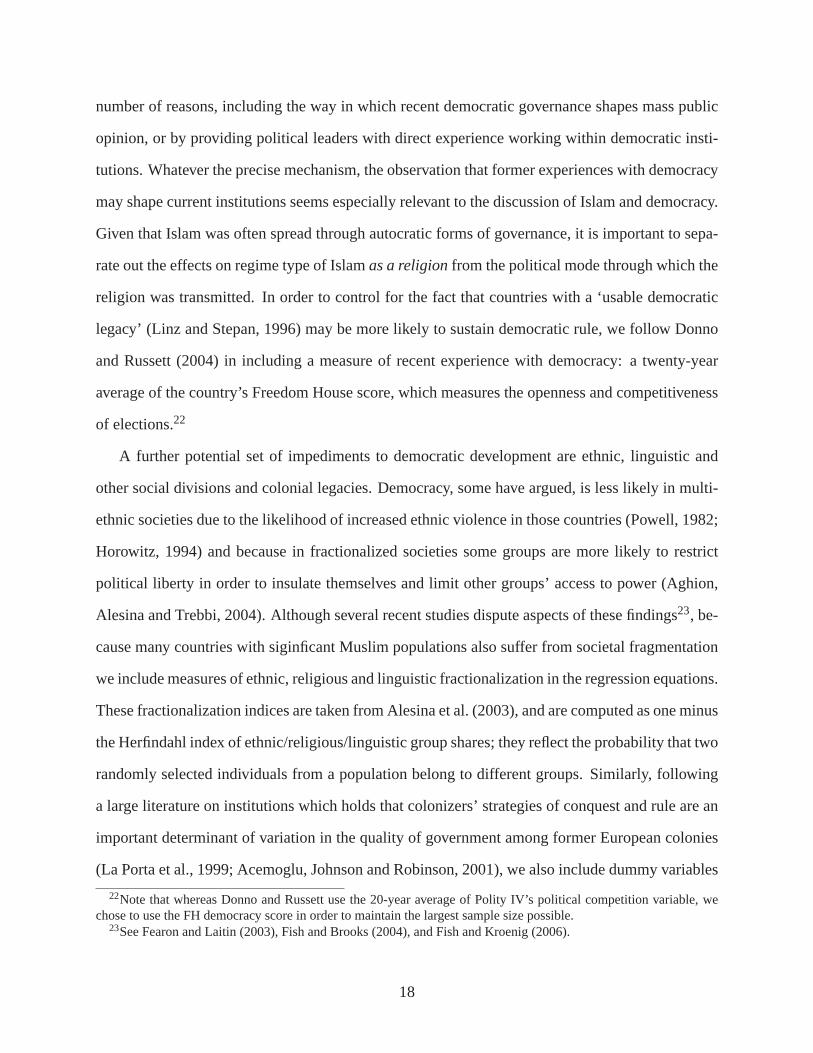
Indeed, figures 1 and 2 illustrate graphically the fact that current patterns of democracy appear
to be associated with the nature of Islam’s arrival.12 This pattern holds true both for all countries
in the sample and for the sub-sample of Muslim-majority countries. Moreover, the difference in
democracy scores between countries in which Islam arrived via conquest versus through peaceful
means is greater in the entire sample than it is in Muslim-majority countries.13 This implies that
a history of Islamic conquest influences the nature of regimetype today, independent of the effect
of Islam. Motivated by the potential importance of such unobservable and/or difficult to measure
historical legacies which may be shaping contemporary patterns of democracy, we offer research
designs targeted at identifying the causal effect of our central variable of interest: Islam.
11A detailed analysis of the political and economic institutions of the conquering Islamic empires is beyond thescope of this study, but it is worth noting that during the medieval period the Islamic world witnessed a shift towardmore extractive institutions. This was in large part because the Abassids responded to the challenge of paying for astanding army (capable of defending its far-flung empire) bygranting military officers the right to set up tax-farms inthe provinces where they were stationed. As a result, despite the fact that the early years of the Abassid empire wascharacterized by a fairly centralized polity which protected property rights and presided over a period of commerce,prosperity and intellectual fermentation, by the eleventhcentury it had devolved into a decentralized and plunderingstate (Cahen, 1970).
12We coded this measure based on information fromOxford Islamic Studies Online, the Cambridge History ofIslam, and other sources.
13We recognize that the relationships depicted in these figures are ordinal, and that one should not necessarily drawconclusions about relationships based on the size of gaps, but given that it is common to discuss relative differences inFreedom House scores between sub-samples of countries, we think it worth mentioning this finding.
10
3 Empirical Strategy
3.1 Instrumental Variable Strategy
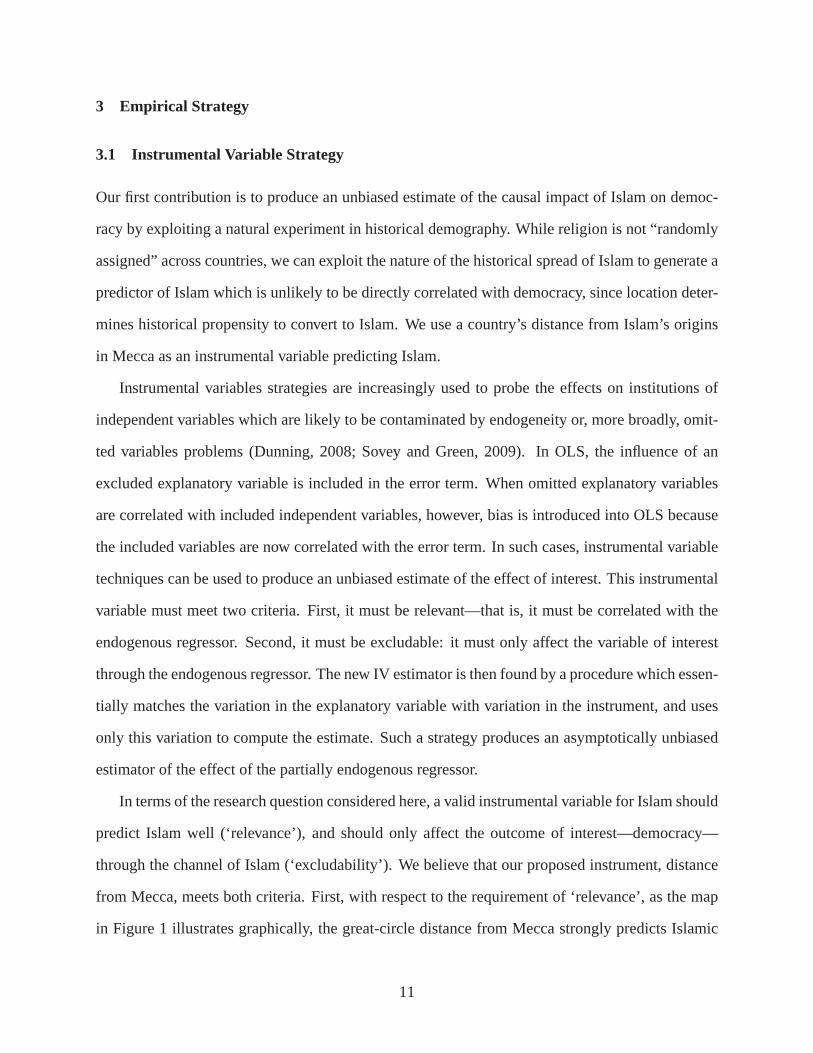
Our first contribution is to produce an unbiased estimate of the causal impact of Islam on democ-
racy by exploiting a natural experiment in historical demography. While religion is not “randomly
assigned” across countries, we can exploit the nature of thehistorical spread of Islam to generate a
predictor of Islam which is unlikely to be directly correlated with democracy, since location deter-
mines historical propensity to convert to Islam. We use a country’s distance from Islam’s origins
in Mecca as an instrumental variable predicting Islam.
Instrumental variables strategies are increasingly used to probe the effects on institutions of
independent variables which are likely to be contaminated by endogeneity or, more broadly, omit-
ted variables problems (Dunning, 2008; Sovey and Green, 2009). In OLS, the influence of an
excluded explanatory variable is included in the error term. When omitted explanatory variables
are correlated with included independent variables, however, bias is introduced into OLS because
the included variables are now correlated with the error term. In such cases, instrumental variable
techniques can be used to produce an unbiased estimate of theeffect of interest. This instrumental
variable must meet two criteria. First, it must be relevant—that is, it must be correlated with the
endogenous regressor. Second, it must be excludable: it must only affect the variable of interest
through the endogenous regressor. The new IV estimator is then found by a procedure which essen-
tially matches the variation in the explanatory variable with variation in the instrument, and uses
only this variation to compute the estimate. Such a strategyproduces an asymptotically unbiased
estimator of the effect of the partially endogenous regressor.
In terms of the research question considered here, a valid instrumental variable for Islam should
predict Islam well (‘relevance’), and should only affect the outcome of interest—democracy—
through the channel of Islam (‘excludability’). We believethat our proposed instrument, distance
from Mecca, meets both criteria. First, with respect to the requirement of ‘relevance’, as the map
in Figure 1 illustrates graphically, the great-circle distance from Mecca strongly predicts Islamic
11

religous adherence, and does so both when the variable is defined as percentage of population that
is Muslim or as dummy variable for Muslim-majority country.The relevance of the instrument
is similarly apparent in Figure 2, where we see that distancefrom Mecca is clearly related to
percentage of Muslim adherents in the population. Althoughin statistical terms the criteria of
relevance requires only that the instrument predict the endogenous regressor well—and not that the
instrument becausallyrelated to that regressor—in our case there exists a fairly intuitive causal
mechanism linking distance from Mecca to percent Islam. Thecloser a country is located to
Islam’s founding city, Mecca, the more likely that its population came into contact with Islamic
populations. Contact with either conquering armies or commercial traders, in turn, increased the
likelihood of conversion to Islam in these areas. Moreover,insofar as Islam was the latest of the
major world religions, it is less likely to have been supplanted in these areas by subsequent contact
with ’newer’ religions.14
In positing that distance from Mecca predicts Islam well, weare not claiming that it is the only
factor determining whether a country developed a large Muslim population. Variation in the assim-
ilative capacity of Islam historically was, of course, alsorelated to factors such as the existence of
strong state structures in neighboring regions, the durability of existing religious institutions, and
the extent of Muslim migration to frontier areas (von Grunebaum, 1966/2008; Donner, 1981).15
However, the existence of other factors shaping the implantation of Islam does not inherently un-
dercut the effectiveness of our distance measure as an instrument because the instrumental variable
estimator remains unbiased as long as such omitted predictors are not correlated with distance.
With respect to the second major criteria for a valid instrumental variable (that is, ‘exclud-
ability’), we also believe that our exclusion restriction—the claim that distance from Mecca has no
effect on democracy today other than through its effect on the development of Islam, conditional on
14Consider the other two major religions which came out of the Middle East: Judaism (founded approximately 1500BCE) and Christianity (100 CE). Distance from origin is lesslikely to be a valid predictor of these religions in light ofthe subsequent spread of Islam starting in approximately 600 BCE.
15In Europe, for example, it was not only distance which limited the spread of Islam to Europe but rather thedevelopment of strong states which were able to expel the Moors from southern Iberia and Italy, and to withstand laterOttoman incursions from the East. Similarly, in the Balkans, where previous religious institutions remained vibrant,Islam did not penetrate as successfully as in Anatolia, where church institutions had been progressively weakenedbefore the arrival of the Ottomans. See Lapidus (2002).
12

the controls included in the regression equations—is plausible, as distance from Mecca is unlikely
to directly relate to political regime choice except through its effect on religion.16
Formally, we estimate by two-stage least squares. In the first stage, Islamic adherence,Ii , in
countryi is treated as endogenous, and modeled as:
Ii = α+ γRi +X′
iδ+νi (1)
whereRi is distance from Mecca,δ is a vector capturing the effects of the control variables in
X′
i , andνi is a random error term. The key exclusion restriction is thatin the population Cov (εi ,
Ri) = 0, whereεi is the error term in the second-stage equation.
The second-stage equation is:
Di = ζ+βIVI Ii +X
′
iµ+ εi (2)
in which Di is the democracy score,I is the predicted value of the percent of the population
that is Islamic, andε is a random error term, assumed to be orthogonal toν. The main coefficient
of interest isβ, the coefficient on Islam.
3.2 Panel Estimation
Our second contribution to the literature is to exploit the panel nature of the data by including
country fixed effects when examining the effect of Islam on democracy. This strategy, we should
note, addresses a somewhat different question than does theinstrumental variable strategy outlined
in the previous section. Instead of looking at the effect oflevelsof Islamic population on political
regime type, it looks at the effects ofchangesin a country’s Islamic population on changes in the
16This particular form of instrumental variable, distance from a specific location, has been employed fruitfullyin a variety of settings. Recent examples include studies ofthe effect of Walmart on local labor markets, usingdistance from Bentonville, Arkansas as an instrumental variable for date of a store’s founding (Dube, Lester and Eidlin,2007; Neumark, Zhang and Ciccarella, 2008); estimates of the impact of the boll weevil on historical agriculturaldevelopment in the United States, using distance from Brownsville, Texas to predict onset (Lange, Olmstead andRhode, 2009); and estimates of the spread of HIV in Africa using distance from the origin of the virus (Oster, 2009).
13
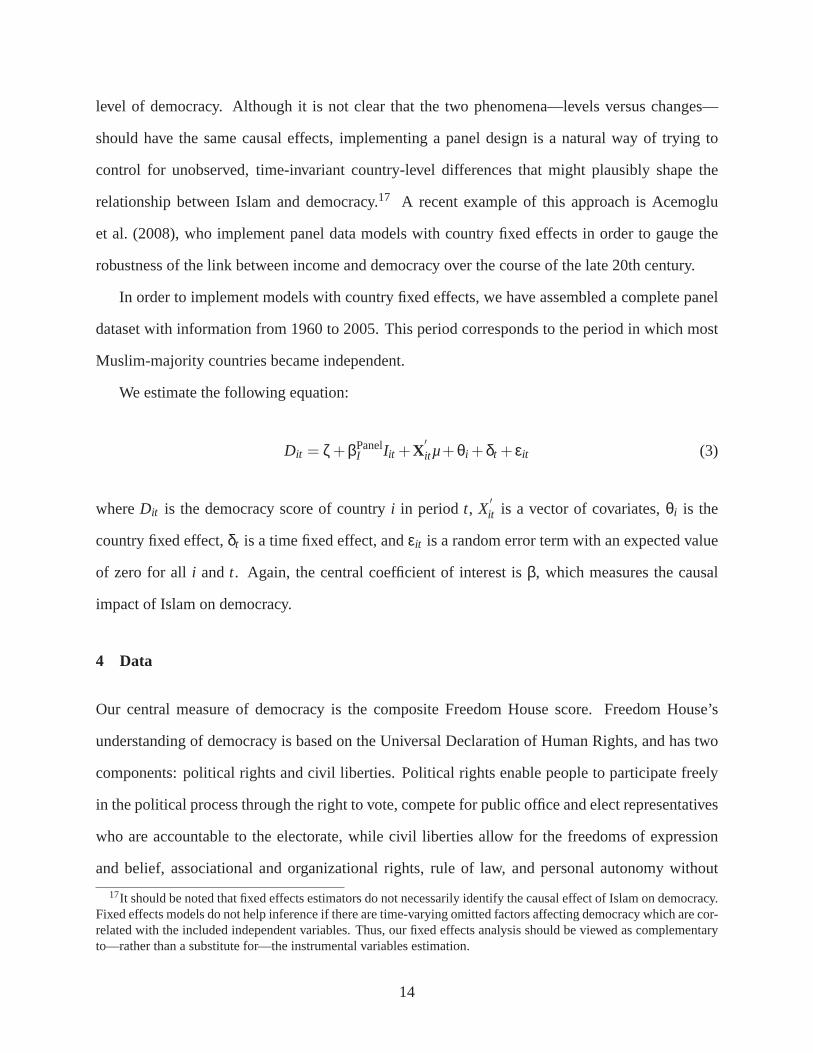
level of democracy. Although it is not clear that the two phenomena—levels versus changes—
should have the same causal effects, implementing a panel design is a natural way of trying to
control for unobserved, time-invariant country-level differences that might plausibly shape the
relationship between Islam and democracy.17 A recent example of this approach is Acemoglu
et al. (2008), who implement panel data models with country fixed effects in order to gauge the
robustness of the link between income and democracy over thecourse of the late 20th century.
In order to implement models with country fixed effects, we have assembled a complete panel
dataset with information from 1960 to 2005. This period corresponds to the period in which most
Muslim-majority countries became independent.
We estimate the following equation:
Dit = ζ+βPanelI Iit +X
′
it µ+θi +δt + εit (3)
whereDit is the democracy score of countryi in periodt, X′
it is a vector of covariates,θi is the
country fixed effect,δt is a time fixed effect, andεit is a random error term with an expected value
of zero for all i andt. Again, the central coefficient of interest isβ, which measures the causal
impact of Islam on democracy.
4 Data
Our central measure of democracy is the composite Freedom House score. Freedom House’s
understanding of democracy is based on the Universal Declaration of Human Rights, and has two
components: political rights and civil liberties. Political rights enable people to participate freely
in the political process through the right to vote, compete for public office and elect representatives
who are accountable to the electorate, while civil liberties allow for the freedoms of expression
and belief, associational and organizational rights, ruleof law, and personal autonomy without
17It should be noted that fixed effects estimators do not necessarily identify the causal effect of Islam on democracy.Fixed effects models do not help inference if there are time-varying omitted factors affecting democracy which are cor-related with the included independent variables. Thus, ourfixed effects analysis should be viewed as complementaryto—rather than a substitute for—the instrumental variables estimation.
14

interference from the state. Based on a checklist of questions, Freedom House ranks countries
on each of these two dimensions on a scale of 1 to 7, with 1 being‘most free’ and 7 ‘least free’.
In order to make the Freedom House scores more intuitive, we reverse the indices so that 1 is
least free and 7 is most free. Our dependent variable for the cross-sectional IV analysis is the
average of the Freedom House scores for the years 2000 through 2008; in the panel analysis, we
construct five year panels, taking the observation every fifth year. For the 1980s, Freedom House
provides single scores for overlapping years; in order to generate annual scores for these years,
we determine the relative contribution of different sets ofyears to each individual year’s score and
weight accordingly. .
In order to check the sensitivity of our results to differentmeasures of democracy, we also
run specifications using Polity IV data from 1950 to 2009 (Marshall and Jaggers, 2009). In con-
trast to Freedom Houses’s rights-based approach to democracy, Polity IV focuses primarily on the
existence or absence of institutions in a country. The Polity score measure includes the competi-
tiveness of political participation, the existance of competitive executive recruitment, the openness
of the recruitment process, and the constraints placed on the executive. Countries are scored on an
eleven-point scale of democracy, and a similarly scaled measure of autocracy. The two scales are
then combined into a single democracy-autocracy score, in which pure autocracies receive a score
of -10 and pure democracies receive a +10. Importantly, the Polity dataset excludes many smaller
countries, thus reducing the coverage of countries.18
The data on percent of the population that is Muslim comes from two principal sources: the
World Christian Encyclopedia (WCE) and the World Religion Database (WRD). The WCE and its
electronic successors are part of an international demography project which documents over-time
trends in Christianity and other major religions. The WCE beganin 1949 as theWorld Chris-
tian Handbook, an Anglican publication containing information on churchhistory and missionary
work. In 1968 its founders decided to undertake a comprehensive survey of all branches of global
Christianity, leading to two paper editions of the World Christian Encyclopedia (Barrett, 1982;
18For the year 2000, for example, Polity IV provides data for only 159 countries, as opposed to Freedom House’s191 countries.
15

Barrett, Kurian and Johnson, 2001) and the subsequent release of two electronic databases: the
World Christian Database (WCD) and the World Religion Database.19
WCE estimates rely on census reports, survey reports, anthropological and ethnographic stud-
ies, and reputable statistical reports from various religious groups. Although the WCE data is un-
paralleled in its scope (approximately 240 countries) and comprehensiveness, there has been some
controversy about the reliability of the estimates given the project’s missionary origins. However,
in a systematic analysis of WCE figures with four other major data sources—the World Values Sur-
vey, Pew Global Attitudes Project, the CIA World Factbook, and the U.S. Department of State’s
International Religious Freedom Report—Hsu et al. (2008) findthat the WCE estimates are highly
correlated. With respect to the Islam figures in particular,correlations with existing datasets are
above .97. In our panel analysis, data on the Muslim population for the years 2000, 2005, and 2010
are taken from the World Religion Database (Johnson and Grim,2010). Figures for 1975, 1980,
1990, and 1995, which were not available from the WRD, came frompaper editions of the WCE.
For 1960, we supplement the WCE/WRD estimates with data from Kettani (2010), who uses na-
tional census and health/demographic surveys, as well as UNYearbooks, to provide estimates of
Islamic populations.
Our distance measure is the great-circle distance in miles between Mecca and the capital city
of each country in the Freedom House database, computed withan on-line distance calculator.20
The literature on the sources of democracy versus autocracyis perhaps one of the largest sub-
fields of comparative politics. In order to verify if Islam retains explanatory power once we con-
sider other possible sources of democracy, we include in ouranalysis a number of control variables.
The first reflects the classic claim that economic development is a central determinant regime type.
As mentioned in Section 2, the seminal example of this approach is Lipset’s (1959) view that
the level of economic development and variables closely associated with it, including the level of
19The World Christian Database is now housed at the Center for the Study of Global Christianity at Gordon-ConwellTheological Seminary, and the World Religion Database at Boston University’s Institute on Culture, Religion andWorld Affairs. Both databases are currently published by Brill Academic Publishers.
20We sought distance information first fromhttp://www.infoplease.com/atlas/calculate-distance.html,and then (for the remaining missing observations) fromhttp://timeanddate.com.
16
educational attainment, urbanization, and the growth of a middle class, strongly influence the pos-
sibilities for the creation and subsequent consolidation of democracy. Our measure of economic
development is real GDP per capita (PPP adjusted), and is taken from Heston, Summers and Aten
(2009).
A second prominent hypothesis in the democratization literature is that natural resource de-
pendence undermines democracy. The so-called ‘resource curse’ has been hypothesized to limit
the prospects for democratic development through a number of channels. Among the most im-
portant is the availability to autocratic leaders of financial resources, which they can use to buy
off their publics and fund repressive state apparatus capable of crushing democratic opposition
movements (Ross, 2001; Bellin, 2004). Claims about the effect of natural resources on political in-
stitutions intersect with our central question—the effectof Islam on regime type—insofar as many
Muslim-majority countries also possess an abundance of natural resources such as oil. In order
to control for the possibility that resource dependence mayundermine democratic institutions, we
follow a recent series of prominent studies which advocate using per capita oil and gas production
rather than fuel exports as a percent of merchandies exports.21 Unfortunately, perhaps the most
ideal measure—one which measures (exogenous) underlying resource stocks rather than the eco-
nomic flows from those stocks—are available for only 100 countries (Stijns, 2005). In order not to
lose statistical power but to nevertheless avoid many of theproblems identified by Ross and other
scholars, we therefore rely on per capita oil production figures as our measure of natural resource
abundance.
Another common hypothesis in the literature is that previous experiences with democracy can
have important effects on current regime type. Huntington (1991), for example, argues that prior
democratic experience, as well as a longer and more recent experience with democracy, is con-
ducive to the stabilization of democracies. As Pridham (2000) observes, this could be true for a
21There are at least two reasons why fuel export measures are viewed as only second-best solutions. First, if themanufacturing sector’s exports rely intensively the country’s natural resources, a resource-rich country may neverthe-less export few raw natural resources. Second, the share of natural resources in exports may be endogenous to existingpolitical institutions insofar as countries with authoritarian institutions may not develop policies which encouragehealthy manufacturing or service sectors, and hence never develop economic sectors outside of extracting whatevermajor natural resource they have. See Ross (2009); Haber andMenaldo (2008); Stijns (2005).
17
number of reasons, including the way in which recent democratic governance shapes mass public
opinion, or by providing political leaders with direct experience working within democratic insti-
tutions. Whatever the precise mechanism, the observation that former experiences with democracy
may shape current institutions seems especially relevant to the discussion of Islam and democracy.
Given that Islam was often spread through autocratic forms of governance, it is important to sepa-
rate out the effects on regime type of Islamas a religionfrom the political mode through which the
religion was transmitted. In order to control for the fact that countries with a ‘usable democratic
legacy’ (Linz and Stepan, 1996) may be more likely to sustaindemocratic rule, we follow Donno
and Russett (2004) in including a measure of recent experience with democracy: a twenty-year
average of the country’s Freedom House score, which measures the openness and competitiveness
of elections.22
A further potential set of impediments to democratic development are ethnic, linguistic and
other social divisions and colonial legacies. Democracy, some have argued, is less likely in multi-
ethnic societies due to the likelihood of increased ethnic violence in those countries (Powell, 1982;
Horowitz, 1994) and because in fractionalized societies some groups are more likely to restrict
political liberty in order to insulate themselves and limitother groups’ access to power (Aghion,
Alesina and Trebbi, 2004). Although several recent studiesdispute aspects of these findings23, be-
cause many countries with siginficant Muslim populations also suffer from societal fragmentation
we include measures of ethnic, religious and linguistic fractionalization in the regression equations.
These fractionalization indices are taken from Alesina et al. (2003), and are computed as one minus
the Herfindahl index of ethnic/religious/linguistic groupshares; they reflect the probability that two
randomly selected individuals from a population belong to different groups. Similarly, following
a large literature on institutions which holds that colonizers’ strategies of conquest and rule are an
important determinant of variation in the quality of government among former European colonies
(La Porta et al., 1999; Acemoglu, Johnson and Robinson, 2001), we also include dummy variables
22Note that whereas Donno and Russett use the 20-year average of Polity IV’s political competition variable, wechose to use the FH democracy score in order to maintain the largest sample size possible.
23See Fearon and Laitin (2003), Fish and Brooks (2004), and Fish and Kroenig (2006).
18

for the identity of colonizer (Norris, 2008).
Following Donno and Russett (2004), we also include variables aimed at addressing two hy-
potheses from the international relations literature. A number of IR scholars argue that democracy
is promoted not just by domestic factors such as level of economic development, but also by fa-
vorable international environments. Gleditsch and Ward (2007), for example, define such environ-
ments in terms of in terms of ‘political neighborhoods’. They demonstrate that the probability that
a randomly chosen country will be a democracy is much higher if its neighbors are also democ-
racies, and that rates of transitions to democracy differ sharply dependng on the political makeup
of the countries in a country’s spatial context (p. 271). In asimilar vein, Pevehouse (2004) finds
that autocracies connected to ‘democratically dense’ international organizations are more likely to
become democratic. A second, related hypothesis, is that a country’s inolvement in international
conflict increases the likelihood of authoritarianism insofar as it leads to the suppression of civil
and political liberties at home, in the name of national security (Gleditsch, 2002). To control for the
possibility that political neighborhoods and international conflict shape political regime type, we
include two measures in our regression equations. The first is ‘degree of democracy in the neigh-
borhood’, which provides the average democracy score of contiguous states for the years 2000 to
2008, where contiguity is defined according to Correlates of War categories 1-4 (countries that are
either directly contiguous by land or contiguous by sea within 150 miles). Relying on data from the
Correlates of War Project’s Direct Contiguity Data, 1816-2006, version 3.1 (Stinnett et al., 2002),
we calculate versions of this measure for both Freedom Houseand Polity democracy scores. The
second variable is the number of fatal militarized disputesthat a country was involved in during
the 1990s; this was computed using the Correlates of War Project’s Militarized Interestate Dispute
(MID) Dataset, version 3.1 (Ghosn, Palmer and Bremer, 2004).
Another debate questions whether it is Islam broadly writ, or the subset of Islamic countries
in the Arab world, driving the apparent relationship between Islam and autocracy (Stepan and
Robertson, 2003). Not withstanding the democratic effervescence witnessed in the recent Arab
Spring, the Arab world continues to suffer from a democracy deficit (Bellin, 2004; Schlumberger,
19

2009). Indeed, during the 2000s, the median Freedom House score for Arab Muslim majority
countries was at the 25th percentile of that for their non-Arab brethren.24 Thus, in order to assess
whether the effect of Islam on autocracy is being driven by the Arab states, we include a dummy
variable for membership in the Arab League.
[NOTE: What does Arabness signify? It is arguably better to control for these factors di-
rectly, since other countries may have similar characteristics. The literature identifies (a) patriar-
chal norms: this we can control for following Fish; (b) high levels of militarism due to spillover
from the Arab-Israeli conflict: this we can control for usingOECD data on military expenditures.]
Finally, in order to provide a check on the validity of our exclusion restriction, we include a
latitude measure as a geographic control. This measure is taken from Gallup, Sachs and Mellinger
(1999), which provides the latitude of the country centroid. For countries where the centroid falls
in the ocean, it is moved to within the nearest land boundary.For missing countries, we use the
latitude of a country’s capital city.
5 Empirical Results
5.1 Descriptive Statistics
Before turning to the main empirical analysis, examining thedescriptive statistics suggests the con-
tours of the identification problem. Figure 3 provides a graphical representation of the stylized fact
motivating our study: the negative relationship between Islam and democracy. Plotting countries’
composite Freedom House scores against percent Muslim (both averaged over the 2000s) pro-
duces a noticeable sloping trend: a ten percentage point increase in a country’s Muslim population
is associated with a sixth of a standard deviation decrease in the Freedom House score.
Whether this bivariate relationship actually represents a causal effect, however, is far from
straightforward. For one, the negative association between Islam and democracy holds histori-
cally; when we examine data from the 1970s through 1990s in Figure 4, the same downward trend
24More specifically, the average Freedom House democracy score for Arab Muslim-majority countries was 2.38, ascompared to 3.38 for Muslim-majority countries outside of the Arab world.
20

appears. Even the handful of Muslim countries in 1900 that are captured in the Polity dataset
suffered from autocratic rule. One interpretation is that something in the nature of Islam has long
lent support to autocratic rule; an equally plausible alternative hypothesis, however, is that Muslim
countries happen to share a historical legacy of non-democracy, which itself persists as institutions
often do.
Furthermore, when compared to non-Muslim countries, predominantly Muslim countries share
several characteristics that suggest a poor environment for democracy. For example, when we
examine the relationship between percent Muslim and per capita income, we see that Muslim
countries indeed tend to be poorer (Figure 5). Here, a ten percentage point increase in a country’s
Muslim population is associated with a seven percent decrease in per capita income. As with
democracy, this pattern appears to hold historically for the 1960s through the 1990s, as seen in
Figure 6, albeit more weakly in the heyday of oil prices. Whilescholars continue to debate the
true nature of the causal connection between income and democracy, such a pattern is at least
suggestive of omitted factors—other than religion—which may determine a country’s economic
and political outcomes.
To facilitate comparisons, we slice our sample into “Muslimmajority” and “non Muslim ma-
jority” for the descriptive statistics in Table 1. The bimodal distribution of Islam evident in Figure
3 suggests that this is not unreasonable—there are relatively few countries with close to half the
population Islamic. The table, which provides data for a larger sample of countries than previous
studies we are aware of, suggest that Muslim countries differ markedly from non-Muslim countries
on key variables of interest. More precisely, as a group, Muslim-majority countries tend to fare
worse on almost every indicator which scholars have suggested are democracy-promoting.25 Mus-
lim countries are poorer, with a mean per capita income of $8900 (2005 PPP) in 2007, compared
to a mean of $12400 in non-Muslim countries. They have a higher degree of ethnic fractionaliza-
tion, as measured by Alesina et al. (2003). Muslim countriesare likely to suffer violent interstate
disputes, as measured by the number of fatal militarized disputes. They do not enjoy a histori-
25See Donno and Russett (2004) for a nice discussion of these factors.
21
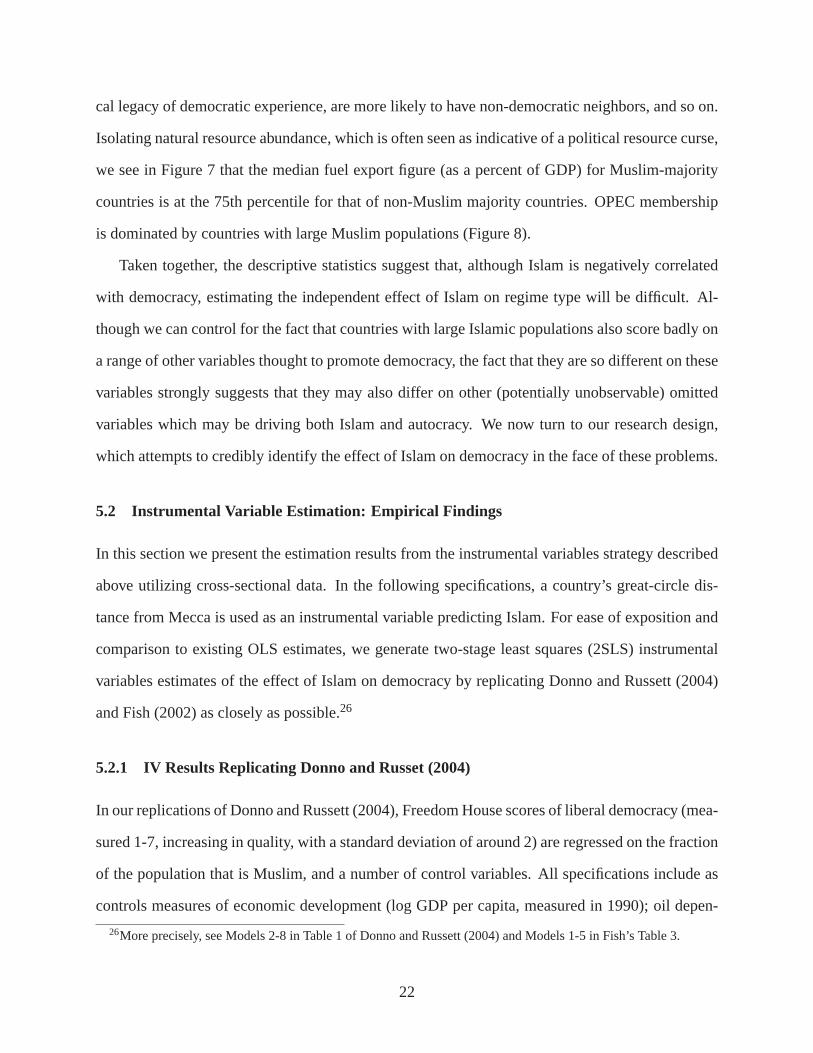
cal legacy of democratic experience, are more likely to havenon-democratic neighbors, and so on.
Isolating natural resource abundance, which is often seen as indicative of a political resource curse,
we see in Figure 7 that the median fuel export figure (as a percent of GDP) for Muslim-majority
countries is at the 75th percentile for that of non-Muslim majority countries. OPEC membership
is dominated by countries with large Muslim populations (Figure 8).
Taken together, the descriptive statistics suggest that, although Islam is negatively correlated
with democracy, estimating the independent effect of Islamon regime type will be difficult. Al-
though we can control for the fact that countries with large Islamic populations also score badly on
a range of other variables thought to promote democracy, thefact that they are so different on these
variables strongly suggests that they may also differ on other (potentially unobservable) omitted
variables which may be driving both Islam and autocracy. We now turn to our research design,
which attempts to credibly identify the effect of Islam on democracy in the face of these problems.
5.2 Instrumental Variable Estimation: Empirical Findings
In this section we present the estimation results from the instrumental variables strategy described
above utilizing cross-sectional data. In the following specifications, a country’s great-circle dis-
tance from Mecca is used as an instrumental variable predicting Islam. For ease of exposition and
comparison to existing OLS estimates, we generate two-stage least squares (2SLS) instrumental
variables estimates of the effect of Islam on democracy by replicating Donno and Russett (2004)
and Fish (2002) as closely as possible.26
5.2.1 IV Results Replicating Donno and Russet (2004)
In our replications of Donno and Russett (2004), Freedom House scores of liberal democracy (mea-
sured 1-7, increasing in quality, with a standard deviationof around 2) are regressed on the fraction
of the population that is Muslim, and a number of control variables. All specifications include as
controls measures of economic development (log GDP per capita, measured in 1990); oil depen-
26More precisely, see Models 2-8 in Table 1 of Donno and Russett(2004) and Models 1-5 in Fish’s Table 3.
22

dence (fuel exports as a fraction of GDP); previous experience of democracy (Polity scores, which
are similar to Freedom House scoes but with a longer time series); and democracy “contagion” ef-
fects (average level of democracy in contiguous neighbors). Still following Donno and Russett, we
also include models with controls for Arab league membership; military violence (“MID involve-
ment”: number of fatal militarized disputes in the country,1960-2001); and variously specified
measures of women’s empowerment (male to female literacy gap; male to female sex ratio; and
women’s participation rates in government and in the national legislature). Finally, we reproduce
all specifications, this time instrumenting Islamic population with distance from Mecca.
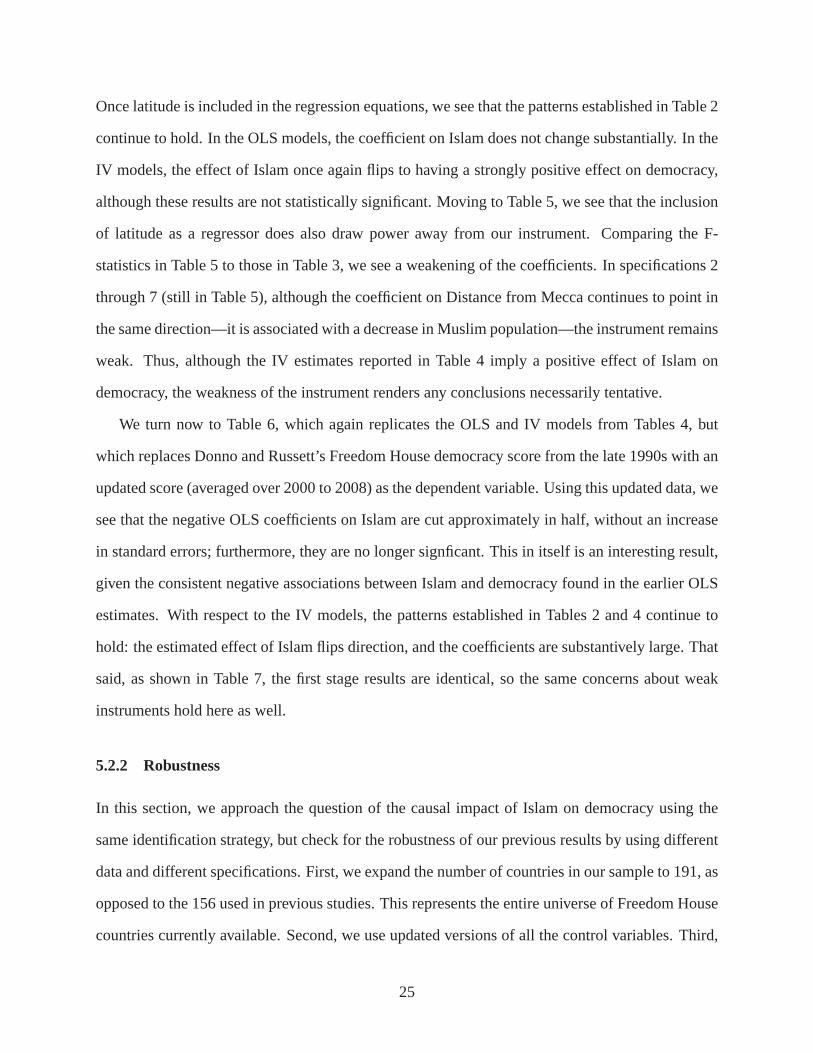
Results from our replication of Donno and Russett are given in Table 2, Columns 1-7. Overall,
our findings match those in the original paper very closely, with slight differences that are proba-
bly attributable to rounding errors. We then reproduce eachregression model using instrumental
variables, so that column 8 reproduces column 1, column 9 reproduces column 2, and so on, with
the only change being that the instrumental variables specifications are the second stage in a 2SLS
estimate. Throughout, the top row is the one of interest—thecoefficient on Islamic population.
There are four findings of note. First, even in the simplest specification, introducing an instru-
mental variable strategy substantially reduces the size ofthe coefficient on Islam. The coefficient
on Muslim population in Column 8 is a third of the size of that inColumn 1. Second, in all other
specifications, the instrumental variables estimate actually flips sign, indicating that Islam actually
has a positive effect on democracy. Third, in almost all 2SLSspecifications, the point estimate
of the positive effect of Islam is substantially larger thanthe negative effect of the “naive” OLS
estimator. Taken together, these results suggest not only that omitted variables are likely problems
with existing estimates of the effect of Islam on institutions, but also that the true relationship may
be in the opposite direction from current estimates. Fourth, standard errors increase substantially
in the instrumental variables regressions once the (largely geographical) Arab dummy is included,
and indeed none of our second-stage estimates are statistically significant. While instrumental vari-
ables estimators often produce larger standard errors thanOLS, we think that the fact that errors
23

increase only with the inclusion of the Arab dummy.27 Another way to see this is in Table 3, which
reports the first-stage—that is, the regression of Islam on the instrument and the other regressors.
Again, the top row is of primary interest; here, we notice that the instrument is statistically signif-
icant throughout. Also, note that while the F-statistics onthe excluded regressor do not indicate
a severe weak instruments problem, the instrument weakens in strength when the Arab dummy is
added.
To place these results in perspective, consider a country that, like 40% of those in our sample,
has almost no Muslims in the population. Then, interpretingthe OLS estimates in Columns 1-7
causally, replacing that country’s inhabitants with all Muslims—but changing nothing else—would
decrease the Freedom House index of democracy substantially. The lowest estimate, in Model 4, is
a third of a standard deviation, and the highest, in Model 1, is a two-thirds of a standard deviation
decrease in democracy. In contrast, interpreting the 2SLS estimates in Columns 8-14 causally,
the same thought experiment yields dramatically differentfindings. Our only estimated negative
effect of Islam is also in the specification corresponding toModel 1, but the effect is much smaller
at a fifth of a standard deviation (see column 8). More strikingly, in every other specification,
we find the opposite effect—that replacing a non-Muslim country’s inhabitants with all Muslims
actually increases the democracy index, with most specifications representing more than a standard
deviation increase in the Freedom House score, with the largest estimate (in Column 6) indicating
that replacing our imaginary country with all Muslims—but making no other changes—would
increase its Freedom House score by a remarkable two standard deviations.
The results reported in Table 4 replicate the models from Table 2, but now include a measure of
latitude. Including latitude is especially important in our setting because our instrumental variable
strategy is geographically defined. We therefore want to be sure that the distance measure we are
using is not accidentally proxying for latitude, which may itself independently affect democratic
institutions. This possibility is of special concern because there is a large literature suggesting that
latitude is a good predictor of income through its effect on disease and/or climate environments.
27This suggests the need to construct a higher quality historically valid measure of distance that better predictsIslam. The development of such a measure will be discussed below in the conclusion.
24
Once latitude is included in the regression equations, we see that the patterns established in Table 2
continue to hold. In the OLS models, the coefficient on Islam does not change substantially. In the
IV models, the effect of Islam once again flips to having a strongly positive effect on democracy,
although these results are not statistically significant. Moving to Table 5, we see that the inclusion
of latitude as a regressor does also draw power away from our instrument. Comparing the F-
statistics in Table 5 to those in Table 3, we see a weakening ofthe coefficients. In specifications 2
through 7 (still in Table 5), although the coefficient on Distance from Mecca continues to point in
the same direction—it is associated with a decrease in Muslim population—the instrument remains
weak. Thus, although the IV estimates reported in Table 4 imply a positive effect of Islam on
democracy, the weakness of the instrument renders any conclusions necessarily tentative.
We turn now to Table 6, which again replicates the OLS and IV models from Tables 4, but
which replaces Donno and Russett’s Freedom House democracy score from the late 1990s with an
updated score (averaged over 2000 to 2008) as the dependent variable. Using this updated data, we
see that the negative OLS coefficients on Islam are cut approximately in half, without an increase
in standard errors; furthermore, they are no longer signficant. This in itself is an interesting result,
given the consistent negative associations between Islam and democracy found in the earlier OLS
estimates. With respect to the IV models, the patterns established in Tables 2 and 4 continue to
hold: the estimated effect of Islam flips direction, and the coefficients are substantively large. That
said, as shown in Table 7, the first stage results are identical, so the same concerns about weak
instruments hold here as well.
5.2.2 Robustness
In this section, we approach the question of the causal impact of Islam on democracy using the
same identification strategy, but check for the robustness of our previous results by using different
data and different specifications. First, we expand the number of countries in our sample to 191, as
opposed to the 156 used in previous studies. This representsthe entire universe of Freedom House
countries currently available. Second, we use updated versions of all the control variables. Third,
25

we follow Fish (2002) in using a dichotomous measure of the Islam variable, although we continue
to prefer the continuous measure for the reasons explicatedby Donno and Russett (2004).
In the following specifications, which follow those in Fish’s Table 3, average Freedom House
scores for 2000 to 2008 are regressed on a majority Muslim dummy and a number of control vari-
ables. These control variables include: economic development (log GDP per capita 2005), latitude,
previous experience with democracy, a dummy for current or former membership in OPEC, level
of ethnic fractionalization, and dummies for former Britishand Soviet colonization.28
The results reported in columns 1 through 5 of Table 7 are the OLS estimates, while the results
reported in columns 6 through 10 report the IV estimates. As with the Donno and Russett specifi-
cations, in Table 7 we see that including latitude and previous experience with democracy cuts the
estimated effect of Islam in half, even in the OLS. Whereas Fish’s point estimates on Islam range
from -1.68 to -1.24, ours range from -0.58 to -0.74. And, similar to the replication of Donno and
Russett’s models, we see that the IV strategy flips the sign of the estimated effects of Islam from
negative to positive, although again the results are not statistically significant. When we examine
the first stage in Table 8, we see that, as with the continuous measure of Islam, the dichotomous
Muslim majority indicator is negatively associated with distance (ie, it is relevant). However, the
F-statistic on the exlcuded instrument is once again low, and as with the Donno and Russett speci-
fications, these regressions are therefore suspect due to the weak inference problem (although the
instrument remains statistically significant in models 1 through 3).
5.3 Panel Estimation
We turn now to our second strategy, one which uses panel data to obtain estimates of the effects
of Islam on democracy. Here, we broadly follow the strategy of Acemoglu et al. (2008), who in
their study of the relationship between income and democracy utilize fixed effects models, as well
28Fish’s original specifications did not include either latitude or previous experience with democracy. We includethese regressors for the reasons explicated above: latititude helps establish the validity of our exclusion restriction (ie,that our distance measure is related to democracy only through the channel of Islam), and previous experience withdemocracy captures whether it is Islam or a general historical influence of autocracy operating to reduce the currentlevel of democracy.
26

as a series of alternative estimation strategies aimed at addressing potential biases introduced by
the presence of a lagged dependent variable. Tables 9 and 10 reports estimates of the effect of
changes in Islamic population on democracy, in models whichadditionally include a five-year lag
of democracy, GDP per capita, total population and natural resource rents. Table 9 reports results
for Freedom House scores for 1975 to 2005, while Table 10 usesPolity scores for the same period.
The models in this section use data from 1970 to 2010, with each observation corresponding to
five-year intervals.
Starting with Table 9, in columns 1 and 2 we see the simple bivariate regression of democracy
on Islam when the data are pooled as a cross-section time series. This OLS estimator produces
positive but very small (nearly zero) effect of changes in Islam on changes in democracy, with a
coefficient of .0006 for the Freedom House score. In contrast, when we control for time-invariant
differences across countries by implementing country and year fixed effects in columns 3 and
4, we find a far stronger effect: an increase in percent Muslimis associated with a substantial
and statistically significant increase in democracy scores. Following our thought experiment from
earlier, if we took a country whose population was full of non-Muslims and replaced it with one
that was 100 percent Muslim, in this fixed effects model, the Freedom House score would increase
by more than percent.
Because democracy is highly persistent over time, in the pooled OLS and fixed effects models
reported in columns 1 through 4, we included the lagged valueof democracy as a regressor in our
analysis. However, in fixed effects specifations, the difference of the lagged democracy variable
is likely to be correlated with the difference of the error term, causing biased estimations of the
impact of Islam. To address this problem, we follow Acemogluet al. (2008) in estimating several
additional models. First, we implement the instrumental variable technique developed by Ander-
son and Hsiao (1982). Here, we time difference the model specified in equation 2 to eliminate
the problem of correlation between the lagged endogenous variable and the country-specific fixed
effect, and then use differences as instruments for the other right-hand-side variables. Second, we
use Arrellano-Bond’s generalized methods of moments (GMM) (Arellano and Bond, 1991). This
27
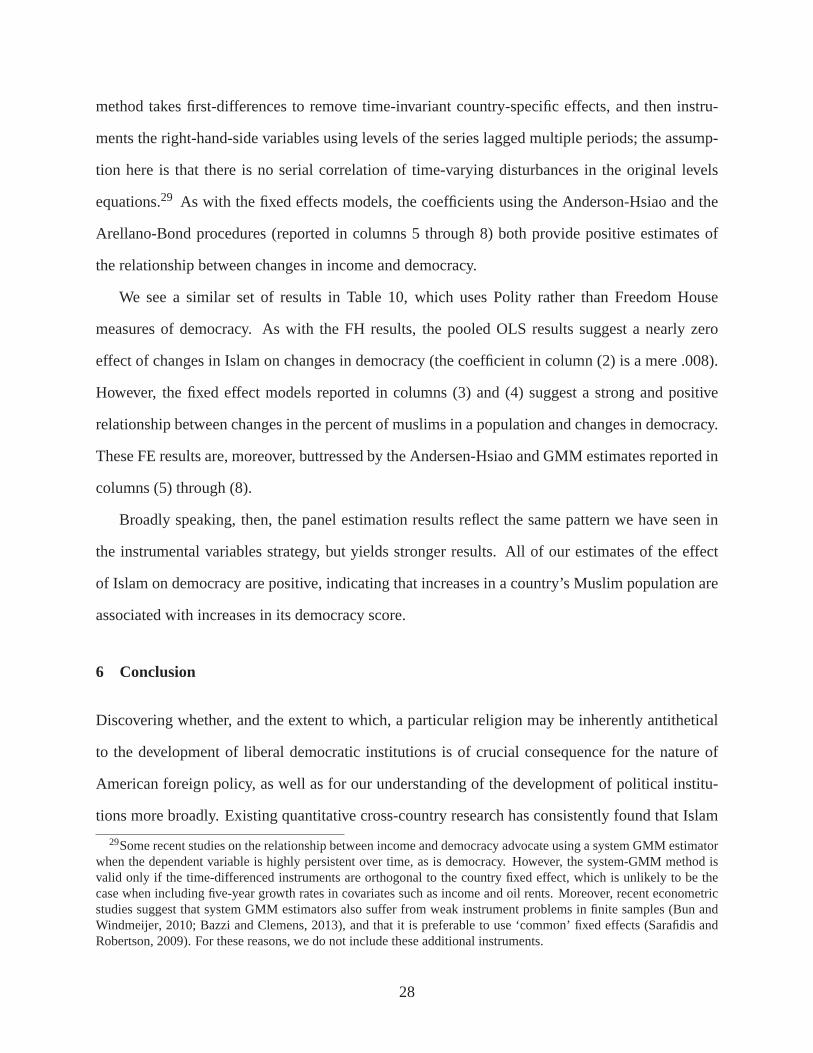
method takes first-differences to remove time-invariant country-specific effects, and then instru-
ments the right-hand-side variables using levels of the series lagged multiple periods; the assump-
tion here is that there is no serial correlation of time-varying disturbances in the original levels
equations.29 As with the fixed effects models, the coefficients using the Anderson-Hsiao and the
Arellano-Bond procedures (reported in columns 5 through 8) both provide positive estimates of
the relationship between changes in income and democracy.
We see a similar set of results in Table 10, which uses Polity rather than Freedom House
measures of democracy. As with the FH results, the pooled OLSresults suggest a nearly zero
effect of changes in Islam on changes in democracy (the coefficient in column (2) is a mere .008).
However, the fixed effect models reported in columns (3) and (4) suggest a strong and positive
relationship between changes in the percent of muslims in a population and changes in democracy.
These FE results are, moreover, buttressed by the Andersen-Hsiao and GMM estimates reported in
columns (5) through (8).
Broadly speaking, then, the panel estimation results reflectthe same pattern we have seen in
the instrumental variables strategy, but yields stronger results. All of our estimates of the effect
of Islam on democracy are positive, indicating that increases in a country’s Muslim population are
associated with increases in its democracy score.
6 Conclusion
Discovering whether, and the extent to which, a particular religion may be inherently antithetical
to the development of liberal democratic institutions is ofcrucial consequence for the nature of
American foreign policy, as well as for our understanding ofthe development of political institu-
tions more broadly. Existing quantitative cross-country research has consistently found that Islam
29Some recent studies on the relationship between income and democracy advocate using a system GMM estimatorwhen the dependent variable is highly persistent over time,as is democracy. However, the system-GMM method isvalid only if the time-differenced instruments are orthogonal to the country fixed effect, which is unlikely to be thecase when including five-year growth rates in covariates such as income and oil rents. Moreover, recent econometricstudies suggest that system GMM estimators also suffer fromweak instrument problems in finite samples (Bun andWindmeijer, 2010; Bazzi and Clemens, 2013), and that it is preferable to use ‘common’ fixed effects (Sarafidis andRobertson, 2009). For these reasons, we do not include theseadditional instruments.
28

is strongly associated with authoritarian forms of governance. In this paper, in contrast, we find no
support for this result. Instead, our positive point estimates for the coefficient on Islam across both
the instrumental variables and panel fixed effects researchdesigns suggest that omitted variables
may be spuriously driving the observed relationship.
We are currently pursuing two further lines of investigation. First, we are in the process of
expanding our panel dataset to include a wider range of years. The World Religion Database
and Kettani (2010) both provide a wealth of historical data on religious adherence going back to
the late 19th century. Although coverage of countries and years is uneven, assembling this data
would enable us to investigate the relationship between Islam and democracy over a longer period
through the implementation of an unbalanced panel analysis, insofar as our findings have indicated
that increasing sample size changes the magnitude and even the direction of the estimated effect of
Islam on democracy.
Second, we are currently constructing a higher quality measure of distance to predict Islam.
While the measure we have already collected—the great circledistance—is plausible and empiri-
cally predicts the global distribution of Islam well, it does not incorporate differences in transport
cost across terrain types. For instance, traveling across rugged terrain would have incurred a greater
cost to ancient and medieval travelers (Nunn and Puga, 2009). Historically valid measures of travel
costs are likely to produce improved predictors of the spread of Islam, which in turn would enable
more credible estimation of Islam’s effects. We are currently in the process of using historical
GIS information on old world trade routes to generate new distance measures that incorporate the
differences in travel costs of small-scale terrain irregularities in a way that reflects differences in
efficiency of transport options in the time of the early spread of Islam.
29

12
34
56
7F
reed
om H
ouse
Sco
re
0 1Islam Arrived by Conquest (=1)
All Countries
Note: The vertical axis depicts the Freedom House score in each country in our sample,obtained by averaging figures from 2000, 2005 and 2010. The horizontal axis indicateswhether Islam arrived via conquest or commercial ties. Sources: Freedom House (2010);World Religion Database (2010); own calculations.
Figure 1: Islam’s Arrival and Contemporary Patterns of Democracy
30

12
34
56
7F
reed
om H
ouse
Sco
re
0 1Islam Arrived by Conquest (=1)
Muslim Majority Countries
Note: The vertical axis depicts the Freedom House score in each Muslim-majority country,obtained by averaging figures from 2000, 2005 and 2010. The horizontal axis indicateswhether Islam arrived via conquest or commercial ties. Sources: Freedom House (2010);World Religion Database (2010); own calculations.
Figure 2: Islam’s Arrival and Contemporary Patterns of Democracy: Muslim-Majority Countries
31

Muslim Majority Not Muslim Majority OverallMean Mean Mean(s.e.) (s.e.) (s.d.)
Fraction Muslim 0.84 .05∗∗∗ .24(0.02) (.01) (.35)
Miles from Mecca (’000s) 2.04 4.41∗∗∗ 3.86(.18) (.21) (2.54)
Freedom House democracy score 2.86 5.23∗∗∗ 4.68(.17) (.15) (1.93)
Polity democracy score -2.22 5.28∗∗∗ 3.32(.86) (.51) (6.43)
log GDP per capita (2005 $PPP) 8.41 8.80∗ 8.71(.17) (.10) (1.21)
Fuel exports (fraction of GDP) .16 .03∗∗∗ .06(.03) (.01) (.13)
Previous experience with democracy 2.55 4.56∗∗∗ 4.09(.14) (.15) (1.85)
Fatal militarized disputes (MIDs) .91 .37∗∗∗ .51(.18) (.07) (.92)
Democracy in neighborhood 3.24 4.91∗∗∗ 4.52(.17) (.12) (1.52)
Ethnic fractionalization .53 .41∗∗∗ .44(.04) (.02) (.26)
Arab League member (=1) .44 0∗∗∗ 0.1
Latitude 24.18 17.47∗∗ 19.04(2.03) (2.17) (24.18)
Total population (’000s) 26537 35802 33642(6832) (11791) (127481)
Obs. 45 148 193
Notes: Variables and their construction are described in Table 13. Statistics for comparing Muslim majority and non-Muslim majority countriescome from two sample t-tests with unequal variances. Statistical significance:∗ 10% ;∗∗ 5% ; ∗∗∗ 1%.
Table 1: Summary Statistics
32

Model 1 Model 2 Model 3 Model 4 Model 5 Model 6 Model 7 IV Model 1 IV Model 2 IV Model 3 IV Model 4 IV Model 5 IV Model 6 IV Model 7(1) (2) (3) (4) (5) (6) (7) (8) (9) (10) (11) (12) (13) (14)
Islamic population (%) -1.24∗∗∗ -.93∗∗ -.80∗∗ -.62 -.78∗∗ -.76∗∗ -.79∗∗ -.37 .78 2.64 2.88 2.30 3.72 2.55(.31) (.37) (.38) (.39) (.38) (.39) (.38) (1.14) (1.89) (2.49) (2.48) (2.25) (2.77) (2.48)
log per capita GDP1990 .77∗∗∗ .83∗∗∗ .84∗∗∗ .59∗∗ .83∗∗∗ .82∗∗∗ .84∗∗∗ .76∗∗∗ .93∗∗∗ 1.02∗∗∗ .55∗ .99∗∗∗ 1.05∗∗∗ .97∗∗∗(.20) (.20) (.21) (.28) (.22) (.21) (.21) (.21) (.22) (.27) (.31) (.27) (.29) (.26)
Fuel exports -2.27∗∗ -2.00∗∗ -1.91∗∗ -1.34 -2.48∗∗ -1.80∗ -1.91∗∗ -2.65∗∗ -2.03∗∗ -1.94∗ -1.09 -2.58∗ -1.82 -1.94∗(.91) (.91) (.97) (.96) (1.19) (.96) (.97) (1.04) (.95) (1.16) (1.15) (1.49) (1.27) (1.17)
Democratic neighbors .08∗∗∗ .08∗∗∗ .08∗∗∗ .08∗∗∗ .07∗∗∗ .06∗∗∗ .08∗∗∗ .11∗∗ .13∗∗ .16∗∗ .15∗∗ .15∗∗ .17∗∗ .16∗∗(.03) (.02) (.02) (.03) (.03) (.02) (.02) (.05) (.05) (.07) (.06) (.06) (.07) (.06)
Past exp. with democracy .14∗∗∗ .14∗∗∗ .13∗∗∗ .14∗∗∗ .14∗∗∗ .12∗∗∗ .13∗∗∗ .15∗∗∗ .14∗∗∗ .13∗∗ .16∗∗∗ .14∗∗ .11∗ .13∗∗(.04) (.04) (.04) (.04) (.05) (.04) (.04) (.04) (.04) (.05) (.05) (.05) (.06) (.05)
Arab League member (=1) -.59∗ -.67∗ -.75∗∗ -.59 -.53 -.67∗ -1.61 -2.72∗ -2.81∗ -2.42∗ -3.17∗ -2.57∗(.35) (.34) (.37) (.37) (.33) (.35) (1.14) (1.54) (1.50) (1.37) (1.70) (1.50)
MID Involvement -.22∗∗∗ -.27∗∗ -.22∗∗ -.20∗∗ -.22∗∗∗ -.36∗∗∗ -.48∗∗∗ -.34∗∗∗ -.38∗∗ -.34∗∗(.09) (.11) (.09) (.08) (.08) (.14) (.19) (.12) (.15) (.13)
Gender literacy gap (%) -.02 -.04∗(.01) (.02)
Sex ratio -.01 -.01(.02) (.03)
Women in Govt. (%) .04∗∗ .05∗∗(.02) (.02)
Women in Parliament (%) .0002 .01(.01) (.02)
Constant 1.50∗∗∗ 1.29∗∗ 1.40∗∗ 2.33∗∗∗ 2.55 1.13∗ 1.40∗∗ 1.21∗∗ .56 .03 1.90∗ 1.48 -.71 .05(.55) (.56) (.57) (.89) (2.49) (.58) (.58) (.61) (.90) (1.07) (.99) (2.87) (1.23) (1.08)
Obs. 156 156 156 149 154 156 156 156 156 156 149 154 156 156R2 .65 .65 .66 .66 .67 .68 .66 .63 .6 .47 .46 .5 .34 .48F statistic 103.88 90.15 80.48 65.12 68.7 73.48 71.73 82.67 74.85 51.29 45.46 47.97 38.16 44.67Notes: The dependent variable is liberal democracy, measuredby the Freedom House score (1-7, increasing in quality). Columns 1-7 are OLS regressions replicating Models 2-8 from Table 1 in Donnoand Russett (2004). Columns 8-14 reproduce the same specifications as the second stage in 2SLS, where percentage of the population that is Muslim is instrumented using distance from Mecca. Allspecifications report Huber-White robust standard errors. Statistical significance:∗ 10% ;∗∗ 5% ; ∗∗∗ 1%.
Table 2: Replication of Donno and Russett (2004) with IV
33
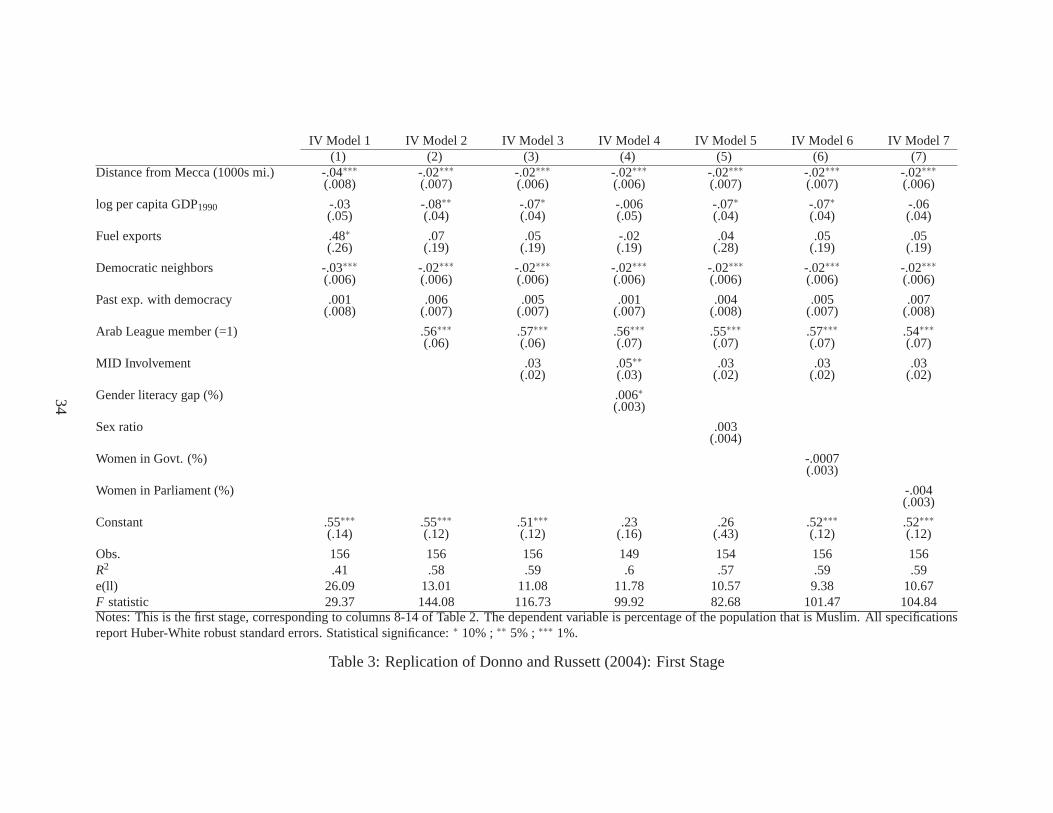
IV Model 1 IV Model 2 IV Model 3 IV Model 4 IV Model 5 IV Model 6 IV Model 7(1) (2) (3) (4) (5) (6) (7)
Distance from Mecca (1000s mi.) -.04∗∗∗ -.02∗∗∗ -.02∗∗∗ -.02∗∗∗ -.02∗∗∗ -.02∗∗∗ -.02∗∗∗(.008) (.007) (.006) (.006) (.007) (.007) (.006)
log per capita GDP1990 -.03 -.08∗∗ -.07∗ -.006 -.07∗ -.07∗ -.06(.05) (.04) (.04) (.05) (.04) (.04) (.04)
Fuel exports .48∗ .07 .05 -.02 .04 .05 .05(.26) (.19) (.19) (.19) (.28) (.19) (.19)
Democratic neighbors -.03∗∗∗ -.02∗∗∗ -.02∗∗∗ -.02∗∗∗ -.02∗∗∗ -.02∗∗∗ -.02∗∗∗(.006) (.006) (.006) (.006) (.006) (.006) (.006)
Past exp. with democracy .001 .006 .005 .001 .004 .005 .007(.008) (.007) (.007) (.007) (.008) (.007) (.008)
Arab League member (=1) .56∗∗∗ .57∗∗∗ .56∗∗∗ .55∗∗∗ .57∗∗∗ .54∗∗∗(.06) (.06) (.07) (.07) (.07) (.07)
MID Involvement .03 .05∗∗ .03 .03 .03(.02) (.03) (.02) (.02) (.02)
Gender literacy gap (%) .006∗(.003)
Sex ratio .003(.004)
Women in Govt. (%) -.0007(.003)
Women in Parliament (%) -.004(.003)
Constant .55∗∗∗ .55∗∗∗ .51∗∗∗ .23 .26 .52∗∗∗ .52∗∗∗(.14) (.12) (.12) (.16) (.43) (.12) (.12)
Obs. 156 156 156 149 154 156 156R2 .41 .58 .59 .6 .57 .59 .59e(ll) 26.09 13.01 11.08 11.78 10.57 9.38 10.67F statistic 29.37 144.08 116.73 99.92 82.68 101.47 104.84Notes: This is the first stage, corresponding to columns 8-14of Table 2. The dependent variable is percentage of the population that is Muslim. All specificationsreport Huber-White robust standard errors. Statistical significance:∗ 10% ;∗∗ 5% ; ∗∗∗ 1%.
Table 3: Replication of Donno and Russett (2004): First Stage
34

Model 1 Model 2 Model 3 Model 4 Model 5 Model 6 Model 7 IV Model 1 IV Model 2 IV Model 3 IV Model 4 IV Model 5 IV Model 6 IV Model 7(1) (2) (3) (4) (5) (6) (7) (8) (9) (10) (11) (12) (13) (14)
Islamic Population (%) -1.26∗∗∗ -.94∗∗ -.86∗∗ -.67∗ -.84∗∗ -.84∗∗ -.87∗∗ -.14 3.60 6.04 6.12 5.00 8.30 5.93(.32) (.39) (.39) (.40) (.40) (.40) (.39) (1.67) (5.60) (7.56) (7.14) (6.03) (9.24) (7.52)
log per capita GDP1990 .72∗∗∗ .80∗∗∗ .75∗∗∗ .53∗ .75∗∗∗ .70∗∗∗ .75∗∗∗ .78∗∗∗ 1.36∗ 1.54∗ .77∗ 1.42∗ 1.74 1.45∗(.24) (.25) (.26) (.31) (.27) (.26) (.26) (.26) (.73) (.91) (.47) (.75) (1.10) (.83)
Fuel exports -2.18∗∗ -1.95∗∗ -1.76∗ -1.23 -2.43∗∗ -1.61 -1.76∗ -2.80∗∗ -2.57∗ -2.57 -1.36 -2.98 -2.65 -2.58(.95) (.95) (1.00) (.99) (1.20) (.99) (1.01) (1.36) (1.42) (1.74) (1.49) (2.01) (2.05) (1.76)
Democratic neighbors .09∗∗∗ .09∗∗∗ .08∗∗∗ .08∗∗∗ .08∗∗∗ .07∗∗∗ .08∗∗∗ .13∗∗ .19 .24 .20 .20 .27 .23(.03) (.03) (.02) (.03) (.03) (.03) (.03) (.06) (.14) (.18) (.14) (.14) (.21) (.17)
Past exp. with democracy .14∗∗∗ .13∗∗∗ .14∗∗∗ .15∗∗∗ .14∗∗∗ .13∗∗∗ .14∗∗∗ .15∗∗∗ .11 .10 .15∗∗ .12 .07 .09(.04) (.04) (.04) (.04) (.05) (.04) (.04) (.04) (.07) (.08) (.07) (.07) (.09) (.09)
Arab League member (=1) -.59∗ -.63∗ -.73∗ -.58 -.47 -.64∗ -3.29 -4.75 -4.69 -3.94 -5.89 -4.46(.36) (.35) (.38) (.37) (.34) (.36) (3.35) (4.54) (4.18) (3.49) (5.49) (4.29)
MID Involvement -.23∗∗ -.28∗∗∗ -.22∗∗ -.21∗∗ -.23∗∗ -.40 -.60∗ -.36∗ -.45 -.37(.10) (.11) (.10) (.10) (.10) (.26) (.35) (.20) (.31) (.24)
Gender literacy gap (%) -.02 -.06(.01) (.05)
Sex ratio -.008 -.03(.02) (.04)
Women in Govt. (%) .04∗∗ .05(.02) (.03)
Women in Parliament (%) -.0009 .03(.01) (.04)
Latitude .002 .001 .004 .003 .003 .004 .004 -.0008 -.01 -.01 -.01 -.01 -.02 -.01(.004) (.004) (.004) (.004) (.005) (.004) (.005) (.006) (.02) (.02) (.02) (.02) (.02) (.02)
Constant 1.63∗∗ 1.38∗∗ 1.61∗∗ 2.44∗∗∗ 2.36 1.38∗∗ 1.61∗∗ 1.11 -1.15 -2.03 1.06 1.12 -3.49 -2.05(.63) (.66) (.68) (.94) (2.51) (.68) (.69) (.96) (3.16) (4.03) (1.87) (3.80) (5.04) (4.07)
Obs. 155 155 155 149 153 155 155 155 155 155 149 153 155 155R2 .65 .66 .67 .66 .67 .68 .67 .62 .32 -.1 -.05 .11 -.67 -.06F statistic 85.95 76.86 69.59 58.34 60.79 64.51 63.05 66.26 40.86 24.59 23.92 26.45 15.71 21.99Notes: Identical to Table 2, except that latitude has been added as a regressor. All specifications report Huber-White robust standard errors. Statistical significance:∗ 10% ;∗∗ 5% ; ∗∗∗ 1%.
Table 4: Replication of Donno and Russett with IV and Latitude
35

IV Model 1 IV Model 2 IV Model 3 IV Model 4 IV Model 5 IV Model 6 IV Model 7(1) (2) (3) (4) (5) (6) (7)
Distance from Mecca (’000s mi.) -.03∗∗∗ -.01 -.01 -.01 -.01 -.009 -.01(.01) (.008) (.008) (.008) (.008) (.008) (.008)
log per capita GDP1990 -.06 -.12∗∗∗ -.11∗∗∗ -.04 -.11∗∗∗ -.11∗∗∗ -.10∗∗(.05) (.04) (.04) (.05) (.04) (.04) (.04)
Fuel exports .53∗∗ .14 .12 .03 .09 .12 .13(.26) (.18) (.18) (.18) (.26) (.18) (.18)
Democratic neighbors -.03∗∗∗ -.02∗∗∗ -.02∗∗∗ -.02∗∗∗ -.02∗∗∗ -.02∗∗∗ -.02∗∗∗(.006) (.006) (.006) (.006) (.006) (.006) (.006)
Past exp. with democracy .002 .007 .007 .002 .005 .007 .008(.008) (.007) (.008) (.007) (.008) (.007) (.008)
Arab League member (=1) .58∗∗∗ .58∗∗∗ .57∗∗∗ .56∗∗∗ .58∗∗∗ .55∗∗∗(.06) (.06) (.06) (.07) (.06) (.06)
MID Involvement .02 .04∗ .02 .02 .02(.03) (.02) (.03) (.03) (.03)
Gender literacy gap (%) .006∗(.003)
Sex ratio .004(.005)
Women in Govt. (%) -.0005(.003)
Women in Parliament (%) -.004∗(.003)
Latitude .001 .002∗∗∗ .002∗∗∗ .002∗∗ .002∗∗∗ .002∗∗∗ .002∗∗∗(.001) (.0008) (.0008) (.0009) (.0009) (.0008) (.0008)
Constant .57∗∗∗ .59∗∗∗ .56∗∗∗ .24 .19 .56∗∗∗ .57∗∗∗(.14) (.12) (.12) (.16) (.43) (.12) (.12)
Obs. 155 155 155 149 153 155 155R2 .41 .59 .6 .61 .58 .6 .6F statistic of excluded instruments 11.06 1.88 1.49 1.74 1.93 1.28 1.57F statistic 24.2 117.04 100.31 90.41 71.69 88.67 93.65Notes: Identical to Table 3, except that latitude has been added as a regressor. All specifications report Huber-White robust standard errors. Statistical significance:∗ 10% ;∗∗ 5% ; ∗∗∗ 1%.
Table 5: Replication of Donno and Russett with Latitude: FirstStage
36
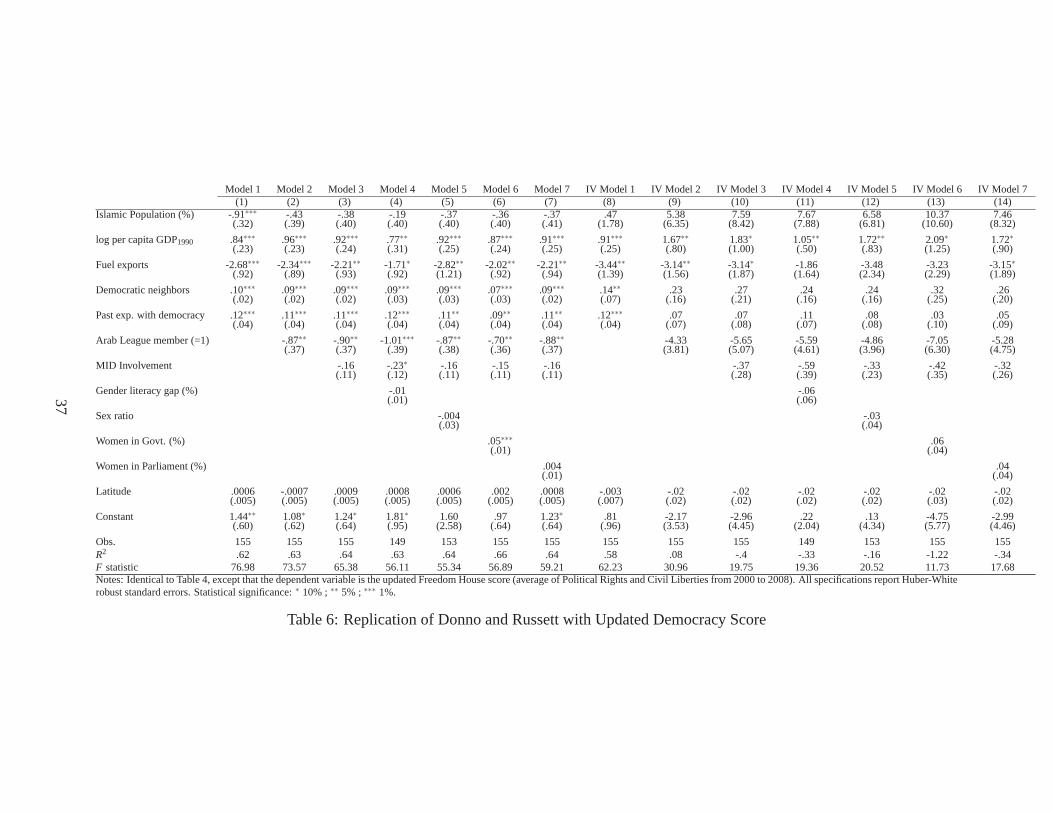
Model 1 Model 2 Model 3 Model 4 Model 5 Model 6 Model 7 IV Model 1 IV Model 2 IV Model 3 IV Model 4 IV Model 5 IV Model 6 IV Model 7(1) (2) (3) (4) (5) (6) (7) (8) (9) (10) (11) (12) (13) (14)
Islamic Population (%) -.91∗∗∗ -.43 -.38 -.19 -.37 -.36 -.37 .47 5.38 7.59 7.67 6.58 10.37 7.46(.32) (.39) (.40) (.40) (.40) (.40) (.41) (1.78) (6.35) (8.42) (7.88) (6.81) (10.60) (8.32)
log per capita GDP1990 .84∗∗∗ .96∗∗∗ .92∗∗∗ .77∗∗ .92∗∗∗ .87∗∗∗ .91∗∗∗ .91∗∗∗ 1.67∗∗ 1.83∗ 1.05∗∗ 1.72∗∗ 2.09∗ 1.72∗(.23) (.23) (.24) (.31) (.25) (.24) (.25) (.25) (.80) (1.00) (.50) (.83) (1.25) (.90)
Fuel exports -2.68∗∗∗ -2.34∗∗∗ -2.21∗∗ -1.71∗ -2.82∗∗ -2.02∗∗ -2.21∗∗ -3.44∗∗ -3.14∗∗ -3.14∗ -1.86 -3.48 -3.23 -3.15∗(.92) (.89) (.93) (.92) (1.21) (.92) (.94) (1.39) (1.56) (1.87) (1.64) (2.34) (2.29) (1.89)
Democratic neighbors .10∗∗∗ .09∗∗∗ .09∗∗∗ .09∗∗∗ .09∗∗∗ .07∗∗∗ .09∗∗∗ .14∗∗ .23 .27 .24 .24 .32 .26(.02) (.02) (.02) (.03) (.03) (.03) (.02) (.07) (.16) (.21) (.16) (.16) (.25) (.20)
Past exp. with democracy .12∗∗∗ .11∗∗∗ .11∗∗∗ .12∗∗∗ .11∗∗ .09∗∗ .11∗∗ .12∗∗∗ .07 .07 .11 .08 .03 .05(.04) (.04) (.04) (.04) (.04) (.04) (.04) (.04) (.07) (.08) (.07) (.08) (.10) (.09)
Arab League member (=1) -.87∗∗ -.90∗∗ -1.01∗∗∗ -.87∗∗ -.70∗∗ -.88∗∗ -4.33 -5.65 -5.59 -4.86 -7.05 -5.28(.37) (.37) (.39) (.38) (.36) (.37) (3.81) (5.07) (4.61) (3.96) (6.30) (4.75)
MID Involvement -.16 -.23∗ -.16 -.15 -.16 -.37 -.59 -.33 -.42 -.32(.11) (.12) (.11) (.11) (.11) (.28) (.39) (.23) (.35) (.26)
Gender literacy gap (%) -.01 -.06(.01) (.06)
Sex ratio -.004 -.03(.03) (.04)
Women in Govt. (%) .05∗∗∗ .06(.01) (.04)
Women in Parliament (%) .004 .04(.01) (.04)
Latitude .0006 -.0007 .0009 .0008 .0006 .002 .0008 -.003 -.02 -.02 -.02 -.02 -.02 -.02(.005) (.005) (.005) (.005) (.005) (.005) (.005) (.007) (.02) (.02) (.02) (.02) (.03) (.02)
Constant 1.44∗∗ 1.08∗ 1.24∗ 1.81∗ 1.60 .97 1.23∗ .81 -2.17 -2.96 .22 .13 -4.75 -2.99(.60) (.62) (.64) (.95) (2.58) (.64) (.64) (.96) (3.53) (4.45) (2.04) (4.34) (5.77) (4.46)
Obs. 155 155 155 149 153 155 155 155 155 155 149 153 155 155R2 .62 .63 .64 .63 .64 .66 .64 .58 .08 -.4 -.33 -.16 -1.22 -.34F statistic 76.98 73.57 65.38 56.11 55.34 56.89 59.21 62.23 30.96 19.75 19.36 20.52 11.73 17.68Notes: Identical to Table 4, except that the dependent variable is the updated Freedom House score (average of PoliticalRights and Civil Liberties from 2000 to 2008). All specifications report Huber-Whiterobust standard errors. Statistical significance:∗ 10% ;∗∗ 5% ; ∗∗∗ 1%.
Table 6: Replication of Donno and Russett with Updated Democracy Score
37

Model 1 Model 2 Model 3 Model 4 Model 5 IV Model 1 IV Model 2 IV Model 3 IV Model 4 IV Model 5(1) (2) (3) (4) (5) (6) (7) (8) (9) (10)
Majority Muslim (=1) -.74∗∗∗ -.68∗∗∗ -.64∗∗∗ -.58∗∗ -.58∗∗ .04 .19 .11 .82 .67(.23) (.23) (.23) (.23) (.23) (1.23) (1.31) (1.59) (1.94) (1.89)
Log GDP per capita (2005 USD PPP) .04 .08 .10 .10 .10 .009 .07 .08 .06 .07(.08) (.09) (.09) (.09) (.09) (.11) (.10) (.11) (.11) (.11)
Latitude -.001 -.002 -.002 -.004 -.006 -.004 -.005 -.005 -.01 -.01(.004) (.004) (.004) (.004) (.004) (.006) (.006) (.007) (.009) (.009)
Previous exp. with democracy .80∗∗∗ .78∗∗∗ .79∗∗∗ .81∗∗∗ .82∗∗∗ .90∗∗∗ .88∗∗∗ .87∗∗∗ .98∗∗∗ .97∗∗∗(.06) (.07) (.07) (.07) (.07) (.17) (.16) (.19) (.23) (.23)
Current or former member of OPEC -.50∗ -.54∗ -.51∗ -.47 -.73 -.74 -.86 -.77(.28) (.28) (.29) (.29) (.45) (.50) (.56) (.54)
Ethnic fractionalization .21 .24 .25 .17 .17 .20(.29) (.28) (.28) (.32) (.35) (.33)
Former British colony (=1) -.28∗ -.25∗ -.46∗ -.41(.15) (.15) (.26) (.26)
Post-communist (=1) .28 .31(.29) (.32)
Constant 1.23∗∗ 1.01∗ .73 .75 .67 .97 .62 .46 .28 .25(.57) (.58) (.65) (.64) (.65) (.66) (.75) (.76) (.83) (.82)
Obs. 191 191 186 186 186 191 191 186 186 186R2 .74 .75 .75 .75 .75 .72 .72 .73 .69 .7F statistic 226.8 191.8 154.9 140.02 124.65 225.38 191.16 156.54 125.49 115.31Notes: The dependent variable is liberal democracy, measuredby the Freedom House score (1-7, increasing in quality). Columns 1-5 are OLS regressions following Table 3 in Fish (2002),with updateddata and including latitude and previous experience with democracy. Columns 6-10 reproduce the same specifications as the second stage in 2SLS, where the dummy variable indicating majority Muslimis instrumented using distance from Mecca. All specifications report Huber-White robust standard errors. Statistical significance:∗ 10% ;∗∗ 5% ; ∗∗∗ 1%.
Table 7: Robustness IV Results
38

IV Model 1 IV Model 2 IV Model 3 IV Model 4 IV Model 5(1) (2) (3) (4) (5)
Distance from Mecca (’000s mi.) -.03∗∗ -.03∗∗ -.02∗ -.02 -.02(.01) (.01) (.01) (.01) (.01)
Log GDP per capita (2005 USD PPP) .04 .02 .02 .02 .02(.03) (.03) (.04) (.03) (.03)
Latitude .002 .002∗ .002∗ .003∗∗ .003∗∗(.001) (.001) (.001) (.001) (.001)
Previous exp. with democracy -.11∗∗∗ -.10∗∗∗ -.10∗∗∗ -.10∗∗∗ -.11∗∗∗(.02) (.02) (.02) (.02) (.02)
Constant .42∗ .52∗∗ .46 .42 .43(.25) (.25) (.29) (.29) (.30)
Obs. 191 191 186 186 186R2 .29 .31 .31 .32 .32F statistic of excluded instruments 5.36 5.14 3.54 2.21 2.21F statistic 21.69 21.44 17.13 17.12 15.07Notes: This is the first stage, corresponding to columns 6-10of Table 7. The dependent variable is percentage of the population that is Muslim. All specificationsreport Huber-White robust standard errors. Statistical significance:∗ 10% ;∗∗ 5% ; ∗∗∗ 1%.
Table 8: Robustness IV Results: First Stage
39

(1) (2) (3) (4) (5) (6) (7) (8)Pooled OLS Pooled OLS FE FE AH IV AH IV GMM GMM
Islamic populationt−1 0.00 0.00 0.62∗∗ 0.88∗∗∗ 1.22∗ 4.88∗ 0.92∗∗∗ 3.98∗∗
(0.00) (0.00) (0.24) (0.22) (0.72) (2.91) (0.31) (1.67)
Democracyt−1 0.84∗∗∗ 0.83∗∗∗ 0.49∗∗∗ 0.52∗∗∗ 0.24 0.19 0.35∗∗∗ 0.20∗
(0.02) (0.02) (0.04) (0.05) (0.31) (0.14) (0.13) (0.12)
Log GDPt−1 0.14∗∗∗ 0.17∗∗∗ 0.01 -0.06 -3.50 -1.73 -2.02∗∗∗ -0.04(0.04) (0.04) (0.10) (0.10) (2.60) (1.51) (0.69) (0.76)
Log populationt−1 0.03∗ -0.27∗ -1.38 -0.82(0.02) (0.15) (1.16) (0.54)
Natural resource rentst−1 -0.00∗∗∗ 0.00 0.00 0.00(0.00) (0.00) (0.00) (0.00)
HansenJ Test [.02] [.14]
AR(2) Test [.59] [.74]
Countries 157 152 157 152 156 152 156 152Observations 954 792 954 792 796 514 795 513R2 0.798 0.805 0.377 0.414 . . . .
Table 10: Fixed Effects Results Using Freedom House Measure of DemocracyNote: Dependent variable is the Freedom House measure of democracy (1-7, increasing in quality). Columns 1 and 2 contain results from pooled cross-sectional OLS models, with robust standard errors
clustered by country. Columns 3 and 4 report fixed effects OLS regressions with country dummies and robust standard errors clustered by country. Columns 5 and 6 use the instrumental variable method
proposed by Andersen and Hsiao (1982) with clustered standard errors, while columns 7 and 8 use Arellano and Bond’s GMM method with robust standard errors; in the GMM estimates we use the
small-sample adjustment. All estimates are based on a balanced panel from 1970 through 2010. For details of variables, see Data Appendix.
40
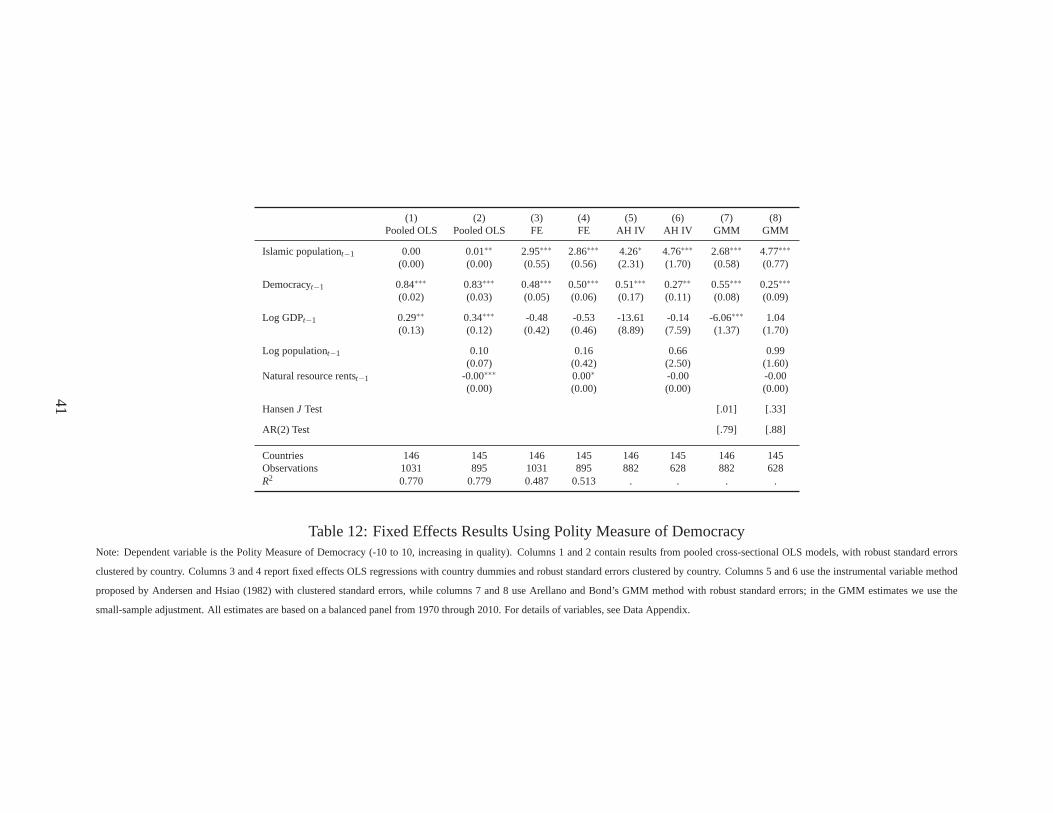
(1) (2) (3) (4) (5) (6) (7) (8)Pooled OLS Pooled OLS FE FE AH IV AH IV GMM GMM
Islamic populationt−1 0.00 0.01∗∗ 2.95∗∗∗ 2.86∗∗∗ 4.26∗ 4.76∗∗∗ 2.68∗∗∗ 4.77∗∗∗
(0.00) (0.00) (0.55) (0.56) (2.31) (1.70) (0.58) (0.77)
Democracyt−1 0.84∗∗∗ 0.83∗∗∗ 0.48∗∗∗ 0.50∗∗∗ 0.51∗∗∗ 0.27∗∗ 0.55∗∗∗ 0.25∗∗∗
(0.02) (0.03) (0.05) (0.06) (0.17) (0.11) (0.08) (0.09)
Log GDPt−1 0.29∗∗ 0.34∗∗∗ -0.48 -0.53 -13.61 -0.14 -6.06∗∗∗ 1.04(0.13) (0.12) (0.42) (0.46) (8.89) (7.59) (1.37) (1.70)
Log populationt−1 0.10 0.16 0.66 0.99(0.07) (0.42) (2.50) (1.60)
Natural resource rentst−1 -0.00∗∗∗ 0.00∗ -0.00 -0.00(0.00) (0.00) (0.00) (0.00)
HansenJ Test [.01] [.33]
AR(2) Test [.79] [.88]
Countries 146 145 146 145 146 145 146 145Observations 1031 895 1031 895 882 628 882 628R2 0.770 0.779 0.487 0.513 . . . .
Table 12: Fixed Effects Results Using Polity Measure of DemocracyNote: Dependent variable is the Polity Measure of Democracy (-10 to 10, increasing in quality). Columns 1 and 2 contain results from pooled cross-sectional OLS models, with robust standard errors
clustered by country. Columns 3 and 4 report fixed effects OLS regressions with country dummies and robust standard errors clustered by country. Columns 5 and 6 use the instrumental variable method
proposed by Andersen and Hsiao (1982) with clustered standard errors, while columns 7 and 8 use Arellano and Bond’s GMM method with robust standard errors; in the GMM estimates we use the
small-sample adjustment. All estimates are based on a balanced panel from 1970 through 2010. For details of variables, see Data Appendix.
41
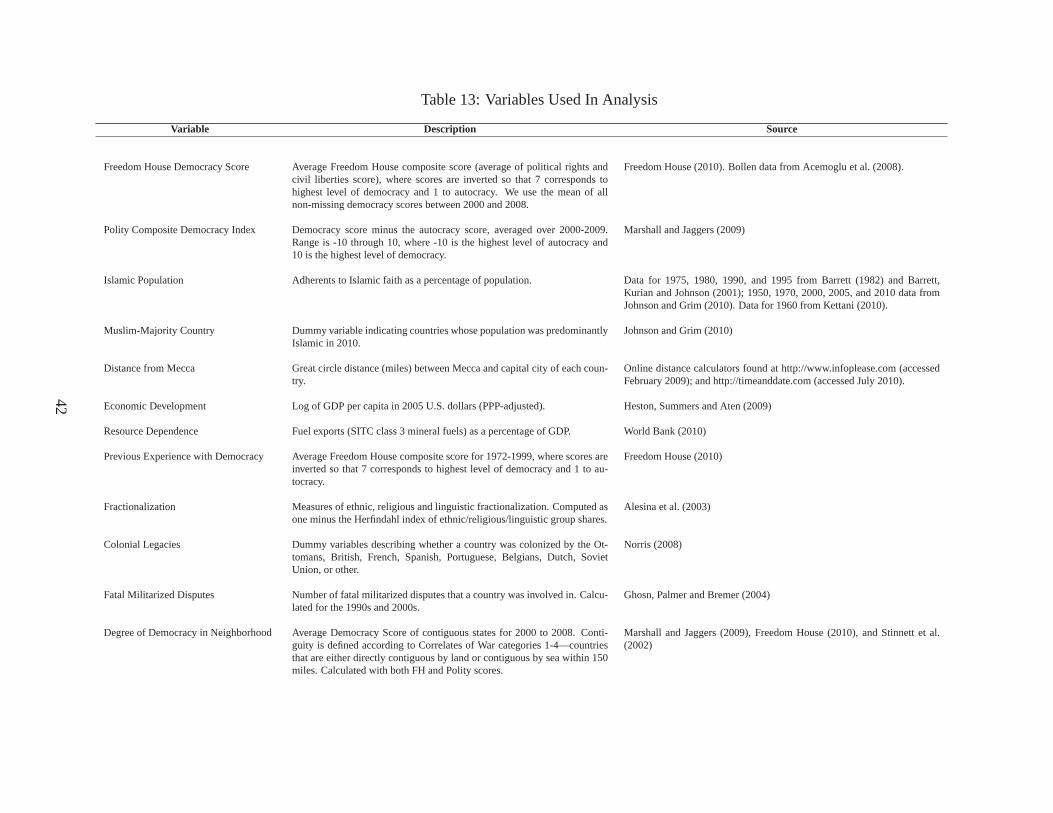
Table 13: Variables Used In Analysis
Variable Description Source
Freedom House Democracy Score Average Freedom House composite score (average of political rights andcivil liberties score), where scores are inverted so that 7 corresponds tohighest level of democracy and 1 to autocracy. We use the mean ofallnon-missing democracy scores between 2000 and 2008.
Freedom House (2010). Bollen data from Acemoglu et al. (2008).
Polity Composite Democracy Index Democracy score minus the autocracy score, averaged over 2000-2009.Range is -10 through 10, where -10 is the highest level of autocracy and10 is the highest level of democracy.
Marshall and Jaggers (2009)
Islamic Population Adherents to Islamic faith as a percentageof population. Data for 1975, 1980, 1990, and 1995 from Barrett (1982) and Barrett,Kurian and Johnson (2001); 1950, 1970, 2000, 2005, and 2010 data fromJohnson and Grim (2010). Data for 1960 from Kettani (2010).
Muslim-Majority Country Dummy variable indicating countrieswhose population was predominantlyIslamic in 2010.
Johnson and Grim (2010)
Distance from Mecca Great circle distance (miles) between Mecca and capital city of each coun-try.
Online distance calculators found at http://www.infoplease.com (accessedFebruary 2009); and http://timeanddate.com (accessed July2010).
Economic Development Log of GDP per capita in 2005 U.S. dollars(PPP-adjusted). Heston, Summers and Aten (2009)
Resource Dependence Fuel exports (SITC class 3 mineral fuels) as a percentage of GDP. World Bank (2010)
Previous Experience with Democracy Average Freedom House composite score for 1972-1999, where scores areinverted so that 7 corresponds to highest level of democracy and 1 to au-tocracy.
Freedom House (2010)
Fractionalization Measures of ethnic, religious and linguistic fractionalization. Computed asone minus the Herfindahl index of ethnic/religious/linguistic group shares.
Alesina et al. (2003)
Colonial Legacies Dummy variables describing whether a country was colonized by the Ot-tomans, British, French, Spanish, Portuguese, Belgians, Dutch, SovietUnion, or other.
Norris (2008)
Fatal Militarized Disputes Number of fatal militarized disputes that a country was involved in. Calcu-lated for the 1990s and 2000s.
Ghosn, Palmer and Bremer (2004)
Degree of Democracy in Neighborhood Average Democracy Score of contiguous states for 2000 to 2008. Conti-guity is defined according to Correlates of War categories 1-4—countriesthat are either directly contiguous by land or contiguous bysea within 150miles. Calculated with both FH and Polity scores.
Marshall and Jaggers (2009), Freedom House (2010), and Stinnett et al.(2002)
42

Table 13: (cont.)
Variable Description Source
Arab League Dummy variable for the twenty-one member states of the Arab League:Algeria, Bahrain, Comoros, Djibuti, Egypt, Iraq, Jordan, Kuwait, Lebanon,Libya, Mauritania, Morocco, Oman, Qatar, Saudi Arabia, Somalia, Sudan,Syria, Tunisia, UAE, and Yemen.
Donno and Russett (2004)
Latitude Latitude of the country centroid. For countries where the centroid falls inthe ocean, it is moved to within the nearest land boundary.
Gallup, Sachs and Mellinger (1999). For missing countries, we use thelatitude of the capital city, as provided by http://worldcaps.com (accessedAugust 2010).
Other Merging data from various sources was often complicated by the fact thatnearly every cross-national dataset uses distinct countryidentifiers. Wefound Rafal Raciborski’s -kountry- ado to be very helpful inthe mergingprocess.
Raciborski (2008)
43

LUX
SUR
LVA VNM HTI SLBSYC TUVFINSVK CHNITAGRD
CHEDNKSWZ USA
GNB
BHS
PHLUGA
ZAFANDNPL
SGP
ERI
CMR
PRT
LKA
HUN
LIERUS
LAO
GHA
VUT
CYP
KNA
IND
HRV TLSKOR
GNQGER
NGA
PANROU ATG
MUS
CIV
CZE NIC TONSVN ARGARM
MNE
LCABRBSTP FSM
RWA
KIR
BEN
ZMB
TZA
MWI
WSM
NLDMDG
MKD
BRAUKR
GUY
NORBELLSO PRYBLR
GRCHNDESTAGO
FJI
LBR
CHLNRUMEXPERISLESP VCT COLCOG GTMLTUZWE
CAF
AUTNZL
GEO
MDA URY
BGR
IRL CUBPLWMMR
TTO
SLE
SRBKHMBTN SLV
SWE
FRA
BLZ
KEN
JPN PNGGBR
TWN DOMDMAMLT AUS
MOZ
MHL
ETH
CPVVENMCO CAN
ISR
POL PRKGAB
ECUSMRZAR JAMBWA
TGO
NAMBDI BOL
THAMNG
CRI
YEM SOM
MLI
BFA
KGZ
BIH
TKM GMBUZBQAT
PAK
KWT
IRN
TCD
SEN
DZA
SDN
MRT
EGY TJKAZE
TUR
BRN
IDN
LBY
MYS
MAR
SYR
BHR
MDVCOM
ALB
JOR
LBN
TUN
ARE
DJIIRQNER
KAZ
SAUBGD
AFG
OMN
GIN
020
4060
8010
0P
erce
nt M
uslim
0 2000 4000 6000 8000 10000Distance to Mecca (mi.)
Note: The vertical axis depicts the percentage of population that is Muslim in each country,obtained by averaging figures from 2000, 2005 and 2010. The horizontal axis measureseach country’s distance to Mecca in miles. Sources: World Religion Database (2010);Distance Calculators available at http://www.infoplease.com and http://timeanddate.com.
Figure 3: The Relevance of the Instrument
44

DOM
AND
VUTBWA
NLD
MNG
LBR
AUSTUV
MOZ
SLV
CZE
SUR
ZWE
SYC
ISRTWN
INDJAM
KHM
MHLMLT
GUY
MNE
MEX
GRD
MKDUKR
LUX
COG
NIC
TZA
MDG
ARG
VCT
GTM
HRV
BRBUSA
KOR
KEN
BGR
RUS
GNB
DMA
CIV
ITALCA
PNG
GRC
PRTKIR
PER
GHA
ISL
COL
HUN
HNDLSO
AGO
MDA
LIECPV
SLE
SVNGBRSWE
BEN
CRIKNA
CHN
URY
GEO
ATG
PRY
BLZ
BOL
VNM
GAB
CHL
HTI
NAM
NGA
MMR
DNK
SWZ
ROU
PRK
CYP
WSM
SLB
BTN
ARMNPL
BEL
VEN
LKA
ZMB
PLW
SRB
LTU
GNQ
IRLNOR
ERI
SGP
BRA
JPN
BHS
PAN
FIN
FJI
NZL
TGO
TLS
ZARRWA
BDI
EST
LAO
UGAETHCAF
FSM
TON
TTO
ESPSVKMCO
CHE
THA
GER
STPZAF
ECU
MUS
CUB
LVA
MWI
CANAUT
PHL
POL FRA
CMR
NRU
BLR
SMR
BHR
COM
TCD
SDN
YEM
IRQ
UZB
TUNTJKQAT
KWT
AFG
JOR
MDV
SOM
MYS
LBN
EGY
TUR
AREAZE
MRT
BFA
OMN
SYR
PAK
IRN
TKM
BGDBIH
GIN DZA
SAU
DJI
MLI
KAZ
KGZ
GMB
IDN
LBY
SEN
NER
BRN
MAR
ALB
12
34
56
7F
reed
om H
ouse
Sco
re
0 20 40 60 80 100Percent Muslim
Note: The vertical axis depicts the composite Freedom HouseScore (political rights andcivil liberties) averaged over 2000-2007. The score rangesfrom 1 (most unfree) to 7 (mostfree). Percentage of population that is Muslim in each country is averaged over 2000, 2005and 2010. The regression line is from a bivariate fit. Sources: Freedom House (2010);World Religion Database (2010).
Figure 4: Islam and Democracy Score, 2000s
45

CAN
JPN
VEN
PER
BRA
CHL
THA
CHE
BOLCUB
SWE
BTN
HUN
CHN
ITA
BEL
NPL
NOR
DNK
URY
DOMHTIPRT
AUT
ARG
NLD
USA
ECU
ESP
GTMRUS
PRY
CRI
COL
BGR
ROU
MEX
NICLBR
NZL
PAN
AUS
GBR
GRC
FRA
HND
GER
SLV
SRB
TUR
AFGMARIRNOMN
−10
−5
05
10P
olity
2 S
core
190
0s
0 20 40 60 80 100Percent Muslim
1900s
LIE
HUNGHA
NLD
NPL
NRU
USA
MOZ
ZWE
BWA
MNG
POL
MCO
SLV
CRI
COG
PRK
KEN
JAM
AND
ZAF
TZA
ITA
ARG
TON
GNBMMRLAOPAN
JPN
BGR
HTI
SLE
ZAR
CIV
GUY
DNK
BEN
IRL
FJI
GAB
FINSMRDMAKIR
CAN
SYC
ISL
VNM
CUB
NAMCPV
GBR
MDG
BRB
MWI
VCT
PRT
ROU
MUS
TWN
SLB
DOM
MEX
PNG
FRABHSLUX
VEN
GRD
BEL
AGO
PHLPER
HNDLSO
KHM
GTM
URY
AUT
COL
UGA
BTN
GNQ
LBR
NZL
TTO
BOL
CMR
ISR
NGA
RWA
ZMB
IND
SWZ
LKA
CHL
CHN
THANIC
SWECHE
MLT
CYP
ETH
KOR SGP
STP
TGO
ECU
CAF
PRY
ESP
NOR
WSM
SUR
GRC
TUV
BDI
LCA
BRA
AUS
OMN
LBNDJI
PAK
COM
TUR
LBY
ALB
MARKWT
MDV
QAT
SEN
MLI
IDN
DZA
TCD
BHR
IRNBRN
SOM
BFA
TUN
SAU
GMB
SYRMRT
IRQ
EGY
SDN
AFG
ARE
MYS
BGD
GIN
JOR
NER
12
34
56
7F
reed
om H
ouse
Sco
re 1
970s
0 20 40 60 80 100Percent Muslim
1970s
PRK
JPN
TGO
WSM
SUR
MNG
PER
CHL
SGP
DOM
CIV
TWNGUY
VNM
CYP
MWI
PHL
ECU
PRYPOL
VCT
BOL
TZA
ZAF
LKA
COL
NGA
ZWE
SYC
DMA
NLD
HUN
NAM
MMR
VUT
NOR
ESP
GNB
NRU
MDG
LCAPRT
GHA
ATG
UGA
FJI
KEN
SLE
ITA
BTN
LAO
CHE
HND
TTO
NZL
CMR
JAM
RWACUB
BGRKHM
IRL
VEN
BRA
BEL
MLT
SLBGRC
NPL
STP
GTM
USALUX
KORPAN
GRD
NIC
FRA
ISR
CAF
ROU
SWEBRBAUT
CPV
ZMB
CRI
SLV
LBR
TUV
CHN
CAN
LSO
BLZ
COG
MUS
KIR
ARG
HTI
GNQ
DNK
KNA
BHS
AUS
SWZ
ETH
URY
PNG
MEX
AGO
FIN
GAB
BEN
INDBWA
GBR
BDI
TON
MOZ
THA
ISL
ZAR
MAR
MRT
QAT
ALB
IRN
LBNPAK
IRQ
TUR
DJI
SEN
IDN
KWT
COM
OMN
SDNTUN
GIN
DZA
SOM
JOR
BGD
LBY
BHRMDV
BFA
ARE
EGY
MYS
SYR
GMB
AFGTCD
SAUMLI
BRN
NER
12
34
56
7F
reed
om H
ouse
Sco
re 1
980s
0 20 40 60 80 100Percent Muslim
1980s
BOL
PHL
MKD
LCA
NAM
LIE
LVA
SUR
ISR
KIRFIN
JPN
BDI
SVK
AUS
TLS
CMR
BHS
BGR
CZE
CHE
BWA
BLR
UKR
TTOGBR
SWZ
KOR
ZMB
SGP
NRU
ISL
EST
KHM
FJI
SMRLUXBRB
RWA
RUS
AND
ITA
PRT
JAM
HRV
LAO
ERI
COL
VEN
CPV
PRK
ECUARG
NZLNLD
HND
MMR
LSO
ZWE
MCO
KEN
DMA
MNG
MHL
WSM
PNG
VUT
GNB
ZAF
LTU
DNK
STP
MDA
KNA
GHA
GERGRD
NOR
BTN
USA
MWI
UGA
LBR
URY
IRLSWE
GAB
CUB
DOM
SLEHTI
PRY
GTM
HUN
BRA
ESP
MDGROU THA
VCT
CHN
PER
TON
NPL
CHL
SYC
GEO
FSM
IND
GUY
BLZ
MUS
NIC
CANTUV
TWN
BEL
ETH
VNM
AUT
PAN
GRC
FRA
ZAR
CAF
ATG
MEX
TGO NGA
LKA
CRI
TZA
GNQ
BEN
PLW
AGO
ARM
COG
POL
CIV
CYP
SLB
SLV
MOZ
MLT
SVN
BFA
AREYEM
MAR
QAT
OMN
SEN
KWT
DJIIDN
ALB
MDVTCD EGY
TUR
TKMUZB
KGZ
SAU
BHR
AFG
KAZBIH
IRN
GINDZA
AZE
BRN
SYR
TJK
LBY
MYS
SOM
NER
JOR
LBN
IRQ
BGD
COMPAK
TUN
MLI
GMB
SDN12
34
56
7F
reed
om H
ouse
Sco
re 1
990s
0 20 40 60 80 100Percent Muslim
1990s
Figure 5: Historical Relationship Between Islam and Democracy
46

PNG
RWA
KNA
IND
IRL
LSOCIV
AUS
LCA
KIR
BRB
NGA
MNE
CZE TTO
SWZVCT
BDI
LUX
POL
MKD
MWI
KHM
UGA
LAO
PHL
TGO
VNMMNG
LVA
CHL
FIN
MMR
EST
NPL
SMR
BEN
CUB
NIC
PAN
NRU
MCO
GEO
ZAR
BEL
ZAF
ATGPRT
CYP
SVKPLW
ERI
MDA
GBR
TUV
MHL SRB
MOZ
MLT
MDG
SVN
NAMJAM
FJI
SWE
GAB SUR
GER
DMA
SGP
GRC
CAF
TONDOM
LIE
FRA
COG
BLR
TZA
FSM
UKR
HND
VUT
CRI
PRY
GNB
USA
TWNJPNITA
ARM
MEX
NLD
TLS
ZWE
BLZ
CHN
NZLMUS
LTU
KOR
SYC
BHS
HUN
DNK
HRV
ZMB
CMR
ISL
GRD
BOL
SLE
PERWSM
URY
CPVGTM
ISR
AND
HTI
CAN
COLLKA
RUS
ETH
ARG
BRA
SLB
SLV
ROU
AGO
GNQ
BTN
PRK
CHEESP
BGR
GUY
GHAKEN
THA
STP
NORAUT
BWA
LBR
ECU
VEN
BFA
NER
MLI
MAR
LBN
SOM
UZBBGD
JOR
TJK
YEMGMB
ALB
ARE
PAKKGZ
EGYTUR
LBY
SDN COM
GIN
QAT
IDN
BHR
SYR
KWT
AZE
OMN
MRT
BRN
MYS
IRNTUN
IRQDZA
SAU
MDV
SEN
AFG
TCD
KAZ
DJI
TKM
BIH
68
1012
log
GD
P p
er c
apita
(20
05 P
PP
)
0 20 40 60 80 100Percent Muslim
Note: The vertical axis depicts log of the average GDP per capita for 2002-2007. Per-centage of population that is Muslim in each country, averaged over 2000, 2005 and 2010.Sources: Penn World Tables 6.3; World Religion Database (2010).
Figure 6: Islam and Economic Development, 2000s
47

JPN
DNK
GUY
FRA
HND
IRL
CHN
NZL
FIN
HTI
LUX
VEN
SLV
SLE
CPV
MUS
COL
NOR
CHL
AUT
CYP
ZAF
GBR
DOM
KOR
MWI
KEN
NIC
GNB
PHL
CAF
USA
ITA
GHA CIV
MDG
ISR
URY
MOZ
FJI
CHE
CMR
TWN
THA
TZA
ESP
TGO
PER
GNQ
SYCZMBECUPAN
NLD
BDI
GAB
LSO
ZWE
BEN
COG
TTO
AUS
ROU
IND
PRT
CAN
NGA
SGP
PRY
ISLBEL
ZAR
NAM
BWA ETH
BRA
BOL
SWE
LKA
ARG
NPL
CRI
RWA
UGA
JAM
BRB
GTM
GRC
MEX
IDN
DZA
TCD
TURMAR
TUN
MYS
BFA
GIN
MRT
BGD
JOR
GMB
IRN
SYR
EGY
NERCOM
PAK
MLI
SEN
56
78
9lo
g G
DP
per
cap
ita (
2005
PP
P)
0 20 40 60 80 100Percent Muslim
1960s
COGSLB
BTN
PHL
ITA
VNM
GNQ
WSM
SWE
COL
KNA
ESP
GRD
NOR
IND
VCT
DOM
CMR
PER
PRY
ETH
ZAF
CHN
PLW
KEN
CIV
MEXLCAATG
MUS
LBR
USA
JAM
AUS
LSO
CHL
GTMECU
FSM
ARGNZL
VEN
SLV
MDG
KIR
MNG
ROU
MWI
GRCFIN
MLT
BRB
NICVUT
PRT
IRL
NAM
LKA
BLZ
UGA
TON
TWN
BHSFRAJPN
BDI
DMA
AGO
SGP
KOR
CHE
SWZ
DNK
CPV
CAN
CRI
CAFPNG
ZMBBWA
RWANPL
HUN
BOLTHA
TTO
TGO
CUB
BEL
ISR
ZAR
ZWE
TZA
HTI GHA
SLE
NGA
LAO
BGR
KHMMOZ
SYC
SUR
STP
BEN
HND
POL
ISL
GUY
GBR
URY
GNB
GAB
AUT
LUX
NLD
CYP
FJI
MHLBRA
PAN
IRQ
SOM
SENSYR
AFG
LBN
GMB
JOR
BFA
DZA
TCD
ARE
EGY
TUR
SDN
TUN
MLI
KWT
OMN
MRT
IDN
COM
ALB
MAR
DJI IRN
BHR
MYS
BRN
NER
BGDPAK
LBY
SAU
GIN
QAT
MDV
56
78
910
log
GD
P p
er c
apita
(20
05 P
PP
)
0 20 40 60 80 100Percent Muslim
1970s
LAOLSO
MUS
DNKSWE
STP
ZAF
MNG
ROU
ECU
HTI
BRB
KIR
NGA
CHE
NLD
COL
TWN
MDG
CYP
NIC
SUR
COG
USA
MOZ
CIV
URY
AUS
TGO
SGPIRL
WSM
ISR
LCA
HND
GTMVUT
CAN
POL
LKA
SWZ
PNG
ZMB
CAF
SLB
BOL
TZA
CHN
BTN MWI
BLZ
CUBVEN
LBR
VCT
BEL
VNM
THADMA
FIN
KEN
LUX
GNB
FRA
UGA
JPNITA
ISL
CRI
PAN
BEN
PHL
GUY
DOM
ZWE CMR
SYC
NPL
CHL
BHS
MLT
ZAR
RWA
FJISLV
GRC
KHM
TON
ARG
BDI
GAB
ETH
GHA
NZL
NAM
CPVSLE
ATGBRAMEX
KNA
NOR
IND
BWA
BGR
ESP
AUTGBR
KOR
GNQ
AGO
JAMGRD
PER
HUN TTO
PRY
PRT
NERSDN
ARE
GMB
QAT
JOR
BHR
MLI
BRN
EGY
MRT
IRN
SEN
MYS
SOM
COM
BFA
TUR
LBY
IDN
LBN
SAUOMN
BGDTCD
DJI
IRQ
MDV
KWT
AFG
TUNDZA
GIN
SYR
ALB
PAK
MAR
67
89
10lo
g G
DP
per
cap
ita (
2005
PP
P)
0 20 40 60 80 100Percent Muslim
1980s
LSO
GEO
FRA
GNBNGA
CHN
ERITZA
JAM
UKR
BEL
BRA
GRC
JPN
LTU
MOZLAO
ISR
LVA
ZAR
CUBPOL
LUX
ROU
SVN
EST
MDA
TTO
FINTWNNZL
GNQ
STPGTM
CAF
CHESWE
SVK
IRL
ARG
KENKIR
AUT
SLB
LBR
MUS
SUR
AUS
KOR
GRD
SGP
BLR
ATG
ZAF
GBR
PANSWZPRY
ESP
NPLKHM
PRT
MDG
NLD
GUY
THA
ZMB
KNA
IND
USA
LCA
CIVAGO
CAN
BGRPER
UGA
BRB
SLE
ETH
HUN
NAM
FSM
BDI
VUT
CPV
NOR
BEN
URY
COG
MWI
HND
BWA
RUS
PNGCMR
CRIHRV
HTI
GAB
NIC
MKD
CHLMEX
PLWMLT
DNK
FJI
TGO
ECU
BTN
BHS
MNG
BLZ
ITAGER
DMA
SYC
LKA
GHA
PHL
MHL
RWA
ISL
WSMTONDOM
VCT
COL
ARMZWE
CYP
BOL
SLV
VEN
CZE
VNM
PAK
DZA
MLI
KWT
SEN
LBN
DJI
QAT
SAU
AZE
GMB
BIH
SYR
SOM
IRQ
AFG
TCD
EGY
UZB
MAR
OMN
IRN
COM
JOR
SDN
KGZ
MYS
NER
TJK
MDV
ARE
TUN
BHR
YEM
TUR
ALB
BFA
KAZ
BRN
TKM
BGD
IDN
LBY
GIN
56
78
910
11lo
g G
DP
per
cap
ita (
2005
PP
P)
0 20 40 60 80 100Percent Muslim
1990s
Figure 7: Historical Relationship Between Islam and EconomicDevelopment
48

020
4060
8010
0F
uel E
xpor
ts a
s P
ct o
f GD
P
0 1Majority Muslim (=1)
Figure 8: The vertical axis depicts fuel exports as a percentofGDP (2008 dollars). Muslim majority is a simple majority, wherethe population data is drawn from the World Religion Database.Sources: World Bank Development Indicators (2010); World Re-ligion Database (2010).
020
4060
8010
0P
erce
nt M
uslim
0 1Current or Former OPEC Member (=1)
Figure 9: Vertical axis depicts percentage of population that is Mus-lim in each country, using average of 2000, 2005 and 2010 figures.Horizontal axis represents OPEC and non-OPEC members. Source:World Religion Database (2010).
49

References
Abootalebi, Ali R. 1999. “Islam, Islamists, and Democracy.”Middle East Review of InternationalAffairs 3(1).
Acemoglu, Daron and James A. Robinson. 2006.Economic Origins of Dictatorship and Democ-racy. New York: Cambridge University Press.
Acemoglu, Daron, Simon Johnson and James A. Robinson. 2001. “The Colonial Origins of Com-parative Development: An Empirical Investigation.”American Economic Review91(5): 1369–1401.
Acemoglu, Daron, Simon Johnson and James A. Robinson. 2002. “Reversal of Fortune: Ge-ography and Institutions in the Making of the Modern World Income Distribution.”QuarterlyJournal of Economics118: 1231–1294.
Acemoglu, Daron, Simon Johnson and James A. Robinson. 2005. “The Rise of Europe: AtlanticTrade, Institutional Change and Growth.”American Economic Review95: 546–579.
Acemoglu, Daron, Simon Johnson, James A. Robinson and PierreYared. 2008. “Income andDemocracy.”American Economic Review98(3).
Acemoglu, Daron, Tarek A. Hassan and James A. Robinson. forthcoming. “Social Structure andDevelopment: A Legacy of the Holocaust in Russia.”Quarterly Journal of Economics.
Aghion, Philippe, Alberto Alesina and Francesco Trebbi. 2004. “Endogenous Political Institu-tions.” Quarterly Journal of Economics119(2): 565–611.
al Braizat, Fares. 2002. “Muslims and Democracy: An Empirical Critique of Fukuyamas Cultur-alist Approach.”International Journal of Comparative Sociology43(3-5): 269–299.
Alesina, Alberto, Arnaud Devleeschauwer, William Easterly, Sergio Kurlat and Romain Wacziarg.2003. “Fractionalization.”Journal of Economic Growth8(June): 155–194.
Almond, Gabriel and Sidney Verba. 1963.The Civic Culture: Political Attitudes and Democracyin Five Nations. Princeton, NJ: Princeton University Press.
An-Na’im, Abdullahi Ahmed. 1990.Toward an Islamic Reformation: Civil Liberties, HumanRights, and International Law. Syracuse, NY: Syracuse University Press.
Anderson, John. 2007.Religion, Democracy and Democratization. London: Routledge.Anderson, Theodore and Cheng Hsiao. 1982. “Forumulation andEstimation of Dynamic Models
Using Panel Data.”Journal of Econometrics18: 47–82.Arellano, Manuel and Stephen Bond. 1991. “Some Tests of Specifications for Panel Data: Monte
Carlo Evidence and an Application to Employment Equations.”Review of Economic Studies58: 277–297.
Banfield, Edward C. 1958.The Moral Basis of a Backward Society. New York: Free Press.Barrett, David B. 1982.World Christian Encyclopedia: A Comparative Survey of Churches and
Religions in the Modern World. New York: Oxford University Press.Barrett, David B., George T. Kurian and Todd M. Johnson. 2001.World Christian Encyclopedia:
A Comparative Survey of Churches and Religions in the Modern World, AD 1900-2000. NewYork: Oxford University Press.
Barro, Robert J. 1999. “Determinants of Democracy.”Journal of Political Economy107(6): 158–183.
Barro, Robert and Rachel M. McCleary. 2003. “Religion and Economic Growth.” NBER WorkingPaper 9682.
Bazzi, Samuel and Michael A. Clemens. 2013. “Blunt Instruments: Avoiding Common Pitfalls in
50

Identifying the Causes of Economic Growth.”American Economic Journal: Macroeconomics5(2): 152–86.
Bellin, Eva. 2004. “The Robustness of Authoritarianism in theMiddle East: Exceptionalism inComparative Perspective.”Comparative Politics36(2): 139–157.
Bollen, Kenneth A. 1979. “Political Democracy and the Timingof Development.”American Soci-ological Review44(4): 572–587.
Boone, Catherine. 2003.Political Topographies of the African State: Territorial Authority andInstitutional Choice. New York: Cambridge University Press.
Bulliet, Richard W. 1979.Conversion to Islam in the Medieval Period: An Essay in QuantitativeHistory. Cambridge, MA: Harvard University Press.
Bun, M.J.G. and F. Windmeijer. 2010. “The Weak Instruments Problem of the System GMMEstimator in Dynamic Panel Data Models.”Econometrics Journal13: 95–126.
Cahen, Claude. 1970. “Economy, Society and Institutions.” InCambridge History of Islam: Is-lamic Society and Civilization, ed. P. M. Holt, Ann K. S. Lambton and Bernard Lewis. Vol. 3London: Cambridge University Press pp. 511–538.
Chateaubriand, Francois-Rene de. 1969.Oeuvres romanesques et voyages. Paris: Gallimard.Cochran, Thomas C. 1960. “Cultural Factors in Economic Growth.” The Journal of Economic
History20(4): 515–530.Dahl, Robert. 1971.Polyarchy: Participation and Opposition. New Haven: Yale University Press.Deutsch, Karl. 1953.Nationalism and Social Communication. Cambridge, MA: MIT Press.Deutsch, Karl. 1961. “Social Mobilization and Political Development.”American Political Science
Review55: 634–647.Donner, Fred McGraw. 1981.The Early Islamic Conquests. Princeton, NJ: Princeton University
Press.Donno, Daniela and Bruce Russett. 2004. “Islam, Authoritarianism and Empowerment: What Are
the Linkages?”World Politics56(4): 582–607.Dube, Arindrajit, T. William Lester and Barry Eidlin. 2007. “Firm Entry and Wages: Impact
of Wal-Mart Growth on Earnings Throughout the Retail Sector.”Working Paper, University ofCalifornia, Berkeley.
Dunning, Thad. 2008. “Improving Causal Inference: Strengths and Limitations of Natural Exper-iments.”Political Research Quarterly61(2): 282.
Ehteshami, Anoushiravan. 2004. “Islam, Muslim Polities and Democracy.”Democratization11(4): 90–110.
Enayat, Hamid. 1982.Modern Islamic Political Thought. Austin, TX: University of Texas Press.Englebert, Pierre. 2000. “Pre-Colonial Institutions, Post-Colonial States, and Economic Develop-
ment in Tropical Africa.”Political Research Quarterly53(1): 7–36.Esposito, John L. and John O. Voll. 1996.Islam and Democracy. New York: Oxford University
Press.Fakhry, Majid. 1954. “The Theocratic Idea of the Islamic State in Recent Controversies.”Interna-
tional Affairs (Royal Institute of International Affairs)30(4): 450–462.Fearon, James D. and David D. Laitin. 2003. “Ethnicity, Insurgency and Civil War.”American
Political Science Review97(1): 75–90.Fish, M. Steven. 2002. “Islam and Authoritarianism.”World Politics55(1): 4–37.Fish, M. Steven. N.d.Are Muslims Distinctive?New York: Oxford University Press.Fish, M. Steven and Matthew Kroenig. 2006. “Diversity, Conflict and Democracy.”Democratiza-
51

tion 13(5): 828–842.Fish, M. Steven and Robin Brooks. 2004. “Does Diversity Hurt Democracy?”Journal of Democ-
racy15(1): 154–166.Freedom House. 2010.Freedom in the World 2010. Washington, DC: Freedom House, Inc. Com-
puter file, available athttp://freedomhouse.org, accessed July 2010.Fukuyama, Francis. 1989. “The End of History?”National Interest.Fukuyama, Francis. 1992.The End of History and the Last Man. Free Press.Fukuyama, Francis. 1995.Trust: The Social Virtues and and the Creation of Prosperity. New
York: Free Press.Gallup, John Luke, Jeffrey D. Sachs and Andrew Mellinger. 1999. “Geography and Economic
Development.” InWorld Bank Annual Conference on Development Economics 1998, ed. BorisPleskovic and Joseph E. Stiglitz. Washington, DC: The World Bank pp. 127–178.
Gennaioli, Nicola and Ilia Rainier. 2006. “Precolonial Centralization and Institutional Qualityin Africa.” In Institutions and Norms in Economic Development, ed. Mark Gradstein and KaiKonrad. Cambridge, MA: MIT Press.
Gennaioli, Nicola and Ilia Rainier. 2007. “The Modern Impactof Precolonial Centralization inAfrica.” Journal of Economic Growth12(3): 185–234.
Ghosn, Faten, Glenn Palmer and Stuart Bremer. 2004. “The MID3Data Set, 1993–2001: Proce-dures, Coding Rules, and Description.”Conflict Management and Peace Science21: 133–154.Dataset available athttp://www.correlatesofwar.org/, accessed August 2010.
Gill, Anthony. 1998.Rendering Unto Caesar: The Catholic Church and the State in Latin America.Chicago: University of Chicago Press.
Gleditsch, Kristian Skrede. 2002.All International Politics Is Local: The Diffusion of Conflict,Integration, and Democratization. Ann Arbor: University of Michigan Press.
Gleditsch, Kristian Skrede and Michael D. Ward. 2007. “Diffusion and the Spread of DemocraticInstitutions.” In The Global Diffusion of Markets and Democracy, ed. Beth Simmons, FrankDobbins and Geoffrey Garrett. New York: Cambridge University Press pp. 261–302.
Greif, Avner. 1994. “Cultural Beliefs and the Organization ofSociety: A Historical and TheoreticalReflection on Collectivist and Individual Societies.”Journal of Political Economy102: 912–950.
Haber, Stephen and Victor Menaldo. 2008. “Do Natural Resources Fuel Authoritarianism?” Work-ing Paper, Stanford University Department of Political Science.
Hashemi, Nader. 2009.Islam, Secularism and Liberal Democracy. New York: Oxford UniversityPress.
Herbst, Jeffrey. 2000.States and Power in Africa: Comparative Lessons in Authority and Control.Princeton, NJ: Princeton UP.
Heston, Alan, Robert Summers and Bettina Aten. 2009.Penn World Table Version 6.3. Philadel-phia, PA: Center for International Comparisons of Production, Income and Prices, University ofPennsylvania. Dataset available at urlhttp://pwt.econ.upenn.edu/; accessed July 2010.
Hoffman, Steven Ryan. 2004. “Islam and Democracy: Micro-Level Indications of Compatibility.”Comparative Political Studies37(6): 652–676.
Holt, Peter M., Ann K. S. Lambton and Bernard Lewis. 1970.The Cambridge History of Islam:The central Islamic lands from pre-Islamic times to the First World War. Vol. 1 London: Cam-bridge University Press.
Horowitz, Donald. 1994. “Democracy in Divided Societies: the Challenge of Ethnic Conflict.”Journal of Democracy4(4): 18–38.
52

Hsu, Becky, Amy Reynolds, James Gibbon and Conrad Hackett. 2008. “Estimating the ReligiousComposition of All Nations: An Empirical Assessment of the World Christian Database.”Jour-nal for the Scientific Study of Religion47(4): 678–693.
Huntington, Samuel P. 1968.Political Order in Changing Societies. New Haven, CT: Yale Uni-versity Press.
Huntington, Samuel P. 1991.The Third Wave: Democratization in the Late Twentieth Century.University of Oklahoma Press.
Huntington, Samuel P. 1993. “The Clash of Civilizations?”Foreign Affairs.Huntington, Samuel P. 1996.The Clash of Civilizations and the Remaking of World Order. Simon
& Schuster.Inglehart, Ronald. 1997.Modernization and Postmodernization. Princeton, NJ: Princeton Univer-
sity Press.Inglehart, Ronald. 2000. “Culture and Democracy.” InCulture Matters: How Values Shape Human
Progress, ed. Lawrence E. Harrison and Samuel P. Huntington. New York: Basic Books pp. 80–97.
Issawi, Charles. 1956. “Economic and Social Foundations of Democracy in the Middle East.”International Affairs (Royal Institute of International Affairs 1944-)32(1): 27–42.
Jamal, Amaney A. and Mark A. Tessler. 2008. “The Democracy Barometers: Attitudes in the ArabWorld.” Journal of Democracy19(1): 97–110.
Johnson, Todd M. and Brian J. Grim. 2010.World Religion Database. Leiden: Brill AcademicPublishing. Computer file, available athttp://www.worldreligiondatabase.org, accessedDecember 2009 and July 2010.
Jones, R. 1979. “Ten Conversion Myths From Indonesia.” InConversion to Islam, ed. NehemiaLevtzion. New York: Holmes and Meier Publishers pp. 129–158.
Karatnycky, Adrian. 2002. “Muslim Countries and the Democracy Gap.”Journal of Democracy13(1): 99–112.
Kedourie, Elie. 1992.Democracy and Arab Political Culture. Washington Institute for Near EastPolicy.
Kettani, Houssain. 2010. “World Muslim Population: 1950-2020.” International Journal of Envi-ronmental Science and Development1(2).
La Porta, Rafael, Florencio Lopez-de Silanes, Andrei Shleifer and Robert W. Vishny. 1999. “TheQuality of Government.”Journal of Law, Economics, and Organization15(1): 222–279.
Lakoff, Sanford. 2004. “The Reality of Muslim Exceptionalism.” Journal of Democracy15(4): 133–139.
Landes, David. 1998.The Wealth and Poverty of Nations. New York: W.W. Norton & Co.Landes, David. 2000. “Culture Makes All the Difference.” InCulture Matters: How Values Shape
Human Progress, ed. Lawrence E. Harrison and Samuel P. Huntington. New York: Basic Bookspp. 2–13.
Lange, Fabian, Alan L. Olmstead and Paul W. Rhode. 2009. “The Impact of the Boll-Weevil,1892-1940.”Journal of Economic History69(3): 685–718.
Lapidus, Ira. 2002.A History of Islamic Societies. New York: Cambridge University Press.Lerner, Daniel. 1958.The Passing of Traditional Society: Modernizing the MiddleEast. New
York: The Free Press.Levtzion, Nehemia, ed. 1979.Conversion to Islam. New York: Holmes & Meier.Lewis, Bernard. 1954. “Communism and Islam.”International Affairs (Royal Institute of Interna-
53

tional Affairs 1944-)30(1): 1–12.Lewis, Bernard. 1996. “Islam and Liberal Democracy: A Historical Overview.”Journal of Democ-
racy7: 52–63.Linz, Juan and Alfred Stepan. 1996.Problems of Democratic Transition and Consolidation: South-
ern Europe, South America and Post-Communist Europe. Baltimore, MD: Johns Hopkins Uni-versity Press.
Lipset, Seymour Martin. 1959. “Some Social Requisites of Democracy.”American Political Sci-ence Review53(1): 69–105.
Lipset, Seymour Martin. 1960.Political Man: The Social Bases of Politics. Garden City, NY:Doubleday and Sons.
Lipset, Seymour Martin. 1963. “The Value Patterns of Democracy: A Case Study in ComparativeAnalysis.”American Sociological Review28(4): 515–531.
Lipset, Seymour Martin. 1967. “Values, Education and Entrepreneurship.” InElites in Latin Amer-ica, ed. S.M. Lipset and Aldo Solari. New York: Oxford University Press pp. 3–60.
Lipset, Seymour Martin. 1970.Revolution and Counter-Revolution: Change and Persistence inSocial Structures. New Brunswick, NJ: Transaction Press.
Marshall, Monty G. and Keith Jaggers. 2009.Polity IV Project: Political Regime Charac-teristics and Transitions, 1800-2009. College Park, MD: Center for International Develop-ment and Conflict Management, University of Maryland. Computer file, available athttp://www.cidcm.umd.edu/inscr/polity, accessed July 2010.
Mawdudı, Abu-l-Al a’. 1976. “Political Theory of Islam.” InIslam: Its Meaning and Message, ed.Khurshid Ahmad. London: Islamic Foundation.
McClelland, David C. 1961.The Achieving Society. New York: The Free Press.Meyer, Katherine, Daniel Tope and Anne M. Price. 2008. “Religion and Support for Democracy:
A Cross-National Examination.”Sociological Spectrum26(5): 625–653.Midlarsky, Manus I. 1998. “Democracy and Islam: Implications for Civilizational Conflict and the
Democratic Peace.”International Studies Quarterly42(3): 485–511.Mobarak, Ahmed Mushfiq. 2005. “Democracy, Volatility, and Economic Development.”Review
of Economics and Statistics87(2): 348–361.Moore, Jr., Barrington. 1966.Social Origins of Dictatorship and Democracy: Lord and Peasant
in the Making of the Modern World. Boston: Beacon Press.Murphy, Kevin J., Robert W. Vishny and Andrei Shleifer. 1989.“Income Distribution, Market Size
and Industrialization.”Quarterly Journal of Economics104: 537–564.Najjar, Fauzi M. 1958. “Islam and Modern Democracy.”The Review of Politics20(2): 164–180.Najjar, Fauzi M. 1980. “Democracy in Islamic Political Philosophy.”Studia Islamicapp. 107–122.Neumark, David, Junfu Zhang and Stephen Ciccarella. 2008. “The Effects of Wal-Mart on Local
Labor Markets.”Journal of Urban Economics63: 405–430.Norris, Pippa. 2008.Driving Democracy: Do Power-Sharing Institutions Work?New York:
Cambridge University Press.Norris, Pippa and Ron Inglehart. 2004.Sacred and Secular: Religion and Politics Worldwide. New
York: Cambridge University Press.North, Douglass. 1990.Institutions, Institutional Change and Economic Performance. New York:
Cambridge University Press.Nunn, Nathan and Diego Puga. 2009. “Ruggedness: The Blessing of Bad Geography in Africa.”
NBER Working Paper 14918.
54
Oster, Emily. 2009. “HIV and Sexual Behavior Change: Why not Africa?” Working Paper, Uni-versity of Chicago.
Pevehouse, Jon. 2004.Democracy from Above? Regional Organizations and Democratization.New York: Cambridge University Press.
Philpott, Daniel. 2005. “The Catholic Wave.” InWorld Religions and Democracy, ed. Larry Di-amond, Marc F. Plattner and Philip J. Costopolous. Baltimore:The Johns Hopkins UniversityPress pp. 102–116.
Pipes, Daniel. 1983.In the Path of God: Islam and Political Power. New York: Basic Books.Powell, G. Bingham. 1982.Contemporary Democracies: Participation, Stability and Violence.
New York: Cambridge University Press.Pridham, Geoffrey. 2000.Dynamics of Democratization: A Comparative Approach. London:
Continuum.Pryor, Frederic L. 2007. “Are Muslim Countries Less Democratic?” Middle East Quarterly
14(4): 53–58.Putnam, Robert D. 1993.Making Democracy Work: Civic Traditions in Modern Italy. Princeton,
NJ: Princeton University Press.Pye, Lucian. 1962.Politics, Personality and Nation-Building. New Haven: Yale University Press.Pye, Lucian. 2000. “Asian Values: From Dynamoes to Dominoes?” In Culture Matters: How
Values Shape Human Progress, ed. Lawrence E. Harrison and Samuel P. Huntington. NewYork: Basic Books pp. 244–255.
Raciborski, Rafal. 2008. “kountry: A Stata utility for merging cross-country data from multiplesources.”Stata Journal8: 390–400.
Reid, Anthony. 1988.Southeast Asia in the Age of Commerce 1450-1680. New Haven: YaleUniversity Press.
Ricklefs, Merle. 2008.A History of Modern Indonesia since c. 1200. 4th ed. Palo Alto: StanfordUniversity Press.
Rose, Richard. 2002. “How Muslims View Democracy: Evidence from Central Asia.”Journal ofDemocracy13(4).
Ross, Michael. 2001. “Does Oil Hinder Democracy?”World Politics53: 325–361.Ross, Michael. 2009. “Oil and Democracy Revisited.” Working Paper, UCLA Department of
Political Science.Rowley, Charles K. and Nathanael Smith. 2009. “Islam’s Democracy Paradox: Muslims Claim to
Like Democracy, So Why Do They Have So Little?”Public Choice139: 273–299.Said, Edward. 1978.Orientalism. New York: Vintage Books.Sarafidis, Vasilis and Donald Robertson. 2009. “On the impactof error cross-sectional dependence
in short dynamic panel estimation.”Econometrics Journal12(1): 62–81.Schlumberger, Oliver, ed. 2009.Debating Arab Authoritarianism: Dynamics and Durability in
Nondemocratic Regimes. Palo Alto: Stanford University Press.Smith, David H. and Alex Inkeles. 1966. “The OM scale: a comparative socio-psychological
measure of individual modernity.”Sociometry29: 353–377.Sovey, Allison J. and Donald P. Green. 2009. “Instrumental Variables Estimation in Political
Science: A Readers’ Guide.” Working Paper, Yale University.Stepan, Alfred. 2000. “Religion, Democracy, and the “Twin Tolerations”.”Journal of Democracy
11(4): 37–57.Stepan, Alfred and Graeme B. Robertson. 2003. “An “Arab” More Than “Muslim” Electoral Gap.”
55
Journal of Democracy14(3): 30–44.Stijns, Jean-Philippe C. 2005. “Natural Resource Abundance and Economic Growth Revisited.”
Resource Policy30: 107–130.Stinnett, Douglas M., Jaroslav Tir, Philip Schafer, Paul F.Diehl and Charles Gochman. 2002. “The
Correlates of War Project Direct Contiguity Data, Version 3.”Conflict Management and PeaceScience19(2): 58–66. Dataset available athttp://www.correlatesofwar.org/, accessedAugust 2010.
Syed, J.W. 1954.Islam and Secular Democracy. Karachi: Saad Publications.Tabellini, Guido. 2010. “Culture and Institutions: Economic Development in the Regions of Eu-
rope.”Journal of the European Economic Association8(4): 677–716.Tessler, Mark. 2002. “Islam and Democracy in the Middle East: The Impact of Religious Orienta-
tions on Attitudes toward Democracy in Four Arab Countries.”Comparative Politics34(3): 337–354.
Tessler, Mark. 2003. “Do Islamic Orientations Influence Attitudes toward Democracy in the ArabWorld?” International Journal of Comparative Sociology43(5): 229–249.
Tessler, Mark and Eleanor Gao. 2005. “Gauging Arab Support for Democracy.”Journal of Democ-racy16(3): 83–97.
Tocqueville, Alexis de. 1966 [1832].Democracy in America. New York: Harper and Row.Trimingham, J. Spencer. 1964.Islam in East Africa. Oxford: Clarendon Press.Voll, John. 1998. “Islam.” InEncyclopedia of Politics and Religion, ed. Robert Wuthnow. Wash-
ington, DC: Congressional Quarterly, Inc. pp. 383–393.von Grunebaum, Gustave E. 1966/2008. “The First Expansion of Islam: Factors of Thrust and
Containment.” InThe Expansion of the Early Islamic State, ed. Fred M. Donner. Burlington,VT: Ashgate Varorium pp. 81–90.
Vryonis, Speros. 1971.The Decline of Medeival Hellenism in Asia Minor and the Process ofIslamization from the 11th through the 15th Century. Berkeley: University of California Press.
Watt, Montgomery W. 1970. “Muhammad.” InCambridge History of Islam: The central Islamiclands from pre-Islamic times to the First World War, ed. P. M. Holt, Ann K. S. Lambton andBernard Lewis. London: Cambridge University Press pp. 30–56.
Weber, Max. 1935 [1905].The Protestant Ethic and the Spirit of Capitalism. New York: Scribners.Woodberry, Robert D. and Timothy S. Shah. 2005. “The Pioneering Protestants.” InWorld Reli-
gions and Democracy, ed. Larry Diamond, Marc F. Plattner and Philip J. Costopolous. Balti-more: The Johns Hopkins University Press pp. 117–131.
World Bank. 2010. World Bank Development Indicators. Washington, DC: The World Bank.Dataset available athttp://data.worldbank.org/indicator, accessed July 2010.
56