does engagement partner perceived expertise matter ... · 2 does engagement partner perceived...
TRANSCRIPT

1
Does Engagement Partner Perceived Expertise Matter?
Evidence from the U.S. Operations of the Big 4 Audit Firms
Daniel Aobdia
Kellogg School of Management, Northwestern University
Saad Siddiqui
Public Company Accounting Oversight Board (PCAOB), Center for Economic Analysis
Andres Vinelli
Public Company Accounting Oversight Board (PCAOB), Center for Economic Analysis
This version: November 2016
This research paper was prepared while Daniel Aobdia was a Senior Economic Research Fellow in the Center for
Economic Analysis at the PCAOB. The PCAOB, as a matter of policy disclaims responsibility for any private
publication or statement by any of its Economic Research Fellows and employees. The views expressed in this paper
are the views of the authors and do not necessarily reflect the views of the Board, individual Board members, or
staff of the PCAOB. We thank Preeti Choudhary, Michael Gurbutt, Chris Hogan, Robert Knechel, Patricia Ledesma,
Robert Magee, Miguel Minutti-Meza, Luigi Zingales, PCAOB staff and the seminar participants at Michigan State,
the PCAOB, and the University of Louisville for helpful discussions on earlier versions of this work. Daniel Aobdia
acknowledges financial support from the Kellogg School of Management and in particular the Lawrence Revsine
Fellowship.

2
Does Engagement Partner Perceived Expertise Matter?
Evidence from the U.S. Operations of the Big 4 Audit Firms
Abstract
This study investigates whether perceived engagement partner industry specialization matters in
the U.S. setting, where the name of the engagement partner is currently not disclosed to the
capital market participants. Using a unique engagement partner dataset for the U.S. operations of
the Big 4 firms, we find that engagements led by industry specialist partners command higher
fees and a higher rate per hour. However, the economic significance of these results does not
appear to be as large as in settings where the name of the engagement partner is disclosed.
Furthermore, we do not find any association between engagement partner industry specialization
and several proxies for audit quality, even though we find a positive association with audit hours.
These results suggest that, at least in the U.S. setting, there is a dichotomy between the client
perceived value and the actual value provided by an industry specialist engagement partner,
consistent with audits suffering from credence goods agency issues.
Keywords: Audit Engagement Partner, Audit Quality, Audit Fees, Industry Specialization,
Expert-Client Agency Costs, Disclosure.
JEL Classification: M42, D82, L14, L22.

3
1. Introduction
The purpose of this study is to determine empirically, in the U.S. setting, whether perceived
individual audit partner industry specialization matters in the context of the Big 4 audit firms.
Even though prior studies consider the role of partner industry specialization for audit fees and
quality, the evidence to date applies only to non U.S. settings where the name of the partner is
publicly disclosed (e.g., Chi et al. 2010, Chi and Chin 2011, Zerni 2012, Goodwin and Wu
2014). We contribute to the literature by focusing on the role of the engagement partner in a
setting where her name is not publicly disclosed. We assess whether partner industry
specialization is associated with a fee premium in the form of higher audit fees and fees per hour,
and also with audit hours and higher audit quality.
Prior studies document, for Sweden and Australia, that industry specialist engagement
partners charge higher audit fees to their clients (Zerni 2012, Goodwin and Wu 2014). However,
it remains an empirical question whether audit clients are willing to pay a premium for industry
specialist engagement partners in the U.S. On the one hand, the perception that an industry
specialist engagement partner is of higher quality, combined with credible private disclosure
mechanisms of this specialization, such as the communication to the audit committee of the
partner’s prior engagements, may lead clients to pay a premium for an industry specialist
engagement partner. On the other hand, because of the lack of public disclosure of the name of
the engagement partner, the audit committee may not fully perceive the added value of the
engagement partner, especially if the audit firm tends to rely on standardized processes and large
engagement teams.
Furthermore, it remains an unexplored topic whether industry specialist engagement partners
are able to charge a fee premium through a higher average rate per hour on the engagement,
4
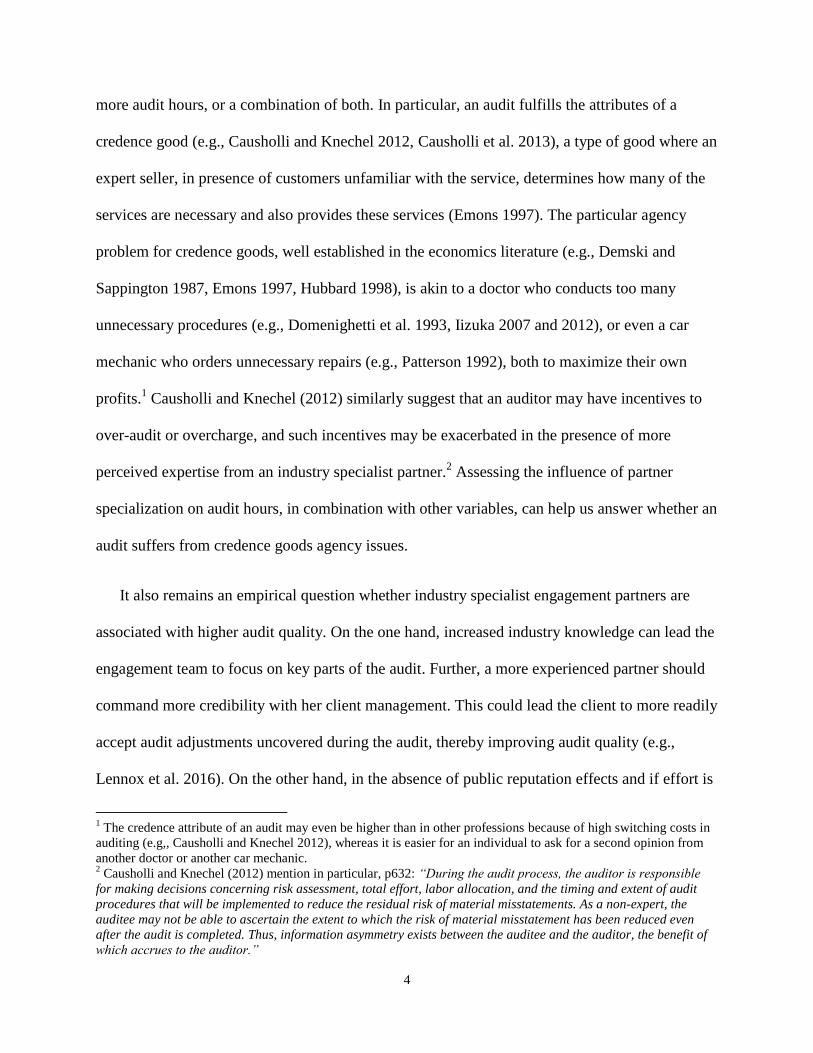
more audit hours, or a combination of both. In particular, an audit fulfills the attributes of a
credence good (e.g., Causholli and Knechel 2012, Causholli et al. 2013), a type of good where an
expert seller, in presence of customers unfamiliar with the service, determines how many of the
services are necessary and also provides these services (Emons 1997). The particular agency
problem for credence goods, well established in the economics literature (e.g., Demski and
Sappington 1987, Emons 1997, Hubbard 1998), is akin to a doctor who conducts too many
unnecessary procedures (e.g., Domenighetti et al. 1993, Iizuka 2007 and 2012), or even a car
mechanic who orders unnecessary repairs (e.g., Patterson 1992), both to maximize their own
profits.1 Causholli and Knechel (2012) similarly suggest that an auditor may have incentives to
over-audit or overcharge, and such incentives may be exacerbated in the presence of more
perceived expertise from an industry specialist partner.2 Assessing the influence of partner
specialization on audit hours, in combination with other variables, can help us answer whether an
audit suffers from credence goods agency issues.
It also remains an empirical question whether industry specialist engagement partners are
associated with higher audit quality. On the one hand, increased industry knowledge can lead the
engagement team to focus on key parts of the audit. Further, a more experienced partner should
command more credibility with her client management. This could lead the client to more readily
accept audit adjustments uncovered during the audit, thereby improving audit quality (e.g.,
Lennox et al. 2016). On the other hand, in the absence of public reputation effects and if effort is
1 The credence attribute of an audit may even be higher than in other professions because of high switching costs in
auditing (e.g,, Causholli and Knechel 2012), whereas it is easier for an individual to ask for a second opinion from
another doctor or another car mechanic. 2 Causholli and Knechel (2012) mention in particular, p632: “During the audit process, the auditor is responsible
for making decisions concerning risk assessment, total effort, labor allocation, and the timing and extent of audit
procedures that will be implemented to reduce the residual risk of material misstatements. As a non-expert, the
auditee may not be able to ascertain the extent to which the risk of material misstatement has been reduced even
after the audit is completed. Thus, information asymmetry exists between the auditee and the auditor, the benefit of
which accrues to the auditor.”

5
costly, industry specialist engagement partners may not spend any extra-effort on their audits to
reach a level of audit quality beyond the bar imposed by auditing standards (e.g., Dye 1993).
Further, Big 4 firms have elaborate quality control systems and audit methodologies that are
likely to reduce the likelihood of substandard audits. Accordingly audit quality may not change
regardless of partner industry specialization.
We use a unique dataset obtained from the Public Company Accounting Oversight Board
(PCAOB) for the U.S. operations of the Big 4 firms to answer our research questions. The
PCAOB is a non-profit organization established by the Sarbanes-Oxley Act of 2002 (SOX) to
oversee the audits of public companies (referred to as issuers or client issuers in the remainder of
this paper) and improve audit quality. The PCAOB, as part of its inspection program, regularly
collects information from audit firms. This information includes, for the U.S. operations of the
Big 4 firms, a list of the audits of issuers and the name of the engagement partner on each
individual audit. The dataset also includes the overall audit hours for each engagement, lead
engagement partner hours and the number of years as partner (seniority). We use this dataset,
available from 2008 till 2013, to build a measure of engagement partner industry expertise that
we base on the partner’s prior-year engagements. We combine this data with Compustat and
Audit Analytics to generate publicly available measures of audit quality, audit fees, and several
control variables. We also combine our dataset with proprietary PCAOB inspection data of
individual engagements that indicate which engagements were inspected and whether audit
deficiencies were identified by the PCAOB (in case a deficiency is identified, the PCAOB issues
a Part I Finding). We follow prior literature and compute publicly available measures of audit
quality, including the propensity of the issuer to restate its financial statements or meet/beat the

6
zero earnings threshold, and accruals (e.g., DeFond and Zhang 2014, Aobdia 2015a).3 We also
use the propensity of the PCAOB to identify Part I Findings as a measure of audit quality (the
data are only available for the subset of inspected engagements).4
In the first set of tests, we find a positive association between partner industry specialization
and audit fees. An increase of one standard deviation of engagement partner industry
specialization is associated with an increase of 11% of the audit fees. This fee increase could be
driven by a higher average rate per hour of the engagement or by more audit hours or both. We
find that the increase is partly driven by a higher rate per hour. An increase of one standard
deviation of partner industry specialization is associated with a rate per hour increase of $8.8,
approximately 4.0% of the mean $221 an hour in the sample. These results suggest that industry
specialist engagement partners are perceived to be of higher quality by the client issuers, who are
willing to pay a premium for the services of the teams they lead. However, we find that the
overall economic significance of our results may not be quite as large as in settings where the
name of the engagement partner is publicly disclosed.
Because the increase in rate per hour is lower than the total audit fee increase, part of the fee
increase must be driven by more audit hours, a proposition we systematically examine in the next
set of tests. We find a positive association between engagement partner industry specialization
and audit hours. This result could be driven by the following explanations: 1) Industry specialist
engagement partners over-audit in the presence of clients who are unable to determine whether
the services provided are necessary or not, a situation typical of credence goods (e.g., Causholli
3 We do not use going concern opinions as a measure of audit quality because Aobdia (2015a) and Bowler (2015)
provide evidence casting doubt on the validity of this specific measure. 4 We caveat that, except perhaps for the Part I Findings, the other measures of audit quality are reasonably noisy
(e.g., DeFond and Zhang 2014, Aobdia 2015a).

7
and Knechel 2012, Causholli et al. 2013). Or 2) the partner aims to increase audit quality,
increased hours are necessary to improve quality and the partner can credibly sell these hours.5
We estimate the association between partner industry specialization and audit quality to
disentangle these two potential explanations. Using the propensity of the issuer to restate its
financial statements or meet/beat the zero earnings threshold, accruals, and the propensity of the
PCAOB to identify a Part I Finding on inspected engagements, we fail to find any relationship
between partner industry specialization and audit quality. This finding suggests that the results
on increased hours are driven by the first explanation, that is industry specialist partners
ineffectively over-audit, with no noticeable influence on audit quality. This result also suggests
that, absent disclosure of their name, engagement partners have little incentives to conduct
higher quality audits, consistent with Aobdia (2015b) who finds evidence that auditors have
limited incentives to conduct audits above the bar imposed by the audit standards in the U.S.6
We also consider an alternative explanation whereby risky and complex clients are more
likely to be audited by an industry specialist engagement partner. Specifically, our results could
be explained by audit firms assigning industry specialist engagement partners to riskier clients.
Industry specialist partners would spend more effort and charge higher fees to reach a similar
level of audit risk as for less risky clients. We use several empirical specifications to determine
whether this alternative explanation is valid. First, we include a battery of variables that control
for client risk and complexity. Second, in all specifications, we include an indicator variable
equal to one when the auditor identifies specific clients to be more risky. Third, following
5 We also test for an association between engagement partner hours and partner industry specialization and find a
positive association. However, the economic significance of this result is much more limited than the one for overall
audit hours. This suggests that the increased audit hours are conducted by more junior personnel and therefore
perhaps of lower quality, potentially consistent with the first explanation of ineffective over-auditing. 6 In particular one would expect industry specialist engagement partners to conduct higher quality audits if provided
with the proper incentives.

8
Lawrence et al. (2011) and Minutti-Meza (2013), we also re-estimate our specifications using a
matched sample based on propensity score matching, to control for the potential sorting of
industry specialist engagement partners to specific engagements, and still find qualitatively
unchanged results. Thus, our results are unlikely to be driven by the alternative explanation
whereby industry specialist engagement partners are staffed to riskier clients.
We conduct several robustness tests. Given the extant debate on measurement of industry
expertise (e.g., Minutti-Meza 2013, Audousset-Coulier et al. 2016), we rerun our analyses using
a battery of different proxies for expertise, including one based on a portfolio-share approach and
another one based on the engagement partner seniority, and find that our results remain
qualitatively unchanged. However, we fail to find meaningful associations between industry
expertise and audit fees, hours and quality when using the partner self-reported measure of
industry specialization. One potential reason is that approximately 90% of the clients are covered
by self-described industry-specialist engagement partners, thereby seriously limiting the cross-
sectional variation in the dataset. This statistic still suggests that a baseline level of industry
expertise exists in the vast majority of audits conducted by the Big 4 in the U.S., consistent with
Bell et al. (2015). While clients are willing to pay to go beyond this baseline level, our other
analyses indicate that audit quality does not necessarily improve.7
Using several proxies for audit committee expertise, we also find some weak evidence that a
more experienced audit committee is able to reduce the credence goods attribute of audits led by
industry specialist engagement partners. This result is consistent with strategic interactions
between sellers and buyers in a credence setting (e.g., Causholli and Knechel 2012).
7 This result is consistent with anecdotal evidence that suggests that audit committees inquire beyond the self-
reported industry expertise of their engagement partners. In particular, audit committees appear to ask for detailed
biographies and lists of prior engagements when assessing new lead partners on their engagements.

9
Our results do not necessarily imply that the decision by the audit committee to hire an
industry specialist engagement partner in the U.S. does not serve a rational goal. In particular,
the name of the engagement partner can currently be publicly disclosed in certain cases ex-post
when things go wrong, including during PCAOB or SEC enforcement actions and class action
lawsuits.8 Thus, the audit committee could have a legitimate incentive to ex-ante engage an
industry specialist engagement partner in an attempt to shield its ex-post exposure to liability.
This incentive should be higher for issuers where the ex-ante risk of litigation is higher.
Consistent with this prediction, we find that audit fees and the average rate per hour are higher
for industry specialist partners in industries with a higher risk of litigation. This result suggests in
general that the credence attribute of an audit may be stronger in the U.S., where litigation is
more prevalent than in many other countries.
Overall, our results contribute to several streams of the literature. We contribute to the audit
partner literature and extend Zerni (2012) and Goodwin and Wu (2014) by providing some
evidence that clients perceive industry specialist engagement partners to be of higher quality and
are willing to pay a premium for their services, even in a setting where the partner name is not
publicly disclosed. This result suggests that, to a certain extent, private disclosure mechanisms
can effectively substitute for public mechanisms. However, partner industry specialization is not
associated with our proxies for audit quality, suggesting that the actual value of using a perceived
industry specialist engagement partner in the U.S. is low. This evidence is in contrast with papers
that focus on countries where the name of the engagement partner is disclosed (e.g., Chi et al.
2010, Chi and Chin 2011). Furthermore, the dichotomy between the client perceived value and
the actual value provided by an industry specialist engagement partner provides support for the
8 See for example the PCAOB enforcement actions against James L. Fazio, and Stephen J. Nardi, partners at
Deloitte and BDO Seidman, respectively (PCAOB 2007a and 2007b).

10
December 15, 2015 PCAOB rule that requires disclosure of the name of the engagement partner
(e.g., PCAOB 2015). In particular, disclosure of the name of the engagement partner may reduce
this dichotomy if capital markets and clients care about choosing higher quality engagement
partners and thus focus on their publicly observable track record (e.g., Aobdia et al. 2015).9
We also contribute to the literature in economics on expert-client agency costs (e.g., Iizuka
2007) by documenting that part of the increased audit fees clients pay for industry specialist
engagement partners are driven by increased audit hours. Given that audit quality remains
unchanged, this suggests that perceived industry specialist engagement partners may
ineffectively over-audit, consistent with audits being credence goods (e.g., Causholli and
Knechel 2012, Causholli et al. 2013). This evidence complements an extensive literature in
industrial organization on the topic of expert-client agency costs and credence goods (e.g.,
Demski and Sappington 1987, Emons 1997). Expert-client agency issues have been documented
in many types of situations, including car mechanics (e.g., Patterson 1992, Hubbard 1998),
doctor-client relationships (e.g., Emons 2001, Afendulis and Kessler 2007, Iizuka 2007 and
2012), legal services (e.g., Hadfield 2000), real estate agents (Levitt and Syverson 2008), and
mutual fund companies and mutual fund investors (Chevalier and Ellison 1997). To our
knowledge, we are the first to find empirical evidence consistent with this theory in the context
of ineffective over-auditing.
We caveat that our results do not necessarily imply that engagement partner industry
expertise does not matter from an audit quality standpoint. For example, our results could be
driven by the current disclosure regime in the U.S. that provides little incentives for engagement
9 Our study provides a baseline that can be compared with future studies on the role of partner industry
specialization in the U.S. that will be based on publicly available partner information.
11
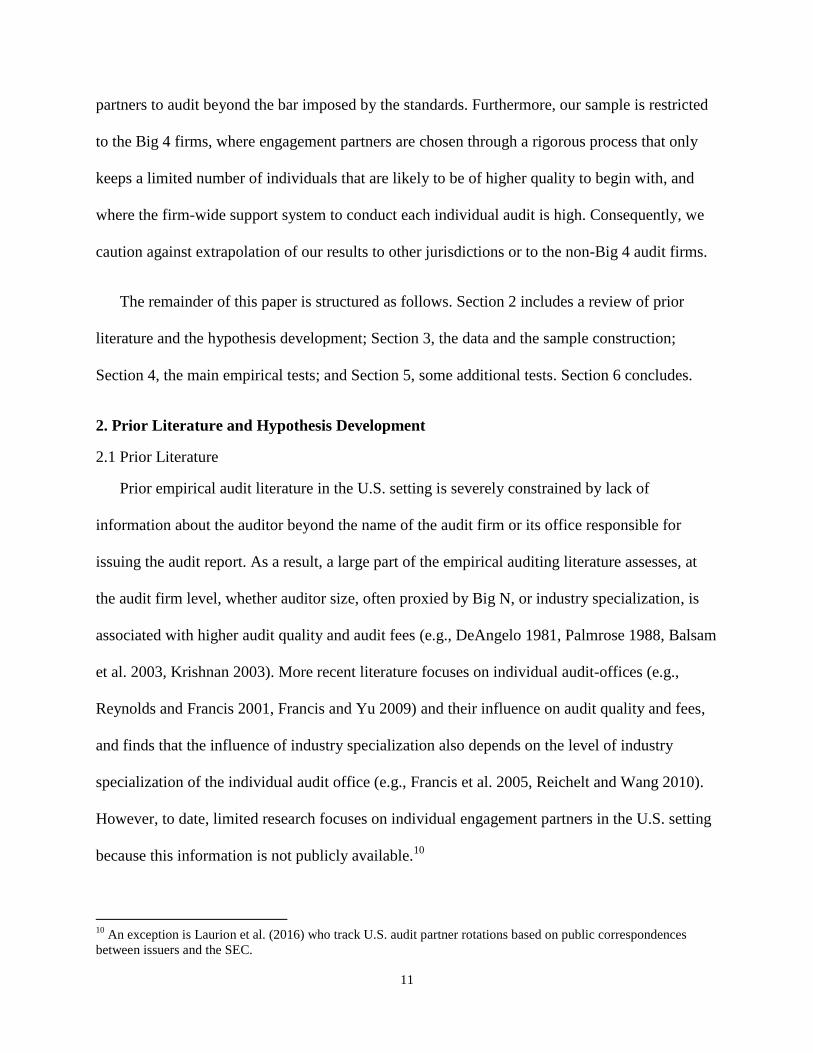
partners to audit beyond the bar imposed by the standards. Furthermore, our sample is restricted
to the Big 4 firms, where engagement partners are chosen through a rigorous process that only
keeps a limited number of individuals that are likely to be of higher quality to begin with, and
where the firm-wide support system to conduct each individual audit is high. Consequently, we
caution against extrapolation of our results to other jurisdictions or to the non-Big 4 audit firms.
The remainder of this paper is structured as follows. Section 2 includes a review of prior
literature and the hypothesis development; Section 3, the data and the sample construction;
Section 4, the main empirical tests; and Section 5, some additional tests. Section 6 concludes.
2. Prior Literature and Hypothesis Development
2.1 Prior Literature
Prior empirical audit literature in the U.S. setting is severely constrained by lack of
information about the auditor beyond the name of the audit firm or its office responsible for
issuing the audit report. As a result, a large part of the empirical auditing literature assesses, at
the audit firm level, whether auditor size, often proxied by Big N, or industry specialization, is
associated with higher audit quality and audit fees (e.g., DeAngelo 1981, Palmrose 1988, Balsam
et al. 2003, Krishnan 2003). More recent literature focuses on individual audit-offices (e.g.,
Reynolds and Francis 2001, Francis and Yu 2009) and their influence on audit quality and fees,
and finds that the influence of industry specialization also depends on the level of industry
specialization of the individual audit office (e.g., Francis et al. 2005, Reichelt and Wang 2010).
However, to date, limited research focuses on individual engagement partners in the U.S. setting
because this information is not publicly available.10
10
An exception is Laurion et al. (2016) who track U.S. audit partner rotations based on public correspondences
between issuers and the SEC.

12
Using international settings such as Australia, China and Taiwan, where the name of the
engagement partner is disclosed, recent research has increased its focus on individual audit
partners (e.g., Chen et al. 2008, Chen et al. 2010). For example, Gul et al. (2013) find for China
that individual engagement partners matter for audit quality, and Aobdia et al. (2015) confirm
their findings for Taiwan, and also find evidence of capital market effects of individual
engagement partners. Knechel et al. (2015) also find differences in individual partner reporting
styles in Sweden. Both Gul et al. (2013) and Aobdia et al. (2015) use partner fixed effect models.
These models capture all time invariant dimensions of a partner, and although informative, do
not fully answer what drives individual partner effects. We cannot apply a fixed effects model
for this particular study because we are interested in measuring the effects of perceived industry
expertise. A fixed effect model would measure actual ability and cannot be estimated (perceived)
by a client because all partner-client histories need to be observable to estimate such a model.11
The closest studies to ours study the influence of partner industry specialization outside of
the U.S. Using data from Sweden and Australia, Zerni (2012) and Goodwin and Wu (2014) focus
on industry expertise at the individual partner level and find a positive association between
industry expertise and audit fees. However, their studies do not focus on audit quality. Chi et al.
(2010) and Chi and Chin (2011), using data from Taiwan, find evidence that partner industry
specialization is positively associated with audit quality. One caveat applicable to these studies is
that their results may not apply to a setting where the name of the partner is not disclosed.
2.2 Hypothesis Development
11
An additional concern of a fixed effect model is that it needs to be estimated on a reasonably long period of time.
An estimation and validation sample may also be required as in Aobdia et al. (2015). We only have six years
available in our dataset.

13
We consider the perceived and actual value of expertise separately by assessing the influence
of the audit partner industry specialization on audit fees and audit quality. In particular, tests of
industry specialization on audit fees can reflect the perceived value of expertise from a client
standpoint, whereas tests on audit quality reflect the actual value of this perceived expertise.
First, we consider whether client issuers are willing to pay a premium for the industry
specialization of their engagement partner. Prior studies suggest that clients are willing to pay a
fee premium when their audit office is an industry specialist (Ferguson et al. 2003, Francis et al.
2005) or is larger (Choi et al. 2010). This suggests that clients may be willing to pay a premium
for an industry specialist engagement partner. In particular, the audit committee could be
interested in working with a credible partner who is less likely to be challenged by the issuer’s
management when presenting the findings of the audit to the client. In general, the audit
committee or the issuer management team is also likely to be interested in interacting with an
industry specialist partner to gain more insights about accounting or auditing practices of other
issuers in the industry, or to benefit from information spillovers from other clients (Aobdia
2015). Anecdotal evidence from audit committee, board members and auditors suggests that
audit committees, in exercising their due care, naturally want to engage the most able auditors
available with the appropriate level of expertise, and ask for detailed information about their
audit team members’ resumes and prior assignments (e.g., Fiolleau et al. 2013). Furthermore, in
settings where the name of the partner is publicly disclosed, Zerni (2012) and Goodwin and Wu
(2014) find a positive association between partner industry specialization and audit fees. Thus,
an audit committee may be interested in hiring an industry specialist partner and pay a premium.
However, in the U.S., issuers cannot accrue signaling benefits in the capital markets by hiring
an industry specialist engagement partner, because the partner name is currently not disclosed.

14
This contrasts with other jurisdictions such as Taiwan where hiring a better partner provides
direct capital market benefits (e.g., Aobdia et al. 2015). Even though an individual audit office
can command a fee premium in the U.S., the audit office’s size and expertise can be inferred
from its clients’ public disclosures. This is not the case for individual partners. Thus, price-
sensitive clients may not insist on working with an industry specialist partner as long as the cost
of the audit is low. Furthermore, audit partners may encounter some difficulties to credibly
convey their expertise to their clients in absence of confirmation from an external disclosure
mechanism.12
This suggests that industry specialist partners may be unable to command a
premium in the U.S. as their assignments to specific clients could result more from internal
supply factors at the audit firm than demand factors from the clients. Audit partners may also
have limited influence on preparing the audit bids with clients, and this could result in a lack of
premium for expertise. Consequently we test the following hypothesis, stated in a null form:
H1a: There is no association between audit fees and engagement partner industry specialization
H1b: There is no association between audit fees per hour and engagement partner industry
specialization
An additional element needs to be considered in the analysis of the potential audit fee
premium for expertise. On the one hand, audit partners may be able to charge a premium per
hour but bill fewer hours in general due to production efficiencies they generate in the audit
process, as suggested by prior literature (e.g.,Cairney and Young 2006, DeFond and Zhang 2014,
Bills et al. 2015). This suggests that audit hours could be lower on engagements audited by
industry specialist partners, thereby lowering the overall client fees.
12
For example it would be much easier, in absence of public disclosure, for a partner in the U.S. to selectively
remove problematic engagements from a biography shared with a prospective client.
15
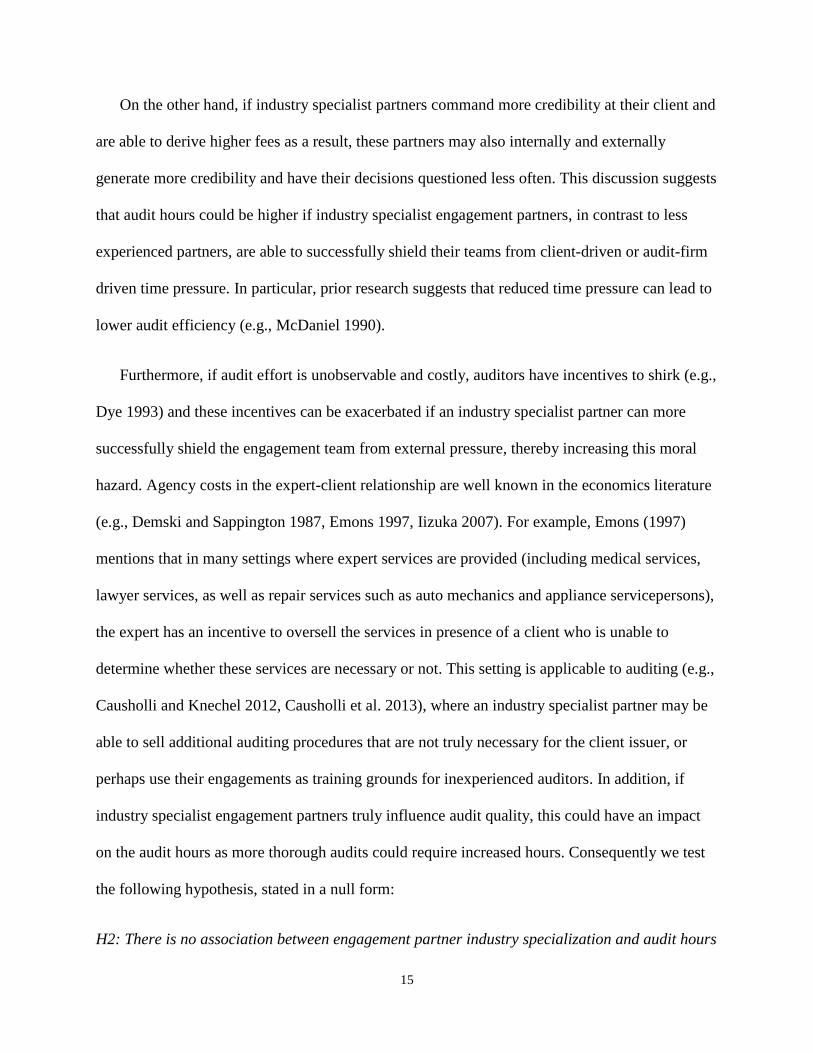
On the other hand, if industry specialist partners command more credibility at their client and
are able to derive higher fees as a result, these partners may also internally and externally
generate more credibility and have their decisions questioned less often. This discussion suggests
that audit hours could be higher if industry specialist engagement partners, in contrast to less
experienced partners, are able to successfully shield their teams from client-driven or audit-firm
driven time pressure. In particular, prior research suggests that reduced time pressure can lead to
lower audit efficiency (e.g., McDaniel 1990).
Furthermore, if audit effort is unobservable and costly, auditors have incentives to shirk (e.g.,
Dye 1993) and these incentives can be exacerbated if an industry specialist partner can more
successfully shield the engagement team from external pressure, thereby increasing this moral
hazard. Agency costs in the expert-client relationship are well known in the economics literature
(e.g., Demski and Sappington 1987, Emons 1997, Iizuka 2007). For example, Emons (1997)
mentions that in many settings where expert services are provided (including medical services,
lawyer services, as well as repair services such as auto mechanics and appliance servicepersons),
the expert has an incentive to oversell the services in presence of a client who is unable to
determine whether these services are necessary or not. This setting is applicable to auditing (e.g.,
Causholli and Knechel 2012, Causholli et al. 2013), where an industry specialist partner may be
able to sell additional auditing procedures that are not truly necessary for the client issuer, or
perhaps use their engagements as training grounds for inexperienced auditors. In addition, if
industry specialist engagement partners truly influence audit quality, this could have an impact
on the audit hours as more thorough audits could require increased hours. Consequently we test
the following hypothesis, stated in a null form:
H2: There is no association between engagement partner industry specialization and audit hours
16
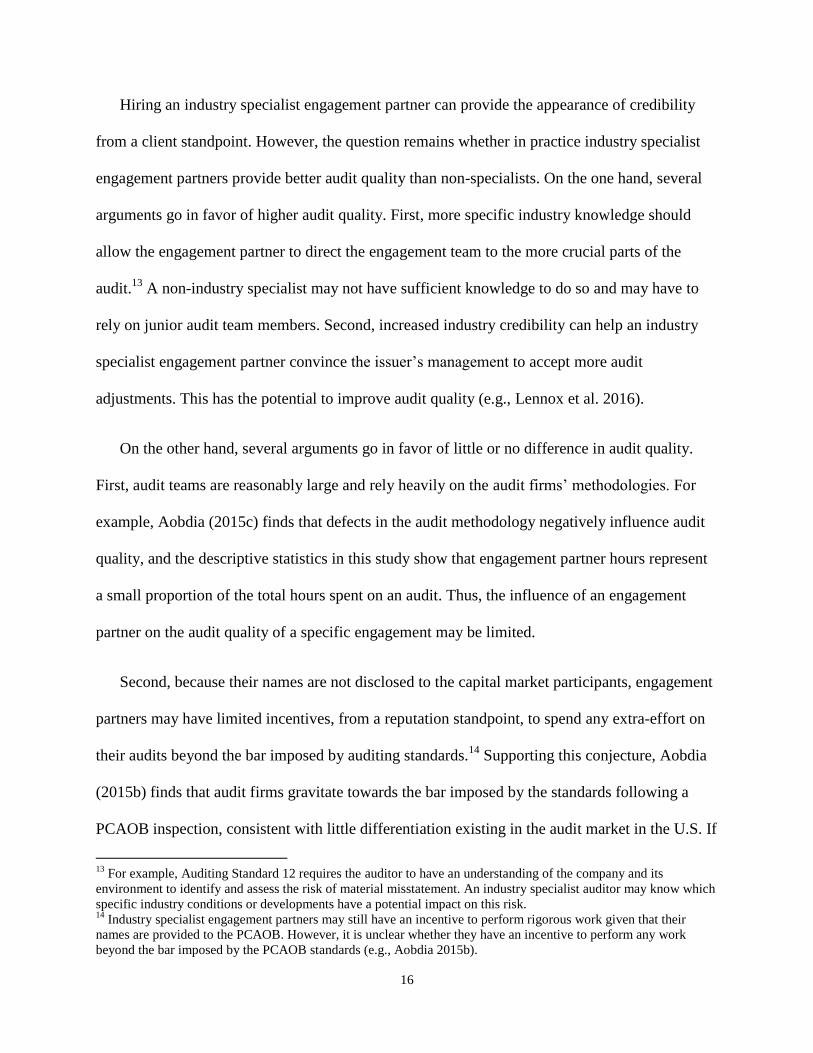
Hiring an industry specialist engagement partner can provide the appearance of credibility
from a client standpoint. However, the question remains whether in practice industry specialist
engagement partners provide better audit quality than non-specialists. On the one hand, several
arguments go in favor of higher audit quality. First, more specific industry knowledge should
allow the engagement partner to direct the engagement team to the more crucial parts of the
audit.13
A non-industry specialist may not have sufficient knowledge to do so and may have to
rely on junior audit team members. Second, increased industry credibility can help an industry
specialist engagement partner convince the issuer’s management to accept more audit
adjustments. This has the potential to improve audit quality (e.g., Lennox et al. 2016).
On the other hand, several arguments go in favor of little or no difference in audit quality.
First, audit teams are reasonably large and rely heavily on the audit firms’ methodologies. For
example, Aobdia (2015c) finds that defects in the audit methodology negatively influence audit
quality, and the descriptive statistics in this study show that engagement partner hours represent
a small proportion of the total hours spent on an audit. Thus, the influence of an engagement
partner on the audit quality of a specific engagement may be limited.
Second, because their names are not disclosed to the capital market participants, engagement
partners may have limited incentives, from a reputation standpoint, to spend any extra-effort on
their audits beyond the bar imposed by auditing standards.14
Supporting this conjecture, Aobdia
(2015b) finds that audit firms gravitate towards the bar imposed by the standards following a
PCAOB inspection, consistent with little differentiation existing in the audit market in the U.S. If
13
For example, Auditing Standard 12 requires the auditor to have an understanding of the company and its
environment to identify and assess the risk of material misstatement. An industry specialist auditor may know which
specific industry conditions or developments have a potential impact on this risk. 14
Industry specialist engagement partners may still have an incentive to perform rigorous work given that their
names are provided to the PCAOB. However, it is unclear whether they have an incentive to perform any work
beyond the bar imposed by the PCAOB standards (e.g., Aobdia 2015b).
17
effort is costly and difficult to monitor (e.g., Balachandran and Ramakrishnan 1987, Dye 1993,
Bedard et al. 2008), then engagement partners may rely more on their audit firms’ methodologies
and engagement team members and decide not to spend any extra-effort on their audits, even if
they are industry specialists.
Third, audit firms actively manage their partners’ assignments and careers. Thus, audit firms
might be cognizant about the strengths and weaknesses of their engagement partners and
appropriately pair them with complementary team members on their engagements. For example,
a non-industry specialist engagement partner may be paired with a highly experienced
engagement team on a specific engagement, while an industry-specialist engagement partner
may be paired with a less qualified engagement team.15
Additional factors could also explain a lack of relationship between engagement partner
industry specialization and audit quality. Industry specialist partners could be overconfident
given their prior track record, or busy individuals whose engagements suffer from lack of
attention. Further, their enhanced knowledge of accounting in given industries may make them
more susceptible to allow more aggressive accounting treatments of certain transactions.
Consequently, it remains an empirical question whether industry-specialist engagement
partners are able to improve audit quality on their engagements. We test the following
hypothesis, stated in its null form:
H3: There is no association between engagement partner industry specialization and audit
quality.
15
Note that even if this statement is valid, this still suggests that industry specialist engagement partners have
limited incentives to achieve higher audit quality at their clients. Otherwise they would push back against this
practice.

18
3. Data and Sample Construction
The PCAOB collects some information about each engagement audited by the U.S.
operations of the largest audit firms in its annual data request form (e.g., McKenna 2015). This
information includes the CIK of the issuer, its fiscal year end, the identity and seniority of the
engagement partner and the hours worked on the audit.16
We obtain this information for the
fiscal years ranging from 2008 to 2013 for the U.S. operations of the Big 4 firms, and start with
24,190 issuer-year observations. We eliminate 5,815 observations corresponding to non-
operating companies and where the name of the engagement partner is missing, leaving a total of
18,375 issuer-years. We base the computation of the expertise proxy on these observations.
Because our partner expertise proxy is computed based on the prior year, we lose another 5,200
observations where the partner’s prior year information is unavailable. Finally, we merge this
dataset with Compustat and Audit Analytics in order to obtain audit fees information, and
compute publicly available measures of audit quality as well as our control variables. Our final
sample is composed of 8,097 observations that have partner industry specialization, audit quality
and fee measures and control variables available. Table 1 summarizes the sample selection
process.
(Insert Table 1 About Here)
We also use audit hours, partner hours, and fees per hour as dependent variables in some of
the specifications. Lead engagement partner hours are only available for the years 2012 and
2013, which further reduces the sample size for the specifications involving the hours. We do not
restrict the data to the intersection of all data available, because doing so would considerably
reduce our overall sample size. We also merge our sample with proprietary PCAOB inspection
16
This information is restricted to the audit of issuers.

19
data, ending in 2012, to determine which engagement is inspected, and what the outcome of the
inspection is. Our sample restricted to inspected engagements is reduced to 502 observations.
4. Main Empirical tests
4.1 Research design
We initially test whether engagement partner industry specialization is associated with audit
quality, fees and hours using the following regression:
Logauditfeesi,t or Log(Hours)i,t or Rate_Per_Hour i,t or Audit_Qualityi,t = α + β1.Expertisei,t
+ γ.Controlsi,t + Year Fixed Effects + Industry Fixed Effects+ εi,t, (1)
where the subscripts i and t correspond to issuers and years, respectively.
Model (1) is estimated using OLS, even when the dependent variables are binary, but the
results are qualitatively unchanged if we use logistic specifications for binary dependent
variables. The dependent variables are composed of Logauditfees, the natural logarithm of the
audit fees charged to the issuer and Log(Hours), composed of two different proxies:
Logaudithours, equal to the logarithm of the total engagement hours, and Logpartnerhours,
equal to the logarithm of the engagement partner hours. Detailed variable definitions are
provided in Appendix A. We also use Rate_Per_Hour as a dependent variable, equal to the total
audit fees divided by the total engagement hours, to test for whether engagements audited by
industry specialist engagement partners command a rate premium. We also use Audit_Quality as
a dependent variable, itself composed of four different proxies, to test for the potential influence
of the engagement partner on audit quality. Following prior literature (e.g., Leuz et al. 2003,
DeFond and Zhang 2014, Aobdia 2015a), we use the following proxies for audit quality:
Restatement, SmallProfits and PartIFinding, indicator variables equal to one when the company
restates its financial statements, has a return on assets between 0% and 3%, or its audit

20
engagement receives a Part I Finding, respectively; and ScaledAccrualsCFO, the absolute value
of accruals deflated by cash flows from operations. All these variables are computed in a similar
fashion as in Aobdia (2015a), who finds that Restatement, SmallProfits, and ScaledAccrualsCFO
represent adequate measures of audit quality when compared with the PCAOB Part I Findings.
We tend to rely more on the inferences derived from PartIFinding, Restatement and SmallProfit,
in contrast to ScaledAccrualsCFO, because of Aobdia (2015a)’s results that suggest that these
variables are stronger at predicting audit quality. Nevertheless our results on audit quality are
qualitatively unchanged regardless of which dependent variable we use. We also do not tabulate
additional specifications that use total accruals or discretionary accruals as dependent variables,
but our results are also qualitatively unchanged when using these variables.
Following prior literature (e.g., Balsam et al. 2003, Krishnan 2003, Reichelt and Wang 2010,
Minutti-Meza 2013), we use the audit partner’s within-industry market share as our measure of
industry specialization. Specifically, our main proxy for partner industry specialization,
Expertise, is equal to the total audit fees charged by the engagement partner in the client
industry, defined using the Fama French 48 industry groups, divided by the total audit fees
charged in this industry.17,18
We measure industry specialization one year prior to the
measurement of the dependent variables, because otherwise we may mistakenly assign
engagement partners to be industry specialists when they just start working on a large
engagement in a completely different industry. Given that the measurement of industry
17
Because the Fama French 48 industry groups are more granular than the typical industries defined by the audit
firms, we rerun in untabulated analyses our specifications using the Fama French 10 industry groups and find
qualitatively unchanged results. 18
One may wonder whether the typical measure of industry specialization, based on publicly available data, does
not suffer from noise due to lack of inclusion of nonpublic companies. Because the PCAOB collects the total
number of non-issuer clients for each partner and each year, we are able to re-run our specifications on partners that
do not have any nonpublic clients. While our sample size is greatly reduced by incorporating this restriction, we
keep finding, in untabulated analyses, qualitatively unchanged results.

21
specialization can be problematic in general (e.g., Zerni 2012), especially because we are limited
by the number of years in our dataset, we also explore some additional measures of industry
specialization in Section 5. Further, there is little consensus in the literature about whether a
continuous market share variable or an indicator variable above a certain market share threshold
needs to be chosen. For example, Goodwin and Wu (2014) use a continuous measure, whereas
Minutti-Meza (2013) and Zerni (2012) use indicator variables. We use a continuous measure of
industry specialization in Model (1), similar to Goodwin and Wu (2014). However, our results
are qualitatively unchanged if we use an indicator variable when the market share is above the
75th
percentile threshold (Specialist variable). We use the latter definition when applying
propensity score matching regressions described below.19
Following prior literature (e.g., Francis et al. 2005; Francis and Yu 2009; Reichelt and Wang
2010), we include a battery of control variables that have been shown to influence audit quality
and audit fees. These control variables are composed of Logat (the natural logarithm of the
issuer’s total assets, to control for issuer size), Leverage (total debt divided by total debt plus
equity, to control for capital structure), Loss (an indicator variable equal to one if earnings before
extraordinary items is negative), BTM (the book to market ratio, equal to the issuer’s book equity
divided by fiscal year end market value), ForeignPifo (absolute value of pretax income from
foreign operations divided by the absolute value of pretax income), Intangi (minus one times
gross PP&E divided by assets), CATA (current assets divided by total assets), Quick (current
assets less inventory divided by current liabilities), Geoseg (number of geographic segments, as
per Compustat Segments), Busseg (number of business segments, as per Compustat Segments),
Stdsalegrowth (the standard deviation of the issuer’s sales growth, computed from year t − 3 to
19
We use an indicator variable when applying the propensity score model in order to estimate the selection model
which must be based on a binary outcome.
22
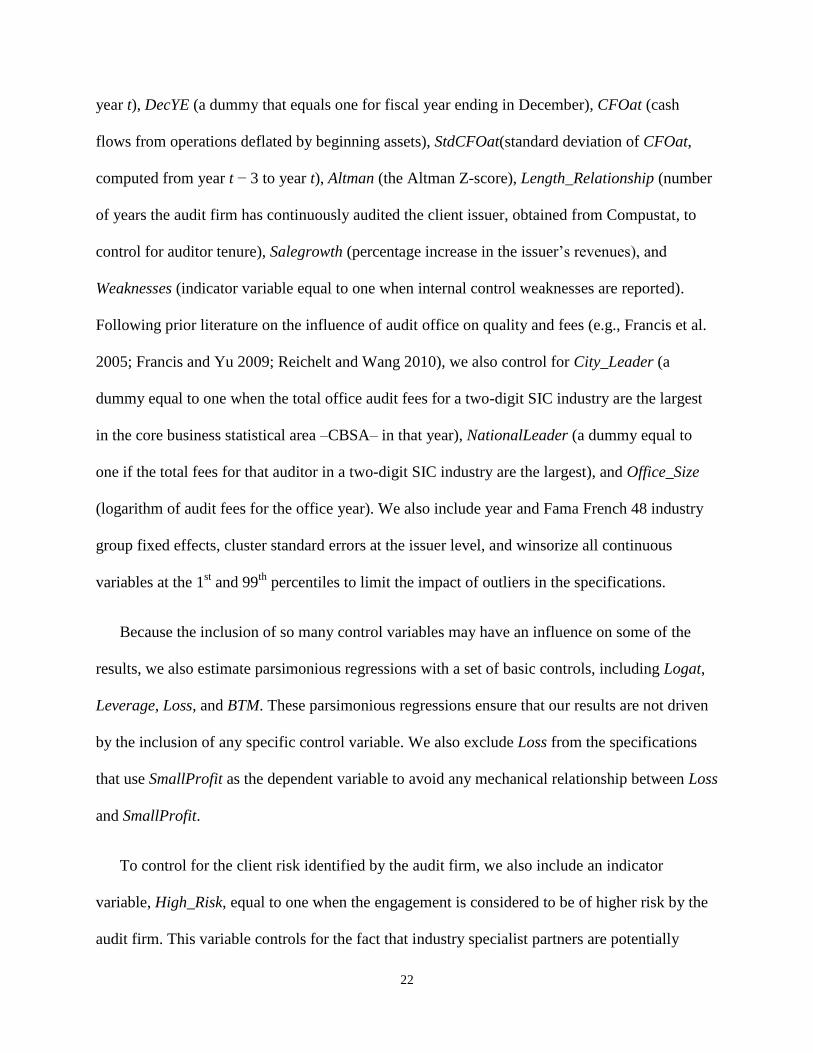
year t), DecYE (a dummy that equals one for fiscal year ending in December), CFOat (cash
flows from operations deflated by beginning assets), StdCFOat(standard deviation of CFOat,
computed from year t − 3 to year t), Altman (the Altman Z-score), Length_Relationship (number
of years the audit firm has continuously audited the client issuer, obtained from Compustat, to
control for auditor tenure), Salegrowth (percentage increase in the issuer’s revenues), and
Weaknesses (indicator variable equal to one when internal control weaknesses are reported).
Following prior literature on the influence of audit office on quality and fees (e.g., Francis et al.
2005; Francis and Yu 2009; Reichelt and Wang 2010), we also control for City_Leader (a
dummy equal to one when the total office audit fees for a two-digit SIC industry are the largest
in the core business statistical area –CBSA– in that year), NationalLeader (a dummy equal to
one if the total fees for that auditor in a two-digit SIC industry are the largest), and Office_Size
(logarithm of audit fees for the office year). We also include year and Fama French 48 industry
group fixed effects, cluster standard errors at the issuer level, and winsorize all continuous
variables at the 1st and 99
th percentiles to limit the impact of outliers in the specifications.
Because the inclusion of so many control variables may have an influence on some of the
results, we also estimate parsimonious regressions with a set of basic controls, including Logat,
Leverage, Loss, and BTM. These parsimonious regressions ensure that our results are not driven
by the inclusion of any specific control variable. We also exclude Loss from the specifications
that use SmallProfit as the dependent variable to avoid any mechanical relationship between Loss
and SmallProfit.
To control for the client risk identified by the audit firm, we also include an indicator
variable, High_Risk, equal to one when the engagement is considered to be of higher risk by the
audit firm. This variable controls for the fact that industry specialist partners are potentially

23
assigned to riskier engagements and alleviates concerns that a positive association between audit
fees or hours and industry specialization, or a null association with audit quality, could be driven
by client risk.
We also re-estimate Model (1) using a matched sample based on propensity score matching.
Lawrence et al. (2011) and Minutti-Meza (2013) find that OLS can lead to misleading inferences
in the analysis of Big 4 auditors and auditor industry specialization on audit quality and fees, and
suggest that using matched samples instead is more appropriate. In particular, Minutti-Meza
(2013) argues that differences in clientele among auditors can influence the measurement of
industry specialization because auditors covering larger clients are more likely to be classified as
industry specialists. Thus, he recommends using matched samples to take care of this issue.
Following these two studies, we apply propensity score matching (Rosenbaum and Rubin 1983)
and rerun Model (1) on the sample of engagements audited by industry specialists and a control
group matched on propensity score matching.20
We use the following first stage logistic model:
Specialisti,t = α + γ.Explanatory Variablesi,t + Year Fixed Effects + Industry Fixed Effects+
εi,t, (2)
In this specification, Specialist is an indicator variable equal to one when Expertise is above
1.6%, which corresponds to the 75th
percentile of the distribution in the sample (see Table 2).21
Specialist proxies for engagements that are audited by an industry specialist partner.
We first estimate the propensity for engagements in the sample to be audited by an industry
specialist. Then, for each engagement audited by a specialist, we match this engagement, without
replacement, with an engagement not audited by a specialist that has the closest predicted
20
Following the recommendations in Shipman et al. (2016), we present our results using both multivariate
regression and propensity score matching. 21
We also use different thresholds, such as the 90th
percentile and 5% of industry fees, and find qualitatively
unchanged results.
24
probability from Model (2).22
The differences between the two groups should be informative
about the treatment effect of engagements being audited by an industry specialist (e.g., Heckman
et al. 1997, 1998, Dehejia and Wahba 1999, 2002, and Lawrence et al. 2011). Following
Lawrence et al. (2011) and Minutti-Meza (2013), we still use Model (1) restricted to the treated
and control samples to control for any remaining differences. However, our results remain
unchanged if we only estimate the average treatment effect without inclusion of control
variables.
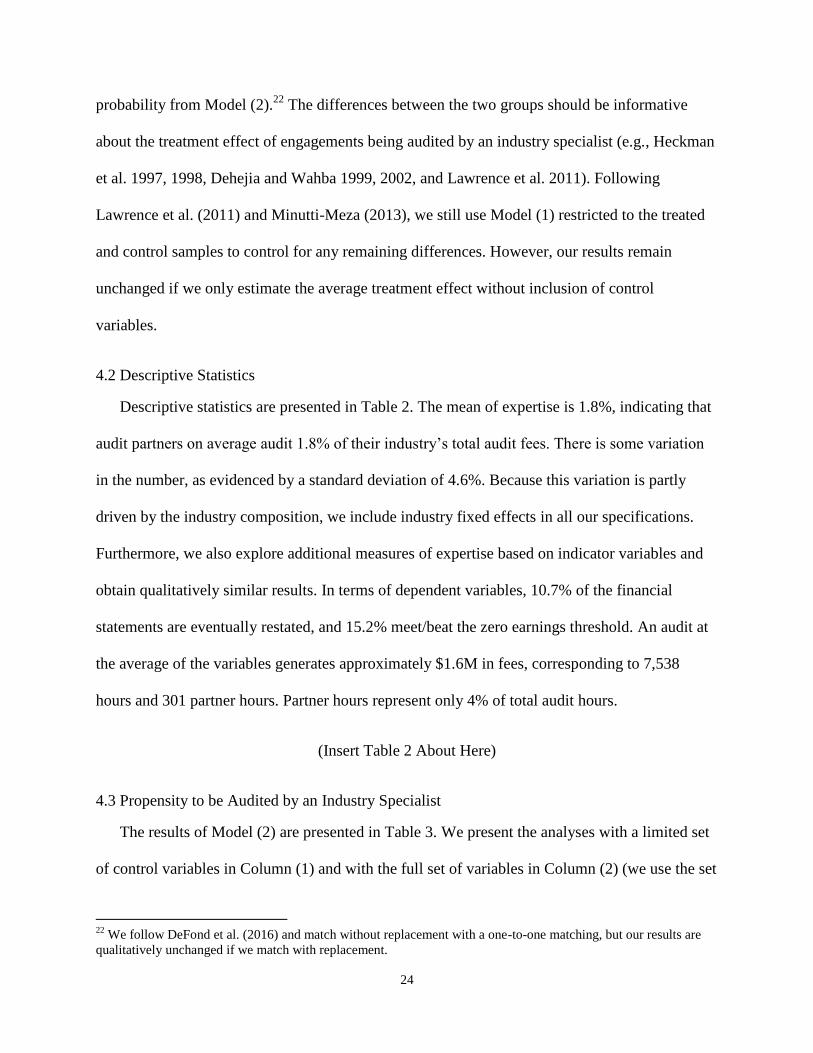
4.2 Descriptive Statistics
Descriptive statistics are presented in Table 2. The mean of expertise is 1.8%, indicating that
audit partners on average audit 1.8% of their industry’s total audit fees. There is some variation
in the number, as evidenced by a standard deviation of 4.6%. Because this variation is partly
driven by the industry composition, we include industry fixed effects in all our specifications.
Furthermore, we also explore additional measures of expertise based on indicator variables and
obtain qualitatively similar results. In terms of dependent variables, 10.7% of the financial
statements are eventually restated, and 15.2% meet/beat the zero earnings threshold. An audit at
the average of the variables generates approximately $1.6M in fees, corresponding to 7,538
hours and 301 partner hours. Partner hours represent only 4% of total audit hours.
(Insert Table 2 About Here)
4.3 Propensity to be Audited by an Industry Specialist
The results of Model (2) are presented in Table 3. We present the analyses with a limited set
of control variables in Column (1) and with the full set of variables in Column (2) (we use the set
22
We follow DeFond et al. (2016) and match without replacement with a one-to-one matching, but our results are
qualitatively unchanged if we match with replacement.

25
with the full set of variables in subsequent analyses based on propensity score matching). We
find that larger issuers, international issuers, issuers audited by an industry-specialist city auditor
and larger offices, and with lower cash flows and sales growth are more likely to be audited by
an industry specialist partner, as evidenced by significant coefficients on Logat, ForeignPifo,
City_Leader, Office_Size, CFOat and SaleGrowth. This suggests that auditors assign industry
specialist engagement partners to larger, more complex and riskier clients, and also where they
have a larger pool of potential industry specialist partners available.23
We note that while
High_Risk loads positively in Column (1), the coefficient becomes insignificant after
incorporating other control variables in Column (2). This result suggests that the client risk as
perceived by the auditor can be controlled with publicly available variables when considering
partner assignment decisions.
(Insert Table 3 About Here)
We note that the explanatory power of Model (2) is reasonably high. Untabulated analyses
indicate that the area under the curve of the model is 88% in Column (1) and only increases to
90% when incorporating all control variables in Column (2).24
4.4 Audit Fee Results
Results on audit fees are presented in Table 4. Columns (1) to (3) show the results when
using Logauditfees as the dependent variable. We find a positive association between Expertise
(and Specialist) and Logauditfees. This result, consistent with Zerni (2012) and Goodwin and
Wu (2014), suggests that clients value industry expert engagement partners on their engagements
23
We note that the relationship on issuer size could be mechanical, due to the way industry specialization is
measured in the first place (e.g., Minutti-Meza 2013). This justifies the need to use a matched model. 24
The Receiver Operating Characteristic (ROC) curve is a parametric plot of the probability of detection versus the
false positive rate (e.g., Schmidt, 2012). The area under the curve (AUC) represents a measure of fit of the model. A
value of 0.5 of this statistic corresponds to a random model, while a value of 1.0 means perfect predictive power of
the explanatory variables.

26
and are willing to pay a premium, even in the context of the U.S. setting where the name of the
engagement partner is not publicly disclosed. The results are qualitatively unchanged regardless
of the number of control variables used, but are slightly weaker in Column (2) when including
more controls. The results also hold when using propensity score matching in Column (3). In
terms of economic significance, based on Column (2), one standard deviation increase in partner
industry specialization is associated with an increase in audit fees of approximately 11%.25
This
number is reasonably large in general, but is still smaller than comparable numbers found in
settings where the name of the engagement partner is publicly disclosed. For example, in
Goodwin and Wu (2014), based on the results of their Table 6 Column (2), an increase of one
standard deviation of industry expertise of the partner is associated with a fee increase of
approximately 24%. These results suggest that clients may not be willing to pay as much for
industry specialist partners in a setting where their name is not disclosed.26
(Insert Table 4 About Here)
Columns (4) to (6) show the results when using Rate_Per_Hour as the dependent variable.
Similarly to the results in Columns (1) to (3), we find a positive association between Expertise
and Rate_Per_Hour. This suggests that clients are willing to pay a premium to use industry
expert audit partners. In terms of economic significance, an increase of one standard deviation of
Expertise is associated with an increase of the fees per hour of approximately $8.8, or 4.0% of
the average fees per hour of $220.5. This number is smaller than the increase in audit fees and
suggests that audit hours must increase, a premise we study next. Because Zerni (2012) and
25
This number is computed as e(2.388×0.045)
-1. 26
We note that the economic significance of an industry expert is closer to Goodwin and Wu (2014) when using
propensity score matching. However, Goodwin and Wu (2014) use OLS and therefore this comparison is not
meaningful.
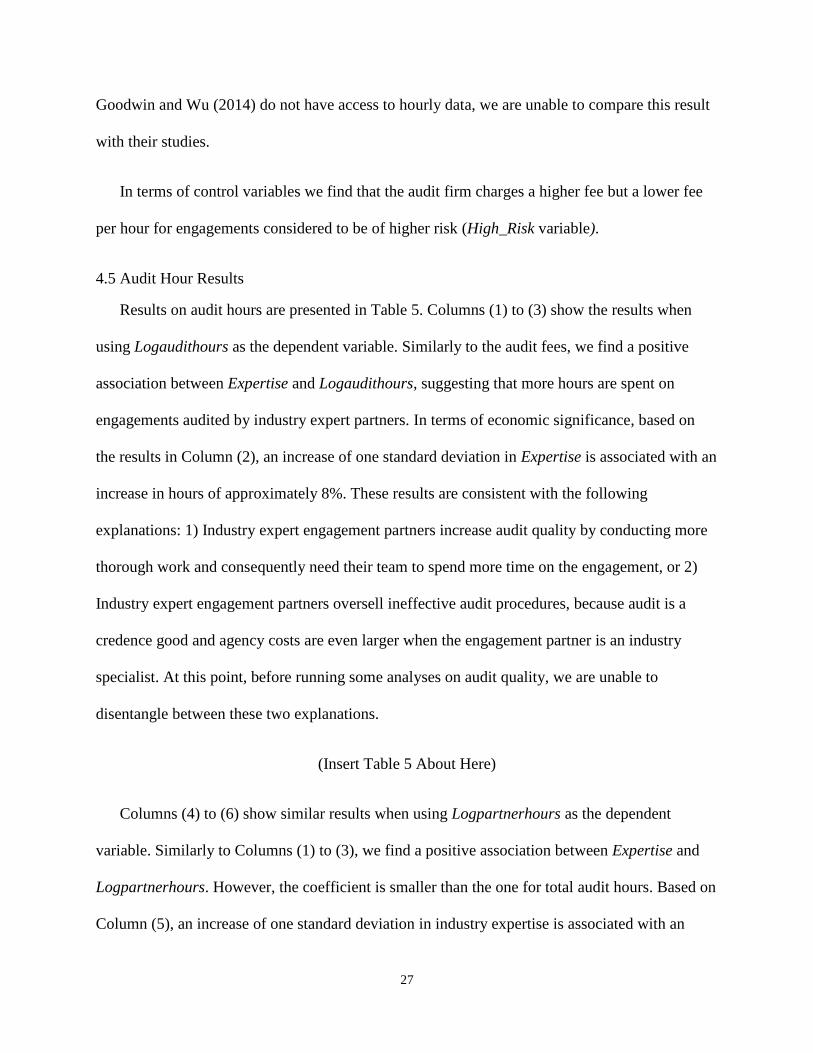
27
Goodwin and Wu (2014) do not have access to hourly data, we are unable to compare this result
with their studies.
In terms of control variables we find that the audit firm charges a higher fee but a lower fee
per hour for engagements considered to be of higher risk (High_Risk variable).
4.5 Audit Hour Results
Results on audit hours are presented in Table 5. Columns (1) to (3) show the results when
using Logaudithours as the dependent variable. Similarly to the audit fees, we find a positive
association between Expertise and Logaudithours, suggesting that more hours are spent on
engagements audited by industry expert partners. In terms of economic significance, based on
the results in Column (2), an increase of one standard deviation in Expertise is associated with an
increase in hours of approximately 8%. These results are consistent with the following
explanations: 1) Industry expert engagement partners increase audit quality by conducting more
thorough work and consequently need their team to spend more time on the engagement, or 2)
Industry expert engagement partners oversell ineffective audit procedures, because audit is a
credence good and agency costs are even larger when the engagement partner is an industry
specialist. At this point, before running some analyses on audit quality, we are unable to
disentangle between these two explanations.
(Insert Table 5 About Here)
Columns (4) to (6) show similar results when using Logpartnerhours as the dependent
variable. Similarly to Columns (1) to (3), we find a positive association between Expertise and
Logpartnerhours. However, the coefficient is smaller than the one for total audit hours. Based on
Column (5), an increase of one standard deviation in industry expertise is associated with an

28
increase of only 3% in the partner hours. This smaller increase for engagement partners suggests
that the extra-hours spent on the audit are not driven by higher quality hours.27
In terms of control variables, we find that both audit and partner hours are higher on higher
risk engagements (High_Risk variable).
4.6 Audit Quality Results
Results on audit quality are presented in Tables 6 and 7. Table 6 shows the results when
using Restatement and PartIFinding as the dependent variables, and Table 7 when using
SmallProfit and ScaledAccrualsCFO. In all eight specifications using the four different
dependent variables, we fail to find any association between Expertise and audit quality.
(Insert Tables 6 and 7 About Here)
These results suggest that having an industry specialist engagement partner on the account
does not have much impact on auditor quality in the U.S., perhaps because audit partner hours
are very small on each engagement in light of the effort put by the remainder of the engagement
team, audit firms tend to heavily rely on their methodologies, and the absence of disclosure of
the name of the engagement partner does not provide any incentive to improve audit quality
beyond the bar imposed by the audit standards. These results are consistent with Donovan et al.
(2014) and Aobdia (2015b), who provide some evidence that audit differentiation does not
matter in the U.S.
The results on audit quality also suggest that the results identified in Table 4 on the audit
hours are driven by the second explanation, that is, because industry specialist partners command
27
In untabulated analyses we confirm that the proportion of partner hours out of the total hours declines when
partner industry specialization increases, suggesting that lower-quality hours are substituted in an audit led by an
industry specialist partner.

29
a higher stature outside their organization and the audit is a credence good, agency costs between
auditor and client are increased when the client is audited by an industry specialist and these
partners tend of sell some services that are unnecessary to their clients.
In terms of control variables, we also find positive associations between High_Risk and
Restatement, SmallProfit and ScaledAccrualsCFO, but none with PartIFinding (the coefficient is
negative and close to significance in one specification). Thus, despite increasing their effort on
higher risk engagements, auditors appear unable to fully reduce the level of audit risk to the level
of lower-risk engagements. This is consistent with the arguments in DeFond and Zhang (2014).
5. Additional Empirical tests
5.1 Focus on Smaller Issuers
We conduct an additional test that is similar in spirit to the propensity-score matching
approach. Because our measure of partner industry specialization is mostly driven by partners
that cover larger issuers, we partition our sample into two equal halves based on the market
capitalization of the issuer, and replicate our analyses on the subsample of smaller issuers. The
advantage of using this subsample is that it acts as a quasi-validation sample, given that the
cross-sectional variation in our industry expertise measure is mostly driven by the coverage of
the largest issuers. In untabulated analyses we find similar results as the ones shown in Tables 4
to 7. This analysis further confirms the inferences detailed above.
5.2 Partner Seniority
We conduct an additional test where we re-run Model (1) adding a second variable for
partner experience, Seniority, equal to the number of years the engagement partner has been an
engagement partner in the audit firm. One advantage of using Seniority compared to Expertise is
that the measure is less likely to be contaminated by measurement error. In particular, more

30
senior partners are more likely to command credibility at their clients, due to their general
expertise of auditing and the total experience they built over time auditing clients. The main
disadvantage of this measure is that it only relates to how many years a partner has been a
partner in the audit firm, and not to how many years the partner has audited specific clients.
(Insert Table 8 About Here)
Results are presented in Table 8. For brevity, we omit the coefficients on the control
variables. We keep finding qualitatively unchanged results on Expertise. We find qualitatively
similar results to Expertise on the Seniority variable. Notably, we find that more senior partners
command higher fees, and that more hours are spent on the engagements they audit. However,
we do not find any significant relationship between Seniority and Rate_Per_Hour. Furthermore,
we find a negative relationship between Seniority and Logpartnerhours, suggesting that more
senior partners are less involved on their audit engagements or more efficient. This result could
also be due to the addition of additional audit partners on large engagements audited by very
senior partners.
We also do not find any association between Seniority and variables that proxy for audit
quality, suggesting, again, that partner experience has little influence on the audit quality of their
engagements. Overall, these results corroborate our main results on Expertise.
5.3 Additional Measures of Industry Specialization
One potential concern of our current measure of industry specialization is that it is based on
audit fees. Given that we assess the influence of partner industry specialization on audit fees, a
legitimate concern could be that a mechanical relationship exists between the dependent and
independent variables, both based on fees. Furthermore, audit fees are also subject to potential
31
economic forces such as lowballing or auditor differentiation that may have an influence on the
measurement of industry specialization. To alleviate these concerns, we use an alternative
measure of industry specialization based on the issuer’s square roots of assets. We build this
variable in a similar fashion as Expertise. We use the issuer’s square roots of assets because a
regression of the logarithm of audit fees on the logarithm of the issuer’s assets yields a regression
coefficient very close to 0.5, with an R-square above 60%. Consequently, audit fees are roughly
proportional to the square root of the issuer’s assets, consistent with prior research on the topic
(e.g., Simunic 1980, Simunic 1984). For this reason, several papers in auditing assess market
share using the square root of the issuers’ assets or use the square root of assets as a deflator
(e.g., Simunic 1984, Kwon 1996, Hogan and Jeter 1999). In untabulated analyses we find
qualitatively similar results when using this other proxy for industry expertise.28
We also perform an additional robustness test by measuring industry expertise as the natural
logarithm of the total audit fees charged by the engagement partner in a given industry. The main
advantage of this measure is that it takes into account the fact that different industries are of
different sizes. In particular, an engagement partner could still be a specialist even if her
industry-market share is reasonably small, because the industry could be very large and the
partner still audits major clients in this industry. We find in untabulated analyses that our
inferences are robust to the use of this alternative measure of partner industry specialization.29
28
We also rerun our specifications using measures of audit quality built similarly as for Expertise, but based on the
issuers’ market capitalization or the number of hours worked on the audit. We find results that are overall
qualitatively similar to the ones shown above. However, when using market capitalization, we find a negative
association between engagement partner industry specialization and SmallProfits. When using hours, we also find a
weak negative association between industry specialization and Rate_Per_Hour. 29
Our inferences are also robust to using the natural logarithm of the sum of the square roots of the clients’ assets as
an alternative specification. This specification alleviates the concerns detailed at the start of this sub-section.

32
We conduct another robustness test by replacing Expertise with another variable that is based
on a portfolio share approach, following Neal and Riley (2004) and Minutti-Meza (2013). The
advantage of this measure is that it recognizes the fact that an audit partner does not need to audit
very large clients in a specific industry in order to build expertise. In particular, if the auditor
spent all her time in a given industry with smaller clients, it is still likely that the auditor would
acquire sufficient expertise in a given industry. We define this variable based on the client
portfolio of the engagement partner. The new proxy for expertise, Expertise Portfolio Share is
equal to the total fees charged by the engagement partner in the client industry divided by the
total fees charged by this partner in all industries (Specialist Portfolio Share, for the propensity
score matching regression, equals one when Expertise Portfolio Share is above 75%). Thus, if an
audit partner spends 100% of her time in a given industry, she is considered an expert. Similar to
our main measure of expertise, we estimate this alternative measure one year prior to
measurement of our dependent variables.
(Insert Table 9 About Here)
We rerun Model (1) using this variable, and, in Table 9, find robust results for all variables
except Rate_Per_Hour, where the coefficient on Expertise Portfolio Share remains positive but
becomes insignificant.
Finally, as part of its annual data request form, the PCAOB collects, for a subset of the audit
firms over several years, the self-reported partner industry expertise, and assesses whether each
of the clients is audited by an industry specialist engagement partner or not. We obtain this
dataset and conduct an additional robustness test to determine whether our inferences are robust
to the use of this self-reported measure. In untabulated analyses, we do not find any meaningful

33
relationship between engagement partner self-reported industry expertise and audit fees, audit
hours or audit quality. However, the main issue of the dataset is that approximately 90% of the
client-years are allegedly audited by self-reported industry specialist engagement partners (this
result is similar to Bell et al. 2015 who find in their sample that 88% of the engagements are
audited by self-reported industry specialists). This lack of cross-sectional variation in our dataset
likely explains our insignificant results and suggests that prospective clients do not fully rely on
the self-reported industry specialization of audit engagement partners.30
This is consistent with
anecdotal evidence that suggests that audit committees tend to focus on specific prior clients of
an engagement partner and ask for detailed biographies and resumes. We note that our result
indicates that a baseline level of industry expertise is present in the vast majority of audits
conducted by the Big 4 in the U.S. However, any increase in perceived industry expertise beyond
this baseline level is not associated with a commensurate increase in audit quality.
5.4 Role of the Audit Committee
In this section we test whether audit committee expertise mitigates the results above. In
particular, because sellers act strategically in a credence goods setting (e.g., Causholli and
Knechel 2012), a more expert audit committee may be able to reduce the credence goods effect
of industry specialist engagement partners. We test for this possibility by augmenting Model (1)
with Auc_CPA, the number of audit committee members who have a CPA, Auc_Big4_Alumns,
the number of audit committee members who are alumni of a Big 4 firm (both variables are built
30
Because the self-reported dataset is substantially smaller than the dataset shown in Tables 3 to 5, one may wonder
whether the reduction in sample size drives the lack of statistical significance in our analyses. In additional
untabulated tests, we rerun our analyses in Tables 3 to 5 restricting the sample to the sample where the self-reported
measure is available, and still find qualitatively unchanged results. This suggests that the lack of statistical
significance when using the self-reported measure is due to the lack of cross-sectional variation in the measure itself
rather than in a reduction in the sample size.

34
from Boardex), and the interactions of these variables with Expertise. We expect the engagement
partner fee premium to be lower when audit committee members are more experienced.
(Insert Table 10 About Here)
Results are presented in Table 10. We find some weak evidence that expertise of the audit
committee reduces the credence goods attribute of the audit. In particular, the interaction
Expertise × Auc_CPA is negative (insignificant but close to significance levels) in the regression
with audit fees as the dependent variable. Furthermore, Expertise × Auc_Big4_Alumns loads
negatively in the regression with Rate_Per_Hour as the dependent variable, even though the
coefficient is insignificant in the audit fee regression. One possibility for the lack of significance
of the regressions is that the audit expertise of the audit committee is dated and thus not entirely
applicable in today’s environment.
5.5 Complex Industries
While we do not find any average effect of engagement partner industry specialization on
audit quality, it is still possible that this effect could appear in specific industries. In particular,
recent evidence (Francis and Gunn 2015, Bills et al. 2015), suggests that the role of auditor
industry expertise is much greater in industries with greater accounting complexity, because the
measurement of earnings is noisier and has more measurement error. We test for this idea by
partitioning our sample between complex and non-complex industries, as defined in Francis and
Gunn (2015) and Bills et al. (2015). In untabulated analyses, we find qualitatively unchanged
results for non-complex industries. For complex industries, our results are similar, except for
SmallProfit, where we find a negative association with Expertise. We still find no association
when using Restatement, PartIFinding, and ScaledAccrualsCFO as the dependent variables.
Overall, this result suggests that partner industry expertise might matter slightly more for audit

35
quality in more complex industries. However, the results are quite weak and still suggest that
there is limited audit quality influence of hiring an industry specialist partner.
5.6 Litigation Industries
Our results above suggest that issuers hiring industry specialist engagement partners pay
higher fees but do not obtain commensurate audit quality improvements. However, this does not
necessarily imply that the decision to hire an industry specialist engagement partner is irrational.
In particular, because the name of the engagement partner can be disclosed ex-post when things
go wrong, an audit committee could have some ex-ante incentives to show that they hired a
qualified auditor in order to attempt to reduce litigation exposure. We test for this idea by
including a proxy for ex-ante litigation risk in our model and interacting it with Expertise. We
build our variable, Litigation, based on industry membership as in Kim and Skinner (2012). We
predict that the interaction Litigation × Expertise should load positively in the fee regressions if
the audit committee perceives higher benefits of hiring an industry specialist engagement partner
when the ex-ante risk of litigation is higher.
Consistent with this hypothesis, we find in untabulated analyses that the interaction
Litigation × Expertise loads positively in the regressions using audit fees, fee per hour, and
hours. This interaction generally does not load when using audit quality measures as the
dependent variables, except for Restatement, where we find a weak negative association. Taken
collectively, these results suggest that the credence nature of auditing is enhanced when the ex-
ante risk of litigation is higher. The uninteracted coefficient on Expertise remains positive and
significant in the regressions using fees, fee per hour, and hours, and insignificant in the
regressions using audit quality measures as the dependent variables. This confirms that the
credence nature of auditing is not restricted to a given set of industries subject to litigation risk.

36
6. Conclusion
This study examines the association between engagement partner industry specialization and
audit fees and quality. We find a positive association between industry specialization and audit
fees and fees per hour, consistent with specialist engagement partners charging a premium to
their clients. We also find a positive association between specialization and audit hours.
However, we do not find any association between specialization and audit quality. Collectively,
these results suggest that specialist engagement partners command some credibility outside and
inside their firms, but that their presence does not necessarily increase audit quality. In particular,
we infer, because our results of increased hours do not translate into higher audit quality, that
industry specialist partners ineffectively over-audit, as is typical of credence goods.
Our results contribute to the auditing literature, by documenting, in a setting where the name
of the engagement partner is not disclosed, that clients still care about the perceived quality of
their engagement partners. They also cast some doubts on the actual value provided by such
partners. We caution that this result may be driven by the lack of disclosure of the name of the
engagement partner in the U.S., which could lead partners to rely more on their audit team and
methodology than in other settings where the name is publicly available. Consequently, future
research may have an opportunity to re-examine changes in the association between engagement
partner industry expertise and audit quality when data become available following the recent
PCAOB decision to require the disclosure of the name of the engagement partner (PCAOB
2015). We note that our results support the disclosure of the name of the engagement partner,
because this disclosure may lead the capital markets and clients to focus more on the publicly
observable track record of the engagement partner (e.g., Aobdia et al. 2015), thereby providing

37
incentives for engagement partners to provide higher audit quality and reducing agency costs
between industry specialist auditors and their clients.
38
References
Afendulis, C.C., and D.P. Kessler. 2007. Tradeoffs from integrating diagnosis and treatment in
markets for health care. The American Economic Review 97 (3): 1013-1020.
Aobdia, D. 2015. Proprietary information spillovers and supplier choice: Evidence from auditors.
Review of Accounting Studies 20 (4): 1504-1539.
Aobdia, D. 2015a. The validity of publicly available measures of audit quality. Evidence from
the PCAOB inspection data. Working paper.
Aobdia, D. 2015b. The impact of the PCAOB individual engagement inspection process –
Preliminary evidence. Working paper.
Aobdia, D. 2015c. Does the organization and culture of the largest audit firms influence their
audit quality and efficiency? Working paper.
Aobdia D., C.-J. Lin, and R. Petacchi. 2015. Capital market consequences of audit partner
quality. The Accounting Review 90 (6): 2143-2176.
Audousset-Coulier, S., A. Jeny, and L. Jiang. 2016. The validity of auditor industry
specialization measures. Auditing: A Journal of Practice & Theory 35 (1): 139-161.
Balachandran, B.V., and R.T.S. Ramakrishnan. 1987. A theory of audit partnerships: Audit firm
size and fees. Journal of Accounting Research 25 (1): 111-126.
Balsam, S., J. Krishnan, and J. Yang. 2003. Auditor industry specialization and earnings quality.
Auditing: A Journal of Practice & Theory 22: 71-97.
Bedard, J.C., D.R. Deis, M.B. Curtis, and J.G. Jenkins. 2008. Risk monitoring and control in
audit firms: A research synthesis. Auditing: A Journal of Practice & Theory 27 (1): 187-
218.
Bell, T.B., M. Causholli, and W.R. Knechel. 2015. Audit firm tenure, non-audit services, and
internal assessments of audit quality. Journal of Accounting Research 53 (3): 461-509.
Bills, K.L., D.C. Jeter, and S.E. Stein. 2015. Auditor industry specialization and evidence of cost
efficiencies in homogenous industries. The Accounting Review 90 (5): 1721-1754.
Bowler, B. 2015. Are going concern opinions associated with lower audit impact? Working
paper.
Cairney, T.D., and G. R. Young. 2006. Homogenous industries and auditor specialization: An
indication of production economics. Auditing: A Journal of Practice & Theory 25 (1): 49-
67.
Causholli, M., and W.R. Knechel. 2012. An examination of the credence attributes of the audit.
Accounting Horizons 26 (4): 631-656.
Causholli, M., W.R. Knechel, H. Lin, and D.E.M. Sappington. 2013. Competitive procurement
of auditing services with limited information. European Accounting Review 22 (3): 573-
605.
Chen, C.-Y., C.-J. Lin, and Y.-C. Lin. 2008. Audit partner tenure, audit firm tenure, and
discretionary accruals: Does long auditor tenure impair earnings quality? Contemporary
Accounting Research 25 (2): 415-445.
Chen, S., S.Y. Sun, and D. Wu. 2010. Client Importance, Institutional Improvements, and Audit
Quality in China: An Office and Individual Auditor Level Analysis. The Accounting
Review 85 (1): 127-158.

39
Chevalier, J., and G. Ellison. 1997. Risk taking by mutual funds as a response to incentives.
Journal of Political Economy 105 (6): 1167-1200.
Chi, H.Y., and C.L. Chin. 2011. Firm versus partner measures of auditor industry expertise and
effects on auditor quality. Auditing, a Journal of Practice & Theory 30 (2): 201-229.
Choi, J.-H., C. Kim, J.-B. Kim, and Y. Zang. 2010. Audit office size, audit quality, and audit
pricing. Auditing: A Journal of Practice & Theory 29 (1): 73-97.
DeAngelo, L. E. 1981. Auditor Size and Audit Quality. Journal of Accounting and Economics 3:
1983-1999.
DeFond, M.L., and J. Zhang. 2014. A review of archival auditing research. Journal of
Accounting and Economics 58 (2-3): 275-326.
DeFond, M.L., D.H. Erkens, and J. Zhang. 2016. Does PSM really eliminate the Big N audit
quality effect? Working paper.
Demski, J.S., and D.E.M. Sappington. 1987. Delegated expertise. Journal of Accounting
Research 25 (1): 68-89.
Dehejia, R., and S. Wahba. 1999. Causal effects in nonexperimental studies: Reevaluating the
evaluation of training programs. Journal of the American Statistical Association 94 (4):
1053-1062.
Dehejia, R., and S. Wahba. 2002. Propensity score-matching methods for nonexperimental
causal studies. The Review of Economics and Statistics 84 (1): 151-161.
Domenighetti, G., A. Casbianca, F. Gutzwiller, and S. Martinolli. 1993. Revisiting the most
informed consumer of surgical services. International Journal of Technology Assessment in
Health Care 9: 505-513.
Donovan, J., Frankel, R., Lee, J., Martin, X., and H. Seo. 2014. Issues raised by studying
DeFond and Zhang: What should audit researchers do? Journal of Accounting and
Economics 58 (2-3): 327-338.
Dye, R. 1993. Auditing standards, legal liability, and auditor wealth. Journal of Political
Economy 101 (5): 887-914.
Emons, W. 1997. Credence goods and fraudulent experts. The RAND Journal of Economics 28
(1): 107-119.
Emons, W. 2001. Credence goods monopolists. International Journal of Industrial Organization
19: 375-389.
Ferguson, A., J.R. Francis, and D.J. Stokes. 2003. The effect of firm-wide and office-level
industry expertise on audit pricing. The Accounting Review 78 (2): 429-448.
Fiolleau, K., K. Hoang, K. Jamal, and S. Sunder. 2013. How do regulatory reforms to enhance
auditor independence work in practice? Contemporary Accounting Research 30 (3): 864-
890.
Francis, J. R., K. Reichelt, and D. Wang. 2005. The pricing of national and city-specific
reputations for industry expertise in the U.S. audit market. The Accounting Review 80:
113–136.
Francis, J. R., and M. Yu. 2009. The effect of Big 4 office size on audit quality. The Accounting
Review 84: 1521–1552.
Francis, J.R., and J.L. Gunn. 2015. Industry accounting complexity and earnings properties:
Does auditor industry expertise matter? Working paper.
40
Goodwin, J., and D. Wu. 2014. Is the effect of industry expertise on audit pricing an office-level
or a partner-level phenomenon? Review of Accounting Studies 19: 1532-1578.
Gul, F. A., D. Wu, and Z. Yang. 2013. Do individual auditors affect audit quality? Evidence
from archival data. The Accounting Review 88 (6): 1993-2023.
Hadfield, G.K. 2000. The price of law: How the market for lawyers distorts the justice system.
Working paper, University of Toronto.
Heckman, J., H. Ichimura, and P. Todd. 1997. Matching as an econometric evaluation estimator:
Evidence from evaluating a job training programme. The Review of Economic Studies 64
(4): 605-654.
Heckman, J., H. Ichimura, and P. Todd. 1998. Matching as an econometric evaluation estimator.
The Review of Economic Studies 65 (2): 261-294.
Hogan, C.E., and D.C. Jeter. 1999. Industry specialization by auditors. Auditing: A Journal of
Practice & Theory 18 (1): 1-17.
Hubbard, T.N. 1998. An empirical examination of moral hazard in the vehicle inspection market.
RAND Journal of Economics 29 (2): 406-426.
Iizuka, T. 2007. Experts’ agency problems: evidence from the prescription drug market in Japan.
The RAND Journal of Economics 38 (3): 844-862.
Iizuka, T. 2012. Physician agency and adoption of generic pharmaceutical. The American
Economic Review 102 (6): 2826-2858.
Kim, I. and D.J. Skinner. 2012. Measuring securities litigation risk. Journal of Accounting and
Economics 53: 290-310.
Knechel, W.R., A. Vanstraelen, and M. Zerni. 2015. Does the identity of engagement partners
matter? An analysis of audit partner reporting decisions. Contemporary Accounting
Research, Forthcoming.
Krishnan, G. 2003. Does Big 6 auditor industry expertise constrain earnings management?
Accounting Horizons 17: 1-16.
Kwon, S.Y. 1996. The impact of competition within the client’s industry on the auditor selection
decision. Auditing: A Journal of Practice & Theory 15 (1): 53-70.
Lawrence, A., M. Minutti-Meza, and P. Zhang. 2011. Can Big 4 versus non-big 4 differences in
audit-quality proxies be attributed to client characteristics? The Accounting Review 86 (1):
259-286.
Laurion, H., A. Lawrence, and J.P. Ryan. 2016. U.S. audit partner rotations. The Accounting
Review, Forthcoming.
Lennox, C., X. Wu, and T. Zhang. 2015. The effect of audit adjustments on earnings quality:
Evidence from China. Journal of Accounting and Economics 61 (2-3): 545-562.
Leuz, C., D. Nanda, and P.D. Wysocki. 2003. Earnings management and investor protection: an
international comparison. Journal of Financial Economics 69 (3): 505-527.
Levitt, S.D., and C. Syverson. 2008. Market distortions when agents are better informed: The
value of information in real estate transactions. The Review of Economics and Statistics 90
(4): 599-611.
McDaniel, L.S. 1990. The effects of time pressure and audit program structure on audit
performance. Journal of Accounting Research 28 (2): 267-285.

41
McKenna, F. 2015. Regulators issue competing proposals for audit partner disclosure.
MarketWatch, July 7.
Minutti-Meza, M. 2013. Does auditor industry specialization improve audit quality? Journal of
Accounting Research 51 (4): 779-817.
Neal, T., and R. Riley, Jr. 2004. Auditor industry specialist research design. Auditing: A Journal
of Practice and Theory 23: 169-177.
Palmrose, Z.-V. 1988. An Analysis of Auditor Litigation and Audit Service Quality. The
Accounting Review 63 (1): 55-73.
Patterson, G.A. 1992. Sear’s Brennan accepts blame for auto flap. Wall Street Journal, June 3,
pp B1 and B14.
PCAOB. 2007a. Orders instituting disciplinary proceedings, making findings, and imposing
sanctions in the matter of James L. Fazio, CPA, respondent. PCAOB Release No. 105-
2007-006.
PCAOB. 2007b. Orders instituting disciplinary proceedings, making findings, and imposing
sanctions in the matter of Stephen J. Nardi, CPA, respondent. PCAOB Release No. 105-
2007-008.
PCAOB. 2015. Improving the transparency of audits: Rules to require disclosure of certain audit
participants on a new PCAOB form and related amendments to auditing standards. PCAOB
release No. 2015-008. December 15.
Reichelt, K., and D. Wang. 2010. National and office-specific measures of auditor industry
expertise and effects on audit quality. Journal of Accounting Research 48: 647–686.
Reynolds, J. K., and J.R. Francis. 2001. Does size matter? The influence of large clients on
office-level auditor reporting decisions. Journal of Accounting and Economics 30: 375-
400.
Rosenbaum, P., and D. Rubin. 1983. The central role of the propensity score in observational
studies for causal effects. Biometrika 70 (1): 41-55.
Schmidt, J.J. 2012. Perceived auditor independence and audit litigation: The role of nonaudit
service fees. The Accounting Review 87 (3): 1033-1065.
Shipman, J.E., Q.T. Swanquist, and R.L. Whited. 2016. Propensity score matching in accounting
research. The Accounting Review Forthcoming.
Simunic, D.A. 1980. The pricing of audit services: Theory and evidence. Journal of Accounting
Research 18 (1): 161-190.
Simunic, D.A. 1984. Auditing, consulting, and auditor independence. Journal of Accounting
Research 22 (2): 679-702.
Zerni, M. 2012. Audit partner specialization and audit fees: Some evidence from Sweden.
Contemporary Accounting Research 29 (1): 312-340.

42
Appendix A: Variables Definitions
Variable Definition
Dependent Variables:
Restatement An indicator variable equal to one if financial statements for the year are restated
SmallProfits An indicator variable equal to one if the ROA (income before extraordinary items
deflated by beginning assets) is positive and less than 3%
PartIFinding An indicator variable equal to one if the inspection of a specific engagement resulted
in a Part I finding
ScaledAccrualsCFO Absolute value of accruals deflated by cash flow from operations
Logauditfees The logarithm of the engagement audit fees, from Audit Analytics
Logaudithours The logarithm of the audit hours spent on the engagement
Logpartnerhours The logarithm of the engagement partner audit hours
Rate_Per_Hour Total audit fees divided by total engagement hours
Explanatory Variables:
Expertise Total audit fees charged by the engagement partner in the client's Fama French 48
industries, divided by the total audit fees for the client's industry
Specialist An indicator variable equal to one when Expertise is above the 75th percentile of the
distribution
Seniority Number of years the engagement partner has been a partner
Expertise Portfolio Share Total audit fees charged by the engagement partner in the client's Fama French 48
industries, divided by the total audit fees charged by the engagement partner
Specialist Portfolio Share An indicator variable equal to one when Expertise Portfolio Share is above 75%
Auc_CPA Number of CPA holders on the audit committee of the issuer
Auc_Big4_Alumns Number of audit committee members that are Big 4 alumni
Control Variables:
Logat Logarithm of assets
Leverage Total debt divided by debt plus stockholder's equity
Loss Indicator variable equal to one when income before extraordinary items (IB) is
negative
BTM Book shareholder's equity deflated by fiscal year end market capitalization
ForeignPifo Absolute value of pretax income from foreign operations (PIFO) divided by the
absolute value of pretax income (PI)
Intangi Minus one times gross PP&E divided by assets
CATA Current assets divided by total assets
Quick Current assets less inventories divided by current liabilities
Geoseg Number of geographic segments
Busseg Number of business segments
StdSaleGrowth Standard deviation of the issuer's sales growth, computed over t-3 and t
DecYE An indicator variable equal to one when the fiscal year ends in December
CFOat Issuer's cash flows from operations deflated by beginning assets
StdCFOat Standard deviation of the issuer's cash flows from operations deflated by beginning
assets, computed over t-3 and t
AltmanZ Altman Z-score. Defined as [1.2 × (Working Capital/ Assets)] + [1.4 × (Retained
earnings / Assets)] + [3.3 × (Earnings Before Interest and Taxes / Assets)] + [0.6 ×
(Market value of equity / Book value of liabilities) + Sale/Assets]
Length_Relationship Number of years the auditor has continuously audited a given client (from Compustat)
SaleGrowth Year-on-year sales growth of the client firm
Weaknesses An indicator variable equal to one if the issuer reports a material weakness

43
Variable Definition
City_Leader An indicator variable equal to one if the auditor office is the largest in the core
business statistical area (CBSA) in terms of fees for the issuers's industry (defined at
the two-digit SIC code)
National_Leader An indicator variable equal to one if the auditor is the largest in terms of fees for the
issuer's industry (defined at the two-digit SIC code)
Office_Size Logarithm of the total office fees charged to clients during the year
High_Risk An indicator variable equal to one if the issuer is classified as higher risk by the audit
firm

44
Table 1: Sample Selection Process
This table presents the sample construction from the raw dataset obtained from the PCAOB.
Observations
PCAOB dataset of issuer-years audited by the Big 4 in 2008-2013 24,190
Less:
Non-operating companies (Mutual Funds, Pension Plans etc.) 5,235
Missing Partner Names 580
18,375
One-year Lagged Expertise Proxies Available 5,200
13,175
Missing variables 5,078
Final sample: Issuer-year observations 8,097

45
Table 2: Descriptive Statistics
This table presents the descriptive statistics. All the variables are defined in Appendix A.
Variables Observations Mean Stdev 25th
perc. 50th
perc. 75th
perc.
Restatement 8,097 0.107 0.310 0.000 0.000 0.000
SmallProfit 8,097 0.152 0.359 0.000 0.000 0.000
PartIFInding 502 0.363 0.481 0.000 0.000 1.000
ScaledAccrualsCFO 8,097 1.380 3.338 0.323 0.574 0.947
Logauditfees 8,097 14.255 0.972 13.585 14.144 14.858
Logaudithours 8,092 8.928 0.853 8.351 8.866 9.465
Logpartnerhours 3,369 5.706 0.682 5.247 5.704 6.160
Rate_Per_Hour 8,092 220.519 87.269 164.750 203.657 254.468
Expertise 8,097 0.018 0.046 0.002 0.006 0.016
Expertise Portfolio Share 8,097 0.573 0.386 0.214 0.598 1.000
Logat 8,097 7.085 1.791 5.828 7.054 8.286
Leverage 8,097 0.338 0.361 0.026 0.282 0.497
Loss 8,097 0.267 0.442 0.000 0.000 1.000
BTM 8,097 0.478 0.561 0.244 0.435 0.701
ForeignPifo 8,097 0.341 0.650 0.000 0.056 0.457
Intangi 8,097 -0.521 0.407 -0.787 -0.400 -0.192
City_Leader 8,097 0.607 0.488 0.000 1.000 1.000
National_Leader 8,097 0.326 0.469 0.000 0.000 1.000
Office_Size 8,097 17.574 1.158 16.843 17.723 18.496
CATA 8,097 0.470 0.243 0.273 0.464 0.654
Quick 8,097 2.177 2.154 1.017 1.516 2.462
Geoseg 8,097 2.740 2.483 1.000 2.000 4.000
Busseg 8,097 2.140 1.743 1.000 1.000 3.000
StdSaleGrowth 8,097 0.304 0.710 0.075 0.143 0.254
DecYE 8,097 0.715 0.452 0.000 1.000 1.000
StdCFOat 8,097 0.068 0.097 0.023 0.040 0.071
CFOat 8,097 0.078 0.169 0.049 0.096 0.150
AltmanZ 8,097 3.666 5.042 1.655 3.071 5.063
Length_Relationship 8,097 11.792 8.954 6.000 10.000 15.000
SaleGrowth 8,097 0.102 0.360 -0.030 0.060 0.172
Weaknesses 8,097 0.020 0.140 0.000 0.000 0.000
Auc_CPA 7,588 0.634 0.709 0.000 1.000 1.000
Auc_Big4_Alumns 7,588 0.506 0.566 0.000 0.000 1.000
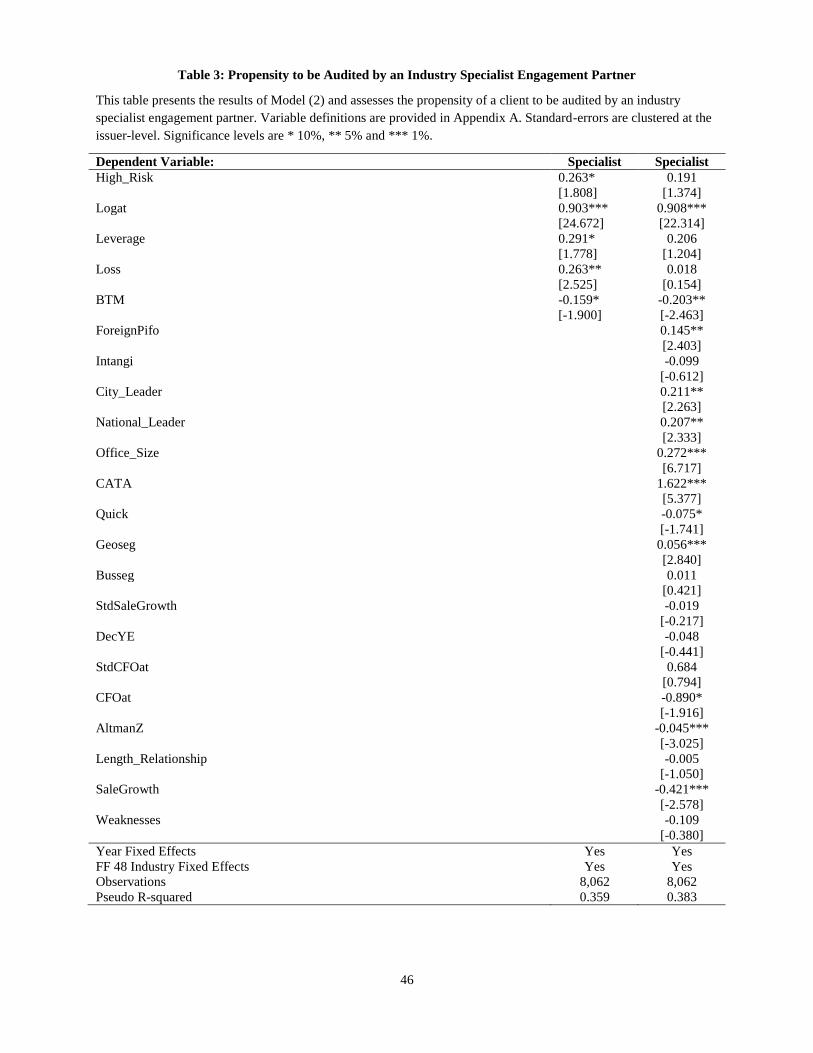
46
Table 3: Propensity to be Audited by an Industry Specialist Engagement Partner
This table presents the results of Model (2) and assesses the propensity of a client to be audited by an industry
specialist engagement partner. Variable definitions are provided in Appendix A. Standard-errors are clustered at the
issuer-level. Significance levels are * 10%, ** 5% and *** 1%.
Dependent Variable: Specialist Specialist
High_Risk 0.263* 0.191
[1.808] [1.374]
Logat 0.903*** 0.908***
[24.672] [22.314]
Leverage 0.291* 0.206
[1.778] [1.204]
Loss 0.263** 0.018
[2.525] [0.154]
BTM -0.159* -0.203**
[-1.900] [-2.463]
ForeignPifo 0.145**
[2.403]
Intangi -0.099
[-0.612]
City_Leader 0.211**
[2.263]
National_Leader 0.207**
[2.333]
Office_Size 0.272***
[6.717]
CATA 1.622***
[5.377]
Quick -0.075*
[-1.741]
Geoseg 0.056***
[2.840]
Busseg 0.011
[0.421]
StdSaleGrowth -0.019
[-0.217]
DecYE -0.048
[-0.441]
StdCFOat 0.684
[0.794]
CFOat -0.890*
[-1.916]
AltmanZ -0.045***
[-3.025]
Length_Relationship -0.005
[-1.050]
SaleGrowth -0.421***
[-2.578]
Weaknesses -0.109
[-0.380]
Year Fixed Effects Yes Yes
FF 48 Industry Fixed Effects Yes Yes
Observations 8,062 8,062
Pseudo R-squared 0.359 0.383

47
Table 4: Audit Fee Results
This table presents the results of Model (1) when using audit fee measures as the dependent variables. Variable
definitions are provided in Appendix A. The t-statistic (in parenthesis) is below the coefficient. Standard-errors are
clustered at the issuer-level. Significance levels are * 10%, ** 5% and *** 1%. OLS = Ordinary Least Squares;
PSM = Propensity Score Matching; FE = Fixed Effects
(1) OLS (2) OLS (3) PSM (4) OLS (5) OLS (6) PSM
Dependent
Variables:
Logaudit
fees
Logaudit
fees
Logaudit
fees
Rate_Per
_Hour
Rate_Per
_Hour
Rate_Per
_Hour
Expertise 2.910*** 2.301*** 231.384*** 189.367***
[7.493] [7.324] [4.884] [4.347]
Specialist 0.262*** 21.943***
[14.010] [6.714]
High_Risk 0.217*** 0.158*** 0.149*** -9.153** -10.109*** -16.312***
[8.201] [7.018] [4.626] [-2.488] [-2.746] [-2.845]
Logat 0.475*** 0.460*** 0.482*** 20.368*** 19.391*** 21.435***
[68.753] [62.085] [45.803] [17.761] [14.646] [10.369]
Leverage -0.007 0.025 0.021 -14.902*** -7.468** -7.502
[-0.212] [0.829] [0.419] [-4.012] [-1.971] [-1.248]
Loss 0.151*** 0.088*** 0.052** 7.493*** 1.811 0.142
[7.937] [5.281] [1.999] [2.690] [0.627] [0.030]
BTM -0.051*** -0.041** -0.047* -8.026*** -7.052*** -8.957**
[-2.793] [-2.437] [-1.681] [-3.414] [-2.945] [-2.517]
ForeignPifo 0.108*** 0.106*** 3.966* 3.673
[10.470] [7.692] [1.960] [1.468]
Intangi 0.142*** 0.179*** 9.117** 21.219***
[5.111] [4.376] [1.970] [3.034]
City_Leader 0.082*** 0.092*** 11.398*** 14.352***
[4.924] [3.777] [3.984] [3.152]
National_Leader 0.005 0.007 2.090 6.682*
[0.335] [0.327] [0.762] [1.661]
Office_Size 0.079*** 0.064*** 6.198*** 5.288***
[10.819] [6.252] [5.274] [2.962]
CATA 0.629*** 0.617*** 22.802** 6.761
[10.888] [6.926] [2.468] [0.416]
Quick -0.043*** -0.065*** 1.212 1.921
[-9.663] [-6.561] [1.644] [1.031]
Geoseg 0.027*** 0.021*** 0.919 1.387
[6.619] [4.334] [1.281] [1.339]
Busseg 0.024*** 0.021*** 1.610* 2.476**
[4.774] [3.381] [1.692] [1.994]
StdSaleGrowth -0.008 -0.001 -2.772 0.027
[-0.670] [-0.047] [-1.525] [0.006]
DecYE 0.022 0.020 -5.222 -8.864*
[1.094] [0.714] [-1.592] [-1.733]
StdCFOat -0.103 -0.131 9.999 -28.936
[-1.099] [-0.560] [0.639] [-0.876]
CFOat -0.244*** -0.310** -36.423*** -3.327
[-4.311] [-2.410] [-3.698] [-0.151]
AltmanZ -0.006*** -0.006 -0.129 -0.251
[-2.742] [-1.121] [-0.432] [-0.403]

48
Length_Relationship 0.001 0.003** 0.502*** 0.855***
[0.675] [2.045] [2.836] [3.502]
SaleGrowth -0.051*** -0.086*** -1.219 -10.158*
[-3.216] [-2.683] [-0.461] [-1.822]
Weaknesses 0.284*** 0.368*** -2.200 6.055
[6.495] [5.309] [-0.291] [0.444]
Year Fixed Effects Yes Yes Yes Yes Yes Yes
FF 48 Industry Fixed Effects Yes Yes Yes Yes Yes Yes
Observations 8,097 8,097 4,048 8,092 8,092 4,045
Adjusted R-squared 0.768 0.814 0.794 0.213 0.235 0.283
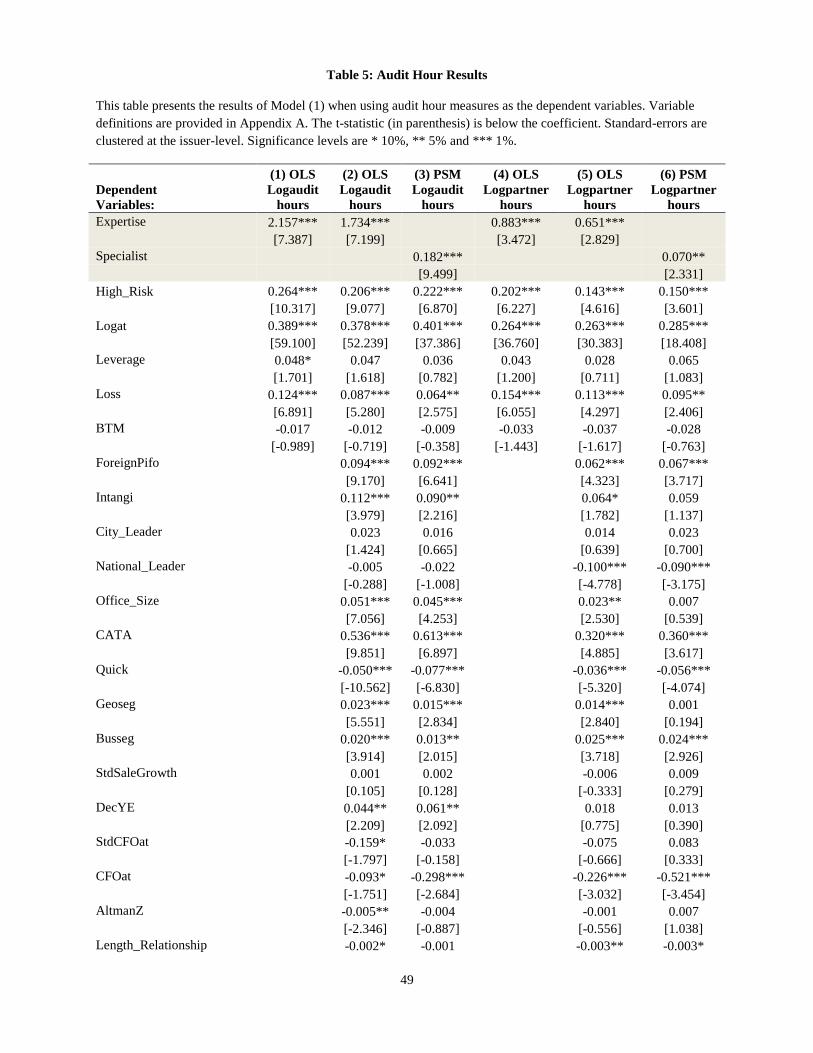
49
Table 5: Audit Hour Results
This table presents the results of Model (1) when using audit hour measures as the dependent variables. Variable
definitions are provided in Appendix A. The t-statistic (in parenthesis) is below the coefficient. Standard-errors are
clustered at the issuer-level. Significance levels are * 10%, ** 5% and *** 1%.
(1) OLS (2) OLS (3) PSM (4) OLS (5) OLS (6) PSM
Dependent
Variables:
Logaudit
hours
Logaudit
hours
Logaudit
hours
Logpartner
hours
Logpartner
hours
Logpartner
hours
Expertise 2.157*** 1.734*** 0.883*** 0.651***
[7.387] [7.199] [3.472] [2.829]
Specialist 0.182*** 0.070**
[9.499] [2.331]
High_Risk 0.264*** 0.206*** 0.222*** 0.202*** 0.143*** 0.150***
[10.317] [9.077] [6.870] [6.227] [4.616] [3.601]
Logat 0.389*** 0.378*** 0.401*** 0.264*** 0.263*** 0.285***
[59.100] [52.239] [37.386] [36.760] [30.383] [18.408]
Leverage 0.048* 0.047 0.036 0.043 0.028 0.065
[1.701] [1.618] [0.782] [1.200] [0.711] [1.083]
Loss 0.124*** 0.087*** 0.064** 0.154*** 0.113*** 0.095**
[6.891] [5.280] [2.575] [6.055] [4.297] [2.406]
BTM -0.017 -0.012 -0.009 -0.033 -0.037 -0.028
[-0.989] [-0.719] [-0.358] [-1.443] [-1.617] [-0.763]
ForeignPifo 0.094*** 0.092*** 0.062*** 0.067***
[9.170] [6.641] [4.323] [3.717]
Intangi 0.112*** 0.090** 0.064* 0.059
[3.979] [2.216] [1.782] [1.137]
City_Leader 0.023 0.016 0.014 0.023
[1.424] [0.665] [0.639] [0.700]
National_Leader -0.005 -0.022 -0.100*** -0.090***
[-0.288] [-1.008] [-4.778] [-3.175]
Office_Size 0.051*** 0.045*** 0.023** 0.007
[7.056] [4.253] [2.530] [0.539]
CATA 0.536*** 0.613*** 0.320*** 0.360***
[9.851] [6.897] [4.885] [3.617]
Quick -0.050*** -0.077*** -0.036*** -0.056***
[-10.562] [-6.830] [-5.320] [-4.074]
Geoseg 0.023*** 0.015*** 0.014*** 0.001
[5.551] [2.834] [2.840] [0.194]
Busseg 0.020*** 0.013** 0.025*** 0.024***
[3.914] [2.015] [3.718] [2.926]
StdSaleGrowth 0.001 0.002 -0.006 0.009
[0.105] [0.128] [-0.333] [0.279]
DecYE 0.044** 0.061** 0.018 0.013
[2.209] [2.092] [0.775] [0.390]
StdCFOat -0.159* -0.033 -0.075 0.083
[-1.797] [-0.158] [-0.666] [0.333]
CFOat -0.093* -0.298*** -0.226*** -0.521***
[-1.751] [-2.684] [-3.032] [-3.454]
AltmanZ -0.005** -0.004 -0.001 0.007
[-2.346] [-0.887] [-0.556] [1.038]
Length_Relationship -0.002* -0.001 -0.003** -0.003*

50
[-1.903] [-0.518] [-2.261] [-1.838]
SaleGrowth -0.049*** -0.051* -0.008 -0.166***
[-3.140] [-1.758] [-0.267] [-2.784]
Weaknesses 0.326*** 0.380*** 0.353*** 0.356***
[8.544] [5.870] [6.252] [3.407]
Year Fixed Effects Yes Yes Yes Yes Yes Yes
FF 48 Industry Fixed Effects Yes Yes Yes Yes Yes Yes
Observations 8,092 8,092 4,045 3,369 3,369 1,689
Adjusted R-squared 0.713 0.756 0.702 0.469 0.507 0.470

51
Table 6: Audit Quality Results – Restatements and Part I Findings
This table presents the results of Model (1) when using audit quality measures (Restatement and PartIFinding) as
the dependent variables. Variable definitions are provided in Appendix A. The t-statistic (in parenthesis) is below
the coefficient. Standard-errors are clustered at the issuer-level. Significance levels are * 10%, ** 5% and *** 1%.
(1) OLS (2) OLS (3) PSM (4) OLS (5) OLS (6) PSM
Dependent
Variables:
Restate
ment
Restate
ment
Restate
ment
PartI
Finding
PartI
Finding
PartI
Finding
Expertise 0.014 0.014 0.947 0.951
[0.135] [0.132] [1.064] [1.086]
Specialist 0.001 0.061
[0.087] [0.967]
High_Risk 0.036** 0.028* 0.044* -0.102 -0.120 -0.073
[2.268] [1.745] [1.831] [-1.404] [-1.605] [-0.667]
Logat 0.004 -0.001 -0.003 -0.013 -0.003 0.026
[1.164] [-0.188] [-0.503] [-0.767] [-0.144] [0.926]
Leverage 0.059*** 0.051*** 0.064** 0.110 0.076 -0.087
[3.809] [3.029] [2.340] [1.306] [0.717] [-0.649]
Loss -0.001 0.002 -0.003 -0.080 -0.115* -0.098
[-0.112] [0.196] [-0.191] [-1.409] [-1.808] [-1.092]
BTM 0.040*** 0.036*** 0.053*** 0.095** 0.082* -0.025
[5.211] [4.819] [4.736] [2.280] [1.840] [-0.350]
ForeignPifo 0.008 0.012 0.017 0.068
[1.091] [1.235] [0.481] [1.522]
Intangi 0.039** 0.050** 0.064 0.142
[2.341] [2.027] [0.781] [1.235]
City_Leader -0.009 -0.008 0.024 0.030
[-0.908] [-0.507] [0.461] [0.398]
National_Leader 0.020* 0.029** 0.020 0.040
[1.954] [2.105] [0.422] [0.655]
Office_Size -0.006 -0.009 0.013 -0.024
[-1.270] [-1.258] [0.606] [-0.887]
CATA -0.089*** -0.070 0.050 0.127
[-2.928] [-1.453] [0.342] [0.594]
Quick 0.002 0.002 0.038 0.053
[0.770] [0.273] [1.647] [1.352]
Geoseg 0.003 0.004 -0.010 -0.009
[1.302] [1.131] [-0.968] [-0.768]
Busseg 0.006* 0.006 0.006 0.008
[1.769] [1.492] [0.431] [0.493]
StdSaleGrowth -0.005 0.013 -0.089 -0.147
[-0.793] [0.891] [-1.481] [-1.377]
DecYE 0.015 0.032** -0.061 -0.006
[1.286] [1.970] [-1.170] [-0.079]
StdCFOat 0.075 0.079 0.192 0.708
[1.463] [0.687] [0.503] [1.122]
CFOat 0.005 -0.073 -0.022 -0.530
[0.147] [-1.015] [-0.087] [-1.236]
AltmanZ -0.001 -0.000 -0.016** -0.030***
[-0.747] [-0.005] [-2.230] [-3.817]
Length_Relationship -0.000 0.001 -0.004* -0.006*

52
[-0.080] [1.038] [-1.708] [-1.873]
SaleGrowth 0.025** 0.017 -0.007 -0.046
[2.518] [0.677] [-0.099] [-0.312]
Weaknesses 0.102*** 0.097* 0.212 0.104
[3.087] [1.940] [1.273] [0.349]
Year Fixed Effects Yes Yes Yes Yes Yes Yes
FF 48 Industry Fixed Effects Yes Yes Yes Yes Yes Yes
Observations 8,097 8,097 4,048 502 502 307
Adjusted R-squared 0.022 0.029 0.045 0.049 0.048 0.080

53
Table 7: Audit Quality Results – Meet/Beat and Accruals
This table presents the results of Model (1) when using audit quality measures (SmallProfit and
ScaledAccrualsCFO) as the dependent variables. Variable definitions are provided in Appendix A. The t-statistic (in
parenthesis) is below the coefficient. Standard-errors are clustered at the issuer-level. Significance levels are * 10%,
** 5% and *** 1%.
(1) OLS (2) OLS (3) PSM (4) OLS (5) OLS (6) PSM
Dependent
Variables:
Small
Profit
Small
Profit
Small
Profit
Scaled
AccrualsCFO
Scaled
AccrualsCFO
Scaled
AccrualsCFO
Expertise -0.148 -0.141 -0.355 -0.158
[-1.256] [-1.235] [-0.531] [-0.233]
Specialist 0.006 -0.092
[0.432] [-1.026]
High_Risk -0.010 -0.018 0.007 0.741*** 0.784*** 0.854***
[-0.695] [-1.196] [0.299] [3.716] [3.816] [3.178]
Logat 0.008*** 0.005 0.001 -0.076*** -0.092*** -0.041
[2.619] [1.382] [0.207] [-3.085] [-3.325] [-0.936]
Leverage 0.133*** 0.101*** 0.130*** 0.371** 0.404** 0.414*
[8.547] [6.336] [4.989] [2.455] [2.302] [1.889]
Loss
2.344*** 2.575*** 2.363***
[17.850] [17.127] [11.010]
BTM 0.114*** 0.097*** 0.106*** 0.285* 0.323** 0.155
[11.693] [10.134] [7.909] [1.957] [2.130] [0.738]
ForeignPifo 0.087*** 0.087*** -0.238*** -0.218***
[9.171] [6.561] [-4.485] [-3.114]
Intangi -0.027 -0.021 0.027 0.130
[-1.619] [-0.834] [0.192] [0.865]
City_Leader -0.013 -0.023 0.031 -0.068
[-1.298] [-1.481] [0.352] [-0.673]
National_Leader -0.002 -0.006 -0.024 0.061
[-0.171] [-0.444] [-0.290] [0.634]
Office_Size -0.004 -0.010 0.047 0.080*
[-1.029] [-1.381] [1.392] [1.875]
CATA -0.100*** -0.143*** 0.776*** 0.093
[-3.494] [-2.763] [2.914] [0.282]
Quick 0.005** 0.018** -0.057** -0.019
[2.148] [2.463] [-2.071] [-0.319]
Geoseg -0.007*** -0.004 0.013 -0.001
[-3.235] [-1.481] [0.766] [-0.072]
Busseg 0.005* 0.007* 0.008 -0.018
[1.776] [1.865] [0.354] [-0.656]
StdSaleGrowth -0.010** -0.026* -0.051 -0.212*
[-2.041] [-1.770] [-0.653] [-1.878]
DecYE 0.020* 0.009 0.102 0.026
[1.878] [0.569] [1.159] [0.240]
StdCFOat -0.085** -0.093 -1.994*** -1.027
[-2.471] [-0.896] [-3.517] [-1.000]
CFOat -0.129*** -0.234*** 1.149*** -1.745***
[-5.955] [-3.726] [3.406] [-2.283]
AltmanZ 0.000 -0.004 -0.002 0.009
[0.139] [-1.628] [-0.173] [0.466]

54
(1) OLS (2) OLS (3) PSM (4) OLS (5) OLS (6) PSM
Dependent
Variables:
Small
Profit
Small
Profit
Small
Profit
Scaled
AccrualsCFO
Scaled
AccrualsCFO
Scaled
AccrualsCFO
Length_Relationship -0.001** -0.002** -0.004 -0.004
[-2.565] [-2.195] [-1.212] [-1.010]
SaleGrowth -0.005 -0.033 0.156 0.024
[-0.652] [-1.465] [1.067] [0.090]
Weaknesses 0.033 0.000 -0.087 -0.196
[1.079] [0.009] [-0.283] [-0.422]
Year FE Yes Yes Yes Yes Yes Yes
FF 48 Industry FE Yes Yes Yes Yes Yes Yes
Observations 8,097 8,097 4,048 8,097 8,097 4,048
Adjusted R-squared 0.090 0.116 0.136 0.118 0.125 0.149

55
Table 8: Seniority Analyses
This table presents the results of Model (1), adding another variable proxying for partner expertise: Seniority. Panel A presents the results for audit fees and hours, and
Panel B for audit quality variables. Variable definitions are provided in Appendix A. For brevity, the coefficients on the control variables are not reported. The t-
statistic (in parenthesis) is below the coefficient. Standard-errors are clustered at the issuer-level. Significance levels are * 10%, ** 5% and *** 1%.
Panel A
(1) OLS (2) PSM (3) OLS (4) PSM (5) OLS (6) PSM (7) OLS (8) PSM
Dependent
Variables:
Logaudit
fees
Logaudit
fees
Rate_Per
_Hour
Rate_Per
_Hour
Logaudit
hours
Logaudit
hours
Logpartner
hours
Logpartner
hours
Expertise / Specialist 2.238*** 0.254*** 189.970*** 23.630*** 1.665*** 0.167*** 0.717*** 0.074**
[7.291] [13.123] [4.212] [6.708] [7.242] [8.227] [2.985] [2.417]
Seniority 0.004*** 0.007*** -0.019 0.277 0.006*** 0.006*** -0.007*** -0.006**
[3.065] [3.699] [-0.076] [0.781] [4.067] [3.302] [-3.760] [-2.078]
Control Variables Full Set Full Set Full Set Full Set Full Set Full Set Full Set Full Set
Year Fixed Effects Yes Yes Yes Yes Yes Yes Yes Yes
Industry Fixed Effects Yes Yes Yes Yes Yes Yes Yes Yes
Observations 7,103 3,476 7,098 3,473 7,098 3,473 3,319 1,663
Adjusted R-squared 0.816 0.805 0.235 0.301 0.759 0.710 0.513 0.475
Panel B
(1) OLS (2) PSM (3) OLS (4) PSM (5) OLS (6) PSM (7) OLS (8) PSM
Dependent
Variables:
Restate
ment
Restate
ment
PartI
Finding
PartI
Finding
Small
Profit
Small
Profit
Scaled
AccrualsCFO
Scaled
AccrualsCFO
Expertise / Specialist -0.017 0.002 0.257 0.038 -0.166 0.004 -0.277 -0.096
[-0.169] [0.160] [0.286] [0.529] [-1.435] [0.273] [-0.359] [-1.009]
Seniority 0.001 0.001 0.003 0.002 0.001 0.001 0.011 0.012
[0.816] [0.783] [0.673] [0.295] [1.461] [0.860] [1.348] [1.249]
Control Variables Full Set Full Set Full Set Full Set Full Set Full Set Full Set Full Set
Year Fixed Effects Yes Yes Yes Yes Yes Yes Yes Yes
Industry Fixed Effects Yes Yes Yes Yes Yes Yes Yes Yes
Observations 7,103 3,476 409 245 7,103 3,512 7,103 3,476
Adjusted R-squared 0.031 0.049 0.038 0.092 0.112 0.132 0.124 0.150
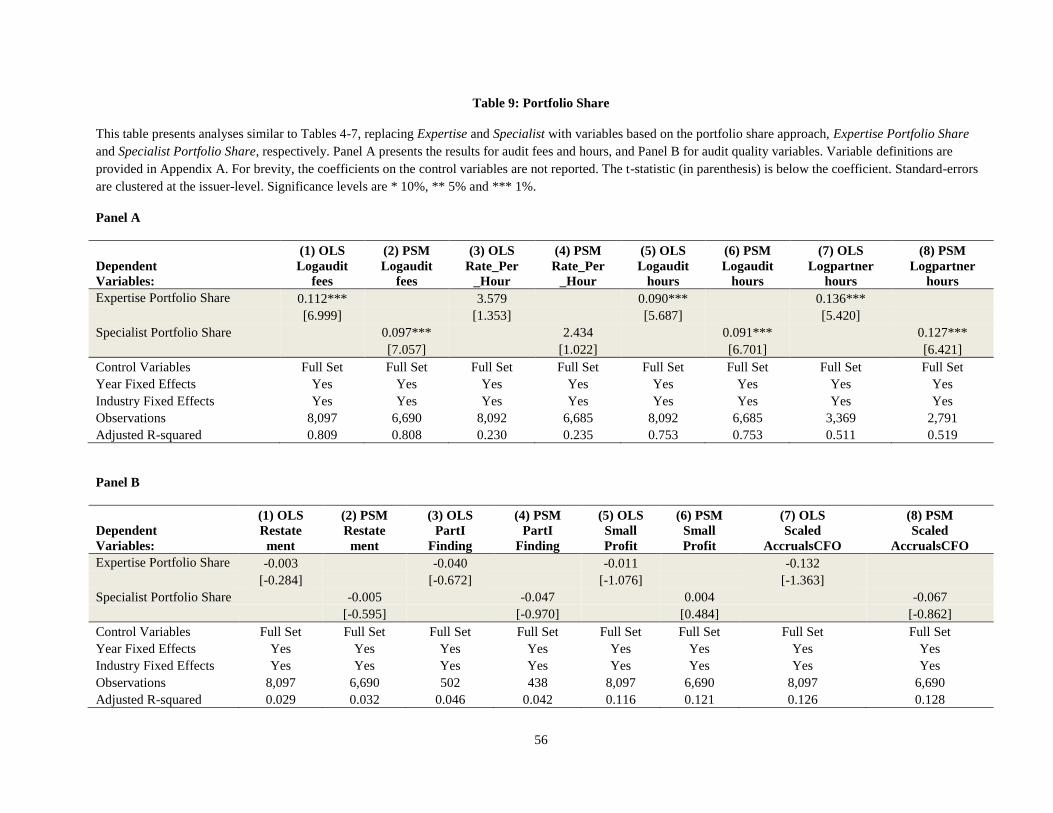
56
Table 9: Portfolio Share
This table presents analyses similar to Tables 4-7, replacing Expertise and Specialist with variables based on the portfolio share approach, Expertise Portfolio Share
and Specialist Portfolio Share, respectively. Panel A presents the results for audit fees and hours, and Panel B for audit quality variables. Variable definitions are
provided in Appendix A. For brevity, the coefficients on the control variables are not reported. The t-statistic (in parenthesis) is below the coefficient. Standard-errors
are clustered at the issuer-level. Significance levels are * 10%, ** 5% and *** 1%.
Panel A
(1) OLS (2) PSM (3) OLS (4) PSM (5) OLS (6) PSM (7) OLS (8) PSM
Dependent
Variables:
Logaudit
fees
Logaudit
fees
Rate_Per
_Hour
Rate_Per
_Hour
Logaudit
hours
Logaudit
hours
Logpartner
hours
Logpartner
hours
Expertise Portfolio Share 0.112***
3.579
0.090***
0.136***
[6.999]
[1.353]
[5.687]
[5.420]
Specialist Portfolio Share 0.097*** 2.434 0.091*** 0.127***
[7.057] [1.022] [6.701] [6.421]
Control Variables Full Set Full Set Full Set Full Set Full Set Full Set Full Set Full Set
Year Fixed Effects Yes Yes Yes Yes Yes Yes Yes Yes
Industry Fixed Effects Yes Yes Yes Yes Yes Yes Yes Yes
Observations 8,097 6,690 8,092 6,685 8,092 6,685 3,369 2,791
Adjusted R-squared 0.809 0.808 0.230 0.235 0.753 0.753 0.511 0.519
Panel B
(1) OLS (2) PSM (3) OLS (4) PSM (5) OLS (6) PSM (7) OLS (8) PSM
Dependent
Variables:
Restate
ment
Restate
ment
PartI
Finding
PartI
Finding
Small
Profit
Small
Profit
Scaled
AccrualsCFO
Scaled
AccrualsCFO
Expertise Portfolio Share -0.003
-0.040
-0.011
-0.132
[-0.284]
[-0.672]
[-1.076]
[-1.363]
Specialist Portfolio Share -0.005 -0.047 0.004 -0.067
[-0.595] [-0.970] [0.484] [-0.862]
Control Variables Full Set Full Set Full Set Full Set Full Set Full Set Full Set Full Set
Year Fixed Effects Yes Yes Yes Yes Yes Yes Yes Yes
Industry Fixed Effects Yes Yes Yes Yes Yes Yes Yes Yes
Observations 8,097 6,690 502 438 8,097 6,690 8,097 6,690
Adjusted R-squared 0.029 0.032 0.046 0.042 0.116 0.121 0.126 0.128

57
Table 10: Audit Committee Regressions
This table presents analyses similar to Tables 4-7, augmenting the explanatory variables with interactions with the number of CPAs and Big 4 alumni on the audit
committee, respectively. Panel A presents the results for audit fees and hours, and Panel B for audit quality variables. Variable definitions are provided in Appendix A.
For brevity, the coefficients on the control variables are not reported. The t-statistic (in parenthesis) is below the coefficient. Standard-errors are clustered at the issuer-
level. Significance levels are * 10%, ** 5% and *** 1%.
Panel A
(1) (2) (3) (4) (5) (6) (7) (8)
Dependent Variables:
Logaudit
fees
Logaudit
fees
Rate_Per
_Hour
Rate_Per
_Hour
Logaudit
hours
Logaudit
hours
Logpartner
hours
Logpartner
hours
Expertise 2.588*** 2.303*** 219.571*** 257.028*** 2.009*** 1.512*** 0.934*** 0.679**
[5.615] [6.185] [3.351] [3.687] [5.902] [5.647] [3.059] [2.125]
Auc_CPA -0.017 0.617 -0.019 -0.013
[-1.356] [0.317] [-1.595] [-0.859]
Expertise × Auc_CPA -0.415 -40.431 -0.387* -0.275
[-1.510] [-1.042] [-1.859] [-1.509]
Auc_Big4_Alumns 0.041*** 0.816 0.035** 0.033*
[2.618] [0.334] [2.271] [1.692]
Expertise × Auc_Big4_Alumns -0.139 -129.188** 0.286 -0.028
[-0.392] [-2.001] [0.919] [-0.077]
Control Variables Full Set Full Set Full Set Full Set Full Set Full Set Full Set Full Set
Year Fixed Effects Yes Yes Yes Yes Yes Yes Yes Yes
Industry Fixed Effects Yes Yes Yes Yes Yes Yes Yes Yes
Observations 7,588 7,588 7,584 7,584 7,584 7,584 3,155 3,155
Adjusted R-squared 0.817 0.817 0.239 0.240 0.761 0.761 0.502 0.502

58
Panel B
(1) (2) (3) (4) (5) (6) (7) (8)
Dependent Variables:
Restate
ment
Restate
ment
PartI
Finding
PartI
Finding
Small
Profit
Small
Profit
Scaled
AccrualsCFO
Scaled
AccrualsCFO
Expertise 0.048 0.016 0.690 0.773 -0.093 -0.083 -0.145 0.290
[0.346] [0.116] [0.553] [0.582] [-0.555] [-0.479] [-0.184] [0.339]
Auc_CPA 0.006 -0.026 0.003 0.028
[0.838] [-0.687] [0.493] [0.539]
Expertise × Auc_CPA -0.030 0.594 0.007 -0.581
[-0.389] [0.439] [0.082] [-0.693]
Auc_Big4_Alumns 0.002 -0.057 0.001 0.092
[0.247] [-1.156] [0.067] [1.271]
Expertise × Auc_Big4_Alumns 0.011 0.472 -0.008 -1.684
[0.050] [0.329] [-0.042] [-1.571]
Control Variables Full Set Full Set Full Set Full Set Full Set Full Set Full Set Full Set
Year Fixed Effects Yes Yes Yes Yes Yes Yes Yes Yes
Industry Fixed Effects Yes Yes Yes Yes Yes Yes Yes Yes
Observations 7,588 7,588 463 463 7,588 7,588 7,588 7,588
Adjusted R-squared 0.029 0.029 0.028 0.030 0.120 0.120 0.126 0.126