does biochar deliver carbon- negative energy? · does biochar deliver carbon-negative energy? ......
TRANSCRIPT

Johannes LehmannDepartment of Crop and Soil SciencesCornell University
Does Biochar Deliver Carbon-Negative Energy?

Terra Preta de Indio©
J. M
ajor
, 200
3
“Terra Preta”‘normal’ soil
Terra Preta
‘normal’ soil
(Central Amazon, Brazil)
©B
Gla
ser
2001
500 to 8,000 years BP

The Discovery of Terra Preta

What is biochar?
Schmidt and Noak, 2000, Global BiogeochemCycles 14, 777-793
Knicker, 2007, Biogeochem 85, 91-118
Complete chemical change during heating in absence of air (pyrolysis)

Natural Occurrence

“Natural” Biochar Abundance in Soils
NSA Lead ProfilesQLD TransectDWN TransectMajor Australian CitiesKatherineDaly Waters
0
5
10
15
20
25
30
35
10203040506070 80 90100 NSA (N=58)QLD (N=114)
DWN (N=280)
N
umbe
r of s
oils
(% o
f all
test
ed s
oils
)
Black Carbon (% of total organic C)
Average≈20%(n=452)
34Gt SOC (0-1m)(Grace et al., 2006, Carbon Balance and Management 1,14)
20% ≈ 7Gt0.1Gt CE /yr fossil fuel(Department of Climate Care, 2008)
Lehmann et al, 2008, Nature Geoscience 1, 832 - 835

Biochar Abundance in World Soils
Krull et al, 2008, in: Nova Sci Publ
(World Soils Archive of ISRIC)
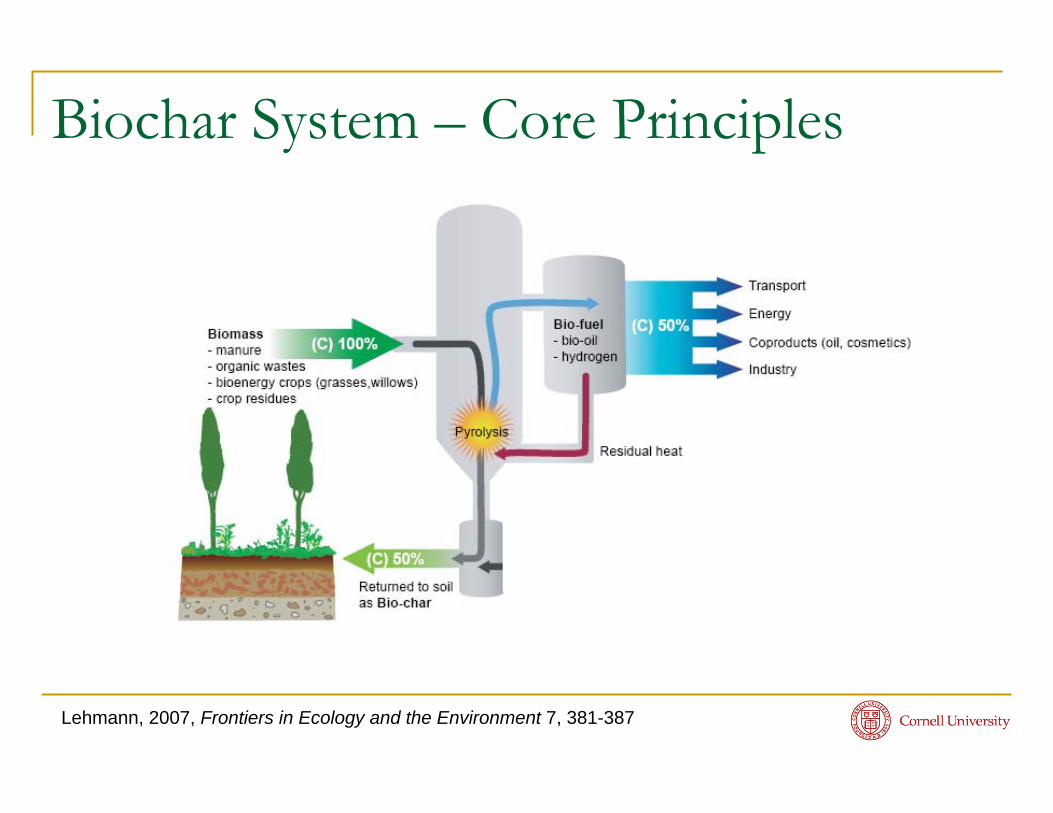
Biochar System – Core Principles
Lehmann, 2007, Frontiers in Ecology and the Environment 7, 381-387

Biochar System – Core Principles
Lehmann, 2009, Springer
Pyrolysis40-55%carbon
75-90%carbon
75% mass loss
50% carbon loss
BIOMASS BIOCHAR
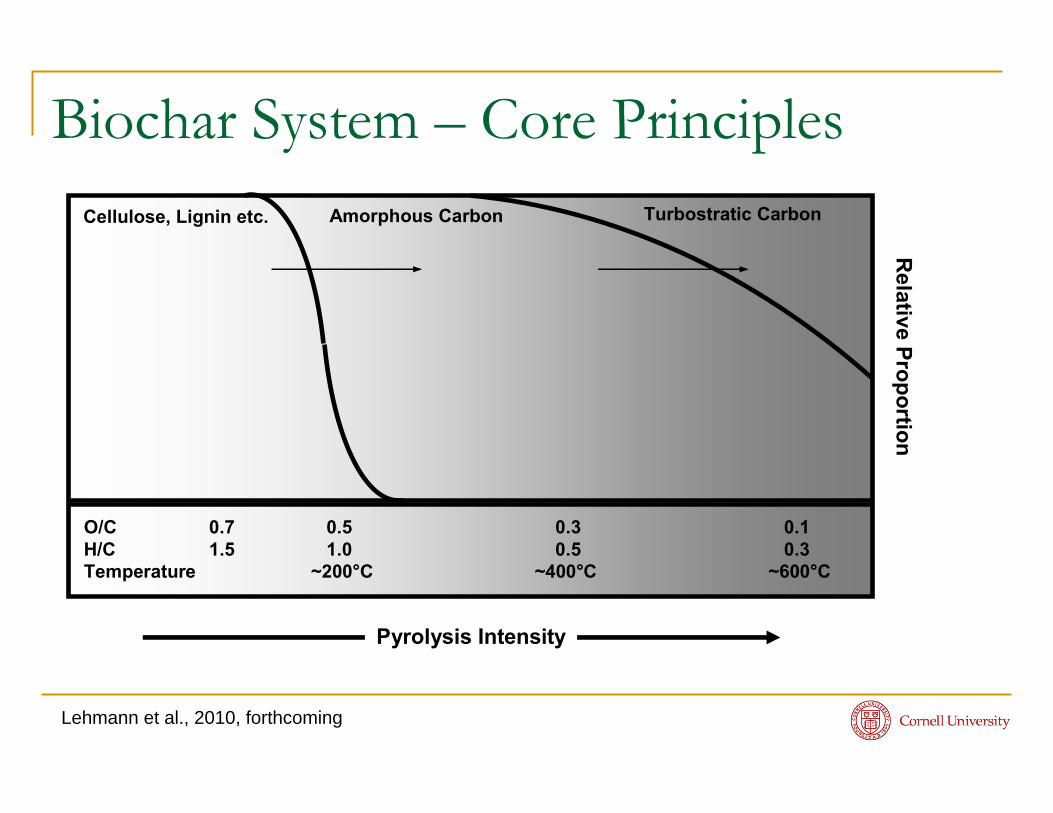
Biochar System – Core Principles
Lehmann et al., 2010, forthcoming
H2OCO, CO2, CH4volatile organics O
O
OH
O O
O
OCH2
OH
OHOH
O OH
OH
O
OH
O+ CH3
HO
CH+
O
OH
O
OH
HOHO
OH
OHO
OOH
OH
OH
n
O
H
HH
H
OH
H OH
O
OH
O OH
H
HH
OH
H
OH
OH
OH
Cellulose, Lignin etc. Amorphous Carbon Turbostratic Carbon
O/C 0.7 0.5 0.3 0.1H/C 1.5 1.0 0.5 0.3Temperature ~200°C ~400°C ~600°C
Relative Proportion
Pyrolysis Intensity

Biochar Stability and Stabilization Mechanisms

Biochar Stability and StabilizationChemical stability + particulate nature
(a) (b)
(c) (d)
Lehmann et al, 2008, Nature Geoscience 1, 238-242Lehmann et al, 2009, in: Earthscan Publ
10 μm
Total Carbon Black Carbon

Biochar Stability and Stabilization
Saturation (Six et al, 2002, Plant and Soil 241: 155-176)
C Input
C in
Soi
l Ordinary organic matter(plant residues, manures, compost)
Biochar

Days
0 100 200 300 400 500
C m
iner
aliz
atio
n [m
g C
O2-
C g
-1 C
]
0
50
100
150
200 HAT ACUDS
Open = Adjacent soilFilled = Anthrosol
LSD=0.05
BC-poorsoils
BC-rich soils
Biochar Stability
Liang et al., 2008, Geochimica et Cosmochimica Acta72, 6096-6078
(N=3; BC age ranges from 800 to 7,000 years)
(Terra PretaCentral AmazonDefined period of BC accumulation)
Mean residence time of 4035 yrs at 10°C MAT
0 30 60 90 120 150 180
0 30 60 90 120 150 180
0
10
20
30
40
50
60
0 30 60 90 120 150 180
0
10
20
30
40
50
60
0 30 60 90 120 150 180
0
40
80
120
160
200
0 30 60 90 120 150 180
0
40
80
120
160
200
0 30 60 90 120 150 180
0
40
80
120
160
200
0
10
20
30
40
50
60
0 30 60 90 120 150 180
0
10
20
30
40
50
60(a) ME (b) NY
(c) PA-1 (d) OH
(e) TN (f) GA
(g) AL
BC-containing soilAdjacent soil
Days
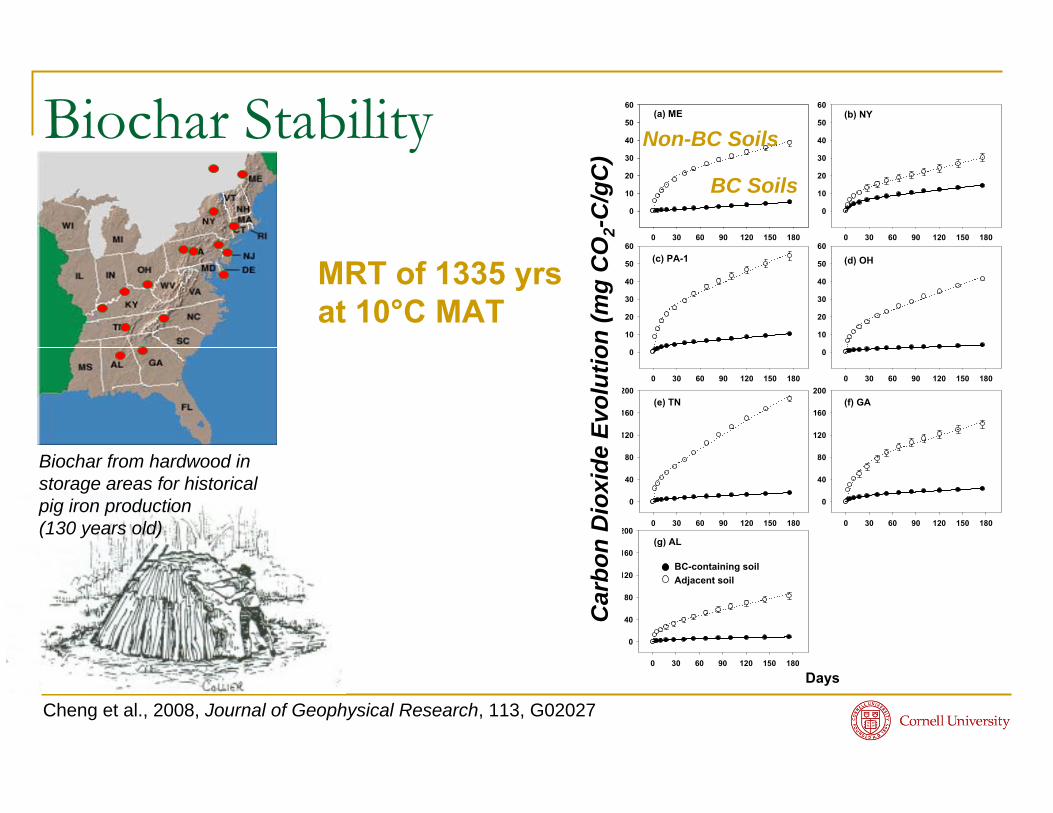
Biochar StabilityBC Soils
Cheng et al., 2008, Journal of Geophysical Research, 113, G02027
Non-BC Soils
Car
bon
Dio
xide
Evo
lutio
n (m
g C
O2-
C/g
C)
Biochar from hardwood in storage areas for historical pig iron production(130 years old)
MRT of 1335 yrsat 10°C MAT

Biochar Stability
Lehmann et al, 2008, Nature Geoscience 1, 832 - 835
Time
Soi
l car
bon
(Mg
ha-1 0
.3m
-1)
0
10
20
30
40
No BC formationBC formation but no BC disappearanceBC formation with fitted BC disappearance
BC
non-BC
modelled
mea
sure
d
Inceptisols (Northern Territory, Australia)13 and 15 profiles27°C MAT, 887 mm MAPGrass vegetation under varying assumptions of burning severity and BC formationModel run to equilibrium (for BC MRT to 1m)
MRT of 1300 and 2600 yrs(718-9259) at 28°C MAT
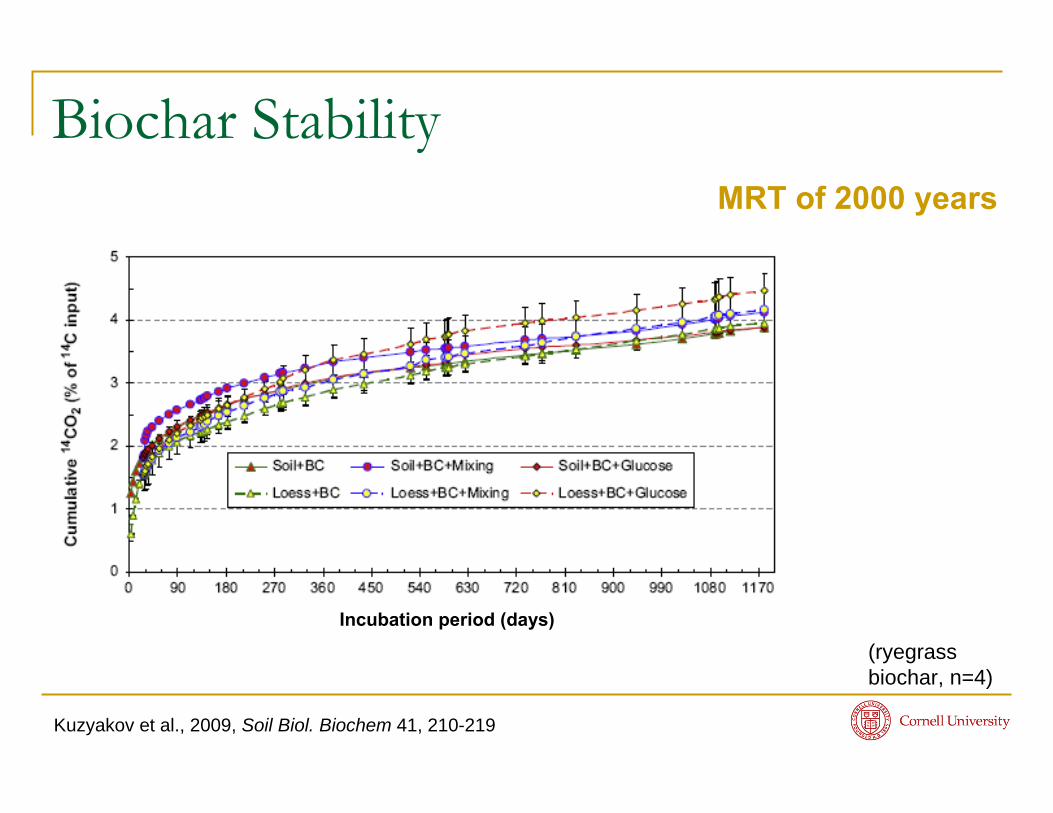
Biochar Stability
Kuzyakov et al., 2009, Soil Biol. Biochem 41, 210-219
(ryegrass biochar, n=4)
MRT of 2000 years
Incubation period (days)

Biochar Quality, Biochar Stability
Corn-BC Oak-BC0
5
10
15
20350°C600°Ca
bb b
(1 year, 30°C, in sand culture, N=8)
Car
bon
loss
rate
(% y
ear-1
)
Nguyen and Lehmann, 2009, Organic Geochemistry 40, 846-853 Nguyen et al., 2010, Environmental Science and Technology 44, 3324–3331
A (corn-350-BC) B (corn-600-BC)
5 nm 5 nm

Biochar Decomposition
Lehmann et al., 2009, in: Earthscan Publ
Bio
char
pro
duct
ion
and
appl
icat
ion
to s
oil
Interactions with mineraland organic matter
Leaching/eluviation
Erosion
Abiotic degradation
Biotic decomposition of labile biochar fraction
Biotic decomposition of stable biochar fraction
Bio-/pedoturbation
Time
Protection by aggregation
Recalcitrance
Stab
ility
Mec
hani
sms
Dec
ay/T
rans
port
Mec
hani
sms

Biochar Decomposition
Lehmann et al., 2009, in: Earthscan Publ
Time (years)
0 20 40 60 80 100 120
Car
bon
rem
aini
ng (%
of i
nitia
l)
0
20
40
60
80
100
2307
5 years2 years
10 years 50 years
100 years1625
327
138
57
MRT2

Global Potential for Emission Reductions and Carbon Sequestration
Lehmann et al, 2010, in: Imperial College Press , forthcoming
Years0 100 200 300 400 500
Annu
al A
pplic
atio
n an
d M
iner
aliz
atio
n(fr
actio
n pe
r yea
r)
0.0
0.2
0.4
0.6
0.8
1.0
1.2
Application
100
5001000
10,000
50
200
50
105
0
20
Years0 100 200 300 400 500
Ann
ual A
pplic
atio
n an
d N
et S
eque
stra
tion
(frac
tion
per y
ear)
0.0
0.2
0.4
0.6
0.8
1.0
1.2
Application
100
500
100010,000
50
200
50
10
5
0
20
Half of total adoption within 30 years and 90% within 50 years
MRTProportion of labile C (MRT of 20 yrs)

Biochar Effects on non-CO2 Greenhouse Gases

Effects of Biochar on Nitrous Oxide
Bhupanderpal-Singh et al., 2010, JEQ published online
N2O: Up to 73% reduction
VertisolAlfisol

Biochar Soil Improvement

Organic Carbon (mg g-1)
0 10 20 30
Cat
ion
Exch
ange
Cap
acity
(mm
olc k
g-1)
0
100
200
300
r2=0.909CEC=2.81C+9.1
r2=0.784CEC=8.60C-18.6
Anthrosols
Adjacent Soils
DSACULGHAT
Other Anthrosols (Sombroek et al., 1993)
Biochar-rich soils
Biochar-poor soils
Liang et al., 2006, Soil Sci. Soc. Am. J. 70: 1719-1730
Biochar Soil Improvement

Biochar Product
Lehmann, 2007, Frontiers in Ecology and the Environment 7, 381-387
Temperature (°C)0 200 400 600 800 1000
Car
bon
reco
very
(% o
f ini
tial C
)
50
60
70
80
90
100
110
pH
2
4
6
8
10
12
14
CE
C (m
mol
c kg-1
)Su
rface
are
a (m
2 g-1
)
0
50
100
150
200
250
300
350Carbonrecovery
pH
Opt
imum
CEC
Surface area
Biochar from black locust(N=3)

Biochar Oxidation
Cheng, Lehmann, Engelhard, 2008, GeochimCosmochim Acta, 72, 1598-1610
2 3 4 5 6 7 8 9 10 11
0
50
100
150
200
250
2 3 4 5 6 7 8 9 10 11
0
50
100
150
200
250
2 3 4 5 6 7 8 9 10
0
50
100
150
200
250
2 3 4 5 6 7 8 9 10
0
50
100
150
200
250
2 3 4 5 6 7 8 9 10
0
50
100
150
200
250
2 3 4 5 6 7 8 9 10
0
500
1000
1500
2000
2500
2 3 4 5 6 7 8 9 10
0
500
1000
1500
2000
2500
2 3 4 5 6 7 8 9 10
0
500
1000
1500
2000
2500
pH
Surf
ace
char
ge (m
mol
e kg
C-1
)
New-BCHF
BC30
BC70 QC
NY
BC-HA
New-BCGW
CT
Negative chargePositive charge
Point of zeronet charge(PZNC)
>2000
<20 >7
<3
130-year-old Biochar(from pig iron production) in comparison to biochar made with traditional kilns

Nutrient Retention Ca
Nut
rient
am
ount
(kg
ha-1
)
-60
-40
-20
0
20
40
60 Crop uptake Leaching by saturated flow Leaching by unsaturated flow
Mg
-40
-20
0
20
40
K
Biochar application rate (t ha-1)
0 20-50
0
50
100
150
200
250
300NO3 + NH4*
Biochar application rate (t ha-1)
0 20
-100-50
050
100150200250300350
Major, PhD thesis
Biochar applied onceTotal over 2 yearsColombia (n=3)a b
ab
a b
ab
B
A
B A
BA
AA Improved nutrient
uptake and crop yield

Temporal Variation in Yield Response
Major et al., 2010, Plant and Soil, published online
Year
2003 2004 2005 2006
Mai
ze g
rain
yie
ld (t
*ha-1
)
0
2
4
6
8
10Control8 t * ha-1 20 t * ha-1
y
Year
2003 2004 2005 2006
Mai
ze g
rain
yie
ld (t
*ha-1
)
0
2
4
6
8
10Control8 t * ha-1 20 t * ha-1
y
Applied once in 2003Colombian Llanos(N=3)
a
b
c
a
ab
b
a
a
baaa
No biochar8t/ha biochar
20t/ha biochar

Time since conversion (years)
0 20 40 60 80 100 120
Mai
ze g
rain
yie
ld (t
ha-1
)
2
4
6
8
10
12BiocharSawdust Manure Tithonia
LSD0.05
Soil Fertility Benefits Dependent on Soil Properties
Kimetu et al., 2008, Ecosystems 11: 726-739
Biochar applied each seasonKenya (n=3)
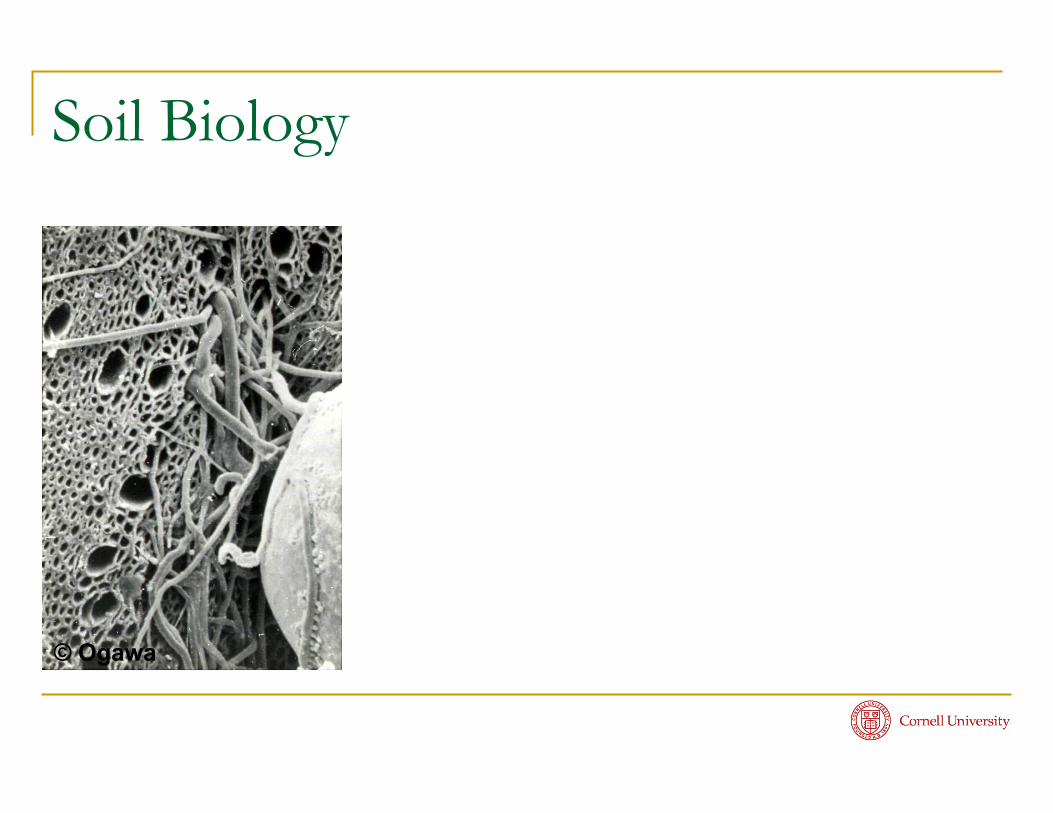
Soil Biology
© Ogawa

Biochar System – Core Principle
Lehmann and Joseph, 2009, Earthscan
WasteManagement
EnergyProduction
SoilImprovement
Mitigation ofClimate Change
Social, Financial Benefits

Biochar System
Lehmann, 2007, Nature 447: 143-144

Systems Analysis: Energy Balance
6.99.1Corn stover (crop residue)
6.99.0Wheat straw
5.37.0Switchgrass
2.33.0Forage corn
Biochar to soil
Biochar to energy
Energy balance (MJ/MJ), Slow pyrolysis
Gaunt and Lehmann, 2008, Environmental Science and Technology 42: 4152-4158
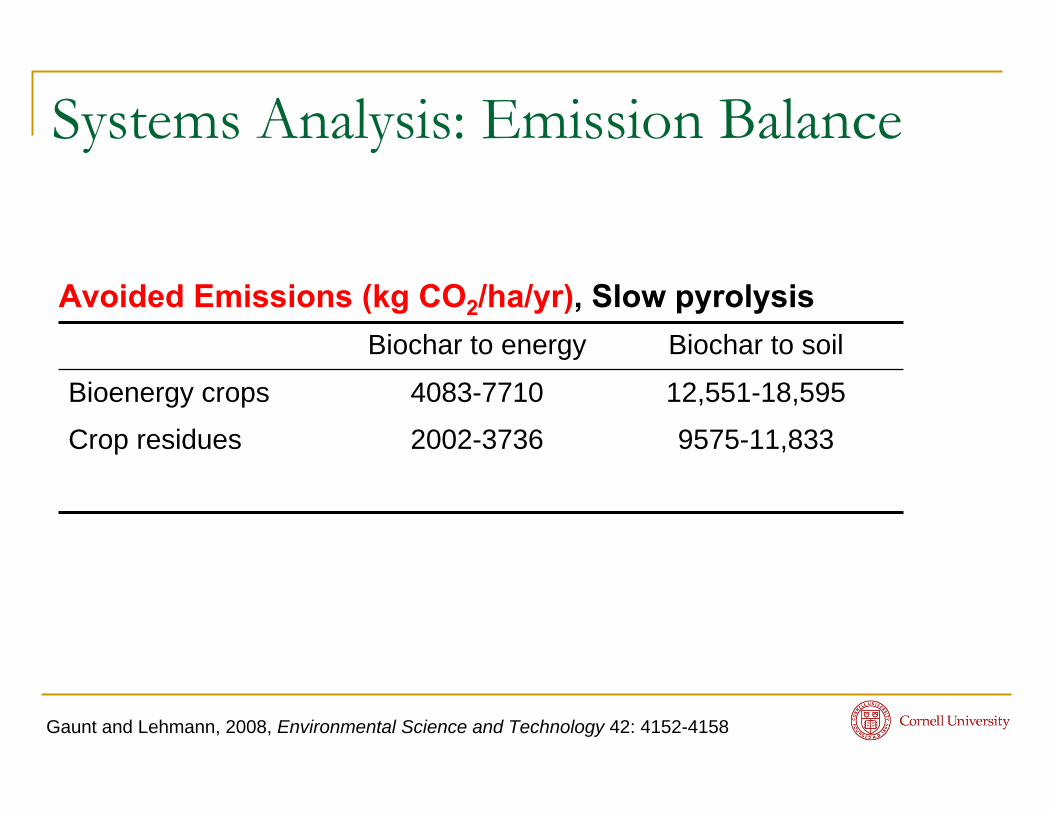
Systems Analysis: Emission Balance
Gaunt and Lehmann, 2008, Environmental Science and Technology 42: 4152-4158
12,551-18,5954083-7710Bioenergy crops
9575-11,8332002-3736Crop residues
Biochar to soilBiochar to energy
Avoided Emissions (kg CO2/ha/yr), Slow pyrolysis

Biomass collection Drying Slow pyrolysis
Pyrolysis facility
TT Soil
application
Natural gas production & combustion
(-)
(-)
Farm equipment, agrochemicals
T
T
T
Compost
(-)
T
Syngas heat
product
BiocharHeat exhaust
Fertilizers
Electricity production
Fossil fuels production
Construction materials
ShreddingBiomass collection Drying Slow pyrolysis
Pyrolysis facility
TT Soil
application
Natural gas production & combustion
(-)
(-)
Farm equipment, agrochemicals
T
T
T
Compost
(-)
T
Syngas heat
product
BiocharHeat exhaust
Fertilizers
Electricity production
Fossil fuels production
Construction materials
Shredding
(a)
Roberts et al, 2010, Environmental Science and Technology 44, 827–833
System boundaries
Systems Analysis: Life Cycle Assessment

Roberts et al, 2010, Environmental Science and Technology 44, 827–833
Systems Analysis: Life Cycle Assessment
0 300 600 900
emit.
reduct.
emit.
reduct.
emit.
reduct.
emit.
reduct.
emit.
reduct.
Greenhouse gases (kg CO2e t-1 dry feedstock)
LUC & fieldemiss.agrochems
field ops
other
stable C
avoid foss fuelgen. & comb.land-use seq.
reduced soilN2O emiss.avoid compost
Late
st
over
Ear
ly
stov
erS
witc
h gr
ass
BYa
rd
was
te
Net = - 864
Net = - 793
Net = - 442
Net = + 36
Net = - 885
Sw
itch
gras
s A
(b)0 300 600 900
emit.
reduct.
emit.
reduct.
emit.
reduct.
emit.
reduct.
emit.
reduct.
Greenhouse gases (kg CO2e t-1 dry feedstock)
LUC & fieldemiss.agrochems
field ops
other
stable C
avoid foss fuelgen. & comb.land-use seq.
reduced soilN2O emiss.avoid compost
Late
st
over
Ear
ly
stov
erS
witc
h gr
ass
BYa
rd
was
te
Net = - 864
Net = - 793
Net = - 442
Net = + 36
Net = - 885
Sw
itch
gras
s A
(b)

Systems Analysis: Sensitivity Analysis
Late Stover Slow pyrolysis(1-10t/hr)
Stover collection energy sensitivity Energy per tonne
collected (MJ) 723 765 (baseline) 833
Net energy (MJ) 4165 4116 4036 % change 1% 0% -2%
Stover collection emissions sensitivity
Emissions per tonne collected (kg
CO2e) -33 58 (baseline) 76
Net CO2e (kg) -970 -864 -843 % change 12% 0% -2%
Roberts et al, 2010, Environmental Science and Technology 44, 827–833

Systems Analysis: Sensitivity Analysis
Late Stover Slow pyrolysis(1-10t/hr)
Roberts et al, 2010, Environmental Science and Technology 44, 827–833
Char yield sensitivity
Char yield input 12 wt % 28.8 wt % (baseline) 35 wt %
Net CO2e (kg) -756 -864 -875 % change -13% 0% 1%
Stable C sensitivity Stable C content of
biochar 0% 50% 80% (baseline) 90%
Net CO2e (kg) -275 -643 -864 -938% change -68% -26% 0% 9%

Systems Analysis: Sensitivity Analysis
Late Stover Slow pyrolysis(1-10t/hr)
Roberts et al, 2010, Environmental Science and Technology 44, 827–833
Syngas energy sensitivity
Energy yield input 50% of baseline (baseline) 150% of
baseline Net energy (MJ) 1509 4116 6722
% change -63% 0% 63% Net CO2e (kg) -703 -864 -1025
% change -19% 0% 19%

Distance (km)
0 200 400 600 800 1000
Net
GH
G (k
g C
O2e
t-1 d
ry s
tove
r)
-1000
-800
-600
-400
-200
0
Net
ene
rgy
(MJ
t-1 d
ry s
tove
r)
0
1000
2000
3000
4000
5000
6000
Rev
enue
($ t-1
dry
sto
ver)
-90
-60
-30
0
30
60
Net energy
Net revenue
Net GHG
(b)
Distance (km)
0 200 400 600 800 1000
Net
GH
G (k
g C
O2e
t-1 d
ry s
tove
r)
-1000
-800
-600
-400
-200
0
Net
ene
rgy
(MJ
t-1 d
ry s
tove
r)
0
1000
2000
3000
4000
5000
6000
Rev
enue
($ t-1
dry
sto
ver)
-90
-60
-30
0
30
60
Net energy
Net revenue
Net GHG
(b)
Costs - transportation
Late stover, high C priceSlow pyrolysis(1-10 tons/hr capacity)
Roberts et al, 2010, Environmental Science and Technology 44, 827–833

Co-Benefits: Waste Stream ManagementCase Study West-Virginia
West Virginia Poultry Farm
99,000 chickens125-600 t/yr poultry litter
Pyrolysis of 300 kg/hr dry litter(at 500°C) Off-sets 114,000L propane gasUS$66,000 /yr
25-120 t/yr biochar

Biochar Cook Stoves
Torres

Small-scale Bioenergy
Whitman and Lehmann, 2009, Environmental Science and Policy 12, 1024-1027
Traditional 3‐Stone Stove Biochar Cook Stove

Co-Benefits: HealthLower indoor pollution=lower respiratory
+ eye infections
Torres

Costs – Carbon Trading AspectsParaguay
Relatively easy countingProof of source possibleLow risk of rapid evasion

EnergyProduction
SoilImprovement
Mitigation ofClimate Change
Social, Financial Benefits
Biochar Benefits – Systems Dimension
WasteManagement

EnergyProduction
SoilImprovement
Mitigation ofClimate Change
Social, Financial Benefits
Biochar Benefits – Systems Dimension
WasteManagement

EnergyProduction
SoilImprovement
Mitigation ofClimate Change
Social, Financial Benefits
Biochar Benefits – Systems Dimension
WasteManagement

EnergyProduction
SoilImprovement
Mitigation ofClimate Change
Social, Financial Benefits
Biochar Benefits – Systems Dimension
WasteManagement

Biochar – The Way Forward
Not “WHETHER”, but “WHERE”