structural transformation of biochar black carbon by c ...10.1038/s41598-017... · structural...
TRANSCRIPT

Supporting Information for
Structural Transformation of Biochar Black Carbon
by C60 Superstructure: Environmental Implications
Minori Uchimiya*,a, Joseph J. Pignatellob, Jason C. Whitec, Szu-Lung Hud, Paulo J. Ferreirad
aUSDA-ARS Southern Regional Research Center, 1100 Robert E. Lee Boulevard, New Orleans,
Louisiana 70124, USA
bDepartment of Environmental Sciences, The Connecticut Agricultural Experiment Station, New
Haven, Connecticut 06504, USA
cDepartment of Analytical Chemistry, The Connecticut Agricultural Experiment Station, New
Haven, Connecticut 06504, USA
dMaterials Science and Engineering Program, The University of Texas at Austin, Austin, Texas
78712, USA
*Corresponding author fax: (504) 286-4367, phone: (504) 286-4356, email:
Number of pages: 12 Number of tables: 2 Number of figures: 8
I. Biochar characterization procedures and results
Proximate analysis. Moisture, ash, volatile matter (VM), and fixed carbon contents of
biochars were determined in triplicate by following American Society for Testing and Materials
(ASTM) method D75821 using LECO thermogravimetric analyzer (TGA701, LECO, St. Joseph,
MI). Moisture was determined as the weight loss after heating the sample under N2 atmosphere
in an open crucible to 107 °C and holding at this temperature until sample weight stabilized. The
VM was determined as the weight loss after heating the sample under N2 atmosphere in a
covered crucible to 950 °C and held for 7 min. Ash was defined as the remaining mass after
subsequently heating the sample under O2 atmosphere in an open crucible to 750 °C and holding
at this temperature until sample weight stabilized. After the determination of moisture, ash, and
VM, fixed carbon was calculated by difference.
Ultimate analysis. Elemental composition (CHNSO) was determined by dry combustion using
Perkin-Elmer 2400 Series II CHNS/O analyzer (Perkin-Elmer, Shelton, CT).
Boehm titration. Total acidity was estimated using a modified Boehm titration method.2
Briefly, 10 g L-1 char suspension was prepared in 0.1 M NaOH. After stirring for 24 h, char
suspension was filtered (0.45 m Millipore Millex-GS; Millipore Corp., Billerica, MA) and 9
mL of 0.1 M HCl was added to 4.5 mL filtrate. Resulting solution was N2 sparged for 2 h and
then titrated with 0.1 M NaOH (titrando 835 autotitrator, Metrohm ion analysis, Herisau,
Switzerland). Blanks were prepared by adding 4.5 mL of 0.1 M NaOH to 9 mL of 0.1 M HCl.
Surface acidity (in mequiv g-1) was determined assuming that NaOH neutralizes all organic acids
with pKa less than 12, including high pKa phenols.2
Biochar characterization results. Ultimate (C, H, N, S, and O; weight-percent on a moisture-
and ash-free basis) and proximate (ash, fixed C, moisture, and volatile matter in weight-percent

on a moisture-free basis) analysis results for 300-700 °C pecan shell biochars are presented in
Table S1. Table S1 also presents atomic H/C ratio as an index of aromaticity, and O/C as an
index of polarity and hydrophilicity. The trends with temperature in Table 1 are in agreement
with the literature.3,4 Grand Canonical Monte Carlo Density Functional theory (GCMC) analysis
of CO2 isotherm indicated a progressive increase in surface area of 271-542 m2 g-1 from 400 to
700 °C (Table 1). Low N2 BET surface area of biochars has been widely reported,5 and is
attributed to the diffusion limitation under the liquid N2 temperature.6 Point of zero charge
(PZC by electrophoretic mobility) of biochars is typically below 3, regardless of pyrolysis
temperature.7 Therefore, both biochar7 and nC608 are expected to be negatively charged within
the pH range employed in the present study.
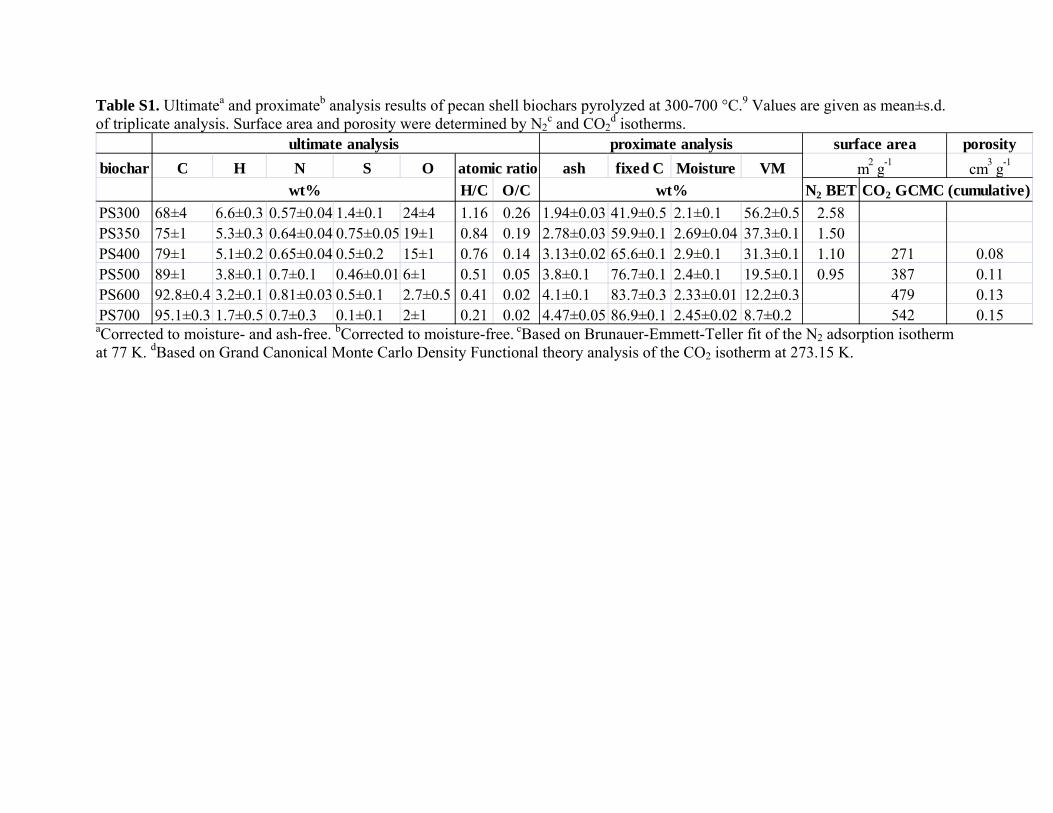
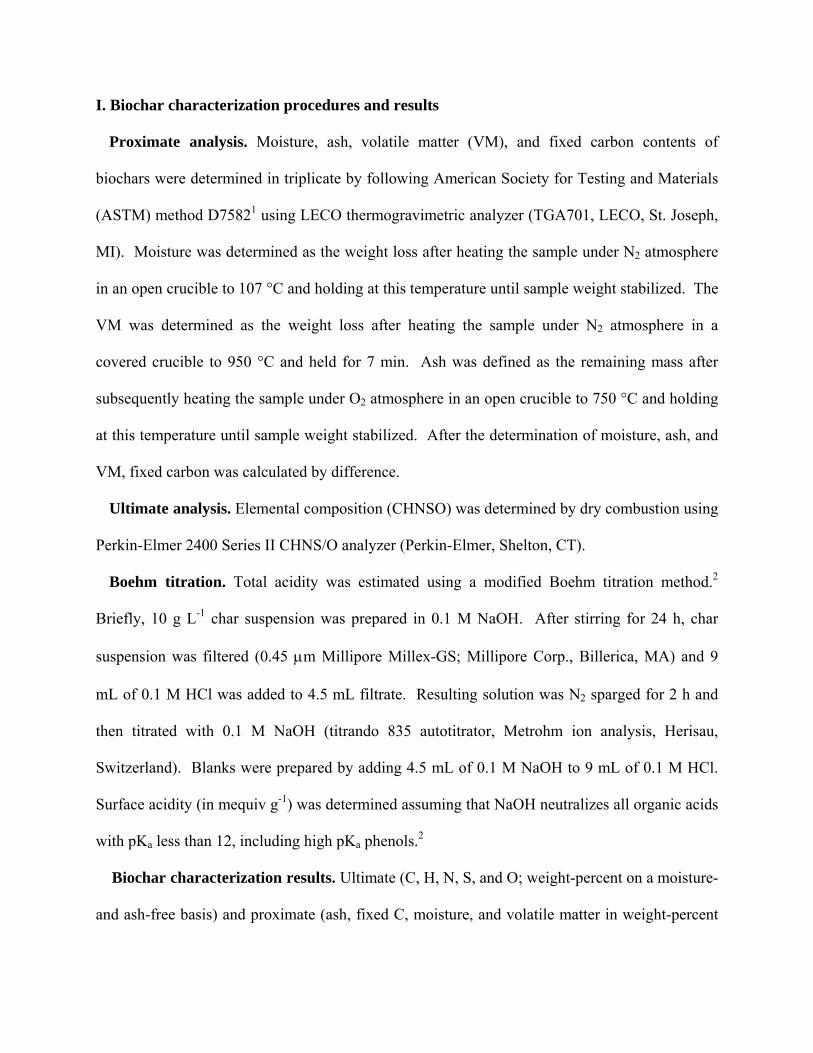
Table S1. Ultimatea and proximateb analysis results of pecan shell biochars pyrolyzed at 300-700 °C.9 Values are given as mean±s.d. of triplicate analysis. Surface area and porosity were determined by N2
c and CO2d isotherms.
porosity
biochar C H N S O atomic ratio ash fixed C Moisture VM cm3 g
-1
H/C O/C N2 BET
PS300 68±4 6.6±0.3 0.57±0.04 1.4±0.1 24±4 1.16 0.26 1.94±0.03 41.9±0.5 2.1±0.1 56.2±0.5 2.58PS350 75±1 5.3±0.3 0.64±0.04 0.75±0.05 19±1 0.84 0.19 2.78±0.03 59.9±0.1 2.69±0.04 37.3±0.1 1.50PS400 79±1 5.1±0.2 0.65±0.04 0.5±0.2 15±1 0.76 0.14 3.13±0.02 65.6±0.1 2.9±0.1 31.3±0.1 1.10 271 0.08PS500 89±1 3.8±0.1 0.7±0.1 0.46±0.01 6±1 0.51 0.05 3.8±0.1 76.7±0.1 2.4±0.1 19.5±0.1 0.95 387 0.11PS600 92.8±0.4 3.2±0.1 0.81±0.03 0.5±0.1 2.7±0.5 0.41 0.02 4.1±0.1 83.7±0.3 2.33±0.01 12.2±0.3 479 0.13PS700 95.1±0.3 1.7±0.5 0.7±0.3 0.1±0.1 2±1 0.21 0.02 4.47±0.05 86.9±0.1 2.45±0.02 8.7±0.2 542 0.15
wt% wt% CO2 GCMC (cumulative)
ultimate analysis proximate analysis
m2
g-1
surface area
aCorrected to moisture- and ash-free. bCorrected to moisture-free. cBased on Brunauer-Emmett-Teller fit of the N2 adsorption isotherm at 77 K. dBased on Grand Canonical Monte Carlo Density Functional theory analysis of the CO2 isotherm at 273.15 K.
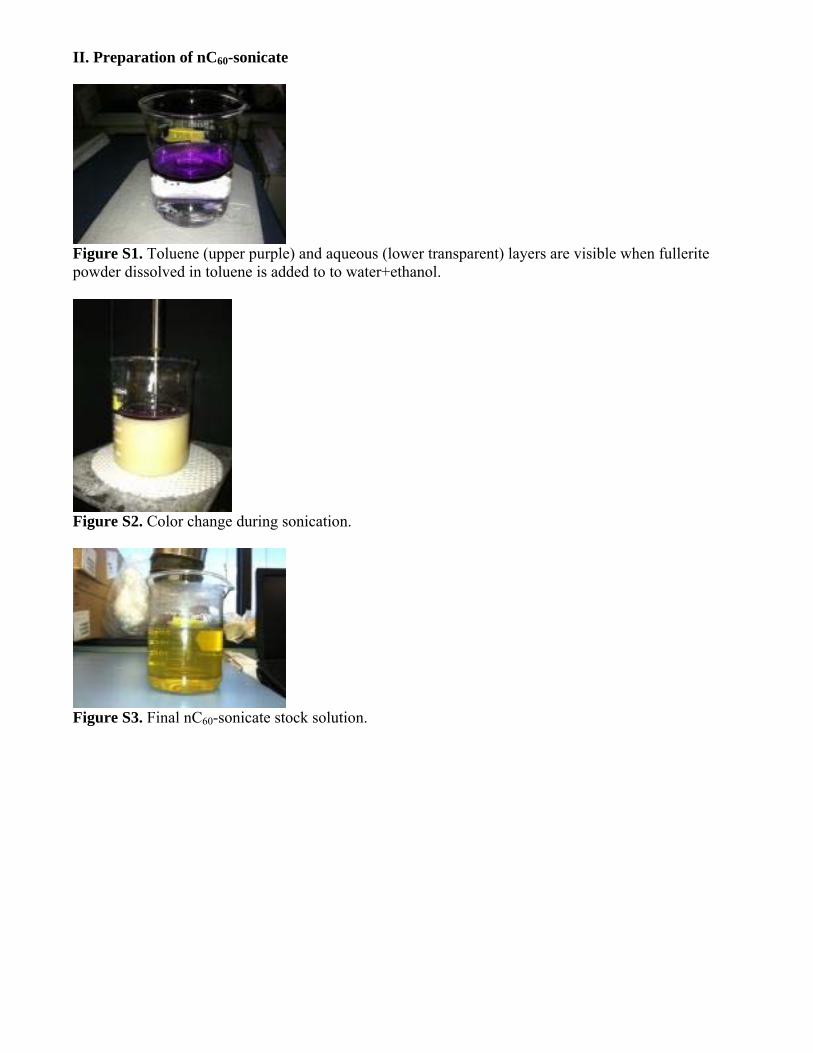
II. Preparation of nC60-sonicate
Figure S1. Toluene (upper purple) and aqueous (lower transparent) layers are visible when fullerite powder dissolved in toluene is added to to water+ethanol.
Figure S2. Color change during sonication.
Figure S3. Final nC60-sonicate stock solution.
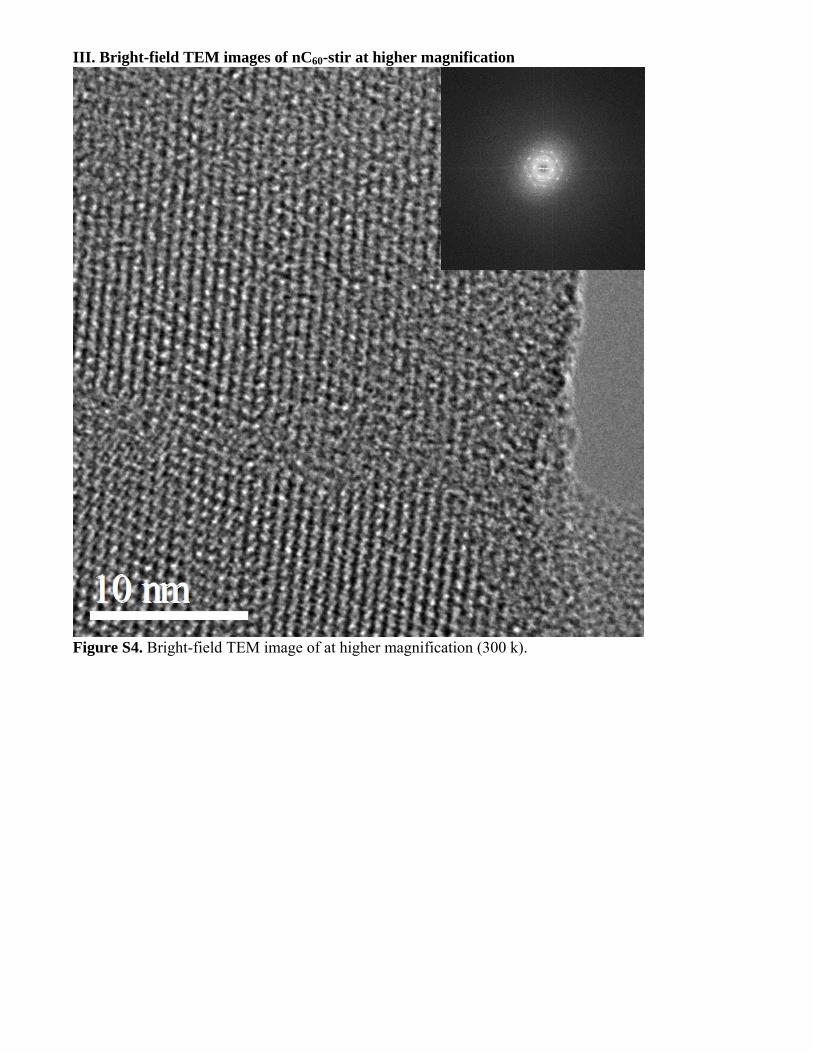
III. Bright-field TEM images of nC60-stir at higher magnification
Figure S4. Bright-field TEM image of at higher magnification (300 k).

Figure S5. Bright-field TEM image of at higher magnification (300 k).

IV. Figure 5 in the unit concentration
Figure S6. Retention kinetics of nC60-sonicate (a-d) on PS300 (a-d) and 1 d equilibration of nC60-sonicate (e-h) and nC60-stir (i-l) on PS300-700 at 5 (a-d, i-l) and 20 (e-h) g L-1 biochar loadings. In d, h, and l, left y-axis is for [nC60]stock, and right y-axis is for the mass balance (dissolved+retained). Values in b, f, and j were calculated using Equation 1. All values are given as mean±s.d. of duplicate experiments.
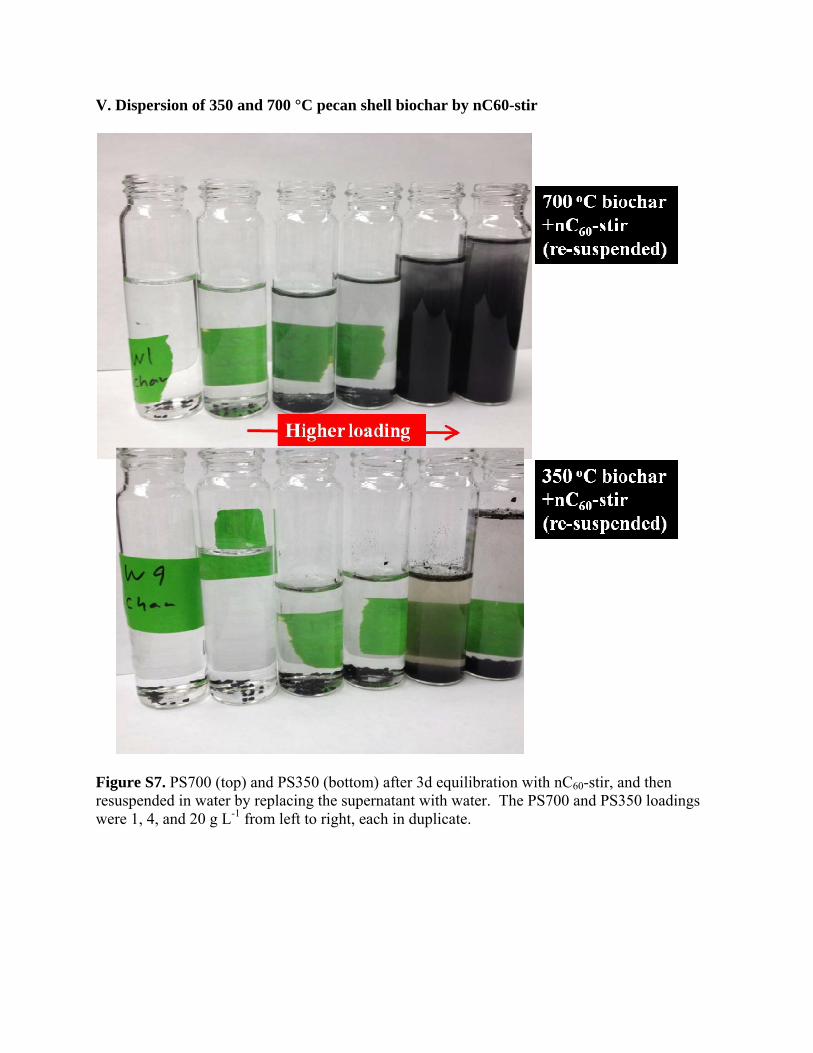
V. Dispersion of 350 and 700 °C pecan shell biochar by nC60-stir
Figure S7. PS700 (top) and PS350 (bottom) after 3d equilibration with nC60-stir, and then resuspended in water by replacing the supernatant with water. The PS700 and PS350 loadings were 1, 4, and 20 g L-1 from left to right, each in duplicate.

VI. Reported [nC60]stock
Literature survey indicates reproducibility problems in both production10 and quantification of
nC60-stir (summarized in Table S2, Supporting Information). Total organic carbon (TOC)
analyzer measured 3.34 mg-C L-1 (by combustion of nC60-stir at 680 °C; 11.62 mg-C L-1 for
nC60-sonicate),11 4 mg-C L-1,12 to as low as 0.35 mg-C L-1 (3 wk stirring).13 UV absorbance (355
nm) of toluene extract measured 0.18-0.26 mg L-1 for nC60 stock solutions stirred in DDW for 2
wk to 11 months with 0-10 mM added NaN3 or NaCl.14 In a separate study, UV/visible
measurement (336 nm) of repeated (3 extraction cycles) toluene extracts measured 1.2 mg L-1
nC60.15 Concentrations measured by HPLC are typically several-fold lower than UV absorbance
or TOC, and ranged from 40 μg L-1 after 8 d stirring,16 126-244 μg L-1 after 99-1,075 d stirring17
(70:30 toluene-methanol extraction with NaCl), to as low as 7.2 μg L-1.18 Variations in the size
and concentration of nC60-stir stock solutions (Figures 1 and Table S2) and disappearance upon
filtration (thin lines in Figure 1) motivated us to rigorously characterize the structure of nC60-stir
(Figure 2).
Table S2. Reported [nC60]stock.
Stock Analytical method [nC60] Ref
nC60-stir (40 d) TOC by combustion 3.34 mg-C L-1
Chen&Elimelech (2009)
nC60-sonicate TOC by combustion 11.62 mg-C L-1
Chen&Elimelech (2009)
nC60-stir (40 d) TOC by combustion 4 mg-C L-1
Xiao et al. (2011)
nC60-stir (3 wk) TOC by combustion 0.35 mg-C L-1
Li et al. (2009)
nC60-stir (3 wk) UV/vis (355 nm) 0.18-0.26 mg L-1
Dhawan (2009)
nC60-stir (2 wk) UV/vis (336 nm)a
1.2 mg L-1
Chang et al. (2012)
nC60-stir (2 wk) HPLC 40 μg L-1
Issacton&Bouchard (2010)
nC60-stir (99-1750 d) HPLC 126-244 μg L-1
Issacton et al. (2011)
nC60-stir (192 h) HPLC 7.2 μg L-1
Terashima&Nagao (2007)aSum of triplicate extraction.
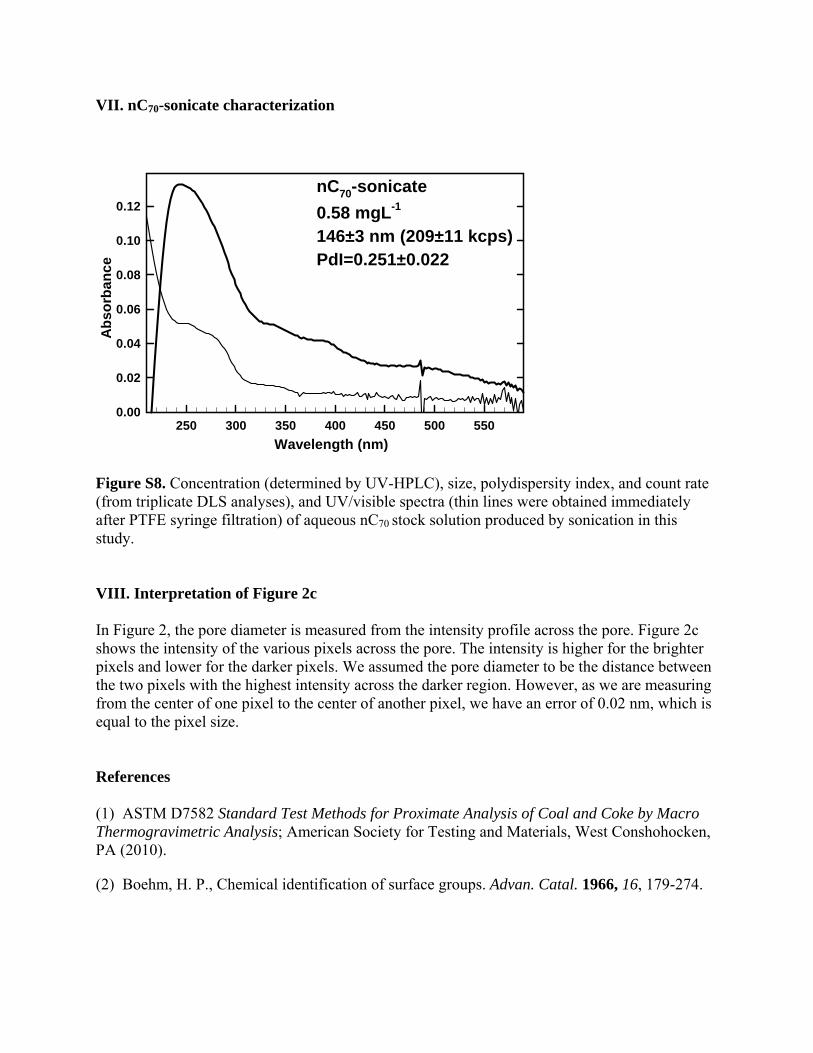
VII. nC70-sonicate characterization A
bso
rba
nc
e
250 300 350 400 450 500 5500.00
0.02
0.04
0.06
0.08
0.10
0.12
nC70-sonicate
0.58 mgL-1
146±3 nm (209±11 kcps)PdI=0.251±0.022
Wavelength (nm) Figure S8. Concentration (determined by UV-HPLC), size, polydispersity index, and count rate (from triplicate DLS analyses), and UV/visible spectra (thin lines were obtained immediately after PTFE syringe filtration) of aqueous nC70 stock solution produced by sonication in this study. VIII. Interpretation of Figure 2c
In Figure 2, the pore diameter is measured from the intensity profile across the pore. Figure 2c shows the intensity of the various pixels across the pore. The intensity is higher for the brighter pixels and lower for the darker pixels. We assumed the pore diameter to be the distance between the two pixels with the highest intensity across the darker region. However, as we are measuring from the center of one pixel to the center of another pixel, we have an error of 0.02 nm, which is equal to the pixel size.
References (1) ASTM D7582 Standard Test Methods for Proximate Analysis of Coal and Coke by Macro Thermogravimetric Analysis; American Society for Testing and Materials, West Conshohocken, PA (2010).
(2) Boehm, H. P., Chemical identification of surface groups. Advan. Catal. 1966, 16, 179-274.

(3) Uchimiya, M.; Wartelle, L. H.; Klasson, K. T.; Fortier, C. A.; Lima, I. M., Influence of pyrolysis temperature on biochar property and function as a heavy metal sorbent in soil. J. Agr. Food Chem. 2011, 59, 2501–2510.
(4) Shinogi, Y.; Kanri, Y., Pyrolysis of plant, animal and human waste: Physical and chemical characterization of the pyrolytic products Bioresour. Technol. 2003, 90, 241-247.
(5) Lattao, C.; Cao, X.; Mao, J.; Schmidt-Rohr, K.; Pignatello, J. J., Influence of molecular structure and adsorbent properties on sorption of organic compounds to a temperature series of wood chars. Environ. Sci. Technol. 2014, 48, 4790-4798.
(6) Braida, W. J.; Pignatello, J. J.; Lu, Y. F.; Ravikovitch, P. I.; Neimark, A. V.; Xing, B. S., Sorption hysteresis of benzene in charcoal particles. Environ. Sci. Technol. 2003, 37, 409-417.
(7) Xiao, F.; Pignatello, J. J., Interactions of triazine herbicides with biochar: Steric and electronic effects. Water Res. 2015, 80, 179-188.
(8) Bouchard, D.; Ma, X.; Isaacson, C., Colloidal properties of aqueous fullerenes: Isoelectric points and aggregation kinetics of C60 and C60 derivatives. Environ. Sci. Technol. 2009, 43, 6597-6603.
(9) Uchimiya, M., Influence of pH, ionic strength, and multidentate ligand on the interaction of CdII with biochars. ACS Sustainable Chem. Eng. 2014, 2, 2019-2027.
(10) Chang, X.; Vikesland, P. J., Uncontrolled variability in the extinction spectra of C60 nanoparticle suspensions. Langmuir 2013, 29, 9685-9693.
(11) Chen, K. L.; Elimelech, M., Relating colloidal stability of fullerene (C60) nanoparticles to nanoparticle charge and electrokinetic properties. Environ. Sci. Technol. 2009, 43, 7270-7276.
(12) Xiao, Y.; Chae, S. R.; Wiesner, M. R., Quantification of fullerene (C60) in aqueous samples and use of C70 as surrogate standard. Chem. Eng. J. 2011, 170, 555-561.
(13) Li, Q.; Xie, B.; Yu, S. H.; Xu, Y., Kinetics of C60 fullerene dispersion in water enhanced by natural organic matter and sunlight. Environ. Sci. Technol. 2009, 43, 3574-3579.
(14) Dhawan, A.; Taurozzi, J. S.; Pandey, A. K.; Shan, W.; Miller, S. M.; Hashsham, S. A.; Tarabara, V. V., Stable colloidal dispersions of C60 fullerenes in water: Evidence for genotoxicity. Environ. Sci. Technol. 2006, 40, 7394-7401.
(15) Chang, X.; Duncan, L. K.; Jinschek, J.; Vikesland, P. J., Alteration of nC60 in the presence of environmentally relevant carboxylates. Langmuir 2012, 28, 7622-7630.
(16) Isaacson, C. W.; Bouchard, D. C., Effects of humic acid and sunlight on the generation and aggregation state of aqu/C60 nanoparticles. Environ. Sci. Technol. 2010, 44, 8971-8976.

(17) Isaacson, C.; Zhang, W.; Powell, T.; Ma, X.; Bouchard, D., Temporal changes in aqu/C60 physical-chemical, deposition, and transport characteristics in aqueous systems. Environ. Sci. Technol. 2011, 45, 5170-5177.
(18) Terashima, M.; Nagao, S., Solubilization of [60]fullerene in water by aquatic humic substances. Chem. Lett. 2007, 36, 302-303.