dodging adverse selection: how donor type and … adverse selection.pdf · dodging adverse...
TRANSCRIPT
Dodging Adverse Selection: How Donor Type and Governance
Condition Aid’s Effects on School Enrollment
Zachary Christensen, Brigham Young University
(801) 803-3045
Dustin Homer, Brigham Young University
(605) 323-7863
Daniel Nielson, Brigham Young University
(801) 422-3417
Department of Political Science
Brigham Young University
744 SWKT
Provo, UT 84602
Fax number 801-422-0580

2
Abstract
We employ AidData to test the effects of primary-education aid on school enrollment. We argue
that the problem of adverse selection complicates both the allocation and the effectiveness of aid.
We hypothesize that bilateral donors ought to have greater freedom to condition aid on recipient
governance quality than multilateral donors, which are often bound by institutional rules to
provide aid more impartially. Compared to their multilateral counterparts, bilateral donors may
have advantages in overcoming adverse selection, resulting in bilateral aid’s boosting
enrollments to a greater degree. AidData’s extensive coverage of multilateral aid enables this
analysis for up to 100 low- and low-middle-income countries from 1995 to 2008. Latent growth
regression analysis suggests that, compared to multilateral donors, bilateral donors indeed
condition their primary education aid on recipient control of corruption and that bilateral aid is
significantly related to improved enrollments.
Keywords
Less-developed countries; foreign aid; adverse selection; enrollment rates; education; latent growth

3
Acknowledgements
We are grateful to Axel Dreher, Michael Findley, Darren Hawkins, Christopher Kilby, Stephen
Knack, Katja Michaelowa, Rich Nielson, Timmons Roberts, , and Sven Wilson for helpful
comments and guidance.
AidData (formerly known as Project-Level Aid or PLAID) was supported by the Bill & Melinda
Gates Foundation; the William and Flora Hewlett Foundation; National Science Foundation
grant SES-0454384; the College of William and Mary; and the College of Family, Home and
Social Sciences, the Department of Political Science, and the David M. Kennedy Center for
International Studies at Brigham Young University.
4
“Education is development. It creates choices and opportunities for
people, reduces the twin burdens of poverty and disease, and gives a stronger
voice in society. For nations it creates a dynamic workforce and well-informed
citizens able to compete and cooperate globally – opening doors to economic
and social prosperity.”
-Millennium Development Goals #2
1. INTRODUCTION
Grinding poverty plagues Eritreans, who eke out less than one dollar per day in per capita
income and thus rank seventh on the list of poorest peoples in the world (World Bank, 2010).
Apparently noticing Eritrea’s plight and seeking to boost its scarce human capital, donors sent
roughly $220 million in foreign aid for improving Eritrean education between 1998 and 2008
(Findley et al., 2009). By the budget standards of advanced industrial economies the amount
appears trivial, but at $20 million per year the aid represented more than 75 percent of total
Eritrean government expenditures on education (World Bank, 2010). Effectively, foreign aid is
the Eritrean education budget.
But an odd pattern has emerged in the beleaguered country: each year from 2005 to 2009
the net primary school enrollment rate – the proportion of school-aged children actually signed
up for school – has dropped. It plummeted from 50 percent in 2005 to 39 percent in 2009
(World Bank, 2010). Many factors – including border disputes, regional war, political
repression, flagging labor opportunities, volatile commodities markets, and climate strain, among
others – likely contributed to this trend. But whatever donors intended with their education aid
to Eritrea, it does not appear to have enabled more children to attend school.

5
Cases like Eritrea raise the possibility that education aid may prove ineffective more
generally. And they provoke a more nuanced research question targeting the specific conditions
under which aid may make a meaningful difference. Indeed, in this article we argue that the
problem of adverse selection – the recipients most likely to seek and receive aid may be the least
likely to use it effectively – complicates both aid allocation and aid effectiveness. Specifically,
we contend that, in order to overcome adverse selection, donors must allocate aid strategically.
And these selection effects in allocation will later condition aid effectiveness. We argue that,
compared to bilateral donors, institutional rules and practices more tightly constrain multilateral
donors, where broad coalitions of developing countries have seats and voting shares on
development banks’ executive boards and can collude to demand financing with few strings
attached. Thus, we expect bilateral donors to be more discriminating about the quality of
governance among recipients and thus to act more strategically when allocating aid for primary
education. These allocation strategies, then, should then influence the effectiveness of the aid in
boosting primary-school enrollment rates.
We address this research question and test the argument empirically by employing
AidData (Tierney et al., 2011), which, as other articles in this special issue have noted,
significantly expands the coverage of aid information. Largely through adding money from
multilateral banks and other donors that do not report to the OECD’s Creditor Reporting System
(CRS), AidData nearly doubles the amount of development finance tracked by a single source,
from $2.9 to $4.9 trillion. Given the amount of activity by multilaterals in the social sectors,
particularly since the mid-1990s (see Lyne et al., 2009), these new data should prove especially
useful for understanding the relationship between education aid and education outcomes.
Indeed, omission of these data – covering more than forty percent of all development finance –

6
from prior work may have biased previous results. For our empirical tests we apply latent growth
(hierarchical linear modeling) estimation, which, by employing both random intercepts and
random coefficients, is a more conservative technique for analyzing pooled time series data.
To date related studies have largely confined themselves to assessing education aid’s
overall impact on economic growth, saying little about whether or not education aid actually
leads directly to its more proximate anticipated outcomes. More recently, two studies have
suggested that specifically-targeted education aid may have a positive influence on the key
outcome of enrollment rates ([Dreher et al., 2008] and [Michaelowa and Weber, 2007]). We
build on these studies by using AidData to nearly double the amount of development finance
considered, isolating the effects of aid to primary schools, assessing bilateral and multilateral aid
independently, and, critically, modeling the effects of adverse selection – measured as recipient
corruption and autocracy – on the allocation and effectiveness of aid from bilateral vs.
multilateral donors. In what follows we introduce the substantive issue area of education aid,
develop expectations for how education aid ought to affect enrollment rates conditional on donor
type and governance, describe the data and estimation methods, present results, and draw
conclusions.
2. EDUCATION AID AND SCHOOL ENROLLMENT
The bulk of the aid effectiveness literature has focused on broad questions of aggregate
aid and its relationship to economic growth ([Burnside and Dollar, 2000], [Easterly, 2006],
[Easterly, Levine and Roodman, 2004] and [Rajan and Subramanian, 2008]). Results have been
mixed, but the center of gravity has gathered around findings that suggest no relationship

7
between aid and growth ([Easterly, Levine and Roodman, 2004] and [Rajan and Subramanian,
2008]).
But economic growth is notoriously hard to predict, so a closer look at the effect of
sector-specific aid on sector-specific outcomes may help unravel the mystery of aid’s impacts. It
should enable us to better identify causal chains and to reduce the statistical noise caused by
intervening variables (Michaelowa and Weber, 2007). By understanding the specific effects of
sector-focused aid on discrete sectoral outcomes we can learn with greater precision whether aid
is accomplishing its intended purposes. Education provides a particularly important policy
domain in which to explore the more direct effects of specifically targeted aid on corresponding
outcomes.
The debate over the effectiveness of education aid is relatively recent, and we categorize
the limited literature into two broad approaches: (1) the effects on general outcomes such as
economic growth and (2) the impact on educational outcomes specifically. Examinations of
economic outcomes most often employ increases in gross domestic product (GDP) or GDP per
capita as broad measures of effectiveness, suggesting that education aid’s improvement of
human capital should stimulate economic growth ([Asiedu and Nandwa, 2007] and [Pritchett,
2001]). These studies seldom uncover a positive correlation between education aid and growth,
reflecting the general finding that aid has little discernible impact on expansion of the overall
economy.
We argue, however, that sector-specific outcomes provide more accurate indicators for
aid effectiveness. Prominently, the 2000 Millennium Development Goals called for universal
primary education by 2015 (UN, 2010). This suggests inquiry into a direct outcome of education
aid: is primary education aid increasing primary school enrollment? Recently, analysts have

8
moved in this direction, assessing education aid’s impact on specific measureable outcomes of
education. These studies use enrollment rates as the dependent variable, both because
enrollments relate to the MDGs and because they boast better data availability. Initial studies by
Michaelowa and Weber (2007, 2008) and Dreher et al. (2008) found positive though rather
modest relationships between education aid and education outcomes, suggesting that aid may
indeed boost school enrollments over time.
However, in these studies the statistically significant relationships were less significant
substantively, and data availability and quality problems make the findings somewhat tentative.
They particularly beg the question of whether the findings generalize to multilateral aid, which is
overwhelmingly excluded from the OECD-CRS data. Both sets of authors acknowledge the
flaws of the CRS database and its potential effect on results. They also discuss the poor coverage
and reporting of primary enrollment data. Moreover, both Dreher et al. (2008) and Michaelowa
and Weber (2007) evaluated the impact of all education aid on primary school enrollment – they
did not isolate the effects of primary school aid on primary enrollment. Dreher et al. recommend
that future research focus on the outcomes of primary-education-specific aid, promoting the
follow-up we undertake here.
Admittedly, enrollment rates are not the only focus of education aid, nor are they the sole
gauge of educational success. A wide literature clearly indicates that universal education of a
reasonable quality is the lynchpin for success in educational development (Bennell, 2002). Much
research has gone on to explore the quality of third-world education and to suggest factors that
may influence educational quality and effectiveness ([Banerjee et al., 2007], [Behrman, 1996],
[Case and Deaton, 1999] and [Scheerens, 2001]). Indeed, intuition coupled with much empirical
evidence suggests that focusing solely on enrollment rates will tell an incomplete story of
9
education outcomes. However, while better educational quality measures would be the preferred
outcome to use for our estimation, sufficient cross-national data on standardized education
outcomes is not widely available ([Barro and Lee, 2001] and [Dreher et al., 2008]). Considering
these limitations, we focus on enrollment rates as our education outcome measure. Since all of
the valuable benefits of education require children to go to school, studying enrollments seems a
credible first step in evaluating educational quality more generally.
Unfortunately, a number of issues plague enrollment data (see Urquiola and Calderon,
2006). In addition to poor historical data coverage for many developing countries, recent
research suggests that international policy initiatives to increase enrollment have come at the cost
of decreased educational quality, further frustrating this measure of education outcomes
([Clemens, 2004] and [Deininger, 2003]). However, following processes outlined by Dreher et
al. (2008), while acknowledging the data limitations, we have moved forward with the analysis
using the best available information.
Beyond the aid literature, our evaluation of the effects of education aid on enrollment fits
within the broader discussion of school enrollment in developing nations. For decades,
researchers have attempted to ascertain which factors influence school attendance among the
world’s poorest students. A number of “household factors” are purported to affect enrollment,
including gender, family socioeconomic status, urban vs. rural location, parental education, and
so forth ([Huisman and Smits, 2009] and [Kazeem et al., 2010]). To estimate these effects we
use GDP per capita as a proxy. Other scholars demonstrate the effects of more direct educational
inputs, like pupil-teacher ratios, schooling costs, and the like ([Case and Deaton, 1999] and
[Deininger, 2003]). Most prominent in the literature, however, is the significant relationship
between child health and school enrollment ([Alderman et al., 2001], [Glewwe and Jacoby,

10
1995], [Handa and Peterman, 2007] and [Schultz, 1999]). For example, Beasley et al. shows
significant health differences between enrolled and non-enrolled Tanzanian children (2000). And
in a path-breaking field experiment establishing causal effects, Miguel and Kramer find that de-
worming treatments increase school attendance (2004). Clearly, the importance of health when
considering third-world school enrollment cannot be overstated. We include infant mortality
rates in our models to account for this effect.
Other scholars look more deeply at the effect of various government variables on school
enrollment. For example, Brown suggests that more democratic poor countries are more likely
than autocratic nations to have higher school enrollment (1999). Rajkumar and Swaroop look
more deeply at the effects of government spending on education outcomes, concluding that
public spending improves education outcomes in well-governed countries but has no impact in
poorly-governed nations (2008). Dreher et al. corroborate these findings, concluding in their
analysis that government spending on education has virtually no effect on overall education
outcomes in poor nations (2008). Filmer and Pritchett find a similarly miniscule effect between
government health spending and child health, an area that is typically highly correlated with
education (1999). From an aid standpoint, Michaelowa and Weber (2007) conclude that
education aid is more effective when coupled with good governance, following the broader
conclusions on aid and governance outlined by Burnside and Dollar (2000). This body of
evidence suggests that governance quality is a key factor conditioning the effects of education
aid on enrollment in poor countries.
We build on this literature by underscoring the important role that adverse selection plays
in aid effectiveness. Economists have offered insurance markets as the classic context to
illustrate adverse selection (see [Arrow, 1965] and [Pauly, 1974]). For example, smokers face a

11
greater risk of health problems than non-smokers and, knowing this, may be more motivated to
buy health insurance. Unless health insurers have some way of identifying smokers and
charging a premium for the insurance, the companies will suffer from the problem of adverse
selection: the riskiest and least profitable customers are the most likely to seek and obtain health
insurance in the first place.
We argue that a similar problem holds in foreign aid. Recipient governments that pocket
or mismanage aid money are also the most likely to seek it. Donor governments may lack
knowledge about recipient type, called information asymmetry, or they may possess the relevant
information but be constrained by norms, rules, or other values to still provide aid to the worst-
governed countries. Thus, we argue that models seeking to explain aid effectiveness must
consider the problem of adverse selection. We address the issue below by treating our measures
of governance quality – corruption and democracy levels – both as factors that affect aid
allocation and as variables that condition the effectiveness of the aid once allocated. Thus, in our
empirical models we consider that donors strategically allocate aid to the less corrupt and more
democratic countries (see also Bermeo, 2011).
Specifically, we argue that multilateral donors face more constraints in addressing
adverse selection than bilateral donors. Multilateral donors, particularly development banks, for
most of their histories operated under the norm of political neutrality: regime type and
governance quality were explicitly omitted as considerations when negotiating loans. In recent
years this de jure rule has relaxed, but it has persisted de facto. For example, the World Bank has
explicit policies meant to condition aid toward countries that manage their public expenses well
(World Bank, 2005). However, there is evidence that these standards are not consistently applied
12
across recipients and World Bank programs (Winters, 2010). We suggest that the banks’
institutional structures provide the motivation that constrains this reform.
Namely, developing countries – the very recipients that present the adverse-selection
problem – have ample formal voting power on the executive boards of the international financial
institutions. For example, at both the World Bank and the Asian Development Bank,
developing-country vote shares sum to nearly half of the totals. At the Inter-American
Development Bank, developing countries hold an actual majority of votes. These developing-
country vote shares, both within executive director constituencies1 and among directors
themselves, can prove pivotal in setting policy at the banks (see Lyne, Nielson and Tierney,
2009). It takes little imagination to envision recipient countries coalescing around policies that
diminish the weight given to questions of governance when banks make allocation decisions.
Indeed, qualitative interviews with former executive directors at multiple banks suggest that
these blocs of developing countries work hard for policies that favor them jointly and that
collusion frequently occurs.2 Moreover, multilateral banks often face a strong need to lend
money to justify their existence, so recipients receive further funding even after failing to
conform to loan conditions or despite weak institutions and governance (see [Easterly, 2006] and
[Knack, 2001]).
On the other hand, while bilateral donors also face constraints driven by military
alliances, trade partnerships, and former colonial ties, they appear to exercise significant
discretion in allocating aid among different sectors. Bermeo, for example, presents compelling
evidence that bilateral donors allocate their portfolios strategically in ways that constrain – and
even bypass – corrupt and poorly managed governments (2011). Because bilateral donors are not

13
institutionally beholden and officially accountable to recipients in the same ways that bind
multilaterals, bilateral aid agencies should be able to address the adverse selection problem by
allocating aid selectively to the recipients most likely to use it well. We measure governance
quality as levels of democracy and corruption and assess its effects both on the allocation and the
effectiveness of aid from bilateral vs. multilateral donors. We turn now to a discussion of the
data used to estimate the model.
3. DATA
While the ability of foreign aid to improve education outcomes is important in all
recipient countries, we limit our analysis roughly 100 low- and lower-middle-income countries
as defined by the World Bank. This is chiefly because primary enrollment rates frequently
approach 100 percent among high- and upper-middle-income countries. The fact that the upper
bound constrains the variance – added to the reality that the wealthier countries receive less aid
per GDP (or none at all) – suggests that the safest practice is to exclude them from the analysis.
Furthermore, in low-income nations, increased enrollment is likely a major focus of development
assistance, and, as noted above, increased enrollment is a reasonable outcome of improved
educational systems and opportunities, despite measurement flaws. Thus, enrollment rates, at
least in developing-country settings, provide a reasonable way to assess the impact of education
aid.
Our aid variables are taken from AidData 1.9 (Tierney et al., 2011). We define primary
aid as the nominal commitment amounts reported for each project that was coded as having
primary education as its major purpose. For projects not included in the CRS, AidData coders
assigned each project an overall purpose code describing its general thrust. The five-digit codes
are extrapolated from the OECD-CRS coding schema and represent a reasonably comprehensive
14
set of aid activities. Also, commitment values are given preference over disbursement values
because of their broader availability. While it seems logical to look at aid that has actually been
disbursed instead of money that has only been promised, the poor coverage of disbursement data
precludes their use. Furthermore, some studies suggest that commitments predict disbursements
reliably – or at least that little evidence suggests otherwise ([Nielson and Tierney, 2005],
[Neumayer, 2003] and [Wilson, 2009]).
We then generated a variable for projects with any education purpose code except
primary education (e.g. secondary, tertiary, combined or unspecified education projects), which
we include in the models as a control variable to better isolate the effects of primary-specific
education aid. Following the same logic, we created a variable representing aggregate aid flows
for all sectors except education. For each of these aid variables, we generated a series of sums
totaling aid from one to five previous years (i.e. t-1+t-2+. . .+t-5) to help account for the delay
between commitments and actual “on the ground” effects of aid for enrollments. In other words,
we presume that aid flows each year have an aggregate effect on aid outcomes. So, for each
country-year observation in our data, we sum aid totals from one year prior to the observation up
to nine years prior to the observation to account for these aggregate effects over time. We report
results of the five-year sum variable (t-1+t-2+. . .+t-5) in the statistical tables below, but we note
that results were robust across specifications ranging from three-year sums to nine-year sums.
All aid variables were measured in per capita terms to control for variance in population.
The amounts reported were divided by the total population of the recipient country as reported in
the World Development Indicators. Due to limited coverage of population figures, the population
values were smoothed over a five-year period, allowing us to calculate per capita figures for as
many aid variables as possible. Skewness tests indicate skewness statistics of 10.1, 23.5 and 5.2
15
for primary aid per capita, other education aid per capita, and all other aid, respectively. Given
this skewness, we logged the variables to help eliminate potential bias. The patterns in primary
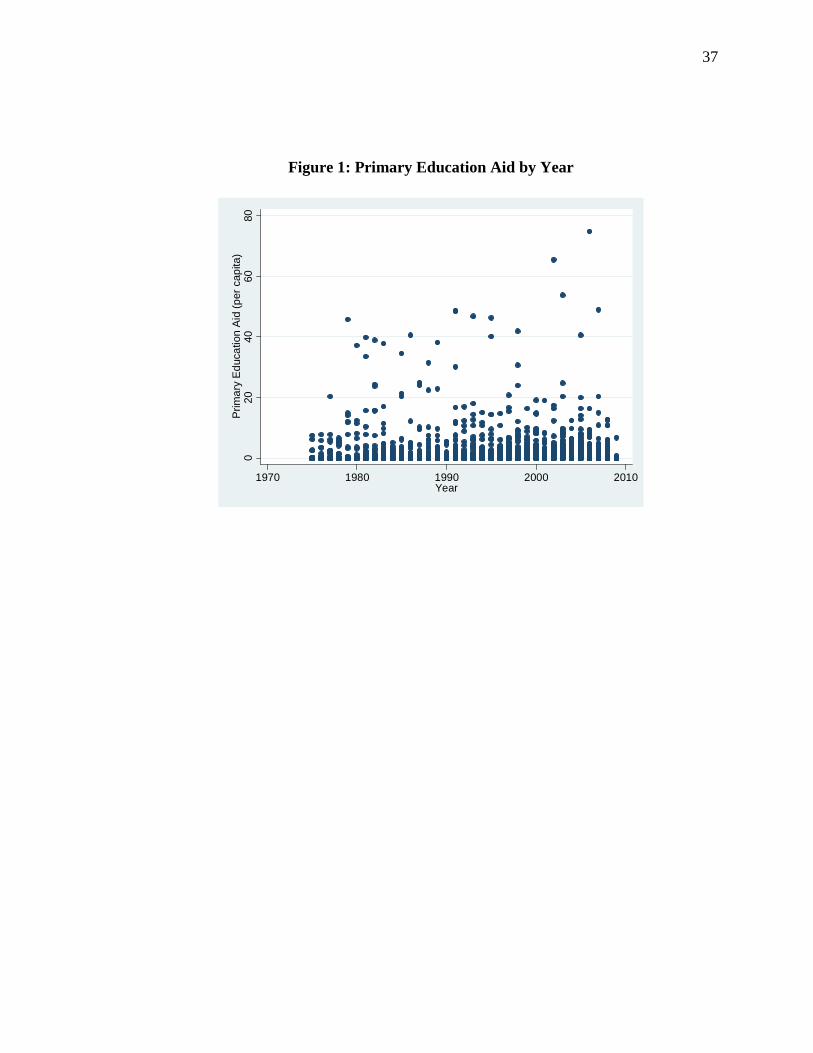
education aid over time can be seen in Figure 1.
**Figure 1 here**
Figure 1 suggests that per-capita primary education aid concentrates at a very low level:
between 0 and 10 dollars per capita, with a low average of roughly 1 dollar per capita. In
essence, while we see that the values of primary education aid nominally increase over time,
most aid per capita levels remain fairly static. Thus, over the past three decades, the majority of
primary aid has remained at a relatively low level per-capita, though some countries have seen
substantial increases over time.
To more fully specify our model, we have included a number of control variables. These
controls follow standards set forth in prior literature on both aid effectiveness and school
enrollments. Most of our control variable data comes from the 2009 World Development
Indicators (WDI) published by the World Bank (2010). Our measure for income is the WDI’s
Gross Domestic Product per capita (US$ 2000), as included both by Michaelowa and Weber
(2007) and Dreher et al. (2008).
Considering the important connection between child health and school attendance
demonstrated by the enrollment literature, we include infant mortality rates as a proxy variable
for health, presuming that a country’s infant mortality rates should have significant impacts on
enrollments. We use the WDI’s infant mortality rate per 1,000 births as our proxy measure.

16
Following previous literature, we also include a control for the percentage of the population in a
country that is below the age of 15 ([Dreher et al., 2008] and [Michaelowa and Weber, 2007]).
This measure is intended to hold constant the level of strain that the education system places on a
society. Countries with higher proportions below the age of 15 will have more potential students
attending school and a smaller proportion of adults to provide and pay for education.
Moving to our variables of interest, much literature on aid effectiveness in general and
education aid in particular includes measures for governance and democracy, largely following
the findings of Burnside and Dollar that the quality of government institutions influences aid
outcomes (2000). Previous education and aid articles use the Freedom House index, government
expenditures, and other proxy variables to account for government influence on education
outcomes ([Dreher et al., 2008] and [Michaelowa and Weber, 2007]). In a similar manner, we
include the Polity 2 measure published in the 2008 edition of the Polity IV database as one of
two proxy measures for governance. This measure provides a scale for the level of democracy in
a country from -10 to 10. Countries with a -10 score are highly authoritarian and countries with a
10 score are highly democratic. Previous literature suggests that countries with more democratic
institutions should more effectively use education aid (Michaelowa and Weber, 2007).
Additionally, we include a measure of corruption provided by the International Country Risk
Guide (ICRG) as a second measure of governance. The ICRG measure assesses perceptions of
corruption by businesspeople and diplomats working with the countries in question. It is scaled
from 1 to 6, with higher values indicating lower levels of corruption (PRS Group, 2009). We
note that all covariates are specified under a number of lag structures ranging from two to nine
years, corresponding with the rolling sums applied to the aid independent variables. All models
were conducted separately for each lag specification. Data on school enrollment – which is the

17
measure of our dependent variable – are taken from the WDI (World Bank, 2010). All raw
enrollment data are measured in percentage values. Data coverage becomes more thorough in the
mid-1990s, which is when we begin our analysis. The WDI dataset records the proportion of
children per year enrolled in primary education programs. Data on enrollments are also skewed,
so we again transformed the data using the logarithm. Some of the enrollment data were missing
from the sample, but the values universally changed slowly over time. This enabled us to
smooth the values over the gaps using a two-year rolling average and thus to increase the number
of observations accordingly.
**Table 1 here**
As the table indicates, primary education aid evinces a startlingly low mean – barely
more than 1 dollar per capita each year. As Figure 1 suggests, the majority of aid totals have
remained at roughly this level across the years in the sample. The minimal average amount of
primary education aid per capita over time suggests neglect by donors of basic schooling in
recipient countries. As such, we worry at the outset that the extremely low amounts of education
aid may not have significant effects on outcomes – not so much because they are targeted poorly
or captured as because the project dollars are ultimately trivial. When pooled with all aid for
education the total is still quite low but rises to nearly $7 per capita. To put this in context, the
median primary education expenditure per capita for the countries in our sample is $33 (mean =
$51). So education aid represents, on average, roughly one fifth to one eighth of government
expenditures on primary education in poor countries. By comparison, upper-middle income

18
countries spend an average of $237 (median = $220) per capita on primary education per year
and upper-income countries $1,325 (median = $1,228).3
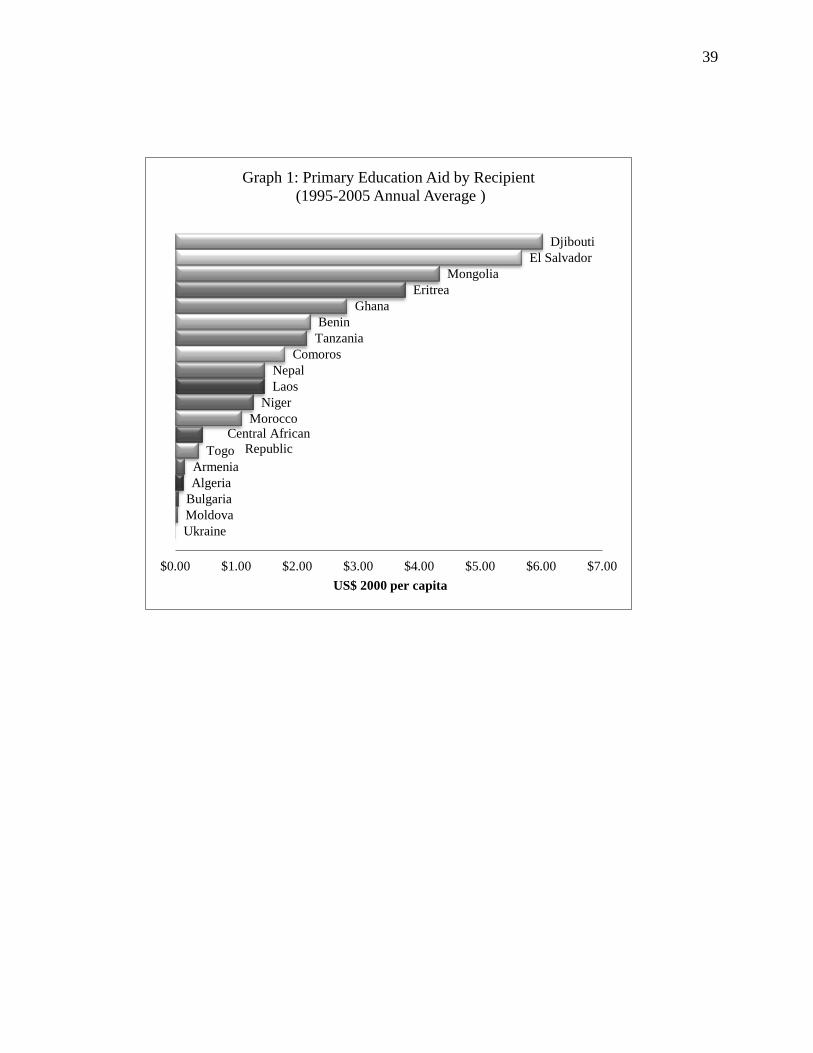
Nevertheless, the average amounts of education aid mask some significant cross-sectional
variation, as the high standard deviations in Table 1 suggest. Graph 1 (below) shows the
variation in the average annual primary education aid received per capita for a random sample of
twenty low- and low-middle income countries. Indeed, our initial example of Eritrea suggests
that aid sometimes provides a very large share of government education expenditures. Roughly
16 percent of poor countries receive education aid dollars that exceed the average basic
education expenditures of $33 per capita for the sample countries.
Notably, the French collectivity of Mayotte near Mozambique in the Indian Ocean
received an astounding $59 million in primary education aid per year in 2007 and 2008 to
provide primary schooling for an estimated population of 194,000 people. The archipelago
nation is so small that statistics are missing from official compendiums, but if the islands host
roughly the same proportion of children with the same enrollment rates as the average from our
sample (37 and 83 percent, respectively), per-pupil aid for primary education would be $994 –
on par with total primary education expenditures in upper-middle-income countries.
Additionally, the tiny French island territory of Wallis and Futuna in the South Pacific received
$10 million per capita in basic education aid in 2007 and 2008 for its population of 15,000 (our
estimated aid per pupil is $849). France, no surprise, provided all four aid projects, suggesting
that it pays to be schoolchildren in at least some French island colonies. Such wide cross-
sectional (and time series) variation in education aid suggests the need for a systematic
assessment of its effects on enrollment rates in recipient countries.
**Graph 1 here**
19
4. METHODS
For our initial estimation, we employed a latent-growth, structural equation, mixed
effects, or hierarchical linear model (HLM). This type of multilevel model is appropriately used
to analyze time-series cross-sectional data like those found here. One drawback of the pooled
time-series OLS method often used in aid-growth research is the significant differences in both
intercepts and slopes across the countries being analyzed. With the type of data used for aid
research, individual observations are at the country-year level, and OLS models require the
trajectory for each group over time to be uniform. However, we should expect each country in
the model to have very different characteristics, starting points, and trajectories, so the
coefficients likely vary significantly by country. In other words, countries have different
numbers of aid observations, different aid growth rates, and other diverse characteristics that
create significant variance across panels that OLS cannot capture. Latent growth curve models
account for such variation (Meredith and Tisak, 1990). HLM allows the parameters of the
regression to vary by country.
We submit that HLM provides a good solution for two-level, multiple-group datasets like
the one employed here. While not yet applied widely in the development literature, latent growth
models have found frequent use in research evaluating group trends in education outcomes while
allowing for significant variation across individuals ([Li et al., 2000], [Burchinal and
Appelbaum, 1991] and [Duncan and Duncan, 1995]). In terms of the wide variation in intercept
and slope of our countries across time, we face similar variance as would be found when
measuring individual responsiveness to group education interventions. In a more familiar
development context, latent growth estimation has recently been used to model the effectiveness
of health-sector aid (Wilson, 2009).

20
HLM also poses a more challenging hurdle for the argument that education aid boosts
enrollments and thus provides a more conservative test of the model. Specifically, HLM methods
account for potentially unobserved development factors that cluster by country and that stem
from those idiosyncratic development trajectories. However, while HLM solves issues inherent
in comparability of variables across time, it does not specifically address endogeneity concerns.
Reverse causality is a frequent problem in analyses of aid effectiveness. In our case, aid
allocation may be influenced by a country’s enrollment rates just as aid may influence
enrollment. To address potential endogeneity in our model, we estimate the allocation of
education aid separately from enrollments. Then we include the relevant control variables that
affect allocation when estimating enrollment. A more elaborate two-stage model was attempted
to estimate these related effects and reduce the potential endogeneity. However, we were unable
to find appropriately exogenous instruments for such a model, and have thus forgone
simultaneous estimation.4 Bereft of appropriate instruments for two-stage estimation, our
perceived causal effects of bilateral primary education aid on enrollments may be misconstrued.
Potentially, some bilateral donors, using some unobserved criteria, select aid recipients that are
more prone to increase enrollments than do multilateral donors. Our controls, determined
partially through the allocation model, are meant to reduce these selection effects. However, the
endogeneity potential in these models prompts us to modulate the claims about that the results
suggest. Our analysis proceeds in two steps: (1) Estimation of primary aid allocation using HLM
and (2) estimation of the effects of primary education aid on school enrollment using HLM.
(a) Education Aid Allocation

21
Modeling our argument that donors may condition their aid on recipient governance, we
first employ HLM methods to estimate a model of primary-education aid allocation. The model
may also suggest control variables for the estimation of enrollment that may help to reduce
endogeneity bias. Dependent variables are current year per-capita primary education values,
divided between bilateral and multilateral totals. For clarification, this model does not consider
the determinants of dyadic aid allocation. Rather, it evaluates the gross amount of primary
education aid allocated to a specific country from bilateral or multilateral donors as wholes. We
accept that donor strategies are a key player in aid allocation; however, this model attempts to
capture bilateral donor strategy writ large instead of at the individual donor level.5
**Table 2 here**
These results indicate that democracy is a significant predictor of aid allocation for both
bilateral and multilateral donors (see Table 2). Against expectations, multilateral donors do seem
to discriminate by democracy levels of recipients when allocating primary-education aid. The
results suggest that bilateral donors, as predicted, also condition primary-education aid on
democracy levels. Substantively, the results also appear significant. The results suggest that a
ten-point shift in the polity score (say, from a partial to full democracy) may lead to a 13 percent
increase in primary-education aid. While encouraging, we note that democracy may be a less
direct indicator of governance quality than is control of corruption. Despite the intrinsic
importance of democratic institutions, democratic countries do not necessarily have more
efficient or less corrupt governments than do autocratic nations. It encouraged us normatively

22
that multilaterals condition on democracy, but we also note that corruption-perception indices
may say more about a country’s proclivity to use aid dollars well.
We further find that the corruption index serves as a significant predictor of primary
education aid for bilateral donors only. Substantively, a shift from partial to full control of
corruption (from 3 to 6 on the ICRG scale) could result in an 18 percent increase in aid for
primary education. These results suggest that bilateral donors consider both democracy levels
and corruption levels when allocating aid for primary education, which indicates that they may
indeed be attempting to address the adverse-selection problem by focusing on governments that
may use aid dollars more productively. While not conclusive, this result suggests some evidence
indicates for our hypothesis concerning bilateral aid allocation. Bilateral donors seem to pay
more attention than multilaterals to a recipient’s control of corruption when allocating
educational foreign aid. While multilateral donors also seem attentive to democracy levels, we
note that corruption levels may provide a more telling proxy for overall government quality. The
results of the allocation model also recommend the inclusion of democracy and corruption as
control variables in our estimation of the effects of aid on enrollment to reduce selection bias. If
democracy and corruption influence donor allocation, their inclusion as controls should address
some of the potential endogeneity in our estimation of aid on enrollment.
(b) Primary education aid and primary school enrollments
We next estimate the overall effect of primary-education aid on school enrollment. We
employ control variables for all foreign aid (minus aid to education) and all education aid (minus
aid to primary education). While these variables allow us to isolate the effects of primary-only
aid, collinearity may reduce the precision of the estimates, but they should not bias results and
23
are warranted theoretically. We note again that the aid figures are analyzed as a sum of five
previous years (t-1 to t-5), allowing us to observe cumulative effects of primary education aid on
education outcomes. Intuitively, aid effectiveness, when measured at the country level, should be
viewed aggregately over time. Consider, for example, time-intensive processes such as school
construction, teacher training, or education-sector reform that may take several years to show
effects. Since projects have differing timeframes for implementation, this summation method
accounts for the time needed to observe “on-the-ground” effects of aid. For clarification, these
five-year rolling sums do not reduce our observations to five-year intervals. Instead, every
country-year observation in the dataset has an aid total that reflects an aid sum for the previous
one to five years of aid receipts. Thus, for each observation, we look at an aggregate effect of aid
over a period of years, instead of just one allocation for one lagged year.
We also estimate each model for both aggregated aid flows and for disaggregated bi- and
multilateral aid flows, allowing us to better discern the conditions under which aid appears to
have the greatest relationship with enrollment. The primary connection between this estimation
and the allocation model is the inclusion of democracy and corruption control variables. As is
shown in the allocation model, these variables likely play a role in donor’s allocation decisions
for primary education aid, especially among bilateral stakeholders. Thus, we use these indicators
to control for potential reverse-causality between aid allocation and enrollment rates.
**Table 3 here**
Initial estimations utilizing aggregate aid as the major descriptive variable are
inconclusive about the relationship between aid and enrollment (see Table 3). Control variables
24
here act as expected – significant coefficients bear the expected signs. Notably, the results
suggest that control of corruption significantly boosts enrollment. Likewise, democracy may
positively affect enrollment, though the results are less stable across specifications, and often
show statistical significance below acceptable levels.6 Furthermore, results indicate a strong
effect of infant mortality rates – the health proxy – on enrollment. Across specifications, the
variable shows significance above the 5 percent level, and results appear substantive as well. We
note that all explanatory variables were included in the regression under various specifications
ranging from the cumulative effects from the previous two to nine years. Furthermore, the
control variables were taken as smoothed values from the previous two to nine years. While our
primary regressions reported here use five-year aid sums with five-year rolling lagged averages
for the other variables, our relevant findings remained robust across each specification.
Our most telling results emerge as we move to the models disaggregating bilateral and
multilateral aid flows. Across all models, control-variable effects hold constant, but bilateral
primary-education aid shows positive and significant effects on enrollment rates; multilateral aid
remains insignificant. Ceterus paribus, bilateral aid to primary education appears to be more
significantly related to education outcomes than is comparable multilateral aid. When evaluated
aggregately, collective aid to education appears unrelated to enrollment rates at conventional
significance levels. However, when disaggregated, bilateral aid is significantly related to
enrollment; multilateral aid does not appear to affect enrollment significantly. Corruption
remains an important predictor of enrollment, as does child health, for both bilateral and
multilateral estimations. Both are significant at the 5 percent level or better. Adult literacy also
remains a highly significant predictor of enrollment growth.

25
The substantive significance of bilateral primary-education aid is fairly modest, however.
It would take a doubling of bilateral aid for primary education to raise enrollments by 2.3
percent. The very low median levels of primary-education aid further weaken our ability to draw
conclusions from this analysis. However, these very low levels of bilateral primary-education aid
also indicate that perhaps a doubling (or more) is within the realm of possibility, particularly if
donors reallocate existing aid from other sectors to primary education. In sum, while they are not
definitive, the results suggest that bilateral donors may condition their primary-education aid on
control of corruption better than multilateral donors. This conditioning may then result in more
effective use of education aid dollars to improve primary school enrollment.
5. CONCLUSIONS AND IMPLICATIONS
The results included here suggest some reinforcing evidence for previous findings that
primary-education aid may cause limited increases to school enrollment. However, the results
also suggest that those effects may not be universal. Indeed, separating bilateral from
multilateral aid produces significantly different results for the two types. Consistent with our
hypothesis, the results suggest that bilateral aid may overcome the problem of adverse selection
somewhat better than multilateral aid. The allocation models included point to the possible
mechanism: bilateral donors may condition their primary-education aid on recipients’ quality of
governance. Without simultaneous estimation, we cannot definitely state that education aid
effectiveness results from governance-based bilateral aid allocation. However, our two models
are reasonably suggestive of such a connection, and further research may be directed toward
substantiating these claims.
26
Since governance quality remains a broadly specified concept that is difficult to measure,
we rely more heavily on corruption-perception indices as a proxy for governance. Multilateral
donors appear also to select recipients according to democracy levels, which we argue may be a
weaker indicator of governance quality – at least as it pertains to making aid effective. But,
unlike multilateral donors, bilateral donors appear to add control of corruption as a criterion for
allocation, which may help explain the greater effectiveness of bilateral aid suggested by the
results of the enrollment models. Corruption levels are indicative of a government’s ability to
allocate resources efficiently and administer effectively, and we expect that such factors should
have the greatest impact on aid effectiveness. Interestingly, Eritrea has received twice as much
multilateral primary education aid as bilateral education aid, lending some anecdotal support to
the suggestive findings on aid type and effectiveness.
We also caution that these results rest on objectively low levels of primary education aid
in the first place. Perhaps we simply should not expect a bare $1 per capita (or $3.50 per pupil)
to do much to compel children to go to school at higher rates. So while aid advocates may be
tempted to use these results as evidence that more aid is needed, we emphasize that we
encountered minimal evidence that more aid leads to better education outcomes in general. We
tentatively suggest that bilateral donors appear to be able to make their primary-education aid
effective in promoting school enrollment; however, these results are substantively small and not
definitive.
The results presented may provide a less sanguine view of education aid than prior
studies. Three factors may account for the disparity. These same factors serve to highlight the
major value this study adds to the aid effectiveness literature. First, the more comprehensive
project information provided by AidData broadened the sample in a heterogeneous way,
27
allowing for a more complete assessment of multilateral development finance alongside bilateral
aid. Second, we focus analysis on the specific effects of aid exclusively directed to primary
education as opposed to education aid in the main. This enabled a finer-grained analysis of
education-aid effectiveness, and it suggested room for reassessment of education aid priorities.
Third, we used an estimation procedure, latent-growth modeling, that we believe provides
a more conservative and appropriate test for pooled time-series data. In pooled time series, not
only do intercepts differ markedly among the panels, but coefficients also diverge substantially.
Accounting for differences in country trajectories – rather than pooling all coefficients jointly –
should provide a higher hurdle for observational studies of aid effectiveness. Our view is that
scholars should err on the side of caution, particularly when their findings have policy relevance.
While our findings proved somewhat robust to the Generalized Method of Moments (GMM)
model used by Dreher et al., (2008), we failed to find adequately exogenous instruments.
Instead, we sought to reduce endogeneity by (1) modeling factors that affect donor allocation of
educational aid and then (2) including the key variables from that model as covariates in our
analysis of education aid effectiveness. While a two-stage model is preferable, the absence of
adequate instruments in our initial tests demands this less elegant method. What is more, latent-
growth models preclude simultaneous estimation with instruments. Latent growth models appear
appropriate methodologically for our data, even if the results are less suggestive than GMM of
positive general effects for basic education aid on primary school enrollments. We again note,
however, that our model does not account for all potential endogeneity, somewhat decreasing our
confidence in the findings.
An interesting finding presented here involved the consistent results across the various
models suggesting that public health in developing countries appears to be a robust predictor of
28
school enrollments. This result reinforces theory and findings from prior studies. We
recommend that future analyses continue comprehensive examinations of the potential effects of
health levels on education outcomes. To the degree that health aid can be made effective (and
we emphasize that such associations need to be credibly established a priori), attention should be
given to its potential positive spillover effects on education outcomes.
Little robust evidence suggests a broad and general causal link between primary
education aid and primary school enrollment, and our results, again reinforcing prior findings,
suggest some mechanisms that may condition aid effectiveness. To what degree does corruption
prevent aid dollars from reaching their intended recipients? Consider the well-known study by
Reinikka and Svensson, which presented (contested) evidence that bureaucratic and political
“capture” prevented education funding from reaching many Ugandan schools (2005).
We of course risk banality when we suggest that further research may most effectively
focus on a narrower picture of education aid effectiveness. Further studies on specific aspects of
education and development, in the vein of Reinikka and Svensson, may help ascertain which
types of education projects are most effective, thereby making a more helpful contribution to the
policy discussion on aid. Better evaluations of who gets education aid and why they receive it
may help us understand the effects of donor aid policies on enrollment growth. While this study
suggests caution in associating primary education aid generally with school enrollments, a more
“bottom-up” perspective on aid donations may help us tease out the ways that developed nations
and multilateral institutions can effectively contribute to education improvement and human
development.
29
Endnotes
1 At all international financial institutions multiple countries share the vast majority of
seats on the executive boards within “constituencies.” Only a few of the largest and most
powerful countries hold their own, unshared seats.
2 Interviews with Cinnamon Dornsife and John Austin, former Executive Directors at the
Asian Development Bank, and Jan Piercy, former Executive Director at the World Bank.
Interviews conducted in Washington, D.C. in June 2005.
3 Per pupil – as opposed to per capita – figures are higher: means of $171 per pupil in
low- and lower-middle-income countries, $1,034 in upper-middle-income countries, and $7,405
in high-income countries. Aid per pupil to poor countries also rises concomitantly: $3.55 per
pupil for primary education aid, $22.56 for all education aid. Percentages, of course, remain the
same (World Bank, 2010).
4 We performed a robustness check using generalized method of moment (GMM)
estimation employing instruments (UN Security Council membership and energy aid). The
effects of bilateral aid on enrollments were significant in some specifications using different lag
structures, controls, and instruments. But the results were not stable across specifications.
However, exogeneity tests for all of the instruments suggested that they were inappropriately
weak and not sufficiently exogenous. By contrast, Dreher et al. found that the same instruments
were exogenous but weak. Thus, we place little emphasis on this robustness check.
5 Following prior research on dyadic aid allocation, we included recipient membership on
the UN Security Council as an explanatory variable in model (Dreher et al., 2009). However, the
results were not significant, and were excluded from the final table. Lagged enrollment rates
were also included as explanatory variables in the allocation model and were also insignificant.

30
The table reports our most efficient estimations of the effects of governance – measured by
corruption and democracy levels – on bilateral and multilateral aid allocation.
6 Another possible estimation strategy would interact both corruption and democracy
with bi- vs. multilateral aid to probe the conditional effects of aid multiplied by governance. We
attempted this specification, but results were not robust to the inclusion of the interaction terms,
likely due to high collinearity. However, since the allocation model demonstrated significant
governance selection effects, particularly for bilateral aid, we suggest here that the conditioning
effects of governance likely occur at the allocation stage. We thus contend that estimating
allocation and enrollment separately is the more appropriate estimation strategy.

31
References
Alderman, H., Behrman, J. R., Lavy, V., & Menon, R. (2001). Child health and school
enrollment - a longitudinal analysis. Journal of Human Resources, 36 (1), 185-205.
Arrow, K. (1965). Aspects of the Theory of Risk-Bearing. Helsinki: Yrjö Jahnssonin Säätiö.
Asiedu, E., & Nandwa, B. (2007). On the impact of foreign aid in education on growth: How
relevant is the heterogeneity of aid flows and the heterogeneity of aid recipients? Review
of World Economics, 143(4), 631-649.
Banerjee, A. V., Cole, S., Duflo, E., & Linden, L. (2007). Remedying education: Evidence from
two randomized experiments in India. Quarterly Journal of Economics, 122 (3), 1235-
1264.
Barro, R. & Lee, J. (2001). International data on educational attainment: Updates and
implications. Oxford Economic Papers, 2001 (3),541-563.
Beasley, N. M. R., Hall, A., Tomkins, A. M., Donnelly, C., Ntimbwa, P., Kivuga, J., Kihamia,
C.M., Lorri, W. & Bundy, D.A.P. (2000). The health of enrolled and non enrolled
children of school age in Tanga, Tanzania. Acta Tropica, 76, (3), 223-229.
Behrman, J. R. (1996). Measuring the effectiveness of schooling policies in developing
countries: Revisiting issues of methodology. Economics of Education Review, 15 (4),
345-364.
Bennell, P. (2002). Hitting the target: Doubling primary school enrollments in Sub-Saharan
Africa by 2015. World Development, 30 (7), 1179-1194.
Bermeo, S. (2010). Development and strategy: Aid allocation in an interdependent world.
Manuscript, Duke University, Durham, NC.
32
Brown, D. S. (1999). Reading, writing, and regime type: Democracy's impact on primary school
enrollment. Political Research Quarterly, 52 (4), 681-707.
Burchinal, M. & Appelbaum, D. (1991). Estimating individual developmental functions:
Methods and their assumptions. Child development, 1991 (1),62-91.
Burnside, C. & Dollar, D. (2000). Aid, policies, and growth. The American Economic Review,
90 (4), 847-868.
Case, A. & Deaton, A. (1999). School inputs and educational outcomes in South Africa.
Quarterly Journal of Economics, 114 (3), 1047-1084.
Clemens, M. (2004). The long walk to school: International education goals in a historical
perspective. Center for Global Development Working Paper, no. 37.
Deininger, K. (2003). Does cost of schooling affect enrollment by the poor? Universal primary
education in Uganda. Economics of Education Review, 22 (3), 291-305.
Dreher, A., Sturm, J. E., & Vreeland, J. R. (2009). Development aid and international politics:
Does membership on the UN Security Council influence World Bank decisions? Journal
of Development Economics, 88(1), 1-18.
Dreher, A., Nunnenkamp, P. & Thiele, R. (2008). Does aid for education educate children?
Evidence from panel data. The World Bank Economic Review, 22, (2), 291-314.
Duncan, T. & Duncan, S. (1995). Modeling the process of development via latent variable curve
growth methodology. Structural Equation Modeling: A Multidisciplinary Journal, 2 (3),
187 – 213.
Easterly, W., Levine, R. & Roodman, D. (2004). Aid, policies, and growth: Comment. American
Economic Review, 94 (3), 774-780.
33
Easterly, W. (2006). The white man’s burden: Why the West’s efforts to aid the Rest have done
so much ill and so little good. Oxford, UK: Oxford University Press.
Filmer, D. & Pritchett, L. (1999). The impact of public spending on health: Does money matter?
Social Science & Medicine, 49 (10), 1309-1323.
Findley, M. G., Hawkins, D., Hicks, R. L., Nielson, D.L., Parks, B.C., Powers, R.M., Roberts,
J.T., Tierney, M.J., & Wilson, S. (2009). AidData: Tracking Development Finance,
presented at the PLAID Data Vetting Workshop, Washington, DC.
Glewwe, P. & Jacoby, H.G. (1995). An economic-analysis of delayed primary-school enrollment
in a low-income country - the role of early-childhood nutrition. Review of Economics and
Statistics, 77 (1), 156-169.
Handa, S. & Peterman, A. (2007). Child health and school enrollment - a replication. Journal of
Human Resources, 42 (4), 863-880.
Huisman, J. & Smits, J. (2009). Effects of household- and district-level factors on primary school
enrollment in 30 developing countries. World Development, 37 (1), 179-193.
Kazeem, A., Jensen, L., & Stokes, C.S. (2010). School attendance in Nigeria: Understanding the
impact and intersection of gender, urban-rural residence, and socioeconomic status.
Comparative Education Review, 54 (2), 295-319.
Knack, S. (2001). Aid dependence and the quality of governance: Cross-country empirical tests.
Southern Economic Journal, 68 (2), 310-329.
Li, F., Duncan, S., & Acock, A. (2000). Modeling interaction effects in latent growth curve
models. Structural Equation Modeling, 7(4), 497–533.

34
Lyne, M. M., Nielson, D.L., & Tierney, M.J. (2009). Controlling Coalitions: Social Lending at
the Multilateral Development Banks. Review of International Organizations, 4 (4), 407-
433.
Meredith, W. & Tisak, J. (1990). Latent curve analysis. Psychometrika, 55, 107–122.
Michaelowa, K., & Weber, A. (2008). Aid effectiveness in primary, secondary, and tertiary
education. Paper commissioned for the EFA Global Monitoring Report 2008, Education
for All by 2015: will we make it?
Michaelowa, K. & Weber, A. (2007). Aid effectiveness in the Education Sector: A Dynamic
Panel Analysis, in: S. Lahiri (ed.): Theory and Practice of Foreign Aid, Amsterdam
(Elsevier), pp. 357-385, forthcoming
Miguel, E. & Kremer, M. (2004). Worms: Identifying impacts on education and health in the
presence of treatment externalities. Econometrica, 72 (1), 159-217.
Neumayer, E. (2003). The Pattern of Aid Giving: The Impact of Good Governance on
Development Assistance. London, UK: Routledge.
Nielson, D. L., & Tierney, M.J. (2005). Theory, data, and hypothesis testing: World Bank
environmental reform redux. International Organization, 59(3), 785-800.
Pauly, M. V. (1974). Overinsurance and the public provision of insurance: The roles of moral
hazard and adverse selection. The Quarterly Journal of Economics, 88 (1), 44-62.
PRS Group, Inc. (2009). International country risk guide (ICRG) researchers’ dataset. [computer
file]. East Syracuse, NY: The PRS Group, Inc. [producer and distributor], 2009.
Pritchett, L. (2001). Where has all the education gone? The World Bank Economic Review,
15(3), 367-391.

35
Rajan, R.G., & Subramanian, A. (2008). Aid and growth: What does the cross-country evidence
really show? Review of Economics and Statistics, 90 (4), 643-665.
Rajkumar, A. S. & Swaroop, V. (2008). Public spending and outcomes: Does governance
matter? Journal of Development Economics, 86 (1). 96-111.
Reinikka, R. & Svensson, J. (2005). Fighting corruption to improve schooling: Evidence from a
newspaper campaign in Uganda. Journal of the European Economic Association, 3 (2-3),
259-267.
Scheerens, J. (2001). Monitoring school effectiveness in developing countries. School
Effectiveness and School Improvement, 12 (4), 359-384.
Schultz, T. P. (1999). Health and schooling investments in Africa. Journal of Economic
Perspectives, 13 (3), 67-88.
Tierney, M.J., Nielson, D., Hawkins, D. G., Roberts, J.T., Findley, M.G., Powers, R.M., Parks,
B. Wilson, S., & Hicks, R.L. (2011). More Dollars than Sense? Addressing Knowledge
Scarcity in Development Finance. World Development Journal, Special Issue.
United Nations. United Nations Millennium Development Goals.
http://www.un.org/millenniumgoals/education.shtml [accessed 10 March 2010].
Urquiola, M. & Calderon, V. (2006). Apples and oranges: Educational enrollment and attainment
across countries in Latin America and the Carribean. International Journal of
Educational Development, December 26, 572-590.
Wilson, S. (2009). The ineffectiveness of health sector foreign aid on infant and child mortality,
1975-2005. Working paper, Brigham Young University, September 12, 2009.
Winters, M. S. (2010). Choosing to target: What types of countries get different types of World
Bank projects. World Politics, 62 (3), 422-458.

36
World Bank. (2005). Review of World Bank Conditionality: Recent Trends and Practices.
http://siteresources.worldbank.org/PROJECTS/Resources/40940-
1114615847489/conditionalitytrends7-20.pdf [accessed 17 February 2011].
World Bank. (2010). World Development Indicators Online. DDP Quick Query. http://ddp-
ext.worldbank.org/ext/DDPQQ/member.do?method=getMembers&userid=1&queryId=6
[accessed 1 August 2010].
37
Figure 1: Primary Education Aid by Year
020
4060
80P
rimar
y E
duca
tion
Aid
(per
cap
ita)
1970 1980 1990 2000 2010Year

38
Table 1: Descriptive Statistics Variable N Mean Std. Dev. Minimum Maximum
WDI Enrollment Rate 921 80.33 17.30 21.43 99.78 Primary Education Aid (pc) 2313 1.55 6.11 0 148.73 Bilateral Primary Education Aid (pc)
2313 .71 4.39 0 148.34
Multilateral Primary Education Aid (pc)
2313 .84 3.35 0 74.86
Other Education Aid (pc) 2313 6.10 26.89 0 840.56 All Other Aid (pc) 2313 89.82 163.84 0 2640.53 Corruption (ICRG) 1062 2.68 1.01 0 5 Polity2 1742 1.61 6.14 -10 10 GDP (pc) 2313 1154.72 977.73 62.24 3854.10 Infant Mortality Rate 750 77.57 59.18 7.2 286.9 Adult Literacy Rate 243 73.29 22.46 9.39 99.75 Child Population % 2263 37.03 8.44 13.41 51.46
39
Ukraine Moldova Bulgaria Algeria Armenia
Togo Central African
Republic
Morocco Niger
Laos Nepal
Comoros Tanzania Benin
Ghana Eritrea
Mongolia El Salvador
Djibouti
$0.00 $1.00 $2.00 $3.00 $4.00 $5.00 $6.00 $7.00 US$ 2000 per capita
Graph 1: Primary Education Aid by Recipient (1995-2005 Annual Average )

40
Table 2: Aid Allocation and Donor Selectivity
Dependent Variable: Bilateral and Multilateral Primary Education Aid
Bilateral Aid 1
Bilateral Aid 2
Multilateral Aid 1
Multilateral Aid 2
GDP (log, per capita) ***-0.1020 -0.0484 -0.0353 0.0841 (0.0332) (0.0703) (0.0227) (0.0521) Democracy ***0.0132 *0.0119 ***0.0112 **0.0117 (0.0043) (0.0071) (0.0034) (0.0052) Control of Corruption ***0.0630 ***0.1250 0.0285 0.0115 (0.0215) (0.0417) (0.0213) (0.0369) Infant Mortality Rate 0.0021 *0.0030 (0.0021) (0.0016) Adult Literacy Rate 0.0037 0.0011 (0.0028) (0.0019) Year ***0.0242 ***0.0258 0.0044 *-0.0117 (0.00361) (0.00729) (0.0032) (0.0068) Constant ***-47.790 ***-51.320 -8.498 *22.890 (7.203) (14.71) (6.407) (13.600) N 1330 555 1330 555 Countries 85 74 85 74 Standard errors in parentheses *** p<0.01, ** p<0.05, * p<0.1 All independent variables reported as 5-yr. rolling average

41
Table 3: Primary Education Aid & Primary Enrollments
Dependent Variable: Primary School Enrollment (log)
(1) (2) (3) (4) (5) (6)
Primary Education Aid 0.00363 0.00686 0.00622
(0.00) (0.00) (0.00) Bilateral Primary Education Aid 0.00742** 0.0232*** 0.0221***
(0.00) (0.01) (0.01) Multilateral Primary Education Aid -0.00128 -0.00372 -0.00371
(0.00) (0.00) (0.00) Other Education Aid (total) 0.00227 0.00357 0.0032 0.00235 0.00279 0.00228
(0.00) (0.01) (0.01) (0.00) (0.01) (0.01)
All Other Aid (total) 0.00538 0.00842 0.00787 0.00549 0.0096 0.00929
(0.01) (0.01) (0.01) (0.01) (0.01) (0.01)
GDP (per capita) 0.0697*** 0.0804*** 0.0624** 0.0693*** 0.0847*** 0.0642**
(0.02) (0.02) (0.03) (0.02) (0.02) (0.03)
Adult Literacy Rate 0.00124* 0.00236*** 0.00214** 0.00114* 0.00228*** 0.00204**
(0.00) (0.00) (0.00) (0.00) (0.00) (0.00)
Control of Corruption 0.0244** 0.0228** 0.0236** 0.0224**
(0.01) (0.01) (0.01) (0.01)
Democracy 0.00349 0.00391* 0.00398* 0.00428*
(0.00) (0.00) (0.00) (0.00)
Infant Mortality Rage -0.00144** -0.00132**
(0.00) (0.00)
% Population Under 14 0.00224 0.00113
(0.00) (0.00)
Year 0.0105*** 0.0111*** 0.00995*** 0.0105*** 0.0103*** 0.00902***
(0.00) (0.00) (0.00) (0.00) (0.00) (0.00)
Constant -17.28*** -18.82*** -16.29** -17.23*** -17.12*** -14.42**
(4.86) (6.53) (6.46) (4.87) (6.52) (6.51)
N 592 384 384 592 384 384
Countries 97 63 63 97 63 63 Standard errors in parentheses
*** p<0.01, ** p<0.05, * p<0.1
Aid variables represent logged sum of previous 5 years of aid
Rolling average of previous five years applied to other variables