document resume ed 369 996 ce 066 590 title patterns … · title patterns and predictors of client...
TRANSCRIPT

DOCUMENT RESUME
ED 369 996 CE 066 590
TITLE Patterns and Predictors of Client Attendance.National Evaluation of Adult Education Programs.Third Interim Report.
INSTITUTION Development Associates, Inc., Arlington, Va.SPONS AGENCY Department of Education', Washington, DC. Office of
the Under Secretary.PUB DATE Apr 94CONTRACT LC90065001NOTE 99p.; For the First Interim Report, see ED 354 371;
for the Second Interim Report, see ED 364 125.PUB TYPE Reports Evaluative/Feasibility (142)
EDRS PRICE MF01/PC04 Plus Postage.DESCRIPTORS *Academic Persistence; *Adult Education; *Adult
Programs; Attendance; *Attendance Patterns; English(Sescond Language); *Enrollment; Enrollment Trends;*Federal Aid; Federal Legislation; Federal Programs;Program Effectiveness; Program Evaluation; SchoolHolding Power; Secondary Education; StudentAttrition
IDENTIFIERS Adult Education Act
ABSTRACTAn evaluation described the patterns of attendance
and the factors associated with the persistence of adult educationclients during the first 12 months following their enrollment infederally supported adult education programs. Data were gathered froma sample of 16,754 persons who entered a program durir: the 1-yearperiod beginning April 22, 1991. Findings indicated the following:about one-third of all new clients enrolled in September or October;85 percent of enrollees actually began instruction; of those whobegan instruction, clients studying English as a second languagereceived a median of 77 hours of instruction over 16 weeks, adultbasic education clients--31 hours over 10 weeks, and adult secondaryeducation clients--26 hours over 8 weeks; and 11 percent of all newenrollees continued into a second year of instruction. Newly enrolledclients were more likely to begin instruction if they were enrolledin smaller programs or programs that did not emphasize outreach andrecruitment activities, had low costs per client seat hour, or hadsubstantial integration of social services. Clients who attended for12 hours or more and those who attended for fewer hours were largelyindistinguishable. The strongest predictors of persistence weresupport services that clients actually use, receipt of instructionduring the day, and the type of learning environment. (Appendixesinclude study objectives, data collection forms, bias control issues,logistic regression summary tables, and index.) (YLB)
***********************************************************************
Reproductions supplied by EDRS are the best that can be madefrom the original document.
***********************************************************************

NATIONAL EVALUATION OFADULT EDUCATION PROGRAMS
Third Interim Report
PATTERNS AND PREDICTORS OF CLIENT ATTENDANCE
Prepared under contract for theDepartment of Education by:
De-elopment Associates, Inc.1730 North Lynn StreetArlington, VA 22209-2023
U.S. DEPARTMENT OF EDUCATIONOffice of Educattonal Research and Improvement
1UE CATIONAL RESOURCES INFORMATIONCENTER (ERIC)
Thts document has been reproduced asrecetved from the person or organtzattonongrnattng a
I' I Minor changes have been made to improvereproduchon Quaitty
Potnts ot view or optruons stated 1r, this docu-ment do not necessarily represent officialOE RI posaton or policy
U.S. DEPARTMENT OF EDUCATION OFFICE OF ThE UNDER SECRETARY
2 BEST COPY AVAILABLE

NATIONAL EVALUATION OFADULT EDUCATION PROGRAMS
Third Interim Report
PATTERNS AND PREDICTORS OF CLIENT ATTENDANCE
Contract No. LC90065001
April 1994
Prepared for:
U.S. Department of Education400 Maryland Avenue, S.W., Room 3122Washington, D.C. 20202
3
Prepared by:
Development Associates, Inc.1730 North Lynn StreetArlington, VA 22209-2023

This report is pursuant to Contract No. LC90065001. The names of the personsemployed or retained by Development Associates, Inc., with management or professionalresponsibility for this phase of 'he project mid this report are listed below. The amountto be charged to the U.S. Department of Education for the entirety of this contract isapproximately $2,839,740.
Project Director
Associate Director forData Processing and Analysis
Associate Director forField Operations
Evaluation Design andAnalysis Specialists
CASAS Project Directors
Malcolm B. Young
Mark A. Morgan
Howard L. Fleischman
Nicholas B. FitzgeraldCynthia HamillPaul J. HopstockKate HanleyLaura WilliamsThomas B. JabineLarry Hotchkiss
Patricia RickardVirginia K. Posey
The views expressed in this report developed under contract to the U.S. Department of
Education do not necessarily reflect the position or policy of the Department, and noofficial endorsement by the Department should be inferred.
4

EXECUTIVE SUMMARY
Study Purpose
In September 1990, the U.S. Department of Education initiated the national evaluationof federally supported adult education programs. The central purpose of the study isto evaluate the potential of programs supported by the Basic State Grants section ofthe federal Adult Education Act "for significantly reducing deficits in the adultpopulation with respect to literacy, English proficiency, and secondary education."The purpose of the evaluation's third interim report is to provide descriptiveinformation on attendance patterns of adult education clients and factors associatedwith their persistence in the program.
Sources of Information
The report draws primarily on data from a sample of persons who entered afederally supported adult education program during the 1-year period beginningApril 22, 1991. Attendance data for a 1-year period were obtained on 16,754 clients.In this report, the data hnve been weighted but no adjustments for nonresponse havebeen incorporated. As a result, numeric estimates will underestimate national counts.Weights have been used to provide unbiased national percentages and inferentialestimates.
Major Study Findings
Patterns of enrollment and attendance
About one-third of all new clients enroll in September or October.
Eighty-five percent of individuals who enroll in adult educationprograms actually begin instruction.
ESL clients who begin instruction receive a median of 77 hours ofinstruction over 16 weeks.
ABE clients who begin instruction receive a median of 31 hours ofinstruction over 10 weeks.
ASE clients who begin instruction receive a median of 26 hours ofinstruction over 8 weeks.
Eleven percent of all new enrollees continue into a second year ofinstruction.
5

Newly enrolled clients are more likely to begin instruction if they are enrolled in
Smaller-sized programs.
Programs that do not emphasize outreach and recruitment activities.
Programs that Z lave low costs per client seat hour.
Programs which have substantial integration of social services.
Differences between client populations who reach the federally defined 12-hourattendance threshold and those who do not
Clients who attend for 12 hours or more and those who attend for lessthan 12 hours are largely indisfinguishable.
There is no discernable change in the ath..on rate at or around the 12thhour of instruction.
There is little difference in the level of satisfaction with adult educationreported for those who attend at least 12 hours and those who do not.
Some clients are satisfactorily served by adult education in less than 12hours.
Distinguishing personal and programmatic characteristics of clients who receive arelatively large number of hours of instruction
Long-term persisters are likely to be those who use support services.
Long-term persisters are likely to receive instruction during the day,rather than evening.
Motivational variables do not discriminate persisters from nonpersisters.
In Adult Basic Education (ABE), older clients are more likely persistthan younger clients, but age is not a substantial predictor for AdultSecondary Education (ASE) or English as a Second Language (ESL).
ABE programs with relatively prestructured (as opposed to highlyindividualized) curricula are more likely to increase client persistence,but differences along this dimension of adult education instructionalcriteria are not predictive of persistence for clients in ASE or ESL.

ESL clients are more likely to persist when enrolled in large classes,ABE clients are more likely to persist in medium-size to large classes(more than 10 clients), and class size is not related to persistence forASE. Support for small class sizes is not indicated.
Spending more per client seat hour is not positively related topersistence.

ACKNOWLEDGMENTS
This report was made possible by the help and cooperation of many persons.The study's Technical Advisory Group (Hal Beder, Connie Eichorn, Rachel Hidaka,Noreen Lopez, Jane Mac illop, Lennox McLendon, and Jack Mezerow) has madenumerous helpful suggestions. Senior sampling and statistical consultants to theproject, Thomas B. Jabine and Larry Hotchkiss, have also provided many usefulcomments and much technical expertise.
We also wish to acknowledge the support and contributions of theDevelopment Associates staff. Laura Williams provided expert programming;Cynthia Hamill provided the graphics; Kate Hanley worked tirelessly with the localprogram directors to maintain the quality of the data; and Beth Glass providededitorial support.
Rob Barnes, the project officer from the Department of Education, providedstrong direction throughout the study and made many insightful and usefulcomments on earlier drafts of this report. We are particularly grateful for hisguidance with respect to the development of the persistence tables in chapter 2.
This report, would have been impossible without the continued participationand tolerance of the program directors, teachers, and staff of those adult educationprograms that are participating in our study. These dedicated professionals havecontinued to provide us with the data we request and the insights we need. Wewant them to know that their efforts are appreciated and that their commitment totheir profession is an inspiration.
Malcolm B.Young, Project DirectorMark A. MorganNicholas B. FitzgeraldHoward L. Fleischman

TABLE OF CONTENTSPAGE
1
1
1
2455
779
132426
313233
37404346
A-1
B-1
C-1
D-1
E-1
F-1
Index-1
Chapter 1 INTRODUCTIONPurpose of This ReportOverview of the National EvaluationSources of Information for This ReportAdjustments for Incomplete DataConfidence Intervals Associated with Reported DataOrganization of This Report
Chapter 2 PA I lERNS OF ENROLLMENT AND NI I ENDANCPAppropriate Measures of Participation and PersistenceAmount of Instruction Clients Actually ReceiveModels of Client FlowsConsistency of Client AttendanceReasons for Client Attrition
Chapter 3 ANALYSIS OF DIFFERENCES AMONG ADULT EDUCATIONCLIENTS GROUPED BY EXTENT OF ATI'ENDANCEDefinitions of Client Groups (1-6)Variables Examined and Procedures UsedDifferentiating Enrollees who Never Attend Class from Those who
Receive Some Instruction (Group 1 versus All Others)Analysis of Early Leavers (Group 2 versus Group 3)Predictors of Persistent Attendance (Groups 3-5 versus Group 6)Summary and Conclusions
APPENDIX A
APPENDIX B
APPENDIX CReport
APPENDIX D
APPENDIX E
APPENDIX F
Index
Study Objectives
Data Collection Forms
Bias Control Issues for Analyses Reported in Third Interim
Logistic Regression Summary Tables
Logistic Regression Summary Tables (Persistence Models)
Estima tion of a Point-In-Time Count of Active Clients
vii
9

Chapter 1INTRODUCTION
Purpose of This Report
This is the third interim report from the National Evaluation of AdultEducation Programs. The first interim report, completed in March 1992, describes theadult education service delivery system. The second interim report, completed inSeptember 1993, describes the clients who entered adult education programs duringthe evaluation's 12-month intake period beginning in April 1991. The purpose of thisreport is to describe the patterns of attendance and factors associated with thepersistence of adult education clients during the first 12 months following theirenrollment in the program.
Overview of the National Evaluation
The U.S. Department of Education began the national evaluation of federallysupported adult education services in September 1990. The central purpose of thisstudy is to evaluate the potential of programs supported by the Basic State Grantssection of the federal Adult Education Act "for significantly reducing deficits in theadult population with respect to literacy, English proficiency, and secondaryeducation." The specific objectives of the national evaluation and an overview of thestudy's design are provided in appendix A of this report.
The evaluation began with a survey of all local ad-llt education programsreceiving Adult Education Act funds in the program year ending June 30, 1990(Universe Survey).1 That survey, which was completed in December 1990 with a 93percent response rate, was used to identify a sample of local programs forparticipation in the longitudinal phase of the study. During the longitudinal phase,the following data were collected:
Information about the characteristics and experiences of a nationallyrepresentative sample of clients who entered local programs during a12-month period;
Information about the amount and nature of instructional servicesreceived by these clients for 18 months after intake, along with periodicinformation about their academic progress; and
' The Universe Survey, a mail survey of all federally supported adult education programs, wasconducted in the fall of 1990. See the first interim report for a discussion of the findings.
1 0

Follow-up information from a subsample of these clients obtainedthrough telephone interviews 6 months after they ceased receivinginstructional services.
A nationally representative sample of 139 local programs agreed to participatein the longitudinal phase of the study, and data collection began in April 1991. Theprograms participating in this phase agreed to complete a questionnaire describingtheir program (Comprehensive Program Profile); they also agreed to provide data onthe characteristics of a sample of clients who first enrolled in adult education betweenApril 1991 and April 1992 and on the extent and type of instructional services thoseclients received for up to 18 months from their time of entry.
Staff of the participating local programs were trained to complete datacollection forms and protocols and were reimbursed for costs associated with datacollection. The national evaluation's research staff provided technical assistance withthe data collection and monitored the quality of the data received.
The national evaluation is to consist of three interim reports and a final report.The first interim report was based on information from the Universe Survey and theComprehensive Program Profiles. The second interim report provided a descriptionof the characteristics of the study's 12-month entry cohort. This, the third interimreport, draws on attendance and participation data for the 12-month period followingthe sampled clients' initial entry into the program. The study's final report, to becompleted in late spring 1994, will draw on the full set of study data, includingspecial studies of program costs and academic achievement.
Sources of Information for This Report
The data presented in this report are taken from five data collection formsprovided by a nationally representative sample of programs on a 12-month cohort oftheir newly entering clients. These forms are as follows:
1. The Client Intake Record: Part A, which was completed for eachsampled client, provides basic demographic information on the client aswell as program information such as placement level, scheduled startdate, and local intake procedures used for the client. Program staffcompleted the form from program intake records.
2. The Client Intake Record: Part B, which was to be completed for allsampled clients who attended at least one instructional session, providesmore detailed information on client characteristics, including receipt ofpublic assistance, living arrangements, and employment status. Part Balso asked clients to rate the importance of 14 reasons for taking adult
2
1 1

education instruction. Spanish versions of the form were provided asneeded.
3. The ClientLibdate Record which provides instructional and attendancedata, was completed at 5-to-8-week intervals by local program staff foreach client who received instruction during the reporting period for upto 18 months from the time of entry into the program.
4. The Client Test Record provides scores on tests of basic skills given atthe time of enrollment, after 70 hours and after 140 hours of instruction(this testing information is available for clients from 111 local programs).
5. The Telephone Follow-up Survey provides information about the qualityof the instruction, the reasons for termination, and the results ofinstruction from a subsample of clients 6 months after they left theprogram.
The report also draws on data from the two surveys of local adult educationprograms, a Universe Survey and a Comprehensive Program Profile. The first'was asurvey of all federally supported adult education programs. It was conducted in thefall of 1990 and obtained data from 2,619 (93 percent) of the local programs receivingfederal Basic State Grants funds in the program year ending June 30, 1990. TheComprehensive Program Profile sought more detailed information about programstructure, instruction, and operations. A Program Profile was obtained from 131 ofthe 139 local programs that agreed to participate in the longitudinal phase of theevaluation. In programs where data about individual clients were obtained frommore than one instructional delivery site, data on the Program Profile pertaining toinstructional variables were obtained from site directors, and site-level data ratherthan program-level data, have been used in the analyses.
Copies of the client intake and update forms are included in appendix B.

Adjustments for Incomplete Data
The study calls for a substantial amount of information on each client. Not allthe data we expect to include in subsequent analyses were received or fullyprocessed in time for inclusion in this report,' and not all of the data expected fromsome of the programs selected for the study will ever be received. To compensate forthe incomplete information, we have taken the following actions:
Adjusted sampling weights. Clients in the study were assigned asampling weight based on the probability of their selection for thestudy. Each client's probability of selection was based on theprobability that the client's program was selected, that the instructionaldelivery site was selected, and that any given client at the site wasselected. Changes in the expected numbers of programs, sites, andclients in certain sites led us to adjust the originally assigned samplingweights. The effect of these adjustments was to maintain the nationallyrepresentative nature of the study's database. The sampling weightadjustments for this report are the same as those used in the analysesfor the study's second interim report.
Imputed some responses. For a small number of variables we haveused other responses from the same client to impute missing data.Generally, however, we have elected to let sample sizes vary accordingto the particular variables involved in different analyses.
Limite the database to those programs and clients for whom we hadreasonably complete intake and update records. Analyses in this reportare based on client intake and up .. records from 16,754 clients. Theseclients were enrolled in 118 local adult education programs. For each ofthese clients we have complete information on the variables included onClient Intake Record: Part A and on their attendance for the 12 monthsfollowing enrollment.
There are two potentially important types of missing data for which thepreceding steps do not account. These are data from ciients and programs for whichthe current weight adjustments do not compensate, and clients for whom we have noClient Intake Rnoitl: Part B. As described in appendix C, we have investigated thepotential impact of these missing data on our analyses, and we have concluded thatthe likelihood that systematic bias has been introduced by these missing data isextremely remote.
2 The report contains information on approximately 80 percent of the clients expected to beincluded in the study's final report.
4
13

Confidence Intervals Associated with Reported Data
The statistics presented in this report are based on probability samples of adulteducation students. The sampling errors for a stratified, multi-stage design such asthe one used in this study generally differ to some extent from those associated withestimates from a simple random sample. Estimation of the actual sampling errorsmust take account of these "design effects." To minimize costs, estimation of actualsampling errors will be deferred until the data are complete.
Organization of This Report
Following this brief introduction, the report addresses the following majorquestions:
What are the patterns of client enrollment and attendance, and howmuch instructional service do clients receive? (Chapter 2)
What are the main reasons why clients enter and leave adult educationprograms? (Chapter 2)
What distinguishes clients who receive instruction from those whoenroll but do not? (Chapter 3)
Are there meaningful differences in the characteristics of clients whoreach the federally defined 12-hour attendance threshold and those whodo not? (Chapter 3)
What personal and programmatic characteristics distinguish clients whotake relatively large numbers of hours of instruction from those who donot? (Chapter 3)
Throughout the report distinctions are made between clients enrolled in theprogram's three major instructional components: Adult Basic Education (ABE), AdultSecondary Education (ASE), and English as a Second Language (ESL). The analysescontained in the study's first and second interim reports make clear that thecharacteristics of clients in these three instructional programs differ, as do the typesof instruction they receive.

Chapter 2PATTERNS OF ENROLLMENT AND ATTENDANCE
This chapter describes the enrollment and attendance patterns of clients whoentered adult education programs during the study's 12-month intake period.' Thecore ,5 Ole chapter is a set of "persistence tables," which provide estimates of theenrollment and attendance patterns for these clients for the 12-month periodfollowing their enrollment in the program.
Appropriate Measures of Participation and Persistence
There are a variety of conceptually reasonable ways to measure participationin adult education programs. These include the following:
Total weeks of enrollment. This is the number of weeks between thestart and the termination of services, regardless of the amount of servicereceived during that period. The calculations begin at the time a clientenrolls in a program. Termination is defined as the last week the clientreceived instruction during the first 12 months following enrollment.The elapsed time value for clients who enrolled but never received anyinstruction is 0; the value for those who were still receiving instructionalservices at the end of 12 months is 52.
Total hours of instruction. This is a measure of the number of hours aclient actually attends class or receives some other instructional service;this is the most frequently used measure in this report. It should benoted, however, that this measure makes no allowance for the fact thatsome clients are in programs that offer services for only 3 or 4 hours aweek, while others are in programs that offer instruction for 6 or morehours a day.
Total weeks of instruction. This is a measure of the number of weeksduring which a client actually attends class. For some clients it may bea better indicator of sustained interest and persistence than the numberof hours of attendance, because in some programs clients can complete alarge number of hours in only a few weeks.
As exhibit 2.1 shows, there is a relatively high correlation among thesemeasures. Nevertheless, there are conceptual as well as statistical differences amongthem that need to be kept in mind. Most of the analyses in this report will be interms of total hours of instruction or total weeks of enrollment.
3 The intake period was from April 22, 1991, through April 21, 1992. Some programs beganparticipation in the study after April 22, and in these cases the intake period was adjusted accordingly.
7
1 5

Exhibit 2.1Correlation Among Three Measures of
Client Participation and Persistence
MeasureTotal Weeksof Enrollment
Total Hours ofInstruction
All Components
Total weeks of enrollment 1.00
Total hours of instruction .74 1.00
Total weeks of instruction .91 .85
ESL ,
Total weeks of enrollment 1.00
Total hours of instruction .82 1.00
Total weeks of instruction .93 .90
ABE
Total weeks of enrollment 1.00
Total hours of instruction .62 1.00
Total weeks of instruction .87 . .77
ASE
Total weeks of enrollment 1.00
Total hours of instruction .63 1.00
Total Weeks of instruction .88 .75
8
1Ei

Amount of Instruction Clients Actually Receive
This report is based on a probability sample of newly enrolled clients who arereasonably representative of newly enrolled clients in the United States.' Of theclients who enrolled for adult education instruction, only 84 percent actually receivedinstruction from the program in which they enrolled within 12 months of the time oftheir enrollment. The amount of instruction for clients who received at least 1 hourwas as follows:
Exhibit 2.2Amount of Instruction Received During 12 Months
by Clients who Began Instruction
Component Median Number ofHours
Median Numberof Weeks
ESL 77 16
ABE 31 10
ASE 26 8
Overall 39 10
As exhibit 2.3 shows, the ESL component not only enrolls the largest percent ofclients (37.8 percent) but also has the smallest percent not beginning instruction (12.2percent) and the largest percent reaching the 12-hour threshold used by the U.S.Department of Education as the cut-off point for inclusion in federal reports (77.4percent). ESL clients also accumulate far more hours than clients in either ABE orASE. The final row of the exhibit shows the distribution of hours within eachcomponent and nationally for clients who received 12 hours of instruction or more.For example, clients who accumulated 12 to 27 hours are in the lowest quartile (Q1)of all clients, whereas an ESL client could accumulate as many as 40 hours and stillbe in the lowest quartile of clients enrolled in ESL.
The data base for this report consists of the 16,754 new clients about whom we had completedata for 12 months after their enrollment, as of the time these analyses were being done. As indicatedin chapter 1, this represents about 80 percent of the total number of clients who will be included in thestudy's final report. We believe that the results of these analyses are nationally representative, butbecause all of the data from two large programs and some additional data from several otherprograms are not included, the numbers presented in the final report may differ somewhat from thosereported herein.
9

Exhibit 2.3Distribution of Clients by Hours of Attendance During the First 12 Months
Following Their Enrollment, by Program Component
Overall ESL ABE ASE
Percent of all adult educationenrollees
100.0 37.8 25.2 37.0
Percent of component enrolleesfailing to begin instruction
16.1 12.2 15.1 18.0
Percent of component enrollees with1 to 11 hours of instruction
16.7 10.4 20.0 21.0
Percent of component enrolleescompleting at least 12 hours
68.1 77.4 65.0 61.0
Quartile distribution of hours ofinstruction completed by clientsreceiving at least 12 hours ofinstruction
Q1 - 12-27Q2 28-58Q3 - 59-134Q4 - > 134
Q1 -12-40Q2 -41-98Q3 - 99-238Q4 > 238
Q1 - 12-24Q2 25-48Q3 - 49-93Q4 - > 93
Q1 12-21Q2 - 22-40Q3 41-84Q4 - > 84
Exhibits 2.4 and 2.5 show the persistence rates, measured as total weeks ofenrollment, for clients who received at least 1 hour of instruction. Exhibit 2.4compares the overall rate with the rates for the three instructional components. Itshows that each of the three instructional components has the same fairly smooth rateof attrition; i.e., a rapid early decline, followed by a gradual decline, until between 9and 24 percent of entrants are still active at the end of their first year.
10
18

Percent of Clients
100
80
60
40
20
0
Exhibit 2.4Persistence Rates in Weeks for Clients Who Received
1 Hour or More of Instruction by Instructional Component
ESL ABE ASE
I I11,1 I I
0 3 6 9 12 15 18 21 24 27 30 33 36 39 42 45 48 51
Weeks Enrolled in Year 1Of those clients attending at least one week
Exhibit 2.5 provides a view of the distribution of the levels of persistence (asmeasured by weeks of enrollment) by census region and instrucfional component.For example, in the shaded row beneath the headings we see that among ESL clientsin the Northeast who received any instruction, 25 percent completed 10 weeks or less,one-half (the median).were enrolled for 23 weeks or less, and 75 percent enrolled for42 weeks or less.
Overall, clients in the West tend to be enrolled longer than clients in the otherregions. In terms of length of time clients attend classes, the overall median numberof weeks in the West is 14, as compared to 11, 8, and 8 in the Northeast, South, andNorth Central regions. In terms of hours of instruction, the ordering of regions isessentially the same. Clients in the West receive the most hours (60), with themedian number of hours received being 44 in the Northeast, 28 in the South and 32in the North Central regions.
11
1 9

Exhibit 2.5Persistence Rates in Weeks of Enrollment for Clients Who Received
1 Hour or More of Instruction, by Census Region and Instructional Component
CensusRegion
InstructionalComponent
Weeks of Enrollment
25th
Percenffle50th
Percentile75th
Percentile
Northeast
ESL 10 23 . 42
ABE 5 12 25
ASE 3 8 17
North Central
ESL 2 10 30
ABE 2 7 18
ASE 2 9 24
South
ESL 3 8 21
ABE 3 11 28
ASE 2 7 17
West
ESL 4 18 52
ABE 2 12 30
ASE 2 7 21
TotalESL 4 16 45
ABE 3 10 24
ASE 2 8 20
12
2 0

Models of Client Flows
Exhibits 2.6 through 2.9 report attrition patterns for clients in the program as awhole, and then for each of the three instructional components (see footnote 4). Eachtable divides the intake cohorts into bimonthly groups. The rows show the numberof months of instruction the clients completed before leaving the program. Forexample, 24 percent of those who began in August or September left the programbefore completing 1 month.
Data from the tables can be used to follow various lines of inquiry. Forexample, using the data presented in exhibit 2.6, we can see that programs in August-September:
enroll about one-third of a year's new clientele (502,763 of 1,474,415);are composed of 56 percent new enrollees and 44 percent who initiallyenrolled in some other month.'
Exhibit 2.7 shows that only 18 percent of ESL clients entering in August orSeptember left before completing their first month, compared with 30 percent of ABEclients (exhibit 2.8) and 35 percent of ASE clients (exhibit 2.9).
ABE clients (exhibit 2.8) entering in August-September have a markedly lowerincidence of very early exit (defined as prior to completion of 2 months) than ABEclients entering in any other entry period. Attrition averages 43 percent for entrantsin this period, compared with an average of 53 percent in other periods.
ASE clients (exhibit 2.9) are those completing course work necessary to obtaintheir high school diploma or preparing to take the GED examination. The attritionrate for those beginning in August-September is considerably lower than the rate for
To determine the active population at any point in time, we must determine the number of newand continuing clients. Although data are presented in pairs of months, actual estimates werecalculated using individual months, and columns may sum to more or less than 100 percent because ofrounding. There were 502,763 new enrollees in August-September; 24 percent of those did notcomplete 1 month, which left 382,100 clients active. June-July had 129,080 new entrahts, of which45,178 (35 percent) were still active at the end of September. April-May had 134,002 new entrants, ofwhich about 31 percent (41,541) were active at the end of October. By continuing this procedure foreach month, we estimate a total of 619,424 clients active at the end of the August-September period, ofwhich 62 percent are from the August-September period. The weighted enrollment of 1,474,415should not be used as an estimate of new clients because it refers only to the weighted number forclients for whom we had completed update data and excludes two certainty programs. By includingintakes from those programs, assuming an attendance pattern for those programs that is consistentwith that seen in other programs, and making other adjustments that were described in the secondinterim report, we estimate that there were 1,893,811 students who first began instruction in the oneyear period April 22, 1991 to April 21, 1992. A simplified method for estimating the total number ofstudents in attendance in a one-year period is described in appendix F.
13
21

other components. Because most students who enter ASE programs as their initialforay into adult education have already completed a large portion of their education(55 percent have completed at least 10 years), it follows that the amount of timeneeded to complete one's education goals may be less for those in ASE than in ABEor ESL, and few ASE students continue past their first year.
Exhibit 2.6Proportion of All New Beginning Clients Exiting in Specified
Number of Months from Time of Entry
Number ofTime of Entry
(Weighted number of enrolling clients)Months
Before Exit Apr-May(134,002)
Jun-Jul(129,080)
Aug-Sep(502,763)
Oct-Nov(195,324)
Dec-Jan(214,802)
Feb-Mar(298,444)
Total(1,474,415)
0-1 0.42 0.45 0.24 0.37 0.34 0.33 0.33
1-2 0.09 0.08 0.13 0.11 0.11 0.11 0.11
2-3 0.06 0.07 0.10 0.11 0.12 0.11 0.10
3-4 0.03 0.05 0.03 0.06 0.09 0.06 0.05
4-5 0.06 0.04 0.05 0.05 0.05 0.03 0.04
5-6 0.03 0.03 0.05 0.06 0.04 0.03 0.04
6-7 0.02 0.02 0.04 0.04 0.01 0.02 0.03
7-8 0.02 0.03 0.08 0.02 0.02 0.02 0.04
8-9 0.02 0.01 0.04 0.02 0.02 0.02 0.03
9-10 0.02 0.04 0.02 0.02 0.02 0.02 0.02
10-11 0.02 0.04 0.01 0.01 0.02 0.01 0.01
11-12 0.06 0.01 0.02 0.02 0.01 0.01 0.02
Continuing 0.15 0.14 0.20 0.13 0.15 0.24 0.18
14
22

Exhibit 2.7Proportion of All New Beginning ESL Clients Exiting in Specified
Number of Months from Time of Entry
Number ofMonths
Before E)dt
Time of Entry(Weighted number of enrolling clients
Apr-May(62,284)
Jun-Jul(56,172)
Aug-Sep(292,864)
Oct-Nov(68,840)
Dec-Jan(93,557)
Feb-Mar(177,463)
Total(751,180)
0-1 0.31 0.35 0.18 0.31 0.28 0.25 0.24
1-2 0.07 0.05 0.14 0.09 0.08 0.08 0.10
2-3 0.05 0.07 0.09 0.11 0.09 0.09 0.09
3-4 0.03 0.07 0.03 0.05 0.07 0.07 0.05
4-5 0.08 0.04 0.04 0.04 0.05 0.02 0.04
5-6 0.03 0.02 0.05 0.05 0.06 0.05 0.05
6-7 0.02 0.02 0.03 0.04 0.01 0.01 0.02
7-8 0.02 0.02 0.09 0.03 0.02 0.02 0.05
8-9 0.01 0.01 0.04 0.03 0.03 0.03 0.03
9-10 0.02 0.06 0.02 0.03 0.03 0.02 0.03
10-11 0.01 0.07 0.01 0.01 0.03 0.00 0.02
11-12 0.12 0.00 0.02 0.02 0.02 0.01 0.03
Continuing 0.23 0.20 0.25 0.18 0.23 0.35 0.26
Note: 0.00 indicates less than 0.005.
13
23

Exhibit 2.8Proportion of All New Beginning ABE Clients Exiting in Specified
Number of Months from Time of Entry
Number ofTime of Entry
(Weighted number of enrolling clients)Months
Before Exit Apr-May(30,126)
Jun-Jul(29,912)
Aug-Sep(81,458)
Oct-Nov(55,374)
Dec-Jan(47,788)
Feb-Mar(40,918)
Total(285,576)
0-1 0.49 0.42 0.30 0.37 0.34 0.44 0.37
1-2 0.10 0.10 0.13 0.12 0.12 0.15 0.12
2-3 0.06 0.08 0.12 0.12 0.14 0.11 0.11
34 0.04 0.04. 0.03 0.08 0.11 0.05 0.06
4-5 0.06 0.04 0.06 0.05 0.08 0.04 0.06
5-6 0.03 0.05 0.06 0.06 0.02 0.02 0.04
6-7 0.03 0.02,
0.05 0.04 0.01 0.01 0.03
7-8 0.01 0.04 0.05 0.01 0.01 0.03 0.03
8-9 0.04 0.01 0.04 0.02 0.03 0.01 0.03
9-10 0.02 0.02 0.01 0.02 0.02 0.02 0.01
10-11 0.02 0.02 0.00 0.01 0.01 0.01 0.01
11-12 0.01 0.02 0.01 0.01 0.01 0.01 0.01
Continuing 0.10 0.13 0.15 0.09 0.09 0.10 0.11
Note: 0.00 indicates less than 0.005.
16
24

Exhibit 2.9Proportion of All New Beginning ASE Clients Exiting in Specified
Number of Months from Time of Entry
Number ofMonths
Before E)dt
Time of Entry(Weighted number of enrolling clients
Apr-May(41,095 )
Jun-Jul(42,704 )
Aug-Sep(127,219)
Oct-Nov(69,344)
Dec-Jan(73,136)
Feb-Mar(79,909)
Total(433,407)
0-1 0.55 0.59 0.35 0.43 0.41 0.46 0.44
1-2 0.12 0.08 0.13 0.10 0.14 0.14 0.12
2-3 0.08 0.07 0.11 0.09 0.14 0.15 0.11
3-4 0.02 0.04 0.04 0.05 0.09 0.05 0.05
4-5 0.04 0.03 0.06 0.06 0.05 0.02 0.04
5-6 0.03 0.03 0.05 0.06 0.02 0.01 0.04
6-7 0.01 0.01 0.04 0.03 0.01 0.02 0.03
7-8 0.02 0.02 0.05 0.02 0.01 0.02 0.03
8-9 0.02 0.01 0.03 0.02 0.01 0.02 0.02
9-10 0.01 0.01 0.01 0.02 0.01 0.01 0.01
10-11 0.02 0.02 0.00 0.01 0.01 0.01 0.01
11-12 0.01 0.01 0.01 0.01 0.01 0.02 0.01
Continuing 0.07 0.07 0.12 0.10 0.09 0.06 0.09
Note: 0.00 indicates less than 0.005.
17
25

Exhibits 2.10 through 2.13 provide estimates of attendance patterns for clients inthe nation as a whole and then for each of the three instructional components.
In each of these exhibits, the population described is a hypothetical group of100,000 new enrollees. Calculations are based on 2-month entry cohorts (January-February enrollees, for example), who were then followed for an entire year. The dataare based on client update information behavior.' Using exhibit 2.10 as an example:
Column 1 is the number of months that clients complete from the time of theirenrollment until they leave the program. If clients leave during the same monththat they enroll, they are considered to have completed 0 month, whether or notthey received instruction. If they are still enrolled at the end of 18 months theyare considered to be continuing. The column shows the 1 month interval towhich the entries in the remaining columns refer.
Column 2 is the number of clients enrolled at the beginning of month x. In ourexample, 56,218 clients were active at the beginning of their second month.
Column 3 reports the number of terminations that occur during the month.Thus, in month 2, the row described above, 10,009 of those enrolled at the start ofthe month (column 2) will leave.
Column 4 is the proportion of clients starting the month who left during themonth. This figure is determined by dividing column 3 (10,0019) by the numberin column 2 (56,218). For example, the proportion of those leaving betweenmonths 2 and 3 is .18. This indicates that for any clients who are in their secondmonth of instruction, there is a probability of 180 in 1,000 (or 18 in 100, or 1.8 in10) that they will leave during month 2.
Columns 5 and 6 are provided to facilitate calculation of column 7. Column 5 isthe number of months clients attended between months x and x+n, which is thesum of the number of clients active in the current month and the number activein the following month divided by 2. This calculation is based on theassumption that clients enter and exit a program at a constant rate throughoutthe month. This is, in our example, the number of clients who attended for 1month during the client's second and third months. Thus 56,218(row 3) +46,209(row 4) = 102,427/2 = 51,213(row 3, column 5).
Column 6 is the total number of client months which will be logged in this andsubsequent months. In our example, the 399,228 is the sum of column 5 from therow being exatnined through the row labeled "Continuing."
h Calculations were made using more than the three significant digits reported in these tables. If
one uses only the reported data to make the calculations, small variations will result.
18
26
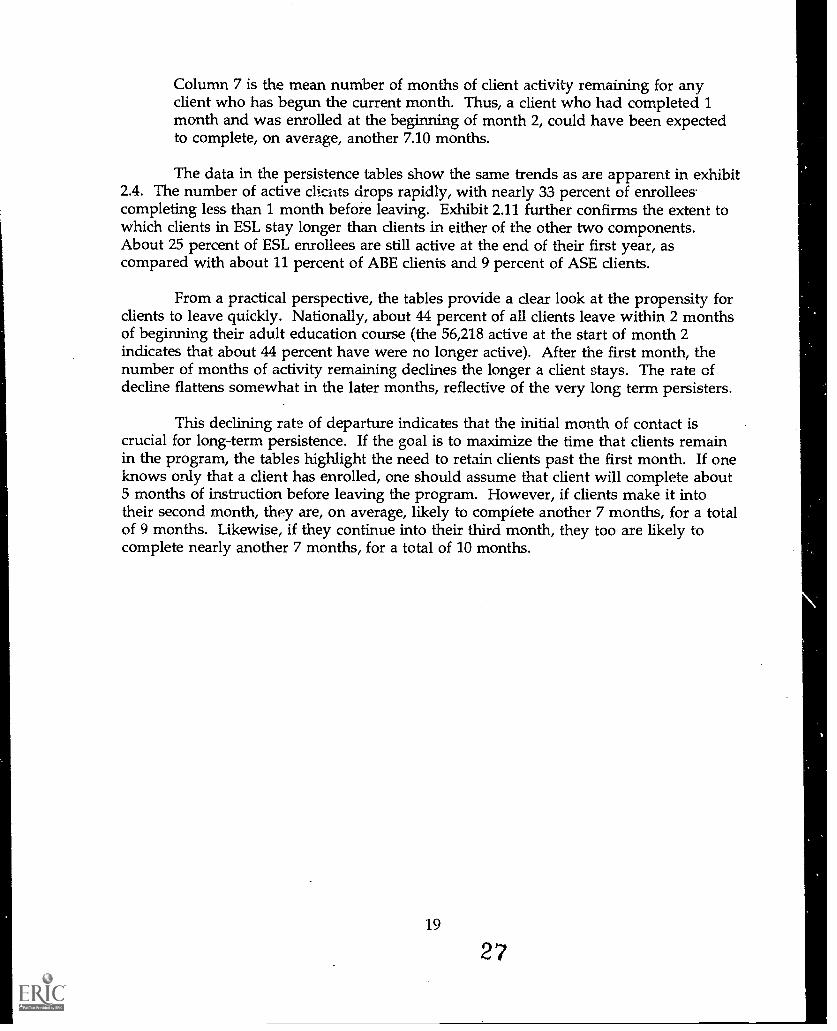
Column 7 is the mean number of months of client activity remaining for anyclient who has begun the current month. Thus, a client who had completed 1month and was enrolled at the beginning of month 2, could have been expectedto complete, on average, another 7.10 months.
The data in the persistence tables show the same trends as are apparent in exhibit2.4. The number of active cliciits drops rapidly, with nearly 33 percent of enrolleescompleting less than 1 month before leaving. Exhibit 2.11 further confirms the extent towhich clients in ESL stay longer than clients in either of the other two components.About 25 percent of ESL enrollees are still active at the end of their first year, ascompared with about 11 percent of ABE clients and 9 percent of ASE clients.
From a practical perspective, the tables provide a dear look at the propensity forclients to leave quickly. Nationally, about 44 percent of all clients leave within 2 monthsof beginning their adult education course (the 56,218 active at the start of month 2indicates that about 44 percent have were no longer active). After the first month, thenumber of months of activity remairiing declines the longer a client stays. The rate ofdecline flattens somewhat in the later months, reflective of the very long term persisters.
This declining rate of departure indicates that the initial month of contact iscrucial for long-term persistence. If the goal is to maximize the time that clients remainin the program, the tables highlight the need to retain clients past the first month. If oneknows only that a dient has enrolled, one should assume that client will complete about5 months of instruction before leaving the program. However, if clients make it intotheir second month, they are, on average, likely to complete another 7 months, for a totalof 9 months. Likewise, if they continue into their third month, they too are likely tocomplete nearly another 7 months, for a total of 10 months.
19
27

1
Months ofActdvityBetween
Enrollmentand
Termination
Exhibit 2.10Estimates of Persistence for All New Education Clients
2 3 4 5 6 7
NumberActive atthe Startof Month
NumberLeaving
During theMonth
Proportionof ThoseStarting
the Monthwho Left
During theMonth
Total ClientMonthsLogged
During thisMonth
AggregateClient
MonthsExpected at
Start ofMonth
MeanNumber of
MonthsRemainingat Start'of
Month
0-1 100,000 32,552 0.33 83,724 544,784 5.45
1-2 67,448 11,230 0.17 61,833 461,060 6.84
2-3 56,218 10,009 0.18 51,213 399,228 7.10
3-4 46,209 5,048 0.11 43,685 348,014 7.53
4-5 41,161 4,410 0.11 38,956 304,330 7.39
5-6 36,751 4,339 0.12 34582 265,374 7.22
6-7 32,412 2,587 0.08 31,119 230,793 7.12
7-8 29,825 3,875 0.13 27,888 199,674 6.69
8-9 25,951 2,765 0.11 24,568 171,786 6.62
9-10 23,185 1,887 0.08 22,242 147,218 6.35
10-11 21,299 1,263 0.06 20,667 124,976 5.87
11-12 20,036 1,899 0.09 19,086 104,309 5.21
12-13 18,136 1,932 0.11 17,171 85,223 4.70
13-14 16,205 5,115 0.32 13,647 68,052 4.20
14-15 11,089 1,193 0.11 10,493 54,405 4.91
15-16 9,896 976 0.10 9,408 43,912 4.44
16-17 8,920 714 0.08 8,563 34,504 3.87
17-18 8,206 1,426 0.17 7,493 25,942 3.16
Continuing 6,780 - - -
20
28

Exhibit 2.11Estimates of Persistence for All New ESL Education Clients
1 2 3 4 5 6 7
Months ofActivityBetween
Enrollmentand
Termination
NumberActive atthe Startof Month
NumberLeaving
During theMonth
Proportionof ThoseStarting
the Monthwho Left
During theMonth
Total ClientMonthsLogged
During thisMonth
AggregateClient
MonthsExpected at
Start ofMonth
MeanNumber of
MonthsRemainingat Start of
Month
0-1 100,000 24,233 0.24 87,883 678,836 6.79
1-2 75,767 10,182 0.13 70,676 590,952 7.80
2-3 65,585 8,765 0.13 61,202 520,277 7.93
3-4 56,820 4,863 0.09 54,388 459,074 8.08
4-5 51,956 3,978 0.08 49,967 404,687 7.79
5-6 47,978 4,719 0.10 45,619 354,719 7.39
6-7 43,260 2,363 0.05 42,078 309,100 7.15
7-8 40,897 5,021 0.12 38,386 267,022 6.53
8-9 35,875 3,229 0.09 34,261 228,636 6.37
9-10 32,646 2,541 0.08 31,376 194,376 5.95
10-11 30,105 1,612 0.05 29,299 163,000 5.41
11-12 28,493 2,566 0.09 27,210 133,701 4.69
12-13 25,927 2,775 0.11 24,539 106,491 4.11
13-14 23,151 9,311 0.40 18,496 81,952 3.54
14-15 13,840 1,412 0.10 13,134 63,457 4.59
15-16 12,428 1,276 0.10 11,790 50,323 4.05
16-17 11,152 865 0.08 10,719 38,534 3.46
17-18 10,287 1,790 0.17 9,392 27,814 2.70
Continuing 8,496 - - - -

Exhibit 2.12Estimates of Persistence for All New ABE Education Clients
1 2 3 4 5 6 7
Months ofActivityBetween
Enrollmentand
Termination
NumberActive atthe Startof Month
NumberLeaving
During theMonth
Proportionof ThoseStarting
the Monthwho Left
During theMonth
Total ClientMonthsLogged
During thisMonth
AggregateClient
MonthsExpected at
Start ofMonth
MeanNumber of
MonthsRemainingat Start of
Month
0-1 100,000 37,446 0.37 81,277 446,161 4.46
1-2 62,554 12,299 0.20 56,404 364,884 5.83
2-3 50,255 11,178 0.22 44,666 308,480 6.14
3-4 39,076 5,840 0.15 36,157 263,814 6.75
4-5 33,237 5,578 0.17 30,448 227,657 6.85
5-6 27,659 4,302 0.16 25,508 197,210 7.13
6-7 23,357 3,089 0.13 21,812 171,702 7.35
7-8 20,268 2,653 0.13 18,941 149,890 7.40
8-9 17,615 2,602 0.15 16,314 130,949 7.43
9-10 15,012 1,462 0.10 14,281 114,635 7.64
10-11 13,550 1,015 0.07 13,042 100,354 7.41
11-12 12,535 1,153 0.09 11,958 87,311 6.97
12-13 11,382 1,043 0.09 10,860 75,353 6.62
13-14 10,339 855 0.08 9,911 64,493 6.24
14-15 9,483 955 0.10 9,006 54,582 5.76
15-16 8,528 583 0.07 8,237 45,576 5.34
16-17 7,945 500 0.06 7,695 37,339 4.70
17-18 7,446 1,327 0.18 6,782 29,643 3.98
Continuing 6,119 - - - -
22
30

Exhibit 2.13Estimates of Persistence for All New ASE Education Clients
1 2 3 4 5 6 7
Months ofActivityBetween
Enrollmentand
Termination
NumberActive atthe Start
of Month
NumberLeaving
During theMonth
Proportionof ThoseStarting
the Monthwho Left
Durin g theMonth
Total ClientMonthsLogged
During thisMon th
AggregateClient
MonthsExpected at
Start ofMonth
MeanNumber of
MonthsReman ingiat Start of
Month
0-1 100,000 43,805 0.44 78,097 378,979 3.79
1-2 56,195 12,286 0.22 50,052 300,881 5.35
2-3 43,909 11,339 0.26 38,239 250,830 5.71
3-4 32,569 4,877 0.15 30,131 212,591 6.53
4-5 27,692 4,355 0.16 25,514 182,460 6.59
5-6 23,337 3,614 0.15 21,530 156,946 6.73
6-7 19,723 2,613 0.13 18,417 135,416 6.87
7-8 17,110 2;691 0.16 15,765 116,999 6.84
8-9 14,419 2,077 0.14 13,380 101,235 7.02
9-10 12,342 1,051 0.09 11,816 87,854 7.12
10-11 11,291 833 0.07 10,874 76,038 6.73
11-12 10,458 1,253 0.12 9,831 65,164 6.23
12-13 9,205 1,054 0.11 8,677 55,332 6.01
13-14 8,150 700 0.09 7,800 46,655 5.72
14-15 7,450 944 0.13 6,978 38,855 5.22
15-16 6,506 726 0.11 6,143 31,877 4.90
16-17 5,780 602 0.10 5,479 25,735 4.45
17-18 5,178 871 0.17 4,742 20,256 3.91
Continuing 4,307 - - - - -
Note: 0 indicates less than 0.5.
23
31

Consistency of Client Attendance
Unlike most elementary and secondary school services, many adult educationclasses are available for 12 months during a year,' but almost none of the clients ofthose services are required to attend. For reasons of economic or farnilial necessity orsimply of personal preference, many clients in adult education programs attendintermittently. Clients come for a period of time, are gone for several weeks or more,and then return. Sometimes the breaks in continuity are as long as several months ormore.
It has been long established in the study of elementary and secondary schoolachievement that test scores decline over the summer months when schools are closed.It is reasonable to speculate that a similar loss may occur with adults who missextended periods of instruction. If this is the case, the total number of hours or weeksof enrollment or instruction over the course of a year may not be a useful predictor ofclient academic achievement. To understand the relationship between attendance andlearning gains, it may be important to know in more fine detail about the consistency,as well as amount, of client attendance.
An initial step toward investigating this relationship is to develop anoperational definition of consistent attendance. An appropriate operational measure ofconsistency should distinguish between brief absences or periods of time when theprogram is closed or not offering instruction for the particular client, and prolongedabsences that might be expected to interfere with learning gains. Research withpublic-school-age populations indicates that 8 weeks seems a reasonable cut-off pointas a definition of extended absence. To assess the extent to which there aresubstantial breaks in client services within a year, exhibit 2.14 presents the distributionof the consistency of attendance by clients during the 12 months after their initialenrollment. As the exhibit shows, of the clients who receive instruction, about 13percent begin, miss a continuous period of 8 weeks or more of instruction, and thenreturn to classes during the course of a year. As is also shown, clients in ASE show aslightly lower incidence of discontinuity. Because ASE clients stay for shorter periods,the relative opportunities for extended discontinuities are fewer.
The typical program offers classes between 10 and 11 months each year (see the first interimreport, pp. 61-62).
24
32

Exhibit 2.14Percent of Clients With and Without Discontinuity of Service (8 weeks' duration)
by Instructional Component
ComponentPercent of Clients
No Discontinuity Discontinuity
ESL 86 14
ABE 87 13
ASE 89 11
Overall 87 13
If we modify the definition of discontinuity to include any breaks in attendanceof at least 1 week, the results for those who took at least 12 hours of instruction arepresented in exhibit 2.15. Interestingly, those who had either no break or a break of 2weeks form the two largest groups.
It is also the case that 66 percent of the clients who take at least 12 hours ofinstruction are never absent for more than 2 weeks in a row. This finding is counterto the common perception that most clients start and stop their instruction manytimes, and have frequent extended absences. It is also true, however, that nearly one-quarter (23 percent) of all clients are absent longer than 4 weeks at a time andsubsequently return to class. This finding may be of interest to those programs thatdrop clients from their rolls after 3 straight weeks of absence.
25
33

Exhibit 2.15Percent of Enrollees with Selected Periods of Discontinuity,
by Instructional Component
Number of Weeks ofContinuous
Nonattendancewith Return
Percent of Enrollees who Received at Least 12Hours of Instruction
ESL ABE ASE Overall
0 26 22 27 26
1 13 19 19 16
2 22 27 25 24
3-4 11 11 11 11
5-6 13 5 5 8
7-8 4 4 3 4
9-10 2 2 2 2
11 + 9 10 8 9
Reasons for Client Attrition
Relatively little is known about the reasons why clients leave adult educationprograms. As part of the national evaluation, we surveyed available published andunpublished literature and contacted other researchers to determine what was knownabout the .attendance patterns of adults in basic skills and comparable adult educationprograms. Essentially, we found no empirical information on which to basecomparisons of the attendance patterns of adults in the federally supported programs.Nor, therefore, could we identify a referent group to use as a basis for assessingwhether the rapidly declining attendance rates that we have found are unique to thefederal programs or are endemic to programs for these types of adults.
To gain further insight into this matter we reviewed available literature onclient attrition and on barriers or deterrents to participation. For many years thefederal adult education program's Annual Performance Reporting Form has soughtinformation from states on the number of clients who have left programs beforecompleting their objectives. The current federal reporting form lists 11 categories ofreasons, including "other known reasons" and "unknown reasons." Because theinformation the Department of Education receives must ultimately come from local
26
34

program staff, rather than clients, it is not accorded a high level of credence by manyprofessionals- in the field.
In his 1991 book on adult education issues and practice, Beder devotes achapter to summarizing the research literature on nonparticipation. Although muchof that literature focuses on getting adults to enter educational programs, it isreasonable to assume that there is a considerable overlap in the factors associated withinitial entry and sustained participation. Bader's review of literature on barriers anddeterrents to participation and available studies on reasons why clients withdraw'suggest that, excluding cost (because there is no charge to the client for participationin the federal adult education program) five categories of variables or fa,ctors influenceparticipation:
1. Initially perceived relevance or motivation, such as the clients' beliefregarding the amount of value to be derived from receiving instructionalservices. In the context of the federal adult education programs, thisfactor may be a desire to learn English, to obtain a high schoolequivalency diploma, to comply with the requirements of an employer orsocial welfare program, or simply to have positive social interactions.
2. Personal psychological factors, such as lack of self-confidence in learningabilities or general avoidance of social involvements.
3. Individual or family circumstance over which neither the client nor theprogram has any control, including ill health of the client or familymember, a move outside the program service area, or a change inemployment conditions.
4. Conflicts of time, place or other circumstance for which potentialprogrammatic remedies exist, including a need for child care,transportation, safer facilities, or flexible instructional hours.
5. Perceived lack of quality or value of the program after receiving someinstruction, including a belief that the desired material was not beingcovered, that progress was too slow, or that the instructional style orconditions were unsuitable.
The first two of these factors seem highly germane to a client's decision toenroll in instruction, but only the last three appear relevant to continued persistence
For example, Development Associates (1980, p. 188) reports that the four reasons most frequentlycited by a sample of 540 interviewed adults who had withdrawn froo-t local adult education programswere employment conflicts (38 percent), personal or family illness (26 percent), child careresponsibilities (16 percent), and lack of access to transportation (10 percent).
27
35

once instruction has begun. To assess the importance of these variables, we haveanalyzed preliminary data from the Telephone Follow-up Survey of a sample of thestudy's clients 6 months after they left the program. As part of that survey we askedthe former clients: "What were your major reasons for leaving your class orinstructional program?" Responses were coded in terms of 17 categories, whichcollapsed into the four broad categories shown in exhibit 2.16. The information in theexhibit is from the sample of 3,403 clients with whom we had completed interviews atthe time the database for this report was established. These respondents arerepresentative of about 340,000 new clients, about 19 percent of the estimated numberof new clients overall. Although statistical adjustments have not been done to makethis sample fully representative of all new clients,9 we believe the number ofresponses is sufficiently large to provide useful insight into the reasons why clientswho begin receiving instruction leave after receiving fewer hours of instruction thanmight be. initially expected.
Exhibit 2.16Distribution of Clients by Reasons for
Leaving the Program
ABE ASE ESL All Components
Left Satisfied 43 % 54 % 25 % 44 %
Completed program 28 35 15 28
Achieved personal goal 5 7 2 5
Outside Events 44 36 62 44
Family/child care 12 9 12 10
Transportation 4 3 5 4
Change of job 13 12 26 16
Instructional Factors 10 9 11 11
Dissatisfied 4 4 4 4
Other Reasons 3 1 2 1
As the exhibit shows, about a quarter of the ESL clients and about half of theABE and ASE clients left their program saying they were satisfied, and about a third
9 For the final report, adjustments will be made to the full telephone follow-up sample to ensurethe data are statistically representative of new clients.
28
36

of all three groups indicated that their personal goals had been met or that they hadcompleted their program of study (e.g., had completed one term or level ofinstruction). Of those clients who reported leaving the program for reasons other thanbeing satisfied, 20 percent indicated that they left because they were diEsatisfied withthe instruction or some other aspect of the program, while 80 percent indicated theirdeparture was related to outside events rather than the nature of the program. Ofthese, it can be argued that clients' problems with child care or transportation could atleast theoretically be addressed by a change in program design, and that thereforeabout 55 percent of the clients who left unsatisfied did so for a reason that was withinthe local program's control.
Summary and Conclusions
In this chapte we have provided summaries of the enrollment and attendancepatterns of clients who entered adult education programs during the study's 12-monthintake period. Tables based on the first year of attendance data demonstrate the widevariation between the median attendance for clients in ESL and those in ABE or ASE.We have shown that there is a heavy loss of clients between enrollment and the startof instruction, and that attrition thereafter is fairly steady until about 18 percent of allclients are still receiving instruction after 1 year. We then presented tables thatsummarize the attendance of a 1-year intake group. These tables allow us to estimatethe average number of months remaining in a client's tenure on the basis of thenumber of months already attended.
We then examined the incidence of instructional discontinuity and determinedthat well over half of the clients in each component had a maximum break ininstruction of 2 weeks or less and that about a quarter of all clients had no breaks intheir instruction.
In attempting to determine why clients left the program we used a preliminaryexamination of the Telephone Follow-up Survey and found that only about 11 percentof clients attributed their departure to instructional factors. Some 44 percent of allclients who left said that they were satisfied with their educational experience; another44 percent said that outside events caused them to leave, with a change of jobs beingthe cause most frequently cited.
In conclusion, enrollment in adult education, while spread over the entire year,is concentrated in the September-October and January-February periods. Gettingthose students who register into actual instruction is probably the single mostimportant factor in ensuring that the students attend for a meaningful period of time.Attrition after the initial month is generally steady, with no real peaks of departures.The attrition curves for all components are very similar, with ESL being the leastdramatic. Clients generally report that they are satisfied with their adult education
29
37

experience and that changes in family or employment circumstances were the mostfrequent causes for leaving the program.
The next chapter addresses questions associated with attrition and persistenceby comparing adult education clients in six analytic groups.
30
38

Chapter 3ANALYSIS OF DIFFERENCES AMONG ADULT EDUCATION
CLIENTS GROUPED BY EXTENT OF ATTENDANCE
The study collected data on a national sample of adults who enrolled in adulteducation programs, but there is an obvious and important distinction betweenenrolling for services and actually receiving them. In this study we found that 16percent of the adults who enrolled for services never attended a class and thereforereceived no instruction.
It is widely believed in the U.S. Department of Education that at least 12 hoursof instruction must be received before academic progress can be achieved. Therefore,the Department's adult education reporting system distinguishes between clients whoreceive more and less. than 12 hours of instruction, including only those receiving 12hours or more in estimating the number of adult education clients and preparingother program analyses. Of our sample of newly enrolled clients, in addition to the 16percent who received no instruction, another 18 percent ended their instruction beforereceiving 12 instructional hours. Thus about 65 percent of all newly enrolled clientsreceived 12 hours of instruction or m-re.
This chapter addresses the following questions:
What distinguishes clients who receive instruction from those who enrollbut do not? .
Are there meaningful differences in the characteristics of clients whoreach the federally defined 12-hour attendance threshold and those whodo not?
What personal and programmatic characteristics distinguish clients whotake relatively large numbers of hours of instruction from those who donot?
In brief, we found that variables within the control of local programs areimportant predictors of whether or not clients begin instruction and of how manyhours of instruction they receive. We also found there to be no empirical basis forusing 12 hours as a cut-off point for including clients in the federal reporting system.
At this point we should also emphasize that one should not assume thai it isnecessary for a student to accumulate many hours to accomplish their goals. Somestudents are able to obtain their GED after receiving only a few hours of instruction,and others are able to learn specific employment-related skills in a relatively shortperiod of time. As will be discussed in the study's final report, the relationshipbetween amount of attendance and client outcomes is complex, and it is not alwaysappropriate to treat clients' persistence as a measure of program effectiveness. Itshould also be noted that predictors and causes are not necessarily the same.
3139

Definitions of Client Groups (1-6)
For the purposes of this chapter, our sample of new enrollees was divided intosix analytic groups based on the number of hours of instruction received:
Group 1--Clients who enrolled but received no instruction;
Group 2--Clients who received from 1 to 11 hours of instruction (i.e.,clients who are excluded from the federal reporting system);
Group 3--Clients who received 12 or more hours of instruction and werein the lowest attendance quartile for their instructional component (i.e.,clients included in .the federal reporting system with the least number ofinstructional hours);
Group 4--Clients who received 12 or more hours of instruction and werein the second attendance quartile for their instructional component;
Group 5Clients who received 12 or more hours of instruction and werein the third attendance quartile for their instructional component; and
Group 6--Clients who received 12 or more hours of instruction and werein the fourth attendance quartile for their instructional component (i.e.,clients with the greatest number of instructional hours). Sustainedpersistence is defined thmughout this chapter as membership in thefourth attendance quartile of clients who received at least 12 hours ofinstruction.
The number of hours of attendance associated with clients in each of the sixanalytic groups is presented by instructional component in exhibit 3.1. For clientswho received 12 or more hours of instruction, ASE clients had the shortest stay inadult education, with a median of 40 hours of instruction over a 1-year period. Themedian ABE client attended adult education for 48 hours, which was approximatelyhalf the amount of instruction received by the typical ESL student over the same 1-year period of time (i.e., a median of 98 hours).
324
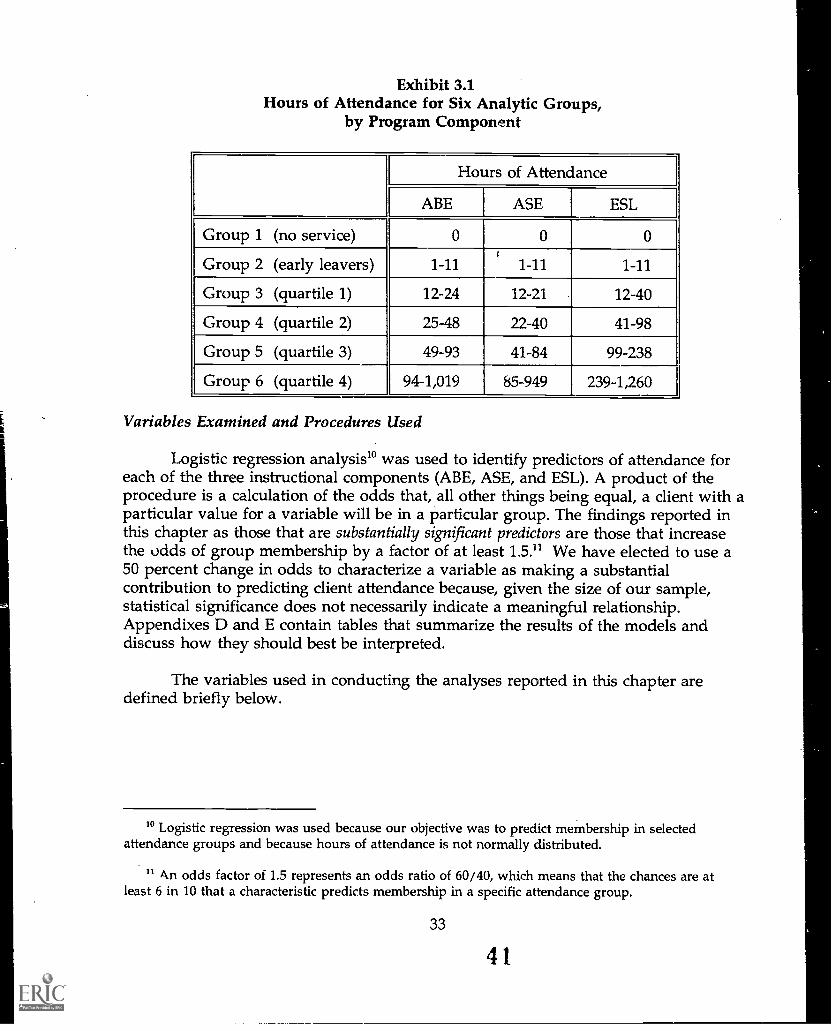
Exhibit 3.1Hours of Attendance for Six Analytic Groups,
by Program Component
Hours of Attendance
ABE ASE ESL
Group 1 (no service) 0 0 0
Group 2 (early leavers) 1-11i
1-11 1-11
Group 3 (quartile 1) 12-24 12-21 12-40
Group 4 (quartile 2) 25-48 22-40 41-98
Group 5 (quartile 3) 49-93 41-84 99-238
Group 6 (quartile 4) 94-1,019 85-949 239-1,260
Variables Examined and Procedures Used
Logistic regression analysis' was used to identify predictors of attendance foreach of the three instructional components (ABE, ASE, and ESL). A product of theprocedure is a calculation of the odds that, all other things being equal, a client with aparticular value for a variable will be in a particular group. The findings reported inthis chapter as those that are substantially significant predictors are those that increasethe odds of group membership by a factor of at least 1.5." We have elected to use a50 percent change in odds to characterize a variable as making a substantialcontribution to predicting client attendance because, given the size of our sample,statistical significance does not necessarily indicate a meaningful relationship.Appendixes D and E contain tables that summarize the results of the models anddiscuss how they should best be interpreted.
The variables used in conducting the analyses reported in this chapter aredefined briefly below.
10 Logistic regression was used because our objective was to predict membership in selectedattendance groups and because hours of attendance is not normally distributed.
11 kn odds factor of 1.5 represents an odds ratio of 60/40, which means that the chances are atleast 6 in 10 that a characteristic predicts membership in a specific attendance group.
33
41.

Client Background Characteristics
Age, defined as 16-21 years, 22-30 years, 31-45 years, and over age 45.
Gender.
Race/ethnicity, defined as American Indian/Alaskan Native; Asian/Pacific Islander;black, non-Hispanic; Hispanic; and white, non-Hispanic.
Prior educational attainment, defined as highest level of education attained (no highschool diploma or its equivalent <GED>, high school diploma or GED, orpostsecondary certification or degree), or years of school completed prior to enrolling(eight ordered categories from zero to more than 12 years).12
Employment status, defined as employed or not employed (the "not employed"category includes persons who are seeking employment and those who are not in thelabor market).
Welfare status, defined as receiving payments or not receiving payments at the time ofenrollment.
Marital status, defined as currently married or not.
Residential stability, defined as whether or not clients were living in the same county5 years before the time when they enrolled.
Client Motivations for Enrollment
Required enrollment, defined as enrollment required by client's employer or anotherprogram or agency (e.g., public welfare) versus otherwise (satisfying family, friends,or other personal or employment goals).
Primary motive for enrolling, defined as improvement of basic skills, improvement ofliteracy skills, improvement of employability, or improvement of self-concept.'
12 Because the two indicators of educational attainment were highly correlated with each other,only one was used as a predictor in any given regression model. This choice was based on which ofthe two indicators correlated highest with membership in the attendance group of interest.
13 Derived from a factor analysis of the extent to which 14 reasons were important for new clientsto enroll in adult education. Primary motive as a predictor of attendance bvas measured as a client'smean factor score.
34
42

Program Setting 14
Program size, defined as very large (over 5,000 clients), large (1,000 to 5,000 clients),medium size (500 to 999 clients), and small (less than 500 clients).
Type of sponsor, defined as programs administered by local education agencies(LEAs), community colleges, and volunteer organizations/community service groups.
Type of community served, defined as a large city in a major metropolitan area, theremainder of a major metropolitan area, a ropolitan area, or a non-metropolitan area."
Program organization and structure
Number of months classes offered, defined as programs that offer services for 8months or less (part-year), versus those offering services for 9 months or more (full-year).
Integration of services, defined as high, medium, or low; derived from an indicatormeasuring the coordination of services with other agencies and the breadth of servicesthat programs offer their clients.'
Use of support services, defined as whether or not clients use support services.'
Program outreach efforts, defined as high, medium, or low on the basis of a compositemeasure of activities designed to attract or recruit new clients; the composite has fivecomponents which are described in the study's first interim report (pp. 46-48):recruitment methods, use of staff for recruitment, use of volunteers for recruitment,
14 Except for use of support services and as otherwise noted for instructional variables, client scoresfor all independent variables pertaining to program characteristics (program setting, programorganization and structure, and program staffing characteristics) are derived from the score assignedto the program in which the client was enrolled.
15 A major metropolitan area is defined as having a population of 1.5 million or more; a large cityin major metropolitan areas as having a population of 500,000 or more; and small metropolitan areasas any community loc ated within a standard metropolitan area with a population of less than 1.5million.
' For a detailed description of this variable see the first interim report (pp. 39-45) .
17 Overall, 25 percent of clients used one or more of nine types of support services (e.g. counseling,child care, transportation) provided by their adult education program (33 percent of ABE clients, 29percent of ASE clients, and 15 percent of ESL clients). Analyses for this chapter compared clients whoreceived no services with those who used support services during their period of active enrollmentderived from the Client Update Record.
35
43

recruitment support from other organizations, and provision of staff in-service trainingon recruitment.
In-service training on retention, defined as whether or not provided.
Cost per client seat hour, defined as high, medium, and low; derived from 12 casestudies of program costs.'
Program staffing characteristics19
Professional commitment, defined whether at least one of two conditions was present:a majority of the instructional staff have more than 3 years of adult education teachingexperience or at least one staff member is certified in adult education (see thediscussion of careerism in the first interim report, pp. 26-27).
Presence of full-time staff, defined as whether or not the program staff has at least onefull-time administrator and one full-time teacher (see the first interim report, p. 27).
Instructional context and orientation
Class size, defined as classes of 1-10 clients, 11-20 clients, 21-30 clients, and 31 clientsor more; derived from the Client Update Record.
Instructional philosophy, defined as the extent to which the program's adult educationcurriculum emphasizes academic versus workplace/life skills as measured by a five-point scale from the Comprehensive Program Profile.'
18 Medium cost is defined as the average cost per client for each hour of instruction (mean clientseat hour cost is $4.57). High and low costs reflect client seat hour costs that are one standarddeviation above or below the mean.
19 The first interim report (pp. 26-28) presented a composite measure of program professionalismbased on data from the Program Profile and Universe Survey. It consisted of the provision of selectedkinds of in-service training for staff, the careerism -of instructional staff, the and presence of full-timestaff. The composite measure of professionalism combined the three components to yield fourcategories: low, moderately low, moderately high, and high. Exploratory analyses indicated a weakand contradictory relationship between the composite measure and sustained client attendance.Subsequent analyses were conducted by disaggregating the composite measure, and the final analysesexamined two predictors of attendance: professional commitment and use of full-time staff.
20 In programs with multiple instructional sites, responses to questions on the ComprehensiveProgram Profile dealing with insfructional philosophy and curriculum orientation were obtained fromthe directors of the specific sites in which the participating clients received instruction. Consequently,site-level responses (rather than program level responses) were used in coding the instructional
36
4 4

Curriculum orientation, defined as the extent to which the program's adult educationcurriculum emphasizes individualized versus prestructured/fixed instructionaldesigns as measured by a five-point scale from the Comprehensive Program Profile(see footnote 20 below).
Type of learning environment, defined as a class with a teacher only or with a teacherand an aide, computer-assisted lab or learning lab, or individual tutor or self-studywith no instructor; derived from the Client Update Record.
Time of day that instruction is received, defined as morning, afternoon, or eveningclasses; derived from the Client Update Record.
Differentiating Enrollees who Never Attend Class from Those who Receive SomeInstruction (Group 1 versus All Others).
Many adult education programs devote considerable effort to client outreachand recruitment activities. This section identifies client background and programcharacteristics that distinguish clients who begin instniction from those who enroll butnever attend the first class. Identifying characteristics that distinguish between thosewho do and do not receive instructional service may help program managers makemore effective use of their outreach and recruitment resources. It may also contributefurther to understanding the extent to which the program is serving the members ofits target population who are most in need.
Logistic regression was used to differentiate enrollees who did and did notreceive instruction. Variables used in these analyses included client backgroundcharacteristics, program background characteristics, program organization andstructure, and program staffing characteristics.' As was previously discussed, wehave identified those variables that increase or decrease the odds that a client will bein a particular attendance group by 50 percent or more. Technical details of theregression analyses summarized in this section are presented in appendix D. Asdiscussed in the appendix, our statistical models were most accurate in distinguishingamong clients enrolled in ABE, but the results for all three instructional componentsare reasonably sound.
Across instructional components, four independent variables were found to besubstantial predictors of whether clients would or would not begin instruction: (1)
philosophy and curriculum orientation for each client.
21 Client background characteristics variables from Intake Form B were not used in these analysesbecause the comparisons involve persons who received no instruction. Use of support services wasomitted for the same reason.
37
45

program size, (2) integration of services, (3) outreach effort, and (4) cost per client seathour. New clients were less likely to begin instruction if they were enrolled in programsthat were very large, programs that devoted a relatively large amount of effort tooutreach and recruitment activities, programs that had high costs per client seat hour,and programs that had little integration of services. Note that these four predictors ofnot receiving instruction are all program-related variables.
Most of the predictors of receiving instruction are also characteristics of programsrather than of clients. Below, predictors of instruction are summarized for eachinstructional group.
For new ESL clients, personal background characteristics are not predictive ofreceiving instruction, but new clients enrolling in ESL are more likely to receiveinstruction if they are enrolled in programs that
are small to large, rather than very large;are administered by school districts, rather than private voluntaryorganizations or technical institutes;are full-year, rather than part-year;have substantial integration of social services;have little emphasis on staff training in retention;have little emphasis on client outreach and recruitment activity; andhave low costs per client seat hour.
New ABE clients who began receiving instruction were most likely to be over45 years of age; to be non-Hispanic whites rather than Asian or Pacific Islanders; andto have a postsecondary certification or degree rather than no high school diploma.Program-related predictors of new ABE clients receiving some hours of instructionwere enrollment in programs that--
are small to krge, rather than very large;are part-year, rather than full-year;have substantial integration of social services;emphasize staff training in retention;have little client outreach iL I recruitment activity; andhave low costs per client seat hour.
New ASE clients who began receiving instruction were more likely to be Asianor Pacific Islanders rather than non-Hispanic whites. Program-related predictors ofinstruction for new ASE clients included enrollment in programs that--
In the case of clients enrolled in ASE, the large program effect holds only for comparisons withmedium-size programs.
38
4 6

are located in nonmetropolitan areas;are medium-size;are sponsored by private voluntary organizations, rather than schooldistricts;are sponsored by school districts rather than community colleges;have substantial integration of social services;have moderate emphasis on client outreach and recruitment;have emphasized prestructured curricular designs rather thanemphasized individualized curricula;have professional commitment of the staff; andhave low costs per client seat hour.
It is interesting to note that in all three instructional components, a high scoreon our composite measure of social services integration is a substantial predictor ofenrollees beginning to receive instruction. That measure is composed of indicators ofthe breadth and depth of coordination of services with other agencies in thecommunity, the extent of support services available to enrollees directly from theprogram or another agency, the use of volunteers in the provision of support services,and the emphasis given in staff training to support services. It may be that programswith strong and varied relationships with other agencies in their service area are bestable to convert enrollees into clients who actually receive instruction.
It is also interesting to note that low or moderate, rather than high, scores forthe level of program effort devoted to outreach and recruitment activities is apredictor of enrollees actually beginning to receive instruction. This finding raises thepossibility that too great an emphasis on outreach and recruitment may result inregistering relatively large numbers of people who are not sufficiently motivated toshow up for class.
Finally, the predictors of receiving or not receiving instruction lend somesupport to a tentative conclusion presented in the study's second interim reportregarding the clients the program serves. For many years adult education programshave been criticized for not reaching the students who are the most in need. In thesecond report we concluded on the basis of information obtained at the time of clientenrollment that the program is enrolling a fairly representative group of its targetpopulation. Earlier in this third report we reported that 16 percent of the clients whoenroll in local programs do not receive instructional service, and thus there is apotential for bias with respect to the clients actually being served. The differencesbetween clients who do and do not receive instruction are mostly due to programrather than personal characteristics however. Thus it can be concluded that theprogram is serving, as well as enrolling, a fairly representative group of the program'starget population.
39 4 7

Analysis of Early Leavers (Group 2 versus Group 3)
The U.S. Department of Education specifies that only clients who have received12 or more hours of instruction should be counted when states and local programscomplete their federal adult education reports. The origin of the 12-hour requirementis not entirely clear, but it has been in effect since at least 1968. According to PaulDelker, director of the adult education program from 1967 to 1986, the cut-off pointof 12-hours was set when the program began. Program officials at that time sought toreport as participants only persons who could have been positively affected by theprogram, and 12 hours seemed to them to be a reasonable measure of minimalinstruction.
Establishing an enrollment criterion that reflects meaningful attendance hasintuitive appeal. However, where that cut-off point should be is not obvious, and 12hours may not be the most appropriate place.
Under the present policy, the Department is in effect requiring that clientsattend several class sessions before they can be counted as program participants. Onaverage, adult education clients attend class sessions for 2 weeks before theyaccumulate 12 hours of instruction. To implement the current reporting policy, localprograms must accurately record the number of hours of attendance for each clientand then exclude those who do not reach the 12- hour threshold. This is certainlypossible, and we have visited programs where we believe the counts are accurate, butwe have also visited programs where the counts are not accurate. (Many programsthat report total hours of instruction do not record the number of hours individualclients receive.) To the extent that some programs do not accurately implement theDepartment's 12-hour rule, a potentially significant amount of error is introduced intothe federal reporting system.
Exhibit 3.2 shows the attendance rates, measured in terms of hours ofinstruction, for new clients who received at least 1 hour of instruction. The patternshown is essentially the same as that displayed in terms of weeks in chapter 2 (exhibit2.4). All three instructional components have a fairly smooth rate of attrition, andthere is no clear shift.in the pattern of attendance at or around the 12th hour ofinstruction.
Exhibit 3.3 provides a clearer view of the attendance rate curves. As the exhibitshows, the attendance curves change directions at various points during the initial 40hours, with several of these shifts occurring prior to the 12-hour line. If the purpose fthe 12-hour exclusion rule is to remove enrollees who are simply observing ratherthan participating in the instructional program, the data presented in the exhibit
Personal communication, January 12, 1994.
40
48

would appear to support setting the criterion for counting participation at 2 or 3 hoursof instruction rather then 12 (i.e., at the first discernable drop in enrollment).
To examine the empirical basis for setting 12 hours as a cut-off point from adifferent perspective, we compared the characteristics of clients who took 1 to 11hours of instruction (group 2) with characteristics of clients in the first attendancequartile of their instructional component (group 3). Again, logistic regression analysiswas used. The extent to which one can distinguish between clients in two analyticgroups can be measured by a discrimination index. This summary statistic rangesfrom zero (chance discrimination) to 1.00 (perfectly reliable discrimination) andindicates how much (in percentage terms) our predictive capability is improved overwhat could be expected by chance alone. Overall, the ability of our statistical modelsto distinguish between the two groups in this set of analyses was in the low tomoderate range. We can distinguished the groups with a moderate degree ofaccuracy among ESL clients (ci = .41) but with considerable less accuracy for ABE (.30) and ASE = .26) clients. In essence, the predictors could not clearly distinguishbetween clients with 1 to 11 hours of attendance and those in the first quartile ofattendance.
To examine this issue from a third perspective, we looked at our preliminaryanalyses of responses from the Telephone Follow-up Survey. We wanted to seewhether clients who left the program during their initial 11 hours were more or lesssatisfied than those who stayed a longer time. Essentially, there was little differencein this regard. Of the clients who left the program after receiving 1 to 11 hours ofinstruction, 36 percent indicated they were satisfied, as compared with 39 percent ofthe clients who were in the lowest attendance quartile of all clients who received 12hours of instruction or more.' In both groups, 6 percent indicated they hadachieved their goals for enrolling at the time they left the program. The pattern acrossinstructional components with respect to goal attainment was also the essentially thesame for both groups. In the 1-to-11-hour attendance group, 2 percent of ESL, 3percent of ABE, and 8 percent of ASE clients reported that they left after havingachieved their goals, and for clients who were in the first attendance quartile thepercentage reporting having achieved their personal goals were 1 percent for ESL, 7percent for ABE, and 8 percent for ASE.
24 By component, 23 percent of ESL, 30 percent of ABE, and 44 percent of ASE clients in the 1-to-11-hour attendance group indicated that they left satisfied; for clients in the first quartile this was thecase for 23 percent of ESL, 39 percent of ABE, and 48 percent of ASE.
41
4 9

Exhibit 3.2Persistence Rates (in Hours) for Clients Who Received 1 Hour or More of
Instruction by Instructional ComponentPetrov of Owns
100 -4.-
GO
-
40
ESL ABE ASE. _
--- - . = . . - . . . . .
0 48 144 192 240 288 334
Hours of Instruction
384
Exhibit 3.3Persistence Rates (in Hours) for Clients Who Received 1 Hour or More of
Instruction by Instructional Component (Compressed View)
Percent of Clients100
12 Hours of Instruction
ESL ABE ASE
N
20Scale AdjustPdFor Clarity
1 4 7 10 13 16 19 22 25
Hours of Instruction
42
50
28 31 34 37 40 +

Finally, we note that the preliminary analyses from the Telephone Follow-upSurvey also suggests that by using 12 hours as a cut-off point, the program isexcluding a sizable number of clients who have been successfully served. This findingis consistent with preliminary analyses of our learning gains data relating changes inachievement test scores to hours of attendance. In particular, the ASE learning gainsindicate that achievement effects are obtained very quickly, and these effects areevident within 10 hours of instruction. If ASE students benefit from 10 or fewerinstructional hours, it seems reasonable to count such clients as participants.
On the basis of the foregoing analysis, it may be worthwhile for federal policymakersto reconsider the need to require states and local programs to distinguish amongclients on the basis of the existing 12-hour attendance rule. There appears to be noempirical basis for using 12 as opposed to some other number of hours. Establishinga cut-off point beyond the first instructional session (which usually involves 2 to 3hours of instruction) places a potentially serious administrative burden on localprograms which may also increase the amount of reporting error and systematicallyexclude clients whom the program has successfully served.
Predictors of Persistent Attendance (Groups 3-5 versus Group 6)
An important objective of adult education programs is to enable clients to receiveinstructional services long enough to demonstrate academic achievement or to achieveother personal goals. Although some clients achieve their instructional goals in ashort period of time, it is generally assumed that, within unspecified limits, the longerthe time that clients receive instruction, the more likely they are to achieve learninggains. Given this assumption, clients who are in the upper attendance quartile fortheir instructional component (94 hours or more for ABE, 85 hours or more for ASE,and 239 or more for ESL) are presumably more likely to be accomplishing their goalsthan those who are not.'
Logistic regression models were developed to identify predictors of persistentattendance for clients in each of the program's three instructional components. Inthese models, clients who took 12 hours or more of instruction in the first threeattendance quartiles were compared with clients who were in the fourth quartile (thepersisters). The technical results of these analyses are presented in appendix E. Thediscriminatory power of the statistical models was moderate to high, and theirpredictive accuracy was high.
The results of these analyses have important program implications. Essentially, as wefound with the other groups, sustained attendance is predicted largely by factorsrelated to program structure and instructional design rather than personal background
25 The mandated testing policies for adult education programs in several states are premised on theassumption that most clients require at least 60 to 70 hours of instruction for learning gains to show.
43
51

or motivational factors. The strongest predictors across all three components are theuse of support services, receipt of instruction during the day as opposed to evening,and clients' learning environment. These, and most of the other factors that werefound to be substantial predictors of persistence, are factors over which localprograms have some control.
Eleven variables are common to at least two of the instructional components,and five are common to all three. Our main conclusions about new client persistenceare summarized as follows:
Personal and Motivational Characteristics
Race/ethnicity is predictive of persistence in all three program components.Compared with non-Hispanic whites, Asian/Pacific Islanders are more likely topersist in ABE and ASE. Hispanics also are more likely to persist in ABE thannon-Hispanic whites. In the ESL component, non-Hispanic blacks are morelikely to persist than Hispanics, who are the majority of the ESL enrollees.
For ABE, older clients are more likely to persist than younger clients, but agewas not found to be a substantial predictor for clients enrolled in ESL or ASE.Specifically, clients over age 30 are more likely to persist in ABE programs.
Gender, marital status, welfare status, prior education, and the enrollmentmotivation variables are not predictive of persistence.
Program and Instructional Characteristics
A relatively prestructured or fixed (as opposed to a highly individualized)curriculum design is predictive of persistence for clients enrolled in ABE, butnot for clients in ASE or ESL.
A curricular emphasis on workplace or life skills is predictive of ASEpersistence. Whether a program's curriculum is academically oriented orworkplace/life skill-oriented does not predict persistence for clients enrolled inABE or ESL.
A client's learning environment is predictive of persistence, but the three typesof learning environment studied are differentially related to persistence byinstructional component. ESL clients participating in independent study aremore likely to persist than are those whose instruction is only classroom-based.Participation in a computer-assisted or another form of learning lab (rather thanonly classroom-based) also is predictive for clients in ESL. Participation in alearning lab rather than only classroom-based instruction also is predictive ofpersistence for ASE clients, whereas independent study is not predictive of
44

persistence for clients in ASE. ABE clients participating in independent studyare less likely to persist than are ABE clients whose instruction is provided onlyin a teacher-based classroom.
Regardless of component, clients who attend classes only during the day arethe most likely to persist, whereas those who attend only at night are the leastlikely to persist. About half of all clients (49 percent) attend only during theday and slightly over a third (37 percent) attend only at night.' Attendingboth day and night classes is also predictive of persistence for AS" and ESLclients, but the effect of day-only classes is stronger.
ESL clients are more likely to persist if they are enrolled in large classes (31students or more), ABE students are more likely to persist if they are inmedium-to-large-size classes (more than 10 clients), and class size is not relatedto persistence for ASE. Thus, our data do not support the argument that smallclass sizes necessarily encourage client persistence.
Having some full-time staff (at least one full-time administrator and one full-time member of the instructional staff) is an important predictor of persistencefor clients enrolled in ESL and ASE.
The relationship between our measure of the integration of services and clientpersistence is different for each instructional component. ABE clients are morelikely to persist if they are in programs that have a high score or integration ofservices (i.e., coordination of program services with other agencies and thebreadth of services offered to clients). Low integration is predictive ofpersistence in ASE and ESL, but the effect depends on the point of comparison(medium for ASE and high for ESL).
Use of support services is a strong predictor for all components. Of the 25percent of clients who use support services, most clients (60 percent) use onlyone type, with counseling (13 percent), financial assistance (6 percent), andtransportation (6 percent) being the services most frequently used. Clients inprograms which provided 5 types of services or more received, on average, 115hours (and 19 weeks) of instruction, while those in programs that provided 4types of support services or less received, on average, 60 hours (and 17 weeks)of instruction. This pattern was the same for ABE, ASE and ESL.
Some 48 percent of ABE, 42 percent of ASE, and 55 percent of ESL clients attend only during theday; 39 percent of ABE, 44 percent of ASE, and 30 percent of ESL clients attend only at night; and theremainder attend both day and evening classes.
45
53

ASE clients enrolled in programs serving urban areas, especially large urbanareas, are more likely to persist than are clients in rural programs. Otherwise,the urbanicity of a program's service area is not a strong predictor ofpersistence.
Spending more per client seat hour is not positively related to persistence.Client cost per seat hour is not a predictor for ESL, and low cost per seat houris predictive of persistence for clients in ASE. For ABE clients, average costsare predictive of persistence.
Summary and Conclusions
This chapter first sought to identify what distinguishes clients who enroll butdo not receive adult education instruction from clients who receive services. On thebasis of logistic regression analyses comparing clients who did and did not receiveinstruction after having enrolled for adult education services, we found the following:
Newly enrolled clients are less likely to begin instruction if they are in aprogram that is very large, in a program that devotes a relatively largeamount of effort to outreach and recruitment activities, or in a programwhose services are not well coordinated with other community agencies.The odds that enrollees will begin are also substantially less if they are ina program that has a relatively high cost per client seat hour.
Clients are more likely to start receiving services if they are in programsthat score high on our measure of services integration, and, for ABEclients, if they are enrolled in programs that devote relatively moreattention to providing staff training in client retention. It may be that aheavy emphasis on outreach and recruitment generates enrollment byunusually large numbers of people who are insufficiently motivated toshow up for class. It also appears that programs that have strong andvaried relationships with other agencies in their service area are mostable to convert enrollees into clients who actually receive instruction.
The second focus of the chapter was on determining what, if any, importantdifferences may exist between clients who begin instruction but leave beforecompleting 12 hours and clients who continue somewhat longer. The U.S.Department of Education specifies that only clients who have received 12 or morehours of instruction should be counted when states and local programs complete theirfederal adult education reports. Ho's. wer, this requirement places an administrativeburden on many local programs, and to the extent that programs do not accurately
46
5 4

implement the Department's 12-hour rule, a potentially significant amount of error isintroduced into the federal reporting system.
To determine whether there is a compelling empirical basis for the 12-hour rule,we looked at the patterns of attendance for clients in each instructional component,the results of logistic regression analyses designed to identify differences betweenclients with 1 to 11 hours of instruction and clients in the first attendance quartile fortheir component, and at preliminary analyses of program impact measures from theTelephone Follow-up Survey and analyses of tested learning gains. Essentially, wefound there to be no empirical basis for using 12 hours as a cut-off point for includingclients in the federal reporting system, and that using it may result in systematicallyexcluding clients whom the program has satisfactorily served.
Finally, the chapter identified predictors of persistent attendance. To identifythese predictors we used logistic regression analyses to compare data on clients whotook 12 hours or more of instruction in the first three attendance quartiles to data onclients who were in the fourth, or most persistent, quartile in their instructional group.Essentially, most of the factors that were found to be substantial predictors ofpersistence are factors over which local programs have some control. For clients whohad already attended at least 12 hours of adult education instruction, the explanationfor sustained attendance lies primarily in factors related to program structure anddesign, rather than personal background or motivational factors. The strongestpredictors of persistence across all three components are as follows:
The presence of support services that clients actually use,
The receipt of instruction during the day as opposed to evening hours,and
The 'zype of learning environment in which the clients pa ''.cipate, but thetype of environment that was most predictive was not the same for allthree instructional components.

APPENDIX AStudy Objectives
A-1
56

STUDY OBJECTIVES
1. Client populations and patterns of participation. To construct empirically based models of client"flows" through each of the program's service components (ABE, ASE, and ESL), which willpermit detailed estimates of client intake, participation, and attrition over time.
2. Factors contributing to client persistence. To identify client background and service-programvariables that are positively related to client persistence (or negatively related to client attrition).
3. Reaching adults with basic literacy needs. To identify service-program characteristics that arepositively or negatively related to attracting and holding adults with basic literacy needs.
4. Support and cooperation at the local level. To assess the extent to which federal and state fundsfor adult education are effectively supplemented by other resources at the local level.
5. Program capacity and demand for services. To develop and compare regional and nationalmeasures of unmet (or deferred) demand for adult education services and excess (or under-utilized) service capacity, and to assess the extent to which improved management of existingadult education resources might bring supply and demand into closer balance.
6. Participation rates of target populations. To develop estimates of the size and composition oftarget populations for each of the program's service components, and, by relating these estimatesto data on program clients, to assess levels and rates of program participation for these targetpopulations.
7. Learning gains. To develop estimates of average learning gains as related to hours of instructionor tutoring for each program component, and, by applying these estimates to data onparticipation, to assess aggregate learning outcomes generated by the program over a 1 yearperiod.
8. Service costs. To develop estimates of average service costs as related to hours of instruction ortutoring for each program component, and, by relating these estimates to data on participationand learning gains, to assess the service costs associated with producing successful outcomes.
9. Employment outcomes. To evaluate the extent to which sustained program participation issignificantly associated with favorable employment outcomes, using employment outcomes ofearly leavers as the standard of comparison.
10. Dissemination. To stimulate wider interest in a discussion of policy issues in adult education bymeans of timely dissemination of findings and interim reports, commissioned papers on selectedissues, and a national conference at the conclusion of the study.
11. Independent research. To facilitate independent research on adult education by issuing unit-record data files for the national samples of service providers and new clients, along withprovisions for linking these two files and high-quality user-oriented technical documentation.
12. Analytic agenda. To develop recommendations concerning future analytic agendas for adulteducation, with special reference to further uses of data from the 1992 National Survey of AdultLiteracy and the 1990 census.

APPENDIX BData Collection Forms
B-1
5 s

01118 Approval No. nmeossExpiration Date 8-31-93
emmomm,
Client Record Booklet 2 71
Client Name:
NATIONAL EVALUATION OFADULT EDUCATION
PROGRAMSU.S. Department of Education
Washington, D.C.
Development Associates, line.173 North Lynn St.
Arlington, VA 22200-2000Telephones (703) 2704077
For infermatIon roll 1400-340-7323
Please send eampleted torso to:
Comprehensive Adult StudentAssessment System (CASAS)2725 Conger.* Street, Suite 1-9I
San Diego, CA 92110Telephones (019) 299-4021
ReportingPeriod
1
23
Begin
April 22, 1991May 27, 1991July 1, 1991
Close
May 24, 1991June 280991Aug. 2, 1991
Transmittal
May 31, 1991July 5, 1991Aug. 9, 1991
4 Aug. 5, 1991 Sept. 6, 1991 Sept. 13, 19915 Sept. 9, 1991 Oct. 11, 1991 Oct. 18, 19916 Oct. 14, 1991 Nov. 15, 1991 Nov. 22, 19917 Nov. 18, 1991 Dec. 20, 1991 Dec. 27, 19918 Dec. 23, 1991 Feb. 14, 1992 Feb. 21, 19929 Feb. 17, 1992 April 10, 1992 April 17, 1992
10 April 13, 1992 June 5, 1992 June 12, 199211 June 8, 1992 July 31, 1992 Aug. 7, 199212 Aug. 3, 1992 Sept. 25, 1992 Oct. 2, 199213 Sept. 28, 1992 Nov. 20, 1992 Nov. 27, 199214 Nov. 23, 1992 Jan. 15, 1993 Jan. 22, 199315 Jan. 18, 1993 March 12, 1993 March 19, 199316 March 15, 1993 May 7, 1993 May 14, 199317 May 10, 1993 July 2, 1993 July 9, 199318 July 5, 1993 Aug. 27, 1993 Sept. 3, 199319 Aug. 30, 1993 Oct. 22, 1993 Oct. 29, 1993
593/25/91

!Client Update Recordi
Client Name:
NATIONAL EVALUATION OF ADULT EDUCATION PROGRAMS
U.S. Department of EducationWashington, D.C.
Development Associates, Ina.1730 North Lynn St.
Arlington, VA :274*.21e1Telephones (703) 2744477
For infornsedon call 1.8011-340.7223
Please send eempleted terns tag
Comprehensive Adult StudentAssessment Systeni (CASAS)2725 Congress threat, Sulte 141
San Diego, CA 02110Telephones (011) 2110-4081
Public reporting burden for this collection of information is estimated to vary from 1 to 2 minutes per response, including time for reviewinginstructions, searching existing data sources, gathering and maintaining the data needed, and completing and reviewing the collection ofinformation. Send comments regarding this burden estimate or any other aspect of this collection,of information, including suggestions forreducing this burden, to the U. S. Department of Education, Information Management and Compliance Division, Washington, D.C.2020'2-4651; and to the Office of Management and Budget, Paperwork Reduction Project 1875-NEW, Washington, D.C. 20503.
National Evaluationof Adult Education
Program'Client ID Number
H I WCXXXDO0000®cxxxx)CDOCXXD00000000S0ooeo®00000TTIOCX1)OCXDO®
Reporting Period000000000000000000®
1 Program Status at End of Reporting Period
0 Active: Received one or more hours of instruction (Go to 3)0 Inactive: Received less than one hour of instruction (Go to 2) and stop
2 Reason for Not Receiving instruction (Choose One)
0 Client no longer attends, reason unknown0 Completed instructional program, not interested in going further0 Completed highest level of instruction offered0 Completed requirements of empioyer/other agency/other program
0 Forced to leave by personal circumstances - moved, changed lob,health, family obligations, etc.
0 Did not complete program, but left expressing satisfaction0 Did not complete program and left expressing dissatisfaction0 Transferred to another site0 Participation ended for other reasons
BEST COPY AVAILABLE 6 9
SERIAL NUMBER
03-25-91

National Evaluation of Adult Education ProgramsClient Update Record
3 Current Program Placement Learning Environment(*) 5 Time of Instructional 6 Progress Test
(Mark All That Apply) (Mark AN That Apply) Activity(Mark AN That Apply)
Administered During ThisReporting Period
0 ESL Beginning 0 Class with teacher only(Chooss Ono)
0 ESL Intermediate 0 Class withloacher and aide 0 Morning0 ESL Advanced 0 Computer assisted lab 0 Afternoon 0 Yes0 ABE Beginning 0 Learning lab 0 Evening 0 No0 ABE intermediate 0 Individual tutor - (Atter5p.m.)
0 ASEp GED Preparation
0 Self-study, no instiuctor0 Other
7 support ServicesUsed DuringThis Period
(Met As That Appy)
8 ApproximateClassSize
This Period
0 Child care0 Transportation0 Health services0 Counseling0 Job search
assistance0 Translator
services0 Financial
assistance
0 Casamanagement
0 Other0 None0 Could not be
determined
I I
000000000000000000000000®00®00
Days andHours Scheduled*
Days HoursScheduled ScheduledPer Week Per Week
II0000oose
0
0 Mark here if days or hoursare unscheduled as in lab environ-ment. Indicate above the numberol days and hours facility is open.
10 WEEKLY CLIENT ATTENDANCE RECORD
Week ONEBeginning
/ /
Week TWOBeginning
/ /
Week THREEBeginning
/ /
Week FOURBeginning
/ /Month Day Year Month Day Year Month Day Year Month Day Year
Total TotalDays Hours
Attended Attended
0 ®00 000 000 000 000 000 000 000000
Total TotalDays Hours
Attended Attended
0 ®100 0®0 000 0C)0 0®0 0®0 000 00
TO00
Total TotalDays Hours
Attended Attended
0 0®0 0®0 000 ®00 000 000 000 000000
Total TotalDays Hours
Attended Attended
® 000 0C)0 000 ®00 000 000 000 000000
Number of scheduleddays class was sot held
0000(!)00Number of scheduleddays class was not held
0000000Number of scheduleddays class was Dot held
0000000Number of scheduleddays clus was not held
0000000Week RVEBeginning
/ /
Week SIXBeginning
/ /
Week SEVENBegkming
/ /
Week EIGHTBeginning
/ /Month Day Year Month Day Year Month Day Year Month Day Year
Total TotalDays Hours
Attended Attended
0 ® ®0 000 TT0 ®C)0 000 000 0®0 0®000®
Total TotalDays Hours
Attended Attended
® 000 000 TS® C)00 000 000 000 0000
00
Total TotalDays Hours
Attended Attended
0 ®O0 000 0®® 000 0®0 000 000 000000
Total TotalDays Hours
Attended Attended
0 0 00 000 0®0 0®0 000 000 000 000®00
Number of scheduleddays class was not held
00000ToNumber of scheduleddays class was not held
000eea)Number of scheduleddays class was not held
000000®Number of scheduleddays class was not held
000000061

APPENDIX CBias Control Issues for Analyses Reported in Third Interim Report

Bias Control Issues for Analyses Reported in Third Interim Report
This appendix summarizes the results of analyses of the degree to which the sampleused in this study is likely to be representative of the population of adult educationclients. The first issue addressed is whether clientlevel information obtained from IntakeB records is flawed because of patterns of missing data. Then we briefly discuss thedegree to which the sample we obtained from i-he telephone follow-up survey isrepresentative.
Intake B records were not obtained for 21 percent of the new adult education clientsparticipating in the national evaluation. The majority (55 percent) of these missingrecords relate to clients who enrolled in an adult education program but never beganinstruction. The rest began instruction, but program staff did not the Part-B Intakerecords for them.
Do the "missing Bs" constitute a problem? In essence, we condude that because thepurpose of the third interim report is intended to describe patterns of attendance andgenerate explanatory models of attendance in order to show how client and programcharacteristics are related to hours of instruction--our sample is sufficient (i.e., at least13,000 cases with complete data on the variables of interest). However, problems relatedto missing data may arise in describing the characteristics of the population based on oursample, which will be need to be corrected for the study's final report.
The sampling weights used in the national evaluation's second interim report wereadjusted to the sampling frame that was actually obtained so that the study's findingswould be nationally representative. The same consideration is relevant here. That is,additional sampling weights should be developed to compensate for missing data if asmaller sample (e.g., composed only of cases with nonmissing data) producedsubstantially different descriptive estimates (compared with a larger sample in which asubstantial portion of cases have missing data) or if the data loss were in some importantway systematic and not random. Both of these considerations were examined.
Sample Biasing Effects
To examine the effect of missing Intake-B records we compared estimates of basicclient characteristics (race, gender, etc.) for two groups. One group consisted of theapproximately 16,000 cases for whom .we had Intake-A and Update records, but forwhom 21 percent of the Intake-B records were missing. The second group wascomposed of the subset of approximately 13,000 cases from the first group which hadcomplete Intake-B records.

Using the adjusted sampling weights and the attendance database,1 descriptiveestimates for 10 traits measured by the Intake A and Universe Survey records werecompared on the basis of whether cases were included or excluded from the analysisbecause of the presence or absence of Intake-13 records. In addition to comparingdifferences in the estimates, we were interested in the extent to which an estimatedepends on its sample; for this, we employed appropriate measures of association forcategorical variables.'
The results of the comparative analysis of the two samples indicated that descriptiveestimates of client and program characteristics are very similar, regardless of whether thesample includes clients with Intake-B records. These results also show that differences inthe estimates depend very little on whether the sample includes clients with completeIntake-B records or is based on clients for whom Intake-B records are totally missing.'
The tables at the end of this appendix summarize the results of the comparativesamples analysis (see exhibits C.2-C.11). Trait estimates are expressed as proportionswith respect to clients within each sample, rounded to whole numbers. The "Total" rowindicates the sample size in terms of the percent and number (unweighted) of clients.Correlation statistics appear below each table and summarize the extent to whichestimates of a trait depend on the sample from which it was drawn. Becuase we areinterested in the effect of dropping cases with missing Intake-B records, the most relevantcomparison is between the full sample (which combines clients who have Intake-Brecords and clients for whom Intake-B is missing) and the smaller (has Intake-B records)sample (which excludes clients for whom Intake-B records are missing).
Predicting Missing Data
Logistic regression analysis was used to predict the presence of Intake-B data inorder to establish more clearly whether the absence of such data was likely to result insystematic estimation bias. The resulting prediction model (which employed aspredictors the 10 variables estimated in exhibits C.2-C.11) was able to correctly classifynew clients in 86 percent of the cases as to whether their Intake-B records were presentor missing in the attendance database.
At a minimum, this database includes clients who have Intake-A and Update records. For thelatter, the number of hours of instruction received in adult education is the minimum datum.
Nonparametric correlation statistics included the Phi Coefficient (for 2x2 tables) and theContingency Coefficient (for larger tables).
Estimates of a trait are fairly independent of the source of information (i.e., the HASB sample orthe HASB-NOT sample). As is indicated by the low correlations, which range from zero to .16, withan average of .07. For example, with respect to gender there is a zero correlation between estimates ofmale-female and data source; the estimate for male is approximately 42 percent regardless of whetherthe sample includes clients with Intake-Bs or not.
C-4
64

The principal finding of this analysis was that there is a regional bias related to thereporting of Intake-B records. Specifically, adult education programs in the West aremore likely to provide Intake-B records (compared with the other census regions), apartfrom the fact that the western programs account for the greatest number of client recordsin the study's database (because of the sampling design). From a descriptive standpoint,the West returned a higher percentage of Intake-B records than other regions of thecountry (see exhibit C.1).
Exhibit C.,Percent of Intake-B Records Returned by Census Region
Census Region Percent of Intake-BsReported
Number of Programs Reporting(clients with Intake-B records)
North Central 80 % 26(3,813 B records)
Northeast 7712
(1,510 B records)
South 7543
(3,674 B records)
West 8237
(4,240 B records)
Total 79 % 118(13,239 B records)
Conclusions about the Need for Bias Adjustment
There is a slight bias in the study related to under-reporting of Intake-B records.This bias is most pronounced for the Western census region (which is most likely toreport Intake-B data), and would tend to inflate descriptive estimates of clientcharacteristics related to Intake B variables for those residing in the West. An adjustment(e.g., weighting or imputing of missing Intake-B records) is therefore warranted in orderto ensure the generalizability of descriptive estimates with respect to Intake-B variables.
An adjustment for missing Iniake-B data will be carried out and implemented forthe final report of the national evaluation but no adjustments are needed for the analysesin this report. This decision takes into consideration the relative emphases of the thirdinterim report and the final report. In this report, we are primarily concerned withestablishing relationships about attendance patterns. While in the final report, thesepatterns will also need to be described with greater precision than must be done here.
C-5
6 5

Exhibit C.2Estimates of Program Size as a Function of Sample
Program SizeHASB-NOT
SampleHASBSample
CombinedSample
Small . 12 % 8 % 8 %
Medium 77 69 71
Large 12 24 21
Total20 %
(N = 3,521)80 %
(N = 13,237)100 %
(N = 16,758)
r = .12
Exhibit C.3Estimates of Client Program Participation by Census Region
as a Function of Sample
Census Region HASB-NOTSample
HASBSample
CombinedSample
Northcentral 24 % 24 % 24 %
Northeast 15 12 13
South 36 27 29
West 24 37 35
Total 1
20 %(N = 3,521)
80 %(N = 13,237)
100 %(N = 16,758)
r = .12
C-6
6 6

Exhibit C.4Estimates of Client Community Type as a Function of Sample
Type of Comrnunity HASB-NOTSample
HASBSample
CombinedSample
Large CityMajor Metro 7 % 18 % 16 %
Balance MajorMetro Area 26 24 24
Small Metro 23 30 29
Non-Metro 44 28 31
Total21 °/0
(N = 3,521)79 %
(N = 13,237)100 %
(N = 16,758)
r = .16
Exhibit C.5Estimates of Client Age as a Function of Sample
Client Age HASB-NOTSample
HASBSample
CombinedSample
16-21 Years 39 % 35 % 36 %
22-30 Years 31 32 32
31-45 Years 23 24 24
46 & Older 7 9 9
Total19 %
(N = 2,787)81 %
(N = 12,253)100 %
(N = 15,040)
r = .04
C-7
6 7

Exhibit C.6Estimates of Program Placement as a Function of Sample
ProgramPlacement
HASB-NOTSample
HASBSample
CombinedSample
ESL 28 % 39 % 37 %
ABE 31 24 25
ASE 41 37 38
Total20 %
(N = 3,098)80 %
(N = 12,792)100 %
(N = 15,890)
r = .09
Exhibit C.7Estimates of Client Gender as a Function of Sample
GenderHASB-NOT
SampleHASBSample
CombinedSample
Male 41 % 42 % 42 %
Female 59 58 58
Total21 %
(3,517)79 %
(N = 13,212)100 %
(N = 16,736)
r = .00

Exhibit C.8Estimates of Educational Attainment (Years of School Completed)
as a Function of Sample
Years of School HASB-NOTSample
HASBSample
CombinedSample
0-8 Years 23 % 23 % 23 %
9 Years 18 17 17
10 Years 22 18 19
11 Yrs . 18 18 18
12 or More 19 24 23
Total 19 %(N = 2,994)
81 %(N = 12,972)
100 %(N = 15,966)
r = .05
Exhibit C.9Estimates of Educational Attainment (Highest Degree Obtained)
as a Function of Sample
HighestDegree
HASB-NOTSample
HASBSample
CombinedSample
None 81 % 71 % 73 %
High School 13 19 18
Some College' 2 5 4
College 4 6 5
Total 18 %(N = 2,630)
82 %(N = 11,641)
100 %(N = 14,271) 1
r = .09
4 Associate's Degree or Technical Certification
C-9
69

Exhibit C.10Estimates of Client Marital Status as a Function of Sample
MaritalStatus
HASB-NOTSample
HASB Sample Combined Sample
Married 37 % 35 % 35 %
Widowed,
1 2 2
Divorced 8 7 7
Separated 4 5 5
Never Married 51 51 51
Total15 %
(N = 2,297)85 %
(N = 12,851)100 %
(N = 15,148)
r = .02
Exhibit C.11Estimates of Client Race as a Function of Sample
Client RaceHASB-NOT
SampleHASBSample
CombinedSample
Native American 1 % 2 % 2 %
Asian 9 10 10
Black 15 13 13
Hispanic 27 31 30
White 48 44 45
Total20 %
(N = 3,268)80 %
(N = 13,101)100 %
(N = 16,369)
r = .05

The Telephone Survey
An examination of the sample of clients included in the telephone survey revealedthat one could predict with considerable accuracy whether an interview would beattempted, and, given an attempt, whether contact would be made. The fact that there isa high degree of predictability is indicative of a nonrandom system, and indicates thereis a reason for concern that tabulation of responses to the telephone survey will yieldbiased estimates of responses that would be given by the entire population. Hence, forthe final report, if a similar pattern exists when the entire telephone interview sample isexamined, corrective measures will be taken. This will likely be a reweight of the sampleto correct for the nonrandom loss of cases.

APPENDIX DLogistic Regression -- Summary Tables

Logistic Regression -- Summary Tables
Logistic regression was used to develop explanatory models for clients whoenrolled in the ESL, ABE, and ASE program components but who dropped out beforereceiving any instruction. These models compare clients with zero hours of instruction(the No-Shows) to those who received instruction. Exhibit D.1 summarizes the predictiveefficacy of the three No Service Models based on two indicators: the discrimination indexand predictive accuracy.
The extent to which the models distinguish between No-Shows (new clients withzero hours of instruction) and new clients who receive instruction is measured by thediscrimination index. This summary statistic can range from zero (chance leveldiscrimination) to 1.00 (perfectly reliable discrimination) and indicates how much (inpercentage terms) our predictive capability is improved using the models over whatcould be expected by chance alone. The No Service Models vary widely in theirdiscriminatory power. No-Shows can be discrfininated most accurately among ABEstudents (d = .68) and least accurately among ESL students (d = .29); ASE No-Shows canbe differentiated with a moderate degree of accuracy (d = .47).
The accuracy of the No Service Models in predicting No-Shows is measured by theproportion of cases predicted by the model to be No-Shows who were in fact observed tohave zero hours of instruction. Similar to the discrimination index, the predictiveaccuracy of the No Service Models varied widely. The ABE model provided the highestaccuracy in predicting No-Shows (78% correct predictions), the ASE model wasmoderately accurate in its predictions (60% correct), and the ESL model was leastaccurate in predicting new clients with zero hours of instruction (37% correctpredictions).
Exhibit D.1Predictive Efficacy of No Sexvice Models
PlacementLevel
PredictiveAccuracy
DiscriminationIndex
UnweightedSample Size
ESL .37 .29 N = 3715
ABE .78 .68 N = 3433
ASE .60 .47 N = 5016
The remaining exhibits in Appendix D are divided into two sets, each of whichsummarizes the logistic regression results by placement level with respect to a class ofpredictors; these consist of a subset of personal and programmatic characteristicspertinent to new clients with zero hours of instruction. In the ESL model, theindependent variable measuring type of community in which a project is located wasdeleted because it is highly correlated with other project-related characteristics such as
D-3

program size and cost. In addition, the single best measure of educational backgroundwas used as a predictor of No-Show group n.embership because these two variables tendto be substantially correlated with each other. The choice of the educational backgroundpredictor was based on which of the two indicators correlated the highest with theoutcome of interest (i.e., membership in the No-Show group); this proved to be thehighest degree achieved by new clients prior to enrolling in adult education.
The logit regression models which follow summarize the contribution of eachindependent variable to the prediction of being a No-Show. Each table displays theregression coefficient, the standard error of the regression coefficient, whether thecoefficient is statistically significant or not (NS), and the odds ratio (the antilog of thecoefficient). The odds ratio provides the easiest measure of the contribution of eachindependent variable to the prediction of being a No-Show, controlling for all otherpredictors in the model. An odds ratio close to 1.00 indicates that a predictor has littleor no influence on being a No-Show, and the regression coefficient should beapproximately zero for such a predictor. As the odds ratio increases from 1, the chancesof being a No-Show are increased by the characteristic in question; similarly, odds ratiosless than 1 indicate that the characteristic decreases the likelihood of being a No-Show.
The amount by which the odds of being a No-Show are increased by acharacteristic can be seen directly in odds ratios greater than one. In Exhibit D2.1, forexample, the odds ratio for Asians is 1.39; this means that Asians are 39% more likely tobe No-Shows in the ESL Program compared to Hispanics. The amount by which theodds of being a No-Show are decreased by a characteristic requires an elementarycalculation, as follows: for odds ratios less than one, simply subtract the odds ratio inquestion from one. Using the data in Exhibit D2.1, it can be estimated that married ESLclients are 17% less likely to be No-Shows compared to those with some prior history ofmarriage (.83 1 = -.17).
Note that for predictors originally measured on a nominal scale (e.g., categoriessuch as Race), a reference group is used and this is always the dominant subgrouprelative to ESL, ABE, or ASE placement. For statistical reasons, the reference group mustbe omitted from the analysis in each model, but its effect on being a No-Show can becalculated as the reciprocal of the odds ratio for each of the target variables in its group.For example, Hispanic is the reference group for Race in the ESL model whereas White isthe reference group for Race in the ABE and ASE models. In Exhibit D2.1, it can be seenthat Hispanics are 28% less likely than Asians to drop out before the first ESL classbecause the odds of being a No-Show for Hispanics relative to Asians is .72 (i.e., 1/1.39 =.72; .72 - 1.00 = -.28).
It should be kept in mind that statistical significance does not necessarily indicate ameaningful relationship, particularly when relatively large samples are used (as in thepresent case). Therefore, we have used a double asterisk to indicate predictors estimatedto increase the odds of membership in the No-Show group by 50% or more.Alternatively, a single asterisk identifies predictors which are estimated to reduce theodds cf receiving no instruction by 50% or more. The designation of a predictor as
D-4
74

substantial also takes the standard error of estimate into account, computed to the 95%confidence level (or plus and minus two standard errors).
Exhibit D2.1ESL No-Show as Predicted by Client Personal Characteristics
Substantial Reduction in Likelihood of No Instruction *
Substantial Increase in Likelihood of No Instruction **
LogisticRegressionCoefficient
StandardError (SE)
StatisticalSignificance
(p < .01)
Odds of ZeroHours of
Instruction
Age16-21 Years Old31-45 Years Old46 and Older(vs. 22-30 Yrs Old)
-.22-.03.04
.02
.02
.02
SignificantNSNS
.81
.971.04
Male(vs female)
.03 .01 NS 1.03
Race/EthnicityAm. Indian .30 .13 NS 1.35Asian/Pac. Isl. .33 .02 Significant 1.39Black nonHisp .06 .04 NS 1.06White nonHisp(vs Hispanic)
.04 .03 NS 1.04
EducationHS Graduate -.01 .02 NS .99Post Sec Grad(vs No Degree)
.09 .02 Significant 1.09
Married(vs Otherwise)
-.19 .01 Significant .83
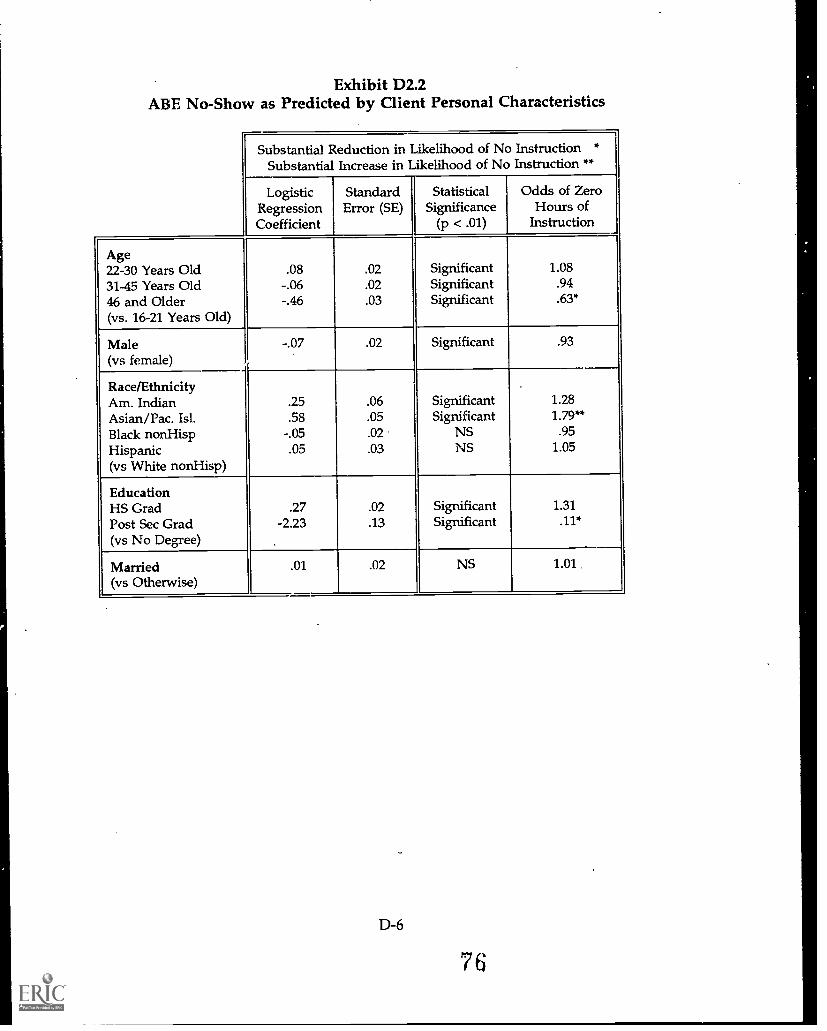
Exhibit D2.2ABE No-Show as Predicted by Client Personal Characteristics
Substantial Reduction in Likelihood of No Instruction *
Substantial Increase in Likelihood of No Instruction **
LogisticRegressionCoefficient
StandardError (SE)
StatisticalSignificance
(p < .01)
Odds of ZeroHours of
Instruction
Age22-30 Years Old .08 .02 Significant 1.08
31-45 Years Old -.06 .02 Significant .94
46 and Older(vs. 16-21 Years Old)
-.46 .03 Significant .63*
Male(vs female)
-.07 .02 Significant .93
Race/Ethnicity .
Am. Indian .25 .06 Significant 1.28
Asian/Pac. Isl. .58 .05 Significant 1.79**
Black nonHisp -.05 .02 NS .95
Hispanic(vs White nonHisp)
.05 .03 NS 1.05
EducationHS Grad .27 .02 Significant 1.31
Post Sec Grad -2.23 .13 Significant .11*
(vs No Degree) .
Married(vs Otherwise)
.01 .02 NS 1.01

Exhibit D2.3ASE No-Show as Predicted by Client Personal Characteristics
Substantial Reduction in Likelihood of No Instruction *
Substantial Increase in Likelihood of No Instruction **
LogisticRegressionCoefficient
StandardError (SE)
StatisticalSignificance
(p < .01)
Odds of ZeroHours of
Instruction
Age22-30 Years Old31-45 Years Old46 and Older(vs. 16-21 Years Old)
-.03-.16-.32
.01
.02.03
NSSignificantSignificant
.97
.85
.72
Male(vs female)
.16 .01 Significant 1.18
Race/ EthnicityAm. Indian -.23 .04 Significant .80Asian/Pac. Isl. -.48 .05 Significant .62*Black nonHisp -.18 .02 . Significant .83Hispanic(vs White nonHisp)
.34 .02 Significant .71
EducationHS Graduate -.26 .02 Significant .77Post Sec Degree(vs No Degree)
-.15 .03 Significant .86
Married(vs Otherwise)
.02 .01 NS 1.02

Exhibit D3.1ESL No-Show as Predicted by Program Structural Characteristics
Substantial Reduction in Likelihood of No Instruction *
Substantial Increase in Likelihood of No Instruction **
LogisticRegressionCoefficient
StandardError (SE)
StatisticalSignificance
(p < .01)
Odds of Zero Hours ofInstruction
SizeSmall -2.24 .05 Significant .11*
Medium -.49 .03 Significant .61*
Large(vs Very Large)
-1.19 .03 Significant .31*
SponsorshipCollege .04 .02 NS 1.04
PV0/T1(vs LEAs)
.59 .05 Significant 1.80**
Design .10 .01 Significant 1.10
Philosophy -.32 .01 Significant .72
Full Year(vs Part Year)
-.91 .02 Significant .40*
Professional .07 .03 Significant 1.08
Committment(vs Otherwise)
.
Full Time Staff(vs Part-Time)
-.31 .02 Significant .74
RetentionTraining(vs Otherwise)
.58 .03 Significant 1.78**
ServicesIntegrationLow .79 .03 Significant 2.21**
Medium(vs High)
.55 .03 Significant 1.73**
OutreachLow -.58 .02 Significant .56*
High(vs Medium)
.45 .02 Significant 1.57**
CostLow -.38 .02 Significant .69*
High(vs Medium)
1.64 .02 Significant 5.16**
D-8
78

Exhibit D3.2ABE No-Show as Predicted by Program Structural Characteristics
Substantial Reduction in Likelihood of No Instruction *
Substantial Increase in Likelihood of No Instruction **
LogisticRegressionCoefficient
StandardError (SE)
StatisticalSignificance
(p < .01)
Odds of Zero Hours ofInstruction
SizeSmallMediumVery Large(vs Large)
-.68-1.83
.84
.03
.03
.04
SignificantSignificantSignificant
.51*
.16*2.31**
SponsorshipCollege .18 .03 Significant 1.20PV0/T1(vs LEAs)
.15 .04 Significant 1.16
Design -.32 .01 Significant .73
Philosophy -.02 .01 NS .98
Full Year(vs Part Year)
.89 .02 Significant 2.43**
Professional -.18 .03 Significant .83Committment(vs Otherwise)
Full Time Staff(vs Part-Time)
.13 .03 Significant 1.13
Retention Training(vs Otherwise)
-.98 .03 Significant .38*
Services IntegrationLow 1.27 .03 Significant 3.56**Medium(vs High)
.42 .02 Significant 1.52**
OutreachLow -.79 .03 Significant 45*
High(vs Medium)
1.28 .02 Significant 3.60**
CostLow -2.78 .13 Significant .06*High(vs Medium)
2.45 .03 Significant 11.56**
Type of CommunityCity -.70 .07 Significant .50*Large Metro .72 .04 Significant 2.05**Small Metro(vs Nonmetro)
.62 .03 Significant 1.86**
D-9 7 9

Exhibit D3.3ASE No-Show as Predicted by Program Structural Characteristics
Substantial Reduction in Likelihood of No Instruction *
Substantial Increase in Likelihood of No Instruction **
LogisticRegressionCoefficient
StandardError (SE)
StatisticalSignificance
(p < .01)
Odds of Zero Hours ofInstruction
SizeSmallMediumVery Large(vs Large)
-.13-1.19-.24
.02
.02
.02
SignificantSignificantSignificant
.88
.31*
.78
SponsorshipCollege 1.53 .03 Significant 4.62**
PVO/TI(vs LEA)
-.47 .03 Significant .62*
Design -.47 .01 Significant .62*
Philosophy .05 .01 Significant 1.06
Full Year(vs Part Year)
.35 .02 Significant 1.41
Professional -.48 .02 Significant .62*
Committment(vs Otherwise)
Full Time Staff(vs Part-Time)
-.03 .02 NS .97
Retention Training(vs Otherwise)
-.34 .02 Significant .71
Services IntegrationMedium .13 .02 Significant 1.14
High(vs Low)
-.58 .02 Significant .56*
OutreachLow .02 .02 NS 1.02
High(vs Medium)
1.02 .01 Significant 2.78**
CostLow -1.97 .05 Significant .14*
High(vs Medium)
1.60 .02 Significant 4.96**
Type of CommunityCity 2.01 .05 Significant 749**
Large Metro 1.52 .03 SignificantSmall Metro(vs Nonmetro)
1.31 .02 Significant 3.72**
D-10 80

APPENDIX E
Logistic Regression Summary TablesPersistence Models

Logistic Regression Summary TablesPersistence Models
Logistic regression was used to develop explanatory models of sustainedpersistence for clients in the ESL, ABE, and ASE instructional components. Thesemodels included only clients with 12 or more hours of instruction. Exhibit E1.0summarizes the predictive efficacy of the three models based on two indicators:the discrimination index and predictive accuracy.
The extent to which the models distinguish between persisters (fourthquartile members) and nonpersisters (members of quartiles 1-3) is measured bythe discrimination index. This summary statistic can range from zero (chancelevel discriinination) to 1.00 (perfectly reliable discritnination) and indicates howmuch (in percentage terms) our predictive capability is improved using themodels over what could be expected by chance alone. The discriminatory powerof the models is moderate. Per5isters can be distinguished from nonpersistersmost accurately among ESL students (d = .48) and least accurately. among ASEstudents (d = .41).
The accuracy of the models in predicting persistence is measured by theproportion of cases predicted by the model to be persisters who were in factobserved to be members of the fourth attendance quartile. The PersistenceModels ranged from 62-66 percent in correctly predicting persisters with the ESLand ABE models being somewhat more accurate than the ASE model.
Exhibit E1.0Predictive Efficacy of Persistence Models
PlacementLevel
PredictiveAccuracy
DiscriminationIndex
UnweightedSample Size
ESL .65 .48 N = 2197
ABE .66 .45 N = 1974
ASE .62 .41 N = 2435
The remainirtg exhibits in Appendix E are divided into four sets, each of whichsummarizes the logistic regression results by placement level with respect to a class ofindependent variables (personal, motivational, programmatic, and instructionalcharacteristics). In the ESL model, the independent variable measuring type ofcommunity in which a project is located was deleted because it is highly correlatedwith other project-related characteristics such as program size and cost. In addition,the single best measure of educational background was used as a predictor ofpersistence in each model (either years of school completed or highest degree
E-3
82

achieved) because these two variables tend to be substantially correlated with eachother. The choice of the educational background predictor was based on which of thetwo indicators correlated the highest with the outcome of interest (i.e., membership inthe persister group).
The k ,1t regression models which follow summarize the contribution of eachindependent variable to the prediction of being a persister. Each table displays theregression coefficient, the standard error of the regression coefficient, whether thecoefficient is statistically significant or not (NS), and the odds ratio (the antilog of thecoefficient). The odds ratio provides the easiest measure of the contribution of eachindependent variable to the prediction of persistence, controlling for all otherpredictors in the model. An odds ratio close to 1.00 indicates that a predictor haslittle or no influence on persistence, and the regression coefficient should beapproximately zero for such a predictor. As the odds ratio increases from 1, thechances of beilig a persister are increased by the characteristic in question; similarly,odds ratios less than 1 indicate that the characteristic decreases the likelihood of beinga persister.
The amount by which the odds of being a persister are increased by acharacteristic can be seen directly in odds ratios greater than one. In Exhibit E2.1, forexample, the odds ratio for Asians is 1.33; this means that Asians are 33% more likelyto be persisters in the ESL Program than are Hispanics. The amount by which theodds of being a persister are decreased by a characteristic requires an elementarycalculation, as follows: for odds ratios less than one, simply subtract the odds ratio inquestion from one. Using the data in Exhibit E2.1, it can be estimated that White ESLclients are 22% less likely than Hispanics to be persisters (.78 1 = -.22).
Note that for predictors originally measured on a nominal scale (e.g., categoriessuch as Race), a reference group is used and this is always the dominant subgrouprelative to ESL, ABE, or ASE placement. For statistical reasons, the reference groupmust be omitted from the analysis in each model, but its effect on persistence can becalculated as the reciprocal of the odds ratio for each of the target variables in itsgroup. For example, Hispanic is the reference group for Race in the ESL modelwhereas White is the reference group for Race in the ABE and ASE models. In ExhibitE2.1, it can be seen that Hispanics are 25% less likely to be persisters in the ESLprogram compared to Asians because the odds of persisting for Hispanics relative toAsians is .75 (i.e., 1/1.33 = .75; .75 - 1.00 = -.25).
It should be kept in mind that statistical significance does not necessarilyindicate a meaningful relationship, particularly when relatively large samples areused (as in the present case). Therefore, we have used a double asterisk to indicatesubstantial predictors of persistence, defined as increasing the odds of fourth quartilemembership by 50% or more; this is an odds ratio of 1.5 or greater. Conversely, asingle asterisk identifies substantial predictors of nonpersistence; this is an odds ratioof .67 or lower (computed as the reciprocal of an odds ratio of 1.5). The designationof a predictor as substantial also takes the standard error of estimate into account,computed to the 95% ccnfidence level (or plus and minus two standard errors).
E-4
8 3

Exhibit E2.1ESL Persistence as Predicted by Client Personal Characteristics
Substantially Less Likely to be a Persister *Substantially More Likely to be a Persister **
LogisticRegressionCoefficient
StandardError (SE)
StatisdcalSignificance
(p < .01)
Odds of 4thQuartile
Membership
Age16-21 Years Old3145 Years Old46 and Older(vs 22-30 Years Old)
-.05.01.33
.02
.02
.02
SignificantNS
Significant
.951.011.39
Male(vs Female)
-.02 .01 NS .98
Race/Ethnicity .
American Indian' -7.22 1.51 Significant --Asian/Pacific Islander .29 .02 Significant 1.33Black non-Hispanic .35 .04 Significant 1.42**White non-Hispanic(vs Hispanic)
-.25 .03 Significant .78
EducationHigh School Graduate -.09 .01 Significant .91Post Secondary Grad(vs No Degree)
-.30 .02 Significant .74
Married(vs Otherwise)
-.12 .01 Significant .88
Resided Last 5 yrsSame County(vs Otherwise)
-.20 .02 Significant .82
Employed(vs Otherwise)
-.20 .01 Significant .82
Welfare Recipient(vs Otherwise)
.24 .02 Significant 1.27
The large SE term suggests that the regression coefficient for ESL American Indian clients ishighly unstable and unreliable as a predictor of persistence, probably because of sample size problems.Inspection of the unweighted cell frequencies confirms this suspicion: a sample size of 22 AmericanIndians with a frequency of zero for membership in the Persister group.
E-5
8 4

Exhibit E2.2ABE Persistence as Predicted by Client Personal Characteristics
,
Substantially Less Likely to be a Persister *Substantially More Likely to be a Persister **
LogisticRegressionCoefficient
StandardError (SE)
StatisticalSignificance
(p < .01)
Odds of 4thQuartile
Membership
Age22-30 Years Old .16 .02 Significant 1.1731-45 Years Old .37 .02 Significant 1.45**
46 and Older(vs 16-21 Years Old)
1 19 .03 Significant 3.29**
Male(vs Female)
-.15 .02 Significant .86
RacelEtimicityAmerican Indian -.73 .06 Significant .48*
Asian/Pacific Islander .49 .06 Significant 1.64**
Black non-Hispanic .21 .02 Significant 1.23
Hispanic(vs White non-Hispanic)
.56 .03 Significant 1.75**
Edr _ationYears School Completed -.14 .01 Significant .88
Married(vs Otherwise)
-.22 .02 Significant .80
Resided Last 5 yearsSame County(vs Otherwise)
.37 .02 Significant 1.44**
Employed(vs Otherwise)
-.03 .02 NS .97
Welfare Recipient(vs Otherwise)
.13 .02 Sign 'leant 1.13

Exhibit E2.3ASE Persistence as Predicted by Client Personal Characteristics
Substantially Less Likely to be a Persister *Substantially More Likely to be a Persister **
LogisticRegressionCoefficient
StandardError (SE)
StatisticalSignificance
(p < .01)
Odds of 4thQuartile
Membership
Age22-30 Years Old -.24 .02 Significant .7931-45 Years Old -.04 .02 NS .9646 and Older(vs 16-21 Yoars Old)
-.09 .03 Significant .92
Male(vs Female)
-.10 .01 Significant .91
Race/EthnicityAmerican Indian -.43 .04 Significant .65*Asian/Pacific Islander .94 .04 Significant 2.55**Black non-Hispanic -.12 .02 Significant .89Hispanic(vs White non-Hispanic)
-.43 .03 Significant .65*
EducationHigh School Graduate -.09 .02 Significant .92Post Secondary Grad(vs No Degree)
-.01 .04 NS .99
Married(vs Otherwise)
.22 .02 Significant 1.24
Resided Last 5 yearsSame County(vs Otherwise)
.00 .02 NS 1.00
Employed(vs Otherwise)
.06 .01 Significant 1.06
Welfare Recipient(vs Otherwise)
.16 .02 Significant 1.18

Exhibit E3.1ESL Persistence as Predicted by Client Motivational Characteristics
Substantially Less Likely to be a Persister *
Substantially More Likely to be a Persister **
LogisticRegressionCoefficient
StandardError (SE)
StatisticalSignificance
(p < .01)
Odds of 4thQuartile
Membership
Required(vs Otherwise)
-.10 .02 Significant .91
Self-Concept -.05 .02 NS .95
Literacy .28 .03 Significant 1.32
Basic Skills .08 .01 Significant 1.08
Employability .17 .02 Significant .84
Exhibit E3.2ABE Persistence as Predicted by Client Motivational Characteristics
Substantially Less Likely to be a Persister *
Substantially More Likely to be a Persister **
LogisticRegressionCoefficient
StandardError (SE)
StatisticalSignificance
(p < .01)
Odds of 4thQuartile
Membership
Required(vs Otherwise)
.32 .02 Significant 1.38
Self-Concept .13 .02 Significant 1.14
Literacy .29 .02 Significant 1.33
Basic Skills -.10 .02 Significant .90
Employability -.14 .02 Significant .87
E-8
8 7

Exhibit E3.3ASE Persistence as Predicted by Client Motivational Characteristics
Substantially Less Likely to be a Persister *
Substantially More Likely to be a Persister **
LogisticRegressionCoefficient
StandardError (SE)
StatisticalSignificance
(p < .01)
Odds of 4thQuartile
Membership
Required(vs Otherwise) .32 .02 Significant 1.38
Self-Concept -.22 .02 Significant .80
Literacy .23 .01 Significant 1.26
Basic Skills .15 .02 Significant 1.17
Employability .01 .02 NS 1.01

Exhibit E4.1ESL Persistence as Predicted by Program Structural Characteristics
Substantially Less Likely to be a Persister *Substantially More Likely to be a Persister **
LogisticRegressionCoefficient
StandardError (SE)
StatisticalSignificance
(p < .01)
Odds of 4thQuartile
Membership
SizeSmall -.72 .10 Significant 49*
Medium2 -5.63 .59 Significant --Large(vs Very Large)
.11 .03 Significant 1.12
SponsorshipCollege .44 .03 Significant 1.55**
PVO/TI(vs LEAs)
.04 .11 NS 1.04
Design -.12 .01 Significant .89
Philosophy -.11 .02 Significant .90
Support Services(vs Otherwise) .87 .02 Significant 2.39**
Professional .68 .04 Significant 1.96**
Committment(vs Otherwise)
Full Time Staff(vs Part-Time)
.89 .03 Significant 2.44**
Retention Training(vs Otherwise) -.09 .03 Significant .91
Services IntegrationLowMedium .45 .04 Significant 1.57**
(vs High) .12 .03 Significant 1.13
OutreachLow -.16 .03 Significant .86
High(vs Medium)
-.08 .03 Significant .93
CostLow .22 .02 Significant 1.25
High(vs Medium)
-.26 .04 Significant .77
Full Year(vs Part Year)
-.29 .04 Significant .75
2 The large SE term suggests an unstable predictor, probably due to sample size problems.Inspection of the unweighted cell frequencies confirms this suspicion: a sample of 239 ESL clientsenrolled in medium-sized projects with a frequency of zero for membership in the Persister group.
E-108 9

Exhibit E4.2ABE Persistence as Predicted by Program Structural Characteristics
Substantially Less Likely to be a Persister *Substantially More Likely to be a Persister **
LogisticRegressionCoefficient
StandardError (SE)
StatisticalSignificance
(p < .01)
Odds of 4thQuartile
Membership
SizeSmall .43 .04 Significant 1.54**Medium -.13 .03 Significant .88Very Large(vs Large)
.18 .04 Significant 1.19
SponsorshipCollege -.01 .02 NS .99PV0/T1(vs LEAs)
.44 .04 Significant 1.56**
Design .39 .01 Significant 1 47**
Philosophy -.34 .01 Significant .71
Support Services(vs Otherwise).
.71 .02 Significant 2.03**
Professional .20 .02 Significant 1.22Committment(vs Otherwise)
Full Time Staff(vs Part-Time)
.33 .02 Significant 1.39
Retention Training(vs Otherwise)
.26 .02 Significant 1.30
Services IntegrationLowMedium -.49 .03 Significant .61*(vs High) .18 .02 Significant 1.19
Outreach1Low .22 .02 Significant 1.25
High(vs Medium)
.25 .02 Significant 1.29
CostLow .13 .03 Significant 1.14High(vs Medium)
-.59 .02 Significant .56*
E-11
9 0

Substantially Less Likely to be a Persister *Substantially More Likely to be a Persister **
LogisticRegressionCoefficient
StandardError (SE)
StatisticalSignificance
(p < .01)
Odds of 4thQuartile
Membership
Full Year(vs Part Year)
-.18 .02 Significant .83
Community TypeCityLarge MetroSmall Metro(vs Nonmetro)
-.24-.11-.16
.05
.03.03
SignificantSignificantSignificant
.79
.89.86

Exhibit E4.3ASE Persistence as Predicted by Program Structural Characteristics
Substantially Less Likely to be a Persister *Substantially More Likely to be a Persister **
LogisticRegressionCoefficient
StandardError (SE)
StatisticalSignificance
(p < .01)
Odds of 4thQuartile
Membership
SizeSmall -.07 .03 Significant .93Medium -.81 .03 . Significant .44*Very Large(vs Large)
-.56 .02 Significant .57*
SponsorshipCollege .27 .03 Significant 1.31PVO/TI(vs LEAs)
.19 .03 Significant 1.21
Design .19 .01 Significant 1.21
Philosophy -.44 .01 Significant .64*
Support Services(vs Otherwise)
.63 .01 Significant 1.88**
Professional -.25 .02 Significant .78Committment(vs Otherwise)
Full Time Staff.(vs Part-Time)
.61 .02 Significant 1.85**
Retention Training(vs Otherwise) -.09 .02 Significant .91
Services IntegrationMediumHigh -.36 .02 Significant .70*(vs Low) .14 .02 Significant 1.15
OutreachLow -.13 .02 Significant .88High(vs Medium)
-.23 .02 Significant .80
CostLow .58 .03 Significant 1.79**High(vs Medium)
-.30 .02 Significant .74
E-13
9 2

Substantially Less Likely to be a Persister *Substantially More Likely to be a Persister **
LogisticRegressionCoefficient
StandardError (SE)
StatisticalSignificance
(p < .01)
Odds of 4thQuartile
Membership
Full Year(vs Part Year)
-.29 .02 Significant .75
Community TypeCityLarge MetroSmall Metro(vs Nonmetro)
.741.04
.15
.05
.03
.02
SignificantSignificantSignificant
2.09**2.84**1.16
Exhibit E5.1ESL Persistence as Predicted by Program Instructional Characteristics
Substantially Less Likely to be a Persister *Substantially More Likely to be a Persister **
LogisticRegressionCoefficient
StandardError (SE)
StatisticalSignificance
(p < .01)
Odds of 4thQuartile
Membership
Time of InstructionNight Only -1.23 .02 Significant .29*
Day & Night(vs Day Only)
.61 .01 Significant 1.84**
Learning EnvironmentLab 1.13 .01 Significant 3.11**
Independent Study(vs Teacher & Aide)
.96 .04 Significant 2.60**
Class Size1-10 Students -2.10 .07 Significant .12*
11-20 Students -1.76 .03 Significant .17*
21-30 Students(vs 31 or More Students)
-1.03 .02 Significant .36*

Exhibit E5.2ABE Persistence as Predicted by Program Instructional Characteristics
Substantially Less Likely to be a Persister *
Substantially More Likely to be a Persister **
LogisticRegressionCoefficient
StandardError (SE)
StatisticalSignificance
(p < .01)
Odds of 4thQuartile
Membership
Time of InstructionNight Only -1.12 .02 Significant 33*
Day & Night(vs Day Only)
-.21 .02 Significant .81
Learning EnvironmentLab -.05 .02 Significant .95Lndependent Study(vs Teacher & Aide)
-.44 .03 Significant .64*
Class Size1-10 Students -.91 .02 Significant 40*
21-30 Students -.14 .02 Significant .8731 or More Students(vs 11-20 Students)
.91 .03 Significant 2.49**

Exhibit E5.3ASE Persistence as Predicted by Program Instructional Characteristics
Substantially Less Likely to be a Persister *Substantially More Likely to be a Persister **
LogisticRegressionCoefficient
StandardError (SE)
StatisticalSignificance
(p < .01)
Odds of 4thQuartile
Membership
Time of InstructionDay Only .46 .02 Significant 1.59**
DaS7 & Night(vs Night Only)
.76 .02 Significant 2.14**
Learning EnvironmentLab .62 .02 Significant 1.85**
Independent Study(vs Teacher & Aide)
.26 .02 Significant 1.30
Class Size1-10 Students -.19 .02 Significant .82
21-30 Students .09 .02 Significant 1.09
31 or More Students(vs 11-20 Students)
.23 .02 Significant 1.26

APPENDIX FEstimation of a Point-In-Time Count of Active Clients

Estimation of a Point-In-Time Count of Active Clients
To determine the active population for any time frame, we must decompose thepopulation into those already attending, and those entering for the first time. Inexhibit F.1 we present a simplified method of estimating the number of clients activeat the time the National Evaluation began by using the average number of intakes inany month (168,024), and the average percent of students remaining active after xmonths. For example, on average, 64 percent of all intakes remain active into theirthird month. This translates into 92,520 clients who initially enrolled two monthsearlier and were still active in the month in which the study began. We obtained 18months of attendance data and extrapolate for the next 18 months. This provides uswith an estimate of the number of clients in attendance who had begun adulteducation in the previous three years. Stimming across all months yields theapproximate number of clients in attendance at a point in time. When the number ofclients already in attendance is added to the number of clients who entered duringthe study year (2,016,288) the result (2,877,799) is the an estimate of the number ofclients served in one year. While this process is parsimonious and roughly accurate,it does not correct for seasonal variations in intake and persistence.
F-3
9 7

Exhibit F.1Estimation of number of active clients at beginning of study
Months From Intake Pct Remaining Clients Still Enrolled
0 100 168,024
1 80 115,162
2 64 92,520
3 55 78,259
4 45 64,037
5 40 56,855
6 35 50,411
7 31 44,670
8 29 41,435
9 26 36,884
10 23 33,473
11 21 30,261
12 20 28,024
13 17 25,064
14 16 23,034
15 12 16,818
16 10 14,770
17 9 12,872
18 8 11,654
19 6 9,269
20 6 8,608
21 5 7,174
22 5 7,174
23 5 7,174
24 4 5,739
25 4 5,739
26 4 5,730
27 3 4,304
28 3 4,304
29 3 4,304
30 2 2,869
31 2 2,869
32 2 2,869
33 2 2,869
34 1 1,435
35 1 1,435
36 1 1,435
Total continuing students 861,511
Note: Extrapolations are shaded. Months 0-18 are based on average percent of clients remaining after x months ofinstruction.
F-4
98

Index
ABE i, ii, iii, 5, 8-10, 12-14, 16, 19, 22, 25, 26, 28, 29, 32, 33, 35, 37, 38, 41, 43,44, 45, 46, A-3, C-8, D-3, D-4, D-6, D-9, E-3, E4, E-6, E-8, E-11,E-15
Alaskan native 34American Indian 34, E-5ASE 5, 8-10, 12-14, 17, 19, 23-26, 28, 29, 32, 33, 35, 38, 41, 43-46, A-3,
C-8, D-3, D-4, D-7, D-10, E-3, E-4, E-7, E-9, E-13, E-16Asian 34, 38, 44, C-11, D-5, D-6, D-7, E-5, E-6, E-7Attrition ii, viii, 10, 13, 26, 29, 30, 40, A-3CASAS 2Census region 11, 12, C-5, C-6Client Intake 2-4, A-3Client Update 3, 18, 35-37Community 35, 39, 46, C-7, D-3, D-9, D-10, E-3, E-12, E-14Curriculum 36, 37, 36, 37, 44Discontinuity 24-26, 29Early leavers viii, 33, 40, A-3Educational attainment 34, C-9, C-10Enrollment i, viii, 1, 3-5, 7-13, 18, 20-24, 29, 34, 35, 38-41, 44, 46ESL i, ii, iii, 5, 8-15, 19, 21, 25, 26, 28, 29, 32, 33, 35, 38, 41, 43-46, A-3, C-8,
D-3, D-4, D-5, D-8, E-3, E-4, E-5, E-8, E-10, E-14federal Adult Education Program 26, 27Hispanic 34, 38, 44, C-11, D-4, D-5, D-6, D-7, E-4, E-5, E-6, E-7Instructional component 11, 12, 25, 26, 32, 41-45, 47Instructional philosophy 36Integration of services 35, 38, 45Language ii, 5LEA D-10Motivation 27, 44Pacific Islander 34Persistence i, ii, iii, v, viii, 1, 7, 8, 10-12, 19-23, 27, 30, 32, 42, 44-47, A-3, E-1,
E-3, E-4, E-5, E-6, E-7, E-8, E-9, E-10, E-11, E-13, E-14, E-15,E-16, F-3
Persisters ii, 19, 43, E-3, E-4Prior education 44Program component 10, 33, A-3Program placement C-8Public assistance 2Race 34, 44, C-3, C-11, D-4, D-5, D-6, D-7, E-4, E-5, E-6, E-7Region 11, 12, C-5, C-6Time of entry 2, 3, 14-17Welfare 27, 34, 44, E-5, E-6, E-7
Index-i
9 9