document resume ed 103 353 teacher 2ducation … · title teacher 2ducation center self study: a...
TRANSCRIPT

DOCUMENT RESUME
ED 103 353 SP 008 958
TITLE Teacher 2ducation Center Self Study: A PreliminaryReport of, and to, the Partners.
INSTITUTION Maryland Univ., College Park. Coll. of Education.PUB DATE Jan 75NOTE 74p.
EDRS PRICE MF-$0.76 HC-$3.32 PLUS POSTAGEDESCRIPTORS *College School Cooperation; Evaluation; Inservice
Teacher Education; Practicum Supervision; PreserviceEducation; Surveys; *Teacher Centers; TeachingSkills
ABSTRACTThis study was undertaken by the participating school
systems and the University of Maryland to systematically examine the14 teacher education centers which have bees, in operation since themid-19601s. The questions investigated were the following: (a) Inwhat preparatory experiences are student teachers engaged? (b) Doexperienced teachers provide and review experiences for studentteachers based on competencies acquired in inservice instruction? (c)What is the variation observed in available inservice content andsources of information among experienced teachers? (d) Who holdsconferences vith student .:'eachers? (e) Does the perceived process ofsupervisory encounters vary between providers and recipients? (f)What are the differences in levels of concerns for pupils, teacherrole, and work situation among various education personnel? Somedifferences between centers and noncenters were found, raising thequestions of what effects the differences have on the career of aprofessional. The document is divided into six chapters. The firstdescribes the study, and the following discuss preservice experienceprovided, inservice patterns, supervisory patterns, and levels ofprofessional concerns. The last chapter consists of a summary,suggestions, and reflections. A reader response letter is included,together with a sample letter to participants and a sample survey.(PB)

I rN
'e4
H. THE SEVEN SCHOOL SYSTEM
AND UNIVERSITY OF MARYLAND
TEACHER EDUCATION CENTER
SELF STUDY'
A PRELIMINARY REPORT OF, AND TO,
THE PARTNERSU.S DEPARTMENT Or HEALTH,
EDUCATION A WELFARENATIONAL INSTITUTE Or
ED'ICATIONMS DOCUMENT HAS BEEN REPRODUCEO EXACTLY AS RECEIVED PROMTHE PERSON OR ORGANUATION ORIGINATING IT POINTS OP VIEW OR OPINIONSSTATED DO NOT NECESSARL.Y REPRESENT Ot,iciAL NATIONAL INSTITUTE OPEDUCATION POSITION OR POLICY
'/tt C' UNIVERSITY OF MARYLAND. ,.,N.
.COLLEGE PARK
COLLEGE OF EDUCATION.,,
OFFICE OF LABORATORY EXPERIENCES
Y e , . .
e -.1 ,
JANUARY, 181 5

To:
Further Studies and Students of Teaching,
Who Actively Inquire into Practice.
J.P.R.
H.H.W. Jr.
.trrata forTEACHER EDUCATION CENTER SELF STUDY
Page Line
i
'iv6
7
8
11
1111
12121213
1313
2426304951
56
00°
15 beginning13 conferencing process26 mode.
5 mean2 responding
15 all pe.0527 3v5,729 675
a variables20 vertically
seven variables2 10,14
11
12 1)103 coefficients7 12
34 Uliberation31 holds40 behavior of the graduates
of the38 370-390.
Appendix 8 should be read page 60, 63, 61 and 52.Do accept our regrets.
PREFACE
The pioneering effort of the College of Education and the several school systems in the state
of Maryland in establishing teacher education centers won the critical acclaim and national
recognition of the American Association of Colleges of Teacher Education in 1968. Since that time
teacher education centers have assumed more varied and extensive responsibility in the total preparation
of student teachers; have provided a variety of inservice training experiences for the regular teaching
staff of the centers; promoted many opportunitiea for curriculum development and experimentation; and
provided a setting for expanding and diversifying field research.
Although most of the University professional staff involved with the centers felt that the
centers were exciting places for training, program development, and research, a systematic and com-
prehensive assessment effort was necessary to evaluate actual productivity and effectiveness. With
the active cooperation of the school systems, the University conducted such an assessment. The
results of this study are reported in this document.
From the standpoint of the University, centers have fulfilled and exceeded their promise.
In the future, new strategies and arrangements for the preservice training of students will be de-
veloped involving comprehensive field-based programs beinning in the freshman year with increasing .
portions of the actual instruction in professional programs moving frem the campus to the centers. I
envision the possibility that the faculty of the centers will not only be able to add continuously to
their professional skills and understandings, but ultimately will be able to complete significant
portions, if not entire University graduate degree programs under center auspices. In the not too
distant future, the University professor 4nd center faculty member will constitute working teams to
examine and develop new and more responsive curriculum designs. Together, broad areas of educational
research will be more widely and effe.tively undertaken through the concerted efforts of such
0
University/center teams.
In all of this, tb teacher education centers will truly become centers for renewal for faculty
and students of both the University and the public school system. The concepts inherent in the
philosophy and operation of the centers have done and will do much to enhance the vitality and
meaning of our profession and our role as professional educators.
George J. Rifler°, Provost
Division of Human and Community ResourcesUniversity of Maryland, College Park
The teacher education center program, sponsored jointly by the University of Maryland and
participating local education systems, represents a positive step forward in a cooperative effort
to improve both the preservice and inservice education of teachers. Student teachers participating in
a center program have the opportunity to obtain a broader experience than do those in a more traditional
program. Through working with more than one cooperating teacher, they have more than one model to
observe. Through seminars held with the center coordinator they are able to exchange ideas with other
student teachers and to better relate theory and the classroom experience.
Though there is a continual need to evaluate and improve the teacher education center program,
evidenced by this jointly executed self study, it has proven its value to both the student teacher
program and to the participating schools. By providing broader and better preservice programs for
BEST COPY AVAILABLE
students, the school systems obtain beginning teaeers better prepared to assume their role in the
instructional process. Consultants made available through the center program provide schools with the
on-going assistance relating to curricular needs. An additional benefit to both the public schools
and the University has been the development of a closer working relationship between the two. This
should lead to the strengthening of both.
Needless to say, the teacher education program calls for leaders in both institutions who
recognize that the interests of both the University and the public school system are best served
through such cooperative efforts and that such programs must meet identified needs of both par-
ticipants. Such has been the case in the past and must continue in th' suture to assure the success
the program des.rves.
John Soles, Assistant DirectorCurriculumHoward County Public School SystemColumbia, Maryland
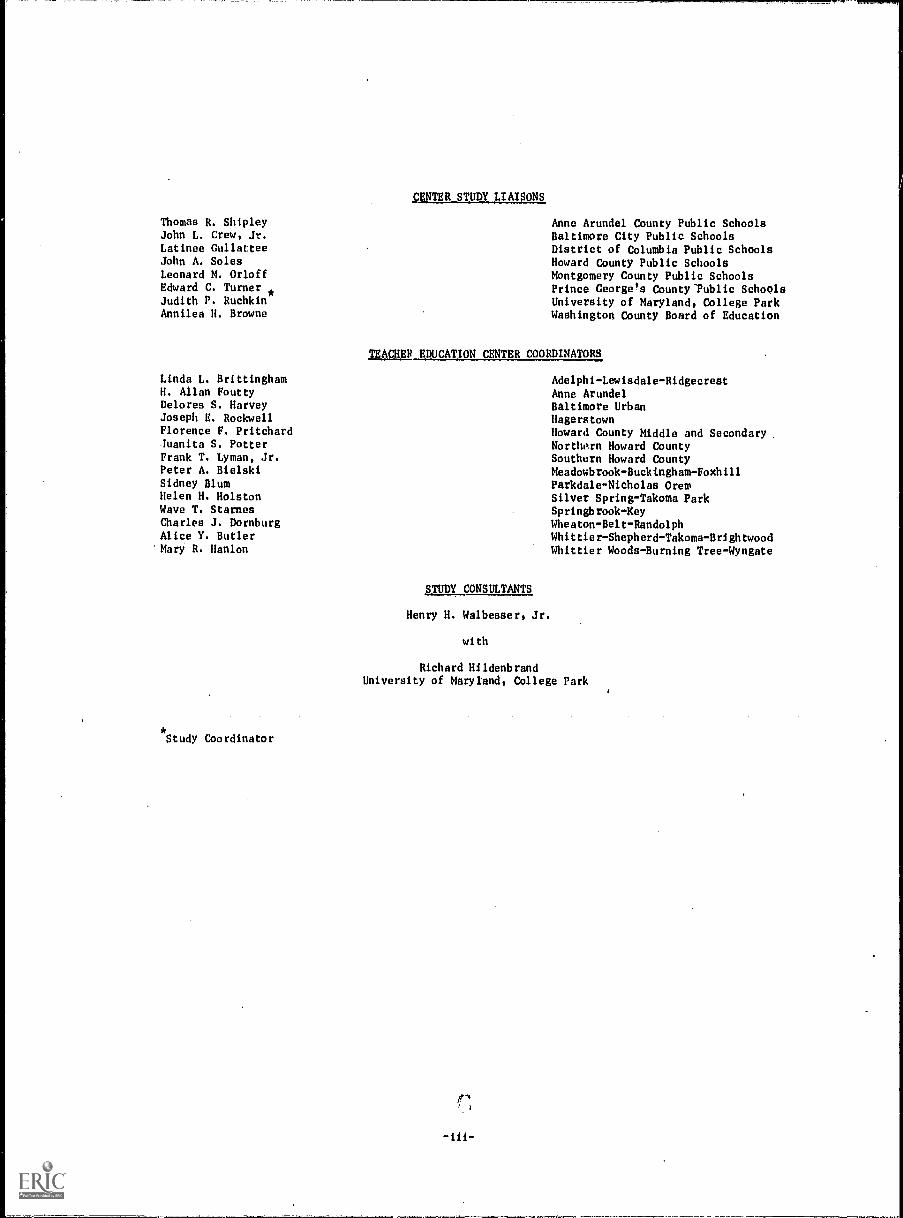
Thomas R. ShipleyJohn L. Crew, Jr.Latinee GullatteeJohn A. SolesLeonard M. OrloffEdward C. TurnerJudith P. RuchkinAnnilea H. Browne
Linda L. BrittinghamH. Allan FouttyDelores S. HarveyJoseph E. RockwellFlorence F. PritchardJuanita S. PotterFrank T. Lyman, Jr.Peter A. BielskiSidney BlumHelen H. HolstonWave T. StarnesCharles J. DornburgAlice Y. Butler
'Mary R. Hanlon
Study Coordinator
SUTER STUDY LIAISONS
Anne Arundel County Public SchoolsBaltimore City Public SchoolsDistrict of Columbia Public SchoolsHoward County Public SchoolsMontgomery County Public SchoolsPrince George's County-Public SchoolsUniversity of Maryland, College ParkWashington County Board of Education
TEACHER EDUCATION CENTER COORDINATORS
Adelphi-Lewisdale-RidgecrestAnne ArundelBaltimore UrbanHagerstown
Howard County Middle and SecondaryNorthern Howard CountySouthern Howard CountyMeadowbrook-Buckingham-FoxhillParkdale-Nicholas OremSilver Spring-Takoma ParkSpringbrook-KeyWheaton-Belt-RandolphWhittier-Shepherd-Takoma-BrightwoodWhittier Woods-Burning Tree-Wyngate
STUDY CONSULTANTS
Henry H. Walbesser, Jr.
with
Richard HildenbrandUniversity of Maryland, College Park

TABLE. OF CONTENTS
PREFACE
CENTER STUDY LIAISONS, COORDINATORS AND CONSULTANTS
Page
i
iii
TABLE OF CONTENTS iv
TABLE OF TABLES
TABLE OF FIGURES vi
CHAPTER i - DESCRIBING THE STUDY
CHAPTER II - PRESERVICE EXPERIENCES PROVIDED 6
SECTION ONE: TRAINING PRACTICESSECTION TWO: INSTRUCTIONAL EXPERIENCES
CHAPTER III - INSERVICE PATTERNS
CHAPTER IV - SUPERVISORY PATTERNSSECTIO ONE: CONFERENCING AVAILABLESECTICN TWO CONFERENCING QUALITY
26
33
CHAPTER V - LEVELS OF PROFESSIONAL CONCERNS 40
CHAPTER VI - SUMMARY, SUGGESTIONS AND REFLECTIONS 49
READER RESPONSE SHEET 58
APPENDIX A - SAMPLE LETTER TO PARTICIPANTS 59
APPENDIX B - SAMPLE SURVEY 60
-iv-

Table
1.
2.
TABLE OF TABLES
Significant Differences in Observation, Teachingand Related Options by Items and Audience
Similarities in Observation, Teaching and
Related Options by Items and Audience
3. Differences in Observations, Teaching andRelated Options by Item, atm Levels
4. Similarities in Observation, Teaching andRelated Options by Items and Audience
5. Significant Differences in Observation, Teaching and OtherPreparatory Options by Variables and School Systems
6. Significant Differences in Observation, Teaching and OtherPreparatory Options by Variables and Individual Center Sites
7. Significant Differences in Observation, Teaching and OtherPreparatory Options by Variables, Groups and Environments
8. Significant Differences in Observation, Teaching and OtherPreparatory Options by Variables, Groups and Environments
Page
6
8
9
10
11
13
14
15
9. Observation, Teaching and Related Preparatory Options byVariable and Setting Indicating Statistically SignificantDifferences 17
10. Percentage of Audience Reporting Experience by Item 18
11. Claimed Preservice Instructional Experiences by VariableClusters and Audiences (Center and Noncenter Student Teachers) 19
12. Claimed Preservice Instructional Experiences by VariableClusters and Audiences (Center Student Teachers andEarly Studerts) 20
13. Claimed Preservice Instructional Experiences by VariableCluster; and Audiences (Noncenter Student Teachers andEarly students) 20
14. Claimed Preservice Instructional Experiences by VariableClusters and Audiences (Center and Noncenter Early Students) 20
15. Statistically Significant Instructional Experiences VariableClusters by Random Samples of Audience Groups
16. Claimed Preservice Training Process Dimensions
17. Statistically Significant Instructional Variable Clustersby Random Samples of Audience Groups
18. Rank Order Correlations of Experiences Claimed
19. Identical Pre and Inservice Experiences as Reported by98 Coor:ating/Supervising Teachers in Centers
20. Identical Pre and Inservice Experiences as Reported by49 Elementary Cooperatin2 Teachers in Centers
21. Identical Pre and Inservice Experiences as Reported by49 Secondary Cooperating Teachers in Centers
22. Percentages of Instructional Leaders in Centers Compared toInstructional Leaders in Noncenters Reporting InserviceInstruction Received by Their Staff Displayed by Topicand Selected Source of instruction
23. Percentages of Instructional Leaders in Centers ReportingInservice instruction Received by Their Staff Compared toPercentages of Cooperating Teachers in Centers ReportingInservice instruction Received Displayed by Topic andSource of Instruction
Table of Tables Continued
21
22
23
24
26
27
27
29
31

Table of Tables, Continued BEST COPY AVAILABLE
Table Page
24. Percent of Elementary Cooperating Teachers in CentersReporting Inservice Instruction Received Compared toSecondary Cooperating Teachers in Centers by Four Topicsand Three Sources of Instruction 32
25. Number of Different Conference Sources Reported by RandomSamples of Student Teachers in Centers and Noncenters 33
26. 2 by 2 Contingency Table of Presence of a Conference byStudent Teaching Assignpent
27. 2 by 2 Contingency Table of Number of Personnel Involved in'a Conference by Student Teaching Assignment
34
34
28. Conference Source Comparisons for Student Teachersin Centers 35
29. Conference Sources for Student Teachers in Noncenters 35
30. 2 by 2 Contingency Table of Number of Personnel Involvedin a Conference by Elementary and Secondary Level WithinCenters 36
31. 2 by 2 Contingency Table of Number of Personnel Involvedin a Conference by Elementary and Secondary Level WithinNoncenters 36
32. Conference Source Comparisons for Student Teachers inElementary Center Assignments 36
33. Conference Source Comparisons for Student Teachers inSecondary Center Assignments 37
34. Supervisory Process Measure 39
35. Concerns Measure 40
36. An Analysis of the Four Measures of the Concerns Instrumentfor the Total Sample, Student Teaching Assignment, andInstructional Level 44
37. An Analysis of the Four Measures of the Concerns Instrumentfor Center-Noncenter, Elementary-Secondary, School Systems,and Centers by Each Population Sampled 45
TABLE OF FIGURES
Figure Page
1. Self Study Measures 4
2. Summary of Possibilities for Comparative, LongitudinalAssessment of Center and Noncenter Products by Typesand Levels of Outcome Measures 53
3. Conceptual Models of Teaching 57

CHAPTER I
DESCRIBING THE OTUDY
This partner-initiated inquiry into teacher education center practices began at a time when both
the participating school systems and the University of Maryland were pleased with this field activity.
Positive attitude toward the center concept among the school systems of the regions is reflected in
the continuing requests for more centers from areas presently without access to these services. The
increased number of inservice activities cooperatively planned by school system personnel and university
faculty together with the growing use of the centers for research and development activity give further
evidence of positive response toward the centers.
Definition of a Teacher Education Center: Centers, as defined by the seven cqllaborating school systems
and the University of Maryland, College Park (UMCP), are shared, school - college arrangements for further-
ing the continuous professional development of educational personnel. The center structure provides for
increased involvement of school personnel in preservice preparation and greater university participation
in inservice efforts. A full time staff member, who is a joint appointee of a school system and the
College of Education, coordinates activities In the field and is charged with meshing the available
material and personnel resources of the two institutions for maximal benefit of each center site.
Centers vary in membershipfrom two to four school constituents and some units may also have classroom
and/or departmental satellites.
Origin of !Ale Study: The impetus for this center study came from the partners themeelves, who seek to
improve their delivery of services in an era'callingfor greater attention to the utilization of resources.
While the school partners continue to have some need for highly skilled new recruits, they increas-
ingly face significantly expanded staff development needs as personnel stabilization becomes more and
more apparent. The university, as a knowledge producer and disseminator, is also subject'to the same
demographic shifts and must be ever careful in its expenditure of resources in order that its basic
societal mission may go forward. In this context, it should be clear nt the outset that the center
study is an internally motivated, sponsor-initated accountability effort. It was undertaken out of a
mutual desire to take a systematic look at the fourteen teacher education centers, which have been in
existence since the mid 1960's. This self - scrutiny is predicated upon a shared desire to know in some
detail what happens in the centers and to the people, who receive center services. This study repre-
sents an exercise of jointly, self-imposed, professional responsibility rather than the currently
common, externally mandated requirement by public sources that educators confront in many other states.
Organizing Rationale for the First Phase of the Study: Prior to engaging in the initial phase of the
center study, the sponsors explored a variety of possibilities for starting the process of evaluating
the centers.* Several different emphases and interests concerning process and product outcomes,
evidenced by pupils and/or teachers, were high on some partners' information seeking Agenda. Some
were most interested In classroom interaction, some wished to concentrate on pupil gains, while others
focuaed on levels of professionalism and other attitudes. However, before addressing such varied
*The counsel and recommendations rendered with the preliminary planning by Barak Rosenshine and
James Raths of the University of Illinois, Urbana, are still valued and hereby gratefully acknowledged.

_2-
questions, we first agreed to collect some preliminary, general observations about the specifics
of the center experience to be compared with the noncenter experience. This meant gathering a common
base of information for all the partners at the start and postponing the differing priorities of diff-
erent systems, and/or centers, for a subsequent phase.
It was decided that the first phase of the investigation would be to ascertain whether there are
differences between centers and noncenters. As full and comprehensive a look at field activities as
possible was called for by all the partners. Therefore, the initial stage of the study consists of
a systematic inquiry into preparatory training experiences, utilization of resources, supervisory
practices and professional concerns. The data concerning training practices, instructional experi-
ences. supervisory behaviors and levels of professional concerns span both cognitive and affective
dimensions. There was involvement and feedback from all the affected groups: pre-student teachers,
student teachers, cooperating/supervising teachers, university supervisors, principals, center co-
ordinators as well as a noncenter sample for the first five aforementioned groups. The questions for
the initial phase of the investigation are concerned with reliably observable external behaviors as
well as those less easily assessable internal behaviors associated with attitudes and judgmentL
Study Questions: The following are the six questions asked and investigated during the first phase
of the teacher education center self study:
1. In what preparatory experien.es are student teachers engaged?
2. Do experienced teachers provide and review experiences for student teachers based
on compr.ltencies acquired in inservice instruction?
3. What is the variation observed in availably inservice content and sources of information
among experienced teachers?
4. Who holds conferences with student teachers?
5. Does the perceived process of supervisory encounters vary between providers and
recipients?
h. What are the differences in levelq of concerns for pupils, teacher role and work
situation among various educational personnel?
Each of the six questions as well as the data gathered to answer each question focused upon
whether there are differences between center and noncenter program components.
Study Limitations and Benefits: This initial phase of the inquiry into center practice is conceived
as formative evaluation. The purpose of the study is to provide systematically gathered feedback to
sponsors concerning program progress and potential areas for adjustment. This preliminary
report is intended for internal consumption to enable the range of affected personnel to review and
to rethink center activities in Ugh: of current information and presently perceived institutional
priorities. The study may have external utility by pointing a way in which other school-college
partnerships, or inter-agency efforts, can undertake to inquire into their shared practices. Such
program probing is seen as beneficial to specific sponsors and more widely to the educational
community at large, where due to the increase in center programs similar questions of evaluation may
arise.
This study does not claim to answer questions of ultimate worth concerning the centers, Worth is
a matter of judgment not data. The ren kilts of this phase of the study are intended to provide a set
.1 .0

-3- BEST COPY AVAILABLE
of observations, upon which to base answers to the questions posed as well as providing a data pool
for future research. This is an attempt to see whether differences actually obtain, which logically
precedes any formal procedures seeking to identify the sources of observed variation. Tits detailed
description of the center treatment informs the partners about the nature of the practices found in
the centers and apprises all concerned of some of the alternative procedures that are being utilized
in these field settings. Such an obRrvation pool also provides a data base upon which to make
curricular and instructional decisions and to conduct further studies.
Design of the Study: During Spring 1973 early preservice students, student teachers, cooperating/
supervising teachers, center coordinators, principals and university supervisors were surveyed about
their perceptions of available pre and inservice instructional experiences including supervisory
practices and more personal,internal professional concerns. The study utilized "self-report" instru-
ments to identify differences in experiences, resources, supervisory behaviors found between centers
and noncenters, levels of schooling and, where possible, among school systems and individual center
sites. Although self-report data are ordinarily suspect, it is held here thct these program inventory
questions possess relatively low emotionality. Therefore, the responses received are likely to be
reliable and accurate. In addition, matched responses from different audiences also serve to enhance
response credibility.
All student teachers assigned to elementary and secondary level centers as well as two groups of
randomly selected noncenter student teachers were asked to complete one of three instruments: (a) the
experiences profile, (b) the supervisory orofile and (c) the teachers' concerns checklist. The
experiences instrument focused on both preservice and inservice practices which include the utiliza-
tion of personnel and material resources. (See Appendix B) Items for the experiences profile were
contributed by members of each of the school systems with teacher education centers as well as by
students and faculty at the University of Maryland, College Park. The total collection of contributed
items was collapsed and organized into a locally developed instrument by Dr. Henry U. Walbesser, Jr.
The supervisory profile is derived from the early 1960's work of Dr. Daniel Solomon,* now on the staff
of the Montgomery County (Maryland) Public Schools. The teachers' concerns checklist represents some
of the current efforts of Dr. Frances Fuller and her colleagues at the Research and Development Center
in Teacher Education at the University of Texas, Austin.
The study solicited information from eleven separate audiences: early preservice students in and
out of centers, student teac!es in and out of centers, cooperating/supervising teachers in and out of
centers, university supervisors working in and out of centers, principals of schools in and out of
centers, and center coordinators, Figure One summarizes the matching of populations with the three
self study measures. All students, cooperating teachers and supervisors also responded to a basic
observation, teaching and related preparatory options measure. Random assignment of instrument to
subjects was used. Each respondent received One instrument with a maximum of one hour administration
time. The survey occurred during the first week of May 1973 and resulted in 1226 returns from the
1312 participants. This constitutes a 932 return rate. However, data from 21 center and 26 noncenter
*Daniel Solomon, William Seadek and Larry Rosenberg "Dimensions of Teacher Behavior," The Journal ofExperimental Education 33 (No. 1): 23-40, Fall 1964, "Teacher Behavior and Student Learning
JalsitiorzJour:Pscholo, 55 (No. 1): 23-4964, and IgashingStvles and. Learning, Chicago: Centerfor the Study of Liberal Education for Adults, 1963, pp 28 -44.

SELF STUDY MEASURES
Audience
Experiences Profile
Fuller
Professional C,ncerns
Profile
Solomon, Bezdek, Rosenberg
Supervisory Profile
Student Teachers
in Center
One-third of available
audience
One-third of available
audience
One-third of available
audience
Student Teachers not
in Centers
Sample of comparable size
to the center student
teachers
Sample of comparable size
to the center student
teachers
Sample of comparable size
to the center student
teachers
Cooperating Teachers
in Centers
Cooperating teachers of
sampled center student
teachers
Cooperating teachers of
sampled center student
teachers
Cooperating teachers of
sampled center student
teachers
Cooperating Teachers
Not in Centers
Cooperating teachers
sampled noncenter
student teachers
Cooperating teachers of
sampled noncenter
student teachers
Cooperating teachers of
sampled noncenter
student teachers
University Supervisors
in Secondary Centers
University supervisors of
sampled center student
teachers
University supervisors of
sampled center student
teachers
University supervisors of
sampled center student
teachers
University Supervisors
Not in Centers
University supervisors of
sampled noncenter
student teachers
University supervisors of
sampled noncenter
student teachers
University supervisors of
sampled noncenter
student teachers
Center Coordinators
_Inservice Information
All coordinators
All coordinators
All coordinators
Principals in Centers
Inservice Information
All in center schools
All in center schools
Principals Not in Centers
Inservice Information
All with student teachers
in sample
Early Preservice Students
in Centers
Half of available audience
Half of available audience
Early Preservice Students
Not in Centers
Half of available audience
Half of available audience
FIGURE ONE
Instrument Administration Scheme

-5-
cooperating teachers were lost in the process of readyinia the responses for electronic data process-
ing, whit'. 'owers the overall return rate to 89% and accounts for certain missing cells in the experi-
ences tables.
Organizationof tie Report: Throughout the report d to summaries and discussion of findings are pre-
sented with attention to observed differences. Where commonalities obtain these are indicated subse-
quent to the observed differences. An exceedingly large number of potential comparisons are involved
in this study. It is possible to marahall the data for the eleven groups sorted by the four analytical
categories: (1) center-noncenter, (2) elementary and secondary level, both of which were relatively
simple as well as (3) the fourteen centers and (4) seven school systems, which become moat complex and
frequently only partially possible due to smallness of cell size. In these days of information overload
and in the interest of both reader and researcher sanity, for the most part only those findings are
presented which exhibit statistically significant differences..
The report begins by reflecting upon the observation, teaching and related preparatory options.
and preservice instructional experiences clusters.* These findings and narrative provide answers to the
first question. The succeeding chapters focus on inservice instruc..onal clusters, general supervisory
practices, conferencing behavior and levels of professional concern. These findings and narrative pro-
vide answers to questions two through six. In this report findings and interpretation are interwoven
by topical focus rather than being presented separately.
Those readers who wish direct access to the unanalyzed data will find it possible to pursue items
of particular interest. Tabulated frequencies of responses and currently completed data analyses are
available, upon request, by querying OLE*DATAPILE at the UMCP Computer Center.
This study was undertaken with the goal of deriving a systematic and detailed description of center
practice to serve as a basis for mutually designed and desired program adjustment. Beyond this local
purpose, the investigation meets the call from the educational community for the establishment of data
banks accessible to other workers seeking to compare results, or to engage in secondary analyses.
Therefore, an additional accomplishment of the study is the availability of this information bAse for
others interested in empirical findings in teacher education.
*The authors wish to acknowledge the support of the University of Maryland Computer Science Center forassistance in the data processing.
CHAPTER II
PRESERVICE EXPERIENCES PROVIDED
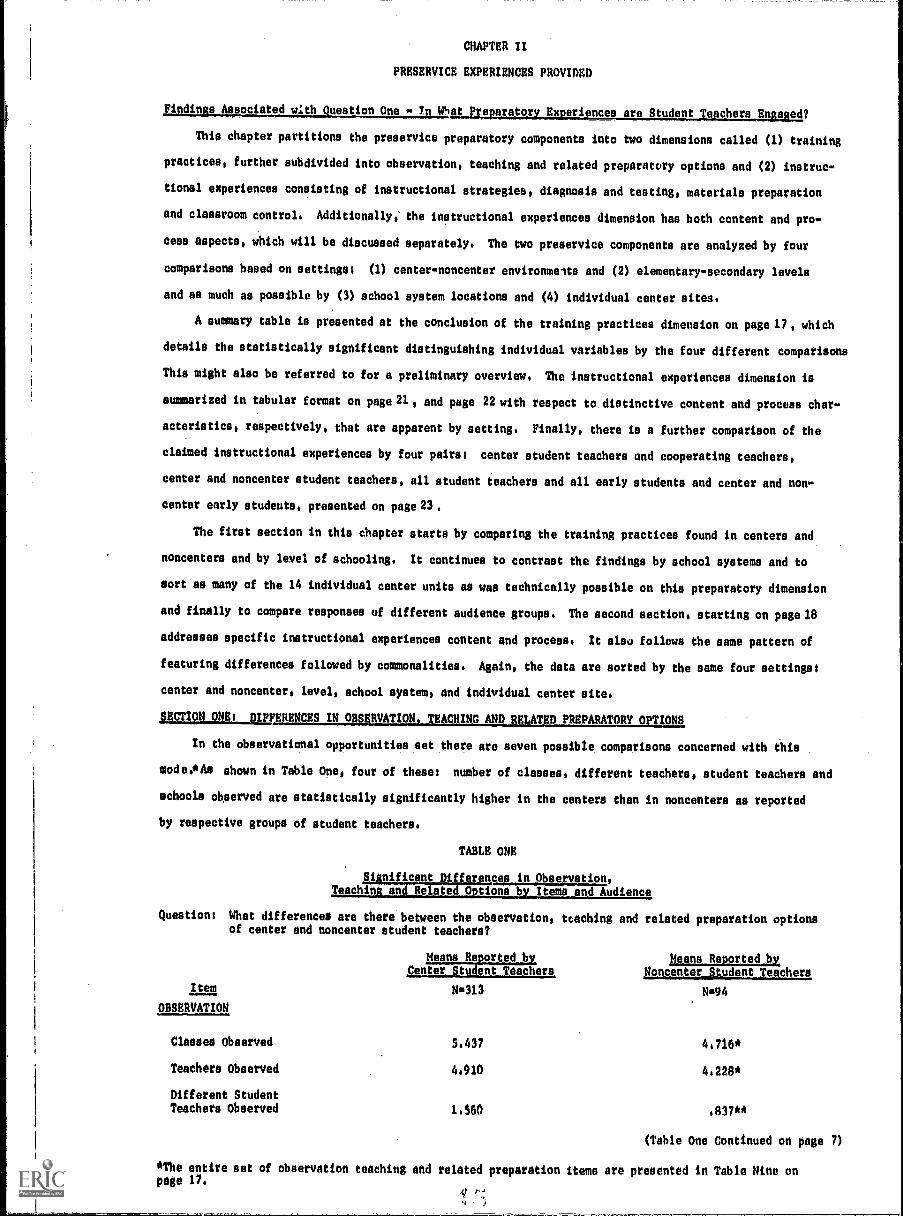
Findings Associated with Question One In NtPrearatorExeriec_aypmeteachersEcjJaecliLLJ
This chapter partitions the preservice preparatory components into two dimensions called (1) training
practices, further subdivided into observation, teaching and related preparatory options and (2) instruc-
tional experiences consisting of instructional strategies, diagnosis and testing, materials preparation
and classroom control. Additionally; the instructional experiences dimension has both content and pro-
cess aspects, which will be discussed separately. The two preservice components are analyzed by four
comparisons based on settings: (1) center-noncenter environmeits and (2) elementary-secondary levels
and as much as possible by (3) school system locations and (4) individual center sites.
A summary table is presented at the conclusion of the training practices dimension on page 17, which
details the statistically significant distinguishing individual variables by the four different comparisons
This might also be referred to for a preliminary overview, The instructional experiences dimension is
summarized in tabular format on page 21, and page 22 with respect to distinctive content and process char-
acteristics, respectively, that are apparent by setting. Finally, there is a further comparison of the
claimed instructional experiences by four pairs: center student teachers and cooperating teachers,
center and noncenter student teachers, all student teachers and all early students and center and non-
center early students, presented on page 23.
The first section in this chapter starts by comparing the training practices found in centers and
noncenters and by level of schooling. It continues to contrast the findings by school systems and to
sort as many of the 14 individual center units as was technically possible on this preparatory dimension
and finally to compare responses of different audience groups. The second section, starting on page 18
addresses specific instructional experiences content and process. It also follows the same pattern of
featuring differences followed by commonalities. Again, the data are sorted by the same four settings:
center and noncenter, level, school system, and individual center site.
sEemnLuolasIN OBSERVATION, PREPARATORY OPTIONS
In the observational opportunities set there are seven possible comparisons concerned with this
modei*Aa shown in Table One, four of these: number of classes, different teachers, student teachers and
schools observed are statistically significantly higher in the centers than in noncenters as reported
by respective groups of student teachers.
TABLE ONE
gisifical:cesic:Observaticm,Teaching and Related Options by Items and Audience
Question: What differences are there between the observation, teaching and related preparation optionsof center and noncenter student teachers?
MUM1125212112,Center Student Teachers
)leans Reported byNoncenter_Btudent Teachers
/tem N313 N94OBSERVATION
Classes Observed 5.437 4,716*
Teachers Observed 4.910 4.228*
Different StudentTeachers Observed 1,560 '837**
(Table One Continued on page 7)
*The entire set of observation teaching and related preparation items are presented in Table Nine onpage 1/,
it ?'-;

BEST COPY AVAILABLE
Table One, continued
Means Reported by, Means Reported b,/Center Student Teachers Noncenter Student Teachers
Item N=313 N "94
OBSERVATION
Schools Observed 3.045 1,765 **
TEACHING
Schools Taught 1.761 1.310**
Teachers UnderWhom Taught 1.953 1.677**
RELATED PREPARATION
Assigned Mailbox 1.860 1,947**
Voice in Selection 1.809 1.968**
Seminars Attended 5.084 3.105**
Choice of Situation 1.290 1.890**
** p 4 .01
There are six items focused on teaching opportunities, of these two; number of schools in which teaching
occurred, and number of teachers under whom teaching occurred, are statistically significant.
However, among a group of ancillary preparation options, consisting of five items, four of these
differentiate the center student teachers from the noncenter group. These items were scored dichoto-
mously, therefore the lower means signifies higher positive responses. Apparently, the center popula-
tion receives a greater benefit in number of seminars attended, voice in selection of cooperating teacher,
choice of student teaching situation and availability of own mailbox as compared with the noncenter
students. This means that of twenty-ond observation, teaching and related items ten are significantly
different (p < .05) indicating the availability of higher center options than obtain in noncenters.
The majority of these differences are also confirmed by the reports of cooperating teachers and super-
visors, as will be reported below.
The observation, participation and related preparatory options aspect of the professional program
appears significantly different in the center environment. The two settings are distinguishable on a
majority of the items. All differences observed indicate that the center environment provides more
training opportunities, that is, it presents a fuller, or richer, array of alternatives than obtains
in the noncenter setting.
Similarities in Findin s Concernin Observation Teachin: and Ancillary Pre aration Options:
Fewer than half the observation, teaching and related preparation options appear to be similar regard-
less of source or location. Whether students, teachers or supervisors are the sources, or whether the
reports originate from center or noncenter locations, only a minority of the various professional prepar-
atory options are alike. In the observation set: number of subjects, ability levels, and grade levels
observed are equally accessible to all candidates.
However, the majority of the teaching opportunities are similarly available to both center and
noncenter trainees. The number of subjects, hours taught, weekly solo teaching and ability levels
taught are part of the field component regardless of setting. In addition, age, sex, introduced as
staff and decision to be a teacher are similarly distributed acrosi the center and noncenter audiences,
as shown in Table Two. For readers' information we report mean or percent for items. The statistical
"

-8-
testa used were analysis of variance or chi square where appropriate,
TABLE TWO
Similarities in Observation, Teaching andRelated Options by Items and Audience
Question: What are the common experiencesof both center and noncenter
Item
in observation, teaching and related preparation optionsstudent teachers:
Means or Percent Reported by Means or Percent Reported byCenter Student Teachers Noncenter Student Teachers
Na313 Ne94
Subjects Observed2 4.752 4,920
Grade Levels Observed2
3.837 3,500
Ability Levels Observed'High 72.9% 62.8%
Middle 92.8% 91.5%
Low 69.5% 68.1%
Ability Levels Taught1
High 64.8% 61.7%
Middle 89.7% 90.4%
Low 66.4% 60.6%
Subjects Taught2
4.114 3.904
Average Hours Taught/Day2 4.768 4.989
Solo Teaching/Week2 10.832 11.319
Timing of Teaching Decision2 3.035 3.117
Introduced as Staff].Yes 28.4% 39.4%
No 71.6% 60.6%
Ag e 1
23 or less 75.4% 68.1%
23 to 29 19.0% 21.3%
29 or more 5.6% 10.6%
Sex"Female 76.6% 77.7%
Male. 23.4% 22.3%
1 Chi square analysis used where assumptions of analysis of variance could not be met.
Percent responging "yes" reported.2 Analysis of variance with mean reported.
When the observation, teaching and related preparation dimension is looked at from the vantage point
of level of schooling a somewhat different pattern is observed. As can be seen from Table Three there are
five observational items that significantly differentiate elementary exposure from the secondary level.
All of these: subjects, teachers, student teachers, schools and grade levels observed favor the elemen-
tary program. Similarly, four teaching variables: number of schools taught, teachers under whom taught,
subje,Its and average hours taught are significantly greater on the elementary level. However, the
ancillary options do not exhibit as strong a level differentiation as do the observation and teaching
items. Here, only two of five possible activities distinguish the two levels: introduction as staff
and seminars attended. Again, the elementary exposure significantly exceeds the secondary options.

TABLE THREE
Differences in Observations Teaching andRelated Options by Items and Levels
Questions What are the unique experiences in observation, teaching and related preparatory optionsof elementary and secondary student teachers?
Item
Means or Percent Reported by Means or Percent2m2110.423Elementary Teachers To7c76070711Mnt Teachers
Subjects Observed'One 5.5% 26,6 % **
2 to 4 13,3% 58,2 % **
5 or more 81.2% 15.2%**
Teachers Observed2 5,21 4.20**
Student Teachers Observed'None 37.1% 48.77,*
3 or more 28,2% 10.%*
Grade Levels Observed 24,00 3,49 **
Schools Observed'1 to 3 69.2% 86,6 % **
4 or more 30.8% 13.4%**
Schools Taught'2 to 3 72.2% 21,4 % **
4 or more 27.8% 78.6%**
Subjects Taught1
One 3.7% 23.6%*
2 to 4 19.1% 68.8%**
5 or more 77.4% 7,6 %*
Taught Under One Teacher' 36.3% S4.4%**
Timing Teaching Decision'Elementary school 26.1% 8,3 %*
Ability Levels Taught'Lc:* 69.3% 59,6%*
Average Hours Taught/Day2 5.16 4.48**
Introduced as Staff' 40.5% 21.9%**
Seminars Attended'1 to 2 17.9%. 52.8%**
3 or more 64.1% 31.7%**
Sex'
Female 87.2%3 67.1%
Male 12.8% 32.9%
1 d Chi square analysis
2 a Analysis of variance
3 Difference between female and male elementary is significant at .01
*p e .05**p < Al

-10-
TABLE FOUR
Similarities in Observatioa Teaching and24191tUptions by Items and Audience
Question: What are the common experiences in observation, teaching and related preparation ofboth elementary and secondary student teachers?
Item Elementary Secondary
Situation Choice'
Classes Observed2
Student Teachers Observed1
1 to 2
Ability Levels Observed'High
57.8%
4.95
34.7%
29.8%
66.4%
5.44
40.7%
27.8%
Middle 5.0% ' 10.1%
Low 28.4% 36.1%
Teachers Taught Under'2 to 3 55.3% 41.1%
4 or more 8.4% 4.4%
Timing Teaching Decision]:Junior high school 8.3% 14.7%
Senior high school 27.1% 28.8%
College 34.9% 39.1%
Other 3.7% 9.5%
Solo Teaching/Week2 10.90 10.79
Voice on Selection1 17.4% 14.6%
AgeLees than 23 76.1% 69.3%
23 to 29 16.5% 24.4%
29 and over 7.3% 7.6%
SexFemale 87.2% 67.1%
Male 12.8% 32.9%
1 Chi square analysis for percents used.
2 Analysis of variance for means used.
As can be observed from the table above, commonality between the elementary and secondary practices
obtains for only three observation and two teaching items. At the same time, three - of a total of five -
related preparation options are equally accessible to student teachers regardless of level. However,
less than half of the total training practices exposure is similarly available to candidates on the
two levels.
The various reports of the preparatory training experience come from different geographic loca-
tions. Seven school systems contribute the setting from which the reports originate. From this vantage
point it is possible to ask two queationst (1) Which training items appeer-to differentiate which two,
or more, of the seven school systems? and (2) Are there readily observable school system patterns?
Table Five summarizes the items that significantly differentiate among the seven systems or where this
was not possible, the five systems with the largest number of participants.
Only two observational variables pertaining to subjects and grade levels appear in the seven system
analysis while schools observed is found to be signif4alik in the five system comparison. However, threeE

BEST COPY AVAILABLE
of the teaching items; schools, subject and teachers under whom taught appear to be significant in the
complete set. In the related options area situation choice is significantly higher as reported by two
systems contrasted with each other and with a third system. Three variables; mailbox assigned, voice
in selection and attended seminars significantly differentiate four members of the five school syttem
set. However, the majority of the observation, teaching and related options are indistinguishable by
school system. Furthermore, it can be seen that no readily distinguishing pattern is available for
either the five, or seven, school systems set. The most that can be said is that there are some recurr-
ing contrasts among the systems that go in the same direction. Systems 5, 6 and 7 do appear to differ
among themselves more than once but no more than three times. It is not possible to derive the exist-
ence of a school system related pattern from these isolated contrasts. The absence of school system
patterns fails to lend support to claims of unique system emphases in the observation, teaching and
related options aspect of preservice training practices.
TABLE FIVE
Significant Differences in Observations Teaching and OtherPreparatory Options by Variables and School Systems
Questions What differences obtain among the seven school systems or among the five largest systems?
Seven System Means or Percent Significant Post
System 1 System 2 System 3 System 4 System 5 System 6 System 7 Hoc Comparisons
N..18 N=9 N.17 N.7 Nu87 N144 Ne132 Allps<.05 BonferroniVariable
Situw-ion ChoicelYes
Subjects Observed2
Grade LevelsObservedl
3
Schools Taughtl1 to 3
Subjects Taught2
Teachgrs TaughtUnder'
4 or more
Schools Observed3
Mailbox Assigned
Voice in SelectionYea
Seminars AttendedNone
3 or more
68.8% 85.7% 75.0% 100.0%
3.28 7.22 5.94
11.1% 11.1% 47.1% 85.7%
11.1% 88.9% 88.2% 100.0%
2.83 5.67 5.24
85.9% 57.7% 43.4% System 5 >6,7
System 6)7
8.57 4.78 4.48 4.80 System 4)1,5,6,7System 2)1
72.1% 32.1% 41.7% System 5)1,6,7System 7)6
67.1% 46.7% 41.0% System 3)1,6,7System 5)1,7
6.57 4.12 3.92 3.97 System 7)1
77.8% 22.2% 52.9% 100.0% 31.0% 58.3% 52.7%
Five System Percent,
0.0% 5.9%
0.0% 5.9%
0.0% 11.8%
43.8% 7.7%
12.5% 69.2%
1111111111.1N1.11 e Chi square analysis for percents used.
2 o Analysis of variance for means used.
System 1)3,5,6,7System 2<5,6,7System 3)5,6,7System 4 >6,7,1,2
System 5)6
58.8% 18.8% 9.9% System 5)1,3,6,7
16.1% 1.4% 25.2% System 5)6,
System 7)6
27.9% 9.7% 14.5% System 5 >6
3.8% 9.9% 25.2% System 7>5
49.4% 62.0% 38.7% System 6)1,7

As can be seen from Table Five no single school system significantly outperforms all remaining
0:horn on any of the observation, teaching or related preparatory options. Nor is there a consistently
low performer in the set. In fact, there is scarcely a general pattern to be observed, Focusing on the
significant post hoc comparisons reveals a :Angle system (#5) which is distinguishable on seven variables:
choice, schools and grade levels observed, schools taught, teachers taught under, mailbox assigned and
voice in selection with respect to at least one, and no more than four other systems. Only on a single
variable: numbers of schools observed, does system #5 exceed all four other systems available for that
analysis. System 87 is recognizably different on three vaiablea: grade levels and subjects observed,
and mailbox assigned in comparison with one of three other school systems. System #6 differs on three
variables: choice, teachers taught under and seminars attended for at least one and no more than two
other systems. System #4 significantly exceeds systems 1,5,6 and 7 both for subjects taught and
teachers taught under, and the latter, for system #2 as well. System #3 is greater on schools taught
and teachers taught under, In comparison with at least three, but no more than four, ether systems,
which twice include systems 6 and 7. System #1 exceeds systems 3,5,6 and 7 for a single variable,
teachers taught under. Apparently, system 112 does not exceed any other system with respect to any of
these training practices. No single system is distinguishable for a majority of the variables from the
majority of the systems.
There appears to be some distinguishable preparatory emphasis, or uniqueness, among the seven
systems, made apparent with respect to systems 4 and 5. That there is no clear, overriding potential
system effect can be observed also by looking verically down the school system column in Table Nine
(page 17) and then horizontally by variables in an attempt to locate particularly recognizable system
features. It is apparent that no variable distinguishes significantly solely on the school system ana-
lyses.
When the training practices are reviewed by analysing responses of the 14 center, or 12 center,
groups no clearer patferns are evident. (See Table Six, page 13). However, the individual center
contrasts are clustered in the observation portion of the preservice training practices. All but one
of the seven observational options appear to distinguish at least two, or more, of the centers. Only
three of the teaching options: schools, hours and teachers differentiated among eleven of the fourteen
sites. Among the ancillary options there was only a single contrast for choice of situation between
two center locations.
The absence of unique center emphases is made evident in Table Six. Again, as with the school
system analysis, there is no individual center setting that consistently tops, or cornea last on, the
Hat of either fourteen, or twelve centers, or that distinguishes on a majority of the variable; tra
the majority of the centers. It is in the portion of the table, where the significant post hoc com-
parisons are presented that some individual center differences are most readily apparent. It should
be noted that of the nine variables, which actually distinguish pain of centers, only three: teachers,
and subjects observed, and schools taught include individual contrasts in which at least one site exceeds
more than half of the remaining aet. These sites are centers 1,8,10 and 11. While renter 10 exceed'
at least one other, but no more than nine centers, for up to six variables, it is imper'tant to obnerve
that it is exceeded by two other centers on two of the very same variables: student tvaehet observpl
and teachers taught under. Additionally, center 10 is exceeded, on schools taught, by five Ater
center eitee. It In worth noting, however, that canter 8 is also significantly distinguishable on thluv

TABLE SIX
Significant Differences in Observation, Teaching and Otheralparatorypotions by Variables and Individual Center.Sites
Question: What differences obtain among the fourteen centers or among the twelve largest ce1
Variable:
Center:(1)N=16
Teachers-
Observed m 4.31
Student TeachersObserved
3 or more 6.3%
Grade LevelsObserved
3 or more 12.5%
Schools Observed3 0.0%
Schools Taught3 87.5%
Introduced asStaff_ 2.2%
Hours Taught/Day ill
Choice
ClassesObserved m
6.27
4.8%
Fourteen Centel` Means or Percent
(2)
N=9(3)
N=17(4)
N=7(5)
N=35(6)
N=24(7)
N=13(8)
N=28(9)
N=35(10)
N=23(1
3.67 5.06 8.14 4.18 5.61 4.15 6.18. 4.66_ 8.24
11.1% 50.0% 71.4% 17.6% 45.8% 0.0% 33.3% 6.1%_ 69.6%
11.1% 47.1% 85.7% 67.6% 77.3% 23.1% 57.1% 39.4% 95.7%
0.0% 5.9% 0.0% 15.2% 13.9% 7.7% 85.7% 12.51. 91.3% 1.
11.1% 11.8% 0.0% 63.6% 21.7% 15.4% 14.3% 71.9% 8.7%
2.2% 3.4% 0.0% 11.2% 9.0% 10.1% 15.7% 5,6%_ 11.2%
9.88 8.53 18.80 8.76 10.09 11.58 6.92 9.00 14.45 1.
2.6% 5.2% 2.6% 13.9% 5.7% 4.3% 061% 10.4% 8.7%
1.75
SubjectsObserved m
Teachers TaughtUnder
4 or more
1.93
Twelve Center Means or Percent
1.76 1.79 1.74 1.54 1.69 1,79 1.95
1.76 1.69 2.46 2.69 2.79 1.89 2.83
48.6% 37..5% 13.4% 25.0% 54.3% 13.0%
m = Means are given for the variable.

otion.Teachins and Otherd Individual Center. Sites
or among the twelve largest centers?
or Percent
7)13
.15
.0%
.1%
.7%
.4%
.1%
.58
Signi
(8)
N=28(9)
N=35
(10)
N=23(11)
N=30(12)
N=27(13)
N=:30
.(14)
N=27
6.18 4.66 8.24 5.18 5.27 3.21 3.07 Center 4 >13,14 Center
33.3% 6.1% 69.6% 10.3% 11.5% 7.1% 3.7% Center 14>10
57.1% 39.4% 95.7% 20.7% 65.4% 17.2% 22.2% Center 5>1,11,13 Center
85.7% 12.5% 91.3% 14.8% 48.1% 10.7% 7.4% Center 8>1 3 5 6 7 9
14.3% 71.9% 8.7% 82.1% 18.5% 70.4% 22.2%Center 1>3, 7 8 106,,, ,
15.7% 5.6% 11.2% 10.1% 5.6% 7.9% 5.6%
6.92 9.00 14.45 11.21 11.85 13.07 10.23
.3% 0.1% 10.4% 8.7% 9.69% 5.7% 10.0% 7.4%Center 5>12
eans or Percent
.54 1.69 1.79 1.95 1.72 1.77 1.64 1.31 Center 10>14
.69 2.79 1.89 2.83 2.00 2.63 1.70 2.85
11 13,14 Center
1412 , Center 5>8,10 Cent
no significant oat hoc
no significant post hoc
Center 3>9 Center 6 >5,13 Center 8>9 Cente1111111.11111111.1/1..
.4% 25.0% 54.3% 13.0% 76.7 % 66.7% *6.7% 4047% Center 10>1 tenth

Significant Post Hoc Comparisons
All p<.05 (Bonferroni)
Center 8>13 14 Center 10>1 2 5 7 9 13 14
Center 6>1,11,12,13,14
Center 10>9 11 12 13
Center 10>1,11,12,13,14
Center 12>3 Center 10 >1,3, 5 6 7 9 11 13 14
Center 5>8,10 Center 9>3,8,10,12,14 Center 11>3,6,7,8,10,12,14 Center 13>3,8,10,12
ificant ost hoc (14
ificant post hoc
1=0.111mlima.....m..morm.......1.1
Center 8>9 Center 10>1,5,9,11,13 Center 14>1,5,9,11,13 Center 5,13 <3,7,8,12
Center 11>7 8 10
21

-14-
of the same variables as center 10 and that both of these centers represent elementary level settings
of school system #5 that appears most readily distinguishable on the previously detailed school system
contrasts.
Despite these suggestive observations, there does not appeo. to be a clearly discernible, distinc-
tive training practice emphasis evident in any one center that is not paralleled to some degree, and
in kind, by other center situations. What this means in practical terms is that it is not at present
possible to say, for example that if one wishes to maximize number of classes observed one would choose
center 10. One might just as well choose any one of centers 1-13 from which 10 does not differ signif-
icantly. The present findings do suggest only that if one wishes to maximize this training exposure
one would not choose center 14 over center 10. Furthermore, the data presently assembled do not allow
choice of centers 1-9 or 13 over center 14 from which they are also statistically indistinguishable.
All we can conclude for practical purposes is that there is more similarity among the centers than
uniquely available training exposure in observation, teaching and related preparatory options.
Differences in Perce tions of Trainin: Practices b Grou.s:
It is also possible to contrast the reports of students concerning observation, teaching and related
preparation, with those of their cooperating teachers and university supervisors in both the center and
noncenter environments. Table Seven presents the results of the two-way comparisons while Table Eight
includes the items on which three-wav contrasts were obtained.
TABLE SEVEN
Significant Differences in Observation Teaching and OtherPre aratory 0 tions b Variables Grou.s and Environments
Question: What are differences in views of student and cooperating teachers in centers and noncenters?
Center Percent Reporting "Yee
Student Teachers Cooperating TeachersVariable.
Situation Choice
Introduced as Staff
Timing of Teaching DecisionPost college
Seminars Attended- None
Ability Levels ObservedLow
Ability Levels TaughtLow
Ability Levels ObservedHigh
76.9%
28.47.
69.5%
6.s%*
36.7%*
13.0%*
5.3%*
61.2%*
66.4% 54.1%*
Noncenter Percent Reporting IseStudent Teachers Cooperating Teachers
62.8% 79.9%*
* pt.05
All chi square analyses
In the centers there are ten items that statistically significantly differentiate the reports of
center student teachers from those of their cooperating teachers, while three items differentiate
students and supervisors, as made apparent in Tables Seven and Eight.
-15-
TABLE EIGHT
Significant Differences in Observation, Teaching_and Other PreparatoryOptions by Variables, Groups and Environments
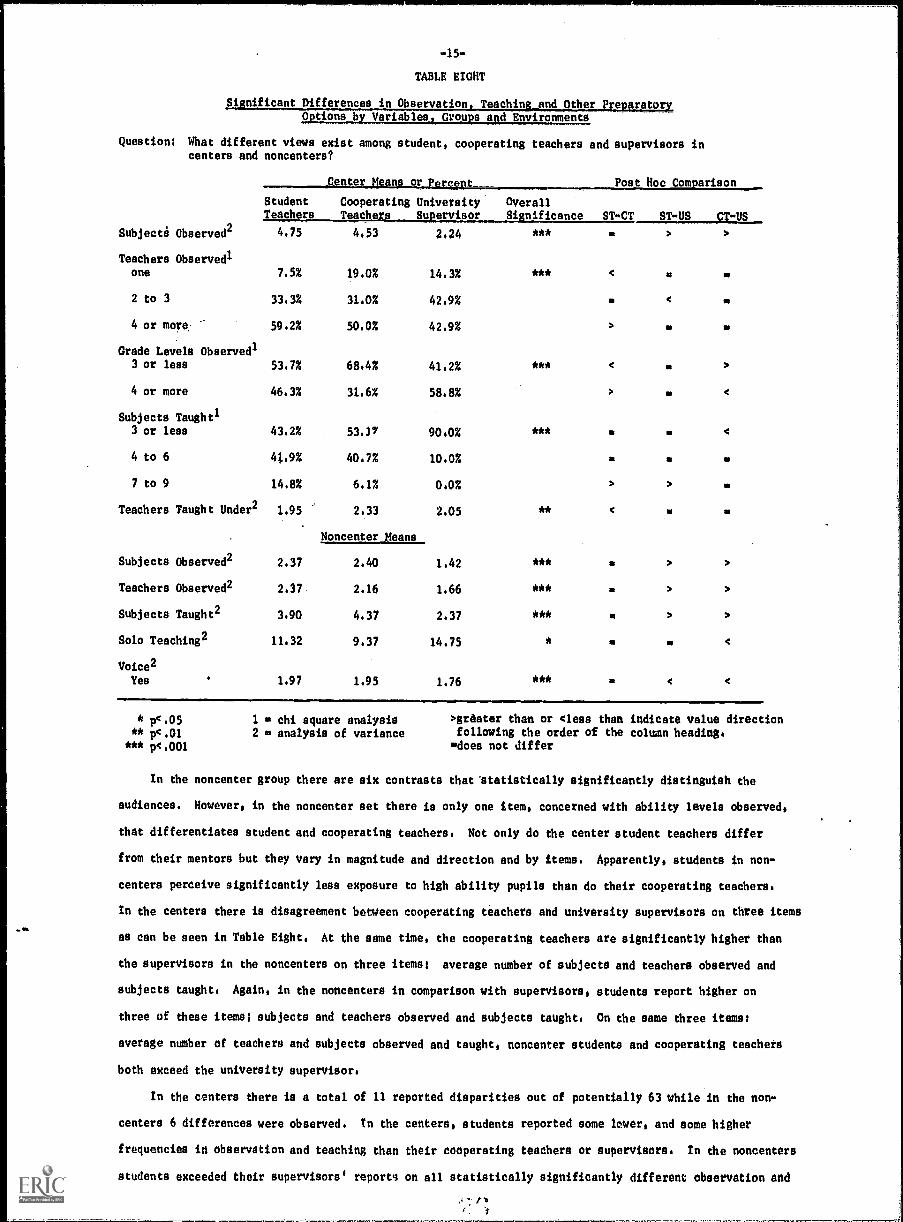
Question: What different views exist among student, cooperating teachers and supervisors incenters and noncenters?
Center_Means or Pereent____ Post Hoc Comparison
StudentTeachers
Cooperating UniversityTeachers Supervisor
OverallSignificance ST-CT ST-US CT-US
Subjects Observed2 4,75 4.53 2.24 ***
Teachers Observed'one 7.5% 19.0% 14.3% * * * < ss se
2 to 3 33.3% 31.0% 42.9% a <se
4 or more, 59.2% 50.0% 42.9% > so so
Grade Levels Observed'3 or less 53.7% 68.4% 41.2% * * * < so >
4 or more 46.3% 31.6% 58.8% > so <
Subjects Taught'3 or less 43.2% 53.77 90.0% * * * a Is <
4 to 6 41.9% 40.7% 10.0% st a se
7 to 9 14.8% 6.1% 0.0% > > le
Teachers Taught Under2 1.95 2.33 2.05 ** < is se
Noncenter Means
Subjects Observed2 2.37 2.40 1.42 *** a > >
Teachers Observed2 2.37 2.16 1.66 *** a > >
Subjects Taught2 3.90 4.37 2.37 *** se > >
Solo Teaching2 11.32 9.37 14.75 * al so <
Voice2
Yes 1.97 1.95 1.76 * * * a < <
* p<.05** p< .01
*** p<.001
1 = chi square analysis2 os analysis of variance
'greater than or (less than indicate value directionfollowing the order of the column heading.
=does not differ
In the noncenter group there are six contrasts that 'statistically significantly distinguish the
audiences. However, in the noncenter set there is only one item, concerned with ability levels observed,
that differentiates student and cooperating teachers, Not only do the center student teachers differ
from their mentors but they vary in magnitude and direction and by items. Apparently, students in non-
centers perceive significantly less exposure to high ability pupils than do their cooperating teachers.
In the centers there is disagreement between cooperating teachers and university supervisors on three items
as can be seen in Table Eight, At the same time, the cooperating teachers are significantly higher than
the supervisors in the noncenters on three items: average number of subjects and teachers observed and
subjects taught. Again, in the noncenters in comparison with supervisors, students report higher on
three of these items; subjects and teachers observed and subjects taught. On the same three items:
average number of teachers and subjects observed and taught, noncenter students and cooperating teachers
both exceed the university supervisor.
In the centers there is a total of 11 reported disparities out of potentially 63 while in the non-
centers 6 differences were observed. In the centers, students reported some lower, and some higher
frequencies in observation and teaching than their cooperating teachers or supervisors. In the noncenters
students exceeded their supervisors' reports on all statistically significantly different observation and

-16-
teaching items. The cooperating teachers exceeded the supervisors also; and the students together with
their mentors report significantly higher opportunities in contrast with the supervisors. In the non-
center set those in the field report that there is more occurring than is indicated by the campus-based
visitors. In summary, there are, more people, more discrepancies and more mixed perceptions in the
centers than in the noncenter situations where there are about half as many statistically significant
contrasts all differing in the same direction.
Interestingly among the 13 items that are reported differently (see both Tables Seven and Eight)
there is noticeable overlap. Ability levels observed appears to distinguish both the center and non-
center students and their cooperating teachers. Similarly, teachers observed, subjects observed and
taught are discrepant across the two settings.
C; the whole, more differences in views are apparent in the center setting contributed by the
dissimilar p..rceptionsof students and their cooperating teachers. Two of the six items exhibiting
this difference ate readily interpretable. The center cooperating teachers are reporting on choice of
teaching situation for themselves and appear to have more of this option than do students. Also, timing
of teaching decision is obviously likely to be later for cooperating teachers than for students who are
now completing their undergraduate programa. If the email cohort of over 29 year old noncenter student
teachers is remembered (See Table Two, page 8) it is understandable why this difference would not also
characterize the noncenter group. Introduction as staff and seminars attended are items pertaining to
the preservice aspect of the program that the centers have as their charge. Consequently it is possible
to comprehend comparative overreporting in this area. In the same vein, noncenter cooperating teachers
may overreport exposure of trainees 0 high ability pupils as a mark of program quality. It should be
noted that areas of discrepant reporting are puzzles for future inquiry rather than tests of respondent
credibility.
The center student teachers overreporting observation and teaching of low ability pupils may signal
an awareness on the part of trainees"that this is an important option to utilize and therefore laying
claims to its achievement. Again, the discrepancies among students, cooperating teachers and supervisors
in the centers with respect to number of grade levels observed and different teachers taught under can
be seen as program enhancement overreporting by two audiences. Students know they are expected to avail
themselves of the opportunity to observe different grade levels and thus they claim this. Concurrently,
the cooperating teachers are especially aware in the centers of the desirability of exposure to a variety
of models and thus they overreport this opportunity.
In the noncentera cooperating teachers and supervisors disagree on the amount of time students spend
teaching on their own. In addition, students and cooperating teachers perceive significantly leas voice
in selection of person to work with than do the supervisors, who do, in fact, exercise this option fairly
frequently. In the centers the cooperating teachers and university supervisor appear to agree more with
one another than in the noncentnrs where every,single variable Is discrepant. Greater consonance in views
of cooperating teachers and supervisors, possibly based on mutually derived program expectancies gained
over time, appoars to characterize the center environment.
If the results of Table One and Three are considered along with Tables Seven and Eight it appears
that on fourteen variables student responses are confirmed by cooperating teacher or supervisor reports.
There are only four variables which distinguish significantly between groups that do not confirm the
student reports used in all the earlier comparisons. This still means that the vast majority of centerev,h44. I

-17-
and noncenter student reports are corroborated by the responses of others, However, number of teachers
observed, introduced as staff, teachers taught under and seminars attended are variables where responses
need to be viewed with some ears tentativeness, It is possible to speculate about why discrepancies
would be manifest for these particular items particularly in the center environment. Here, there is a
more concentrated training effort in progress, more students present, making visible the commitment to
a richer and more varied training emphasis and an inservice effort supporting continuous staff develop-
ment. As an added consequence, awareness of what the program is expected to be is higher in the centers
and is a possible explanation for the discrepancy with tespect to these particular items signalling the
existence of the program. A summary of the training practices results are presented in Table Nine.
TABLE NINE
BItImigg.Practicea Summary:
Observation Tea hi and Related Preparatory Optionsb Variable and Settin Indicatin Statisticall
Significant ,Differences
Variable Setting
School.,
AMID"
*
*
Individu 1Center
--------
Situation Choice
Classes Observed
Subjects Observed
Elementary /Secondary),Center/Noncenterl
>
>
>
*
*
*
Teachers Observed > > *
Student Teachers Observed° > > *
Grade Levels Observed > * *
Schools Observed° > > * *
Ability Levels Observed
Schools Taught°
Subjects Taught.°
Hours Taught/Day
Solo Teaching/Week *
Ability Levels Taught - low
Taught Under one Teacher
Voice in Selection
Mailbox Assigned
Introduced as Staff
Seminars Attended
Timing Teaching Decision -elementary
Age
Sex (% female over male)
o Comparison based on highest category,
1 Whenever a statistically significant result was observed > always shows the greater value directionas indicated by the order in the column heading.
2 Whenever a statistically significant difference was observed an * 'a used.

-18-
SECTION TWO: PATTERNS OP PRESERVICE INSTRUCTIONAL EXPERIENCES
The instructional experiences portion of preservice preparation has both content and process dimen-
sions. The content comprises four skill areas concerned with instructional strategies, diagnosis and
testing, preparation of materials and classroom control, These four dimensions of the preservice
experiences are derived from 31 items in the Survey and are presented in Table Ten. The process cate-
gories include the complete observation and review cycle as well as the partial ones composed of re-
viewed only, observed only, student solo and no response.
The majority of the instructional experiences items elicit responses indicating that the specific
training had been encountered by more than half of the student teachers independent of environment.
(See Table Ten) However, students in the centers claim a significantly greater average number of
experiences than noncenter student teachers. The experiences mean for the center students is 18.504
while the noncenter is 16.032 (p4.02). Both groups are exposed to more than half of the 31 items but
the center audience is the clear gainer on preservice exposure.
TABLE TEN
Percentage of Audience Reporting Experience by Item
Question: Is there variety (in claimed) preservice instructional experiences by location andpreparatory stage?
CenterStudentTeacher
CenterCoop.
Teacher
Center
StudentTeacher
NoncenterStudentTeacher,
All StudentTeachers
EarlyStudents
Soh., N99 N127 N31 Nu158
-Null3Item
Test Administration, Gradingand Interpretation 78.5 74.7 78.0 80.6 78.5 23.9
Standardized TestAdministration 33.6 31.3 33.9 29.0 32.9 8.8
Discovery Inquiry Lesson 64.5 73.7 64.6 64.5 64.6 24.8
Individualised Instruction 75.7 80.8 77.2 54.8 72.8 51.3
Unit Introduction, ClosureLesson 90.7 81.8 90.6 90.3 90.5 40.7
Higher Order Questioning 52.3 46.5 50.4 38.7 48.1 9.7
Microteaching Lesson 43.9 46.5 44.9 29.0 41.8 9.7
Parent Conference 37.4 35.4 40.2 45.2 41.8 .9
Field Trip Planned andSupervised 42.1 41.4 43.3 12.9 37.3 12.4
Small Group Instruction 84.1 90.9 85.8 74.2 83.5 53.1
Classroom Test Administration 58.9 71.7 59.1 54.8 58.2 8.0
Immediate and DelayedFeedback 59.8 63.6 58.3 54.8 57.6 16.8
Wait Time 42.1 29.3 40.9 35.5 39.9 7.1
Pupil Participation inClassroom Routines 72.9 75.8 72,4 67.7 71.5 15.9
Direct StudentAttending Behaviors 14.8 68.7 72.4 61.3 70.3 30.1
Reduction of Task Complexity 59.8 59.6 61.4 51.6 59.5 23.9
Reduction of Crowding orNoise 92.5 83.8 93.7 87.1 92.4 35.4
Restructure Seating Pattern 60,7 5746 61.4 71.0 63.3 9.7
(1: (Table Ten continued on page 19),i. ',

Table Ten, continued
-19-BEST COPY
AVAILABLE
Center Center Center Noncenter All Student EarlyStudent Coop. Student Student Teachers StudentsTeacher Teacher Teacher Teacher
item N107 No99 NP127 No31 N158 N113
Special Verbal Warning 87.9 81.8 87,4 . 93.5 88.6 41.6
Visual Prompting 74.8 74.7 74.8 67.7 73.4 27.4
Diagnose individualLearning Problem 11.2 46.5 10.2 19.4 12.0 23.9
Construct a Learning Station 48.6 50.5 41.2 41.9 49.4 19.7
Construct Lesson for GivenBehavioral Objectives 68.2 81.8 72.4 48.1 69.6 34.5
Test Construction 83.2 68.7 82.7 67.7 79.7 11.5
Construct BehavioralObjectives 79.4 75.8 79.5 67.7 77.2 25.7
Construct NonbehavioralObjectives 93.5 41.4 91.3 74.2 88.0 15.9
Create Laboratory,Simulation Exercise 61.7 33.3 59.8 48.4 57.6 13,3
Create a Slide, Filmstripor Slide-Tape 37.4 28.3 37.0 32.3 36.1 7.1
Interpret Standardized Test 29.0 21.2 30.7 19.4 28.5 8.0
Interaction Analysis 28.0 24.2 29.9 6.5 15.3 12.4
Select a Standardized Test 15.0 9.1 15.0 9.7 13.9 0.0
Furthermore, on both the instructional' strategies and material preparation skills, centers provide
significantly greater options than do the noncenters. As can be seen below, the center means do not
differ'from the noncenter ones on either diagnosis and testing or classroom control techniques. The
presence of significant differences in two areas and the similarity in two others is a useful finding
for program planners. It might be possible to devote effort to bring noncenter experiences on par with
center emphases in instructional strategies and materials production. More readily accessible is
targeting joint institutional effort to increase options in the diagnosis and testing and classroom
management areas in the centers.
TABLE ELEVEN
Claimed Preservice Instructional Experiences,hylariable Clusters and Audisam
Question: Do student teachers encounter different number and kinds of experiences in centers?
Total Number of Experiences
Means for Experiences Reportedby Center Student Teachers
Means for Experiences Reportedby Noncenter Student Teachers
18.504
instructional Strategies 5.961 5.000*
Diagnosis and Testing 3.394 2.871
Materials Preparation 3.913 3.226**
Control Strategies 5.236 4.936
aialm.1111.1.4.16.1.
* p M2**13 <101
Vwpmeammapo
When student teacher reports of experiences are compared by individual center location or school
system no significant differences are obtained. This further suggests that the responsibility for the
observed differences is indeed a function of the center setting. As a matter of practical guidance,
furthermore, it appears that students' often articulated prefexenees for particular sites and/or systemsepees

-20-
may not lead to access to the fullest range of instructional competencies.
The comparisons of the array and type of experiences by level yields only a single significant
contrast. Instructional strategies obtain significantly more, mean 6.3,on the elementary than
on the secondary level, mean 5.1 (p<.01).
Student Teacher and Early_Preservice Group Patterns
All student teachers significantly exceed all early preservice students on number of experiences.
Furthermore, all student teachers significantly exceed the early group on instructional strategies,
materials preparation, diagnosis and testing and control strategies.
Student teachers in centers exceed pre-student teachers on number of experiences, instructional
strategies, materials preparation, diagnosis and testing, and control strategies as indicated in
Table Twelve. Student teachers in noncenters exceed pre-student teachers on total number of items and
on all four experlynce dimensions.
TABLE TWELVE
Claimed Preservice Instructional Experiences byVariable Clusters and udiences
Means for Experiences Reported Means for Experiences Reportedby Center Student Teachers by Center Early Students
Total Number of Experiences 18.5 1.3**
Instructional Strategies 5.9 2.5**
Diagnosis and Testing 3.3 .92**
Materials Preparation 3.9 1.6**
Control Strategies 5.2 2.1**
TABLE THIRTEEN
Means for Experiences Xtoortedby Noncenter Student Teachers
Means for Experiences Reportedby Noncenter Early Students
Total Number of Experiences 16.0 5.4**
Inatructional Strategies 0 2.0**
Diagnosis and Testing .97**
Materials Preparation 3..., .76**
Control Strategies 4.9 1.6**
TABLE FOURTEEN
Means for Experiences Repottedby Center Early Students
Means for Experiences Reportedby Noncenter Early Students
Total Number of Experiences 7.3 5.4**
Instructional Strategies 2.5 2.0*
Diagnosis and Testing .92 .97
Materials Preparation 1.6 .76*
Control Strategies 2.1 1.6
*pt.05**p<.01
4

-21-
It can be seen from the above tables that the early students in centers differ significantly
from those in the noncenters on precisely the same dimensions: total number of experiences, strategies
and materials preparation as the center student teachers differ from their noncenter counterparts,
This tends to suggest the presence of a center effect made evident by the two populations on the two
levels of professional preparation.
At the same time, all student teachers in contrast with the early group have significantly more
control experiences. Similarly, center student teachers differ from center early preservice group in
this area as well. In addition, noncenter student teachers and early candidates are also distinguish-
able on the control dimension. All of these findings are summarized in Table Fifteen below.
Audience and Group
TABLE FIFTEEN
Statistically Significant Instructional Experiences VariableClusters by Random Samples of Audience Groups
Number of Materials Diagnosis ClassroomExperiences Strategies Preparation, Testing Control
Elementary/SecondaryStudent Teachers >
1
Center/NoncenterStudent Teachers
Center/NoncenterEarly Students
Center Student Teachers/Early Students
Noncenter Student Teachers/Early Students
Elementary/SecondaryStudent. Teachers
1 = Whenever a statistically significant result was observed > always shows the greater value directionas indicated by the order in the audience and group heading.
Therefore, it appears that there are two seta of influences operating. The first is a general
center effect that amounts to a richer environment in the sense of an overall magnitude of experiences
and a larger number of experiences of a particular sort: instructional strategies and materials pre-
paration. The second is a student teacher effect, which is also distinguishable from the early pre-
service in all settings in overall magnitude of experiences and the additional diagnosis and testing
and control strategies components. There is programmatic logic inherent in the differential expecta-
tions for student teacher functioning in contrast with the early participants to explain this finding.
There is a further program implication for sponsors in the similarity observed with respect to the
control and diagnosis and testing dimensions. This clearly emerges as an area for concerted train-
ing effort in both center and noncenter settings. To untangle the relative contributions of center
and role remains an area for further and subsequent inquiry,
Training Process Patterns
We turn now to the training process dimensions of the thirty-one instructional experiences,
which wore grouped earlier in the four categories of instructional strategies, diagnosis and testing,
preparation of materials and classroom control, The previous discussion, on pages 18 - 21 concerned
the content differences observed and noted both an over-all significance between centers and noncenters
and significant differences on two of the categories. The focus now shifts to the training process
dimensions of these thirty-one experiences. Training process has been defined as the complete ob-
served and reviewed cycle, observed only, reviewed only and student alone.(These four process
d

-22-
categories summarize all the claimed column headings in the instructional experiences portion of the
sample student teacher instrument included in Appendix B.)
It appears from Table Sixteen that center student teachers experience significantly more "reviewed
only" and less "observed only" than noncenter student teachers. The two groups report similarly with
respect to being on their own and having the complete observed and reviewed cycle. The responses of
the center student and cooperating teachers differ precisely on those training dimensions, where the
students agree and conversely they are alike just where the students conflict. Not surprisingly, the
students report significantly more being on their own than do the cooperating teachers. At the same
time, the center cooperating teachers by comparison with the student teachers over report the extent
of the complete training cycle. When the center student teachers are contrasped with the center early
experience students it appears that the student teachers receive significantly more benefit of the com-
plete cycle than do the early preservice candidates. However, on the other three training process
dimensions the center based student teachers and early experience students appear to be indistinguish-
able. This points to the essential similarity between the kind-albeit not the extent-of training
program provided to all candidates in the centers.
TABLE SIXTEEN
Claimed Preservice Training Process Dimensions
Questions Is there significant variation in claimed preservice training process dimensions bylocation and preparatory stage?
Percent of Total Number of Experiences Claimed
StudentOnly
ObservedOnly
ReviewedOnly
Observed andReviewed
Total Numberof Experiences
Center Student (127) 17.6% 29.3%* 4.6%* 48.5% 2350
Noncenter Student (48) 15.2% 37.3% 1.2% 46.3% 499
Center Student (127) 17.6%* 29.3% 4.6% 48.5%* 2350
Center Cooperating Teacher (99) 7.9% 31.6% S.7% 56.8% 1694
Center Student (127) 17.6% 29.3% 4.6% 48.5%* 2350
Center Pre (48) 24.1% 32.6% 7.9% 35.4% 353
Center Student (127) 17.6% 29.3% 4.6% 48.5%* 2350
Noncenter Pre (65) 37.0%* 40.2%* 6.8% 16.0% 338
Center Pre (48) 24.12 32.6% 7,9% 35.4%* 353
Noncenter Pre (65) 37.0%* 40.2% 6.8% 16.0% 338
Noncenter Student (31) 15.2% 37.3% 1.2% 46.3% 499
Noncenter Pre (65) 37.01' 40.2% 6.8%* 16.0%* 338
All StudentCenter and Noncenter (158) 17.2% 30.7% 4.0% 48.1% 2849
All PreCenter and Noncenter (113) 35.5%* 25.5% 8.6% 30.3%* 591
* r significant p<.01
The center program appears more alike despite the differentiation between the stages of professional
training than are the early preservice programs in the two environments. There are two significant
contrasts on the early experience level and both favor the centers. The center students report
being on their own significantly less and more frequently being the receivers of the complete train-
ing cycle. While the above contrasts differentiate the center and noncenter early experience candidates,
only a single training process dimension separates the center student teachers from the early candidates.
This suggests the presence of a center training process mode independent of trainee level. The presence

-23-
of three significant rontrasts between center student teachers and noncenter early experience students
also underscores this finding. Again, the complete cycle comes out in favor of the centers while the
noncenters claim more "student alone "and "observed only." Additional role differences are made apparent
in the noncentwr student teacher and early candidate comparison. Here, the early group is significantly
more on its own, receives review only and has less access to the complete cycle. It is as if the train-
ing proceL6 obtained in the noncenters was reserved for the student teachers and the early candidates
were left untended with the single exception of an occasional observation.
The comparison of all student teachers and early experience students in the two environments also
results in two significant contrasts. Here, again, the student teachers are the beneficiaries of the
complete training cycle, and are "alone" lees than are the early experience candidates.
TABLE SEVENTEEN
Statistically Significant Instructional VariableClusters by Random Samples of Audience Grqms
Audience and Group
Center Student/Cooperating Teachers
Center/NoncenterStudent Teaders
Center and NoncenterStudent Teachers/Early Students
Center/NoncenterEarly Students
Center Student Teachers/Early Students
Noncenter Student Teachers/Early Students
Center Students/Noncenter Early Students
Observed and Reviewed Reviewed Only Observed Only Student Alone
As indicated on the above experiences process summary table, observation and review are primarily
student teacher oriented. However, centers also provide more of this complete cycle to the early candi-
dates than obtains for this group in the noncenter situation. Another related, apparent trend is the
predominance of the "student alone" category for all early students except for those in the centers.
It is worth noting also that student teachers and cooperating teachers in centers report this
instructional experience process differently. The students-perceive themselves more alone and the
teachers see themselves as providing more complete observation and review cycles than is apparent to
the recipients.
Extent and Kind of instructional Emphasis by Preparatory Stages
Another interesting question in professional preparation is whether there is differentiation or
specialized induction accompanying the assumption of different roles. Specialization has two aspects:
extent and kind of instruction, or training emphasis. It needs to be recalled that Table Ten, page 18,
lista the individual items clustered in the four instructional experiences dimensions. All items
claimed to have received a portion or the entire observation and review cycle ate included. it can be
observed that the extent of reported disparity is greatest between student teachers and the early candi-
dates. The over-all range of experiences starts at 12% for the student teachers and Climbs to 922
while the early candidates begin at 0% and culminate at 53%. That there is a difference in degree of
4' ,"

-24-
training emphasis still leaves open the question about the kind of instruction provided for these two
groups at different stages of professional preparation. When the rank order correlations are computed
for these two groups it appears that there is significant association (all four coefticients are signifi-
cant from zero) between what is provided for pre-student teachers and student teachers.
TABLE EIGHTEEN
Rank Order Correlations of Experiences Claimed
Center Student Teachers and Cooperating Teachers .80
Center Student Teachers and Noncenter Student Teachers .94
All Student Teachers and all Pre-Student Teachers .71
Center Pre and Noncenter Pre-Student Teachers .81
WIMP. Nmim=1.1=.1.M/NINI.
It appears that there is essentially one preparatory program operating for all preservice candidates
in both center and noncenter situations. The instructional content and process emphases in student
teaching seem well established and when other preservice candidates are present they also receive the
benefit of essentially the same set of training experiences albeit to a lesser degree. This is partic-
ularly apparent in the instructional process dimension obtaining in the centers. (See Table Sixteen)
Although the frequency of specific clusters of instructional experiences is significantly lower for
the early group, the training process in the centers only distinguishes them significantly on the com-
plete observed and reviewed cycle. It is as if the centers "know" the process and will deliver it
similarly to the preservice candidates regardless of stage of preparation. When the center and noncenter
early candidates are compared, the contrast clear, favors the centers, which provide significantly
more complete cycles and less "student alone" for this group.
The rank order correlation of the thirty-one items for the early group and the student teachers is
.71 which again underscores the similarity between the training provided to all preservice candidates.
The comparison of the early group in the center and noncenter locations also yield a correlation of
.81. It appears that there is some discrepancy between student teachers and early preservice student
students although the kinds of experiences that are most frequently available - albeit not to the
degree they are available - tend to be quite alike. This essentially similar experiences profile for
the early preservice students and student teachers raises the question of appropriate differentiation
within the field component of the preservice program and deserves sponsor attention.
SUMMARY
This chapter addressed two dimensions of preservice preparation: training practices and instruc-
tional experiences. The training practices included three components: observation, teaching and re-
lated preparatory options and the instructional experiences comprised both content and process with
respect to total number of experiences, instructional strategies, diagnosis and testing, mateLials
preparation and classroom control.
The basic question for this chapter, and for the study, is whether there are significant differ-
ences between the center and noncenter settings on these eight components. It has been shown that
statistically significant differences do obtain for five of these components as reported by student
teachers. Specifically, in the observation, teaching and related preparation the centers provide a
significantly greater Variety of options than is available in the noncenters. The overall magnitude
of the center instructional experiences exceedwthat found in the noncenters and both instructional

-25- BESTCOPY
AVAILABLE
strategies and materials preparation are more frequent in the center setting. In the process mode,
the complete observation and review cycle obtains significantly more in the centers than in the non -
center situations. The centers seem to have richer environments in training practices and provide
a greater number and variety of instructional experiences of essentially the same kind for both
student teachers and early preservice students.
With respect to significant differences among school systems or centers, neither the training
prentices nor the instructional experiences dimensions indicate the existence of 'unique patterns
among the individual system or center sites. However, the entire training practices dimension as
well as the experiences reported with instructional strategies do differentiate in favor of the
elementary preparation over that available on the secondary level.

CHAPTER III
THSERVICE PATTERNS
Relationship Between inservice Experienced and Preservice Delivered:
An important question concerning inservice experiences is whether receiving instruction is
associated with giving. For this study, this question becomes to what degree do cooperating teachers
transmit knowledge acquired from various sources to student teachers. It can be seen from Table
Nineteen that for the only ten pnssible identical items, on which cooperating teachers reported both
inservice receiving and preservice providing data, 60% of the items differed significantly. xg(.01)
INSERVICE OBSERVATIONS
TABLE NINETEEN
Identical Pre and Inservice Experiences as Reported by98 Cooperating/Supervising Teachers in Centers
Question: Is receiving inservice associated with giving preservice instruction?
Percent of Student Percent of Cooperatingitems Teachers Receiving Teachers Receiving
Small Group Instruction 90 47**
Individualization 80 64**
Construct Behavioral Objectives 76 70
Discovery-Inquiry 74 46**
Test Construction 69 36**
Feedback 64 38**
Higher Order Questions 47 46
Microteaching 46 51
Wait Time 29 25
Verbal Interaction Analysis 25 53**
** x2
(.01)
Apparently cooperating teachers do, in part, provide and review experiences for student teachers
based on competencies acquired in inservice instruction. in addition, teachers report significantly
more available experiences for student teachers than were provided to them such as: discovery-
inquiry, feedback, individualisation of instruction, small group instruction and test construction.
There is only one item: verbal interaction analysis on which 52% of the cooperating teachers report
receiving inservice training but only 25% of the students having this preparatory experience. In
sum, student teachers were gainers on nine of the ten identical items. They received the indirect
benefits of cooperating teacher inservice instruction on the nonsignificant items: higher order
questions, microteaching, wait time and behavioral objectives were able to have experiences that
their cooperating teachers lacked on five items which differentiated significantly.
It appears, therefore, that available inservice content to cooperating teachers is only one
source in providing training experiences for novices. More than what is received appears to be
transmitted fur half the experiences. Only with respect to verbal interaction analysis is there
significant loss in transmission. This pattern appears also for the elementary and secondary groups
as well. (See Table Twenty and Twenty-one.)

-27-
TABLE TWENTY
Identical Pre and Inservice Experiences as Reported by49 Elementary Cooperating Teachers in Centers
Questions Is receiving associated with
Items
giving on the elementary level?
Percent of ElementaryStudent TeachersReceiving
Percent of ElementaryCooperating TeachersReceiving
96 51**Small Group Instruction
Individualization 82 67
Discovery-Inquiry 73 48**
Construct Behavioral Objectives 71 65
Feedback 69 38**
Test Construction 59 34**
Higher Order Questions 51 50
Microteaching 42 46
Wait Time 26 23
Verbal Interaction Analysis 26 46**
**x ! (.01)
TABLE TWENTY-ONE
Identical Pre and Inservice Exepriences as Reported by49 Secondary Cooperating Teachers in Centers
Questions Is receiving associated with giving on the secondary level?
Items
Percent of SecondaryStudent TeachersReceiving
Percent of SecondaryCooperating TeachersReceiving
Small Group Instruction 84 42**
Individualization 78 60
Construct Behavioral Objectives 82 71
Discovery-Inquiry 76 47**
Feedback 60* 39 *
Test Construction 80 38**
Higher Order Questions 43 43
Microteaching 52 56
Wait Time 33 29
Verbal Interaction Analysis 24 60**
*X2o (.05)
**X g (.01)
The elementary reports differentiated only on half the ten items. Apparently, individualization
is similarly accessible on the elementary levels to both experienced and beginning personnel. However,
the remaining items: small group instruction, discovery-inquiry, feedback and test construction all
indicate significantly more transmission than what is provided cooperating teachers. Overall, and on
the elementary and secondary levels, there is significant attrition with respect to transmission of
verbal interation analysis. The items differentiating the programs delivered and received are identical

-28-
on the two levels. However, 80% of the secondary students in contrast with 59% of the elementary
trainees receive test construction experience, while there is more small group instruction and feed-
back practice on the elementary level, Both the significantly greater emphasis on instructional and
testing items and the lesser attention to interaction observed throughout may be attributable to a
perception held by teachers about what novices need to practice in contrast with those who design
inservice programs. An alternate explanation is that as a consequence of their on campus training
students arrive with both an interest in, and skill for, engaging in particular instructional
behaviors, which they put to work independent of what has been provided to, or via, their cooperat-
ing teachers. This discontinuity deserves further probing as do the variety of sources and alter-
nate modes that inservice personnel utilize in their personal quest for professional growth.
The responses of center and noncenter instructional leaders concerning the exposure of their
entire staffs reveal interesting contrasts of magnitude and rank order of training emphasis, (See
Table Twenty-Two) There are seven items which favor the centers in amount of exposure reported by
the instructional leaders in these two environments. They are: small group instruction, strategies
for inquiry, taxonomy of objectives, team teaching, video taping, interaction analysis and wait time.
Furthermore, the university is perceived as the source of instruction significantly more in the
centers than in the noncenters for a majority of the inservice experiences. The school system is
reported as providing essentially the same level of inservice exposure in both situations with the
exception of a single item: videotaping which is reported significantly more from this source in
the noncenter setting. In the centers only for two items: human relations and team teaching do
the relative frequencies of school sources exceed those from the campus (and neither of these has
statistical significance). However, in the noncenter environment fourteen of the items
exhibit higher relative frequencies by the school as the source rather than the campus, This is
hardly surprising, in fact, it confirms the existing agreements of the partners for the university's
assumption of inservice responsibilities in the centers while in the noncenters the school system
continues to execute this charge. Self study as a source of inservice appears to be evenly balanlbed
in the center and noncenter environments. The noncenters significantly exceed the centers on discovery-
inquiry while the centers outdo the noncenters on videotaping being provided through self study.
The range of inservice exposure distinguishes the two environments also. The center responses
span a low of 27.9% on wait time to a high of 83.7% on classroom control while the noncenters only range
from 10.2% to 75.5% for the same items. It becomes useful to contrast the rank order of the remain-
ing nineteen items as well. The rank order correlation of the inservice activities is .80, which
suggests considerable similarity of content exposure - albeit differences in sources of instruction.
It is worth noting that videotaping, individualization, small group instruction and interaction analysis
rank significantly higher in the centers than in the noncenters. These items constitute what is here
termed the center inservice training emphasis.
The common inservice activities across the two environments, which do not distinguish on any of
the contrasts contain: criterion referenced test, higher order questioning, feedback, individuali-
zation, use of space, lecture, nondirective communication and test construction. These eight staff
development exposure options appear alike in both center and noncenter settings and are perceived
as emanating from similar Sources according to principals.

TABLE TWENTY-TWO
Percentages of Instructional Leaders in Centers Compared
to Instructional Leaders in
Noncenters Reporting Inservice Instruction Received by Their
Staff Displayed by
Topic and Selected Source of Instruction
Question:
What are most frequent inservice experiences?
SOURCE OF INSTRUCTION
Topic
TOTAL
RESPONSE
UNIV. OF
MARYLAND
SCHOOL
SYSTEM
CENTER
COORD.
N=43
Center
N=49
Non
Center
Center
Non
Center
Center
Non
Center
Center
Classroom Control Strategies
Construct Behavioral Objectives
Construct Criterion
Referenced Test
Diagnostic Procedures
Discovery-Inquiry
Higher Order Question
Human Relations Skills
Feedback
_
Individualization
Instructional Uses of Available
Physical Space
Lecture
Microteaching
Nondirective Communication
Strategies
Small Group Instruction
Strategies for Inquiry
Taxonomy of Educational
Objectives
Team Teaching
Test Construction
Use of Video Tape Recorder
and Playback Equipment
Verbal Interaction Analysis
Wait Time
83.7
79.1
44.2
76.7
65.1
53.5
81.4
53.5
53.5
30.2
58.1
41.9
76.7
53.5
51.2
72.1
51.2
72.1
53.5
27.9
75.5
73.5
38.8
65.3
59.2
46.9
67.3
34.7
65.3
49.9
30.6
40.8
30.6
40.8**
32.7*
30.6*
40.8**
32.7
36.7**
26.5**
10.2*
34.9
37.2
9.3
41.9
23.3
23.3
37.2
14.0
27.9
14.0
11.6
30.2
16.3
30.2
20.9
16.3
16.3
7.0
23.3
27.9
11.6
14.3*
14.3*
10.2
10.2**
6.1*
10.2
16.3*
4.1
12.2
4.1
8.2
4.1**
6.1
6,.1 **
6.1*
10.2
8.2
4.1
6.1*
8.2*
.0*
16.3
30.2
11.6
27.9
20.9
11.6
46.5
11.6
18.6
7.0
2.3
9.3
4.7
16.3
9.3
11.6
20.9 .0
2.3
9.3
4.7
28.6
38.8
8.2
36.7
24.5
20.4
49.0
4.1
30.6
16.3
4.1
20.4
12.2
16.3
6.1
8.2
18.4
8.2
20.4**
14.3 .0
25.6
20.9
9.3
16.3
18.6
16.3
168::
20.9
9.3
4.7
32.6
11.6
23.3
16.3
.
9.3
14.0
2.3
108.:
7.0
SELF
STUDY
Non
Center :
z
Center
Non
Center
32.6
44.9
23.3
40.8
23.3
20.4
32.6
36.7
16.3
34.7*
23.3
20.4
37.2
36.7
18.6
24.5
41.9
38.8
23.3
20.4
7.0
8.2
14.0
16.3
16.3
14.3
32.6
24.5
18.6
16.3
14.0
10.2
39.5
22.4
25.6
18.4
32.6
14.3*
11.6
8.2
11.6
8.2
* Significant Difference (a = .05)
** Significant Difference (a = .01)

-30-
When the responses of center instructional leaders and cooperating/supervising teachers are com-
pared additional patterns emerge. (See Table Twenty - Three) It appears that Instructional leaders
significantly overreport all sources: campus, school and coordinators in contrast with the teachers.
In effect they claim more delivery than is reported as occurring by the staff. At the same time
they underreport teacher self study as a source of instruction for three items, For nineteen of the
twenty-one variables teachers claim self study as the most frequent source and the university as
the preeminent inservice agent for the other two variables; microteaching and interaction analysis,
However, the principals cite the campus as the foremost source of professional growth on eight items,
self study for seven variables and coordinators for a single item: microteaching. When the responses
of instructional leaders are contrasted by level: elementary and secondary, no significant differences
can be observed.
However, contrasting the responses of elementary and secondary cooperat.ing teachers does yield
five statistically significant :ontrast on four variables. (fable Twenty -four) It :mars that
lecture and criterion referenced test are primarily secondary level emphases while classrooN control
and videotaping are preeminently elementary training concerns. With respect to the sources of instruc-
tion both the university and the coordinator are claimed significantly more by the elementary teachers
while the secondary personnel report self study as their chief instructional source. It should be
noted that the school system does not distinguish the two groups on any of the twenty-one variables
and is therefore omitted from the table in the interest of eliminating visual clutter.'
AS one focuses on relative item frequencies across the inservice sources another program related
questions surfaces. To wit, does there appear to be reported differentiation in inservice emphasis
by each source? or, does everybody follow a trend and address the same thing? One way to view this
distinctive inservice emphasis issue is to 'set a 10% difference among the taree sources; center coor-
d4lator, school system and the university as an indicator. Tallying the items with a 10% differential
by instructional leaders and cooperating teachers results in the following:
Number of Items Differing 10% or More by Source
Center Coordinator School System University Total
IL 2 1 11 14
CT 2 5 10 17
Multiplying the three sources by the 21 instructional skills yields 63 potential three-way comparisons.
Although the cooperating teacher perceived differentiation is somewhat greater than that reported by
instructionsL leaders, neither group identified the majority of items as distinct for any me source.
There is some specialization with respect to microteaching and verbal interaction analysis by coor-
dinators and an emphasis on behavioral objectives and human relations through school system inservice.
But there is no clearly apparent functional or programmatic uniqueness among the inservice sources.
There is rather an overlap of current interests independent of source. No single source can be
identified readily as the bearer of specialized knowledge. This presents an area for future policy
and program deliveration for center sponsors,

TABLE TWENTY-THREE
Percentages of Instructional Leaders in Centers Reporting_ Inservice Instruction Received
by Their Staff Compared to Percentages of Cooperating Teachers in Centers Reporting
Inservice Instruction Received Displayed by Topic and Source of Instruction
Question:
What are nost frequent inservice experiences?
TOTAL
RESPONSE
SOURCE OF INSTRUCTION
SCHOOL
SYSTEM
CENTER
COORD.
SELF
STUDY
UNIV. OF
MARYLAND
Tonic
IL (92)
CT (98)
IL
CT
IL
CT
IL
CT
IL
CT
Classroom Control Strategies
83.7
84.7
34.9
22.4
16.3
14.3
25.6
7.1**
32.6
61.2=*
Construct Behavioral Objectives 79.1
83.7
37.2
26.5
30.2
20.4
20.9
6.1**
23.3
31.6
Construct Criterion
Referenced Test
44.2
50.0
9.3
7.1
11.6
5.1
9.3
3.1
23.3
19.4
Diagnostic Procedures
76.7
78.6
41.9
17.3**
27.9
15.3
16.3
6.1
32.6
35.7
Discovery-Inquiry
65.1
65.3
23.3
11.2
20.9
12.2
18.6
3.1**
16.3
29.6
Higher Order Question
53.5
o4.3
23.3
20.4
11.6
9.2
16.3
8.2
23.3
31.6
Human Relation Skills
81.4
78.6
37.2
17.3*
46.5
25.5*
16.3
4.1*
37.2
48.0
Feedback
53.5
60.2
14.0
1' {.3
11.6
11.2
18.6
7.1*
18.6
34.7
Individualization
79.1
Instructional Uses of. Available
80.6
27.9
15.3
18.6
17.3
20.9
4.1**
41.9
39.8
t..2
Physical Space
53.5
67.3
14.0
4.1*
7.0
9.2
9.3
3.1
23.3
39.8
Lecture
30.2
51.0*
11.6
7.1
2.3
5.1
4.7
6.1
7.0
31.6**
Microteaching
58.1
62.2
30.2
24.5
9.3
6.1
32.6
16.3
14.0
23.5
Nondirective Communication
Strategies
41.9
56.1
16.3
16.3
4.7
6.1
11.6
5.1
16.3
30.6
Small Group Instruction
76.7
77.0
30.2
14.3*
16.3
12.2
23.3
2.0**
32.6
51.0
Strategies for Inquiry
53.5
61.2
20.9
12.2
9.3
8.2
36.3
5.1*
18.6
30.6
Taxonomy of Educational
Objectives
51.2
64.3
16.3
16.3
11.6
9.2
9.3
5.0
14.0
24.5
Team Teaching
72.1
70.4
16.3
9.2
20.9
10.2
14.0
8.2
39.5
51.0
Test Construction
51.2
66.3
7.0
9.2
.0
7.1
2.3
4.1
25.6
33.7
Cr!m
ctrz
Use of Video Tape Recorder
.4c
and Playback Equipment
72.1
79.6
23.3
24.5
2.3
5.1
30.2
26.4
32.6
25.5
Ze.
Verbal Interaction Analysis
53.5
60.2
27.9
25.5
9.3
6.1
18.6
15.3
11.6
18.4
.3=2.
Wait Time
27.9
35.7
11.6
8.2
4.7
4.1
7.0
6.1
11.6
16.3
fOgo
rv",
* Significant Difference (a = .05)
IL = Instructional Leaders
** Significant Difference (a = .01)
CT = Cooperating Teachers

-32»
TABLE TWENTY-FOUR
Percent of Elementary Cooperating Teachers in Centers Reporting.Inservice Instruction Received Compared to SecondaryCooperating Teachers in Centers by Four Topics and
Three Sources of Instruction
Respondents
ClassroomControl
Baia
Construct CriterionReferenced Test
Lecture Video-
lain&
Elementary Teachers 89.8 38.8* 38.8* 81.6
N*52
Secondary Teachers 79.6 61.2* 63.3* 77.6
Nm46
University of Maryland
Elementary Teachers 36.7 6.1 6.1 30.6
Secondary Teachers 8.2 8.2 8.2 18.4
Center Coordinators
Elementary Teachers 14.3** 2.0 10.2 32.7**
Secondary Teachers 0.0** 4.1 2.0 8.2**
Self Study
Elementary Teachers 57.1 16.3 18.4* 22.4
Secondary Teachers 65.3 22.4 44.9* 28.6
* p<.05
** p.01
SUMMARY
In the inservice available, as in the preservice exposure, the centers provide a richer environ-
ment in which more sources provide significantly more instruction on specific instructional approaches.
Both what is transmitted through inservice and what is available through other means is made accessible
to trainees. On the whole cooperating teachers on the elementary and secondary levels provide similar
exposure for student teachers. While there are a few differences in inservice content according to
level of schooling the majority of the exposure provided appears not to distinguish between the
elementary and secondary personnel. Nor does there appear to be a recognizable, distinct, content
emphasis by various inservice sources. However, for the majority of the inservice experiences the
university is perceived as the source of instruction significantly more in the centers than in the
noncenters.

CHAPTER IV
SUPERVISORY PATTERNS
Findings Associated with Question Four » Who Holds Conferences with Student Teachers? and QuestionFive - Does the Perceived Quality of Supervisory Encounters Vary fletwee6 Providers and Recipients?
SECTION ONE; CONFERENCING AVAILABLE
The frequency and percentage of different conference sources reported by random samples of student
teachers assigned to center and noncenter settings are reported in Table Twenty-five. Most student
teachers in centers report conferences with one of four sources; cooperating teacher only; center
coordinator only; cooperating teacher and center coordinator only; and cooperating teacher, center
coordinator, and university supervisor. A nonsignificant chi square (X2) is observed with the
frequencies of these four categories of personnel being found equally often as conference sources.
Whether these are the principal patterns of conferencing one might expect in a teacher education center
setting is an open question. It is of some interest though, to observe that the center coordinator
acting alone does assume the role of one of the four principal conference sources for student teachers.
Two sources account for most of the noncenter student teacher conferences; cooperating teacher
only and cooperating teacher together with university supervisor. A nonsignificant X2is observed with
these two categories. Whether this is the expected pattern in a noncenter setting is another open
question.
A 'variety of queries arises from these data. One rather natural question is whether the
presence of a supervisory conference conducted by any professional, or combination of professionals,
is independent of student teaching assignment in a center or noncenter. Table Twenty-six shows the
2 by 2 contingency tchle and computed X2 value used to answer this question. The 0.72 value is not
significant. The data support the null hypothesis that presence of a supervisory conference is in-
dependent of student teaching assignment setting. Hence, the reported pattern of the presence, or
absence, of a conference is alike in the centers and noncenters.
TABLE TWENTY-ME
Number of Different Conference Sources Reported by Random Samples of Student Teachersin Centers and Noncenters
Source ,Center (N=96) Noncenter (N=20)Frequency in % Frequency in %
Cooperating Teacher Only 20 21 15 52
Center Coordinator Only 17 18 n.a. n.a.
University Supervisor Only 3 3 0 0
Cooperating Teacher, Center Coordinatorand University Supervisor 15 16 1 3
Cooperating Teacher andCenter Coordinator Only 22 23 n,a. n.a.
Cooperating Teacher andUniversity Supervisor Only 7 7 12 41
University Supervisor andCenter Coordinator Only 7 7 n.a. tiotio
No Conference Leader S 5 1 3
n.a. 0 not appropriate since no coordinators are assigned
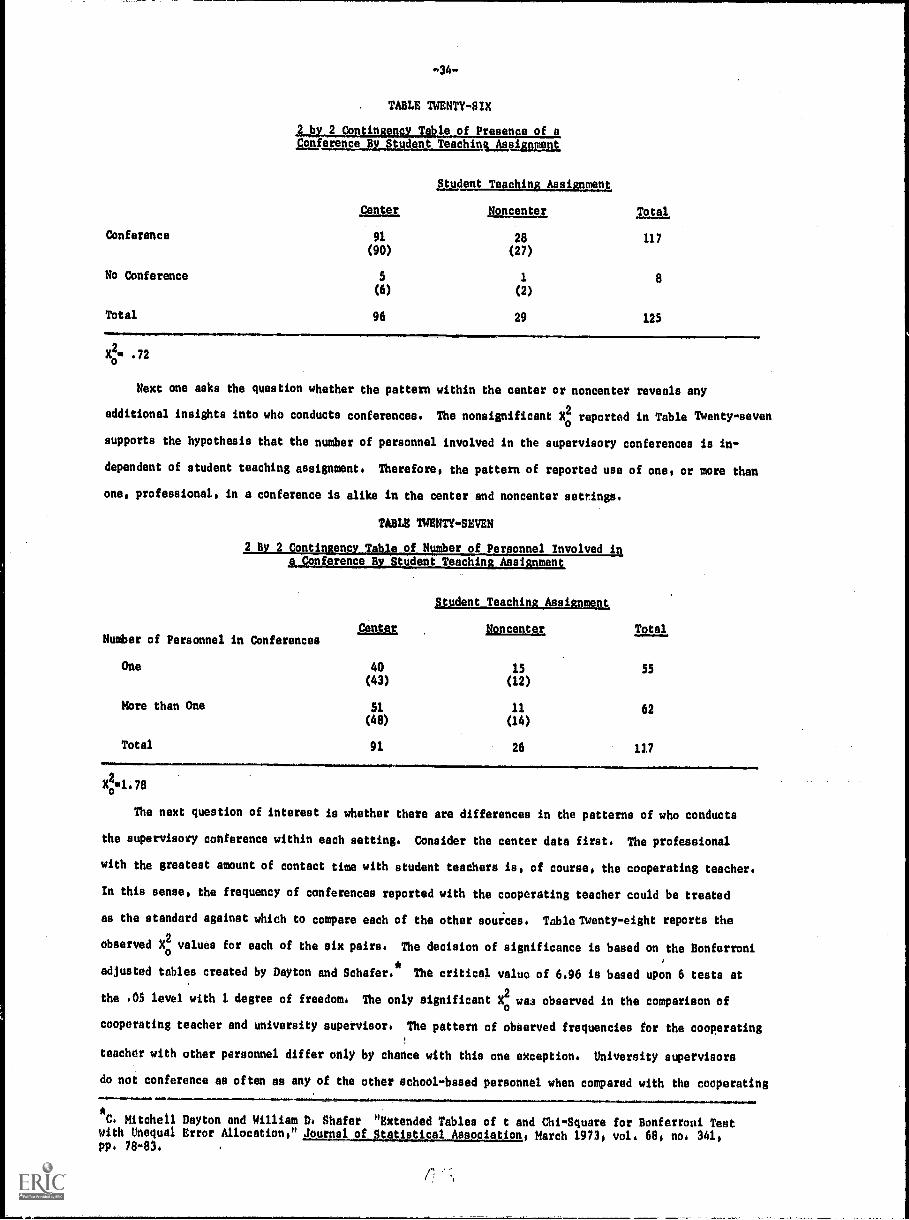
34-
. TABLE TWENTY-SIX
2 by 2 Contingency Table_of Presence of aConference By Student Teaching_glaignment
Center
Student Teaching Assignment
Totaloncenter
Conference 91 28 117(90) (27)
No Conference 5 1 8(6) (2)
Total 96 29 125
Xo
2el .72
Next one asks the question whether the pattern within the center or noncenter reveals any
additional insights into who conducts conferences. The nonsignificant X02
reported in Table Twenty-seven
supports the hypothesis that the number of personnel involved in the supervisory conferences is in-
dependent of student teaching assignment. Therefore, the pattern of reported use of one, or more than
one, professional, in a conference is alike in the center and noncenter settings.
TABLE TWENTY-SEVEN
2 By 2 Contingency Table of Number of Personnel Involved in
Total
a Conference By Student Teaching Assignment
Number of Personnel in ConferencesCenter
Student Teaching Assignment
Noncenter
One 40 15 55(43) (12)
More than One 51 11 62(48) (14)
Total 91 26 117
X2ul.78
The next question of interest is whether there are differences in the patterns of who conducts
the supervisory conference within each setting. Consider the center data first. The professional
with the greatest amount of contact time with student teachers is, of course, the cooperating teacher.
In this sense, the frequency of conferences reported with the cooperating teacher could be treated
as the standard against which to compare each of the other sources. Table Twenty-eight reports the
observed X2values for each of the six pairs. The decision of significance is based on the Bonferroni
adjusted tables created by Dayton and Schafer.* The critical value of 6.96 is based upon 6 tests at
the .05 level with 1 degree of freedom. The only significant Xo
2was observed in the comparison of
cooperating teacher and university supervisor. The pattern of observed frequencies for the cooperating
teacher with other personnel differ only by chance with this one exception. University supervisors
do not conference as often as any of the other school-based personnel when compared with the cooperating
*C. Mitchell Dayton and William D. Shafer "Extended Tables of t and Chi-Square for Bonferroni Test
with Unequal Error Allocation," Journal of Statistical Association, March 1973, vol. 68, no. 341,pp. 78-83.
r

-35-
teacher as a standard. One explanation for this one significant Xo
2is that those already present
on a continuing basis and readily available for conferences have significantly more opportunities
for engaging in such supervisory activity than the campus-based personnel, whose presence and par-
ticipation occurs by special arrangement. In addition, it may also be that supervisors usually
conference together with other personnel such as the cooperating teacher.
TABLE TWENTY-EIGHT
Conference Source Comparisons for Student Teachers in Centers
X2
Cooperating Teacher - Center Coordinator .24
Cooperating Teacher - University Supervisor 12.56
Cooperating Teacher - Center Coordinatorand Cooperating Teacher .1
Cooperating Teacher - Cooperating Teacherand University Supervisor 6.26
Cooperating Teacher - Center Coordinatorand University Supervisor 6.26
Cooperating Teacher - Center Coordinator, .72
University Supervisor, andCooperating Teacher
Decision
n.s.
sig.
n.s.
n.s.
n.s.
n.s.
n.s. not significantsig. significant with p<.05
A similar strategy was employed in examining the noncenter conference source data. Table
Twenty -nine reports these findings. Again, the university supervisor appears with significantly smaller
conferencing frequency when compared with the cooperating teacher. The nonsignificant comparison
of cooperating teacher against cooperating teacher and university supervisor continues to support the
conjecture that supervisors do not conference alone, but conference together with another professional.
TABLE TWENTY-NINE
Conference Sources for Student Teachers in Noncenters
2
Conference Source PairsXo
Decision
Cooperating Teacher-University Supervisor 15 sig.
Cooperating Teacher-University Supervisorand Cooperating Teacher .34 n.s.
n.s.. not significantsig. n significant with p.05
Is elementary-secondary level independent of the number of personnel who conference with a
student teacher? Table Thirty shows a nonsignificant X: value. Consequently, for center student
teachers, the pattern of conference frequencies with one, or more than one, professional is the same
for elementary and secondary level assignments.
Table Thirty-one shows the data for noncenter student teachers related to the same question of
number of personnel involved by level. Again, the result is nonsignificant. Hence the pattern of
number of professionals involved in conferences by elementary and secondary levels is nonsignificant
and does not differ for centers and noncenters.

-36-
TABLE THIRTY
2 By 2 Contingency Table of Number of Personnel Involved in
a Conference By Elementary and Secondary Level Within Centers
Level
Number of Personnel in Conferences
One
More than One
23
(22)
26
(27)
49
Elementary Secondary
17
(18)
25
(24)
42
40
51
91
0.19
TABLE THIRTY-ONE
2 By 2 Contingency Table of Number of Personnel Involved in
---Yeld8eoondaraCcmfer""BEl"Level WitIVAJDETWAL1
LevelElementary Secondoty.
Number of Personnel in Conferences
One
More than One
8 7 15(9) (6)
9 4 13(8) (5)
17 11 28
.61
The relative frequency of conferences conducted by one or more professionals does not differ for
elementary and secondary levels. But, does the previous pattern for paired comparisons with the
cooperating teacher also characterize the elementary level apart from the secondary level? Table
Thirty-two summarizes the paired comparisons for the elementary center data. No significant Xo
are observed. All paired comparisons with the cooperating teacher frequency are chance differences.
TABLE THIRTY-TWO
Conference Source Pairs
Conference Source Comparisons for Student Teachersin Elementary Center Assignments
X2
0
Cooperating Teacher - Center Coordinator
Cooperating Teacher - University Supervisor
Cooperating Teacher - Center Coordinatorand Cooperating Teacher
Cooperating Teacher - University Supervisorand Cooperating Teacher
Cooperating Teacher - Center Coordinatorand University Supervisor
Cooperating Teacher - Ceater Coordinator,
University Supervisor, and Cooperating Teacher
.12
3.6
3.2
3.6
1.34
2.28
Decision
n.s.
n.s.
n.s.
n.s.
n.s.
n.s.
Table Thirty -three reports the finding for those student teachers with secondary center
assignments. One significant difference is observed with the cooperating teacher and university
supervisor comparison. Again, this result may be explained in terms of university supervisors
choosing to conference with the student teacher and another professional rather than working alone.

Conference Source Pairs
-37-
TABLE THIRTY-THREE
Conference Source Cou.arisons for Student Teachersin Seconder Center Assignments
x2
Cooperating Teacher - Center Coordinator
CooperAing Teacher - University Supervisor
Cooperating Teacher - Center Coordinatorand Cooperating Teacher
Cooperating Teacher - University Supervisorand Cooperating Teacher
Cooperating Teacher - Center Coordinatorand University Supervisor
Cooperating Teacher - Center Coordinator,and University Supervisor, andCooperating Teacher
4
9.3
BESTCOPY
AVAILABLE
Decision
n.s.
sig.
2.88 n.s.
2.88 n.s.
5.4 n.s.
0 n.s.
Sumnaa
Four conference sources account for 81% of all supervisory conferences conducted in the teacher
education centers. These four sources are the cooperating teacher, acting alone; the center
coordinator, acting alone; the cooperating teacher and center coordinator, acting together; and the
cooperating teacher, center coordinator, and university supervisor, acting together. The observed
frequencies of the four categories are not significantly different.
Part of the role of the center coordinator does emerge from these data. The center coordinator
acting alone as a supervisory conference leader is one of the four largest conference sources.
Coordinators also clearly participate as conference sources with two or more partners. This specially
designated member of both the University and the school system is one of the active sources of
supervisory conferences.
The pattern of presence or absence of supervisory conferences is alike for centers and non-
centers. Supervisory conferences occur no more frequently in centers. When supervisory conferences
do occur, the pattern of using one professional, or a combination of professionals, to conduct
supervisory conferences is alike in centers and noncenters. The use of combinations of personnel to
conduct supervisory conferences is no more likely in the center setting.
The pattern of presence or absence of supervisory conferences is alike for elementary and
secondary school level assignments. Supervisory conferences occur no more frequently at the elementary
level than at the secondary level. When supervisory conferences do occur, the pattern of using one
professional or a combination of professionals to conduct supervisory conferences is alike at the
elementary and secondary levels. The use of combinations of personnel to conduct supervisory con-
ferences is no more likely at the elementary level than at the secondary level.
When patterns of personnel involved in confereocing are examined, the only significant difference
observed is in the cooperating teacher - university supervisor comparison. The university supervisor
conferencing frequency is significantly smaller. This result appeared for both centers and noncenters
as well as on the secondary level. Therefore, the composition of personnel involved in supervisory
conferences are very much alike for student teaching assignment and student teaching level.
-38-
SECTION TWO; CONFERENCING PROCESS
In addition to the observed frequency and participation pattern in confereneing, this component
of teacher preparation has a process dimension as well. There has been an attempt to probe not just
the observed pattern of conferencing but the perceived impact of supervisory behavior as well. This
study assumes that supervision is a form of teaching and particularly that teaching fosters re-
flective activity.
The instrument used for eliciting supervisory experiences data was based on Solomon's work
developed for classifying teacher encounters.*
In these studies the questionnaire was concurrently
validated by college student gains in academic achievement. The center study utilized an abridged
and adapted form of the instrument. A random sample of center and noncenter student teachers,
cooperating teachers, center coordinators and university supervisors also participated in responding
to this portion of the survey.
Five factors or conferencing dimensions were obtained and are identified in Table Thirty-four.
Subscores were computed from the items within each factor. It should be noted that the student
teachers are reflecting their perceptions of the conference leader(s), while the remaining samples
are reporting upon their own supervisory behaviors.
The findings from comparisons among student teacher and cooperating teacher, centers, elementary
and secondary level, as well as school systems suggest that these various populations perceive the
conferencing dimensions alike. A significant difference emerges on factor four, participation-
nonparticipation, with respect to the elementary-secondary levels. A significant difference is
observed for student teachers and for cooperating teachers on this dimension. In both instances,
the greater means are observed for the secondary level samples. Having unsolicited comments of
students serve as conference material, engagement in conference leader - student teacher discussion
on general problems and pursuit of new and unexpected events appears to be more frequent on the
secondary level accordi .; to both conference providers and recipients. Such participation suggests
that there is a seeming unpredictability characteristic of the conference process in contrast with
those on the elementary level. Furthermore, for the cooperating teacher group only, factor two,
task and person attentive versus ignoring, also shows the secondary exceeding the elementary personnel.
Demonstration and practice in use of analysis, asking questions about subject matter, changes in
presentation, expression of opinion and encouragement of dramatization appear to be more frequent in
secondary conferences than in elementary ones according to the cooperating teachers.
One explanation for these findings may be contained in the nature of the items constituting
the factors. It may simply be that such activities are more common in conferencing at the secondary
level with the multiplicity and diversity of courses. It is also possible that secondary conferences
are more attentive and participatory than elementary ones by virtue of the more unpredictable
adolescent environment in which candidates function. More autonomous, independent behavior and
greater content emphasis, characteristic of secondary school settings in general, appear to be felt
in the supervisory conference situation as well.
In further summary, although the frequency of conference contacts does not differ by level, the
quality of confereneing with respect to participation and attentiveness is distinguishable by level
of schooling. However, those engaged in direct contact through supervisory encounters perceive
conferencen similarly,
ASolomon et al, op. cit.

-39-
TABLE THIRTY-FOUR
SUPERVISORY PROCESS MEASURE
Factor One: Student - Teacher and Content Centered
Item Loading Description
29 .72389 Listens to students attentively
27 .69806 Expresses approval of students' work
26 .63930 Clear and understandable
30 .61262 Treats students as equals
31 .55418 Well organized presentations
32 .53717 Students gain important principles
20 .49715 Ends discussions prematurely
25 .46623 Depersonalized criticism
22 .46562 Demonstrates use of methods of analysis
14 .44723 Questions about students' individual experiences
21 .40912 Encouragement of students' contributions
11 .36343 Protecting behavior
16 .32117 Posed general problems as discussion topics
Factor Two: Person and Task Attentive - Ignoring
23 .57046 Students practice use of methods of analysis
15 .55052 Asked questions about subject matter
22 .55048 Demonstrates use of methods and analysis
28 .52927 Make changes in presentation of material
19 .46267 Continuation of incomplete discussions
17 .45949 Expressed opinion about material
24 .4500$ Encouragement of students dramatization of conceptsand problems
13 .38458 Looked for student reaction
20 .34789 Ends discussion prematurely
18 .33558 Used work of student as bases for discussion
16 .32287 Posed general problems as discussion topics
Factor Three: Permissiveness - Control
3 .59820 Amount of teacher lecture
10 .55263 Semester shift from discussion to lecture
7 .47548 Within conference lecture sequence
12 .32343 Limit discussion to relevant topics
Factor Four: Participatory - NenparticipatorY
4 .62075 Students' unsolicited comments
5 .48151 Tencher-student discussions
6 .37233 Shift between lecture and discussion
1 .36049 Followed up new and unexpected topics
16 .35427 Posed general problems as discussion topics
Factor Five: Discussion - Lecture
9 .75342
8 .49501
Semester shift from mostly lecture to discussion
From fairly open discussion to lecture

CHAPTER V
LEVELS OF PROFESSIONAL CONCERNS
Findings Associated with Question Six: What are the Differences in the Levels of Concerns for Pupils,Teacher Role and Work Situation_mong Various EducaqpnalPersonnel?
Frances Fuller of the University of Texas has hypothesized that teachers pr)gress through
developmental stages as they becore part of the profession.* Initially utilizing open-ended
responses and subsequently, using a structured 56 item Likert-type check list, she and her colleagues
have identified three professiona3 concerns factors.**
The first of these is concern for students,
(impact), the second is concern for rode of the teacher (self) and the third is concern for
situation (task).
The Maryland study utilized the Fuller instrument, the same factor analytical procedures, but
included a wider range of professional personnel than had been involved in the Texas sample. The
Maryland population, (N447), ranged from early preservice students to principals and included student
teachers, cooperating teachers, university supervisors and center coordinators as well. Despite the
wider role functions in the sample, the solutions, especially on the first two factors, were ex-
tremely close to the Texas findings with 92% of the items on factor 1 and 89% on factor 2 being the
same. In addition, 74% of the items on factor 3 were clustered similarly as well. This factor has
been renamed "work situation" to fit the particular constellation of items obtained. Table Thirty-
five lists the item, loading and description for each of the three factors of the "concerns" measure.
TABLE THIRTY-FIVE
CONCERNS MEASURE
Factor One - Concern for Students
?tem Loading Description
47 .72683 Guiding students toward intellectual and emotional growth(46)
24 .70801 . Diagnosing student learning problems(23) Diagnosing student teaching problems
22 .70331 Meeting the needs of different kinds of students(21) Meeting the needs of different kinds of student teachers
53 .70261 Whether each student is getting what he needs(52)
33 .67618 Whether students can apply what they learn(32) Whether student teachers can apply what they learn
55 .66945 Recognizing the social and emotional needs of students(54) Recognizing the social and emotional needs of student teachers
32 .65330
(31)
Adapting myself to the needs of different studentsAdapting to the needs of different studentsAdapting myself to the needs of different student teachers
30 .60916 Challenging unmotivated students(29) Challenging unmotivated student teachers
* Frances F. Fuller "Concerns of Teachers: A Developmental Conceptualization" American EducationalResearch Journal, VI (March 1969), pp. 209-226.
* *The current instrument with 50 item- ani the most recent conceptualization is Gary D. Borichand Frances F. Fuller Teacher Concerns Checklist: An Instrument for Measuring Concerns for Self,Taski_ and Impact,. Research and Deve', .mint Center for Teacher Education, The University of Texasat Austin, 1974. The Texas concerns ,bels are given in parentheses above.
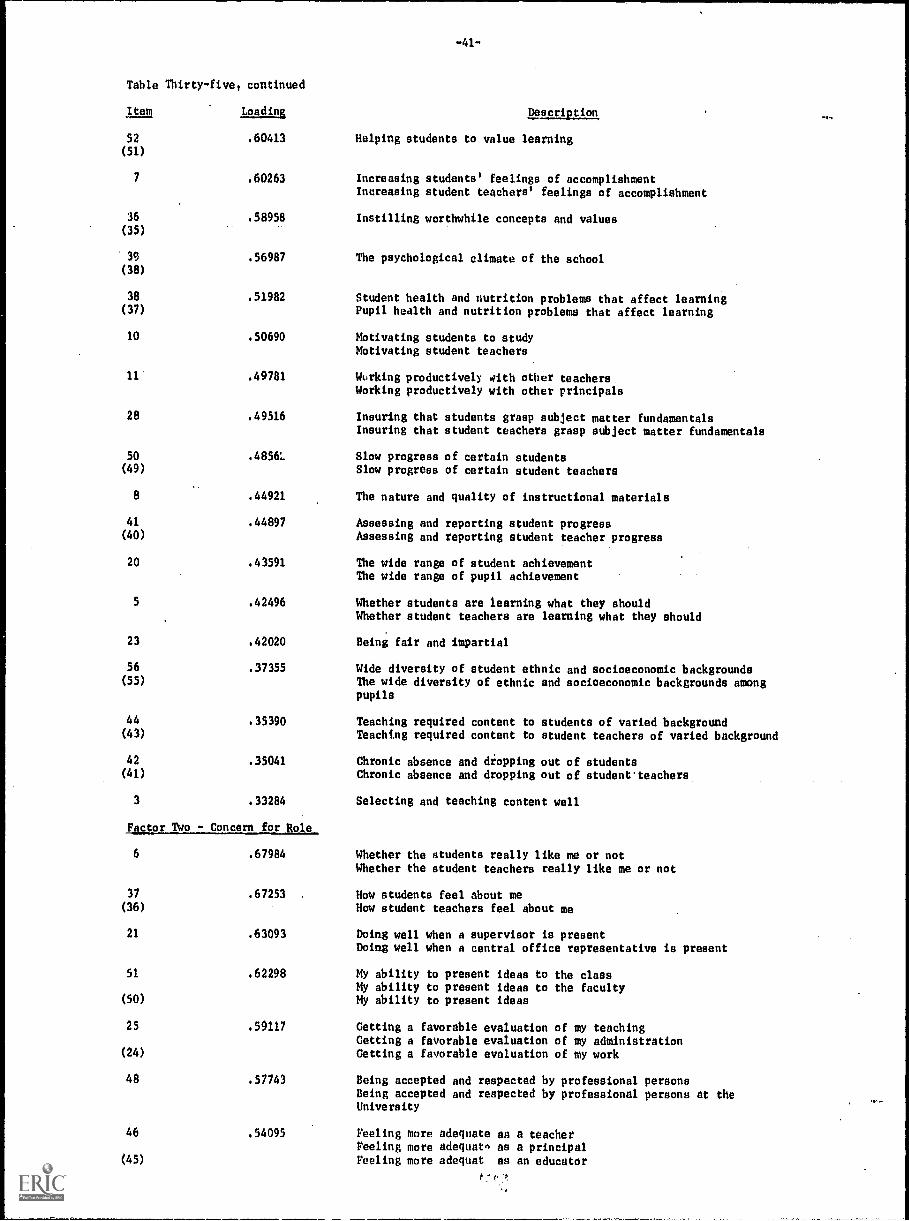
-41-
Table Thirty-five, continued
Item Loading Description
52 .60413 Helping students to value learning(51)
7
36
(35)
.60263 Increasing students' feelings of accomplishmentIncreasing student teachers' feelings of accomplishment
.58958 Instilling worthwhile concepts and values
3c3 .56987 The psychological climate of the school(38)
38 .51982 Student health and nutrition problems that affect learning(37) Pupil health and nutrition problems that affect learning
10 .50690 Motivating students to studyMotivating student teachers
11
28
.49781 Working productively with other teachersWorking productively with other principals
.49516 Insuring that students grasp subject matter fundamentalsInsuring that student teachers grasp subject matter fundamentals
50 Slow progress of certain students(49) Slow progress of certain student teachers
8 .44921 The nature and quality of instructional materials
41 .44897 Assessing and reporting student progress(40) Assessing and reporting student teacher progress
20
5
23
.43591 The wide range of student achievementThe wide range of pupil achievement
.42496 Whether students are learning what they shouldWhether student teachers are learning what they should
.42020 Being fair and impartial
56 .37355 Wide diversity of student ethnic and socioeconomic backgrounds(55) The wide diversity of ethnic and socioeconomic backgrounds among
pupils
44 .35390 Teaching required content to students of varied background(43) Teaching required content to student teachers of varied background
42 .35041 Chronic absence and diopping out of students(41) Chronic absence and dropping out of student teachers
3 .33284
Factor Two - Concern for Role
6 .67984
Selecting and teaching content well
Whether the students really like me or notWhether the student teachers really like me or not
37 .67253 How students feel about me(36) How student teachers feel about me
21 .63093 Doing well when a supervisor is presentDoing well when a central office representative is present
51 .62298 My ability to present ideas to the classMy ability to present ideas to the faculty
(50) My ability to present ideas
25 .59117 Getting a favorable evaluation of my teachingGetting a favorable evaluation of my administration
(24) Getting a favorable evaluation of my work
48 .57743 Being accepted and respected by professional personsBeing accepted and respected by professional persons at theUniversity
46 .54095 Feeling more adequate as a teacherFeeling more adequate as a principal
(45) Feeling more adequat as an educator
t.-(.
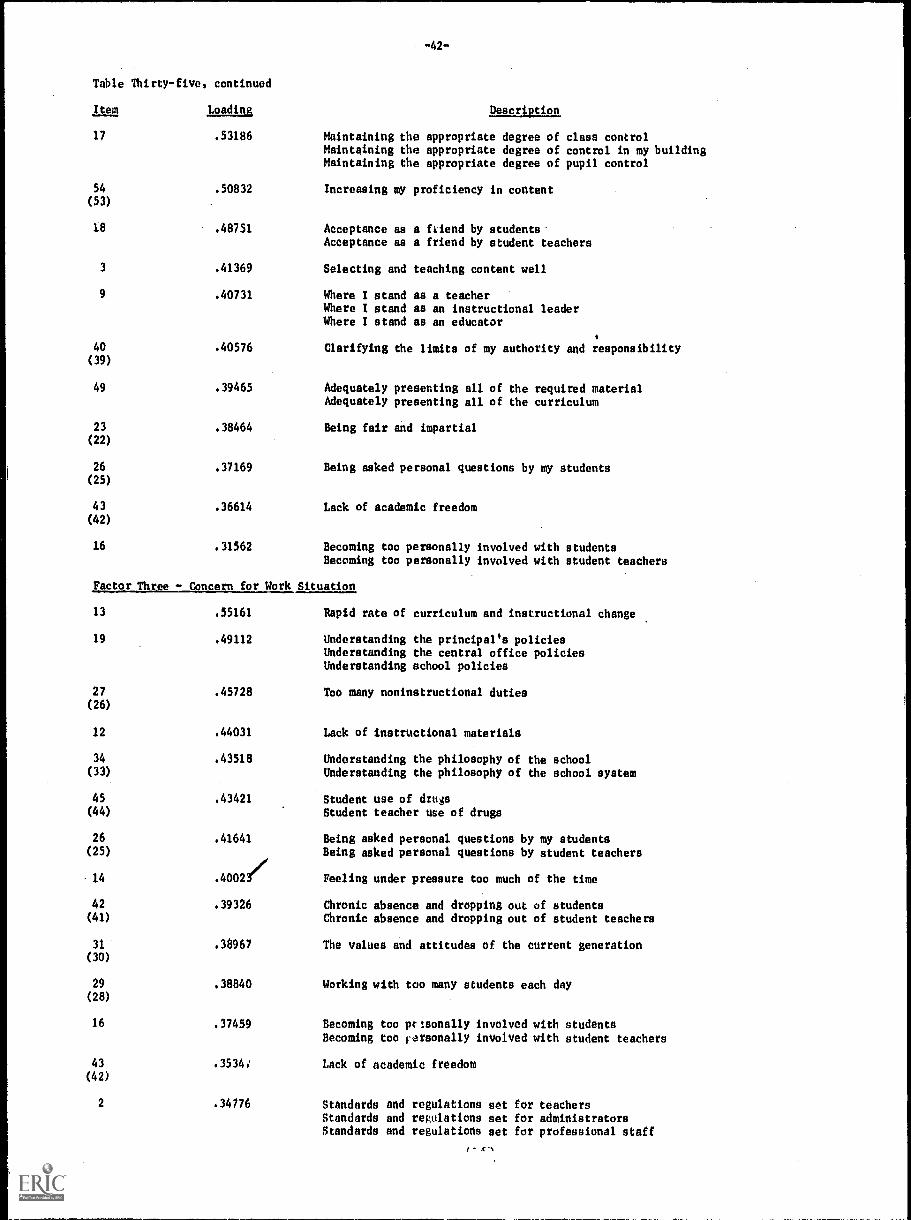
-42-
Table Thirty-five, continued
Item Loading Description
17 .53186 Maintaining the appropriate degree of class controlMaintaining the appropriate degree of control in my buildingMaintaining the appropriate degree of pupil control
54 .50832 Increasing my proficiency in content(53)
18 .48751 Acceptance as a friend by studentsAcceptance as a friend by student teachers
3
9
40
(39)
.41369 Selecting and teaching content well
.40731 Where I stand as a teacherWhere I stand as an instructional leaderWhere I stand as an educator
.40576 Clarifying the limits of my authority and responsibility
49 .39465 Adequately presenting all of the required materialAdequately presenting all of the curriculum
23 .38464 Being fair and impartial(22)
26 .37169 Being asked personal questions by my students(25)
43 .36614 Lack of academic freedom(42)
16 .31562 Becoming too personally involved with studentsBecoming too personally involved with student teachers
Factor Three - Concern for Work Situation
13
19
.55161 Rapid rate of curriculum and instructional change
.49112 Understanding the principal's policiesUnderstanding the central office policiesUnderstanding school policies
27 .45728 Too many noninstructional duties(26)
12 .44031 Lack of instructional materials
34 .43518 Understanding the philosophy of the school(33) Understanding the philosophy of the school system
45 .43421 Student use of drugs(44) Student teacher use of drugs
26 .41641 Being asked personal questions by my students(25) Being asked personal questions by student teachers
14 .4002/' Feeling under pressure too much of the time
42 .39326 Chronic absence and dropping out of students(41) Chronic absence and dropping out of student teachers
31 .38967 The values and attitudes of the current generation(30)
29 .38840 Working with too many students each day(28)
16 .37459 Becoming too personally involved with studentsBecoming too rarsonally involved with student teachers
43 .3534 Lack of academic freedom(42)
2 .34176 Standards and regulations set for teachersStandards and regulations set for administratorsStandards and regulations set for professional staff
t X-%

Table Thirty-five, continued
Item Loading
17
15
-43-
Description
BES1 COPY AVAILABLE
.34117 Maintaining the appropriate degree of class controlMaintaining the appropriate degree of control in my buildingMaintaining the appropriate degree of pupil control
.33352 Frustrated by the routine and inflexibility of the situation
40 .32958 Clarifying the limits of my authority and responsibility(39)
20 .31437 The wide range of student achievementThe wide range of pupil achievement
46 .31776 Feeling more adequate as a teacherFeeling more adequate as a principal
(45) Feeling more adequate as an educator
Definition of the Concerns Measures
Four scores were computed from the concerns measure; a total score, and a score for each of
the three factors. The four measures were first examined independent of location for each of the
following populations: student teacher, cooperating teacher, university supervisor, instructional
leader, center coordinator, and early preservice student.
Data Analysis Strategy
A two part data analysis strategy was planned. The first strategy was to analyze the data for
all groups combined into a total score. The total score analysis is followed by an analysis
of the center data, then the noncenter data, then the elementary level, and finally the secondary
level.
For each significant F observed in any of the five data analyses of part one, two planned
orthogonal contrasts are conducted: one simple and one complex. The simple contrast is student
teacher versus cooperating teacher. This might be characterized as a comparison of the two groups
most directly involved in day to day classroom instruction. The planned.complex contrast was
student teacher and cooperating teacher versus university supervisor, instructional leader and
center coordinator. These might be characterized as the direct classroom teacher groups compared
with those somewhat removed from direct classroom responsibility. It WAS further decided to conduct
post hoc comparisons on other category pairs using the Scheffe procedure.*
Part two compares center and noncenter, elementary and secondary, school systems, and centers
within each of the populations sampled including student teachers, cooperating teachers, university
supervisors, instructional leaders, center coordinators, and early preservice students. Again, the
same four "Concerns" measures were analyzed.
Part One Data
Table Thirty-six summarizes the findings for the four "Concerns" measures following the above
plan outlined as the part one data analysis.
Student Teacher-Cooperating Teacher Contrast: For all samples the student teacher - cooperating
teacher planned contrast exhibits a marked pattern of significant results indicating higher scores
for the student teacher on factor two - concern for role. One possible explanation for these
*Henry Scheffe The Analysis of Variance, Neon York: Wiley, 1959 and C. Dayton Mitchell, The. Design
of Educational Experiments, New York: McGraw -Hill, Inc., 1970, p.48.

-44-
results is that student teachers are simply more conscious of role as teacher which they are be-
ginning to assume than are experienced teachers such as cooperating teachers,
TABLE THIRTY-SIX
AN ANALYSIS OF TI! YOUR MEASURES ON THE CONCERNS INSTRUMENT FOR THETOTAL SAMPLE, STUDENT TEACJIING ASSIGNMENT, AND INSTRUCTIONAL LEVEL
Sample Measure- F 4T - CT ST + CT - ScheffeConcerns Overall Contrast US + IL + CC Post Hoc
Contrast Comparisons
Total Total Score S S> S>
_
CC<PREsample Factor One S NS S> US<CT,IL,PRE,ST
Factor Two S S> S> CC<US,ST,PREIL<ST,PRE
Factor Three CC<ST, PRE,US
Center Total Score S S> S5 CC<PREFactor One S NS S>Factor Two S S> S> CC<PREFactor Three S S> 5> CC<ST,PRE
CC,CT,IL<PRE
Noncenter Total Score NS NS NSFactor One NS NS S5Factor Two S S> NS IL<US,ST,PRE
IL,CT<ST,PREFactor Three S NS NS
Elementary Total Score S S> S> CC<PREFactor One S NS S5 US<PRE,STFactor Two S S> S> CC<ST,PREFactor Three S S> S> CC<ST
CC,IL,CT<PRE
Secondary Total Score S S> NSFactor One NS N5 NSFactor Two S S> D> CC<PRE,STFactor Three S S> NS
System Total Score S
Factor One NSFactor Two S
Factor Three S System 3>System 5
S se Statistically significant Abbreviations: > indicates value directionNS* Not statistically significant CC center coordinator according to order in column
CT * cooperating teacher heading or groups in/I, 0 instructional leader
. post hoc comparisonPRE* early preservice studentST 0 student teacherUS n university supervisor
For the same contrast and for all sampIns,,a nonsignificant result is reported for factor one -
concerns for students. This result might be explained by observing that both student teacher and
cooperating teacher are immediately involved with students and hence one would expect them tt, have
equivalent levels of concern for students.
Again for the same contrast, but with the exception of the noncenter sample, the student
teacher scores are significantly higher than the cooperating teacher on the factor three measure
concern for work situation as well as for the total score on the concerns measure. The factor three
finding might be explained by observing that student teachers are mote concerned with trying to
comprehend the rules and regulations of the work situation than are cooperating teachers who are
knowledgeable about the work environment. The significant findings on factors two and three could
Very well account for the significant total score result.

In addition, the five school systems with the largest number of survey participants exhibit
significant overall differences an factors two, three and total. However, only factor three, work
situation, distinsuishes any pair of systems and interestingly finds the urban setting indicating
higher concern in this area than is shown by one of the suburban systems.
Complex Contrast
The total population shows a significant result for each of the three factor measures and the
total "Concerns" measure with the student teacher and cooperating teacher concerns pooling being
higher. The elementary and center samples show the same results and in the same direction. These
findings suggest that greater concern for these specified aspects of teaching; student, teacher
role, work situation and overall is likely to be shown by those closest to direct classroom contact.
Individual group contrasts tend to support this closeness conjecture with student teachers, cooperat-
ing teachers and the early preservice students reporting significant post hoc results over the other
personnel.
TABLE THIRTY-SEVEN
AN ANALYSIS OF THE POUR MEASURES OF THE CONCERNS INSTRUMENT FORCENTER-AONCENTER, ELEMENTARY-SECONDARY, SCHOOL SYSTEMS, AND CENTERS
BY EACH POPULATION SAMPLED
COMPARISONS POPULATIONSStudent
Teachers
CooperatingTeachers
University Instructional CenterSupervisors Leaders Coordinators
PreserviceStudents
Elementary -Secondary
S> NSNS NS
S>
NS
NS
NS
NS
NSS>
NSNSNS
NS
NS
Center -Noncenter
NS NSNS NS
NS
NS
NS
NSNSNS
NS
NS
NS
NS
NS
NS
Systems
Post hoc Scheffe
NS NS
NS ,NS
NS
NS
NS
NS
NS S
S S
Fee. 2, 5 :6,7
Fee. 3, 5(6Total 5(6,7
Centers NS NSNS NS
S
S
S
S
NSNS
NS
NS
no post hocsignificantfindings
Placement of factor score results in the table follows the patternindicated in the box. Where the greater than sign,>, is used itindicates direction according to the order of the category label.
part Two Data
Table Thirty-seven summarizes the findings for the four "Concerns" measures following the plan
outlined as the part two data analysis.
Center Noncenter Dpca Analysis
No significant differences emerge for the center-noncenter comparison category within any of
the populations for which the test is possible.
Elementary_- Secondary Data Analysis.
The most readily interpreted finding above is the statistically significant; higher concern for
students registered by all elementary student teachers and elementary cooperating teachers in

comparison with trainees and teachers on the secondary level. This becomes an interesting finding
in light of the greater student orientation of the elementary school in contrast with the secondary
school, noted generally. Whether greater student centeredness comes from the school level, or whether
the personnel attracted to elementary school bring greater pupil concern with them can be examined
in light of the available data.
It is worth noting that the elementary and secondary early preservice students do not differ
statistically significantly on level of student concerns. Furthermore, nor do the instructional
leader personnel evidence significance on this dimension. That neither the early preservice
students nor the instructional leaders exhibit statistically significant differences in level of
pupil concern casts doubt on the notion that this focus is a personal orientation of those, who
select and continue to work on the elementary level. The findings in this investigation suggest
quite differently that pupil focus is altered in some way and at some point, during the period of the
professional training program rather than being an established pre-professional, or merely
becoming a subsequent, orientation of the candidates. Since the three audiences are representative
samples of their respective populations, sex differences between elementary and secondary personnel
are similarly distributed and cannot account for the significantly greater pupil concern of the
elementary trainees in student teaching nor of the elementary teachers. The fact that experienced
personnel are distinguishable by level may imply that pupil centeredness is a function of school
level. This is a useful finding because it points to potential sources and times for change in
attempting to increase secondary trainees' student concerns.
It needs to be noted that instructional leaders are distinguishable by level on factor 3,
work situation. Given the item content of this factor and current reports of secondary schools, it
is hardly surprising to find secondary leader concerns exceeding those manifest on the elementary
level.
AzEteLnsRatALnalsisi__
In a comparison of the three school systems with the largest number of Maryland students, one
has appeared significantly tower than the others on factors two and three as well as the total
measure; as reported b!? the inst.ructionsl leaders in system 5. Further examination of these differences
and their possible caises needs to be included in recommended future works with particular attention
to potential reit, nship between concerns and extent, type and duration of pupil contact.
Center Data Analysis
Significant differences among centers appear only for the cooperating teacher category. All
four "Concerns" measures are significant. The post hoc procedure however, was unable to isolate the
source of these differences.
Summary.
The developmental hypothesis, suggesting concern for situation growing with length of
professional service, currently advanced by Fuller* is only partially supported by the results of
this version of the "Concerns" measure. The present findings confirm the greater concern with role,
*"Becoming a Teacher" in 1975 luarhaeli, of the National Society for the Study of Education (editedby David C. Ryans), in press.

-47-
or self survival, evidenced by novices and the similarity of their pupil concerns to that shown by
experienced teachers. However, it is worth noting that our student teachers, who were reporting about
the identical setting as their cooperating teachers, evidenced significantly greater situational
concern as well. (See Table Thirty-six)
Why should cooperating teachers evidence significantly lower work situation concerns than
student teachers in Maryland while inservice teachers exceed students in the Texas sample? It is
possible to pule over what might distinguish cooperating teachers from inservice personnel in
i..neral. Could those serving as cooperating teachers anywhere have different mastery of situation
from their peers and consequently he perceived and assigned as more appropriate models by those
who select cooperating teachers? Or might the presence of another "adult" reduce the built-in
situational frustration? In either event, having a more satisfactory link between teacher and
environment could mean lower concern about situation.
All student teachers are significantly more concerned with work situation than are
cooperating teachers. Furthermore, students exceed cooperating teacher level of concerns on both
elementary and secondary levels, in centers and in school systems. When those closer to direct
instruction, student and cooperating teachers, are pooled and compared with those less directly assor
dated, center coordinator, instructional leaders and supervisors, the directly involved exceed
the others overall, in centers and on the elementary level. However, in the secondary level and
noncenter set, personnel appear similarly concerned about work situation.
It is possible eo conceive of work situation concern as an interaction of environmental
frustration and role function. In general, the closer to direct delivery of instruction the higher
the concern. However, there are indications of environmental influences operating as well.
Secondary instructional leaders exceed the elementary principals revealing greater hardship and
frustration felt on the secondary level. Again, in system 6 where accountability procedures have
been in operation, environmental stress is also manifest via principals. Finally, system 3
indicates the presence of environmental stress manifest by all personnel in this urban setting in
contrast with suburban location.
Work Situation Concern as Function of Role and Environment
Role Influences:
1) Novice > Experienced
2). Close > Less directly involved
Environmental Influences:
I) Level
Secondary Instructional Leaders >Elementary Instructional Leaders
2) SystemIL 6 >10 SysteM Stress manifest via principalsSystem 3 >5 System Stress manifest via all personnel
Therefore work situation concern maybe conceptualized 119 a function of both role and environment.
There are two role influences: novice over experience! and those directly involved it instructional
delivery over those less directly involved. Where exceptions to these significant trends are observed
they are mediated by environmental Influences comprised of level and system effects which are seen
to interact with the observed role functions,
In summarizing all these concerns' results. .t appears that the closer the individual is to
direct classroom involvement, the higher the general level of concerns, with student teachers and
cooperating teachers showing significantly greater concern scores. In this cross-sectional study,
the early preservice candidates evidence higher role and situation concerns than do the student
teachers, In addition, there is the presence of a level effect with respect to pupil concerns,
Elementary student and cooperating teachers compared with those on the secondary level, exhibit
Significantly higher student concerns. These data do, in part, respond to Fuller's call for identify-
ing specific trainee subgroup concerns evident in particular situations and stages, There are some
suggestive findings about which program stages and/or environments are associated with what levels of
:oncern for particular groups of pre and inservice personnel.

CHAPTER VI
SUMMARYL SUGGESTIONS AND REFLECTIONS
BM' CONAVAILABLE
This study represents systematic, rather than impressionistic inquiry into the precise character-
istics of what the center and noncenter program, or treatment, contain. In the first section of this
chapter the six study questions are restated and answered directly accompanied by an overall summary of
findings. The next section poses possibilities and recommendations for subsequent phases of the
study. The last section is frankly speculative and questions the adequacy of the current models
serving as. bases for teacher education programs and by implication for their assessment,
SECTION ONE: SUMMARY
The basic question underlying the study is whether there are observable differences between
centers and noncenters and if so, what distinguishes these two arrangements? There are observable
differences between the centers and noncenters of quite specific sort. Both on the pre and inservice
levels there appears to be more program, greater number and variety of exposures to training practices
and instructional experiences in centers than in noncenters.
The responses below to the original six questions of the study give a more detailed description
of findings.
Question 1. In what preparatory experiences are student teachers engaged?
centers provide a significantly greater variety of options than are available in the noncenters
in observation, teaching and related preparation. The overall magnitude of the center instructional
experiences exceeds that found in the noncenters. Both instructional strategies and materials
preparation are more frequent in the center setting. The complete observation and review cycle
occurs significantly more often in the centers than in the noncenter situation.
Question 2. Do experienced teachers provide and review experiences for student teachers
based on competencies acquired in inservice instruction?
Inservice instruction does serve as a basis for the experiences cooperating teachers provide for
student teachers. The findings further suggest that available inservice content is only one of
several sources that cooperating teachers draw on in providing training experiences for novices.
Question 3. What is the variation observed in available inservice content and sources of
information among experienced teachers?
Center cooperating teachers have more inservice content and sources of instruction available
than noncenter personnel. The number of competencies acquired by experienced teachers through
inservice training and transmitted to student teachers is significantly greater in the centers than
in the noncenter situations. The University is identified as the source of competencies acquired
through Inservice instruction significantly more often in center than in noncenter situations.
Question 4. Who hnqls conferences with 4tudent teachers?
Four conference sour, , whose magnitude of appearance is not significantly different, account
for almost all of the supervisory conferences conducted in the centers. These four sources are the
cooperating teacher, acting alone; the center coordinator, acting alone; the cooperating teacher and
center coordinator, acting together; and the cooperating teacher, center coordinator and university
supervisor acting together. pattern of presence or absence of supervisory conferences is alike
for tenter and noncenter situations.

^50-
Question 5. Does the perceived process of supervisory encounters vary between
providers and recipients?
The process of supervisory conferences is perceived similarly by providers and recipients
and does not differentiate between center and noncenter settings. The only differences obtained
signify discrepant findings between elementary and secondary levels.
Question 6. What are the differences in levels of concerns for pupils, teacher role and work
situation among various educational personnel?
There are significant differences in levels of concern by various educational personnel. Generally,
those close to direct instructional involvement, student teachers and pre-student teachers, evidence
the highest concerns in contrast with one, or more, groups: principals, coordinators and university
supervisors. Concern for role of teacher and work situation distinguished groups most often. How-
ever, elementary students and cooperating teachers exceed their secondary colleagues on level of
pupil concern.
The design of this study is influenced by the goal free evaluation notion advanced by Scriven.*
He suggests that knowledge of objectives, however specific and/or behaviorally stated, is of lesser
importance - and might even be a source of distraction for evaluation - than what actually occurs in
a particular program under review.
This has been the initial phase of a comprehensive and systematic attempt to identify what is
happening in the centers independent of what center advocates and/or adversaries may prefer to
perceive as occurring. The potential inherent in the centers for future field-based programs was
clearly excluded from this investigation. It is of course, hoped that by surveying the on-going
practices of the centers and by utilizing the findings for shared discussion and joint school college
decision-making, the potential of the centers might be realized most fully.
In this study the professional induction experience is reflected through a variety of specific
training options, supervisory behaviors and levels of concerns. The analysis of the data consists
of comparisons between center and noncenter settings, elementary and secondary levels and where
frequencies permitted by school systems and individual center locations.
Most supervisory and concerns components tend to be the same regardless of situation, level,
school system or individual center site. However, a majority of the experiences items do distinguish
among various audiences, and there is also significantly observable difference in observation, teaching
and related preparation and inservice options available. Where statistically significant differences
obtain these favor the centers with respect to extent of preservice experience clusters, observation,
and related options, inservice involvement and utilization of complete observation and review cycles.
Where centers differ from noncenters, they tend to have more of everything, be it program components,
or divergence between matched reporting groups. That it not only do the centers have more program
and more partiripants, but more mixed perceptions about what the program is, as well.
There are two conceptually linked areas of disagreement. The first comprises the observation,
teaching and related preparatory options and the second consists of the instructional experiences
clusters. There is some disparity between student teachers and cooperating teachers, independent of
*Michael Scriven "Coal-Pret Evaluation" Communication to Evaluators, 2A, National Institute of Education,
Berkeley, California, Fall 1971, pp. 1-6.

-51-
setting, concerning observation, teaching and related preparatory opportunities. Center and noncenter
student teachers compared with cooperating teachers reveal essentially the same pattern qnd a similarly
mild disagreement. At the same time the observation, teaching and related preparation dimension
elicits far more difference between center student teachers and cooperating teachers. This is the
reverse of the experiences profile pattern in which generational disparities were observed on half the
process categories. (See Table Seventeen) Furthermore, when both content and process dimensions were
included there was a 36% discrepancy between the overall rankings of the center students and cooperating
teachers. It appears that the experiences content and/or process disparities are generational while
the observation, teaching and related preparatory dimension is situational.
In this area for further sponsor inquiry, it is hypothesized that situational divergences
would be comparatively more accessible for purposes of program adjustment than generational disparities.
That is, with relatively little effort, the specifics of observation, teaching and related options
might be expanded in the centers and/or the noncenters might be brought up to par with the centers
on those items on which they are currently outperforued. Those experience variables that differentiate
audiences across location and/or situation, which appear to be generational discrepancies, seem less
likely to be altered through focused attention or even concerted effort.
Therewere also some differences between elementary and secondary level analyses but these were
fewer than obtained in the contrasts between center and noncenter settings. It should be noted that
the teaching portion of the training practices dimension clearly favored the elementary program and
could serve as a guide to adjustments in secondary preparation. However, school systems and individual
centers did not differ significantly either in training or experiences provided to yield clearly
identifiable patterns.
These findings leave several areas for serious discussion among program sponsors. It is possible
to conceive of further probes in at least two areas: locating potential sources that might account
for specific program differences and discovering the subsequent impact of center participation. To
wit, what are performance expectancies for graduates of a somewhat richer, more varied program with
greater number of professional options and wider exposure to practice?
With respect to the ongoing activity, it is worth asking whether the program sponsors wish to
address the increasing need for staff development activities jointly and to provide unique, or inter-
changeable, roles for each partner? Serious thought might be given to s concentrated, differentiated
inservice thrust, recognizing all the special characteristics of adult learners and the increasingly
stable teacher population for curricular and instructional planning. In the same vein, can the current
conception of student teaching serve as a vehicle for professional renewal of the majority, rather than
minority, of school staff? Furthermore, does non-differentiation, lack of specialization, noted in
both the early preservice and student teaching comparison and in sources of inservice instruction
fit sponsor intentions?
SECTION TWO: POSS./B/L/TIES AND WOMMENDATIONS
Having fo me differences between the centers and noncenters, one outstanding question is
what differenc the obaerved differences make in the career of a professional. The next phase of
the center study aims to move toward identifying the instructional career and behavior of the center

-52-
program. The intent is to progress from instructional involvement to instructional behavior to
related pupil behavior. Subsequent to establishing connections between teacher and pupil behaviors
it becomes possible to proceed to pupil outcomes.
We found a richer, more varied, more instructional strategies and more materials based preparation
in the centers both for the pre and the inservice groups. An obvious next question is whether given
richer, more varied repertoires, the trainees and the experienced personnel actually have a chance to
employ what they are now presumed to know how to do. Having established the presence of differences
in instructional training, a next question is whether the obtained differences are also accompanied by
observable differences in instructional behavior. A variety of observational studies are anticipated
to seek answers to this question.
As an overall sequence, we recommend moving from Phase I, systematic description of treatment to
Phase II general follow-up of both pre and inservice "products" to Phase III, observational studies of
trainees and pupils, Phase IV, internal attitudes of personnel and V, pupil outcomes. Additional,
smaller scale studies further probing the already available data from Phase I are especially desirable
as well. Clearly the phases outlined above are only partially sequential. That is, it is quite
possible, given personnel and material resources, to concurrently conduct Phases II, III and IV.
Both :or purposes of illustration and as an actual proposal for Phase II we outline four questions
that might guide the follow-up activity. It should be noted that the nonexistence of either unique
system or center patterns is a practical boon for such a follow-up. Since the differences observed
are center associated rather than tied to specific systems or sites, it is possible to generate
randomly selected groups of both pre and inservice products, who might actually be located and whose
participation may be solicited in such further investigation.
The proposed four phase follow-up moves from the external vantage point: the actions and/or
perceptions of others, such as personnel officers and principals, through externally observable be-
havior, to internal attitudes of personnel and the ultimate, internal outcome of schooling, change
in pupil attitudes and achievement. Therefore, these projected phases consciously continue to link
the outside and the inside, that is, the behaviorist and humanist domains.
Possible Phase II Questions
1, What is the difference in observed teacher and/or pupil behavior and performance where significantly
richer array of inservice activities have been reported?
2. What differences in hiring, selection and promotion of center and noncenter trainees obtain?
3. Does principal assessment of center and noncenter graduates differ?
4. Does pupil assessment of graduates of center and noncenter programs differ?
It needs to he noted that these four questions focus on graduates and inservice personnel
mostly from an external vantage point. Figure Two outlines other possible outcome measures, levels
of outcomes and audiences of which these two groups are a part. Additionally, the chart visually
represents Phases II through V and differentiates three levels of outcome Measures: immediate,
intermediate and ultimate. These levels are, in turn, keyed to both external and internal types
of outcome measures.

-53-
Big COPY AVAILABLESummary of Possibilities for Com arative Lon itudinal Assessment 1f Center and Noncenter
Products by Types and Levels of Outcome Measures
Audiences
Pre-student teachers
Student teachers
Graduates
Inservice personnel
Types of Outcome Measures
External
Enrollment/withdrawal
Observed student teacherand pupil performance
Observed teacher andpupil performance
Hiring, retention,promotionPrincipal and pupilassessment
Observed teacher andpupil performance
Observed teacher,trainee and pupilperformance
Internal
Levels of Outcomes
Immediate (1)
Trainee satisfaction Intermediate(2)in student teaching
Intermediate(2)
Pupil attitudes and Ultimate (3)
achievement
Immediate (1)
Teacher and pupil Intermediate(2)satisfaction
Pupil attitudes and Ultimate (3)
achievement
Intermediate(2)Teacher and pupilsatisfaction
Pupil attitudes and Ultimate (3)
achievement
FIGURE TWO
Question 1 above is predicated upon some intriguing - albeit far from perfectly established -
connections between instructional variety and pupil gain.*
There appears to be sufficiently demon-
strated association between variability in instructional techniques, materials and activities and**
cognitive pupil gain to render this a promising area for inquiry. In light of the significantly
greater variety of instructional strategies and mateAtis noted in the center treatment it is worth
asking whether this greater variety provided in the continuous preparation program of both pre and
inservice personnel is transmitted in some recognizable form into classroom behavior and transformed
into pupil gain. That A how do pupils, the ultimate clients, receive the benefit of a richer, fuller,
more varied continuous teacher preparation program? The cooperating teachers exposed to a greater
variety of instructional experiences might transmit these both to the novices and to their own pupils
as well. Consequently, these pupils might be possible target groups for tracing such effects. Another
prospect for transmission is, of course, the new entrant to the profession.
Pursuit of this possible connection between training program effects and ultimate pupil gain
is a long range and long shot activity in light of the work of Coleman, * ** Mosteller and Moynihan****
*Heath, Po'oert W. and Nielson, Mark A. "The Research Basis for Performance Based Teacher
Education" Review of Educational Research, v. 44, no. 4, Fall 1974$ pp. 463-484.**
Rosenshine, Barak and Furst$ Norma "Research on Teacher Performance Criteria" in Smith, B.O.Research in Teacher Education,, Englewood Cliffs, New Jersey/ Prentice-Hall 1971., pp. 37-72.*Rosenshine, Barak Teaching Behaviors and Student Achievement, international Association for theEvaluation of Educational Achievement, LEA Studies, No 1, National Foundation for EducationalResearch in England and Wales, 1971, pp. 137447.***
gguali,ty pf Educational Opportunity,, Washington, D.C. U.S. Office of Education, 1966.****
On Equality. of Educational Opportunity, New York: Random House, 1972.

and Averch et al*
indicating' the currently cimull, meast,reatl pupil ourcemes attributable solely
to schooling. That is, the potential contribution of teacher preparation to pupil gain faces great
odds at the start due to the extreme smallness of any school effects associated with pupil gain.
Nonetheless, it is worth considering and attempting to investigate whether the pupils of teachers
benefitting from center programs are distinguishable on presently used measures from the achievement
of pupils of those personnel, who have not had such exposure. Liven the paucity of measureable
schooling effects, such a study woad be undertaken with a genuine, not merely formally stated,
null hypothesis.
Besides conceiving product studies it would be useful to attempt to untangle the potential
sources of center effects. The presently perceived, center effects may be attributable to several
interactive phenomena. It is possible that center differences are due to concerted deliberate effort
of center personnel. Which combination of personnel is central needs to be probed: coordinators'
systematic interaction with cooperating teachers, principal and coordinator planned staff development
activities, self selection of professional growth options by inservice personnel and availability of
print and nonprint instructional materials are all potential contributors to the fuller, more
complete center treatment observed.
It is also worth considering whether the observed differences in center options are the result
of participation in teacher preparation over time. Although the random sample of noncenters did include
long-term participants in teacher preparation, it remains for a follow-up study to separate the reports
according to length of participation in sponsoring preservice candidates. In addition to attributing
the observed differences to concerted effort, they may also be caused by the concentration of candidates
all seeking to learn entry level skills for teaching. The concentration hypothesis is predicated
upon the notion of speedier and greater diffusion of training practice where more candidates are
present as potential beneficiaries. Verification of this conjecture is possible only for the center
sample where contrasts between the high and low enrollment groups can be pursued.
There are several other small scale studies that may be performed utilizing the data already
collected. In addition, there are other investigations that would carry further the findings of
Phase I. The questions below start with those for which the data are at hand and conclude with those
where additional information needs to be gathered.
Additional Questions concerned with tdentifying,Sources and/or Impact of Treatment Differences:
1. Are different areae, of specialization differentially associated with training practices,
instructional content and process, levels of concerns and/or supervisory practices?
2. What is the relative contribution of level and center influences on available training practices
and magnitude and kind of instructional experiences?
3. Now does the training program utilization differ between early and late decision-makers?
4. Are there recognizable patterns in the utilization of training practices by those exhibiting high,
medium and low levels of concern for pupil, role and work situation?
5, Do center graduates and/or inservice participants differ in pursuit of further study with
respect to content or sources, when compared with noncenter peers?
How Effective is Schooling? Santa Monica, California: Rand Corporation, 1971.

-55-
6. What is the relationship between the extent, type and duration of pupil contact and level of
concerns?
7. What piece of the elementary program accounts for the significantly higher pupil orientation
observed?
8. Why are secondary supervisory conferences significantly more participatory than elementary ones?
9. Is there higher awareness of training procedures to be utilized in the induction of novices in
the centers?
As noted earlier, a distinction needs to be made in the continuing phases of the center study
between those concerned with potential impact on pupils, educational personnel and program and those
which attempt to identify possible sources for the observed differences. It might be recalled that
to date this study provides specific information: a detailed, systematic description of the center
treatment but can make no claims about which of several center components might be responsible for
which portion of the observed differences.
This distinction is both theoretically and practically - albeit not statistically - significant.
Identifying specific center components, or inputs, that are associated with particular outcomes would
allow experimental, or at least quasi-experimental alteration of the factors presumed to have specific
effects. Additionally, at times of shrinking resources such as the present, it would then be possible
to concentrate personnel energy and material support on those areas, or inputs, being responsible for
the observed program differences. Eventually, the connection between program inputs, mediated by
treatment, and impact might then be grounded more firmly. That is, attention to possible sources
of observed program differences is linked to the concern with what is the impact of those differences.
Where do the obtained differences come from and what difference do the differences make, is another
way of stating the relationship between the two areas of source and impact.
SECTION THREE: REFLECTIONS
The joint institutional support for,
heartening. Nonetheless, there have been
and participation in, inquiry into practice has been
inevitable frustrations in the course of this self study.
Technical problems, data processing delays, human
and suspicions about motives for the inquiry were
fears concerning findings and their utilization,
part of the context in which this study was
accomplished. But, the greatest hardship of all remains an intellectual one. Quite simply there is
almost no theoretical foundation on which to base a specialized investigation into teaching. Grand,
or grounded theories of instruction remain largely to be discovered. As a consequence this study is
essentially atheoretical, albeit empirical, and guided by some tentative models of teaching. It is
worth noting that nearly all the questions posed by school and campus personnel concerning the center
setting had a common core.
The implicit model underlying most of the questions in this study, derived from sponsor
assumptions, is the expanding repertoire of apprenticeship. Conceiving of teaching initially and
beyond as skill acquisition and opportunities for practice has advantages. Not only are the skills
describable but they are readily quantifiable and thus allow for verification of the model.
But, the study is somewhat more eclectic than such a single model of teaching would imply.
It draws on two other models as well. In contrast with the apprentice framework there is the far

-56-
less easily verifiable Deweyian reflective conceptualization which guides the work of Daniel
Solomon. Posing the indicators and instances of reflectiveness in professional development led to
the supervisory conference as the most readily identifiable locus for reflectiveness. With the rather
sparse data at hand and with the wisdom of hindsight, this source may not have been the best for
verifying the existence of the reflectiveness model.
The third model underlying the study is the notion of teaching as becoming, frequently associated
with Arthur Combs. The developmental stages conceptualization of Frances Fuller, representing this
framework, was explored extensively and some suggestive results with partial disconfirmation of the
model have been presented.
Having verified the existence of a rather recognizably richer, fuller, more varied training
setting in the centers but little difference among systems or individual center sites does allow
program sponsors to ponder the worth of the underlying apprentice model as well as the general
similarity among the units. It is now possible more explicitly to return to other models of teaching:
the reflective as well as the becoming, and perhaps others as well, and actively plan programs
and assessments consonant with the model's primary emphases.
In selecting assessment and inquiry strategies the choice is often perceived as being between
carefully controlled, small scale, single variable focused, xperimental investigations and More
naturalistic, holistic, descriptive, field survey methods. Both approaches seek to build theory which
will predict behavior and thereby guide practice. In our view conceiving of potential research
strategies as a range of options along a continuum from philosophical speculation to consistency
analysis*
to historically, anthropologically and sociologically derived field methods**
to
observational approaches***
to quasi-experimental or experimental designs****
and beyond is the most
responsive approach. Although alignment with a methodological party is not a requirement for inquiry
in teacher education, starting with a conceptual model of teaching is helpful for initial focus and
definition. While we concur with conventional wisdom which suggests that the selection of
research methodologies is determined by the nature of the problem investigated we would add that the
available expertise and the preferences of human subjects and investigators for particular research
strategies need to be included as well.
What we call for is a greater variety of techniques addressing a range of concerns in teaching
from the specific to the general in a systematically interrelated fashion. We humbly remind
ourselves that the long-sought theoretical underpinning of teaching is only partially visible at
present. While its patterns and regularities may be exceedingly complex it remains for us to devise
strategies that render it more readily comprehensible, transferable and capable of improvement.
Toward this end we view moving back and forth across several conceptual models utilizing a range
of research techniques in an orderly fashion as a promising alternative to despair, or to single-minded
* Robert E. Stake and Terry Denny "Needed Concepts and Techniques for Utilizing More Fully thePotential of Evaluation" in Educational Evaluation: New Roles, New Means, 68th Yearbook of the NationalSociety for the Study of Education, Part II, Chicago, U. of C. Press, 1969, pp. 370-317.1 ,**
Frank W. Lutz and Margaret A. Ramsey "The Use of Anthropological Field Methods in Education,"Educakional Researcher, vol. 3, no. 10, November 1974, pp. 5-9.***
Donald Medley and Harold Mittel "Measuring Classroom Behavior by Systematic Observation"Handbook of Research on Teaching,. ed. N.L. Oage, Chicago: Rand McNally, 1963, pp, 247-328.****
Donald T. Campbell and Julian C. Stanley "Experimental and Quasi-Experimental Designs for
Research on Teaching in Gagel"Ibid.

-57-
conceptual and/or methodological fixatiop. We do not simply call for any kind of inquiry but rather
for an array of investigations that are_linked either conceptually and/or methodologically. A
contemporary version of the early agricultural revolutionary three-field rotation plan is the essence
of the notion.
For purposes of illustration we reduce the range of methodologies proposed to two: naturalistic
and experimental and the models to three: apprentice, reflective and becoming. Therefore, the
systematic progression strategy proposed here moves back and forth, horizontally, vertically and
diagonally over the cells in Figure Three. This represents an attempt to seek connections between
Inquiry Modes
uonceptuai moaeis
Reflective
or :ieacning
BecomingApprentice
Naturalistic .
Experimental
FIGURE THREE
the multiple and overlapping roles of teaching that may most productively be illuminated by each
method. By allying what are often seen as competing views and techniques we acknowledge that
teaching has many purposes, many outcomes and.many values. These complexities, inherent in any
educational program assessment, may he faced most fully if the range of available research tech -
niqups are concurrently and/or sequentially brought to bear on at least tentatively bounded
conceptual areas. Both for maximal theoretical and practical pay-off we propose this systematic
progression strategy to guide successive phases of the center study and other investigations as well.

READER RESPONSE SHEET
1. Now that you have read this report, what questions do you have?
2. If you had free access to any piece of knowledge in teacher educationwhat next question would you want to have answered?
Signa ure
Please complete and return this sheet to Dr. Judith Ruchkin, Office ofLaboratory Experiences, University of Maryland, College Park, Md. 20742
MIIIIIIMM.11.1111101
-58-
g.1.1"1,
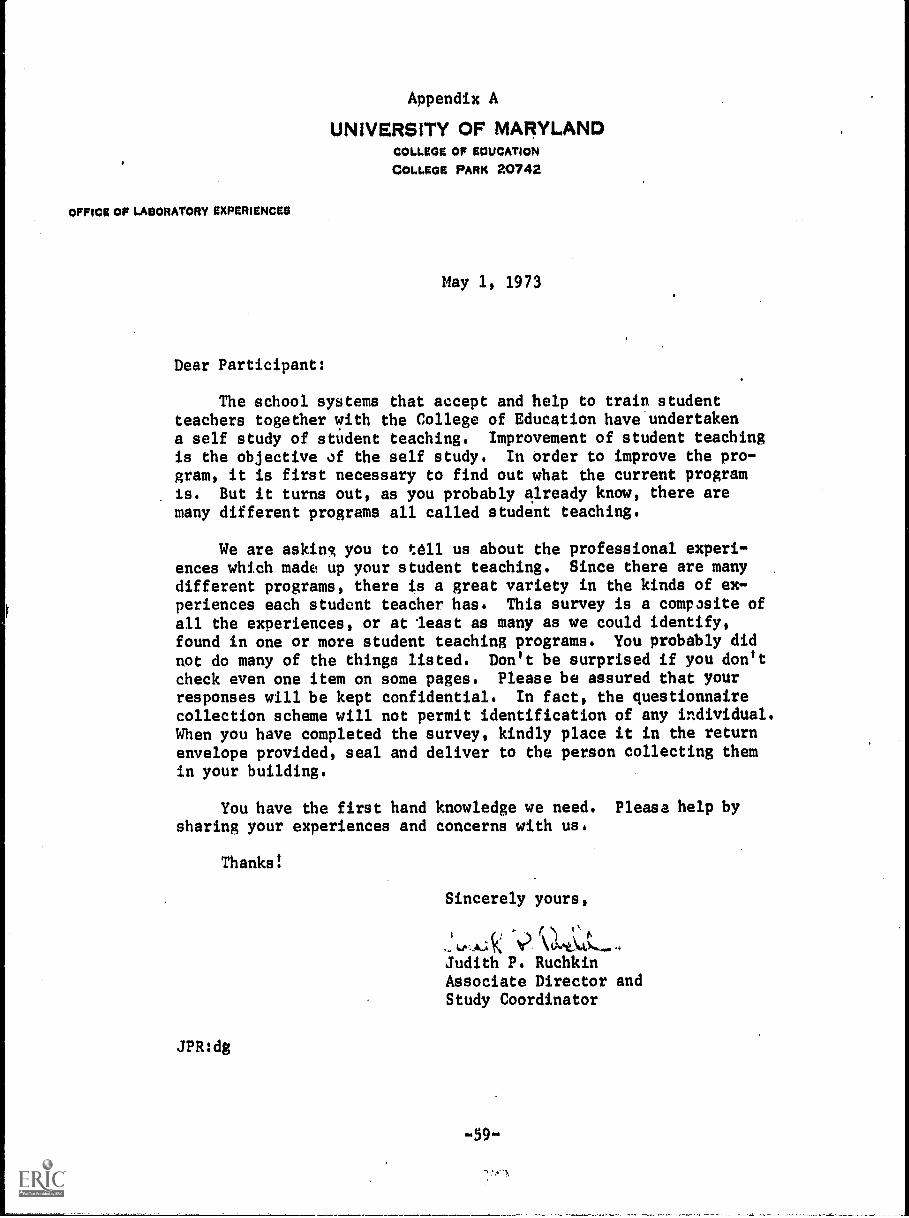
Appendix A
UNIVERSITY OF MARYLANDCOLLEGE OF EDUCATION
COLLEGE PARK 20742
OFFICE OF LABORATORY EXPERIENCES
May 1, 1973
Dear Participant:
The school systems that accept and help to train studentteachers together with the College of Education have undertakena self study of student teaching. Improvement of student teachingis the objective of the self study. In order to improve the pro-gram, it is first necessary to find out what the current programis. But it turns out, as you probably already know, there aremany different programs all called student teaching.
We are asking you to tell us about the professional experi-ences which made up your student teaching. Since there are many
.
different programs, there is a great variety in the kinds of ex-periences each student teacher has. This survey is a composite ofall the experiences, or at least as many as we could identify,found in one or more student teaching programs. You probably didnot do many of the things listed. Don't be surprised if you don'tcheck even one item on some pages. Please be assured that yourresponses will be kept confidential. In fact, the questionnairecollection scheme will not permit identification of any individual.When you have completed the survey, kindly place it in the returnenvelope provided, seal and deliver to the person collecting themin your building.
You have the first hand knowledge we need. Please help bysharing your experiences and concerns with us.
Thanks!
JPR:dg
Sincerely yours,
s ( I
4**-4-11C V \Judith P. RuchkinAssociate Director andStudy Coordinator
.59.

Appendix B
STUDENT TEACHER SURVEY
This survey is soliciting information about the range of professional experiences that students encounter dur-ing their student teaching. As you will note, we would like to find out approximately when and by whom the infor-mation or experienLe was provided. Please respond to the questions in terms of your student teaching experience.
I. General Information
A. Female Male- .
D. Age
C. Grade point average (as best you remember it to the nearest hundredth)
D. Student teaching was conducted in a Teacher Education Center Noncenter setting.
E. Student teaching was conducted at the elementary middle , or secondary level(s).
F. I am a major in the Department of Dance , Early Childhood-Elementary Education , Industrial
Education , Music , Physical Education , Secondary Education , Special Education
, other (please specify)
G. My choice for a student teaching assignment was in a Center Noncenter setting.
t' My parents' occupations: Mother , rather
I. My parents' education: Mother ; Father
J. Number of different classes I observed during student teaching: .
K. Number of different subject areas I observed during student teaching:.
L. Number of different teachers I observed during student teaching:
M. Number of different student teachers I observed during student teaching: .
N. Number of different grade levels I observed during student teaching:
O. Number of different schools in which I observed during student teaching: .
P. Number of different schools in which I taught during student teaching:
Q. I was was not assigned a mail box separate from my cooperating teacher.
R. I was was not introduced as a member of the teaching staff during a P.T.A. meeting.
S. Subjects I taught during Student teaching were:
T. For the most active week in which I taught, the average number of hours of class instruction I taught per
day was hours.
U. During the most active week in which I taught, the number of class hours I taught during the week without
my cooperating teacher or other teacher being present was hours. '
V. I had did not have a voice in selecting my cooperating teacher.
W. The total number of teachers under whom'l taught during student teaching was: .
X. I observed high ,average , low ability classes.
Y. I taught high , average , low ability classes,
E. I decided to become a teacher when I was in elementary school , junior high school . senior high
school , college. , other (please spec!ly)
AA, Which student teaching seminars did you attend during this semester?
88. After graduation my career plan is to:
CC. Area of specialization or concentration:
DD. The three most exciting books I read recently are:
and

BESTCOPY
AVAILARE
Experiences
Approximately When was the Performanceand by Whom was it Observed
Approximately When was the PerformanceReviewed and by Whom
210t440
744 XN, 8X..."4
m04-$
it, 44140ti,
O N(./E-4
0aa'0a
if: 440
144 tit v001
00
8.8t :O E
0
li .e4
!I?L i 84.J9
.-'00.
1.4 .r1
88.6 I'MR,
g0 W;...oce V)
...4..-1 p
°L..8 '1%1e)
P, Ww 0.e4 V)
..' P.84%)
vr
>'
op0
...I0mw8.1gm
0gVa44tow
08.8.0 0
8' f?.
0
88.8C 408 A'
0000a
VBlico8 3
,40n,.. ..
82XVIM
0V/ WP. 0m 0
1,4
01 P88
.g C).
(;1' c',1
P"instructional0 0
a ...W P
..1:8,4 0.8 ,2
Procedures for rArectingStudent Attending (Looking-Listening) Behaviors
Reduction of the Complexityof a Learning Task or SocialSituation
Reduction of the Level ofcrowding or Noise
Restructure SeatingPattern
Special VerbalWarning_
Visual
Pr021UIUL--____________________Other Important Experiences(please specify)
..--. ..,
Other Professional Experiences
Please check only those experiences you have engaged in during student teaching. If you tried the experienceand no one observed you, place a check in the "Myself" column with the approximate date(s) you tried them. If
someone did observe your effort, please identify the date(s) on which the observation(s) occurred, and the individualwho observed you. If someone reviewed your effort and provided analysis, please identify the approximate date(s)on which the review(s) occurred and the individual(s) who provided feedback on your effort. If you engaged in anexperience several times please provide the approximate dates of the most recent performance, observation and/orreview. More than one person may have observed the same experience and more than one person may have reviewed thesame experience. Please check all individuals listed in the column headings.
Professional Experiences
Approximately
0.---------------
W
'r32.P,
7.:
aid
.4.,MW44 09..9. w0 0JV H
by Whom
4,a
0004 IMN
0'' 1.2 044 0J0 H
When was the Experiencewas it Observed
.
Approximate Date(s) when Reviewedand by Whom
w0
'' 41.1
.2 w4-1 0JOH
84J11a
W .14
11 740 00 0uu
0440
01 .!...i
8 8.0
4.1 44cos+
aa
r, 0CA 0. '5
3 4,0.1 0(so
t 14..1 V)
2 56'
0 0c/)
.44 .
71;
...14.,01.4401.444I., 0SAm
8 1.
4.,
a
B0
8 .8,
,0 1.4
0J
8 1
0 H
06.1M0
14 44
11 11
m mu Q
04M
H v48atipv) gl
0PS ..IMM....
0.F-I
8Gopen u.
P. 4444 0N
0 q-4
'' 8ea
v)
Construct a Diagnosisof an Individual.
Learning Problem
Construct aLearning, Station
_______,
.....................4
Construct a Lesson for (livenBehavioral 04jeetiVe
Constructa Test
Construct BehavioralOhlectiVes ''''a''''''...""'"...'construct Nonbehavioral
04.1.ecAlles
---rml...144.4*1... a. 441................-
61
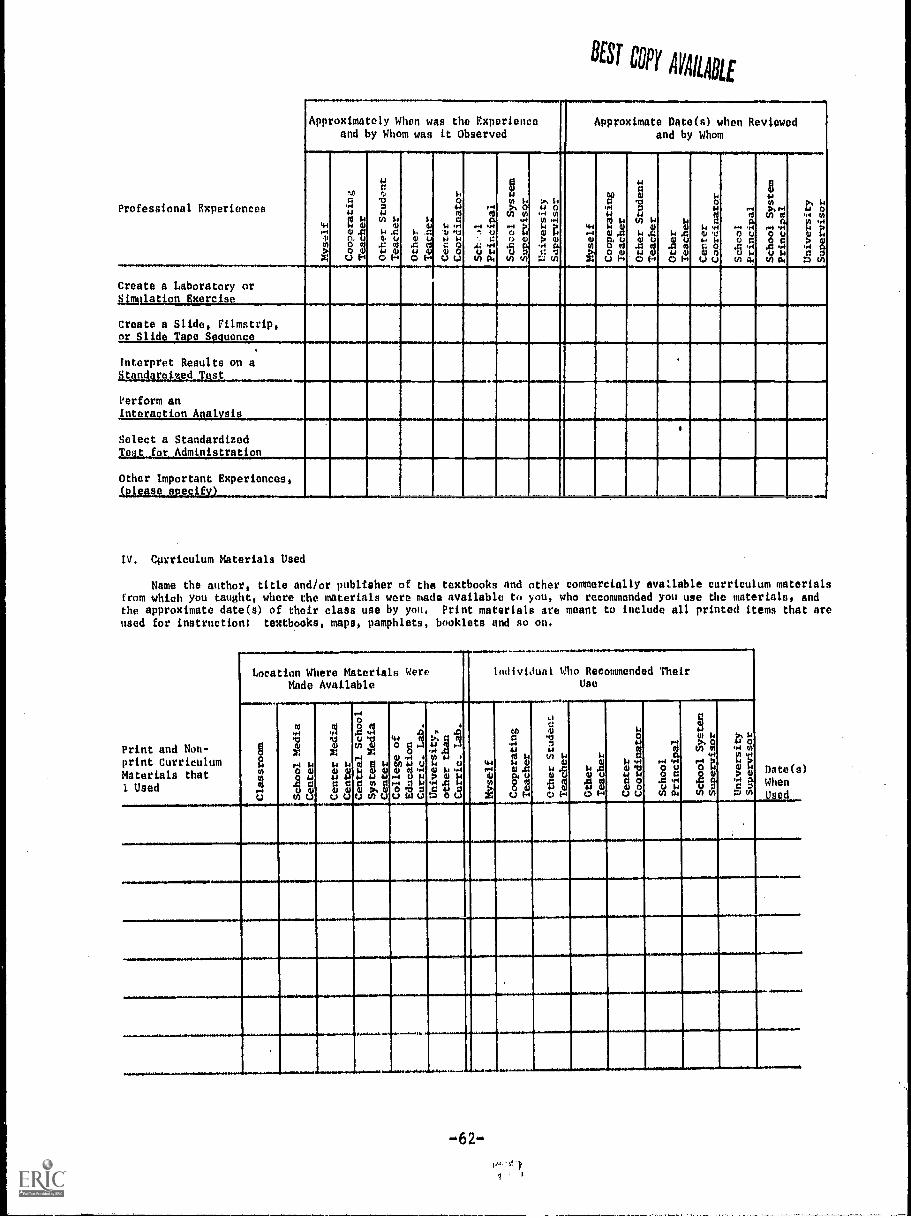
BEST COPY AVAILABLE
Professional Experiences
---
----...........-.-..........-....-.....
Approximately When was the Experienceand by Whom was it Observed
_ ......
Approximate Date(s) when Reviewedand by Whom
44
11
I',
..1,
C'1444
4 t:'4. 18 g
c.) I-I
4.1
FT5o4.1' tk: t.ti gQM
00k; -E,
V, 2o FA
14
o4,
21.4 44
;1, 11
,ii 8c.) c.)
.440a
PA .14
''' U
40' ' r,
ce a.
g0 i.P, 00 VI
.44PA Pi
Cl tfi 8v) to
p... II44.,-1 U)VI .4414 }2 t
'cr I: 8..:.) ce
,--.1"
: ',
#
00041
g ilB. 23 (11
4.1
a0,1
.04
'414 14
h1 CI
o El
Ll
14 A11
ei 1140
41
041
g141 ::.1
t Ou a
r40
73ta.
.2 ,9
til ci:
0mON rrl0 0a
rg .il.8 .F.
(11) it:
14Ll 0,e1 VIr .00
. 24 4
Create a Laboratory orSimulation Exercise
Create a Slide, Filmstrip,or Slide Tape Stiauence
-
Interpret Results on aStandardized Test --
I
Perform anInteraction Analysis
-----
I .
Select a StandardizedTest for Administration I
Other Important Experiences,(please specify) -- - 1 M.*
IV, Cprriculum Materials Used
Name the author, title and/or publisher of the textbooks and other commercially available curriculum materialsfrom which you taught, where the materials were made available to you, who recommended you use the materials, andthe approximate date(s) of their class use by you. Print materials are meant to include all printed items that areused for instruction: textbooks, maps, pamphlets, booklets and so on.
Print and Non-print CurriculumMaterials thatI Used
Location Where Materials WereMade Available
Individual Who Recommended TheirUse
Date( s
Whenused
gow0oa
...
C.)
----,...0o
14.4Mo cu0 M
A°tO...4
iln.,co
ZWMWOMW)cu cu
41.1 01
g .0.9C.J,-44)00
"402 I .4U .tito ,v
4-4 ...
1., 0 cu41.1 M 4.1
g WO
44 m0 d ad
W.4.4 4MUMcu $ $ ',4r-I LI $.1
.24.) U1 C.)
..0.1344.,4M M
U$11 14 ',4o W $.4
1 fi0 U
41-4
i'^$0.6"RA
,................,"..........
m0..441
rat$1.1 AS0.418 g
U 14
1.1
uto.ti:$IJ
tn 01.0
awl Ut g01.4-
awl0J.0
awl U
t g0 14
0041
$4 .s.40 40UMg 8U u
1.40
4.1 .a0 u00f, 11v) ct.
U
. s.0
V) 044bl
°o14W
.0o B-ti) te
v t..44 inin .414 b0 14Y W'3)0O v).----
....11
11....
................................1.*
Oomrsol............a
I.
6.................................*.u.s
.1. ,10..............=
-62-V I
1

II, Classroom Instructional Experiences
BEST CONAVAILABLE
Please check only those experiences you have engaged in during student teaching. If you tried the experienceand no one observed you, place a check in the "Myself" column with the approximate date(s) you tried them. If someone did observe your effort, please identify the date(s) on which the observation(s) occurred, and the individualwho observed you. If someone reviewed your effort and provided analysis, please identify the approximate date(s) onwhich the review(s) occurred and the individual(s) who provided feedback on your effort, If you engaged in an ex-perience several times please providt. the approximate dates of the most recent performance, observation and/or review.More than one person may have observed the same experience and more than one person may have reviewed the same ex-perience, Please check all individuals listed in the column headings.
Instructional Experiences
A. Instructional Strategies:
Approximately When was the Performanceand by Whom was it Observed
Approximately When was the PerformanceReviewed on0 by Whom
ro41
44 44WA0 0
,ie IN
mg.14
tWt11It 14MUWUVUOMag
44awV0
14
P 2,ggt'>g
P
IN ,&)
X gtg
w0Vco
o
.1J4 4VPMO(!> 8
r-iaCl.
'04 IIOM,M11
,(,)1 a.
0vin 1.1
Ps 0VI V)
.o.1
"Oow.0 P..4
P HV 04.1 tAVI wlH
., d s.wtl,z
mg44v'1'41 11Mu8 :OH
voW
4
v'H i4W.UW00145 :o
P
p .11
.5 :0H
P0Vg5
'44,
;'g oot 8
0-4
aa.
731
00.L.: .04
I'A
gV5 LIP40
:1) V)V-4
"0'OW.8 m0 ,7)
Ps VV 0ort ti)V/ ...4
t4 r,:A w.1 a,
:5 ,7)
Administration, Grading andInterpretation of a Test
Administratior of aStandardized Test __-,----
Discovery -Inquiry Lesson_
IndividualizedInstruction Lesson
Lesson for Introduction to,or Closure of, a Unit
Lesson with Higher Orderguestioning_Techniques
MicroteachingLesson
_______
--..,--
-I---,----....
ParentConference
Plan and Supervisea Field Trip
---..,
Small croupInstruction Lesson
Test Administration ofTeacher or Student_ made Test
_..
Various Immediate and DelayedFeedback Procedures in Lesson
---
Wait time or belayedAnswering Lesson
R. Classroom Control Strategies:
Establinhes Class RoutinesJointl_y_ with Students 1 f I- L__ 1 1 1 --I L
1
1
I! L