document resume ed 095 673 ec 062 716 sattler, jerome m ... · document resume. ec 062 716....
TRANSCRIPT

ED 095 673
AUTHORTITLE
INSTITUTIONSPONS AGENCY
PUB DATENOTE
EDPS PRICEDESCRIPTORS
DOCUMENT RESUME
EC 062 716
Sattler, Jerome M.Intelligence Test Modifications on Handicapped andNonhandicapped Children. Final Report.San Diego State Univ. Foundation, Calif.Social and Rehabilitation Service (DREW), Washington,D.C. Div. r.f Research and Demonstration Grants.31 Oct 7282p.; See EC062717 for additional information
MF-$0.75 HC-$4.20 PLUS POSTAGECerebral Palsy; *Exceptional Child Research;*Intelligence Tests; *Material Development; *MentallyHandicapped; *Physically Handicapped; TestValidity
ABSTRACTThe effects of modifications in intelligence test
procedures ueon the scores obtained by 232 normal, 102 mentallyretarded, 106 cerebral palsied and 35 orthopedically handicappedchildren were investigated. Stanford-Binet tests in year-levels IIthrough V were modified to require only a pointing or yes/noresponse. The modified form appeared to be valid with IQs within 3points of scores obtained on the standard form. Additionally,Stanford-Binet tests at year-levels IX through XIII, three subtestsof the Wechsler Intelligence Scale for Children (Digit Span, BlockDesign, and. Coding) and a separate Memory for Block Designs test weremodified. The modified Stanford-Binet tests at the higher level werenot valid; the modified Digit Span Block Design subtests had asufficient degree of validity; while the modified Coding subtest andthe Memory for Block Designs test were significantly easier than thestandard subtest. Results indicated that some modified tests canserve as substitutes for standard tests in the assessment ofhandicapped children. (DB)

FINAL REPORT
WC IHIP.Mitfpu4kr.10 W Fen
etSt
ATIONOtl T TO OPIL 4 TI _1N
THIS DOCUMENT PAS MN REPRODUCED EPACnY AS RECEIVED FROMTHE PERSON OR ORGANIZATION ORIGINATING IT POINTS OF VIEW OR OPINIONSSTATED 00 NOT NECESSARISY RE RESENT OFFICIAL NATIONAS INSTITUTE OFEDUCATION POSITION OR POI-ICY
INTELLIGENCE TEST MODIFICATIONS ON HANDICAPPED AND NUNHANULUAPPED
CHILDREN
PROJECT NUMBER: 15-P-55277/9-02
GRANTEE AGENCY: San Diego State College Foundation
PROJECT DIRECTOR: Jerome M. Battler, Ph.D.
DATE: October 31, 1972
This investigation was supported, in part, by Research Grant 15-P-55277/942
from the Division of Research and Demonstration Grants, Soc1:11 acid Rehabili
tation Service, Department of Health, Education, and Welfare, WashingtOno
D.C., 20201

Significant Findings for Rehabilitation (and Social Service)
Workers
The investigation, which was designed to evaluate the effects of test
modifications on the performance of nonhandicapped and handicapped childrOk.resulted in a number of findings which should be of value to rehabilitation
and social service workers. The findings are listed below.
1, The modified Stanford-Binet tests located at year-levels II through V
appear to be valid. Therefore, children who have limited or no speech or
who have severe motor disabilities can be administered the modified testsas substitutes for the standard tests.
2. The modified WISC Digit Span and Block Design subtests appear to be
valid. The Digit Span subtest can be administered to children who havespeech difficulties since a pointing response appears to be an acceptablesubstitute for an oral response. The Block Design subtest can be admin-
istered to children who have motor difficulties because the examinerassembles the blocks into a design on instruction from the child.
The modified WISC Coding subtest resulted in an easier test.ThOrefore, the standard norms cannot be used. However, the modifiedsubtest does appear to be useful, and can be used as an experimental test
to assess the ability of cerebral-palsied and other handicapped children.
40 The modified Stanford-Binet tests which appear at year-levels IXthrough XIII, primarily memory tests, were easier than the standard tests.Mete results indicate that multiple-choice procedures for memory testsare likely to result in easier tests than procedures requiring the S to
respond by rote memory.
5. The Memory for Block Designs test was too easy for normal children.
However, there were many significant correlations between it and other
memory and ability tests. It can be useful for research purposes, but
needs to be expanded.
6. Degree of physical disability in cerebral-palsied children between 5and 16 years of age appears to be related significantly to their level of
intelligence.
1. The literature review indicated that the initial IQ's of cerebral-palsied children can be considered to be reliable and valid.
8. The project also supported in part other investigations related toexaminer effects, testing minority group children, and racial experimenter
effects. The appendix lists the publications relate; to these areas.

PREFACE
ACKNOWLEDGEMENTS
TABLES
FIGURES
INTRODUCTION
Contents
Page
ii
iii
iv
vii
2
3
3
5
7
8
9
9
9
11
12
16
16
20
31
35
35
REVIEW OF RELAXANT LITERATURE
Nonresearch Reports
Research Findings
Reliability and Validity of the IQ for Cerebral-Palsied Children
Discussion
PART I. STANFORD-BINET (FORM L -M) TESTS AT YEAR-LEVELS II THROUGH V
Methodology
Pilot Study
Composition of Sample for Lower Level
Procedure
Results
Analysis of Variance
Intercorrelations
Item Validity
Cerebral Palsied: Spastic vs. Nonspastic
Cerebral Palsied: Test-taking Ability
PART II. UPPER LEVEL STANFORD-BINET TESTS, THnEE WISC SUBTESTS, AND
MEMORY FOR BLOCK DESIGNS TEST 35
Methodology 35
Pilot Study and General Considerations 35
Composition of Sample for Upper Level 36
Procedure 37
Results 41
Stanford-Binet Tests 41
WISC Subtests 46
Memory for Block Designs 58
Cerebral Palsied: Spastic vs. Nonspastic 60
Discussion 60
REFERENCES 68
APPENDIX 73
i
Preface
The work reported herein represents an effort to evaluate the effects
of modifications in test procedures on the performance of both nonhandi-
capped and handicapped children. The modifications were designed so that
children with special disabilities could be evaluated with the materials
used in standard tests. The two most prominent tests in the field ofindividual assessment of children, the Stanford-Binet and WISC, were used
in the present investigation. The modifications used in the investigation,
for the most part, represent changes both in the test stimuli (usually
keeping the standard stimulus and adding distractor stimuli in order tochange'the test into a multiple-choice format) and in the method of
response (requiring only a pointing or a "yes" or "no" response). Thealterations were necessary in order to be able to use the items in the
assessment of children with special disabilities, especially disabilities
which involve speech or mctor coordination. We hope that the results of
the investigation will prove to be of value to psychologists, educators,
and rehabilitation personnel who work with physically handicapped children.

Acknowledgements
There are many individuals who have made this project possible.Without their support and help, the research could not have been carriedout. Thanks are due to the Social and Rehabilitation Service of theU.S. Department of Health, Education, and Welfare for providing thefinancial support necessary to carry out the project and to the Salr,DiegoState College Foundation for providing the necessary support services. I
am especially grateful to the following school districts and to thedirectors of school psychology services, superintendents, principals, andteachers, who cooperated on the project: Milton Grossman (School PsychologyServices, Sweetwater Union School District, Chula Vista, California);Les Six and John Horn (School Psychology Services, Chula Vista CitySchools, Chula Vista, California); John S. Dailey (Principal, SchweitzerTherapy Center, San Diego, California); Rodney Franklin (School Psycho-logical Services, Cajon Valley Union School District, El Cajon, California);Raymond A. Lanoue (Principal, California Avenue School, Vista, California);William T. Hawes, (Principal, Chula Vista Jr. High School, Chula Vista,California); Bill Wilson (San Diego City Children Centers, San Diego,California); and John Griffith (Planning and Research, San Diego CitySchools, San Diego, California).
In addition to the above schools and school districts, we receivedexcellent cooperation from many child care centers, preschools, and homesfor mentally retarded children. Their support and cooperation were muchappreciated. I wish to acknowledge the following centers: Home of theGuiding Hands; Angels Unaware Center for the Retarded; St. Madeleine'sSophie Preschool Training Center for Retarded Children; Child DevelopmentCenter, California State University, San Diego; Kiddie Korral ChristianPreschool; Christopher Robin's; Little One's Nursery School; Tree HouseNursery; Tiny Tim's Kindergarten & Nursery School; Loma Alta PreschoolNursery; United Methodist Preschool; Candy Cane College; PlayhouseNursery School; H Street Nursery School; Early Achievement Center; andCommunity Child Center.
During the early phase of the project, Elias Katz gave generouslyof his time to discuss the project with the principal investigator. Hishelp, too, was appreciated.
There were many examiners who did the actual testing of children andtheir help also has been appreciated. Thanks are due to Joseph Ryan,Nancy Anderson, Dorothy Morena, Al Davidson, William Grimes, James Karolek,Judy Pepper, Michaela Osborne, William Safarjan, Patricia Volkerts, andDan Skenderian. I am also grateful to Michael Dowdle, Dave Nichols, andDiane Dietz for their help on the project. Finally, I wish to thark thehundreds of children who participated in the project and their parents,who gave us permission to test their children. Their help has been muchappreciated.
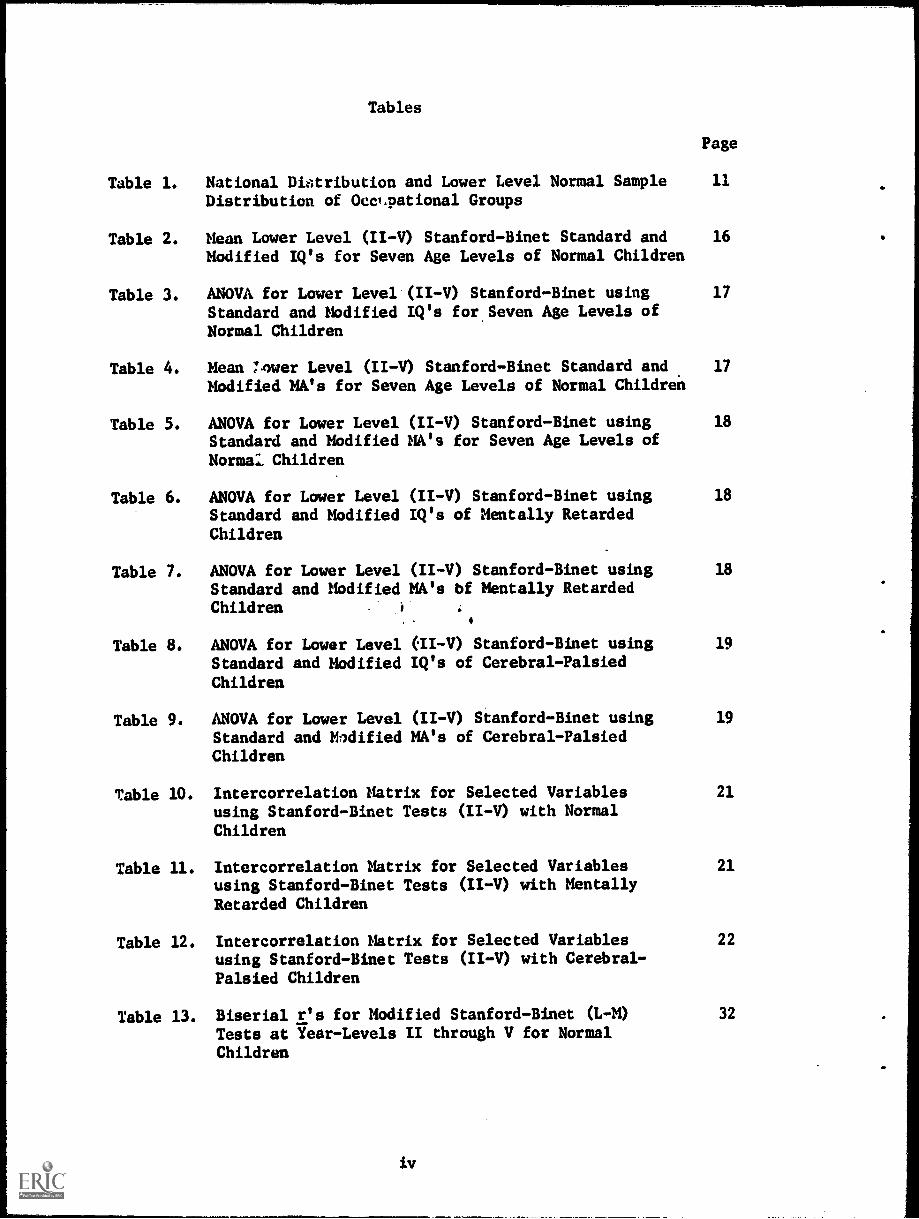
Tables
Page
Table 1. National Distribution and Lower Level Normal Sample 11
Distribution of Ocv.pational Groups
Table 2. Mean Lower Level (II-V) Stanford-Binet Standard and 16
Modified IQ's for Seven Age Levels of Normal Children
Table 3. ANOVA for Lower Level (II -V) Stanford-Binet using 17
Standard and Modified IQ's for Seven Age Levels ofNormal Children
Table 4. Mean 7ower Level (II-V) Stanford-Binet Standard and 17
Modified MA's for Seven Age Levels of Normal Children
Table 5. ANOVA for Lower Level (II-V) Stanford-Binet using 18
Standard and Modified MA's for Seven Age Levels ofNormal Children
Table 6. ANOVA for Lower Level (II-V) Stanford-Binet using 18
Standard and Modified IQ's of Mentally RetardedChildren
Table 7. ANOVA for Lower Level (II -V) Stanford-Binet using 18
Standard and Modified MA's bf Mentally RetardedChildren
Table 8. ANOVA for Lower Level (II -V) Stanford-Binet using 19
Standard and Modified IQ's of Cerebral-PalsiedChildren
Table 9. ANOVA for Lower Level (II-V) Stanford-Binet using 19
Standard and Modified MA's of Cerebral-PalsiedChildren
Table 10. Intercorrelation Matrix for Selected Variablesusing Stanford-Binet Tests (II-V) with NormalChildren
Table 11. Intercorrelation Matrix for Selected Variablesusing Stanford-Binet Tests (II -V) with Mentally
Retarded Children
Table 12. Intercorrelation Matrix for Selected Variablesusing Stanford-Binet Tests (II-V) with Cerebral-
Palsied Children
21
21
22
Table 13. Biserial r's for Modified Stanford-Binet (1041) 32
Tests at Year-Levels II through V for Normal
Children

Tables (continued) Page
Table 14. Biserial r's for Modified Stanford-Binet (L -N) Tests. 32
at Year-Levels II through V for Mentally RetardedChildren
Table 15. Biserial r's for Modified Stanford-Binet (L-M) Tests 33
at Year-Levels II through V for Cerebral-PalsiedChildren
Table 16. Biserial r's for Modified Stanford-Binet (L-M) Tests 34at Year-Levels II through V for Total Group
Table 17. National Distribution and Upper Level Normal Sample 36Distribution of Occupational Groups
Table 18. Correlations between Standard and Modified Upper 42Level Stanford-Binet Tests
Table 19. Number of Ss Obtaining Successes and Failures on Upper 45Leiel Standard and Modified Stanford-Binet Tests
Table 20. Chi Square Analyses for Proportion of Agreement of 46Successes and Failures on Upper Level Stanford-BinetTests
Table 21. Correlations between Standard and Modified WISC 47Subtest Scaled Scores and IQ's
Table 22. ANOVA for Standard and Modified WISC Digit Span 47Scaled Scores of Normal Children
Table 23. ANOVA for Standard and Modified WISC Digit Span 47Scaled Scores of Mentally Retarded Children
Table 24. ANOVA for Standard and Modified WISC Digit Span 48Scaled Scores of Cerebral-Palsied Children
Table 25. ANOVA for Standard and Modified WISC Digit Span 48Scaled Scores of Orthopedically Handicapped Children
Table 26. ANOVA for Standard and Modified WISC Block Design 48Scaled Scores of Normal Children
Table 27. ANOVA for Standard and Modified WISC Block Design 49Scaled Scores of Mentally Retarded Children
Table 28. ANOVA for Standard and Modified WISC Block Design 49Scaled Scores of Cerebral-Palsied Children
Table 29. ANOVA for Standard and Modified WISC Block Design 49Scaled Scores of Orthopedically Handicapped Children

Tables (continued)
Table 30.
Table 31.
Table 32.
Table 33.
Table 34.
Table 35.
Table 36.
Page
ANOVA for Standard and Modified WISC Coding Scaled 50
Scores of Normal Children
ANOVA for Standard and Modified WISC Coding Scaled 50
Scores of Mentally Retarded Children
ANOVA for Standard and Modified WISC Coding Scaled 50
Scores of Cerebral-Palsied Children
ANOVA for Standard and Modified WISC Coding Scaled 50
Scores of Orthopedically Handicapped Children
ANOVA for Four Rows of Modified WISC Coding with 51
Normal Children
ANOVA for Four Rows of Modified WISC Coding with 51
Mentally Retarded Children
ANOVA for Four Rows of Modified MSC Coding with 52
Cerebral-Palsied Children
52
ANOVA for Standard and Modified WISC IQ's of Normal 52
Children
ANOVA for Standard and Modified WISC IQ's of 53
Mentally Retarded Children
ANOVA for Standard and Modified WISC IQ's of 53
Cerebral-Palsied Children
ANOVA for Standard and Modified WISC IQ's of 53
Orthopedically Handicapped Children
Intercorrelation Matrix for Selected Variables 55
in Normal Group
Intercorrelation Matrix for Selected Variables 55
in Mentally Retarded Group
Intercorrelatiun Matrix for Selected Variables 56
in Cerebral-Palsied Group
Intercorrelation Matrix for Selected Variables in 57
Orthopedically Handicapped Group
Memory for Block Designs Standard Scores for Three 58
Groups
Correlations between Memory for Block Designs and 59
other Variables
Table 37. ANOVA for Four ROws of Modified WISC Coding with
Orthopedically Handicapped Children
Table 38.
Table 39.
Table 40.
Table 41.
Table 42.
Table 43.
Table 44.
Table 45.
Table 46.
Table 47.
vi

Figures
Page
Figure 1, Three-Hole Form Board (II, 1) 23Figure 2. Block Building: Tuwer .(II, 4) 23
Figure 3, Picture Vocabulary (II, 5) 23
Fiore 4. Naming Objects (11-6, 3) 23
Figure 5. Picture Vocabulary (11-6, 4) 24
Figure 6. Repeating Two Objects (11-6, 5) 24
Figure. 7. Obeying Simple Commands (11-6, 6) 24
Figure 8, Three -Hole Form Board: Rotated (11-6, alt.) 24
Figure 9. Picture Vocabulary (III, 2) 25
Fiore 10, Block Building: Bridge (III, 3) 25Figure 11. Picture Hmories (III, 4) 5Figure 12. Copying a Circle (III, 5) 25
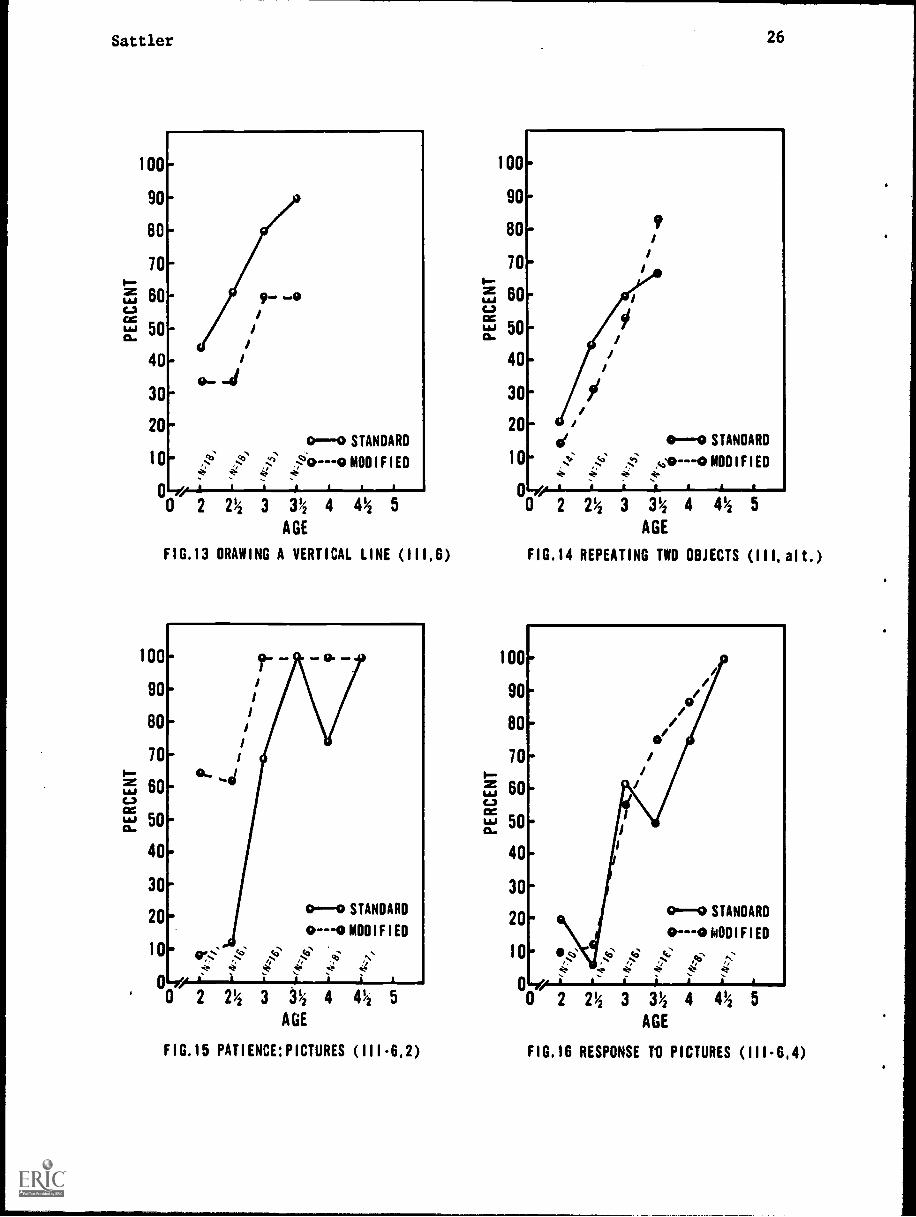
Figure 13, Drawing a Vertical Line (III, 6) 26
Figure 14, Repeating Two Objects (III, alt.) 26
Figure 15. Patience: Pictures (111-6, 2) 26
Figure 16, Response to Pictures (111-6, 4) 26
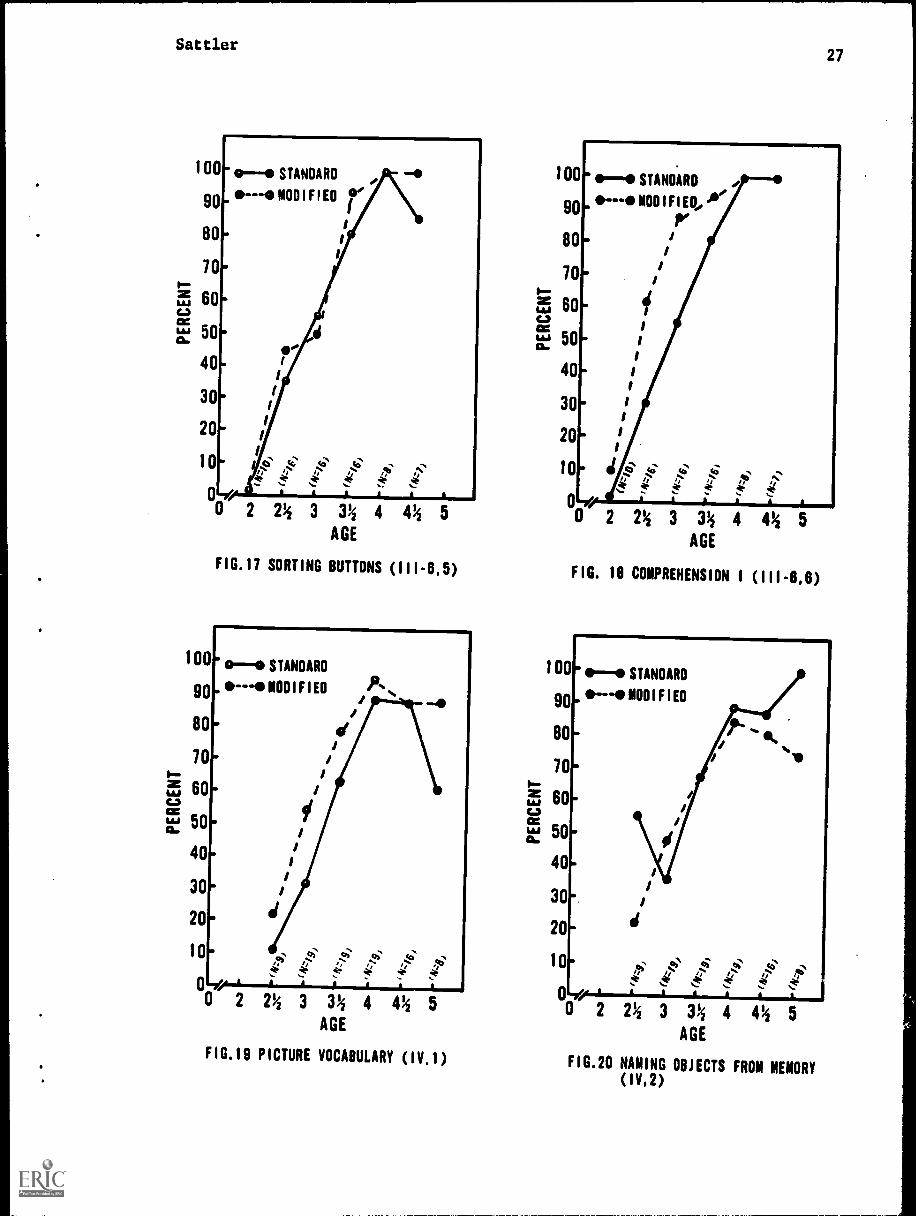
Figure 17, Sorting Buttons (111-6, 5) 27
Figure 18, Comprehension I (111-6, 6) 27Figure 19. Picture Vocabulary (IV, 1) 27
Figure 20. Naming Objects from Memory (IV, 2) 27
Figure 21, Opposite Analogies I (IV, 3) 28
Figure 22, Comprehension II (IV, 6) 28
Figure 23. Memory for Sentences I (IV, alt.) 28
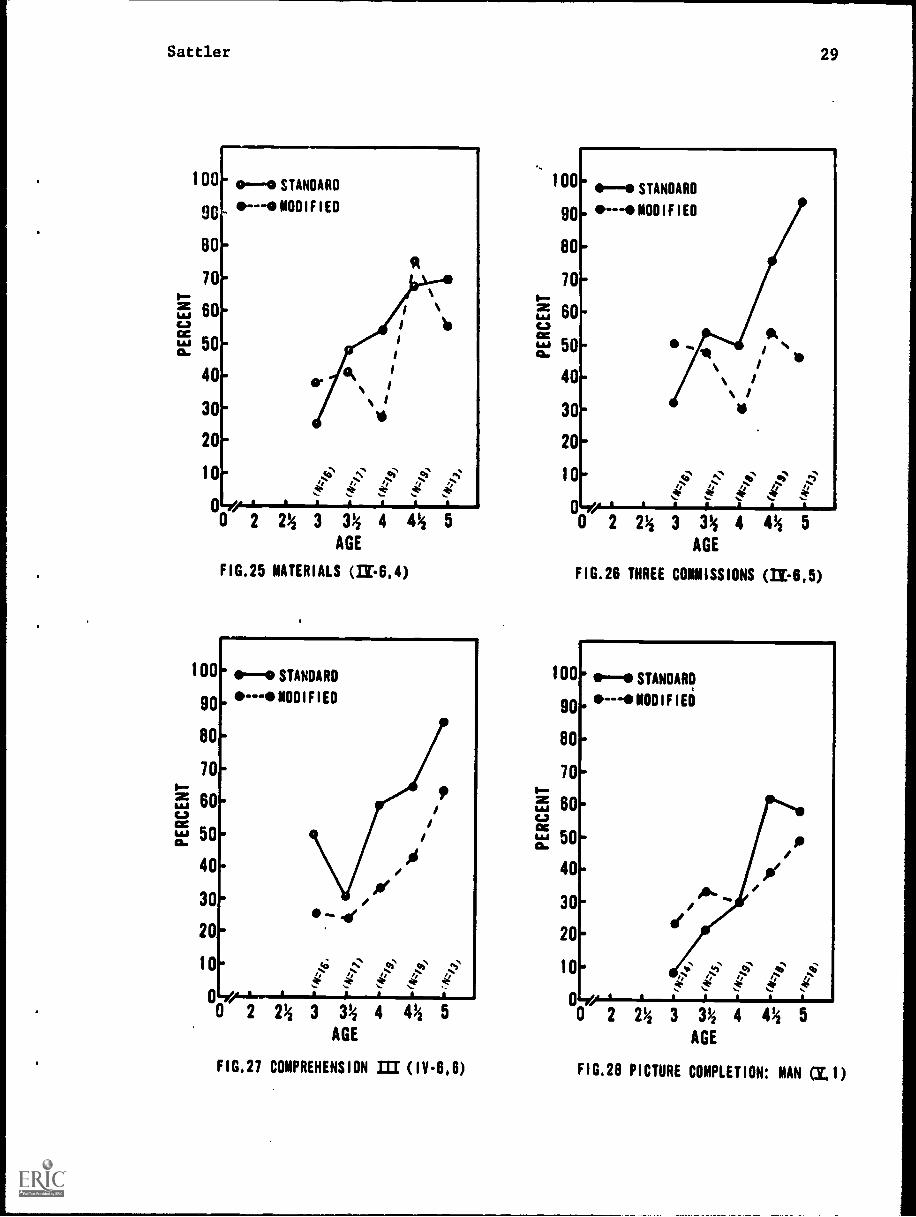
Figure 24. Opposite Analogies I (IV-6, 2) 28Fi.gure, 25. Materials (IV-6, 4) 29
Figure 26. Three Commissions (IV-6, 5) 29Figure 27. Comprehension III (1V-6, 6) 29
Figure a, Picture Completion: Man (V, 1) 29
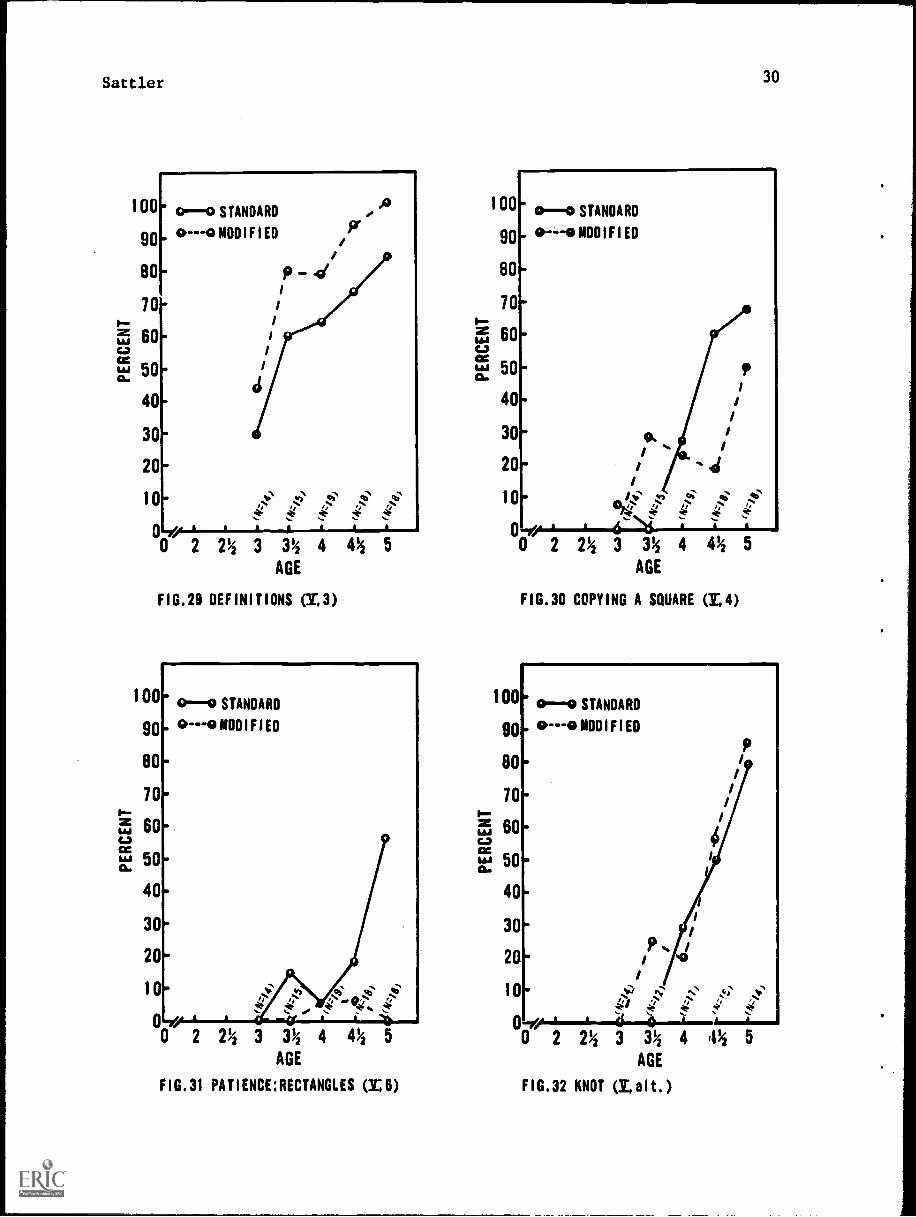
Figure 29. Definitions (V, 3) 30
Figure 30. Copying a Square (V, 4) 30
Figure 31. Patience: Rectangles (V, 6) 30
Figure 32. Knot (V, alt.) 30
Figure 33. Memory for Designs I (IX, 3) 43Figure 34. Memory for Sentences II (XI, 4) 43
Figure 35. Memory for Designs II (XII, A) 43
Figure 36. Plan of Search (XIII, 1) 44Figure 37. Memory for Sentences III (XIII, 3) 44Figure 38. Copying a Bead Chain from Memory (XIII, 6) 44
Figure 39. Arrangement of Block Design Stimulus Board . 39
Figure 44. Memory for Block Design Stimulus Cards 40
(90° = 90° rotation; FG = figure groundinversion; R = correct answer)
vii

Settler 1
Abstract
The effects of modifications in test procedures upon the scoresobtained by nonhandicapped and handicapped children were investigated.The modified tests only required a pointing or "yes/no" response. First,Stanford-Binet tests in year-levels II through V were modified. The Sswere 133 normal, 27 mentally retarded, and 30 cerebral-palsied children.The modified form appears to be valid (rs of .83 to .92 with the standardform and IQ's within 3 points of the standard form). Second, 6 Stanford-Binet tests at year-levels IX through XIII, primarily memory tests, and3 WISC subtests were modified. A Memory for Block Designs test was alsoevaluated. The Ss were 99 normal, 75 mentally retarded, 76 cerebralpalsied, and 35 orthopedically handicapped children. The modifiedStanford-Binet tests were not valid because the tests were too easy. Themodified Digit Span and Block Design subtests, however, had a sufficientdegree of validity (rs of .66 to .92). The modified Coding subtest wassignificantly easier than the standard subtest. The Memory for BlockDesigns test also was too easy, but it appears to be a promising test forevaluating memory ability. The results indicate that some modified testscan serve as substitutes for standard tests in the assessment of handi-capped children.
Settler 2
Introduction
Intelligence tests which are designed for and standardized on a non-handicapped population are often administered to handicapped children.However, the physical disabilities of these children frequently make itimpossible for them to perform on such tests. Therefore, modifications intest procedures are often necessary, butmodifications can create probvismin the use of test norms. Many writers have made suggestions for alteringstandard tests, but few suggestions have been put to experimental test.The present project was designed to evaluate the effects of modificationsin test procedure upon the performance of nonhandicapped and handicappedchildren. The two scales that were studied were the Stanford-BinetIntelligence Scale and the Wechsler Intelligence Scale for Children (WISC).Selected test:. or subtests from each scale were evaluated. In additionto evaluating the effects of modifications, a multiple choice Memory forBlock Designs test was studied. All modifications were designed so thatonly a pointing or "yes/no" response was required from the child.
The procedures developed in the present investigation may be usefulfor those engaged in the intellectual assessment of children who havehandicaps which interfere with their ability to take standard tests.While it is not likely that modifications in standard procedures willproduce results that are equivalent to those obtained under standardprocedures, it is important to know to what extent the modified procedureyields results that are similar to those obtained under standard procedures.
Two general types of modifications can be delineated, and both wereevaluated in the present investigation. One concerns modifications intest stimuli; the other concerns modifications in test responses. Modifi-cations in test stimuli are more difficult to design than modificationsin test responses. The reason for this is that in going from a situationin which one stimulus is used to one in which four stimuli are used threenew stimuli must be developed and evaluated. Thus, for example, inmodifying the Picture Vocabulary test of the Stanford-Binet, from a testi which the child says the name of the picture to a multiple-choice testin which the child points to one of four pictures for each word, 54 newstimuli have to be designed for the 18 items that are in the test.Modifications in test responses are easier to construct when only theresponse modality is being altered because there are limited possibilitiesthat are involved when changes are made from the standard response modalityto a pointing response modality.
It is important to recognize that modifications in test stimuli arelikely to alter the nature of the item, and consequently, the validityand reliability of the item may be affected. However, the validity andreliability of items which involve alterations solely in the responsemodality are likely to be less affected. The standard Stanford-Binetitems that require verbal responses may require the child to recall thecorrect answer. Many possible choices are available to him. However,

Settler
when the item is changed to a multiple-choice format, the child must
recognize the correct choice. Recognition, in this case, may alsoinvolve a process of discrimination (i.e., eliminating three otherpossible choices) that was not involved in the usual case of recall.Therefore, the validity of a test should be evaluated whenever it ismodified.
3
The investigation consisted of two separate but related studies. InPart I, the modifications of tests located at the lower year levels ofthe Stanford-Binet were studied. An effort was made to modify tests inyear-levels II through V to enable children who are not able to speak orwho have motor difficulties to respond to tests. In Part II, sixStanford-Binet tests and three WI% subtests were modified, and an expe_i-mental test--Memory for Block Designs--was studied. Different samples ofchildren were used for each part of the investigation.
Review of Relevant Literature
The review of literature is divided into four sections. In thefirst section, nonresearch reports are described. These reports focuson the inappropriateness of standard procedures in testing handicappedchildren, the need for modifications, the problems associated with theuse of test norms, and suggested modifications without research findings.The second section examines research findings. The third section focuseson the problem of the reliability and validity of the IQ obtained whentesting cerebral-palsied children. The fourth section discusses thegeneral findings. The review focuses on the cerebral palsied, not onlybecause of the abundance of material available on this condition, butalso because the problems associated with testing the cerebral palsiedare similar to those encountered with many other handicapped groups.Tests which have been especially designed to evaluate handicappedchildren (e.g., the Columbia Mental Maturity Scale and the Hayes-Binet)are not reviewed.
Nonresearch Reports
Inappropriateness of Standard Test Procedures
The motor, speech, visual, and auditory difficulties of cerebralpalsied and other handicapped children greatly limit the applicabilityof standardized tests, and make caution mandatory in interpreting thetest results (Bice & Cruickshank, 1966; Burgemeister & Blum, 1949;Cardwell, 1947; Doll, 1954; Garrett, 1952; Haeussermann, 1952). Sincecerebral-palsied children frequently perform motor tasks in a slow andlaborious manner, they are at a particular disadvantage when time limitsare imposed. It is extremely difficult to interpret test failures madeby cerebral-palsied children because the examiner is not always certainwhether the failure is due to the child's physical disability or to his

SAttler 4
limited mental ability (Garrt.--t, 1952). The "literal administration,
scoring and the interpretation of the Stanford-Binet tends to under-estimate a child's ability almost in proportion with the child's severity
of handicaps [Katz, 1955, p. 18]." Similarly, McIntire (1938) observed
that standardized test scores may reflect the extensiveness of thecerebral-palsied child's physical handicap rather than the level of his
intellectual ability. Lord (1937) further maintained that difficultiesin test interpretation often make the concept of mental age misleading
when it is applied to cerebral-palsied children.
Need for Modifications
In order to make standardized tests applicable to handicappedchildren, many modifications in administration and/or testing procedureshave been advocated (Allen, 1962; Allen & Jefferson, 1962; Arnold, 1951;Berko, 1953; Bice, 1948; Bice & Cruickshank, 1966; Dunsdon, 1952;Eisenson, 1.954; Heilman, 1949; Holt & Reynell, 1967; Jewell & Wursten,1952; Katz, 1956, 1958; Keats, 1965; Kessler, 1966; Melnick, 1954;Meyer & Sinmel, 1947; Michal-Smith, 1955; Miller & Rosenfield, 1952;Newland, 1963: O'Brien & Hewson, 1948; Portenier, 1942; Russ & Soboloff,1958; Schonell, 1956, 1958; Sievers, 1950; Strother, 1945; Taylor, 1959).Testers report that they frequently modify standard procedures whenexamining handicapped children (Braen & Masling, 1959). The form of the
modification, however, is dependent on the judgment of each individualexaminer; in effect, each examiner may be creating his own test.Generally, little is known about the effects of modifications on theobtained test results (Sattler & Theye, 1967). For example, Blum,
Burgemeister & Lorge (1951) wrote that in using modifications, "there is
insufficient attention paid to cross checking the results with those of
a more normal group of equated children [p. 177]." McCarthy (1958) too,
noted, "The problem is: what do normal children do with the same [i.e.,
modified] tasks? [p.19]."
Use of Test Norms
Can standardized test norms be used when there have been modifica-
tions in test administration? Strother (1945) and Braen & Masling (1959)noted that test norms cannot be used when standardized tests have beenaltered, while Maisel, Allen & Tallarico (1962) pointed out that it is
not known to what extent test modifications with handicapped children
invalidate the norms established on a non-handicapped population.Katz's (1956) suggestion to omit those subtests which require physicalabilities not possessed by the handicapped child leads to problemsassociated with reliability and validity (cf. Braen & Masling, 1959).

Sattler 5
In spite of the difficulties in using test norms, it is stillimportant to compare the cerebral-palsied child's performance with thatof the normal child. While it is necessary, at times, to accommodate thetest to the child, "No testing is valid if it is so unique that we cannotmeasure or place the child within accepted standardized normative rangesof mental development Nichal-Smith, 1955, p. 151." It is important to
compare the cerebral-palsied child with the non-handicapped child, becausethe latter sets the standards in the world at large (Allen, 1959; Maurer,1940).
Suggested Modifications without Research Findings
There are a number of writers who have suggested specific alterationsin intelligence test administration without presenting normative orstatistical data. The effects of the suggested modifications are thereforeunknown. Presenting items in a multiple-choice format, pantomimingresponses, steadying the child's hand, enlarging objects, and having thechild point are examples of untested modifications for use with cerebral-palsied and other handicapped children (Allen & Jefferson, 1962; Bice &Cruickshank, 1966; Dunsdon, 1952; Eisenson, 1954; Jewell & Wurstein, 1952;Katz, 1958; Keats, 1965; Neuhaus, 1967; Newland, 1963; O'Brien & Hewson,1948; Schonell, 1958).
Research Findings
Seven studies have reported non-significant differences in scoresbetween tests which were modified and tests which were administeredusing standard procedures, while three studies reported significantdifferences. Unfortunately, most studies failed to compare handicappedand non-handicapped groups; many of the studies also failed to use arepeated-measures design.
Nonsignificant Findings
Of the seven experiments with nonsignificant findings, four studiednon-handicapped populations (Arnold, 1951; Maisel, Allen, & Tallarico,1962; Tozier, 1968; Wamba & Marzolf, 1955), two studied handicappedpopulations (Katz; 1956; Livingston, 1957, and one studied both handi-capped and non-handicapped populations (Wattron, 1956).
Maisel, Allen, and Tallarico (1962) gave the Leiter InternationalPerformance Scale (Leiter, 1952) to normal children between the ages offive and 11, using the standard procedure and also using a modifiedprocedure which consisted of having the children indicate by pointingwhere they wanted the examiner to place the blocks. Because the adaptedand standard methods of administration did not yield significantlydifferent scores, the authors suggested that the standardized LeiterScale norms could be used with both administrative procedures.

Sattler 6
Arnold (1951) also studied the effects of having non-handicapped
children, who had either average or retarded mental ability, motion
where to place the Leiter Scale blocks. In addition, he also studied the
effects on the Porteus Mazes (Porteus, 1959) test of a pointing modifi-
cation which consisted of having the subjects motion where to draw the
lines. All subjects, too, were administered the Stanford-Binet Scale
(Form L) (Ferman & Merrill, 1937) under standard conditions. Because the
correlations between the Leiter Scale (modified) and the Stanford-Binet
(standard) and between the Porteus Mazes (modified) and Stanford-Binet
(standard) were highly significant in both groups (rs ranged from .81 to
.94), Arnold concluded that both the Leiter Scale and the Porteus Mazes
provided valid scores with the modified procedures.
Tozier (1968) studied the effects of a pointing modjication.of the
Block Design subtest of the WISC (Wechsler, 1949). A board with six
blocks showing the various possible positions of the blocks used in the
construction of the designs was presented as the key for all experimental
group subjects (adolescent non-handicapped males and females). Their
task was to point to one of the blocks on the board and then to indicate
where the block should be placed on a white, unlined sheet of paper. The
experimental and control (standard administration) groups did not obtain
significantly different scores. Since Tozier did not use a repeated-
measures design, the relationship between the scores obtained using the
two procedures is not known.
Wamba and Marzolf (1955) modified the Progressive Matrices test by
having non-handicapped subjects between the ages of six and 11 indicate
their responses by means of eye movements. The subjects achieved similar
scores under both standard and eye-movement response conditions.
Katz (1956) proposed a pointing-scale method for scoring the
Stanford-Binet (Form L) which involved scoring only those items that
could be answered by pointing, and then prorating the score to obtain the
mental age. He reported that a group of cerebral-palsied preschoolchildren obtained equivalent scores under the standard and pointing-scale
methods. Normal children were not studied.
Livingston (1957), studying partially sighted children between the
ages of eight and 10, reported that enlarging the visual items of the
Stanford-Binet (Form L) did not produce significantly different scoresbetween the experimental and control groups. Non-handicapped children
were not studied.
Wattron (1956) first studied blind children between the ages of seven
and 17. The scores they obtained on a block design test, which required
the use of tactile-kinesthetic perception, correlated highly with their
Hayes-Binet scores. He then found that a non-handicapped group (matchedfor age and sex with the blind group) did not differ from the blind group
in their scores on the modified test. However, the non-handicapped group
was not given a standard block design test, and therefore it is not known
to what extent the modified block design test produced scores which were
different from those which would have been obtained using the standard
procedure.

Settler 7
Significant Findings
Three studies reported that altering standard testing proceduresresulted in scores which were not comparable to those obtained with thestandard method. Graham & Shapiro (1953) found that in a group of normalchildren between the ages of 6-3 and 12-2, pantomime instructions led tosignificantly lower WISC Performance scores than did standard instructions.An oral Digit Symbol test, developed by Kaufman (1966) and administeredto two adult medical-patient samples, was completed in less time than thestandard written version. However, when the sample was divided into groupsof young, middle, and older patients, no significant differences were foundbetween oral and written performance in the youngest age group, whereasin the middle and older groups, more time was taken on the written versionthan on the oral version.
Koppitz (1970) studied the effect of presenting three to seven digitsin an auditory and visual modality and the effect of having an aural andwritten response modality. The subjects were normal children in gradesone through five. The visual modality of presentation consisted of showingall of the digits simultaneously on a card for 10 seconds to the child.This procedure differs from the usual digit span procedure in which thestimuli are presented successively. The visual presentation resulted inhigher scores than the auditory presentation. However, the two responsemodalities were not significantly different.
It is probable that the conflicting findings are due partly to typeof modification, subject population, and test content. The majority ofthe findings suggest, however, that modifying test procedures does notnecessarily produce significant changes in performance.
Reliability and Validity of the la forCerebral-Palsied Children
Writers have suggested, without presenting research data, that it isdifficult to determine the reliability and validity of the IQ for cerebral-palsied children. Linde (1964), for example, noted that the reliabilityand validity of the tests found in the standard Wechsler and Stanford-Binetscales are too often dependent on normal speech and manual dexterity,thereby restricting the performances of cerebral-palsied children. Mecham,Berko & Berko (1960) wrote that the mental age of cerebral-palsiedchildren increases in irregular steps; therefore, the mental age obtainedon any one testing may not be reliable. They also cautioned against theuse of first scores as the sole criterion in long-range planning. Russ &Soboloff (1958) wrote that, with cerebral-palsied children, the results ofthe initial psychometric examination are usually the lowest, and Sievers(1950) cautioned that a diagnosis of mental retardation should not begiven to a cerebral1palsied child on the basis of a single administrationof an intelligence test.

Sattler 8
Test-retest and follow-up studies do not support these opinions.Portenier (1942) reported that retest IQs for 13 cerebral-palsiedchildren, taken from a sample of 40 cerebral-palsied children between theages of 2-7 years and 19-10 years, were in close agreement with those
obtained from the first testing (reliability coefficient and retestinterval were not reported). In most cases, the Stanford-Binet (Form L)
was used for both testings.
Kogan (1957) studied test-retest IQ's using the Cattell InfantIntelligence Scale (Cattell, 1960), the Stanford-Binet Scale (Form L),or some combination of the two. The subjects were 31 cerebral-palsiedchildren who had initially been tested between 2-0 and 6-9 years of age.Retest intervals ranged from seven to 32 months. There was an averagedifference of 6.5 points between the two tests; this was attributablelargely to the probable errors of the test scores, therefore the reliabilityof the IQ's was highly satisfactory.
Crowell and Crowell (1954) studied test-retest IQ's obtained fromthe Stanford-Binet Scale (form not indicated) and from a variety of otherindividually administered intelligence tests. The sample consisted of 61cerebral-palsied children (ages not indicated). The average test-retest
interval was 30 months. The obtained reliability coefficient of .92indicated that the initial IQ's of the subjects were adequately reliable.
Taylor (1959) conducted a follow-up study of 214 of 1800 cerebral-palsied subjects who had initially been tested on the Stanford-BinetScale (form not indicated). The initial testing for all subjects wasusually before age six and the follow-up was from three to 12 years later.The Wechsler Scales were generally used for the reevaluation. Only fourof the 214 children changed by more than one IQ classification range,therefore indicating satisfactory reliability for the initial IQ classi-
fication.
Klapper and Birch (1966) obtained social, economic, and educationaldata for a sample of 89 out of 155 cerebral-palsied subjects. The 89subjects were between 16 and 28 years of age and had been administered anindividual intelligence test 14 to 15 years prior to the follow-up period.The initial IQ was found to have some prognostic significance, especiallyin relation to levels of employment and educational achievement. Theirresults indicate that the initial IQ has some predictive validity. Thug,although there is some controversy' concerning the reliability of the IQsobtained on first testing cerebral-palsied children, the studies reviewedsuggest that they usually have a satisfactory degree of reliability.
Discussion
The present survey indicates a need for studies using both normaland handicapped children to more fully evaluate the effects of modifica-
tions in intelligence test procedures. For the purposes of educationaland vocational planning, it is important to compare a handicapped child'sintellectual level with that of a handicapped group but also with that ofa non-handicapped group.

Sattler 9
While there are a number of non-verbal tests which are useful forthe assessment of intellectual functioning in the handicapped child(cf. Allen, 1958; Allen & Collins, 1955; Allen & Jefferson, 1962), theStanford-Binet and Wechsler tests are still frequently used (cf. Braen &
Masling, 1959). Many authors have felt that the Stanford-Binet is anexcellent instrument for assessing intelligence, even though modificationsare sometimes necessary and even though many problems are encountered in
administering the test to some handicapped children (Bice, 1948; Doll,Phelps & Melcher, 1932; Dunsdon, 1952; Eriksen, 1955; Hohman & Freedheim,1958; Katz, 1955; Kogan, 1957; Lantz & Wolf, 1956; Michal-Smith, 1955;Miller & Rosenfeld, 1952; Portenier, 1942; Schonell, 1956; Sievers, 1950;Strother, 1952). However, there is an obvious need to standardize suchmodifications.
In addition to the need for improved ways of modifying standardtests, there is also a need to develop new methods for the assessment ofthe mental capacities of handicapped children (cf. Agassiz, 1955). Tech-niques need to be developed which can be used to assess children whosehandicaps involve several avenues of communication (Kogan, 1957; Russ &Soboloff, 1958).
Research studies dealing with test modifications should use bothcorrelational and analysis of variance designs; it is important to knowthe degree of relationship between scores obtained under modified andstandard procedures, as well as whether there is a statistically signifi-cant mean difference between such scores. Caution is needed in applyingthe results obtained from group studies to the assessment of any oneindividual. While significant group differences may not appear in thescores obtained under modified and standard procedures, individualsubjects may show large differences under the two procedures. It is
suggested, therefore, that new norms be developed, norms based uponscores obtained under modified procedures covering the chronological ageranges to which the test is applicable for both normal and handicappedpopulations.
PART I: Stanford-Binet LForm L-M), Tests at Year-levels II through, V
Methodology
Pilot Study
Every test in year-levels II through V of the Stanford-Binet(Form L-M) was studied, and modifications were made for those tests whichcould not be responded to by pointing in the standard form of the test.The following tests were not modified because the standard version of the

Sattler 10
test requires a pointing response: Delayed Response (II), IdentifyingParts of the Body (II and 11-6), Identifying Objects by Name (II),Identifying Objects by Use (II-6), Comparison of Balls (1II-6),Discrimination of Animal Pictures (III-6), Comparison of Sticks (III-6),Pictorial Identification (IV and IV-6), Discrimination of Forms (IV),Aesthetic Comparison (IV-6), Pictorial Similarities and Differences I(IV-6), and Pictorial Similarities and Differences II (V). The test"Word Combinations" at year-level II, however, was not used because nomodification appeared to be feasible.
In the pilot study, two tests, "Stringing Beads" (III) and "PaperFolding: Triangle" (V), were part of the original modification. However,the tests proved to be too difficult to modify, even after severalmodifications were attempted. Consequently these two tests were droppedfrom the final form.
During the pilot phase of the investigation, attention was given toconstructing pointing modifications for each test and to develop anexaminer's manual. Seven groups of children participated in the pilot
phase to evaluate the modifications. The test modifications that wereinitially proposed needed revision because some turned out to be too easywhile others turned out to be too difficult. The samples in the pilotphase consisted of seven to 10 normal children who were given variousversions of the modified tests. In the pilot phase, item analyses weremade for each test, for each item of a test, and for each responsealternative of a test. The item analyses lead to further revisions of
the tests. Directions also were revised on the basis of commentsobtained from the examiners.
Part of the difficulty in constructing modified tests was that someof the concepts on the Stanford-Binet are difficult to depict in pictureform. For example, the correct answer for one of the Opposite Analogiesitems (IV) ("The snail is slow, the rabbit is ") is "fast." Theconcept "fast" is difficult to draw, especially when it must be recognizedby a 4-year-old child. The correct answer ("dark") for a second OppositeAnalogies item ("In the daytime it is light, at night it is ") alsowas difficult to depict. Another difficult item was depicting "glass" forthe correct answer to the Materials Test (IV-6) item b which asks what awindow is made of.
The test "Repeating 2 Digits" (II-6) was too difficult when it wasadministered by pointing to numbers on a card which showed numbers 1through 9 and then asking the child to point to the same numbers on thecard. Another modification which consisted of showing the digits oncards one at a time and then asking the child to point to the digits ona card which showed the numbers 1 through 9 (as above) also was toodifficult for 21/2-year-old children. The test then was changed from using"digits" as stimuli to using "objects" as stimuli.

Sattler 11
Composition of Sample for Lower Level
Preschools throughout San Diego County were contacted in order toobtain children who were between 2 and 5 years of age. In some cases,children were obtained through personal contacts. This occurred morefrequently with children in the 2- to 3-year-age level because childrenin this age level usually do not attend preschools. Special centerswere contacted in order to obtain children for the mentally retardedgroup and for the cerebral-palsied group. Children in all groups weretested only with parental permission or with permission of the centerstaff for those cases where parents were not available. Age and dis-ability were the only two selection criteria for inclusion in thementally retarded and cerebral-palsied groups. Age, birthdate, parentaloccupation, and no disability were the four selection criteria forinclusion in the normal group. In none of the groups was sex used toselect children.
Normal
The normal sample was selected so that parental occupation conformedas closely as possible with the national distribution of occupationalgroups. The birthdays of the children at the time of testing were withintwo-months of each half-year interval beginning with age 2 and ending atage 5 (14 chronological age = 47.9 months). No attempt was made to havean equal number of males and females. There were 133 children in thesample, 70 boys and 63 girls. Table 1 shows the national distributionof occupational groups and the distribution of occupational, groups of theparents of the children in the normal sample. The largest. iscrepanciesare four percentage points in categories III and IV. Overall, thedistribution of parental occupations in the present sample appears toconform to that of the national distribution.
Table 1. National Distribution and Lower Level Normal Sample Distributionof Occupational Groups
NormalOccupational Group National Group
% N %
I Professional & Technical 10 17 13
II Managers, Officials, Proprietors 16 21 16Farm Owners & Farm Managers
III Clerical & Sales Workers 14 24 18
IV Craftsmen, Foremen & Operatives 39 46 35
V Service Worker-Public & Private 6 10 8
VI Laborers-Farm & Nonfarm 10 15 11
95 133 101

Settler 12
Mentally Retarded
There were 27 children in the mentally retarded group, 17 boys and10 girls (4 chronological age = 43.67 months).
Cerebral Palsied
There were 30 children in the cerebral-palsied group, 18 boys and12 girls (M chronological age = 55.67 months).
Examiners
The examiners were full time graduate students in psychology atCalifornia State UnIversity, San Diego. All examiners had completedsuccessfully a course in individual intelligence testing and werecompleting their remaining course requirements for the masters' degree.There were a total of 11 examiners, six male and five female. There was
no attempt to randomly assign subjects to examiners because different
examiners served during various time periods of the project and theavailability of subjects was dependent on a number of factors, includingthe obtaining of permission from various schools, agencies, and parents
to test children. Examiners were provided with names of subjects after
parental permission slips were returned. There was little possibilityof bias in the procedures that were used because assignments wereconstantly rotated, that is, examiners were usually assigned subjects fora two-week period and had to return for further names after they had
tested their assigned children. All examiners were supervised by theproject director, Jerome M. Sattler. Questions about scoring andadministration were discussed whenever they arose.
Procedure
Test Order
The standard and modified tests were administered in counterbalanced
order. Random permutations of 2 were used to determine the order in whichthe two forms were administered (i.e., standard or modified first).
Test-Retest Intervals
The test-retest interval ranged from 1 to 20 days. Of the 190children tested, only seven were given the standard and modified testsmore than seven days apart.
Materials,
The directions for the modified tests, the test stimuli, and therecord booklet which were used in the project are contained in aseparate part of the Final Report, entitled "Supplement to the Final
Report." However, this section contains a brief description of each ofthe modifications that were designed for year-levels II through V of

Sattler 13
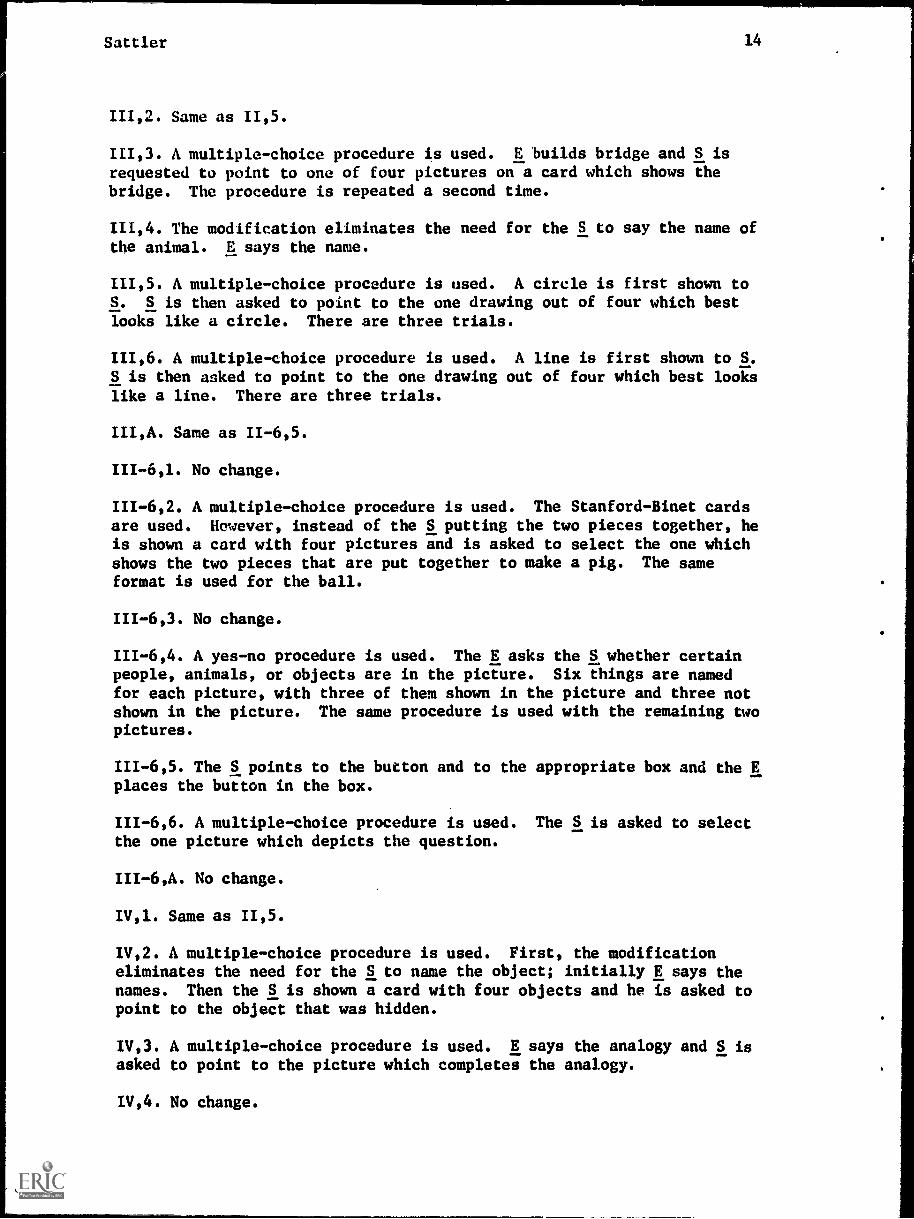
the Stanford-Binet. In year-levels II through V there are 49 tests.Seven tests appear more than once making a total of 42 separate tests.Of these 42 testa, 27 were modified, 12 were not modified because theyonly require a pointing response, and three were not used in the modifiedform. A description of each modification follows.
Description of Modifications of Stanford-Binet Tests atYear-Levels II -V
11,1. S points to a block after E has pointed to a recess. E then places
block in recess for S.
11,2. No change.
11,3. No change.
11,4. A multiple-choice procedure is used. E makes a four-block towerand S is asked to point to one of four pictures on a card which shows afour-block tower.
11,5. A multiple-choice procedure is used. E says word and S is asked topoint to one picture which indicates the word.
11,6. Not used.
II,A. No change.
11-6,1. No change.
11-6,2. No change.
11-6,3. Six items are placed before the S. E says the word and S isasked to point to the item.
11-6,4. Same as 11,5.
11-6,5. The Repeating 2 Digits test was modified in three ways. First,
objects were substituted for digits. Second, instead of saying the namesof the objects, E points to pictures. Third, the task was changed fromone requiring an oral response to one requiring a pointing response.
11-6,6. A multiple-choice procedure is used. There are three separatecards. On each card there are four pictures. S is asked to point tothe picture named by the E. The correct picture on the first card showsa child giving a dog to a man. The correct picture on the second cardshows a child putting the button in a box. The correct picture on thethird card shows a child putting a pair of scissors beside a block.
II-6,A. S points to a block after E has pointed to a recess. E thenplaces block in recess for S.
111,1. Not used.
Sattler 14
111,2. Same as 11,5.
111,3. A multiple-choice procedure is used. E builds bridge and S isrequested to point to one of four pictures on a card which shows thebridge. The procedure is repeated a second time.
111,4. The modification eliminates the need for the S to say the name ofthe animal. E says the name.
111,5. A multiple-choice procedure is used. A circle is first shown toS. S is then asked to point to the one drawing out of four which bestlooks like a circle. There are three trials.
111,6. A multiple-choice procedure is used. A line is first shown to S.S is then asked to point to the one drawing out of four which best lookslike a line. There are three trials.
III,A. Same as 11-6,5.
111-6,1. No change.
111-6,2. A multiple-choice procedure is used. The Stanford-Binet cardsare used. However, instead of the S putting the two pieces together, heis shown a card with four pictures and is asked to select the one whichshows the two pieces that are put together to make a pig. The sameformat is used for the ball.
111-6,3. No change.
111-6,4. A yes-no procedure is used. The E asks the S whether certainpeople, animals, or objects are in the picture. Six things are namedfor each picture, with three of them shown in the picture and three notshown in the picture. The same procedure is used with the remaining twopictures.
111-6,5. The S points to the button and to the appropriate box and the Eplaces the button in the box.
111-6,6. A multiple-choice procedure is used. The S is asked to selectthe one picture which depicts the question.
III-6,A. No change.
IV,1. Same as 11,5.
IV,2. A multiple-choice procedure is used. First, the modificationeliminates the need for the S to name the object; initially E says thenames. Then the S is shown a card with four objects and he is asked topoint to the object that was hidden.
IV,3. A multiple-choice procedure is used. E says the analogy and S isasked to point to the picture which completes the analogy.
IV,4. No change.

Sattler 15
IV,5. No change.
IV,6. A multiple-choice procedure is used. E asks the question and Spoints to his answer.
IV,A. A multiple-procedure is used. E reads the sentence and S is askedto point to the picture which best describes his answer. Each picturehas three elements (e.g., two boys, candy, mother, or two boys, wagon,mother).
IV-6,1. No change.
IV-6,2. Same as IV,3.
IV-6,3. No change.
IV-6,4. A multiple-choice procedure is used. E asks question and S isasked to point to his answer.
IV-6,5. A multiple-choice procedure is used. E asks question and S isasked to point to his answer. Each picture has three elements (e.g.,pencil on chair, box, and open door, or open door, pencil, and man andchild).
IV-6,6. A multiple-choice procedure is used. E asks question and S isasked to point to his answer.
IV-6,A. No change.
V,1. A multiple-choice procedure is used. E shows S the incomplete manand then asks S to point to the picture that best shows the man completed.There are two trials.
V,2. Not used.
V,3. A multiple-choice procedure is used. E asks question and S isasked to point to his answer.
V,4. A multiple-choice procedure is used. A square is first shown to S.S is then asked to point to the one drawing out of four which best lookslike a square. There are three trials.
V,5. No change.
V,6. A multiple-choice procedure is used. E shows S a complete card andthen one that has been cut in two. E then shows S one-half of a card.Finally, E asks S to select the picture that shows where the rest of thecard is. This procedure is used on two trials. On the third trialanother procedure is used. E shows S a complete card. E then shows Sthe card cut in two. Finally, E asks S to select the picture that showsa whole card if the two pieces were put together.
V,A. A multiple-choice procedure is used. E ties knot around a pencil.E Then asks S to point to the picture that looks like the knot he tied.

Sattler
Data Analysis
16
Four principal statistical procedures were used to evaluate the
data. First, analysis of variance designs were used to evaluate thestandard and modified IQ's and MA's obtained on the Stanford-Binet. In
the normal group a 7 ,{ 2 ANOVA design was used, with repeated measures onthe last factor, to evaluate the IQ's and MA's. The first factor was theseven age levels, by half-year intervals, and the second factor was the
treatment (standard and modified forms). In the mentally retarded andcerebral-palsied groups, a repeated measures design was used (treatmentX subjects) to evaluate the IQ's and MA's. The treatment factor consisted
of the standard and modified forms. Age was not used as a factor becausethere was no attempt made to select children according to birthdate anddate of testing in these two groups.
Second, intercorrelations were performed using the IQ's and MA'sobtained on the standard and modified forms together with the sex andsocioeconomic level (SES) of the subjects. Third, biserial rs were used
to evaluate item validity. Only the modified items were evaluated in
this way. Fourth, a t test was used to evaluate the IQ's obtained bythe spastic and nonspastic cerebral-palsied children.
Results
Analysis of Variance
Normal
Ia. Table 2 presents the mean IQ's for the seven age levels forthe standard and modified IQ's and Table 3 presents the results of theanalysis of variance. The significant effects were age level and theinteraction between age level and treatment. However, the treatment
variable was not a significant effect. The difference between the IQ'son the standard and modified forms was .16 points, in favor of thestandard form. Simple effects tests at each age level indicate that onlyat the lowest age level (1-10 to 2-2) was the modified IQ higher than thestandard IQ.
Table 2. Mean Lower Level (II-V) Stanford-Binet Standard and ModifiedIQ's for Seven Age Levels of Normal Children
Age Level
Mean IQ
N Standard Modified
1-10 to 2-2 19 115.37 122.79*
2-4 to 2-3 19 109.84 106.322-10 to 3-2 19 116.11 117.843-4 to 3-8 19 113.58 112.163-10 to 4-2 19 111.00 109.744-4 to 4-8 19 111.11 108.6C4-10 to 5-2 19 105.95 104.32fatal 133 111.85 111.69
< .01.

Sattler 17
Table 3. ANOVA for Lower Level (II V) Stanford-Binet using Standardand Modified IQ's for Seven Age Levels of Normal Children
(N = 133)
SourceBetween
MS df
Age Level (A) 917.57 6 2.34*Error 392.61 126
Within
Treatment (B) 1.66 1 .05
A X B 130.60 6 3.83**Error 34.08 126
*IV .05.** 2L< .01.
MA. Table 4 presents the wean MA's for the seven age levels and forthe standard and modified MA's, and Table 5 presents the results of theanalysis of variance. Like IQ, the significant effects were age level andthe interaction between age level and treatment. However, the treatmentvariable was not a significant effect. The large age level effect wouldbe expected because there is a close relationship between MA and CA in anormal group. The difference between the MA's on the standard andmodified forms was .47 points, in favor of the standard form. Simpleeffects tests at each age level indicated that there was a significantdifference between the standard and modified MA's at three age levels.The modified MA was higher at the lowest age level (1-10 to 2-2) butlower at the second age level (2-4 to 2-8) and sixth age level (4-4 to4-8).
Table 4. Mean Lower Level (II-V) Stanford-Binet Standard and ModifiedMA's for Seven Age Levels of Normal Children
Mean IQ
Age Level N Standard Modified
1-10 to 2-2 19 29.53 31.37**
2-4 to 2-8 19 35.00 33.212-10 to 3-2 19 44.21 44.793-4 to 3-8 19 49.11 48.423-10 to 4-2 19 54.47 53.84*4-4 to 4-8 19 60.32 58.534-10 to 5-2 19 62.68 61.84Total 133 47.90 47.43
* Il< .05.

Sattler 18
Table 5. ANOVA for Lower Level (II-V) Stanford-Binet using Standard andModified MA's for Seven Age Levels of Normal Children
SourceBetween
MS df
Age Level (A) 5605.02 6 72.01**
Error 77.84 126
Within
Treatment (B) 14.92 1 2.53*A X B 16.05 6 2.72
Error 5.90 126
*2< .05.** p. < .01.
Mentally Retarded
IO. Table 6 presents the means and the ANOVA results for thementally retarded group. The treatment effect was not significant;therefore, the standard and modified IQ's do not differ significantlyin the mentally retarded group. There was a 2.93 difference between thetwo IQ's, in favor of the modified form.
MA. Table 7 presents the means and the ANOVA results for thementally retarded group. The treatment effect was not significant;therefore, the standard and modified MA's do not differ significantlyin the mentally retarded group. There was a .70 difference between theMA's, in favor of the modified form.
Table 6. ANOVA for Lower Leval (II-V) Stanford-Binet using Standardand Modified IQ's of Mentally Retarded Children
(N = 27)
Source
Treatment (A)Ss (B)
A X B
MS
115.57
490.6459.30
df
1.951
26
M IQ (Standard) = 39.18M IQ (Modified) = 42.11
Table 7. ANOVA for Lower Level (II-V) Stanford-Binet using Standardand Modified MA's of Mentally Retarded Children
(N = 27)
Source
Treatment (A)Ss (B)
A X B
MS df
1.466.68202.92
4.57
1
26
M MA (Standard) = 37.48M MA (Modified) = 38.18

Sattler 19
Cerebral Palsied
j. Table 8 presents the means and the ANOVA results for thecerebral-palsied group. The treatment effect was not significant;therefore, the standard and modified IQ's do not differ significantlyin the cerebral-palsied group. There was a 1.87 difference between thetwo IQ's, in favor of the modified form.
MA. Table 9 presents the means and the ANOVA results for thecerebral-palsied group. The treatment effect was not significant;therefore, the standard and modified MA's do not differ significantlyin the cerebral-palsied group. There was a .07 difference between thetwo MA's, in favor of the modified form.
Table 8. ANOVA for Lower Level (II-V) Stanford-Binet using Standardand Modified IQ's of Cerebral-Palsied Children
= 30)
Source MS df
Treatment (A)Ss (B)
A X B
52.27682.4857.36
1
29
<1
M IQ (Standard) = 80.43M IQ (Modified) = 82.30
Table 9. ANOVA for Lower. Level (II-V) Stanford-Binet using Standard.ind Modified MA's of Cerebral-Palsied Children
= 30)
Source MS df
TreatmentSs (B)
B
(A) .07
309.9223.86
1
29
<1
M MA (Standard) = 44.90M MA (Modified) = 44.97
Comment on the analyses of variance. In only one of the three groups,the normal, was there a significant effect involving the treatment variable.However, after further data analysis, the effect turned out to be signifi-cant only at one of the age levels, namely, that between 1-10 and 2-2 yearsof age. At the six other age levels the standard and modified IQ's werenot significantly different; These results suggest that IQ's and MA'sobtained on the standard and modified forms are essentially similar. Theonly reservations to this generalization are at the lowest level of theexamination. At this level, IQ's and MA's are higher on the modified formthan on the standard form in a sample of above-average ability children.

Sattler 20
Intercorrelations
The results of intercorrelations among seven variables (sex, SES, CA,
standard IQ, standard MA, modified IQ, and modified MA) are shown in Tables
10, 11, and 12 for the normal, mentally retarded, and cerebral-palsied
groups, respectively. In addition, in the cerebral-palsied group, sevenadditional scores are included which were obtained from the Survey of
Degree of Physical Handicap (the scale ranged from no incapacity [1] to
great incapacity [4]). In the Survey there are six separate areas that
are evaluated: vision, hearing, speech, sitting balance, arm-hand use,
and walking. In addition, a seventh rating was obtained, the totaldisability rating, by summing the six individual ratings. The primary
correlations, as far as the investigation is concerned, are the ones bases'on the standard and modified IQ's. These correlations are uniformly high
(.83, .92, and .88 in the normal, mentally retarded, and cerebral-palsiedgroups, respectively) and thereby indicate that the standard and modified
IQ's are highly related. These high correlations are somewhat spuriousbecause the modified form contains many of the same tests that are found
in the standard form.
Sex was a significant variable only in the normal group. There was
a significant, but moderate relationship between sex and standard IQ and
between sex and modified IQ. High IQ's were associated with females,while high chronological ages were associated with males.
Socioeconomic status was not a significant variable among any of the
correlations in the three groups.
In the cerebral-palsied group, of the six separate ratings concerningdegree of physical handicap, four (vision, hearing, sitting balance, andarm-hand use) were not related significantly to any of the variables
concerned with test scores. Speech ability, however, was significantlynegatively related to mental age obtained on the standard and modifiedforms, and walking ability was significantly negatively related to mentalage obtained on the standard form. Since the present sample had adequatevisual and auditory capacities, these two modalities did not correlate
with any of the other variables.
Related to the intercorrelations is the percentage of subjects whopassed the standard and modified forms for each test. These data areshown in Figures 1 through 32 for each Stanford-Binet test in year-levels
II through V that were used in the study. The figures show the percentage
of subjects passing each test as a function of age level.

Sattler 21
Table 10. Intercorrelation Matrix for Selected Variables usingStanford-Binet Tests (II-V) with Normal Children
Variable 1
(N = 133)
2 3 4 5 6 7
1. Sexa -- -.07 -.21 .23 -.07 .25 -.07
2. SES .03 -.11 -.05 -.06 -.03
3. CA -.16 .87 -.27 .86
4. Standard IQ .33 .83 .29
5. Standard MA .14 .96
6. Modified IQ .14
7. Modified MA
Mean 1.47 3.42 42.11 111.85 47.90 111.69 47.43
SD .50 1.47 11.77 14.51 13.27 15.64 12.63
Note.--r = .16 at p = .05 and r = .21 at EL= .01 (two-tailed).
aMale = 1, female= 2.
Table 11. Intercorrelation Matrix for Selected Variables using Stanford-Binet Tests (II-V) with Mentally Retarded Children
(N = 27)
Variable 1 2 3 4 5 6 7
1. Sexa -- -.08 .17 .10 -.31 .16 -.18
2. SES -.14 .19 .11 .12 .01
3. CA -.40 -.13 -.54 -.05
4. Standard IQ .52 .92 .50
5. Standard MA .45 .91
6. Modified IQ .52
7. Modified HA
Mean 1.37 4.19 116.26 42.81 36.15 43.67 37.26
SD .49 1.75 109.80 14.27 9.03 16.46 9.03
Note.--r = .38 at EL= .05 and r = .49 at E; = .01 (two-tailed).
aMale = 1, female = 2.

Table 12.
Intercorrelation Matrix for Selected Variables using
Stanford-Binet Tests (II-V)
=
with Cerebral-Palsied Children
(N = 27)
ft
Variable
12
34
56
78
910
11
12
13
14
1.
Sex
.03
.08
-.06
-.07
-.12
.03
.15
.00
-.06
.08
-.03
-.07
-.01
2.
SES
.05
-.07
.04
-.22
-.09
-.09
.00
.19
.30
.27
.03
.24
3.
CA
-.42
.62
-.54
.60
.12
.00
-.63
-.17
-.37
-.45
-.55
4.
Standard IQ
.43
.88
.42
-.19
.00
.05
-.05
.04
-.03
-.02
5.
Standard MA
.18
.95
.01
.00
-.57
-.19
-.32
-.48
-.54
6.
Modified IQ
.21
-.11
.00
.27
.04
.10
.16
.19
7.
Modified MA
.07
.00
-.48
-.14
-.31
-.37
-.44
8.
Vision
.00
-.20
-.23
-.06
-.13
-.04
9.
Hearing
.00
.00
.00
.00
.00
10.
Speech
.33
.32
.44
.71
11.
Sitting
balance
.64
.48
.74
12.
Arm -hand use
.53
.78
13.
Walking
.79
14.
Total disability.
rating
Mean
1.40
3.93
55.67
80.43
44.90
83.27
45.97
1.17
1.00
2.00
1.50
1.53
2.33
9.53
SD
.50
2.10
15.01
17.29
12.22
19.08
11.02.
.46
.00
1.14
.82
.86
.96
2.84
Note.--r = .38 at 2L= .05 and r = .49 at p= .01
(two-tailed).
aMale = 1, female = 2

Battler
100
90
00
701.-E 60C2
1.2 50
40
30
20
z
3.
10
*
0 ' "0 2 21/2 3
o---1,STANOARO
A I A
31/2 4 41/2 5
AGE
23
100-
90-
80-
70-
E 60
50
40
30-
20-
10-
0 2 21/2
ft STANDARD
--- =IF I ED
a a a
3 31/2 4 41/2 5
AGE
FIG.1 THREE-HOLE FORM BOARD (11,1) FIG.2 BLOCK BUILOING:TOWER (11,4)
100- --90- or80-
70-
60-
50-
40-
30-
20-
10 - ,N0.-// "
0 2 21/2
0--IDSTANOARO
- - - MODIFIED
a
3 31/2 4 41/2 5
AGE
100 -
90-if
80' se°
70--e, 60-
El 50-
40-
30-
20-40--41STANDARO
10- ,4; 0....-401001FIEDk"
0-7e/ " a
c gati0 2 21/2 3 31/2 4 41/2 5
AGE
FIG.3 PICTURE VOCABULARY (11,5) FIG.4 NAMING OBJECTS (11.6,3)

Sattler
100
90
80
701.-6 60
tt 50
40
30
20
10
0-W
0---0 STANDARD
,c.-)s e---.MODIFIED
2 2'4 3 A 4 4'4 5
AGE
FIG.5 PICTURE VOCABULARY (II-6,4)
100.
90-
80-
70-$... ,ea 60-
ii
E 50- a
a
40- a
a
30-a
a
20-a...4
0-9 STANDARD
10- $ %-,
.,,cz - - -o MODIFIED
4 .1
0-e/ a a a 1 I a A
0 2 2'4 3 A 4 4'4 5
AGE
24
100 -
90-
80 -
60-
Letcrl
50- l
40- a
a
a
30 -
20-so---o STANDARD
10 ---eMODIFIED
0-s7 I
0 2 A 3 A 4 4'4 5
AGE
FIG.6 REPEATING TWO OBJECTS (II-6,5)
100
90
80
70
W 60
E 50
40
30
20
11IWu
(p.--o STANDARD
10- "7' *---oMODIFIED
0-77 " I 'AAA0 2 2'4 3 3'4 4 4'4 5
AGE
FIG.7 OBEYING SIMPLE COMMANDS (II.6,6) FIG.8 THREE-HOLE FORM BOARD:ROTATED (II-6,alt.)

Sat t ler
100
90
80
70
60-
E 50
40-
30
20 -
10 - Q
'0e/
2 2k
100
90
80
70la; 60
ig..1 50
40
30
20
e---o STANDARD
So---MOOIFIE0
11111113 34 4 4k 5
AGE
25
100.
90-
80-
70-,.. /
ES 60- IC3 i
E 5°'40- s
s
30- s
s
20-s
e 1e P-ml, S TANO A R 0
1 0- z.k. iz.k. ,4, ,4?....-41,MODIFIE0-p - ...rf ,,tf0-7 "
09
2 21/2
.
3 3k 4 4k 5
AGE
FIG.9 PICTURE VOCABULARY (111,2) FIG.10 BLOCK BUILDING:BRIOGE (111,3)
g STANDARD10
,4!;% §4.--MODIFIED
0 -vdi A A# . .
0 2 2k 3 3k 4 4k 5AGE
100
90
80
70
60
L0 ..1 50
40
30
20
10
0-e/
40.--41STANDARO
%4;
,.y 7:4---*MODIFIE0:' *:
,
..?
A 1 1 #1A12 21/2 3 31 4 4k 5
AGE
FIG. 11 PICTURE MEMORIES (111,4) FIG. 12 COPYING A CIRCLE (111,5)
26Battler
100- 100
90- 90
80- 80
70- 70
Ws60. 9, 0 ES
C360
C3 )
El 50- / 3- 50/
40- / 40.-. -1
30-4)
30
20- 200--c STANDARD
10- ,i',% . ,.,; ;:v---o MODIFIED 104 4 4 4
O`AV Ai a I
11 I I
0 2 2% 3 3% 4 4% 5
AGE
FIG.13 DRAWING A VERTICAL LINE (111,6)
100-
90-
80-
70--5 60-C.3
ggil 50-
40-
30-
20-
10-0,;%
0002 21/2
0--0 STANDARD
o - - -o MODIFIED
44? 'tc ct; \p i 1
3 3% 4 4% 5
AGE
lo---.41 STANDARD
. .:, ,c,scp---oNODIFIED4 4 4 4
0 2 2% 3 3% 4 4% 5
AGE
FIG.14 REPEATING TWO OBJECTS (I I I, alt.)
100-
90
80-
70-
60C.3
El 50
40
30
20
10
co---o STANDARD
O---O kiODIF I ED
I I I
2% 3 3% 4 41/2 5
AGE
FIG.15 PATIENCE:PICTURES (III-6.2) FIG.16 RESPONSE TO PICTURES (III-6.4)
Battler27
100-0-- STANDARD 0
90 .---oMODIFIE0
80-
70-off, 60-
Es 50-
40-I.
30-
20- II
10 .tzs 4.eiz
0-s7 a p a
0 2 21/2 3 31/2 4 414 5
AGE
100
90
80
10
60
El 50
40
30
20
FIG.17 SORTING BUTTONS (111 -6,5)
STANDARD
.*---eNODIFIED
dI
1
I
10- $ $ F ...F* 4 4 4 4 404-AV a L * 4) A A A
0 2 21/2 3 31/2 4 41/2 5AGE
FIG.19 PICTURE VOCABULARY (IV,1)
100---o STANDARD
90-
80-
70-
W 60-VE 50'
40-
30-
20-
10- CZZ
0-tv AA )
0 2 21/2 3 31/2 4 41/2 5AGE
FIG. 18 COMPREHENSION I (111 -8,6)
100-eSTANDARD
90.*---oNODIFIED
80-
70-
LT, 60-wLI!cc 50
40r
30-
20-
10
,
0 2
I
d
$ 4, c; .; 4-
I p a a2ra'i! 4? I .? ;
21/2 3 31/2 4 41/2 5AGE
FIG.20 NAMING OBJECTS FROM MEMORY

Sattler
a.
100
90
80
70
60
50
40
30
20
10
-oo STANDARD
.o---0 MODIFIED
0-e/0 2
I
1
I
I0 , ` c.,,, .; co(-4, .... 7... . f.'
4 .4 ..14 ?
0-A 0 I a a
2%2 3 34 4 41/2 5
AGE
28
100' o--p STANDARD
90 -o---oMODIFIED
0
80-
70-
60-
111 50
40-
30-de
20-
10- 4!;' $ A? AF
0
0 2 2%2 3 3` 4 414 5
AGE
FIG.21 OPPOSITE ANALOGIES I (IV,3) FIG.22 COMPREHENSION II (IV,6)
100
90
80
70
E 60(.4crW 50
40
30
20
10
0
oo STANDARD
o---0 MODIFIED
3 314 4 02AGE
FIG.23 MEMORY FOR SENTENCES I(Malt.)
100
90
80
10
60(.4
te, 50
40
30
20
oo STANDARD
---o MODIFIED
1 0
41 1 A it
A 3 3'4 4 02 5
AGE
FIG.24 OPPOSITE ANALOGIES I (IV-6.2)
0 2
Sattler
100 4).-- STANDARD
90 e- *MODIFIED
80
20
10 1/49 %1 $ $, i, s4 Z1
sft;'
0II A 1 I A
0 2 21/2 3 31/2 4 41/2 5
AGE
FIG.25 MATERIALS (II 6,4)
100
90
80
10
60ca
EA 50
40
30
20.
10
S STANDARD
4--- MOD IF I ED
1. 4;#a
#I0 1. '
A
$ $# #i I
3 31/2
AGE
4 41/2 5
FIG.27 COMPREHENSION ill (IV6,6)
29
100 -41---losTANDARD
90. ---0001FIED
80-
70-
5 60-
E50-40-
%
%130-
20-
, .4..0,7. . . p A A
0 2 21/2 3 31/2 4 41/2 5
AGE
FIG.26 THREE COMMISSIONS (I1:6,5)
100
90
80
70
60
E 50
40
30
20
10
0 STANDARD
*--- *MODIFIED
"//0 2 21/2 3 31/2 4 41/2 5
AGE
FIG.28 PICTURE COMPLETION: MAN (r.1)
Sa t t ler
100 0---o STANDARD
90 0---QmoDIFIED
80 P-70
60F
Lc/ 50
40
30
20
A
10 hi ei 4.93'
40 /I &Falk0 2 21/2 3 31/2 4 41/2 5
AGE
FIG.29 DEFINITIONS (Y,3)
100
90
80
70
0--0 STANDARD
o--- MODIFIED
M 60
E 50
30
1 00 oo STANDARD90 to-4,11001FM
80
701.-
,1 60
;12 50
40
30
20 410 0;
0re0 2 21/2 3 31/2 4 41/2 5
AGE
FIG.30 COPYING A SQUARE (3C4)
100
90
80
70
60ca
E 50
40 40
0--0 STANDARD
o---oNODIFIED
30 30
20 20
10 is , - 10 .z.) r,-; ...., c,s
V 4 4'0 0
. .21/2 3 31/2 4 41/2 0 2 21/2 3 31/2 4 41%
AGE AGE
FIG.31 PATIENCE:RECTANGLES (3C6) FIG.32 KNOT (Y, alt,)
5

Item Validity
31
Tables 13 through 16 present biserial r's for the normal group,mentally retarded group, cerebral-palsied group, and for the total group.Each group is discussed separately.
Normal group,. In the normal group, the biserial r's are generallylow, ranting from -.14 to .30. Of the 32 correlations shown in Table 13,11 are .15 or higher. The number of children used for the correlationsranged from 30 to 92. The samples' mean IQ's for the various tests areabove average, with the exception of the IQ's for the samples for fourtests at year-level 11-6 where the IQ's are in the upper limits of theaverage range. The range of mean IQ's is from 108.91 to 113.12, whilethe range of standard deviations of the IQ's is from 12.81 to 19.62. Thecorrelations indicate that some of the items are working effectively,while others are contributing little to test validity. The restrictedrange of the normal sample may, in part, have contributed to the rela-tively low correlations.
Mentally retarded group. The biserial correlations are much higherin the mentally retarded group than in the normal group, although therealso are some large negative correlations. Of the 32 correlations thatare shown in Table 14, 21 are .15 or higher. The range of coefficientsis from -1.00 to .62. The four large negative coefficients are based onsamples of 4 to 12 children, and occur at year-levels IV, IV-6, and V.The low number of subjects for these correlations, in part, reduces thesaliency of the negative correlations. The number of children used forthe correlations range from 4 to 23. The mean IQ's range from 33.00 to56.80. These IQ's are in the lower range of mental retardation. Thestandard deviations range from 9.82 to 23.78. The correlations indicatethat most of the modified tests are working well in the mentally retardedgroup.
Cerebral-palsied group. The biserial correlations in the cerebral-palsied group range from -.36 to .46. Of the 32 correlations shown inTable 15, 11 are .15 or higher. There are four negative correlations of-.15 or higher. The mean IQ's are in the Below-Average range (range of80.17 to 87.32). The standard deviations range from 18.75 to 22.64. Thecorrelations indicate that some of the items are working effectively,while others are contributing little to or detracting from test validity.
Total group. The biserial correlations in the total group rangefrom -.34 to .40. Of the 32 correlations shown in Table 16, 13 are .15or higher. The mean IQ's range from 85.53 to 105.60. The standarddeviations are very large, ranging from 20.78 to 36.08. These deviationsreflect the large variability of IQ's that existed in the total sample.Because the total group was not selected to represent a normal distribu-tion of IQ ranges, it is difficult to evaluate the contribution of thesebiserial is to test validity.
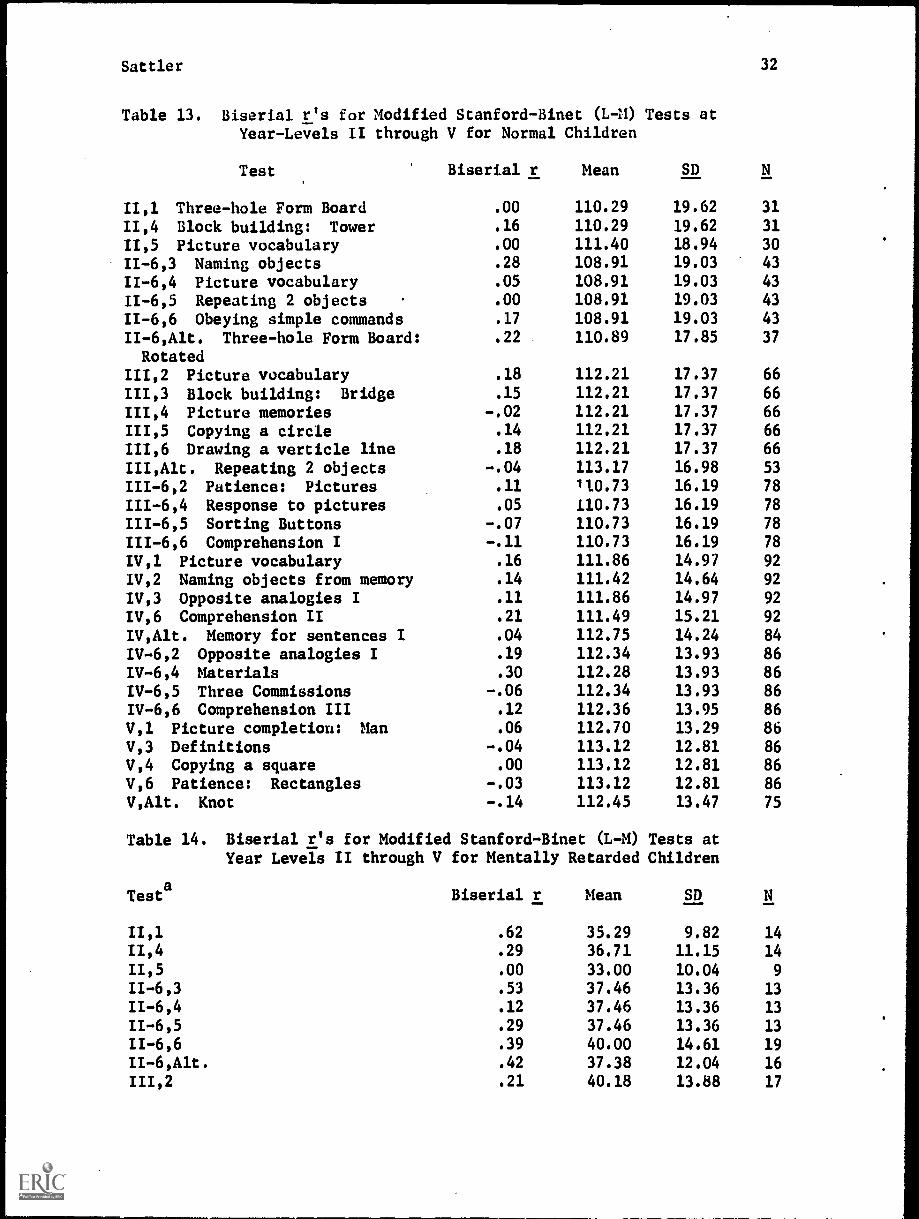
Sattler
Table 13. Biserial r's for Modified Stanford-Binet (L M) TestsYear-Levels II through V for Normal Children
Test Biserial r Mean
at
SD
32
11,1 Three-hole Form Board .00 110.29 19.62 31
11,4 Block building: Tower .16 110.29 19.62 31
11,5 Picture vocabulary .00 111.40 18.94 30
II-6,3 Naming objects .28 108.91 19.03 43
11-6,4 Picture vocabulary .05 108.91 19.03 43
11-6,5 Repeating 2 objects .00 108.91 19.03 43
11-6,6 Obeying simple commands .17 108.91 19.03 43
II-6,Alt. Three-hole Form Board: .22 110.89 17.85 37
Rotated111,2 Picture vocabulary .18 112.21 17.37 66
111,3 Block building: Bridge .15 112.21 17.37 66
111,4 Picture memories -.02 112.21 17.37 66
111,5 Copying a circle .14 112.21 17.37 66
111,6 Drawing a verticle line .18 112.21 17.37 66
III,Alt. Repeating 2 objects -.04 113.17 16.98 53
111-6,2 Patience: Pictures .11 110.73 16.19 78
111-6,4 Response to pictures .05 110.73 16.19 78
111-6,5 Sorting Buttons -.07 110.73 16.19 78
111-6,6 Comprehension I -.11 110.73 16.19 78
IV,1 Picture vocabulary .16 111.86 14.97 92
1V,2 Naming objects from memory .14 111.42 14.64 92
IV,3 Opposite analogies I .11 111.86 14.97 92
IV,6 Comprehension II .21 111.49 15.21 92
IV,Alt. Memory for sentences I .04 112.75 14.24 84
IV-6,2 Opposite analogies I .19 112.34 13.93 86
IV-6,4 Materials .30 112.28 13.93 86
IV-6,5 Three Commissions -.06 112.34 13.93 86
IV-6,6 Comprehension III .12 112.36 13.95 86
V,1 Picture completion: Man .06 112.70 13.29 86
V,3 Definitions -.04 113.12 12.81 86
V,4 Copying a square .00 113.12 12.81 86V,6 Patience: Rectangles -.03 113.12 12.81 86
V,Alt. Knot -.14 112.45 13.47 75
Table 14.
Testa
Biserial r's for Modified Stanford-Binet (L-M) TestsYear Levels II through V for Mentally Retarded Children
Biserial r Mean
at
SD
11,1 .62 35.29 9.82 14
11,4 .29 36.71 11.15 14
11,5 .00 33.00 10.04 9
II-6,3 .53 37.46 13.36 13
11-6,4 .12 37.46 13.36 13
11-6,5 .29 37.46 13.36 13
II-6,6 .39 40.00 14.61 19
II-6,Alt. .42 37.38 12.04 16
111,2 .21 40.18 13.88 17

Sattler 33
Table 14. continued
Testa
Biserial r Mean SD
111,3 .31 38.40 11.87 20
111,4 .34 40.00 12.73 22
111,5 .34 41.57 14.53 23
111,6 .22 41.57 14.53 23
III,Alt. .26 39.00 13.54 14
111-6,2 .18 43.89 13.63 18
111-6,4 .37 44.56 14.33 16
111-6,5 .33 43.89 13.63 18
111-6,6 .23 44.06 14.03 17
IV,1 .30 46.53 16.23 17
IV,2 .54 46.53 16.23 17
IV,3 .58 46.53 16.23 17
IV,6 .08 46.53 16.23 17
IV,Alt. -.32 42.29 13.86 14
IV-6,2 .36 50.17 17.58 12
IV-6,4 -.59 50.33 17.38 12
IV-6,5 -.17 50.33 17.38 12
IV-6,6 .23 50.33 17.38 12
V,1 .00 56.80 23.78 5
V,3 .00 56.80 23.78 5
V,4 -.63 56.80 23.78 5
V,6 .00 56.80 23.78 5
V,Alt. -1.00 51.25 23.43 4
aSee Table 13 for test names.
Table 15.
Testa
Biserial r's for Modified Stanford-Binet (L-M) TestsLevels II through V for Cerebral-Palsied Children
Biserial r Mean
at Year
SD
11,1 .00 80.17 22.12 12
11,4 -.13 80.17 22.12 12
11,5 .00 81.92 21.19 12
11-6,3 .30 82.38 22.64 13
11-6,4 .33 82.38 22.64 13
11-6,5 -.21 82.38 22.64 13
11-6,6 -.05 82.38 22.64 13
II-6,Alt. .30 82.38 22.64 13
111,2 .43 81.47 19.73 17
111,3 .09 81.47 19.73 17
111,4 .16 81.47 19.73 17
111,5 .17 81.47 19.73 17
111,6 .28 81.47 19.73 17
III,Alt. .07 81.47 19.73 17
111-6,2 .11 81.67 19.83 21
111-6,4 -.06 82.75 19.70 20111-6,5 -.36 81.65 20.35 20111-6,6 .46 81.67 19.83 21
IV,' .11 84.86 18.75 28
IV,2 -.23 84.86 18.75 28

Battler
Tabla 15. continued
34
Testa
r Mean SD
IV,3
.Biserial
.26 84.86 18.75 28
IV,6 .12 84.86 18.75 28
IV,Alt. .36 84.52 19.02 27
IV-6,2 .17 85.08 20.14 24
IV-6,4 .01 85.08 20.14 24
IV-6,5 .05 85.08 20.14 24
IV-6,6 -.08 85.08 20.14 24
11,1 .01 87.32 19.53 22
V,3 -.10 87.32 19.53 22
V,4 -.15 87.09 19.66 22
V,6 .00 87.32 19.53 22
V,Alt. .10 87.32 19.53 22
Table 16. Biserial r's for Modified Stanford-Binet (L-M) TestsYear-Levels II through V for Total Group
Testa Biserial r Mean
at
SD
II,1 .27 35.53 36.08 57
11,4 -.17 85.88 35.67 57
11,5 .00 90.63 34.61 51
11-6,3 .12 90.45 33.32 69
11-6,4 .11 90.45 33.32 69
11-6,5 -.22 90.45 33.32 69
11-6,6 .01 86.85 34.50 75
II-6,Alt. .18 87.45 35.21 66
111,2 .18 94.74 32.21 100
111,3 .05 92.81 33.54 103
111,4 .19 92.10 33.62 105
111,5 .17 91.95 33.50 106
111,6 .00 91.95 33.50 106
III,Alt. .00 94.39 32.58 84
111-6,2 -.04 95.23 29.54 117
111-6,4 .17 96.54 28.74 114
111-6,5 .05 95.34 29.65 116
111-6,6 .05 95.70 29.23 116
IV,1 .26 98.23 27.34 137
IV,2 .17 97.94 27.07 137
IV,3 .26 98.23 27.34 137
IV,6 .18 97.99 27.30 137
IV,Alt. .14 98.76 27.72 125
IV-6,2 .33 100.86 25.29 122
IV-6,4 .21 100.84 25.21 122
IV -6,5 .07 100.88 25.24 122
IV -6,6 .05 100.13 25.12 122
V,1 .40 105.60 20.78 113
V,3 -.34 105.60 20.78 113
V,4 .06 104.98 21.18 113
V,6 .05 105.60 20.78 113
V,Alt. -.04 104.55 21.37 101
aSee Table 13 for test names.

Sattler 35
Comment on biserial r's. Three of the tests (Memory for Sentences Iat year-level IV, alternate; Materials at year-level IV-6, 4; and Knot atyear-level V, alternate) which show large negative correlations in thementally retarded group either do not show as large negative correlationsin the normal group, or show positive correlations. One test, forexample, Materials at year-level IV-6 has a biserial coefficient of .30in the normal group and -.59 in the mentally retarded group. If we use
the normal group as the standard for evaluating the validity of themodified tests, we can conclude that many of the tests are valid, whilenone are seriously working in a negative direction.
Cerebral Palsied: Spastic vs. Nonspastic
In the cerebral-palsied group, the IQ's of children with a spastictype of condition (N = 18) were compared with those who were not spastic(N = 12). Diagnoses were based on information contained in the children'sschool records. The two groups did not differ significantly on the IQ'sthey obtained on the standard administration CH IQ spastic = 83.50; 24 IQnonspastic 75.83; t = < 1, p > .05) and on the modified administration(M IQ spastic = 85.28; M IQ nonspastic = 80.25; t < 1, R> .05).
Cerebral Palsied: Test-taking Ability
In the cerebral-palsied group, 13 of the 30 children were not ableto be administered one or more of the standard tests. In contrast, onlytwo children were not able to be administered three of the modified tests.The major handicaps of the cerebral-palsied children which interferredwith their performance included no speech, spastic arm movements, or nouse of arms. Thus, the modifications provided a means for a more thoroughevaluation of these children.
Part II: Upper Level Stanford-Binet Tests, Three WISC Subtests, andMemory for Block Designs Test
Methodology
In the second part of the study, six Stanford-Binet tests located atyear-levels IX through XIII, three WISC subtests (Digit Span, Coding, andBlock Design), and a new test entitled, "Memory for Block Designs," wereevaluated. Five of the six Stanford-Binet tests are memory tests, whileone is a reasoning test.
Pilot Study and General Considerations
Initially, two or more modifications were proposed for each of thethree WISC subtests. ,However, it Woon became evident that time consider-ations would not permit a systematic evaluation of each type of modification.A different sample would have been needed to evaluate the effects of eachtype of modification, thereby doubling the number of subjects in each group.In addition, other factors became evident, and these are described below.
On the Digit Span subtest, a multiple-choice procedure could beused for Digits Forward but not for Digits Backward. This became evidentwhen some children began to read the digits on the response cards from

Sattler 36
right to left after the Digits Backward series was read to them, therebyturning the task into another Digits Forward task. The final modificationthat was selected for study was the oral-pointing modification. This
modification would allow for an evaluation of the effect of altering onlythe response modality.
On the Block Design subtest only the free space modification wasused. A second modification, use of numbered squares, was not selectedbecause this procedure could provide cues to the subjects which mightenable them to solve the items more easily than on the standard presenta-tion. Thus, only a plain white sheet of paper was used by the examiner asthe designated area on which to construct the designs for the subjects.
On the Coding subtest, the modification selected was one in which the.subjects did not have to make any marks. This modification is one whichcan be used to evaluate handicapped children with motor disabilities sinceit requires only a "yes" or "no" response from the subjects.
Composition of Sample for Upper Level
Schools throughout San Diego County were contacted in order to obtainnormal, mentally retarded, cerebral palsied, and orthopedically handicappedchildren. Excellent cooperation was obtained from all of the school dis-tricts so that in the cerebral-palsied and orthopedically handicappedgroups, in particular, nearly all of the available children in thesegroups were tested. Children in all groups were tested only with parentalpermission. Age and disability were the only two selection criteria forinclusion in the mentally retarded, cerebral-palsied, and orthopedicallyhandicapped groups. Age, birthdate, parental occupation, and no disabilitywere the four selection criteria for inclusion in the normal group. In
none of the groups was sex used as a criterion to select children.
Normal
The normal sample was selected so that parental occupation conformedas closely as possible with the national distribution of occupationalgroups. The birthdays of the children selected were within one month oftheir birthdate at the time of testing. The sample ranged from 5-0 to16-0 years of age (M chronological age = 10.46 years). There were 44males and 55 females in the sample. Table 17 shows the national distri-bution of occupational groups and the distribution of occupational groupsof the parents of the children in the normal samle. The largestdiscrepancies are four and three percentage points in Categories III andII, respectively. Overall, the distribution of parental occupations inthe present sample appears to conform to that of the national distribution.
Table 17. National Distribution and Upper Level Normal SampleDistribution of Occupational Groups
NormalOccupational Group National Group
% N %
I Professional & Technical 10 10 10
II Managers, Officials, Proprietors 16 19 19
Farm Owners & Farm Managers
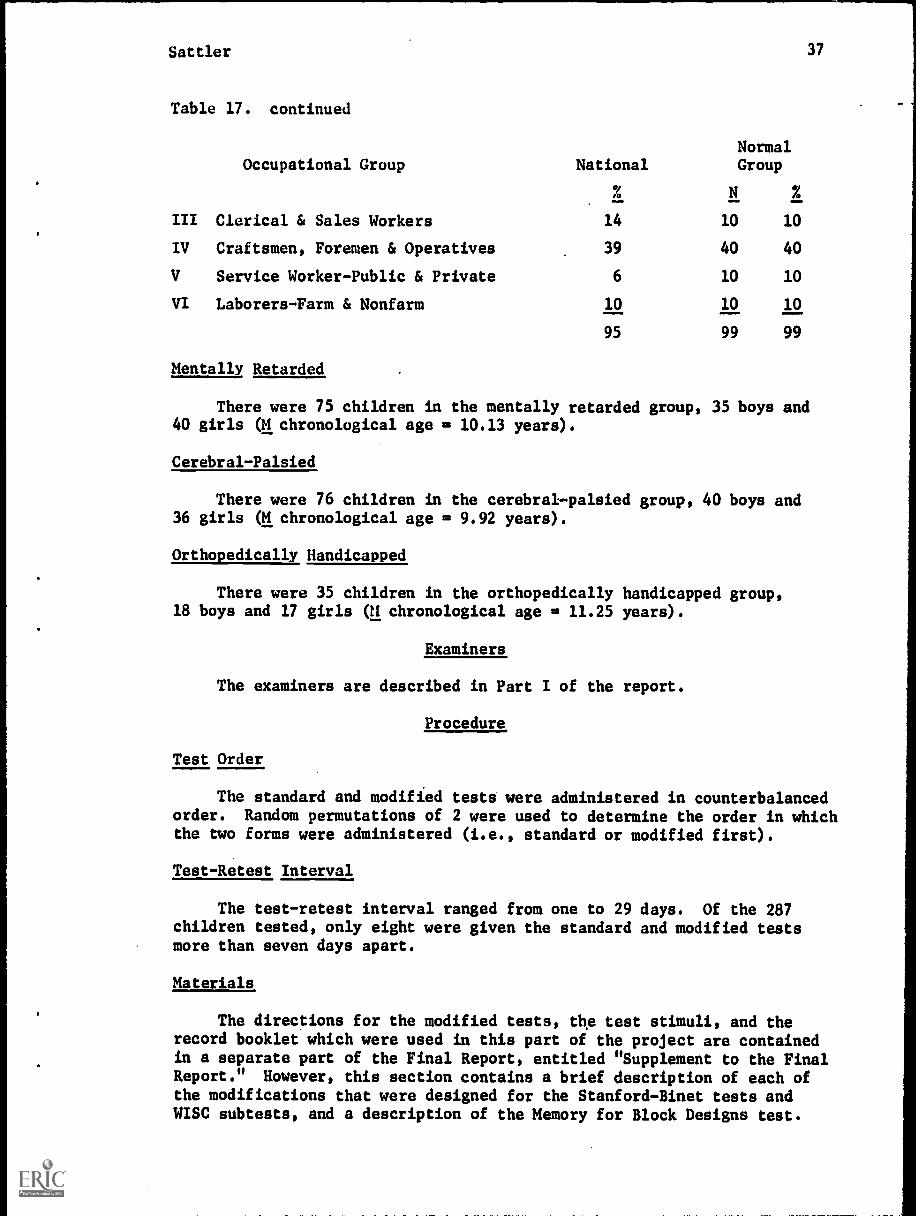
Settler
Table 17. continued
Occupational Group NationalNormalGroup
N
III Clerical & Sales Workers 14 10 10
IV Craftsmen, Foremen & Operatives 39 40 40
V Service Worker-Public & Private 6 10 10
VI Laborers-Farm & Nonfarm 10 10 10
95 99 99
Mentally Retarded
37
There were 75 children in the mentally retarded group, 35 boys and40 girls OA chronological age = 10.13 years).
Cerebral-Palsied
There were 76 children in the cerebral-palsied group, 40 boys and36 girls OA chronological age = 9.92 years).
Orthopedically Handicapped
There were 35 children in the orthopedically handicapped group,18 boys and 17 girls (U chronological age = 11.25 years).
Examiners
The examiners are described in Part I of the report.
Procedure
Test Order
The standard and modified tests were administered in counterbalancedorder. Random permutations of 2 were used to determine the order in whichthe two forms were administered (i.e., standard or modified first).
Test-Retest Interval
The test-retest interval ranged from one to 29 days. Of the 287children tested, only eight were given the standard and modified testsmore than seven days apart.
Materials
The directions for the modified tests, the test stimuli, and therecord booklet which were used in this part of the project are containedin a separate part of the Final Report, entitled "Supplement to the FinalReport." However, this section contains a brief description of each ofthe modifications that were designed for the Stanford-Binet tests andWISC subtests, and a description of the Memory for Block Designs test.

Sattler 38
Description of Modifications for Upper Level Stanford-Binet
Tests and WISC Subtests, and Description of Memory for
Stanford-Binet
Year IX,3.E shows theone picture
Block Designs Test
Memory for Designs I. A multiple-choice procedure is used.stimulus card, removes it, and S is asked to point to thewhich shows the drawings.
Year XI,4. Memory for Sentences II. A multiple-choice procedure isused. Z says the sentence and S is asked to point to the sentence thatwas read.
Year XII,A. Memory for Designs II. A multiple-choice procedure is used.E shows S the stimulus card, removes it, and S is asked to point to theone picture which shows the drawing.
Year XIII,1. Plan of Search. A multiple-choice procedure is used. E
presents the situation to S and S is asked to point to the one drawingthat shows the best way to hunt for the purse so as to be sure not tomiss it.
Year XIII,3. Memory for Sentences III. A multiple-choice procedure is
used. E says the sentence and S is asked to point to the sentence thatwas read.
Year XIII,6.procedure ispoint to the
Copying a Bead Chain from Memory. A multiple-choiceused. E makes bead chain, removes it, and S is asked topicture which shows the bead chain constructed by E.
WISC Subtests
Digit Span. An oral-pointing modification is used. The digits 1through 9 appear on a rectangular white card which is 3 5/16 inches by171/2 inches. Each digit is surrounded by heavy black lines. These blacklines or boxes are 1 9/16 inches by 13/16 of an inch. The card is placedin front of the child so that he can see clearly all of the digits. Anunsharpened yellow pencil is used by the child to point to the digits.After E reads the digits, S is asked to point to the numbers on the card.The same procedure is used for Digits Forward and for Digits Backward.
Block Design,. A pointing modification is used. Six blocks, showingthe various colors that are used in the construction of the designs (red,white, and various positions of half-red and half-white), are attached toa board (see Figure 39). These blocks serve as a key for the S. The Sis asked to point to a block on the board and then to a place on a whitesheet of paper. After S designates the block and the location on thesheet of paper, E takes the block (with the designated color combination)from his reserve and places it on the designated location. A reservesupply of 18 blocks is used so that E would lose little time in placingthe block selected by the S in the designated location. In al] otherrespects, the procedures described in the standard administration arefollowed.

Sattler 39
R R W W
W' R
W W R R
Figure 39. Arrangement of Block Design stimulus board.
Coding. A "yes"-"no" modification is used. The modification was
designed so that the S is required to say "yes" or "no" depending onwhether the symbol under the letter matched the symbol shown in the key.A specially prepared Coding form was constructed. Three boxes are used
for each item. An empty box on the first row is used for the E to make
a mark when the S says "yes." It is left blank when the S says "no."The second row shows the number. The third row shows the symbol. Under
the three rows, the key is presented. By use of a randomization procedure,correct symbols and incorrect symbols were placed under each number. Theincorrect symbols were selected from those shown in the standard key.
The standard WISC Coding numbers were used. However, instead of
placing all of the letters on one page, four separate pages (trials) wereused. The time limits were 24" for the first trial and 32" for each ofthe remaining trials. This modification was incorporated in order to
study the rate of improvement over the four trials. The total time limit
(120") is the same as that used in the standard form. The modified form
appears in the Record Booklet in the Supplement.
Memory for Block Designs
The Memory for Block Designs test is a new multiple-choice memorytest which incorporates the 10 WISC Block Design subtest stimuli. The
E shows the S each WISC Block Design card for five seconds, beginningwith card A, and after removing each card immediately presents themultiple-choice card on which four designs appear. The S's task is to
point to the correct design.
The multiple-choice cards each have an overall dimensions of 7 14/16inches by 2 inches. Each block design drawing is 1 9/16 inches by 1 9/16
inches. Each block in the drawing is 13/16 of an inch by 13/16 of aninch. There is 5/16 of an inch between drawings. The cards are shown in
Figure 40.
Data Analysis
Various statistical procedures were used to evaluate the validity ofthe modified tests. For the Stanford-Binet tests, correlations wereobtained between the standard and modified tests in each of the four groups.In addition to correlations, chi square analyses were conducted to evaluatethe degree to which subjects passed both the standard and modified testsor failed one form of the test and passed the other form. Biserialcorrelations could not be obtained because a Stanford-Binet IQ was notavailable and an entire series of Stanford-Binet tests was not adminis-tered. Only selected Stanford-Binet tests were evaluated, primarily thosewhich clearly involve a memory component.

Sattler
1
2.
3.
4.
5.
6.
7.
8.
9.
10.
.111,W R w
VI VI
90° . FG 90°
R w R
Ow*
90-FG
90°
90°
w
W R
RFt;
R
FG
FG
R w
FG
XR
W w
vR vE
90°
FG
FG
FG
R.w
R
90°
9o0
Figure 40. .Memory for Block Design Stimulus cards (90° = 90°rotation; FG = figure ground inversion; R = correct answer).
40

Sattler 41
For the WISC subtests, correlations were obtained between thestandard and modified WISC subtest scaled scores and WISC IQ's in eachof the four groups. In addition, analyses of variance procedures wereused to evaluate the standard and modified WISC scaled scores and WISCIQ's. In the normal group three 10 X 2 ANOVA designs, with repeatedmeasures on the last factor, were used to evaluate the Digit Span, BlockDesign, and IQ scores. The first factor was the 10 age levels (6 through15) and the second factor was the scaled score (standard and modified).For the Coding subtest, a 7 X 2 ANOVA design was used because Coding Bis only appropriate for children 8 years of age and older; therefore,children in age groups 9 through 15 were studied. The 8-year-old groupwas not evaluated because some children in this group were younger thaneight years. The design for the mentally retarded, cerebral-palsied, andorthopedically handicapped groups was a treatment by subjects design.The two treatments were the standard and modified administrations. Agewas not used as a factor because there was no attempt made to selectchildren according to birthdate and date of testing in these three groups.
Intercorrelations were performed using IQ's obtained on the standardand modified WISC forms together with four subject variables: sex,socioeconomic level (SES), chronological age, and general IQ.
For the Memory for Block Designs test, standard scores were computed,and correlations were obtained between the raw scores on the Memory forBlock Designs test and other variables. Finally, a t test was used toevaluate the WISC IQ's obtained by the spastic and nonspastic cerebral-palsied children.
Results
The results are discussed in four parts. The first part presents theresults for the Stanford-Binet tests; the second, presents the results forthe WISC subtests; the third, presents the results for the Memory for BlockDesigns Test; and the fourth, presents IQ's for spastic vs. nonspasticcerebral-palsied children.
Stanford-Binet Tests
Correlations between Standard and Modified Upper Level Stanford-Binet Tests
Table 18 presents the correlation coefficients between the standardand modified forms of the six upper level Stanford-Binet tests. In thenormal group there were three significant correlations (Memory for DesignsI, Memory for Sentences III, and Copying a Bead Chain from Memory), whichrange from .30 to .44. In the mentally retarded group there were foursignificant correlations (Memory for Designs I, Memory for Sentences II,Plan of Search, and Memory for Sentences III), which range from .25 to.43. In the cerebral-palsied group there were four significant correla-tions (Memory for Designs I, Memory for Sentences II, Memory for SentencesIII, and Copying a Bead Chain from Memory), which range from .26 to .40.Finally, in the orthopedically handicapped group there were three signi-ficant correlations (Memory for Sentence II, Plan of Search, and Memory for

Sattler 42
Sentences III), which range from .35 to .56. The standard and modifiedforms of the Memory for Sentences III test correlated significantly in allfour groups; Memory for Designs I hnd Memory for Sentences II in three ofthe four groups; Plan of Search and Copying a Bead Chain from Memory in twoof the four groups; and Memory for Designs II in none of the groups.
Table 18. Correlations between Standard and Modified Upper LevelStanford-Binet Tests
Tests Normal MentallyRetarded
CerebralPalsied
OrthopedicallyHandicapped
Memory for designs I .35** .25* .37** .24Memory for sentences II .14 .41** .26* .36*Memory for designs II -.06 .20 .05 .08Plan of Search .11 .37** .15 .56**Memory for sentences III .44** .43** .40** .35*Copying'a bead chain
from memory.30** .22 .28* .19
* It< .05.
** .121.< .01.
Related to the correlations between the standard and modified testsis the percentage of subjects who passed the standard and modified formsfor each test. These data are shown in Figures 33 through 38 for eachStanford-Binet test in the upper year levels that were used in the study.The figures show the percentage of subjects passing each test as afunction of age level.

Sat tier
100
90
80
70
60
E5 500-40
30
20
10
0 -0 --
V
o--4 STANDARD
MODIFIED
Oas0r I
6 7 8 9 .10 11 12 13 14 15
AGE
100 -
90 -
80
70 -
E 60c4scf, 50 -a.
40 .
30 / '420 w a STANDARD
106---4) MODIFIED
°ap e° 1 A A A
0 6 7 8 9 10 11 12 13 14 15
AGE
FIG.33 MEMORY FOR DESIGNS I (II.3) FIG.34 MEMORY FOR SENTENCES LE (II,4)
100
90
80
70
60
°; 50cL.
40
30
20
10
00 6
AI
40.--4oSTANDARD
6--- MODIFIED
a
1 8 9 10 11 12 13 14 15AGE
FIG.35 MEMORY FOR DESIGNS IL
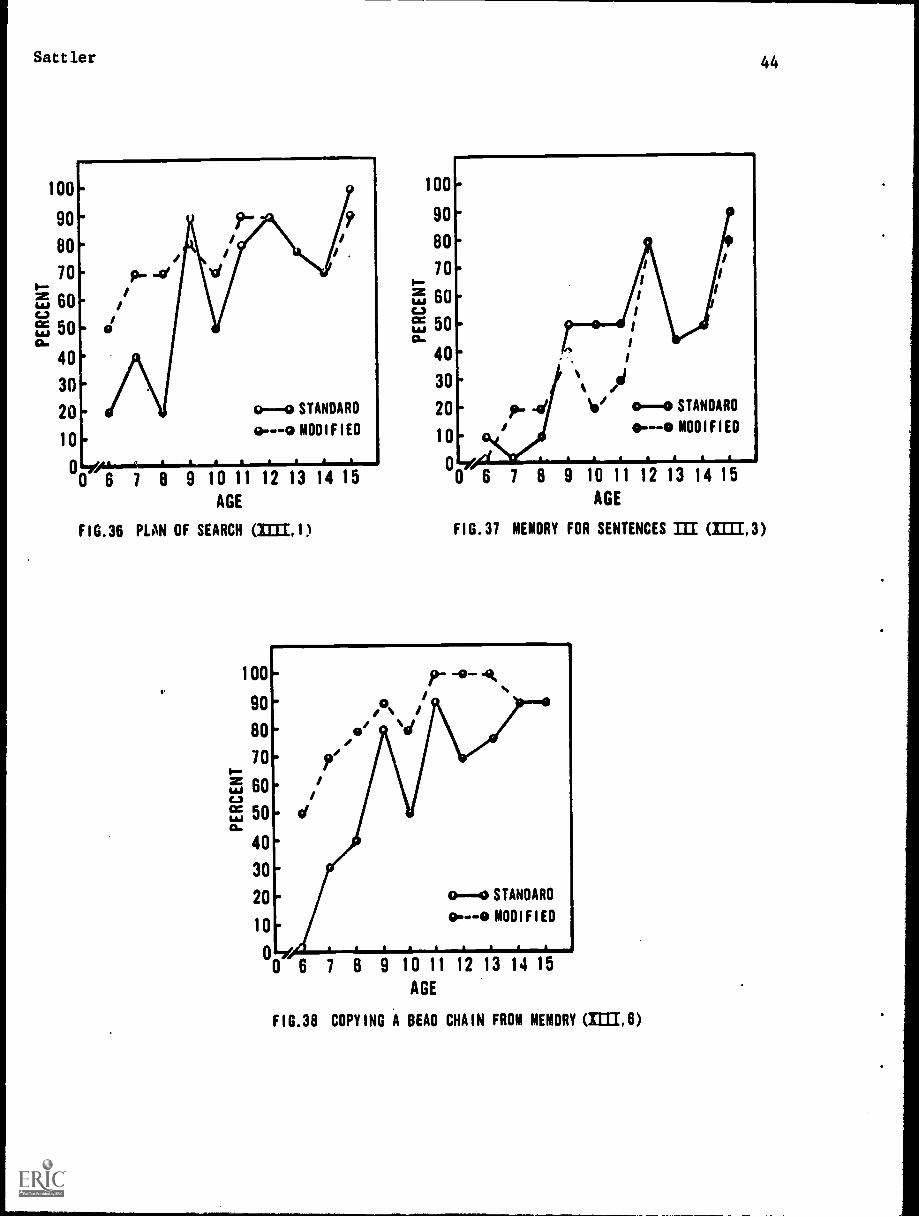
Battler
100
90
80
10,--iT, 60C6)
e5 50a.
40
30
20
10
o--co STANDARD
o---o MODIFIED
09 10 11 12 13 14 15
AGE
FIG.36 PLAN OF SEARCH (11311)
v
100
100
90
80
10-E 60c.)
E5 5006
40
9 10 11 12 13 14 15AGE
FIG.37 MEMORY FOR SENTENCES III =1.3)
44
r -0- 490. o.. /80- et ../
70- 'It,.-
5 60- ic..1 iit 50- d06
40.30
20- 0-0 STANDARD
10- o---0 MODIFIED
.-e0. . .
0 6 7 8 9 10 11 12 13 14 15AGE
A A A
FIG.36 COPYING A BEAD CHAIN FROM MEMORY (IIII,6)

Sattler 45
Chi Square Analyses for Upper Level Stanford-Binet Tests
Au index of the validity of the upper level Stanford-Binet tests isthe number of subjects who passed both the standard and modified formsand who failed both the standard and modified forms. Table 19 presents
the number of subjects who obtained successes and failures on each ofthe six upper level Stanford-Binet tests that were studied in the inves-tigation. Table 19 shows the number of subjects who were correct onboth forms, correct on one form and incorrect on the other, and incorrect
on both forms. Chi square analyses were performed for each groupseparately and for each test separately in order to determine whether theproportion of agreement (correct on both plus incorrect on both) wasgreater than the proportion of disagreement (correct on one and incorrecton the other). Thus, for example, the first chi square that was performedfor the data of Table 20 was for the normal group for the Memory forDesigns I test. The number of subjects who performed the same way on bothforms was 71 (52 + 19), while the nutilh'r of subjects who performed differ-ently on the two forms was 29 (10 + 19). The chi square for thesefrequencies was 16.81, which is significant (2. < .01). The chi squaresfor each test and group are shown in Table 20.
Table 19. Number of Ss Obtaining Successes and Failures on Upper LevelStandard and Modified Stanford-Binet Tests
Test
Memory fordesigns I
Memory forsentences II
Memory fordesigns II
Plan of search
Memory forsentences III
Copying a beadchain frommemory
Correct onboth standardand modified
NO MR CP OR
Correct onstandard/incorrect onmodified
NO MR CP OR
Incorrect onstandard/
correct onmodified
NO MR CP OR
Incorrect onboth standardand modified
NO MR CP OR
52 6 10 8 10 3 7 5 19 20 11 8 19 46 48 14
29 2 6 7 21 3 12 8 23 2 6 3 27 68 50 15
74 6 11 9 8 0 1 2 18 45 56 18 0 24 8 6
53 4 4 8 13 1 3 1 23 13 22 6 11 57 47 20
27 1 5 6 16 4 7 7 11 0 4 3 46 70 58 18
58 5 10 11 4 2 4 5 27 24 22 9 11 42 39 9
Note.--Abbreviations are as follows: NO = normal, MR = mentally retarded,CP = cerebral-palsied, OR = orthopedically handicapped.

Sattler 46
Table 20. Chi Square Analyses for Proportion of Agreement of Successesand Failures on Upper Level Stanford-Binet Tests
(See Table 19 for data)
TestNormal
MentallyRetarded
CerebralPalsied
OrthopedicallyHandicapped
Memory for designs I 16.81** 10.45** 21.01** 1.83
Memory for sentences II 1.21 54.61** 18.50** 3.03
Memory for designs II 22.09** 2.61 18.01** .46
Plan of search 7.29** 28.13** 8.22** 11.43**
Memory for sentences III 20.25** 58.08** 35.15** 10.32**
Copying a bead chainfrom memory
13.69** 6.25* 6.45* 7.36**
* z < .05.
** 2 < .01.
The results of the chi square analyses indicate that on five of thesix tests in the normal group there were significantly more subjects whoperformed the same way on both forms of the tests that there were subjectswho performed differently on both forms of the tests. The only test havinga nonsignificant chi square was Memory for Sentences II. In the mentallyretarded group five of the six chi squares were also significant. However,in this group the nonsignificant chi square was on the Memory for Designs IItest. In the cerebral-palsied group all of the chi square tests were signi-ficant. However, the frequencies for Memory for Designs II were in adirection opposite that that predicted. That is, the pattern of disagreementwas greater than the pattern of agreement on the two forms. In the ortho-pedically handicapped group there were only three significant chi squares(on Plan of Search, Memory for Sentences II, and Copying a Bead Chain fromMemory), and all frequencies were in the predicted direction.
WISC Subtests
Correlations between the Standard and Modified WISC Subtests and ita.
Table 21 presents the correlations between the standard and modifiedWISC subtest scaled scores and IQ's for each of the four groups. The WISCIQ's were obtained by the method proposed by Tellegen and Briggs (1967).The Digit Span, Block Design, and Coding subtests can be considered to con-stitute a short form of the WISC. This short form was used to obtain WISCIQ's. All correlations were significant at the .01 level. The coefficientsranged from .47 to .92. These data indicate that the standard and modifiedsubtest scaled scores and the standard and modified IQ's are highlycorrelated.

Sattler 47
Table 21.. Correlations between Standard and Modified WISC SubtestScaled Scores and IQ's
Subtest Normal MentallyRetarded
CerebralPalsied
OrthopedicallyHandicapped
Digit Span .70* .68* .78* .92*
Block Design .66* .78* .82* .70*
Coding B .56* .74* .62* .47*
IQ. .71* .84* .80* .83*
* EL< .01.
Analyses of Variance of WISC Scores
Digit Span. Tables 22 through 25 present the Digit Span ANOVA results
for the four groups. The standard and modified forms were not significantlydifferent in the normal and orthopedically handicapped groups, whereas themodified form was significantly more difficult than the standard form inthe mentally retarded (by .80 points) and cerebral-palsied (by .85 points)groups. Age and the interaction between age and treatment were not signi-ficant factors in the normal group.
Table 22. ANOVA for Standard and Modified WISC Digit Span Scaled Scoresof Normal Children
Source
(1 =
df
99)
MS
Ages (A) 9 16.55 1.15
Error 89 14.37
Treatment (B) 1 2.88 1.12
A X B 9 2.74 1.06
Error 89 2.57
M Digit Span Scaled Score (Standard) = 11.35M Digit Span Scaled Score (Modified) = 11.11
Table 23. ANOVA for Standard and Modified WISC Digit Span Scaled Scoresof Mentally Retarded Children
(N= 72)
Source
Treatment (A)
Ss (B)A X B
MS df
10.76*25.0012.002.32
1
71
M Digit Span (Standard) = 3.88M Digit Span (Modified) A 3.04
* 2 < .01.

Sattler 48
Table 24. ANOVA for Standard and Modified WISC Digit Span Scaled Scoresof Cerebral-Palsied Children
(N = 76)
Source
Treatment (A)Ss (B)
A X B
MS cif
8.06*27.8027.313.45
1
75
M Digit Span (Standard) = 7.38M Digit Span (Modified) = 6.53
* Q < .01.
Table 25. ANOVA for Standard and Modified WISC Digit Span Scaled Scoresof Orthopedically Handicapped Children
(N = 33)
Source
Treatment (A)Ss (B)A X B
MS df
1
34
3.965.1630.861.30
M Digit Span (Standard) = 8.23M Digit Span (Modified) = 7.69
Block Design. Tables 26 through 29 present the Block Design ANOVAresults for the four groups. In each group the standard Block Designsubtest yielded significantly higher scores than the modified Block Designsubtest. The discrepancies between the standard and modified forms wasgreatest in the normal group (1.69 points) and least in the cerebral-palsied group (.60 points). While mean differences in all groups weresignificant, the discrepancy was less than a point in the cerebral-palsiedgroup and in the orthopedically handicapped group. Age and the inter-action between age and treatment were not significant factors in thenormal group.
Table 26. ANOVA for Standard and Modified WISC Block Design Scaled Scoresof Normal Children
(N = 99)
Source df MS
Ages (A) 9 29.21 1.92
Error 89 15.20
Treatment (B) 1 141.12 47.05*
A X B 9 7.54 2.51Error 89 3.00
M Block Design Scaled Score'(Standard) = 12.00M Block Design Scaled Score (Modified) = 10.31
* 2 < .01.

Sattler 49
Table 27. ANOVA for Standard and Modified WISC Block Design Scaled Scoresof Mentally Retarded Children
(1 = 74)
Source MS df
Treatment (A)Ss (B)
A X B
16.2219.372.35
1
73
6.92*
M Block Design (Standard) = 5.24M Block Design (Modified).- 4.58
* P < .05.
Table 28. ANOVA for Standard and Modified WISC Block Design Scaled Scoresof Cerebral-Palsied Children
(N = 76)
Source
Treatment (A)Ss (B)
A X B
MS df
6.65*13.92
21.572.09
1
75
M Block DesignM Design
(Standard) = 6.39(Modified) = 5.79
* P < .05.
Table 29. ANOVA for Standard and Modified WISC Block Design Scaled Scoresof Orthopedically Handicapped Children
(1 = 34)
Source MS df
TreatmentSs (B)
A X B
(A) 25.5316.893.07
1
33
7.65*
M Block Design (Standard) = 8.18M Block Design (Modified) = 7.00
* 2.< .01.
Coding. Tables 30 through 33 present the Coding ANOVA results for the
four groups. In each group the standard Coding subtest yielded signifi-cantly lower scores than the modified Coding subtest. The discrepanciesranged from 1.48 in the mentally retarded group to 3.32 in the cerebral-palsied group. Age and the interaction between age and treatment werenot significant variables in the normal group.

Sattler 50
Table 30. ANOVA for Standard and Modified WISC Coding Scaled Scores ofof Normal Children
(N = 69)
Source df MS F .
Ages (A) 6 26.43 1.77
Error 62 14.93
Treatment (B) 1 185.15 40.54*
A X B 6 4.43 .98
Error 62 4.57
M Coding Scaled Score (Standard) = 13.48M Coding Scaled Score (Modified) = 15.78
* 2. < .01.
Table 31. ANOVA for Standard and Modified WISC Coding Scaled Scores ofMentally Retarded Children
(N = 65)
Source
Treatment (A)Ss (B)
A X B
MS df
22.23*70.89
21.233.19
1
64
M Coding (Standard) = 5.14M Coding (Modified) = 6.62
* 2. < .01.
Table 32. ANOVA for Standard and Modified WISC Coding Scaled Scores ofCerebral-Palsied Children
(N = 63)
Source
Treatment (A)Ss (B)
A X B
MS
346.67
30.077.51
df
46.14*1
62
M Coding (Standard) = 4.30M Coding (Modified) = 7.62
* 2. < .01.
Table 33. ANOVA for Standard and Modified WISC Coding Scaled Scores ofOrthopedically Handicapped Children
(N = 30)
Source
Treat At (A)Ss (B)
A X B
M Coding (Standard) =M Coding (Modified) =
MS
64.0725.37
9.17
6.908.97
df
1
29
6.99*
* E < .05.

Sattler 51
Rows on modified WISC Coding. The Coding subtest was modified intwo ways. One major modification was placing correct and incorrect symbolsunder the various numbers. The second modification consisted of timingseparately each of the rows of digits. In the standard WISC Coding subtestthere are four rows, the last three of which contain an equal number ofdigits (25 digits). The first row, however, contains fewer digits thanthe remaining three rows (18). Thus, it was anticipated that there wouldbe a significant difference between the scores on the first row and thoseon each of the remaining three rows.
A treatment by subjects design was used to evaluate the scoresobtained on the four rows. Tables 34 through 37 present the ANOVA results.The row factor was a significant effect in the normal, mentally retarded,and orthopedically handicapped groups. However, in the cerebral-palsiedgroup the row factor was not a significant effect.
Newman-Keuls tests were conducted in the three groups in which therewas a significant row main effect. (Means are shown in the ANOVA tables.)In the normal group, the mean on the first row was significantly lower(2< .01) than the means on each of the three remaining rows. In addition,the mean of the second row was significantly lower than the means on thethird and fourth rows. The mean on the third row was not significantlydifferent from the mean of the fourth row. In the mentally retarded groupand in the orthopedically handicapped group the mean on the first row wassignificantly lower (2< .01) than the means on each of the three remain-ing rows. No other differences were significant.
Table 34. ANOVA for Four Rows of Modified WISC Coding with Normal Children
(14 = 99)
Source MS df
Rows (A) 190.12 3 53.23*Ss (B) 101.84A X B 3.57 293
M Row 1 Raw Score = 11.26M Row 2 Raw Score = 13.03M Row 3 Raw Score = 13.90M Row 4 Raw Score = 14.42
* 2 < .01.
Table 35. ANOVA for Four Rows of Modified WISC Coding with MentallyRetarded Children
= 72)
Source MS df
Rows (A) 18.66 3 12.52*Ss (B) 47.16A X B 1.49 210
M Row 1 Raw Score = 5.22M Row 2 Raw Score = 6.15M Row 3 Raw Score = 6.34M Row 4 Raw Score = 6.22
* 2< .01.
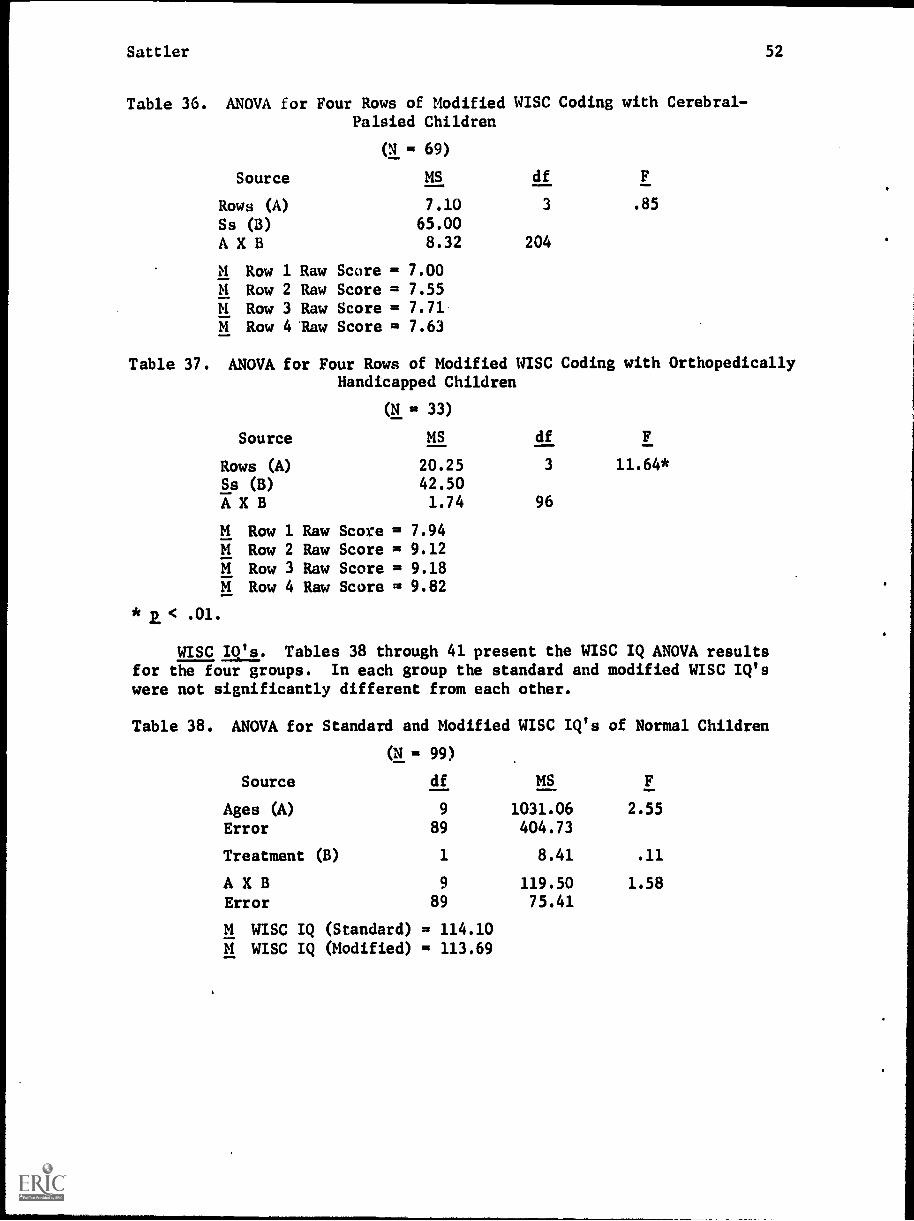
Sattler 52
Table 36. ANOVA for Four Rows of Modified WISC Coding with Cerebral-Palsied Children
(N = 69)
Source MS df
Rows (A) 7.10 3 .85
Ss (B) 65.00A X B 8.32 204
M Row 1 Raw Score = 7.00M Row 2 Raw Score = 7.55M Row 3 Raw Score = 7.71M Row 4 'Raw Score = 7.63
Table 37. ANOVA for Four Rows of Modified WISC Coding with OrthopedicallyHandicapped Children
= 33)
Source MS df
Rows (A) 20.25 3 11.64*
Ss (B) 42.50A X B 1.74 96
M Row 1 Raw Score = 7.94M Row 2 Raw Score = 9.12M Row 3 Raw Score = 9.18M Row 4 Raw Score = 9.82
WISC IO's. Tables 38 through 41 present the WISC IQ ANOVA resultsfor the four groups. In each group the standard and modified WISC IQ'swere not significantly different from each other.
Table 38. ANOVA for Standard and Modified WISC IQ's of Normal Children
ON = 99)
Source df MS
Ages (A) 9 1031.06 2.55
Error 89 404.73
Treatment (B) 1 8.41 .11
A X B 9 119.50 1.58
Error 89 75.41
M WISC IQ (Standard) = 114.10M WISC IQ (Modified) = 113.69

Settler 53
Table 39. ANOVA for Standard and Modified WISC IQ's of Mentally RetardedChildren
(N = 71)
Source MS df F
Treatment (A) 10.71 1 < 1Ss (B) 557.30A X B 47.50 70
M IQ (Standard) = 64.72M IQ (Modified) = 64.17
Table 40. ANOVA for Standard and Modified WISC IQ's of Cerebral-PalsiedChildren
(N= 76)
Source
Treatment (A)Ss (B)
A X B
MS df F
2.59257.92896.90
99.73
1
75
M IQ (Standard) = 74.03M IQ (Modified) = 76.63
Table 41. ANOVA for Standard and Modified WISC IQ's of OrthopedicallyHandicapped Children
(N= 35)
Source MS df F
Treatment (A) 1.73 1 < 1Ss (B) 747.60A X B 71.05 34
M IQ (Standard) = 84.94M IQ (Modified) = 84.63
Intercorrelations
The results of intercorrelations among six variables (sex, SES, CA,IQ, WISC IQ standard, and WISC IQ modified) are shown in Tables 42 through45 for the normal, mentally retarded, cerebral-palsied, and orthopedicallyhandicapped groups. In addition, in the cerebral-palsied and orthopedicallyhandicapped groups, seven additional scores are included which were obtainedfrom the Survey of Degree of Physical Handicap (the scale ranged from noincapacity [1] to great incapacity [4]). In the Survey there are sixseparate areas that are evaluated: vision, hearing, speech, sitting balance,arm-hand use, and walking. In addition, a seventh rating was obtained, thetotal disability rating, by summing the six individual ratings.
Variable 4 requires some explanation. This IQ was derived from anassortment of tests that represented either previous IQ scores in thechild's records or IQ scores estimated from the Stanford-Binet Vocabularytest. In the latter case, the method suggested by Cureton (1954) was used

Sattler 54
to obtain an IQ. In some cases IQ's were not available for some subjectsbecause examiners failed Co administer the Vocabulary test and an IQ alsocould not be obtained from the child's school records. The general IQrepresented by Variable 4 is based on an assortment of tests, and itshould be considered as a rough approximation of a general level ofintelligence.
We first examine the correlations between the WISC IQ's (standard andmodified), which were based on the three subtests (Digit Span, BlockDesign, and Coding), and the general IQ. The two WISC IQ's correlatesignificantly with Variable 4, the general IQ, in all four groups at alevel which is less than .01. The lowest correlations are in the normalgroup (.39 and .29 for the standard and modified IQ's, respectively).In the mentally retarded, cerebral-palsied, and orthopedically handicappedgroups the correlations are higher (all .55 or above).
Sex was a significant variable only in the cerebral-palsied group.Poorer vision was associated with boys.
Socioeconomic status was a significant variable only in the cerebral-palsied group. Cerebral-palsied children coming from a high socioeconomicstatus level tended to have more speech difficulty than cerebral-palsiedchildren coming from a low socioeconomic level.
Chronological age was a significant variable in the normal group andin the cerebral-palsied group. In the normal group, higher WISC standardand modified IQ's were associated with older children. In the cerebral-palsied group, walking difficulty was associated with younger children.
In the cerebral-palsied group, the general IQ, in addition to itssignificant correlations with the two WISC IQ's, was significantly nega-tively associated with visual ability, speech ability, and the totaldisability ratings. Further, in the cerebral-palsied group, WISC IQ's(standard and modified) were significantly negatively associated withvisual ability, arm-hand use ability, and tot 1 disability ratings.Correlations among the six individual variablt-. associated with thedegree of physical handicap ratings indicated that four of the six ratingswere significantly intercorrelated, namely, speech, sitting balance,arm-hand use, and walking. The total disability rating also was corre-lated significantly with these four variables as well as with visualdifficulties. Visual difficulty and hearing difficulty were notcorrelated with any of the other separate disability ratings.
The total disability rating, as we have seen, correlated significantlywith general IQ, the two WISC IQ's, and with all of the separate disabilityratings, with the exception of vision. The corelations involving the totaldisability rating and the six separate disability ratings representsomewhat spurious correlations because the individual disability ratingscomprise the total rating.
In the orthopedically handicapped group, the general IQ, in additionto its significant correlations with the two WISC IQ's, was significantlynegatively associated with speech difficulty and with the total disability

Sattler 55
ratings. The standard WISC IQ was negatively associated with speechability and with arm-hand use ability, while the modified WISC IQ wasnegatively associated only with speech ability. Correlations among thesix individual variables associated with the degree of physical handicapratings indicated that visual ability was correlated significantly withsitting balance, arm-hand use, and total disability ratings. Sittingbalance was correlated significantly with arm-hand use and walking.Hearing was not correlated significantly with any of the variablesbecause all of the children in the sample could hear adequately.
The total disability rating, as we have seen, correlated significantlywith general IQ, the two WISC IQ's, and with all of the separate disabilityratings, with the exception of hearing and speech. As mentioned previously,the correlations involving the total disability ratings and the individualdisability ratings are somewhat spurious.
Table 42. Intercorrelation Matrix for Selected Variables in Normal Group
Variable 1 2 3 4 5 6
1. Sexa
-.03 .05 .02 .12 .072. SES .01 -.06 -.06 -.183. CA -.12 .35 .274. IQ
b .39 .295. WISC IQ (S) .71
6. WISC IQ (M)b
Mean 1.56 3.52 125.59 105.81 113.95 113.64SD .50 1.44 34.57 20.53 16.60 16.43N 99 99 99 81 99 99
Note.--For N = 99 r = .20 at p = .05 and r = .26 at p= .01 (two-tailed);for N = 81 r = .22 at p= .05 and r = .28 at ps .01 (two-tailed).
aMale = 1, female = 2.bS = standard, M = modified.
Table 43. Intercorrelation Matrix for Selected Variables in MentallyRetarded Group
Variable 1 2 3 4 5 6
1. Sexa -.19 .06 -.11 -.15 -.102. SES -.11 .16 .18 .123. CA .03 .04 .124. IQ
b .57 .555. WISC IQ (S) .84
6. WISC IQ (M)b
Mean 1.53 4.40 121.59 61.14 63.73 63.62SD .50 1.66 22.12 14.29 18.06 17.43N 75 75 75 69 73 73
Noti.--For N = 75 r = .23 at 2L= .05 and r = .30 at p= .01; for N = 73 r =.23 at r = .05 and r= 30 at p= .01; for N= 69 r = .24 at 2.= .05 and r m.31 at 2.= .01 (all two tailed).
aMale = 1, female = 2.bS = standard, M = modified.

Table 44.
Intercorrelation Matrix for Selected Variables in
Cerebral-Palsied Group
Variable
12
34
56
78
910
11
12
13
1.
Sexa
.06
.02
.03
-.21
-.13
-.33
-.11
-.09
.05
-.02
-.03
-.10
2.
SES
.02
-.08
.00
.05
.10
.08
-.30
-.06
-.09
-.10
-.14
3.
CA
-.18
-.13
.07
.15
.13
.02
-.12
.09
-.27
-.04
4.
IQ
.68
.55
-.24
.01
-.38
-.15
-.20
-.05
-.30
5.
WISC IQ
(S)13
.80
-.16
.07
-.45
-.14
-.43
-.12
-.37
6.
WISC IQ
(M)b
-.14
.09
-.30
-.05
-.27
-.08
-.23
7.
Vision
-.07
.16
.08
-.15
.16
.35
8.
Hearing
.06
-.07
-.01
-.04
.06
9.
Speech
.50
.42
.38
.74
10.
Sitting
balance
.41
.68
.81
11.
Arm-hand use
.34
.70
12.
Walking
.76
13.
Total disability
rating
Mean
1.47
3.78
119.08
82.68
74.03
76.63
1.29
1.03
1.61
1.51
1.91
2.28
9.62
SD
.50
1.78
31.39
19.48
21.39
23.22
.51
.23
.78
.86
.87
.81
2.69
N76
76
76
68
76
76
76
76
76
76
76
76
76
N Note.--For N = 76 r = .23 at 2.= .05 and r =
.29 at 2.= .01 (two-tailed); for N = 68 r = .24 at a= .05
and r = .31 at ja= .01 (two-tailed).
atiale= 1, female = 2.
bS = standard, M = modified.

Table 45.
Intercorrelation Matrix for Selected Variables in Orthopedically Handicapped Group
Variable
12
34
56
78
910
11
12
1.
Sexa
-.12
-.02
.21
.05
.15
.23
.00
-.09
-.02
-.02
-.06
13 .01
cn p rtre i-,
m rt
2.
SES
.32
.10
.06
.07
.09
.00
-.24
.12
.29
-.09
.06
3.
CA
.15
-.06
.02
.06
.00
-.11
.06
.11
.00
.05
4.
IQ
.61
.76
-.07
.00
-.71
-.03
-.29
-.11
-.34
5.
WISC IQ
(S)b
.83
-.14
.00
-.52
.01
-.37
-.09
-.31
6.
WISC IQ
(M)b
-.10
.00
-.58
.06
-.31
-.10
-.29
7.
Vision
.00
.04
.37
.64
.08
.65
8.
Hearing
.00
.00
.00
.00
.00
9.
Speech
.01
.04
.07
.31
10.
Sitting
balance
.52
.54
.80
11.
Arm -hand use
.18
.74
12.
Walking
.64
13.
Total disability
rating
Mean
1.49
4.03
135.00
89.55
84.94
84.63
1.31
1.00
1.23
1.49
1.43
2.23
8.69
SD
.51
1.69
35.22
20.91
20.73
19.72
.68
.00
.60
.78
.70
.84
2.31
N35
35
35
29
35
35
35
35
35
35
35
35
35
Note.7-For N = 35 r = .33 at EL= .05 and r = .43 at 2= .01 (two-tailed); for N = 29 r = .37
and r =
.47 at 2 = .01 (two-tailed).
aMale
= 1, female = 2.
bS = standard, M = modified.

Settler 58
Memory for Block Designs
Standard Scores
Table 46 presents the standard scores (M = 10, SD = 3) for the Memory
for Block Designs test for the mentally retarded, cerebral-palsied, and
orthopedically handicapped groups. Standard scores could not be obtained
for the normal group because their mean score was very high (14 = 8.83).
Thus, the test proved to be too easy for the normal sample. However, the
test has a satisfactory range of standard scores for the cerebral-palsied
group and for the orthopedically handicapped group. The range is less
satisfactory for the mentally retarded group.
Table 46. Memory for Block Designs Standard Scores for Three Groups
Standard Scores
RawScore
MentallyRetarded
CerebralPalsied
OrthopedicallyHandicapped
10 12 15 13
9 11 13 12
8 11 12 10
7 10 11 9
6 10 9 8
5 10 8 6
4 9 6 5
3 9 5 4
2 8 4 2
1 8 2 1
0 8 1 0
Note.--Normals not included because there was limited variability in the
group and because the mean was 8.83.
Correlations
The raw scores for the Memory for Block Designs test were correlatedwith 29 other variables in the normal and mentally retarded groups and
with 36 other variables in the cerebral-palsied and orthopedically handi-capped groups (see Table 47). The sevea additional variables in the latter
two groups were for the variables associated with the Survey of Degree of
Physical Handicap form.
In the normal group, despite the limited range of scores, there weremany significant correlations between the Memory for Block Designs test
and the other variables. The highest correlations were with "Copying aBead Chain from Memory" (.44) and with "Memory for Designs II" (.39). The
test also correlated significantly with the estimated WISC IQ's (with the
standard form, r = .28; with the modified form, r = .35). In the mentallyretarded, cerebral-palsied, and orthopedically handicapped groups, many ofthe correlations between Memory for Block Designs and other variables were
also significant. Thus, for example, IQ, Memory for Designs I, and Memoryfor sentences III were significantly correlated with Memory for Block
Designs in all three groups. In the cerebral-palsied and orthopedically

Sattler 59
handicapped groups, speech proficiency was significantly negativelyrelated to Memory for Block Designs scores (-.31 and -.41, respectively).Thus, handicapped children with poor speech tend to have low Memory for
Block Designs scores.
In the original proposal, an analysis of the incorrect responses on
the Memory for Block Designs test was planned. The aim was to compare the
incorrect responses of the cerebral-palsied children with those of thenormal children in order to see whether any systematic differences appeared
in their incorrect choices. However, because the test proved to be too
easy for the normal children, this analysis was not performed.
Table 47. Correlations between Memory for Block Designs and other Variables
Variable
1. Sex2. SES
3. CA4. IQ
5. Memory for designs I (S)
6. Memory for sentences II (S)7. Memory for designs II (S)
8. Plan of search (S)
9. Memory for sentences III (S)10. Copying a bead chain from
memory (S)
11. Digit Span (S)12. Coding B (S)
13. Block Design (S)14. WISC IQ (S)15. Memory for designs I (M)
16. Memory for sentences II (M)17. Memory for designs II (M)18. Plan of search (M)19. Memory for sentences III (M)20. Copying a bead chain from
memory (M)21. Digit Span (M)22. Coding B (M)
23. Block Design (M)
24. Coding B Row 1 (M)
25. Coding B Row 2 (M)26. Coding B Row 3 (M)27. Coding B Row 4 (M)
28. Coding B Total (M)
29. win to (M)30. Vision31. Hearing32. Speech33. Sitting balance
34. Arm-hand use
NormalMentallyRetarded
CerebralPalsied
OrthopedicallyHandicapped
-.07 -.08 -.03 -.03
-.08 -.05 .03 .28
.34** .37** .34** .57**
.10 .35** .43** .59**
.34** .31** .42** .45**
.18 .1; .44** .36*
.39** .18 .32** .45**
.28** .32** .31** .42*
.08 .27* .31** .51**
.29** .30* .37** .46**
.22* .24 .55** .59**
-.01 .40** .49** .26
.24* .28* .47** .45**
.28** .31** .55** .53**
.33** .21 .38** .17
.36** .04 .26* .27
.05 .36** .27* .29
.07 .26* .35** .32
.21* .23 .22 .30
.44** .32** .37** .22
.34** .28* .50** .60**
.02 .39** .44** .11
.14 .08 .53** .47**
.30** .4** .30* .57**
.33** .47** .48** .34
.29** .47** .41** .39*
.33** .41** .47** .52**
.32** .44** .48** .48**
.35** .27* .58** .54**qp -.11 -.1211011 .07 .00
-.31** -.41*=1, MIMMN.Mo. -.15 -.02MI.M1.1=1 NOMPIMI. -.04 -.25

Sattler 60
Table 47. continued
35.
36.
Variable
WalkingTotal disability rating
SD
Normal
II=
8.83
1.7199
MentallyRetarded
MEANER OM
MS 11111MD
5.902.15
71
CerebralPalsied
-.22
-.23**6.622.23
76
OrthopedicallyHandicapped
.08
-.207.662.18
35
Note.--(S) indicates standard, (M) indicates modified.
* 2. < .05.* *P.< .01.
Cerebral Palsied: Spastic vs. Nonspastic
In the cerebral-palsied group, the IQ's (based on the three WISCsubtests that were administered) of children with a spastic type of
condition (N = 51) were compared with those who were not spastic
(N = 20). Diagnoses were based on information contained in the
children's school records. The two groups did not differ significantly
on the IQ's they obtained on the standard administration (M IQ spastic
75.51; M IQ nonspastic = 71.40; t = .01, 2. > .05) and on the modifiedadministration (M IQ spastic = 76.43; M IQ nonspastic = 75.55; t = .02,
/L> .05).
Discussion
The major purpose of the investigation was to develop, if possible, anonverbal form of selected Stanford-Binet tests and WISC subtests whichcould be used to *assess children with impaired speech and motor abilities.In one part of the project, a eystematic attempt was made to modify those
Stanford-Binet tests that occur at year-levels II through V which require
a verbal or motor response. In the second part of the project selectedStanford-Binet tests were modified at year-levels IX through XIII, andthree WISC subtests--Digit Span, Block Design, and Coding--were modified.
We first turn to a discussion of the results for the lower level Stanford-
Binet tests.
The results of the analyses of variance and of the intercorrelationsfor the modified tests at year-levels II through V of the Stanford-Binetindicate that the modified form of the Stanford-Binet for these lower year
levels provides valid IQ's. IQ's on the standard and modified formsdiffered in the normal group by .16 points; in the mentally retarded group,by 2..93 points; and in the cerebral-palsied group, by 1.87 points. In the
latter two groups, the mean IQ obtained on the modified form was higherthan the mean IQ obtained on the standard form. The results, using MA as
the dependent measure, were essentially similar to those using IQ.
The standard deviations of the standard and modified IQ's in the
normal group are also similar. They are respectively, 14.51 and 15.64,
and closely conform to the expected standard deviation of 16.00. Similarly,

Sattler 61
in the mentally retarded group, the standard deviations on the standard andmodified forms are 14.27 and 16.46, while in the cerebral-palsied group,the standard deviations are 17.29 and 19.08, respectively.
The correlations between the standard and modified Stanford-Binet IQ'swere high in the normal, mentally retarded, and cerebral-palsied groups,(.83, .92, and .88, respectively). These correlations, of course, arebased on two forms which have overlapping tests, so that the IQ's are notindependent of each other. Overall, the modified form appears to have anacceptable level of concurrent validity.
The biserial correlations for the modified tests are less satisfactorythan desired. They were generally low, although approximately one-third ofthe items in the normal group had coefficients that were above .15. Itwould have been interesting to compare the biserial correlations of thestandard form tests with those of the modified form tests, but this com-parison is not possible because the analyses for the standard tests werenot performed. The limited item validities may be in part a function ofthe limited number of subjects An the normal group for some of the analyses(e.g., less than 50 subjects for tests at year-levels II and 11-6) andthe higher than average mean IQ for the sample. Although item validitiesare not as satisfactory as possible, the modified items, as a whole, as wehave seen, provide IQ's and MA's that are very similar to those providedby the standard items.
A number of interesting findings appeared in the cerebral-palsiedgroup. Degree of physical disability, for the most part, was not relatedto either IQ or MA. The significant correlations involving degree ofphysical disability indicated that low mental ages were associated withspeech difficulty and with walking difficulty. The mean IQ obtained onthe standard form by the cerebral-palsied children was 80.43, while theirmean IQ on the modified form was 83.27. These means are in the belowaverage range. The mean IQ's generally are similar to those reported inthe literature. If the two forms of the Stanford-Binet can be consideredas alternate forms, then the correlation of .88 between the two forms inthe cerebral-palsied group indicates that the IQ is reliable. This resultis congruent with the literature review which indicated that the IQ obtainedin testing cerebral-palsied children can be considered to be reliable.Finally, the results indicated that the children with a spastic conditionobtained IQ's that were not significantly different from those with anonspastic condition.
For the upper-level Stanford-Binet tests, two statistical procedureswere used, namely, correlations between the two forms and chi squareanalyses. The results of the chi square analyses are somewhat moresupportive of the hypothesis that the modified and standard forms providecomparable results than the results of the correlations between the twoforms. The significant correlations in the normal group are low; similarly,the significant correlations in the remaining three groups (mentallyretarded, cerebral-palsied, and orthopedically handicapped) are alsogenerally low. In contrast, most of the chi squares were in a directionwhich supported the hypothesis that the two groups would perform similarlyon the two forms of the test.

Sattler 62
Part of the reason why the modified Stanford-Binet tests in the upper
year levels do not appear to meet highly acceptable levels of validity is
that the modifications led to easier tests. That is, the percent correct
on the modiacd tests was in all cases in the normal group and in a
majority of the cases in the other three groups higher on the modified
tests than on the standard tests. For example, on the Copying a Bead
Chain from Memory test the percent correct on the standard form was 62%
while on the modified form it was 85%. Similarly, on the Plan of Search
test the percent correct was 56% on the standard form compared with 76%
on the modified form. Even more drastic changes were evident in the three
other groups. These results indicate that multiple-choice modifications
of memory tests, including memory for designs, sentences, or bead chains,
are likely to be easier than the non-multiple-choice standard presentation.
Thus, if we can generalize, multiple-choice procedures used with memory
tests for children between 5 and 16 years are likely to lead to more easier
tests than their counterpart tests which require the child to reproduce
the stimulus by rote. While it is possible that multiple-choice procedures
could be devised which use more difficult distractors, the distractors used
in the present investigation were only slightly changed in some cases from
the correct alternative. Therefore, the results suggest that it is likely
to be difficult to use a multiple-choice procedure for memory tests for
children between 5 and 16 years of age.
The results for the three WISC subtests which were modified (Digit
Span, Block Design, and Coding) indicated that there is, in general, a
satisfactory degree of reliability for the three modified forms, although
mean differences between the standard and modified forms are significantly
different for some tests and for some groups.
The correlations between the WISC modified Digit Span and standard
Digit Span range from .68 to .92 in the four groups. In two of the four
groups (mentally retarded and cerebral-palsied) there were significant
differences between the standard and modified forms, but these differences
were less than a point in both groups. Thus, it appears that an aural-
pointing administrative format can serve as a substitute for the standard
administrative format--aural-oral--when the child has speech difficulties.
The correlations between the WISC modified Block Design and standard
Block Design range from .66 to .82 in the four groups. These correlations
indicate that the scaled scores on the standard and modified forms are
significantly related, although the degree of relationship is somewhat
lower than Is desirable. Interestingly, the highest correlation (.82)
occurred in the cerebral-palsied group.
In all four groups the modified form was significantly more difficult
than the standard form. This would be expected because the child could
not handle the blocks himself, and therefore was deprived of the oppor-
tunity to use trial-and-error procedures in attempting to solve the tasks.
However, in the four groups the smallest mean difference between the two
forms occurred in the cerebral-palsied group (.60 points). Thus, the
high correlation between the standard and modified Block Design forms and
the minimal difference between the two forms in the cerebral-palsied

Settler 63
group indicate that the modified Block Design subtest can serve as asubstitute for the standard Block Design subtest for children with severe
motor disabilities.
The correlations between the WISC modified Coding and standard Codingrange from .47 to .74. These correlations indicate that the scaled scoreson the standard and modified forms are significantly related, although thedegree of relationship is somewhat lower than is desirable. In all fourgroups the modified form was significantly easier than the standard form.The cerebral-palsied group had the largest difference between the twoforms, 3.32 points, which represents a difference of 77%. The smallestabsolute difference was in the mentally retarded group, 1.48 points,which represents a difference of 29%. In the normal group the differencewas 2.30 points, which represents a difference of 17%. In the orthopedi-cally handicapped group the difference was 2.07 points, which representsa difference of 30%.
The modified Coding subtest enabled the cerebral-palsied group toobtain scores which were 77% higher than they obtained on the standardform. However, because the normal group also performed at a higher levelon the modified form, it does not appear likely that the modified form canbe used as a substitute for the standard form using the standard norms.The results, however, do suggest that the modified Coding subtest providesa means of assessing cerebral-palsied children. As a crude approximation,the norms for the standard Coding subtest may be used for the modifiedCoding subtest by subtracting 23% from the child's score. The figure of23% was arrived at by averaging the gains of a group with a mean standardscale score which was close to 7 (orthopedically handicapped) and of agroup with a mean standard scale score which was close to 13. Thus thegain for an average child (a mean of 10) is estimated to 23%, which is theaverage of 30% and 17%. Further research is needed to determine thevalidity of the modified Coding subtest. The present results indicatethat the modified Coding subtest provides minimally reliable scaled scores.
The modifications on the Coding subtest permitted an assessment oflearning efficiency because each row was timed separately. The resultsshowed that only in the normal group was there a significant degree ofimprovement from the second to the third row. In three of the four groups(the exception was the cerebral-palsied) there also was significantimprovement from the first to the second row; this, as we have seen, wasdue simply to the fact that there were fewer symbols in the first row thanin the three remaining rows. It is difficult to account for the failureof the cerebral-palsied group to increase their scores significantly. Theydid increase their mean score from 7.00 on the first row to 7.55 on thesecond row, but the gain was not significant. Timing each of the rowsseparately appears to be a useful method of evaluating learning efficiencyon the Coding subtest.
Another method of evaluating the modified and standard forms of thethree subtests was to evaluate the WISC IQ's estimated from the threesubtests. The results indicated that the standard and modified IQ's arehighly comparable. The range of correlations was from .71 to .84 in thefour groups, while mean differences between the two IQ's ranged from .31

Sattler 64
to 2.60 in the four groups. Only in the cerebral-palsied group was themean difference greater than one point. The reason why the mean differ-ences between the standard and modified IQ's were small was that thehigher scores on the Coding subtest were counterbalanced by the lowerscores on the Block Design subtest. In all four groups, as well, thestandard deviations were similar for the standard and modified WISC IQ's.
A further test of the validity of the modified WISC IQ was to compareit with previous IQ scores or with an estimated IQ based on the Stanford-Binet Vocabulary test. This comparison generally yielded acceptablelevels of concurrent validity. The correlations between the modifiedWISC IQ and the general IQ ranged between .29 to .76. These results aresomewhat surprising if we consider that the general IQ's were based on anassortment of heterogenous tests. Nevertheless, the results point out thatboth the standard and modified short forms of the WISC, composed of theDigit Span, Block Design, and Coding subtests, have acceptable levels ofconcurrent validity.
In the cerebral-palsied group, degree of physical disability wasrelated to both the general IQ and the WISC 1Q. These findings suggestthat the more physically disabled the cerebral-palsied child is, themore likely he is to have a low.IQ. This conclusion, however, is limitedto cerebral-palsied children between 5 and 16 years of age, because asignificant relationship between the two variables was not establishedwith the cerebral-palsied children between 2 and 5 years of age.
The mean general IQ of the cerebral-palsied group was 82.68. Thisestimate is similar to the mean IQ obtained by the younger group. As inthe younger cerebral-palsied group, the children with a spastic conditionobtained IQ's that were not significantly different from those with anonspastic condition. In the orthopedically handicapped group, there alsowas a significant relationship between general IQ and total disabilityrating. Thus, like the cerebral palsied child, the more physicallydisabled the orthopedically handicapped child is, the more likely he isto have a low IQ.
The results for the Memory for Block Designs test turned out to besomewhat disappointing. The main problem was the failure of the test todiscriminate among the normal children. The test was too easy for thesechildren. However, in the mentally retarded, cerebral-palsied, andorthopedically handicapped groups the results were somewhat more encour-aging. Using the general IQ as a criterion, the test had correlationsranging from .35 to .59 (all significant) in the three groups. In allfour groups the Memory for Block Designs test was also shown to be corre-lated significantly with many other tests and subtests. However, thestandard scores for the test, even in the mentally retarded, cerebral-palsied, and orthopedically handicapped groups, are somewhat restricted.Thus, in its present form, the test can only be used as a rough measureof memory ability. The results strongly suggest that a memory for blockdesign test can be a useful addition to the available memory tests, if thetest could be expanded to more items, especially ones with more difficultdesigns. The correlations between the Memory for Block Designs test andthe other memory tests suggest that the test is measuring a differentfacet of memory than the other memory tests that were studied.

Settler 65
Summary
The investigation was designed to evaluate the effects of modifica-tions in test procedures upon the scores obtained by normal, mentallyretarded, and handicapped children. The primary tests studied were the
Stanford-Binet and the WISC. In addition, a new Memory for Block Designstest was investigated. There were two different parts to the investiga-
tion. In the first part, only tests in year-levels II through V of theStanford-Binet were studied. In the second part, six Stanford-Binet tests,primarily memory tests appearing at year-levels IX through XIII, and threeWISC subtests--Digit Span, Block Design, and Coding--were studied. The
modifications were designed so that speech and motor dexterity would notbe required in the child's responses.
In the first part of the investigation, 27 Stanford-Binet tests weremodified. Some modifications were relatively simple, such as asking thechild to point to a stimulus instead of saying the name of the stimulus,while other modifications were extensive, such as constructing multiple-choice cards for each of the Picture Vocabulary items. Many of themodifications introduced a multiple-choice procedure. In most cases, onlya pointing response was required. Not all of the tests could be modified.The "Stringing Beads" and "Paper Folding" tests were not used in the finalform after repeated unsuccessful attempts were made to modify the tests.In the standard version of the Stanford-Binet, 12 tests at year-levels IIthrough V only require a pointing response; therefore, these tests werenot modified.
There were three groups of children who served as subjects in thefirst part. In the normal sample there were 133 children (70 males,63 females) selected according to parental occupation in order to obtaina representative sample. Their birthdays were within two months from thedate of testing. In the mentally retarded group there were 27 children(17 males, 10 females), and in the cerebral-palsied group there were30 children (18 males, 12 females). The mean ages of the children rangedfrom 43.67 months to 55.67 months. Sex was not used as a selectioncriterion. All children were administered the standard and modified formsof the Stanford-Binet in counterbalanced order.
The results of the modifications for the lower level Stanford-Binettests were highly encouraging. Correlations between the standard andmodified forms in the three groups ranged from .83 to .92. In addition,
differences in mean IQ's between the standard and modified IQ's were small,ranging from .16 to 2.93 points. Also of interest was that 13 of the 30cerebral-palsied children were not able to take one or more of the standardtests because of their physical handicaps, while only two of the 30cerebral-palsied children were not able to take a total of three of themodified tests. The results of the modifications suggest that the modifiedStanford-Binet tests can be used as a substitute for the standard testswhen children have speech or motor disabilities which interfere with theirperformance on the standard Stanford-Binet tests at year-levels II through V.
In the second part of the study, Stanford-Binet and WISC subtests werestudied, along with the Memory for Block Designs test. The six Stanford-Binet tests were Memory for Designs I, Memory for Sentences II, Memory for

Sattler 66
Designs II, Plan of Search, Memory for Sentences III, and Copying a BeadChain from Memory. The modification for the six Stanford-Binet testsconsisted of the introduction of a multiple-choice procedure for each ofthe above tests. The modification for the WISC Digit Span subtestconsisted of changing the oral response to a pointing response by havingthe child point to numbers on a card which showed the digits one throughnine. Fur the Block Design subtest, the modification consisted of havingthe examiner construct the design after the child designated a particularblock from a sample showing the various block positions and also designatedthe location un a sheet of paper where the block should be placed. For theCoding subtest, the modification consisted of having a symbol shown undereach number and asking the child to indicate whether the symbol in thebox was correct, that is, whether it matched the symbol for the number thatappeared in the key. In addition, the four rows were timed separately,although the total time for the subtest was the same as that used in thestandard version. Finally, for the Memory for Block Designs test, amultiple-choice procedure was used. Each WISC Block Design Card was shownto the child, after which he was asked to point to the correct design ona card showing four different designs.
There were four groups of children who served as subjects in thesecond part. In the normal sample there were 99 children (44 males,55 females) selected according to parental occupation in order to obtaina representative sample. Their birthdays were uithin one month from thedate of testing. In the mentally retarded group there were 75 children(35 males, 40 females), in the cerebral-palsied group there were 76children (40 males, 36 females), and in the orthopedically handicappedgroup there were 35 children (18 males, 17 females). The mean ages ofthe children ranged from 9.92 years to 11.25 years. Sex was not usedas a selection criterion. All children were administered the standardand modified tests and subtests in counterbalanced order.
The results for the six Stanford-Binet tests were not encouraging.While chi square analyses indicated that the subjects performed similarlyon both the standard and modified forms, correlations between the twoforms, when significant, were low. The multiple-choice procedure led toeasier tests. The results indicate that it is likely to be a difficulttask to devise multiple-choice memory tests that will be of comparabledifficulty to tests that require subjects to respond by rote, particularlyfor children between 5 and 16 years of age.
The results for the three WISC subtests indicate that the modifiedprocedures that were used in the investigation for the Digit Span andBlock Design subtests can be used as alternate procedures for testinghandicapped children. In the four groups, correlations between thestandard and modified subtests ranged from .66 to .92, and all corre-lations were highly significant. Mean differences between the standardand modified subtests in the four groups were less than one scaledscore point for the Digit Span subtest and less than two scaled scorepoints for the Block Design subtest. In contrast, the modified Codingsubtest does not appear to be a feasible substitute for the standardCoding subtest. Although significant correlations were obtained betweenthe standard and modified subtests in the four groups (.47 to .74), in
Sattler 67
the cerebral-palsied group the mean difference between the two forms washigh, 3.32 scaled score points. The modified Coding subtest is an easiersubtest than the standard subtest. The modified subtest, however, haspromise as a test for evaluating handicapped children because it requiresonly a "yes" or "no" response. It also has the potential of providing acrude estimate of learning ability.
The Memory for Block Designs test proved to be too easy for thenormal subjects and also had a limited range of standard scores in thementally retarded group. The range was somewhat more satisfactory in thecerebral-palsied and orthopedically handicapped groups. However, in allfour groups there were significant correlations between the Memory forBlock Designs test and other variables. The test needs to be expanded toinclude more difficult items. It appears to be a promising test and islikely measuring a different facet of memory than memory for design andsentences tests. In its present form, the test can only be used as arough measure of memory ability.
Other interesting findings indicated that the mean IQ's obtained bythe younger cerebral-palsied children were 80.43 (SD = 17.29) on thestandard Stanford-Binet and 83.27 (SD = 19.08) on the modified Stanford-Binet. For the older children, the mean IQ obtained on a variety of testswas 82.68. These estimates are similar to those reported in the literature.However, lower mean IQ's were obtained by the cerebral-palsied children, asestimated from the three WISC subtests: 74.03 (SD = 21.39) on the standardform and 76.63 (SD = 23.22) on the modified form. Similarly, the mean IQ'sof the orthopedically handicapped group were lower on the WISC (84.94, SD =20.73, standard; 84.63, SD = 19.72, modified) than on other tests(89.55, SD = 20.91). In contrast, in the normal and mentally retardedgroups, estimated WISC IQ's were higher than IQ's obtained on other tests.In the normal group, the mean IQ on the standard form was 113.95 (SD = 16.60),113.64 (SD = 16.43) on the modified, and 105.81 (SD = 20.53) on othertests. In the mentally retarded group, the mean IQ on the standard formwas 63.73 (SD = 18.06), 63.62 on the modified form (SD = 17.43), and 61.14(SD = 14.29) on other tests. Correlations between the two forms for theIQ's estimated on the basis of the three subtests ranged from .71 to .84 inthe four groups.
The extensiveness of physical disability was, for the most part, notrelated to IQ scores obtained by the younger cerebral-palsied children onthe Stanford-Binet. However, for the cerebral-palsied children between 5and 16 years of age, degree of physical disability was related to level ofintelligence. The greater the disability, the more likely the child wasto have a lower IQ.

Sattler 68
References
Agassiz, C. D. S. Functional capacity is our ultimate aim. In British
Council for the Welfare of Spastics. London: British Council for
the Welfare of Spastics, 1955. Pp. 29-47.
Allen, R. M. Suggestions for the adaptive administration of intelligencetests for those with cerebral palsy: Part II. Cerebral Palsy Review,
1958, 19, 6-7.
Allen, R. M. Psychological assessment procedures for the cerebral palsied.
In Proceedings of the Postdoctoral Workshop in Psychological Services
for the Cerebral Palsied. Coral Gables, Fla.: University of Miami
Press, 1959. Pp. 21-4.
Allen, R. M. Cerebral palsy. In J. F. Garrett and E. S. Levine (Eds.),Psychological Practices With The Physically Disabled. New York:
Columbia University Press, 1962. Pp. 159-96.
Allen, R. M., & Collins, M. G. Suggestions for the adaptive administrationof intelligence tests for those with cerebral palsy: Part I. CerebralPalsy Review, 1955, 16, 11-14, 25.
Allen, R. M., & Jefferson, T. W. Psychological Evaluation of The Cerebral
Palsied Person. Springfield, Ill.: Charles C. Thomas, 1962.
Arnold, G. F. A technique for measuring the mental ability of the cerebral
palsied. Psychological Service Center Journal, 1951, 3, 171-8.
Berko, M. J. Some factors in the mental evaluation of cerebral palsied
children: Cerebral Palsy, Review, 1953, 14, 6, 11, 15.
Bice, H. V. Psychological examination of the cerebral palsied. Journalof Exceptional Children, 1948, 14, 163-8, 192.
Bice, H. V., & Cruickshank, W. M. The evaluation of intelligence. In
W. M. Cruickshank (Ed.), Cerebral Palsy: Its Individual and Community
Problems. (2nd ed.) Syracuse, N. Y.: Syracuse University Press, 1966.
Pp. 101-34.
Blum, L. H., Burgemeister, B., & Lorge, I. Trends in estimating the mental
maturity of the cerebral palsied child. Journal of Exceptional
Children, 1951, 17, 174-7.
Braen, B. B., & Masling, J. M. Intelligence tests used with special groups
of children. Journal of Exceptional Children, 1959, 26, 42-5.
Burgemeister, B. B., & Blum, L. H. Intellectual evaluation of a group of
cerebral palsied children. Nervous Child, 1949, 8, 177-80.
Cardwell, V..E. The Cerebral Palsied Child and His Care In The Home.New York: Association for the Aid of Crippled Children, 1947.
Cattell, P. Cattell Infant Intelligence Scale. New York: Psychological
Corp., 1960.

Sattler 69
Crowell, D. H., & Crowell, D. C. Intellligence test reliability forcerebral palsied children. Journal of Consulting Psychology, 1954,18, 276.
Cureton, E. E. Mental age equivalents for the Revised Stanford-BinetVocabulary test. Journal of Consulting, Psychology, 1954, 18, 381-383.
Doll, E. A. Intelligence and cerebral palsy. Cerebral Palsy Review, 1954,15, 8-9, 19, 27.
Doll, E. A., Phelps, W. M., & Melchor, R. T. Mental Deficiency Due to BirthInjuries. New York: Macmillan, 1932.
Dunsdon, M. I. The Educability if Cerebral Palsied Children. London:Newness Educational Co., 19L2.
Eisenson, J. Examining, for Aphasia. New York: Psychological Corp., 1954.
Eriksen, B. Intelligence tests in children suffering from cerebral palsy.Acta Paediatrica, Stockholm, 1955, 44 (Monograph Supplement 103),24-6.
Garrett, J. F. Cerebral palsy. In J. F. Garrett (Ed.), Psychological,Aspects of Physical Disability. Washington, D. C.: U.S. GovernmentPrinting Office, 1952. Pp. 60-7.
Graham, E. E., & Shapiro, E. Use of the performance scale of the WechslerIntelligence Scale for Children with the deaf child. Journal ofConsulting Psychology, 1953, 17, 396-8.
Haeussermann, E. Evaluating the developmental level of cerebral palsypreschool children. Journal of Genetic Psychology, 1952, 80, 3-23.
Heilman, A. E. Appraisal of abilities of the cerebral palsied child.American Journal of Mental Deficiency, 1949, 53, 606-9.
Hohman, L. B., & Freedheim, D. K. Further studies on intelligence levelsin cerebral palsied children. American Journal of Physical Medicine,1958, 37, 90-7.
Holt, K. S., & Reynell, J. K. Assessment of Cerebral Palsy,. Vol. II.London: Lloyd-Luke, 1967.
Jewell, B. T., & Wursten, H. Observations on the psychological testing ofcerebral palsied children. American Journal of Mental Deficiency,1952, 56, 630-7.
Katz, E. Success on Stanford-Binet Intelligence Scale test items ofchildren with cerebral palsy as compared with non-handicapped children.Cerebral Palsy Review, 1955, 16, 18-19.
Katz, E. The pointing scale method: A modification of the Stanford-Binetprocedure for use with cerebral palsied children. American Journalof Mental Deficiency, 1956, 60, 838-42.
Sattler 70
Katz, E. The "pointing modification" of the revised Stanford-Binet
Intelligence Scales, Forms L and M, years II through VI: A report
of research in progress. American Journal of Mental Deficiency,
1958, 62, 698-707.
Kaufman, A. An oral digit symbol test. Journal of Clinical Psychology,
1966, 22, 180-3.
Keats, S. Cerebral Palsy. Springfield, Ill.: Charles C. Thomas, 1965.
Kessler, J. W. Psychopathology of Childhood. Englewood Cliffs, N.J.:
Prentice-Hall, 1966.
Klapper, Z. S., & Birch, H. G. The relation of childhood characteristics
to outcome in young adults with cerebral palsy. Developmental
Medicine and Child Neurology, 1966, 4, 645-56.
Kogan, K. L. Repeated psychometric evaluations of preschool children with
cerebral palsy. Pediatrics, 1957, 19, 619-21.
Koppitz, E. M. The visual aural Digit Span test with elementary school
children. Journal of Clinical Psychology, 1970, 26, 349-353.
Lantz, B., & Wolf, R. The Columbia Mental Maturity Scale and the
Stanford-Binet Test with cerebral palsied children. California
Journal of Educational Research, 1956, 7, 183-5.
Leiter, R. G. Leiter International Performance Scale. Chicago: Stoelting,
1952.
Linde, T. Mental evaluation in cerebral palsy. Journal of Rehabilitation,
1964, 30, 17.
Livingston, J. S. An evaluation of a photographically enlarged form of
the revised Stanford-Binet Intelligence Scale for use with the
partially seeing child. (Doctoral dissertation, New York University)
Ann Arbor, Mich.: University Microfilms, 1957. No. 21-712.
Lord, E. E. Children Handicapped with Cerebral Palsy. New York:
Commonwealth Fund, 1937.
Maisel, R. N., Allen, R. M., & Tallarico, R. B. A comparison of the
adaptive and standard administration of the Leiter International
Performance Scale with normal children. Cerebral Palsy Review, 1962,
23, 3-4, 16.
Maurer, K. M. Mental measurement of children handicapped by cerebral
palsy. Physiotherapy Review, 1940, 20, 271-3.
McCarthy, D. A. Measurement of cognitive abilities at the preschool and
early childhood level. In Proceedings of The Invitational Conference
on Testing Problems. Princeton, N.J.: Educational Testing Service,
1958. Pp. 10-25.

Sattler 71
McIntire, J. T. The incidence of feeble-mindedness in the cerebral
palsied. American Association for Mental Deficiency, 1938, 43,
44-50.
Mecham, M. J., Berko, M. J., & Berko, F. G. Speech Therapy in Cerebral
Palsy. Springfield, Ill.: Charles C. Thomas, 1960.
Melnick, A. Psychological aspects of the cerebral palsied child.Journal of the American Osteopathic Association, 1954, 53, 592-4.
Meyer, E., & Simmel, M. The psychological appraisal of children with
neurological defects. Journal of Abnormal and Social Psychology,1947, 42, 193-205.
Michal-Smith, H. Problems encountered in the psychometric examinationof the child with cerebral palsy. Cerebral Pal.sy. Review, 1955, 16,
15-16, 20.
Miller, E., & Rosenfeld, G. B. The psychological evaluation of childrenwith cerebral palsy and its implication in treatment. Journal of
Pediatrics, 1952, 41, 613-21.
Neuhaus, M. Modifications in the administration of the WISC Performancesubtests for children with profound hearing losses. Exceptional
Children, 1967, 33, 573-4.
Newland, T. E. Psychological assessment of exceptional children andyouth. In W. M. Cruickshank (Ed.), Psychology of ExceptionalChildren and Youth. (2nd ed.) Englewood Cliffs, N.J.:Prentice-Hall, 1963. Pp. 53-117.
O'Brien, V., & Hewson, L. Analysis of psychological examinations ofchildren with cerebral palsy. Jcurnal of Child Psychiatry, 1948,
1, 121-39.
Portenier, L. G. Psychological factors in testing and training thecerebral palsied. Physiotherapy Review, 1942, 22, 301-3.
Porteus, S. D. The Porteus Maze Test. New York: Psychological Corp.,1959.
Russ, J. D., & Soboloff, H. R. A Primer of Cerebral Palsy. Springfield,
Ill.: Charles C. Thomas, 1958.
Sattler, J. M.variables1967, 68,
Schonell, F. E.
& Theye, F. Procedural, situational, and interpersonalin individual intelligence testing. Psychological Bulletin,347-60.
Educating Spastic Children. London: Oliver and Boyd, 1956.
Schonell, F. E. Intelligence testing. In R. S. Illingworth (Ed.),Recent Advances in Cerebral Palsy. Boston: Little, Brown, 1958.Pp. 132-45.

Sattler 72
Sievers, D. J. Psychometric problems related to cerebral palsy.Unpublished master's thesis, University of New Mexico, 1950.
Strother, C. R. Evaluating intelligence of children handicapped bycerebral palsy. Crippled Child, 1945, 23, 82-3.
Strother, C. R. Tice psychological appraisal of children with cerebral
palsy. In American Psychological Association, Division of SchoolPsychologists, and National Society for Crippled Children and Adults(Eds.), Psychological Problems of Cerebral Palsy. Chicago: National
Society for Crippled Children and Adults, 1952. Pp. 5-19.
Taylor, E. M. Psychological Appraisal of Children with Cerebral Defects.Cambridge, Mass.: Harvard University Press, 1959.
Tellegen, A., & Briggs, P. F. Old wine in new skins: Grouping Wechsler
subtests into new scales. Journal of Consulting Psychology, 1967,
31, 499-506.
Terman, L. M., & Merrill, M. A. Revised Stanford-Binet Intelligence
Scale. (2nd rev.) Boston: Houghton-Mifflin, 1937.
Tozier, L. L. Modifications of the WISC Block Design subtest. Unpub-lished master's thesis, San Diego State College, 1968.
Wamba, D. E., & Marzolf, S. S. Use of eye movements as a responseindicator in testing the, physically handicapped. Journal of Clinical
tAychology, 1955, 11, 405-7.
Wattron, J. B. A suggested performance test of intelligence. New Outlookfor The Blind, 1956, 50, 115-21.
Wechsler, D. Wechsler Intelligence Scale for Children. New York:
Psychological Corp., 1949.

Satcler 73
Appendix
The project not only directly contributed to an evaluation of theeffects of test modifications but also indirectly contributed to anumber of related investigations and projects that were carried out by
the principal investigator. At the time of the final report, two articleshave been published which are related to the problem of test modifications.These are noted below. The other work of the principal investigator, whichwas also carried on during the project, led to a number of publications and
these, too, are noted below.
Publications Resulting, in part, from Support Provided by the Social
and Rehabilitation Service
1. Sattler, J. M. Racial experimenter effects. In K. S. Miller &
R. M. Dreger (Eds.), Comparative studies of blacks and whitesin the United States. New York: Academic Press, 1973. Pp. 8-32.
2. Sattler, J. M. Intelligence testing of ethnic minority-group andculturally disadvantaged children. In L. Mann and D. Sabatino (Eds.)
The first review of special education. Vol. 2. Philadelphia:
The JSE Press, 1973. Pp. 161-201.
3. Sattler, J. M. Examiners' scoring style, accuracy, ability, andpersonality scores. Journal of Clinical Psychology, 1973, 29,
38 -39.
4. Sattler, J. M. Assessment of children's intelligence. Philadelphia:
Saunders, 1973. (In press)
5. Sattler, J. M., & Anderson, N. E. Peabody Picture Vocabulary Test,Stanford-Binet, and Stanford-Binet Modified with normal andcerebral palsied preschool children. Journal of Special Education,1973, 7. (In press)
6. Sattler, J. M., & Martin, S. Anxious and nonanxious examiner roles on
two WISC subtests, 1222chology, in the Schools, 1971, 4, 347-349.
7. Sattler, J. M., & Ryan, J. J. Scoring agreement on the Stanford-Binet.Journal of Clinical Psychology, 1973, 29, 35-38.
8. Sattler, J. M., & Ryan, J. J. Who should determine the scoring ofWISC Vocabulary responses? Journal of Clinical Psychology, 1973,
29, 50-54.
9. Sattler, J. M., & Tozier, L, L. A review of intelligence testmodifications used with cerebral palsied and other handicappedgroups. Journal of Special Education, 1970, 4, 391-398.