document resume ed 051 556 - eric · document resume. 24. ea 003 550. author harty, harold ... oido...
TRANSCRIPT
ED 051 556
DOCUMENT RESUME
24 EA 003 550
AUTHOR Harty, HaroldTITLE "Perceptions of Consultant Utilization." Statistical
Report. First Draft.INSTITUTION Eastern Regional last. for Education, Syracuse, N.Y.SPONS AGENCY National Center for Educational Research and
Development (DREW /CE), Washington, D.C.BUREAU NO BR-6-1440PUB DATE Jul 70CONTRACT OEC-1-7-061440-3062NOTE 283p.
EDR. PRICE EDRS Price MF-$0.65 HC-$9.87DESCRIPTORS *Adminictrator Attitudes, *Consultants,
*Consultation Programs, *Opinions, Principals,School Statistics, Statistical Surveys, *TeacherAttitudes, Technical Reports
ABSTRACTThis technical report documents teachers',
principals', and consultants' perceptions of the importance ofidentified consultant behaviors when installing the process-promotingprogram, Science--A Process Approach. Teachers' viewpoints arereported within the framework of grade level taught, age, years ofexperience, and degree status. Prindipalso perceptions arecategorized by States and the school types administered. Consultants'viewpoints are analyzed according to the number of teachers with whoma consultant worked, consultanc degree status, academic rank, andteaching specillty. Related documents include EA 003 544, EA 003 545,EA 003 546, and BA 003 549. (Computer printout on pages 238-253 mayreproduce poorly.) (Author/LLB)
0
-.--wene,WO. ri*"kf
EASTERN REGIONAL INSifITUTa FOR EDUCATION
(First Draft)
'0.4)
LeN U.L.
Lf1
DEPARTMENT OF 14EALtH.EDUCATION A WELFARE
r-4
OFFICE OF EOUCATIONTHIS DOCUMENT HAS BEEN REPRO-
tri,
DUCED EXACTLY AS RECEIVED FROMTHE PERSON Ok ORGANIZATION CRIG-
C:)INAT.NG IT. POINTS OF VIEW or OPIN-IONS STATED DO NOT NECES3ARILY
:) REPRESS!, f OFFICIAL OFFICE OF ED:1-
WCATION P:SITION CP POLICY.
STATISTICAL REPORT
"Perceptions of Consultant Utilization"
Part I - Teachers' Perceptions
Part II - Principals' Perceptions
Part III - Consultants' Perceptions
Part IV - Data Summary
Prepared by:
Harold HartyJuly 1970
PREFACE
The intent of this document has been an organizationalattempt to bring together the perceptions of three educator-typesto determine what kinds of consultant service teachers deem mostimportant and feel the greatest need for. The report is basicallydivided into four parts, with three sections devoted to the res-ponses of the given educator-types to queries asked via writtenquestionnaires. A brief fourth segment has been included as ageneral synthesis of the respon3es of those individuals withina given educational setting. An appendix has also been providedfor those who wish to pursue a more thorough or comprehensivestudy.
T;e general format of this report, which may appear ratherunorthodox, was established as a result of Nuch deliberation withthose individuals who will have future use for this document.The emphasir, is on rather than a narration of lofty literarystyle. As a matter of fact, because of economic and time constraintsthe text has not been proofread with the us...al desired degree of scru-tiny. The data have not been presented as a result of stringent andsophisticated statistical treatments for the same above mentionedreasons. Also, tha more complex statistical treatments have beenavoided because of the uncleanness and untidiness of the data, whichcould be "cleaned u:1" with sufficient time, dilionce and perseverance.
To facilitate the utilization of this document, the encyclopedicapproach has been employed. For this purpose a pre-index has beenprovided. The report, itself, is not very readable; and it wouldprobably be very undesirable for one to pursue thin tedious task.Therefore, it is recommended that this compendium be used as areference piece. To quote task sheet number III-H-7 (9/3/69),Nrite a report, construct it so it will "-Je a "gold mine" for allother consultant documents, brochures, essays, etc."
So --- the veins have been uncovered, have fun digging!!!
H.H.
Syracuse, N.Y.4uly, 1970
0
0
TABLE OF CONTENTS
Page
1. Teachers' Perceptions of Consultant Utilization
(Table #1 to Table #108)
2. Principals' Perception of Cousti-tant Utilization 86
(fable #109 to Table #143)
3. Consultants' Perceptions of Consultant Utilization. . . 123
(Table #144 to Table #252)
4. Data Summary 222
(Table #253 tl Table #257)
5. Appendix
(A) Questionnaire for Teachers 235(B) Computer Printout--Teachers 258
(C; Questionnaire for Prin ipals 254(D) Computer Printout -- Principals 257
(E) Questionnaire for Consultants 261(F) Computer Printcut--Consultants 265
-1-
41171,
Code NoL
8
PRE-INDEX
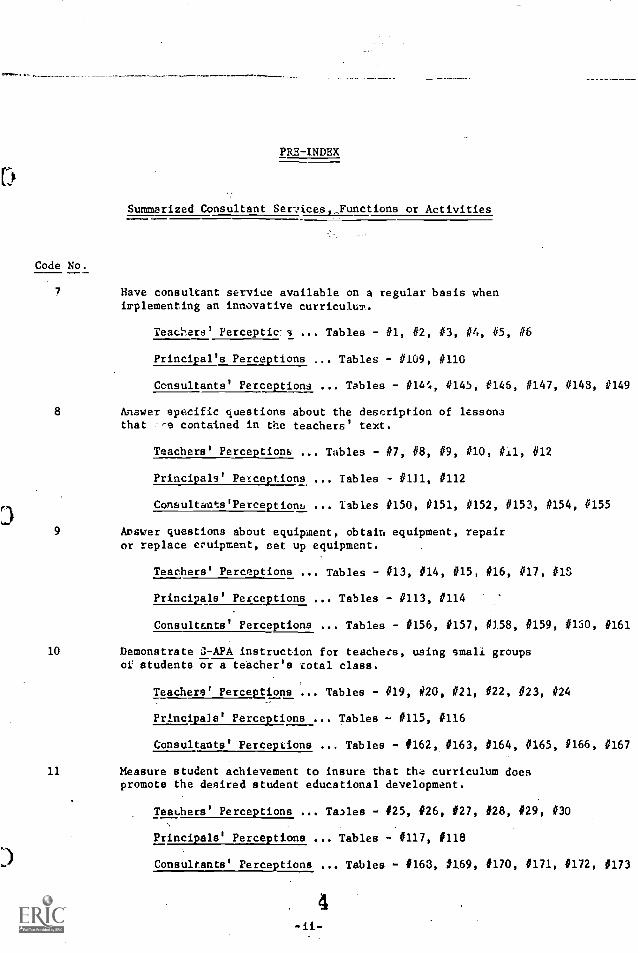
Summarized Consultant Ser-Aces,Junctions or Activities
Have consultant service available on a regular basis whenimplementing an innovative curriculum,
Teacl-srs' Perceptic-s ... Tables - #1, #2, #3, #4, #5, #6
Principal's Perceptions Tables - 0109, #110
Consultants' Perceptions ... Tables - #164, #145, #145, #147, #148, 11149
Answer specific questions about the description of lessonsthat rre contained in the teachers' text.
Teachers' Perceptions ... Tables - #7, #8, #9, #10, #il, #12
Principals' Perceptions ... Tables - #Ill, #112
Consultants'Perceptionu ... Tables #150, #151, #152, 0153, #154, #155
9 Answer questions about equipment, obtain equipment, repairor replace ecuipment, set up equipment.
Teachers' Perceptions ... Tables - #13, #14, #15, #16, #17, #1S
Principals' Perceptions ... Tables - #113, #114
Consultants' Perceptions ... Tables - #156, #157, 0158, #159, #150, #161
10 Demonstrate 3-APA instruct -ion for teachers, using small groupsof students or a teacher's total class.
Teachers' Perceptions ... Tables - #19, 020, #21, #22, #23, #24
Principals' Perceptions Tables 7.. #115, #116
Consultants' Perceptions ... Tables - #162, #163, #164, #165, #166, #167
11 Measure student achievement to insure that tha curriculum doespromote the desired student educational development.
Teachers' Perceptions ... Tales - #25, #26, #27, #28, #29, #30
Principals' Perceptions ... Tables - #117, #118
Consultants' Perceptions ... Tables - #163, #169, #170, #171, #172, #173
4
0
Code No.
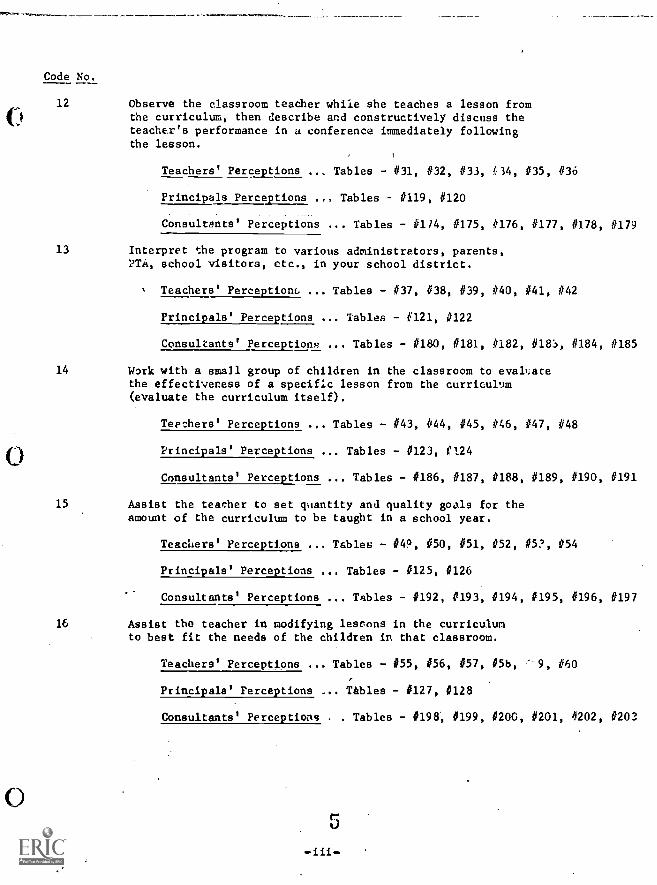
12 Observe the classroom teacher while she teaches a lesson fromthe curriculum, then describe and constructively discuss theteacher's performance in a conference immediately followingthe lesson.
Teachers' Perceptions ... Tables - #31, #32, #33, 134, #35, #315
Principals Perceptions Tables - #119, #120
Consultants' Perceptions ... Tables - #174, #175, #176, #177, #178, #179
13 Interpret the program to various administrators, parents,PTA, school visitors, etc., in your school district.
Teachers' Perceptions ... Tables - #37, #38, #39, #40, #41, #42
Principals' Perceptions ... Tables - 4'121, #122
Consultants' Perceptions ... Tables - #180, #181, #182, #18'..), #184, #185
14 Work with a small group of children in the classroom to evalsatethe effectiveness of a specific lesson from the curriculum(evaluate the curriculum itself).
Teachers' Perceptions ... Tables - 443, #44, #45, #46, #47, #48
Principals' Perceptions ... Tables - #123, #124
Consultants' Perceptions ... Tables - #186, #187, #188, #189, #190, #191
15 Assist the teacher to set quantity and quality goals for theamount of the curriculum to be taught in a school year.
Teachers' Perceptions ... Tables - #50, #51, #52, #5?, #54
Principals' Perceptions Tables - #125, #126
Consultants' Perceptions ... Tables - #192, #193, 0194, #195, #196, #197
16 Assist the teacher in modifying lessons in the curriculumto best fit the needs of the children in that classroom.
Teachers' Perceptions ... Tables - 455, #56, #57, #5b, 9, #60
Principals' Perceptions Tables - #127, #128
Consultants' Perceptions . . Tables - #198, 4199, 0200, #201, 4202, #203
Code 1:o.
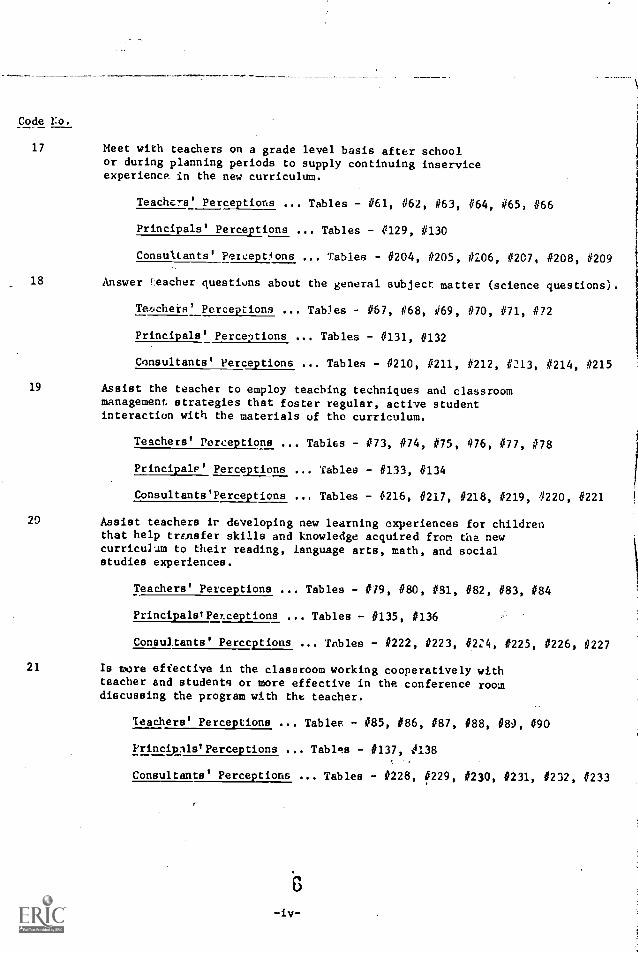
17 Meet with teachers on a grade level basis after schoolor during planning periods to supply continuing inserviceexperience in the new curriculum.
Teachers' Perceptions ... Tables - 061, 062, #63, 064, 1165, #66
Principals' Perceptions ... Tables - 0129, #130
Consultants' Perceptions ... Tables - #204, 11205, 0206, #207, 11208, #209
18 Answer i:eacher questions about the general subject matter (science questions).
Te'achers' Perceptions ... Tables - #67, 1168, 1169, 1170, 1171, 1172
Principals' Perceptions ... Tables #131, #132
Consultants' Perceptions Tables - #210, #211, #212, t213, 11214, #215
19 Assist, the teacher to employ teaching techniques and classroommanagement. strategies that foster regular, active studentinteraction with the materials of the curriculum.
Teachers' Perceptions ... Tables - #73, #74, #75, #76, #77, 1178
Principals' Perceptions .,. Tables - #133, 4134
Consultants'Perceptions ... Tables - #216, 0217, #218, #219, #220, #221
20 Assist teachers it developing new learning experiences for childrenthat help transfer skills and knowledge acquired from the newcurriculum to their reading, language arts, math, and socialstudies experiences.
Teachers' Perceptions ... Tables - #19, 080, #81, #82, 083, 084
PrincipalstPerxeptions Tables - 0135, #136
Consultants' Perceptions ... Tables - #222, #223, #224, #225, 0226, #227
21 Is more effective in the classroom working cooperatively withteacher and students or more effective in the conference roomdiscussing the program with the teacher.
Teachers' Perceptions Tables - 485, 186, 487, 088, 48), 490
PrincipalstPerceptions Tablcts - 4137, ti138
Consultants' Perceptions ... Tables - 4228, 4229, 4280, 4231, 4232, 4233
6
-iv-
Code No.
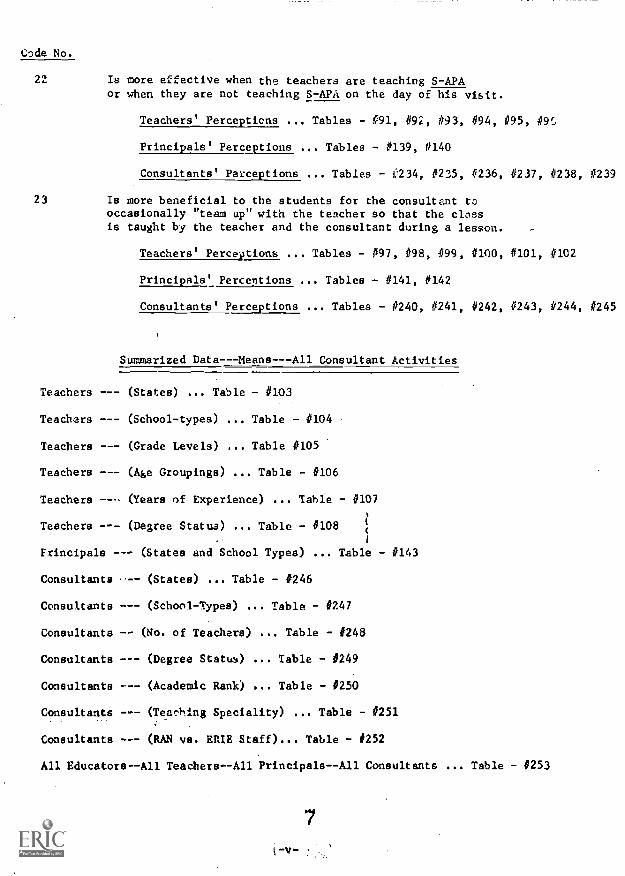
22 more effective when the teachers are teaching S-APAwhen they are not teaching S-APA on the day of his visit.
Teachers' Perceptions ... Tables - #91, #92, #93, #94, #95, #9.f.,
Principals' Perceptions Tables - #139, #140
Consultants' Perceptions ... Tables - 034, #235, #236, #237, #238, #239
23 Is more beneficial to the students for the consultant tcoccasionally "team up" with the teacher so that the classis taught by the teacher and the consultant during a lesson.
Teachers' Perceptions ... Tables - #97, #98, #99, #100, #101, #102
Principals' Percentions ... Tables - #141, #142
Consultants' Perceptions ... Tables - #240, #241, #242, #243, #244, #245
Is
or
Summarized Data---Means---All Consultant Activities
Teachers
Teachers
Teachers
Teachers
Teachers
Teachers
Principals -
Consultants
Consultants
Consultants
Consultants
Consultants
Consultants
Consultants
(States) ... Table - #103
(School-types) Table - #104
(Grade Levels) ... Table #105
(Ate Groupings) ... Table - #106
(Years of Experience) ... Table - #107
(Degree Status) ... Table - #108
- - (States and School Types) ... Table - #143
--- (States) ... Table - #246
- -- (School-Types) ... Table - #247
-- (No. of Teachers) ... Table - #248
- -- (Degree Status) ... Table - #249
--- (Academic Rank) ... Table - #250
- -- (Teaching Speciality) ... Table - #251
--- (RAN vs. ERIE Staff)... Table - $252
All Educators--All Teachers--All Principals--All Consultants
7
-V-
OIDO Table - #253

Teachers -- Principals -- Consultants
Teachers -- Principals -- Consultants
TeachersPrincipalsConsultants
Teachers--Principals--Consultants
0
0
- -- (States - Pa.) ... Table - P254
- -- (States - F.Y.) ... Table - #255
- -- (Pilot Schools) Table - #256
-- (Demo Schools) ... Table - #257
-1-
Part I
"Teachers' Perceptions of Consultant Utilizati7n."

rIPrel Norrakormene
0 During preservice workshops and prior to the actual teaching of
Science--A Process Approach (S-APA) the enclosed document (see:
Appendix) entitled "CJnsultant Utilization Preferences" was adminis-
tere to those in attendance. The workshops were held during August,
1969, at the following sites:
Flinboro State College - (Pennsylvania demo school teachers -kindergarten thru third grade)
Ithaca College
Siena College
- (Pennsylvania and New York State pilotschool teachers - fourth and fifthgrades)
- (New York State demo school teacherskindergarten thru third grade)
The schools, of diverse characteristics, are distributed geographically
throughout the states of New York and Pennsylvania. These elementary
schools are a part of the Eastern Regional Institute for Education's
(ERIE's) network of pilot and demonstration schools. The schools,
their locations, and ERIE code numbers are as follows:
Pilot Schools
CodeNumber School Location
01
02
03
F. S. Banford SchoolCedar Road SchoolCortland Campus School
Canton, N. Y.E. Northport, N. Y.Cortland, N. Y.
04 Maple School Williamsville, N. Y.05 Nathaniel Rochester #3 Rochester, N. Y.06 Gen. E. S. Otis #30 Rochester, N. Y.07 C. C. Ring School Jamestown, N. Y.08 Rosedale School White Plains, N Y.
09 Calvin Smith School Paintid Post, N. Y.10 Ticonderoga School Ticonderoga, N. Y.11 Trumai.sburg School Trumansburg, N. Y.12 Weatmere School Albany, N. Y.17, Blessed Sacrament School Syracuse, N. Y.
-2--

0
0
Pilot Schools cont.
CodeNumber School Location
20 J. Henry Cochran School Williamsport, 2enna.21 Fairview School Fairview, Penna.
22 Wellsboro School Wellsboro, Penna.23 Abraham Lincoln School Pittsburgh, Penna.24 Overlook School Pittsburgh, Penna.
25 Shannock Valley School Rural. Valley, Penna.
26 Washington School Shamokin, Penna.
29 St. Cyril of Alexandria Pittsburgh, Penna.
Demonstration Schools
30 Campbell School Campbell, N. Y.
31 Clinton School Clinton, N. Y.
32 G. Berton Davis School Malone, N. Y.33 Friendship School Friendship, N. Y.34 Gardiners Avenue School Levittown, N. Y.
35 Groton School Groton, N. Y.36 Yancock School Hancock, N. Y.37 John Kennedy School Batavia, N. Y.
38 North Hill School Cheektowaga,' N. Y.
39 Onondaga Hill School Syracuse, N. Y.40 Park View School Kings Park, N. Y.
41 Paulding School Tarrytown, N. Y.
42 Scotchtown Avenue School Goshen, N. Y.43 Sherman-Massey School Watertown, N. Y.44 Sloatsburg School Sloatsburg, N. Y.
45 Stevens School Scotia, N. Y.46 Watkins Glen School Watkins Glen, N. Y.50 Ben Avon School Pittsburgh, Penna.51 Boalsburg School State College, Penna.
52 Brighton Township School Beaver, Penna.53 Hamilton School Carlisle, Penna.54 Hoffman Avenue School Windber, Penna.55 Inglewood School Lansdale, Penna.56 Johnsville School Warminster, Penna.57 Lamar Township School Mill Hall, Penna.58 Lionville School Downingtown, Penna.59 Norwood School Norwood, Penna.60 Roosevelt School Media, Penna.
61 Smethport School Smethport, Penna.
6? Dr. Edward Tracy School Easton, Penna.
63 White Oak School McKeesport, Penna.64 Woodward School Lock Haven, Penna.
11
-3--
( )
0
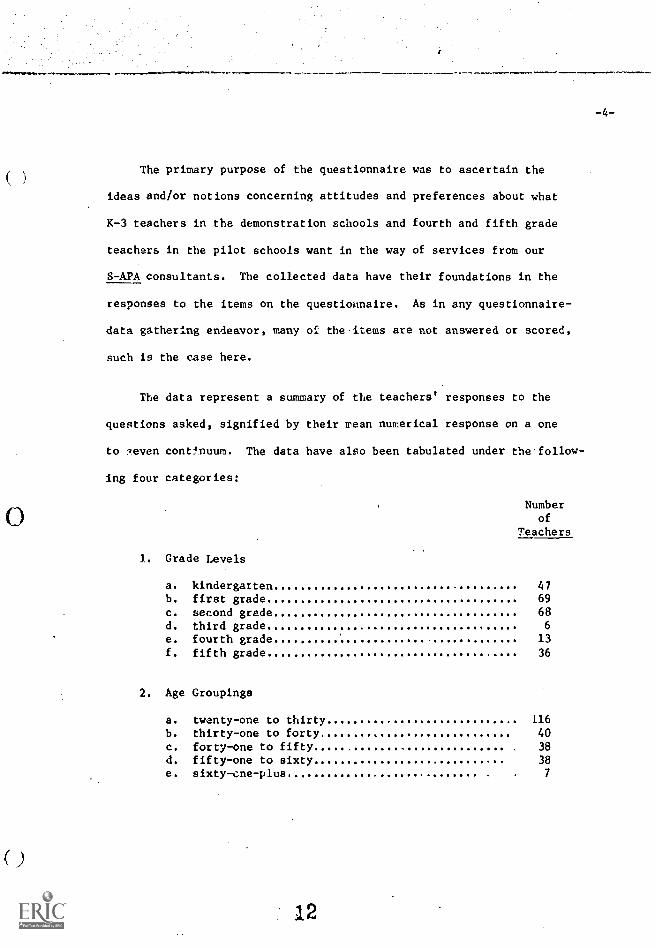
The primary purpose of the questionnaire was to ascertain the
ideas and/or notions concerning attitudes and preferences about what
K-3 teachers in the demonstration schools and fourth and fifth grade
teachers in the pilot schools want in the way of services from our
S-APA consultants. The collected data have their foundations in the
responses to the items on the questionnaire. As in any questionnaire-
data gathering endeavor, many of the items are not answered or scored,
such is the case here.
The data represent a summary of the teachers' responses to the
questions asked, signified by their mean numerical response on a one
to :,even cont5nuum. The data have also been tabulated under the follow-
ing four categories:
Numberof
Teachers
J. Grade Levels
a. kindergarten 47
b. first grade 69
c. second grade 68d. third grade 6
e. fourth grade 13
f. fifth grade 36
2. Age Groupings
a. twenty-one to thirty 116
b. thirty-one to forty 40
c. forty-one to fifty 38
d. fifty-one to sixty 38
e. sixty-cne-plus 7
12
-4-
(_)
,./10114,1,`,17.
Numberof
Teachers
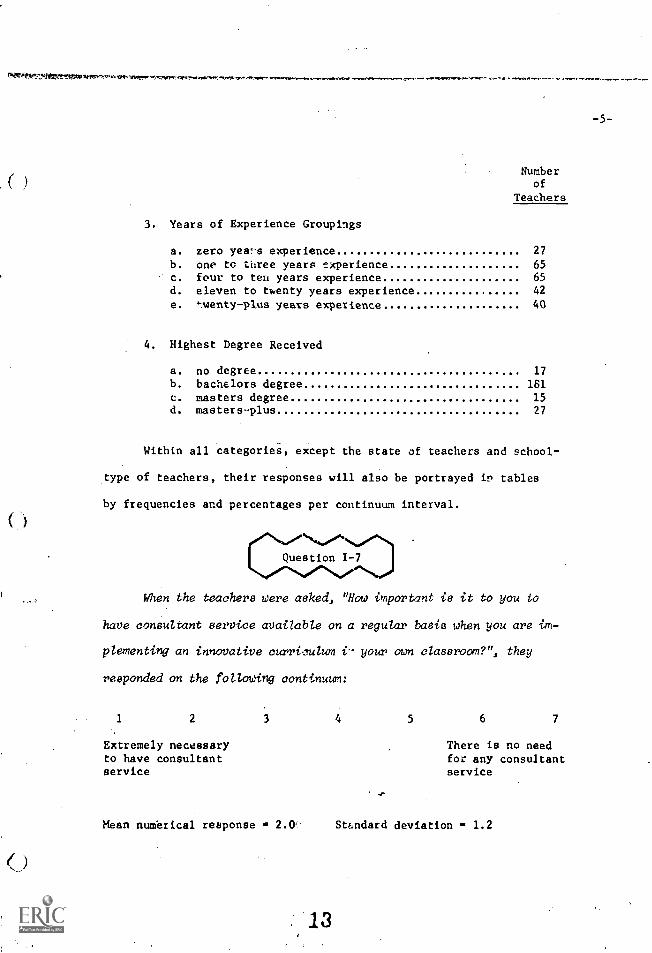
3. Years of Experience Groupings
a. zero yew's experience 27
b. one tc three years experience 65
c. four to ten years experience 65
d. eleven to twenty years experience. ... 42
e. -...wenty-plus years experience 40
4. Highest Degree Received
a. no degree 17
b. bachelors degree 161c. masters degree 15d. masters-plus 27
Within all categories, except the state of teachers and school-
type of teachers, their responses will also be portrayed in tables
by frequencies and percentages per continuum interval.
Question 1-7
When the teachers were asked, "How important is it to you to
have consultant service available on a regular basis when you are im-
plementing an innovative curriculum i- your own classroom?", they
responded on the following continuum:
1 2 3 5 6 7
Extremely necessary There is no needto have consultant for any consultantservice service
Mean numerical response 2.0, Standard deviation 1.2
13
-5-
0
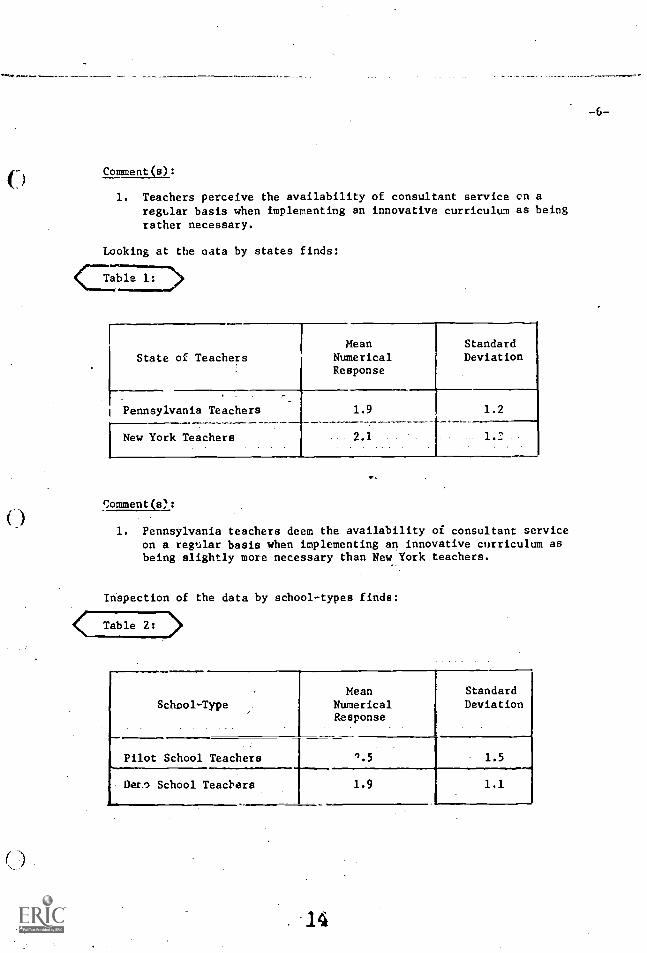
Comment(s):
1. Teachers perceive the availability of consultant service cn aregular basis when implementing an innovative curriculum as beingrather necessary.
Looking at the beta by states finds:
State of Teachers
Pennsylvania Teachers
New York Teachers
Mean StandardNumerical DeviationResponse
1.9 1.2
CommentOIL:
1. Pennsylvania teachers deem the availability of consultant serviceon a regular basis when implementing an innovative curriculum asbeing slightly more necessary than New York teachers.
Inspection of the data by school-types finds:
< Table 2: >
School-TypeMean
NumericalResponse
StandardDeviation
Pilot School Teachers '.5 1.5
Der.o School Teachers 1.9 1.1
14
-6-
Comment(s):
1. Demo school teachers assess the availability of consultantservice on a regular basis when implementing an innovative.curriculum as being more. necessary than pilot school teachers.
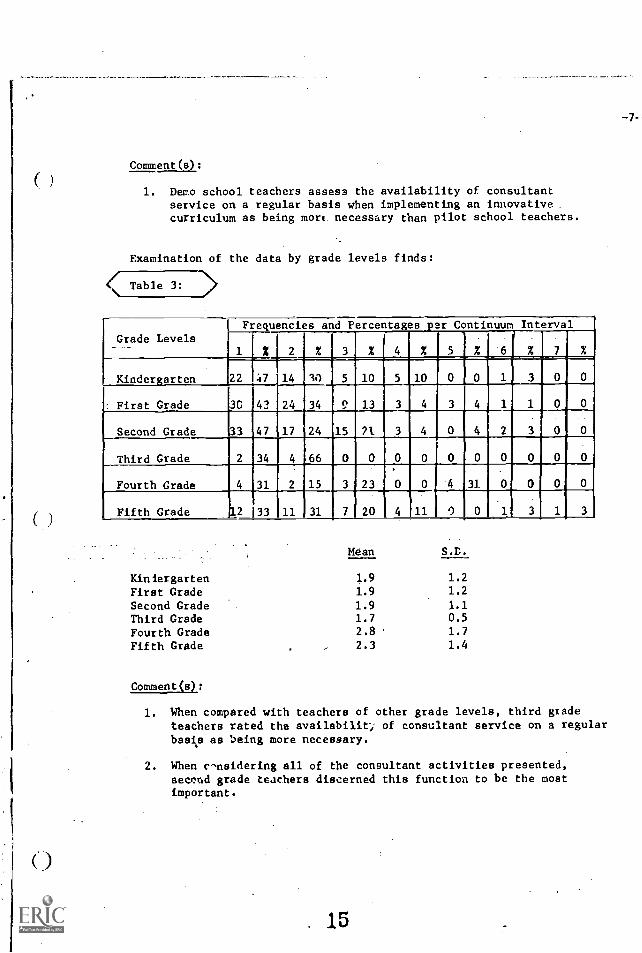
Examination of the data by grade levels finds:
( Table 3: 7>
Grade Levels_._
Frequencies and Percentages per Continuum Interval
1 2 2 % 3 % 4 %
1
5 % 6 % 7 %
Kindergarten 22 47 14 10 5 10 5 10
: First Grade 30 42 24 34 9 13 3 4 3 4 1 1 0 0,
Second Grade 33
2
47
34
17
4
24
66
15
0
21
0
3
0
4
0
0
0
4
0 0 0
1
0 0Third Grade
Fourth Grade 4 31 2 15 3 23 0 0 '4 31
Fifth Grade 12 33 11 31 7 20 4 11 3
Mean S.D.
Kiniergarten 1.9 1.2
First Grade 1.9 1.2
Second Grade 1.9 1.1
Third Grade 1.7 0.5
Fourth Grade 2.8 1.7
Fifth Grade 2.3 1.4
Comment(s):
1. When compared with teachers of other grade levels, third gtadeteachers rated the availability of consultant service on a regularbasis as being more necessary.
2. When c^nsidering all of the consultant activities presented,seccral grade teachers discerned this function to be the mostimportant.
15
-7-
isnrw=rtwitecestVcsrgr..,..`9-7AVV7A1, , e,.
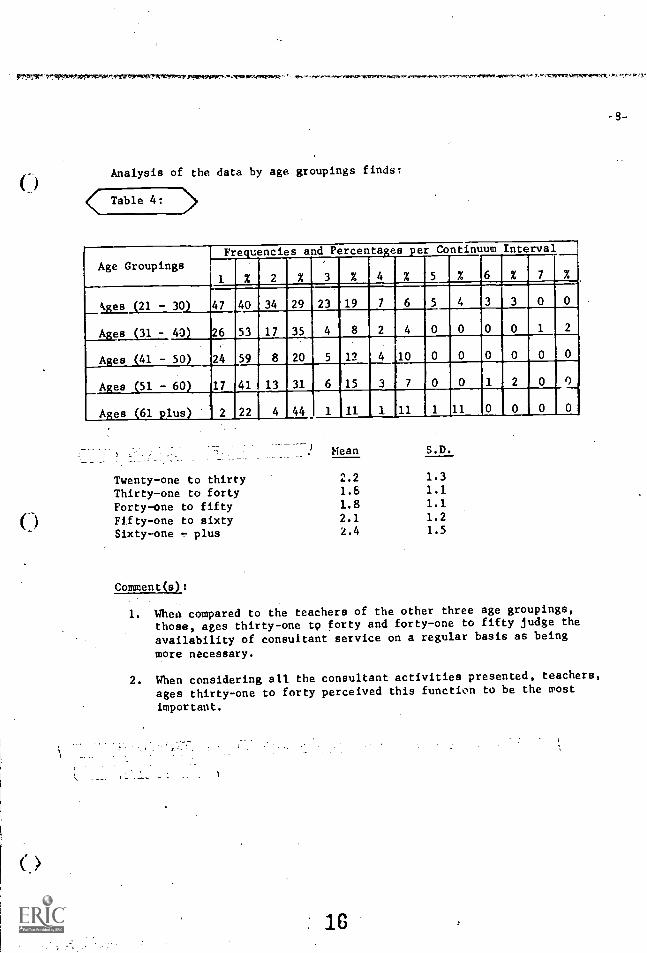
Analysis of the data by age groupings finds:
< Table 4:
Age Groupings
Frequencies and Percentages per Continuum Interval
% 2 % 3 % 4 % 5 % 6 % 7 %
kges.S21 - 30) 47 40 34 29 23 19 7 6 5 4 3 3
Ages (31 - 40) 26 53 17 35 4 8 2 4
Ages (41 - 50) 24 59 8 20 5 12 4 10
Ages __(51 - 6) 17 41 13 31 6115 3 7 0 0 1
Ages (61 plus) 2 22 4 44 1 11 1 11 1 11
Mean S.D.
Twenty-one to thirty 2.2 1.3
Thirty-one to forty 1.6 1.1
Forty-one to fifty 1.8 1.1
Fifty-one to sixty 2.1 1.2
Sixty-one - plus 2.4 1.5
Comment(s):
1. When compared to the teachers of the other three age groupings,
those, ages thirty-one to forty and forty-one to fifty judge the
availability of consultant service on a regular basis as being
more necessary.
2. When considering all the consultant activities presented, teachers,
ages thirty-one to forty perceived this function to be the most
important.
16
-9-
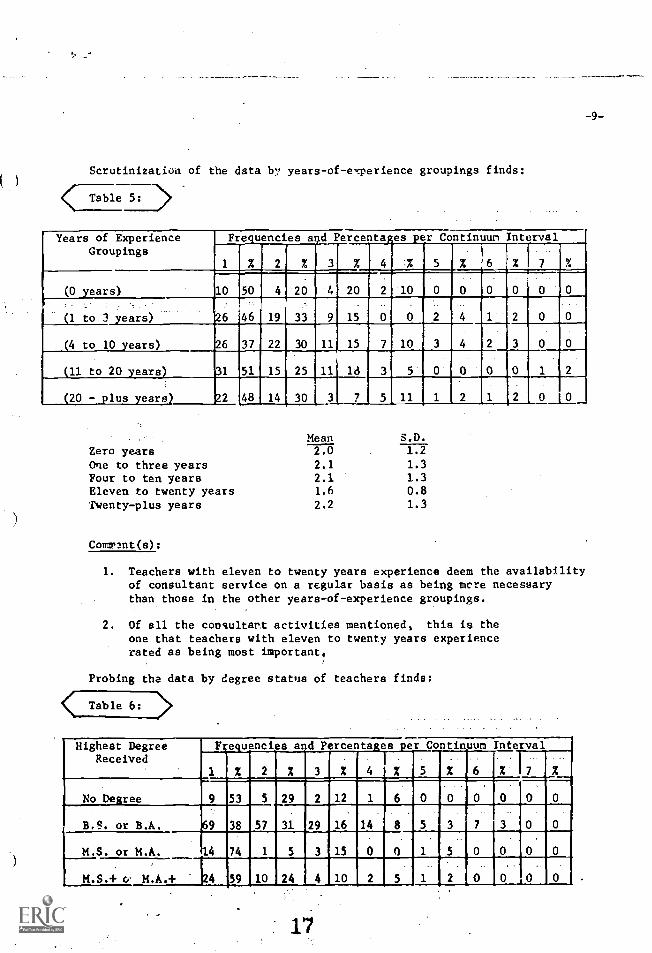
Scrutinization of the data by years -of- experience groupings finds:
< Table 5:
Years of ExperienceGroupings
Fre.uencies and Percenta.es er Continuum Interval
1 % 2 % 3 % 4 % 5 % 6 Er111 .
(0 ears) 11150
--4
19
20
33
4
9
20
15
2 10
0
0
2
0
4
0
1
0 0
0(1 to 3 years)
4 to 10 ears)
11 to 20 ears
e
III
111111M
22 30
25
11
11
15 7 10 3 4 2 3 0 0
18 3 5 0 0 0 0 1 2
20 - .1us ears +2 48 14 30 3 7 5 11 1 2 1 2 0 0
Mean S.D.
Zero years 2.0 1.2
One to three years 2.1 1.3Four to ten years 2.1 1.3Eleven to twenty years 1.6 0.8
Twenty-plus years 2.2 1.3
Commlnt(s):
1. Teachers with eleven to twenty years experience deem the availabilityof consultant service on a regular basis as being mcre necessarythan those in the other years-of-experience groupings.
2. Of all the consultant activities mentioned, this is theone that teachers with eleven to twenty years experiencerated as being most important,
Probing tha data by degree status of teachers finds:
< Table 6: >
Highest DegreeReceived
Frequencies and Percentages per Conti uum Interval
1 %
1
2 X 3 X 4 T X 5 X 6 X 1 7 X
No Degree 9 53 5 29 2 ,12 1 6 0 0 0 0 0 0
B.S. or B.A. ,69 38 57 31 29 16 14 8 5 3 1 3 0 0
M.S. or M.A. 14 74 1 5 3 15 0
._
0 1 5 0 0, 0 0
M.S.+ o. M.A.+ 124 59 10 24 4 10 2 5 1 2 0 0 0 0
17
0
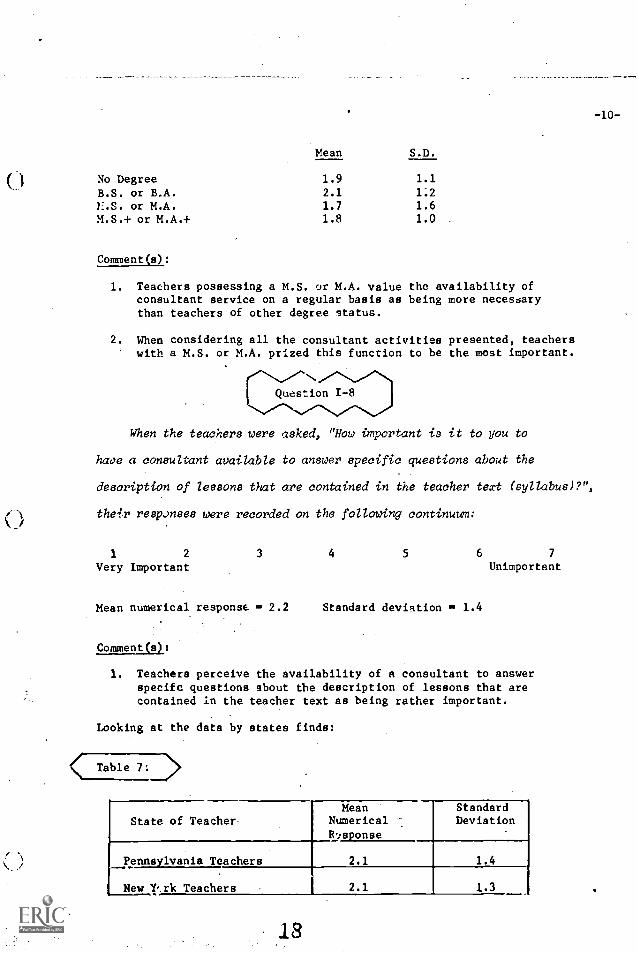
Mean S.D.
No Degree 1.9 1.1
B.S. or B.A. 2.1 1.2
L.S. or M.A. 1.7 1.6M.S.+ or M.A.+ 1.8 1.0
Comment(s):
1. Teachers possessing a M.S. or M.A. value the availability ofconsultant service on a regular basis as being more necessarythan teachers of other degree status.
2. When considering all the consultant activities presented, teacherswith a M.S. or M.A. prized this function to be the most important.
Question 1-8
When the teachers were asked, "How important is it to you to
have a consultant available to answer specific questions about the
description of lessons that are contained in the teacher text (syllabus)?",
their responses were recorded on the following continuwn:
1 2
Very Important3 4 5 6 7
Unimportant
Mean numerical response. = 2.2 Standard deviation 1.4
Comment(s):
1. Teachers perceive the availability of a consultant to answerspecifc questions about the description of lessons that arecontained in the teacher text as being rather important.
Looking at the data by states finds:
Table
State of Teacher.Mean
NumericalR,Isponse
StandardDeviation
Pennsylvania Teachers 2.1 1.4
New Y,,rk Teachers I 2.1 1.3
18
-10-
0
C)
1.710.0., 7,7
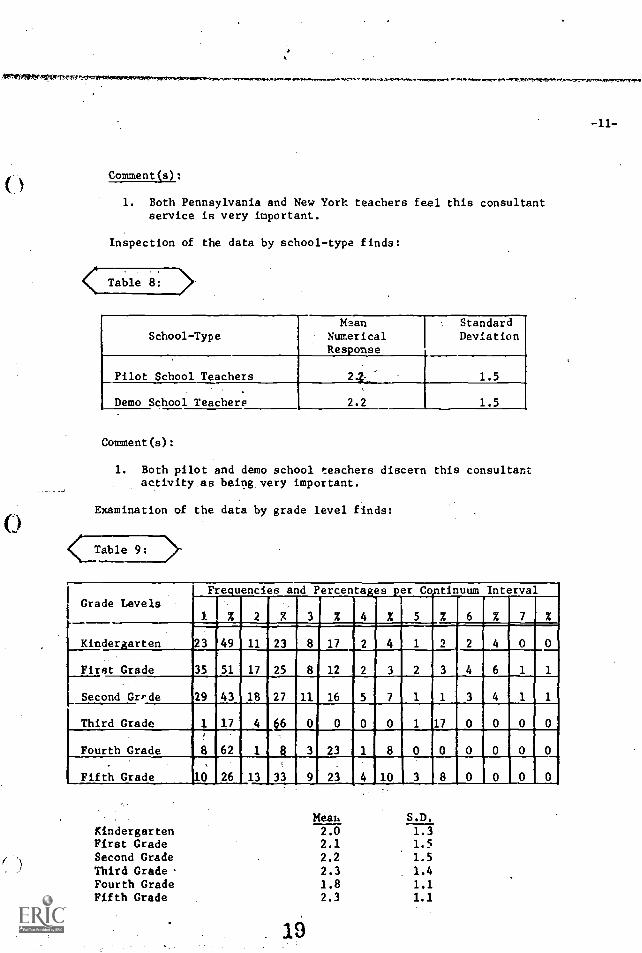
Comment(s):
1. Both Pennsylvania and New York teachers feel this consultantservice is very important.
Inspection of the data by school-type finds:
< Table 8: >
School-TypeMean
NumericalResponse
StandardDeviation
Pilot School Teachers 2.2- 1.5
Demo School Teachers 2.2 1.5
Comment(s):
1. Both pilot and demo school teachers discern this consultantactivity as being, very important.
Examination of the data by grade level finds:
<Table 9:
I Grade LevelsFrequencies and Percentages per Continuum Interval
I 11 X 2 R 3 X 4 Z 5 % 6% 7 2t
Kindergarten 23 49 11 23 8 17 2 4 1 2, 2 4 0 0
First Grade 35 51 17 25 8 12 2 3 2 3 4 6 1 1
Second Grade 29 43 18 27 11 16 5 7 1 1 3 4 1 1
Third Grade 1. 17 4 66 0, 0 0 0 I 17 0 0 0, r
Fourth Grade 8 62 1 8 3 23 1 8 0 0 0 0 0 0
Fifth Grade 10 26 13 33 9 23 14 10 3 8 0 0 0 0,
Meat. S.D.
Kindergarten 2.0 1.3First Grade 2.1 1.5
Second Grade 2.2 1.5
Third Grade 2.3 1.4Fourth Grade 1.8 1.1Fifth Grade 2.3 1.1
19

Comment s):
1. Fourth grade teachers evaluate this function more importantthan teachers, of tie other grade levels.
2. When considering all the consultant activities presented,fourth grade teachers deemed this sarvice to be the mostimportant.
Analysis of the data by age groupings finds:
< Table 10: >
Age GroupingsFrequencies and Percentages per Continuum Interval
1 . 2 I 3 % 4 % 5 % 6 % 7
es 21-30 40 34 39 33 22 18 7 6
Ages 131-40) 24 47 9 18 7 14 4 8 3
Ages (41-50) 23 56 10 24 5 12
Ages (51-60) 17 46 9 24 5 14 2 5 2 5 1 3 1
Ages (61 plus) 7 78 0 0 2 22
Mean S.D.
Twenty-one to thirty 2.3 1774.
Thirty-one to forty 2.2 1.6
Forty-one to fifty 1.6 1.1Fifty-ore to sixty 1.9 1.2
Sixty-one - plus 1.7 1.0
Comment(s):
1. Teachers, ages forty-one to fifty, judgeto be more important than teachers withingroupings.
2. Of all the consultant functions mentionedteachers, ages forty-one to fifty, rattd
20
this consultant activitythe other four age
, this is the one thatas being most important.
-12-
r
-13-
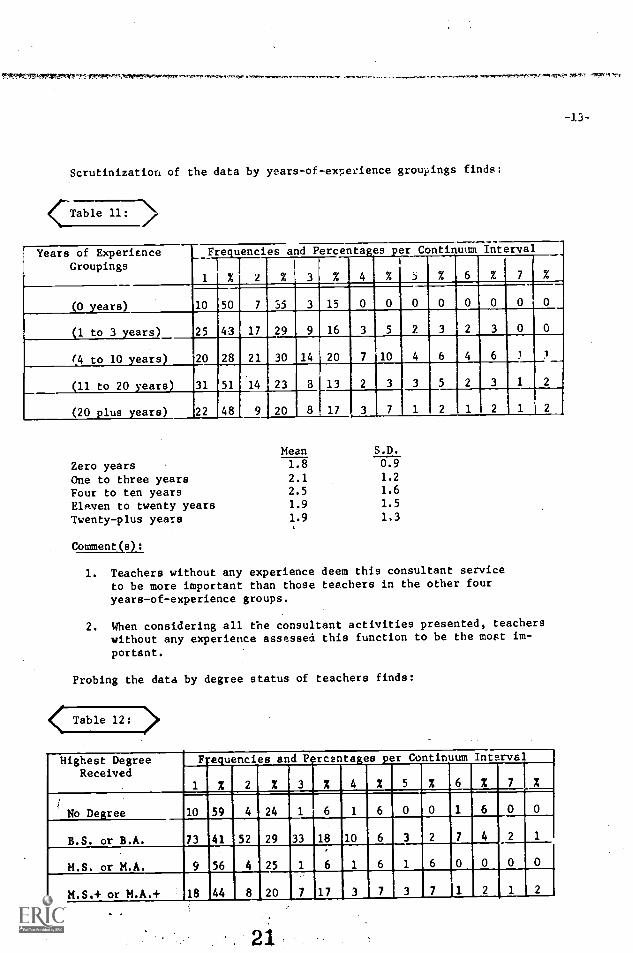
Scrutinization of the data by years-of-experience groupings finds:
cr7,1773.7>Years of Experience
Groupings
Frequencies and Percentages per Continuum Interval 1
1 % 2% 3 % 4 % % 6 % 7
(0 years) 10 50 7 35 3 15 0 0 0 0 0 0 0 0
(1 to 3 years) 25 43 17 29 9 16 3 5 2 3 2 3 0 0
(4 to 10 years) 20 28 21 30 14 20 7 10
(11 to 20 years) 31 51 14 23 8 13 2 3
(20 plus years) 22 48 9 20 8 17 3 7
Mean S.D.
Zero years 1.8 0.9
One to three years 2.1 1.2
Four to ten years 2.5 1.6
ElAven to twenty years 1.9 1.5
Twenty-plus years 1.9 1,3
Comment(eli
1. Teachers without any experience deem this consultant serviceto be more important than those teachers in the other four
years-of-experience groups.
2. When considering all the consultant activities presented, teacherswithout any experience assessed this function to be the most im-
portant.
Probing the data by degree status of teachers finds:
< Table 12: >
Highest DegreeReceived
F.:equencies and P rcanta es per Continuum Int-) arval
1 2 2 3 2 4 2 5 % 6 2 7 %
+
No Degree 10 59 4 24 1 6 1 6 0 0 1 6 0 0
B.S. or B.A. 73 41 52 29 33 18 10 6 3 2 7 4 2
M.S. or M.A. 9 56 4 25 1 6 1 6 1 6 0 0 0 0
M.S.+ or M.A.+ 18 44 8 20 7 17 3 7 3 7 1 2 1 2
21
1k- JIMS 4.0,441Vri P....,
-14-
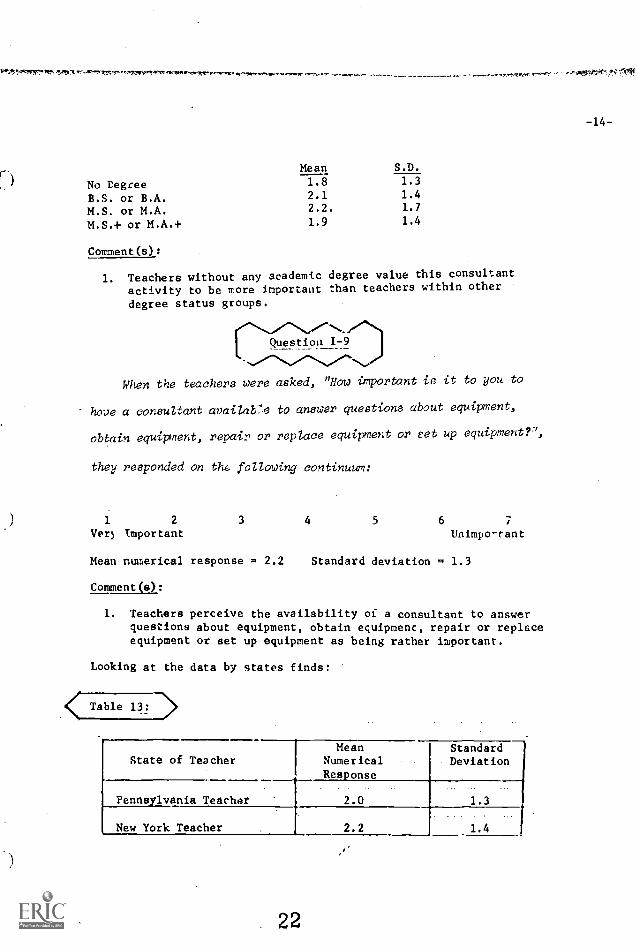
Mean S.D.
No Degree 1.8 1.3
B.S. or B.A. 2.1 1.4
M.S. or M.A. 2.2. 1.7
M.S.+ or M.A.+ 1.9 1.4
Comment(s):
1. Teachers without any academic degree value this consultant
activity to be more important than teachers within other
degree status groups.
Question 179
When the teachers were asked, "How important is it to you to
hope a consultant availare to answer questions about equipment,
obtain equipment, repair or replace equipment or eet up equipment ?',
they responded on the following continuum:
1 2
Yen Important3 4 5 6 7
Unimportant
Mean numerical response = 2.2 Standard deviation = 1.3
Comment(s):
1. Teachers perceive the availability of a consultant to answerquestions about equipment, obtain equipment, repair or replaceequipment or set up equipment as being rather important.
Looking at the data by states finds:
<Is Table 13: -2>
State of TeacherMean
NumericalResponse
2.0
StandardDeviation
1.3Pennsylvania Teacher
New York Teacher 2.2 1.4
22
-15-
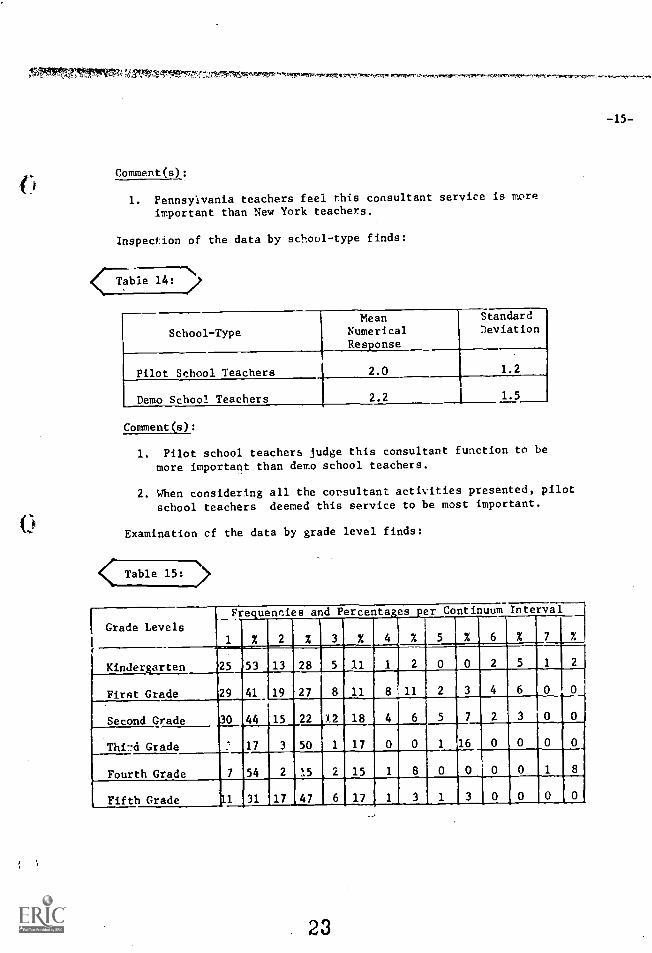
Comment(s):
1. Pennsylvania teachers feel this consultant service is moreimportant than New York teachers.
Inspection of the data by school-type finds:
Table 14: 1
School-Type
MeanNumericalResponse
2.0
StandardDeviation
1.2Pilot School Teachers
Demo School Teachers 2.2 1.5
Comment(s):
1. Pilot school teachers judge this consultant function to be
more important than demo school teachers.
2. When considering all the consultant activities presented, pilot
school teachers deemed this service to be most important.
Examination cf the data by grade level finds:
Table 15:
Frequencies and Percentages per Continuum rnterval
Grade Levels% 2 % 3 % 4 % 5 % 6 % %
Kindergarten. 25 53 13 28 5 11 2
First Grade 29 41 19 27 8 11 8 11 2 3 4 6 0 0
Second Grade 30 44 15 22r
12 18 4 6 5 7 2 3 0 0
Thi:xl Grade ' 17 3 50 1 17 0 0 1 16 0 0 0 0
Fourth Grade 7 54 2 15 2 15 1 8 0 0
Fifth Grade 71 31 17 47 6 17
23
-.ern
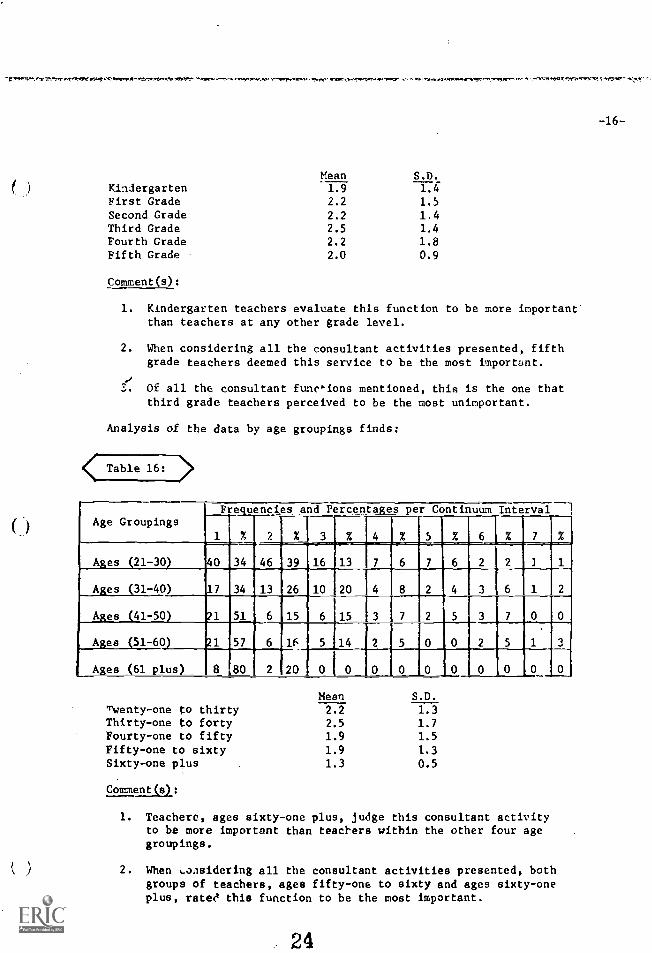
-16-
Mean S.D.
Kindergarten 1.9 1.4First Grade 2.2 1.5Second Grade 2.2 1.4Third Grade 2.5 1.4Fourth Grade 2.2 1.8Fifth Grade 2.0 0.9
Comment(s):
1. Kindergarten teachers evaluate this function to be more important'than teachers at any other grade level.
2. When considering all the consultant activities presented, fifthgrade teachers deemed this service to be the most important.
3. Or all the consultant func,ions mentioned, this is the one thatthird grade teachers perceived to be the most unimportant.
Analysis of the data by age groupings finds:
Table 16: >
Age GroupingsFrequencies
2
and Percentages per Continuum Interval-1
% 3 % 4 % 5 % 6 %
Ages (21-30) 11134 46 39 16 13 7 6 7 6 2 2
Ages (31-40) 17 34 13 26 10 20
Ages (41-50) 1 51 6 15 6 15 3 7 2 5 3 7 0 0
Ages (51-60 1 57 6 16 5 14 2 5 0 0 2 5 1 3
Ages_161 plus)_ 8 ,80 2 20 0
Mean S.D.
Twenty-one to thirty 2.2 1.3Thirty-one to forty 2.5 1.7Fourty-one to fifty 1.9 1.5
Fifty-one to sixty 1.9 1.3Sixty-one plus 1.3 0.5
Commentls):
1. Teacherc, ages sixty-one plus, judge this consultant activityto be more important than teachers within the other four agegroupings.
2. When Loasidering all the consultant activities presented, bothgroups of teachers, ages fifty-one to sixty and ages sixty-oneplus, rated this function to be the most important.
24
g wW,www,,WWW,WWWtgr, P-7,11r..
-17-
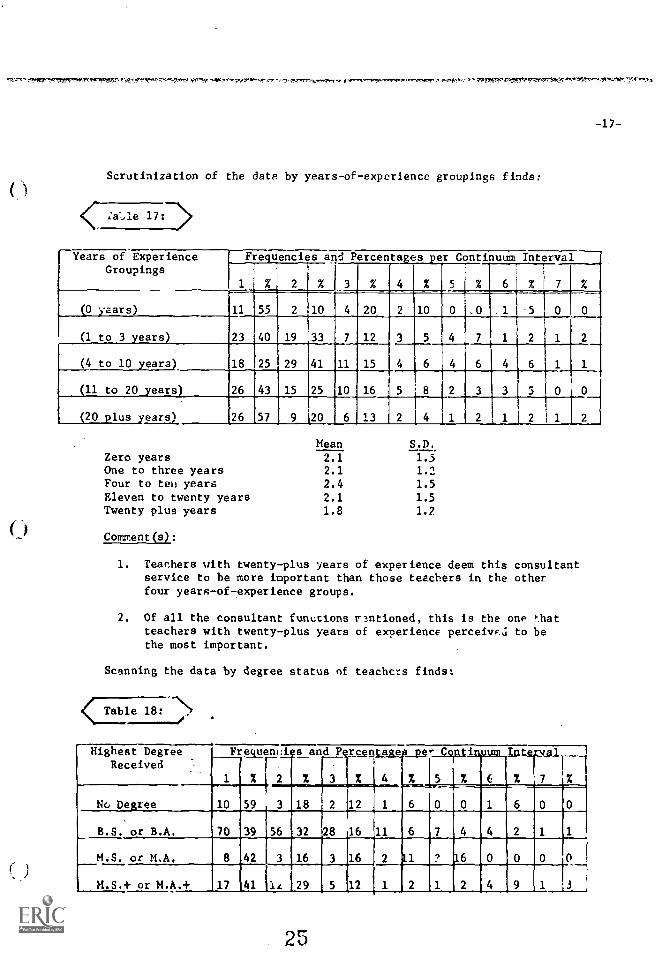
Scrutinization of the data by years-of-experience groupings finds:
<(: 2.3',1e 17 :-D>
Years of ExperienceGroupings
Frequencies and Percentages per Continuum Interval
1
1
%'
i
2 % 3 % 4 % 5 % 6 % 7 %
(0 years) 11 55 2 10 4 20 2 10 0 . . 1 5 0 0
(1 to 3 years) 23 40 19 33 7 12
(4 to 10 yearn) 18 25 29 41 11 15 4 6
(11 to 20 years) 26 43 15 25 10 16 5 8
(20 plus yearsN 26 57 9 20 6 13 2 4 11 2 1 2 1 2
Mean S.D.
Zero years 2.1 1.5One to three years 2.1 1.2Four to teu years 2.4 1.5
Eleven to twenty years 2.1 1.5
Twenty plus years 1.8 1.2
Comment(s):
1. Teachers with twenty-plus years of experience deem this consultantservice to he more important than those teachers in the otherfour years-of-experience groups.
2. Of all the consultant furwcions rantioned, this is the one thatteachers with twenty-plus years of experience perceive,; to bethe most important.
Scanning the data by degree status of teachers finds:
< Table 18: >
Highest DegreeReceived
Frequencies and Percentage _pgr Coptimutttn_latenzall
1 % 2 2 3 % 4 % 5 % 6 2 7 I%
No Degree 10 59 3 18 2 12 1 6 0 0 1 6 0 0
B.S. or B.A. 70 39 56 32 28 16 11 6 7 ,4 4 2 1 1
M,S. or M.A. 8 ,42 3 16 3 16 2 Al ,16 0 0 0 0......
M.S.+ or M.A.+ 17 41 is 29 5 12
.?
1 2 1 2 4 9 1 3
Iry
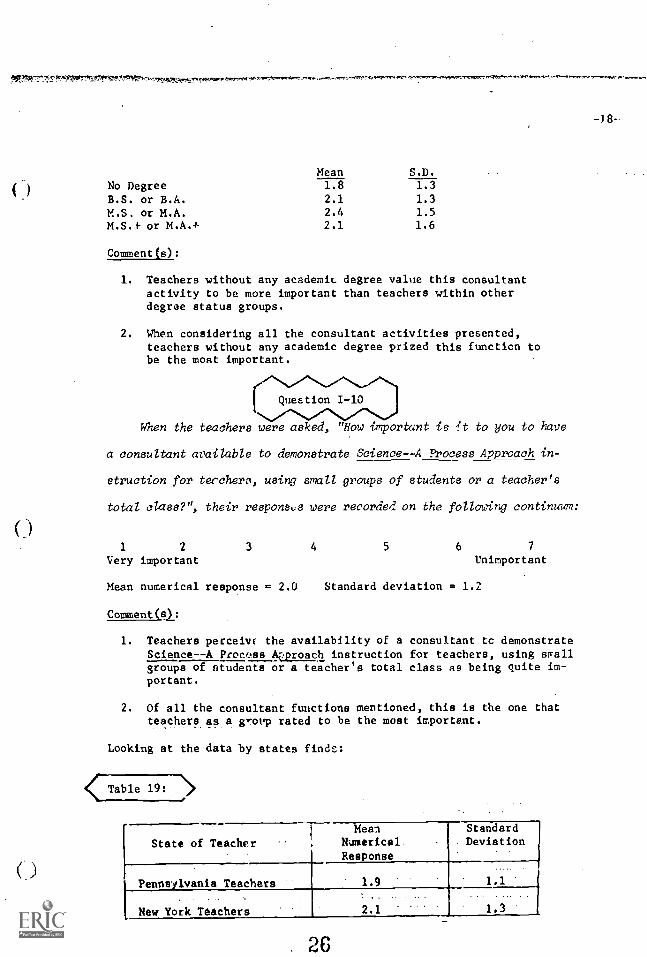
)No DegreeB.S. or B.A.M.S. or M.A.M.S.+ or M.A.+
Comment(s):
Mean S.D.
1.82.1
2.4
2.1
1.3
1.3
1.51.6
0
1. Teachers without any academic degree value this consultantactivity to be more important than teachers within otherdegree status groups.
2. When considering all the consultant activities presented,teachers without any academic degree prized this function tobe the most important.
rQuestion I-10
When the teachers were asked, "How important is it to you to have
a consultant available to demonstrate Science--A Process Approach in-
struction for terchera, using &matt groups of students or a teacher's
total class?", their respons,s were recorded on the fatovng continuum:
1 2 3 4 5 6 7
Very important Unimportant
Mean numerical response = 2.0 Standard deviation = 1.2
Comment(s):
1. Teachers perceive the availability of a consultant tc demonstrateScience--A Prou:ss Approach instruction for teachers, using sirengroups of students or a teacher's total class as being quite im-portant.
2. Of all the consultant functions mentioned, this is the one thatteachers as a group rated to be the most important.
Looking at the data by states finds:
State of Teacher
MeanNumericalResponse
StandardDeviation
Pennsylvania Teachers 1.9 1.1
New York Teachers 2.1
._ .
1.3
2E
-18-
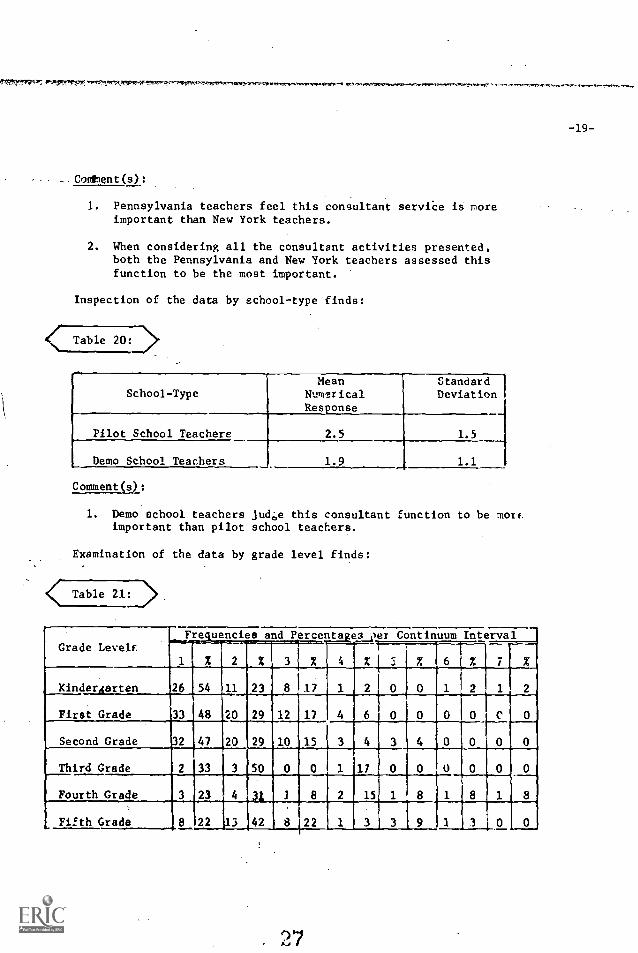
Codhent(s):
-19-
1. Pennsylvania teachers feel this consultant service is moreimportant than New York teachers.
2. When considering all the consultant activities presented,both the Pennsylvania and New York teachers assessed thisfunction to be the most important.
Inspection of the data by school-type finds:
Table 20: >
School-TypeMean
NumericalResonse
StandardDeviation
Pilot School Teachers 2.5 1.5
Demo School Teachers 1.9 1.1
Comment (j:
1. Demo school teachers jud,;,e this consultant function to be MOTEimportant than pilot school teachers.
Examination of the data by grade level finds:
Table 211.4>
Grade LevelsFre uencies and Percents easier Continuum Interval
1 X 2 2 3 % 4
1
X - % 6 X 7 X
Kindergarten 26 54 11 23 8 17 1 2 0 0 1 2 1 2
First Grade 33 48 20 29 12 17 4 6 0 0 0 0 C 0
Second Grade 32 47 20 29 10 15 3 4 3 4
Third Grade 2 33 3 50 0 0 1 17 0 0 U 0 0 0
Fourth Grade 3 23 4 31 1 8 2 15 1 8 1 8 1 8
Fifth Grade 8 22 15 42 8 22 1 3 3 9 1 3 0 0
. 27
TIN
Mean S.D.
) Kindergarten J.9 1.3First Grade 1.8 0.9Second. Grade 1.9 1.1
Third. Grade 2.0 1.1Fourth Grade 3.1 1.9Fifth Grade 2.4 1.3
Comment(s):
1. First grade teachers evaluate this function to be more importantthan teachers at any other grade level.
2. Of all the consultant functions mentioned, this is the one thatfirst grade teachers perceived to be the most important.
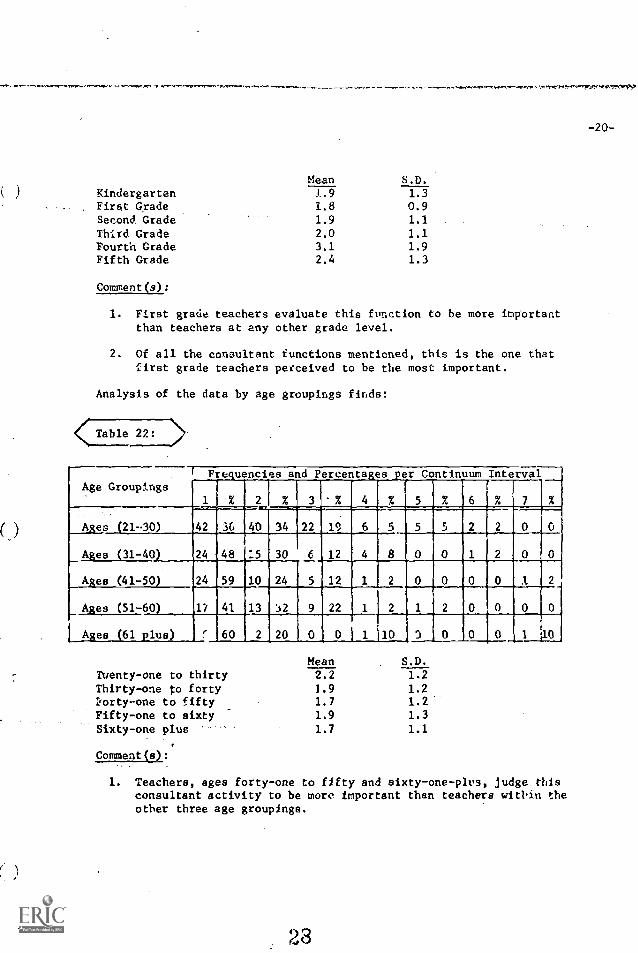
Analysis of the data by age groupings finds:
Age GroupingsFrequencies and Percentages per Continuum Interval
1 % % 3i
% 4 % 5 %i
6 % 7 %
A:es (21-30) 42 36 40 34 22 19 6 5 5 5 2 2 0 0
Ares 31-40) 24 48 :5 30 6 12 4 8 0 0 1 2 0
A:es (41-50 24 59 10 24 5 12 1 0 1
Ages (51-60) 17 41 13 :12 9 22 1 2
.
1 2 0 0 0
Ages (61 plus) 60 2 20 0 0 1 10 D 0 0 0 1 10
Mean S.D.
Twenty-one to thirty 2.2 1.2Thirty-one to forty 1.9 1.21(orty-one to fifty 1.7 1.2Fifty-one to sixty 1.9 1.3Sixty-one plus 1.7 1.1
Comment(s):
1. Teachers, ages forty-one to fifty and sixty one -plus, judge thisconsultant activity to be more important than teachers within theother three age groupings.
23
-20-
0
trnmylre:+r",.:
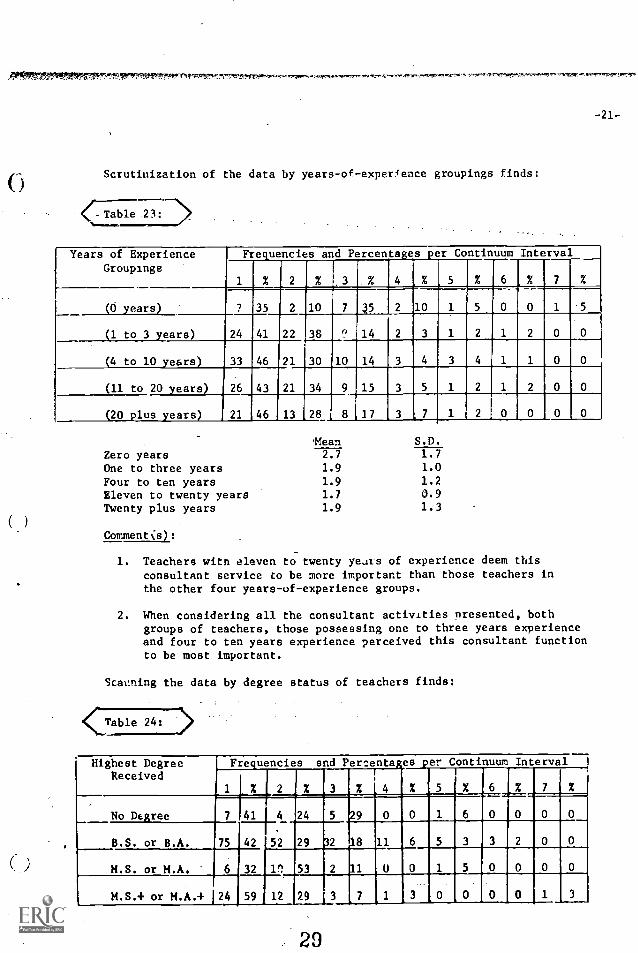
Scrutiuization of the data by years -of- experience groupings finds:
-21-
Years of ExperienceGroupings
Frequencies and Percentages per Continuum Interval
1 % 2 % ,3 % 4 X 5 % 6 % 7 %
(0 years) 7 35 2 10 7 35 2 ,10 1 5 0 0 1 -5
(1 to 3 years) 24 41 22 38 14 2 3 1 2 1 2 0 0
(4 to 10 years) 33 46 21 30 10 14 3 4 3 4 1 1 0 0
(11 to 20 years) 26
21
43
46
21 34
13 ,28
9
8
15
]7
3
3
5
7
1
1
2
2
1
0
2
0
0
0
0
0(20 plus years)
Zero yearsOne to three yearsFour to ten yearsEleven to twenty yearsTwenty plus years
Comments):
Mean2.7
1.9
1.9
1.7
1.9
S.D.
1.71.0
1.20.91.3
1. Teachers with eleven to twenty years of experience deem thisconsultant service to be more important than those teachers inthe other four years-uf-experience groups.
2. When considering all the consultant activities presented, bothgroups of teachers, those possessing one to three years experienceand four to ten years experience perceived this consultant functionto be most important.
Scanning the data by degree status of teachers finds:
(Table 24: >
Highest DegreeReceived
No De
Frequencies and Percents
1 X 2 X 3 %
9
32 8
7
B.S. or B.A
41 4
75 142 52
24
29
es per. Continuum Interval
4 % 5 X 6-
7 %
0
11
6 0 0
0
H.S. or M.A. 6 32 11 53
M.S.+ or M.A.+ L24 59 12 29
29
No DegreeB.S. or B.A.M.S. or M.A.M.S.+ or M.A.+
Comment(s):
Mean2.S
1.91.7
1. Teachers possessing a M.S.+ or M.A.+ value this consultantactivity to be more important than teachers within otherdegree status groups.
2. Of all the consultant functions mentioned, this is the one thatteachers with a B.S. or B.A.'only rated as being the mostimportant.
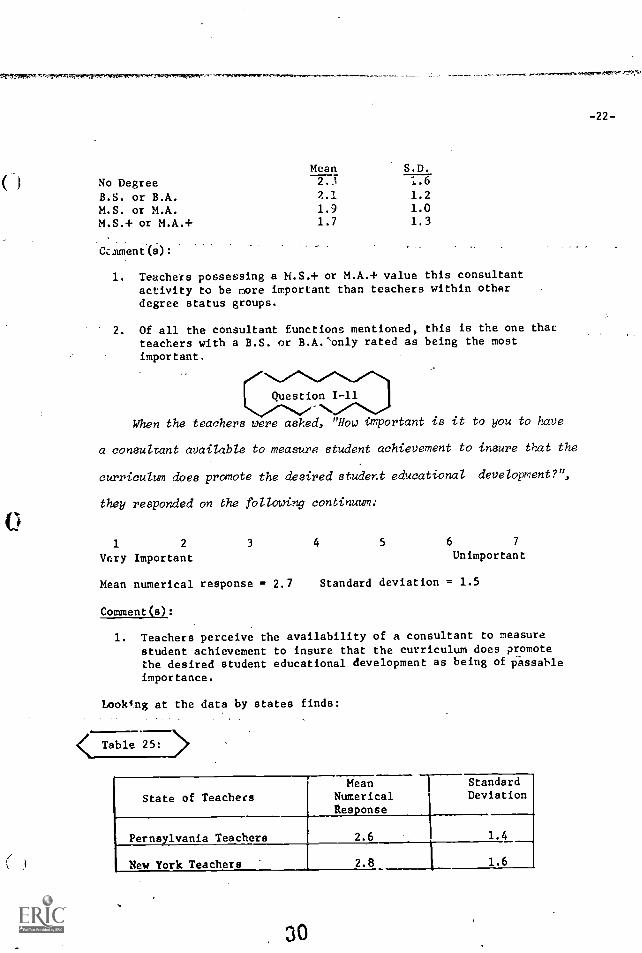
Question I-11"When the teachers were asked, "How important is it to you to have
a consultant available to measure, student achievement to insure that the
curriculum does promote the desired student educational development?",
they responded on the foiiowing continuum:
1 2
Very Important
3 4 5 6 7
Unimportant
Mean numerical response 2.7 Standard deviation = 1.5
Comment(s):
1. Teachers perceive the availability of a consultant to measurestudent achievement to insure that the curriculum does promotethe desired student educational development as being of passable
importance.
Looking at the data by states finds:
(-Table >
State of Teachers
Pernsylvanis Teachers
Mean T-- StandardNumerical DeviationResponse
2.6 1.4
New York Teachers 2.8 t 1.6
a0
-22-
-23-
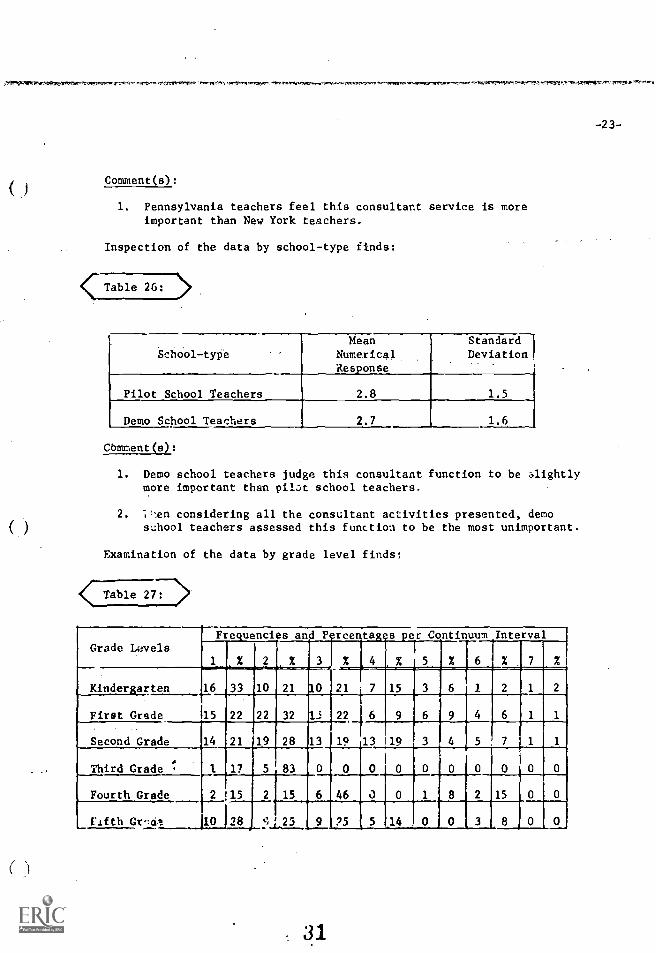
Comment(s):
1. Pennsylvania teachers feel this consultant service is moreimportant than New York teachers.
Inspection of the data by school-type finds:
Table 26: >
. .School -type
MeanNumericalResponse
2.8
StandardDeviation
1.5Pilot School Teachers
Demo School Teachers 2.7 1.6
COmmentkl:
1. Demo school teachers judge this consultant function to be slightlymore important than pil3c school teachers.
2. Hen considering all the consultant activities presented, demoschool teachers assessed this function to be the most unimportant.
Examination of the data by grade level finds:
< Table 27 T-->
Grade LorelsFrequencigs and Perce tages per Continuum Interval
% 2 % 3 % 4 % 5 % 6 % 7 %
Kinder:arten 16 33 10 21 10 21 7 15
First Grade 115 22 22 32 13 22 6 9 6 9 4
Second Grade 14 21 19 28 13 19 13 19 3 4 5 7
Third Grade : 1 17 5 83 0 0 0 0 0 0 0 0
Fourth Grade 2 .15 2 15 6 46 a 0 1 8 2 15
fifth Gr-as 10 28 `)1,25
_
9 :)5 5 14 0 0 3, 8
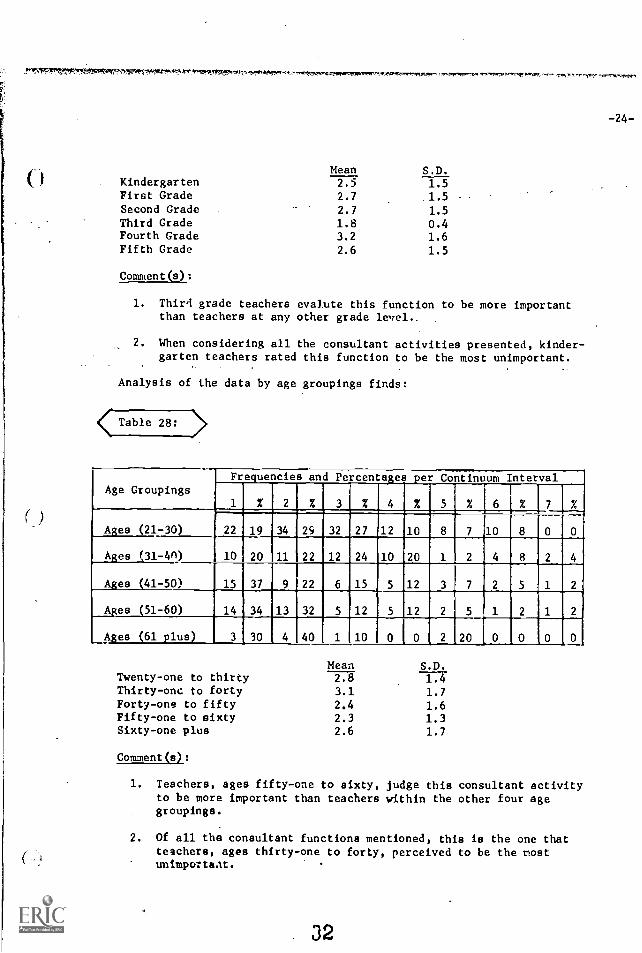
-24-
Mean S.D.Kindergarten 2.5 1.5First Grade 2.7 .1.5Second Grade 2.7 1.5Third Grade 1.8 0.4Fourth Grade 3.2 1.6Fifth Grade 2.6 1.5
Comment(s):
1. Third grade teachers evalute this function to be more importantthan teachers at any other grade level..
2. When considering all the consultant activities presented, kinder-garten teachers rated this function to be the most unimportant.
Analysis of the data by age groupings finds:
Table 28:
Age GroupingsFrequencies and Percentages per Continuum Interval
1 % 2% 3 % 4 % 5 % 6 % 7%Ages (21-30) 22 19 34 29 32 27 12 10 8 7 10
Ages (31-4n) 10 __, 2 4
Ages (41-50) 15 37 1 9 22 6 15 5 12
Ages (51-60) 14 34 13 32 5 12 5 12
Ages (61 plus) 3 30 4 40 1 10 0 0 2 20
Mean S.D.Twenty-one to thirty 2.8 1.4Thirty-one to forty 3.1 1.7Forty-one to fifty 2.4 1.6Fifty-one to sixty 2.3 1.3Sixty-one plus 2.6 1.7
Comment(El:
1. Teachers, ages fifty-one to sixty, judge this consultant activityto be more important than teachers within the other four agegroupings.
2. Of all the consultant functions mentioned, this is the one thatteachers, ages thirty-one to forty, perceived to be the mostunimportant.
32

-25-
Scrutinization of the data by years-of-experience groupings finds:
Table 29: ->
Years of ExperienceGroupings
Frequencies and Percentages per Continuum Interval
1 % 2 % % 4 % 5_ % 6 % 7 %
(0 years) 1 5 6 30 5 25 4 20 2 10 1 5 1 5
(1 to.3 years) 14 24 16 28 16_ 28 6 10 3_ 5 3 5
(4 to 10 years) 17 24 17 24 17. 24. 10 14 4 6 6 A 0 0
(11 to 20 years) 13 21 18 30 10 16 8 13 4 7 6 '10 2 3
(20 plus years) 18 40_ 12 26 7 15 4 9 3 7 1 2
Mean S.D.
Zero years 2.9 1.5
One to three years 2.7 1.4
Four to ten years 2.9 1.6
Eleven to twenty years 2.6 1.7
Twenty plus years 2.3 1.4
Comment(s):
1. Teachers with twenty plus years of experience deem this consultantservice to be more important than those teachers in the other four
years-of-experience groups.
2. Wren considering all the consultant activities presented, bothgroups of teachers, those possessing four to ten years of experience
and eleven to twenty years experience discerned this consultantfunction to be the most unimportant.
Scanning the data by degree status of teachers finds:
< Table 30: >
Highest DegreeReceived
Frequencies
2
and
2
Percentages
3 2 4
per
2
Continuum
5 2 6
Interval
Z 7
I
%%
No Degree 5 29 6 35 3 18 2 12 1 6 0
B.S. or B.A. 42 22 52 28 50 27 21 11 8 4 13 7 2 1
M.S. or M.A. 7 37 2 11 4 21 1
M.S.+ or M.A.+
t
10 24 9 22 7 17 7 17 3 1 2 5
33

Mean S.D.No Degree 2.3 1.1B.S. or B.A. 2.7 1.5
M.S. or M.A. 2.9 1.8M.A.+ or M.A.+ 2.9 1.6
Comment(s):
1. Teachers without any academic degree value this consultantactivity to be more important than teachers within other degreestatus groups.
2. Of all the consultant functions mentioned, this is the one thatteachers possessing a M.A.+ or M.A.+ rated as being the most unim-portant.
Question 1-12
When the teachers were asked, "Row important is it to you to
have a consultant available to observe the classroom teacher while she
teaches a lesson from the curriculum, then describe orb r!orstructively
discuss the teacher's performcnce in a conference
the lesson?", their responses were recorded on the j 'ontinuvm:
2 3 4 5 6
Very Important nc
Mean numerical response = 2.6 Standard deviation
Comment(s):
1. Teachers perceive the availability of a consu::: ernethe classroom teacher while she teaches a lessr curriculum,then describe and constructively discuss the tr, rformancein a conference immediately following the le.;o: ; of mediocreimportance.
Looking at the data by states finds:
(Table 31:
State of Teacher
Pennsylvania Teachers
New York Teachers
MeanNumericalResponse
2.5
2.5
M
,f 1
on
-26-
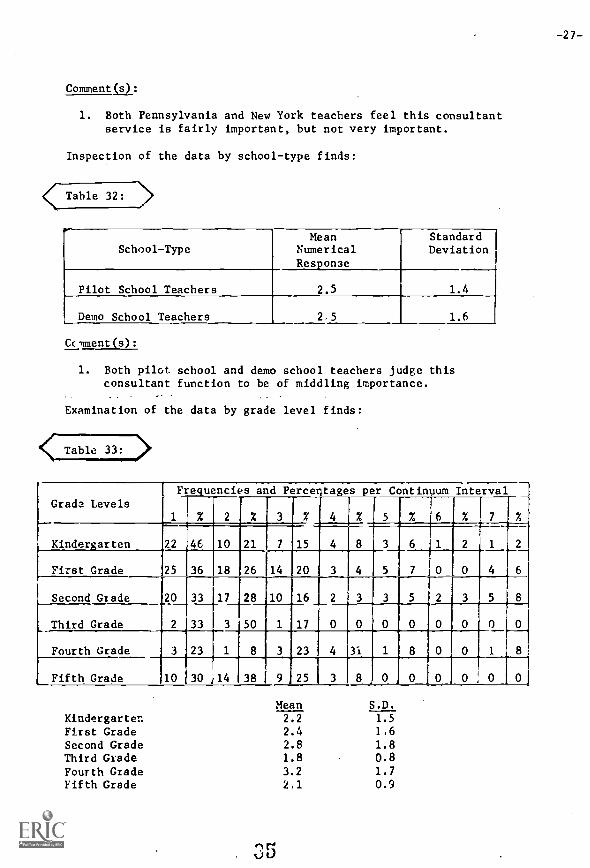
Comment(s):
-27-
1. Both Pennsylvania and New York teachers feel this consultantservice is fairly important, but not very important.
Inspection of the data by school-type finds:
Table 32: 2>
School-TypeMean
NumericalResponse
StandardDeviation
Pilot School Teachers 2.5 1.4
Demo School Teachers 2,5 1.6
Cr llment(s):
1. Both pilot school and demo school teachers judge thisconsultant function to be of middling importance.
-
Examination of the data by grade level finds:
< Table 33: >
Grade LevelsFrequencies and Percentages per Continuum Interval 7
1 2 2 %_3 % 4 % 5 % 6 % 7 .
Kindergarten 22 46 10 21 7 15 4
First Grade 25
20
36
33
18
17
26
28
14
10
20
16
3.
2
4
3
5
3
i 7 1
5
0
2Second Grade
1._
Third Grade 2 33 3 50 1 17 0 0 0 0 0 0 0 0
Fourth Grade 3 23 8 3 23 4 31 1 8 0 0. 1 8J
Fifth Grade 10 30 14 38 9 25 3 8 0 J 0 0 0 0 0
Mean S.D.
Kindergarten 2.2 1.5
First Grade 2.4 1.6
Second Grade 2.8 1.8Third Grade 1.8 0.8Fourth Grade 3.2 1.7
Fifth Grade 2.1 0.9
Ot)
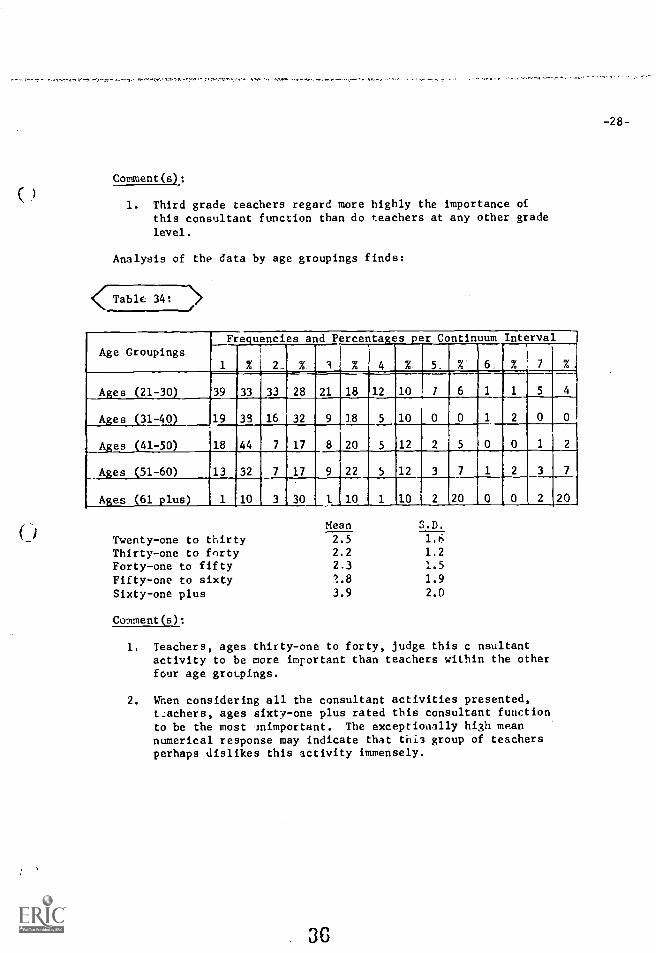
Comment(s):
-28-
1. Third grade teachers regard more highly the importance ofthis consultant function than do teachers at any other gradelevel.
Analysis of the data by age groupings finds:
Table 3177--"\,
Age GroupingsFrequencies and Percentaggs per Continuum Interval
1 % 2 % 4. %. ' 6. % 7 %
Ages (21-30) 39 33 33 28 21 18 12 10
Ages (31-40) 19 39 16 32 9 18 5 10 0
Ages 18 44 7 17 8 20 5 12 2 5 0 0 1 2_01-50)
Ages 01-60) 13 32 7 17 9 22 5 12 3 7 1 2 3 7
Ages (61 plus) 1 10 3 30 1 10 1 JO 2 20 0 0 2 20
Twenty-one to thirtyMean2.5
S.D.
Thirty-one to forty 2.2 1.2
Forty-one to fifty 2.3 1.5
Fifty-one to sixty 1.8 1.9
Sixty-one plus 3.9 2.0
Comment(s):
1. Teachers, ages thirty-one to forty, judge this c nsultantactivity to be more important than teachers within the otherfour age groupings.
2. When considering all the consultant activities presented,teachers, ages sixty-one plus rated this consultant functionto be the most unimportant. The exceptionally high meannumerical response may indicate that tni3 group of teachersperhaps dislikes this activity immensely.
36
-29-
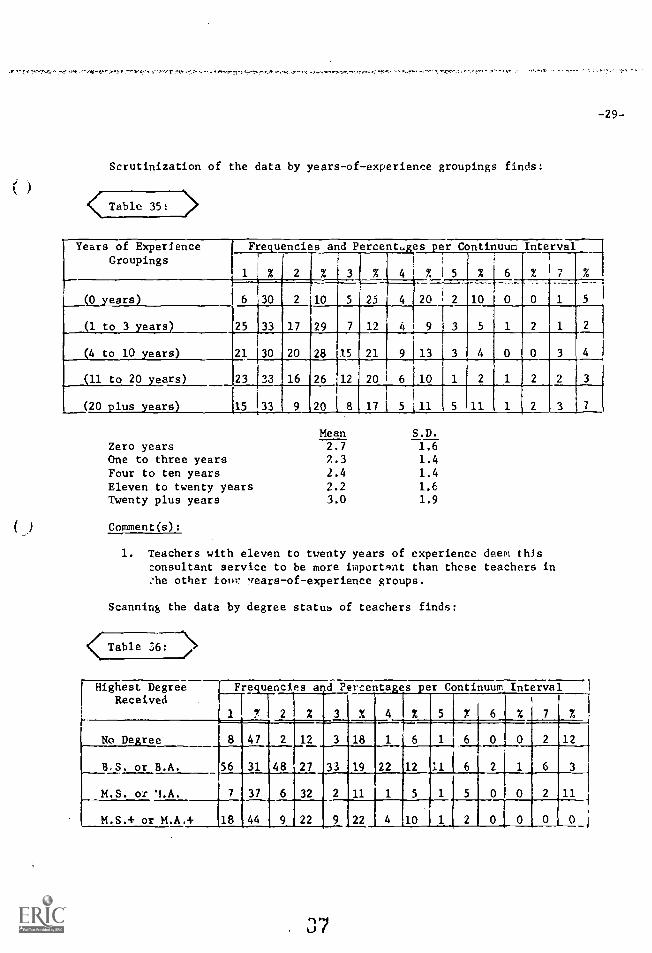
Scrutinization of the data by years-of-experience groupings finds:
<(_Table 35: >
Years of ExperienceGroupings
Frequencies and Percentages per Continuum Interval
1 % 2 % 3 % 4!% 5 % 6 % 7
(0 years) 6 30 2 10 5 25 4 20 2 10 0 0
(1 to 3 years) 25 33 17 29 7 12 4 9 3 5
(4 to 10 years) 21 30 20 28 15 21 9 13 3 4
(11 to 20 years) 23
15
33
33
16
9
26
20
12
8
20
17
6 J 10
5 11 5 11 1 2(20 plus years)
Zero yearsMean S.D.
1.62.7One to three years 2.3 1.4
Four to ten years 2.4 1.4
Eleven to twenty years 2.2 1.6
Twenty plus years 3.0 1.9
) Comment(s):
1. Teachers with eleven to twenty years of experience deem this:onsultant service to be more important than those teachers inhe other tour 'tears -of- experience groups.
Scanning the data by degree status of teachers finds:
Table 36:
Highest DegreeReceived
Fre uencies a d Percentages er Continuum Interval
1 .- 2 % 3 % 4 % 111 7 6 % 7 %
No De:ree 8 47 2 12 3 18 1 6 1 6 0 0 2 12
B.S. or B.A. 56 31 48 27 33 19 22 12 1
M.S. or I.A. 7 37 6 32 2 11 1 5 1 5 0 1 0 2 11
M.S.+ or M.A.+ 18 44 9 22 9 22 4 10
()
Mean S.D.
No Degree 2.8 2.1
B.S. or B.A. 2.6 1.6
M.S. or M.A. 2.6 1.9
M.S.+ or M.A.+ 2.0 1.3
Comment(s):
1. Teachers possessing a M.S.+ or M.A.+ value this consultantactivity to be more important than teachers within otherdegree status groups.
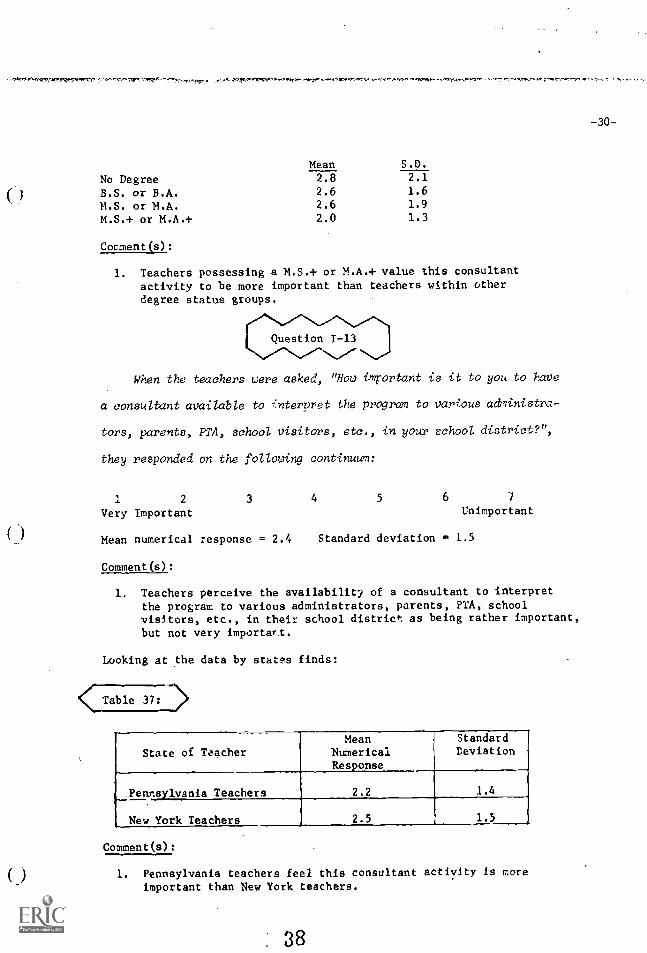
Question I-13
When the teachers were asked, "How important is it to you to have
a consultant available to interpret the program to various administra-
tors, parents, PTA, school visitors, etc., in your school. district?",
they responded on the following continuum:
1 2 3 4 5 6 7
Very Important Unimportant
Mean numerical response = 2.4 Standard deviation = 1.5
Comment(s):
1. Teachers perceive the availability of a consultant to interpretthe program to various administrators, parents, PTA, schoolvisitors, etc., in their school district as being rather important,but not very important.
Looking at the data by states finds:
(TiZie7377->
State of TeacherMean
NumericalResponse
StandardDeviation
Pennsylvania Teachers 2.2 1.4
New York Teachers 2.5 1.5
Comment(s):
1. Pennsylvania teachers feel this consultant activity is moreimportant than New York teachers.
38
-30-
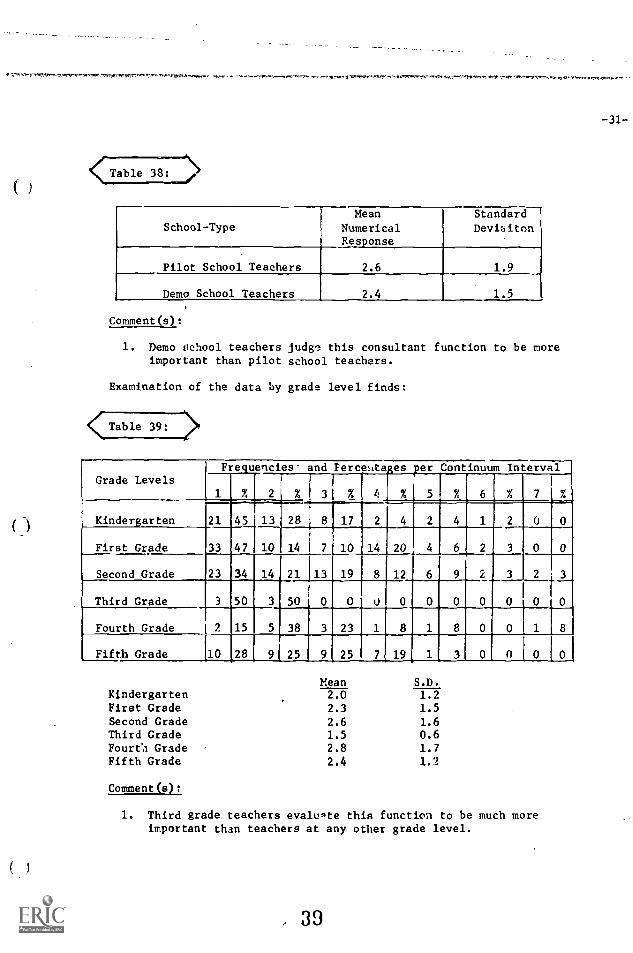
<Table 38:.---\
-31-
School-TypeMean
NumericalResponse
2.6
Standard
Deviaiton
1.9Pilot School Teachers
Demo School Teachers 2.4 1.5
Comment(s):
1. Demo ochool teachers judge this consultant function to be moreimportant than pilot school teachers.
Examination of the data by grade level finds:
Table 39: >
Grade LevelsFre.uencies- and Percehtaes er Continuum Interval
7 % t: % 5 % 6 % 7 %
Kindergarten 45 13 28 8 17 2 4 2 4 1 2 0
First Grade 33 47 10 14 7 10 14 20
Second Grade 23 34 14 21 13 19 8 12 6 9
Third Grade 3 50 3 50 0 0 0 0 0 0
Fourth Grade 7. 15 5 38 3 23 1 8 1 8 0 0 1
Fifth Grade 10 28 9 25 9 25 7 19 1 3 0
Mean S.D.Kindergarten 2.0 1.2First Grade 2.3 1.5Second Grade 2.6 1.6Third Grade 1.5 0.6Fourea Grade 2.8 1.7
Fifth Grade 2.4 1.2
Comment(s)t
1. Third grade teachers evaluate this function to be much moreimportant than teachers at any other grade level.
39
:
-32-
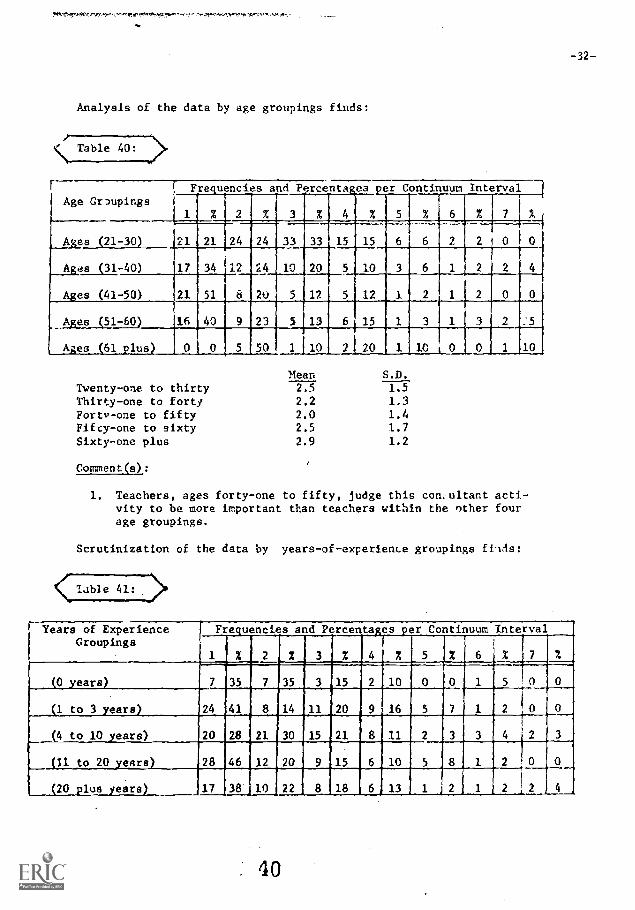
Analysis of the data by age groupings finds:
St Table 40: >
Age Gr:Dupings( Fre.uencies and PPrcenta ea er Continuum Interval
1 2 % 3 % % % 6 % 7 %
Ages (21-30) 1111 24 24 1111 6 6 Ill 2 0
jivs (31-40) 17 34 12 24 20 3 6 1 2 2 4
(41-50) li 51 8 20 5 111111=111 0__Ages
A:es 51-60 16 40 IMI 5 13 Mill 1 3 1111111 2 II
Ages (61 plus) 0 0 5 50 1 III 2 20 II 10 0 0 1 10
Mean S.D.
Twentyone to thirty 2.5 1.5Thirty-one to forty 2.2 1.3Forty-one to fifty 2.0 1.4Fifty-one to sixty 2.5 1.7
Sixty-one plus 2.9 1.2
Comment(s):
1. Teachers, ages forty-one to fifty, judge this consultant acti-vity to be more important than teachers within the other fourage groupings.
Scrutinization of the data by years-of-experience groupings fills:
<Lible 41:
Years of ExperienceGroupings
Frequencies and Percentages per Continuum Interval
1 % % 3 % 4 % 5 % 6 % 7 %
(0 years) 7 35 7 35 3 15 2 10 0 0 1 5 0 0
(1 to 3 years) 24 41 8 14 11 20 9 16 5 7 1 2 0 0
(4 to 10 years) 20 28 21 30 15 21 8 11 2 3 3 4 2 3
(11 to 20 years) 28 46 12 20 9 15 ,6 10 5 8 1 2 0 0
(20 plus years) ,17 38 ,10 22 8 18 6,1 13 1 2 1 2 I 2 4
40
-33-
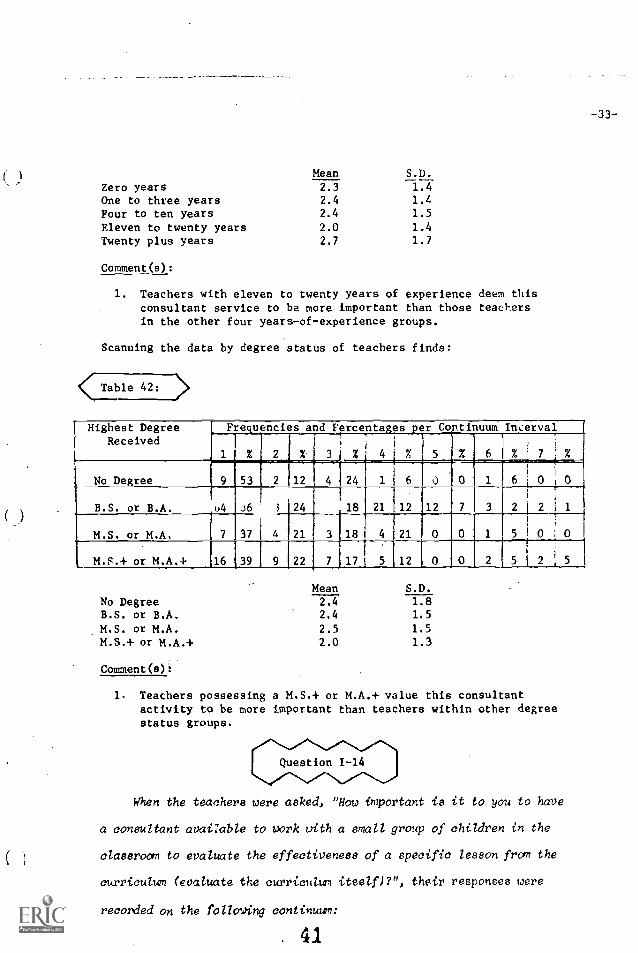
Mean S.D.
Zero years 2.3 1.4
One to three years 2.4 1.4
Four to ten years 2.4 1.5
Eleven to twenty years 2.0 1.4Twenty plus years 2.7 1.7
Comment(s):
1. Teachers with eleven to twenty years of experience deem thisconsultant service to be more important than those teact..ersin the other four years-of-experience groups.
Scanning the data by degree status of teachers finds:
<,..Table 42: ),).
Highest DegreeReceived
Frequencies and Percentages per Continuum Interval
9
%
2
X
12
3
4
%
24160014 % 5 %
,
6 % ' 7Y%
No Degree 6 0 0
B.S. or B.A. u4 J6 3 24 18 21 12 12 7 3 2 2 i 1
M.S. or M.A. 7 37 4 21 3 18 4 21 0 0 1
i
5 0 i 0
M.F.+ or M.A.+ 16 39 9 22 7 171 5 12 0 0 2 5 21
5
Mean S.D.
No Degree 2.4 1.8
B.S. or B.A. 2.4 1.5
M.S. or M.A. 2.5 1.5
M.S.+ or M.A.+ 2.0 1.3
Comment(s):
1. Teachers possessing a M.S.+ or M.A.+ value this consultantactivity to be more important than teachers within other degreestatus groups.
When the teachers were asked, "How important is it to you to have
a consultant available to work with a small group of children in the
classroom to evaluate the effectiveness of a specific lesson from the
curricutwn (eoatuate the currieutum itself) ? ", their responses were
recorded on the following continuum:
. 41
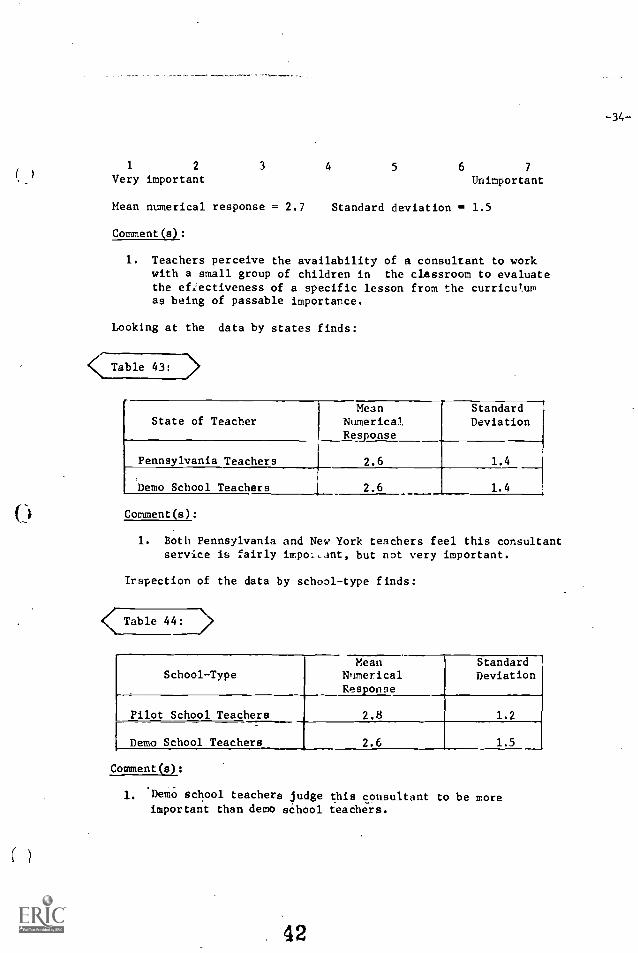
1 2
Very important3
-34-
4 5 6 7
Unimportant
Mean numerical response = 2.7 Standard deviation = 1.5
Comment(s):
1. Teachers perceive the availability of a consultant to workwith a small group of children in the classroom to evaluatethe ef,Zectiveness of a specific lesson from the curriculumas being of passable importance.
Looking at the data by states finds:
< Table 43:
State of TeacherMean
Numerical.
Response
StandardDeviation
Pennsylvania Teachers 2.6 1.4
Demo School Teachers 2.6 1.4
Comment(s):
1. Both Pennsylvania and New York teachers feel this consultantservice is fairly important, but not very important.
Inspection of the data by school-type finds:
Table 44:
School-TypeMean
NumericalRes.onse
StandardDeviation
Pilot School Teachers 2.8 1.2
Demo School Teachers 2.6 1.5
Comment(s):
_ .
1. Demo school teachers judge this consultant to be moreimportant than demo school teachers.
42
-35-
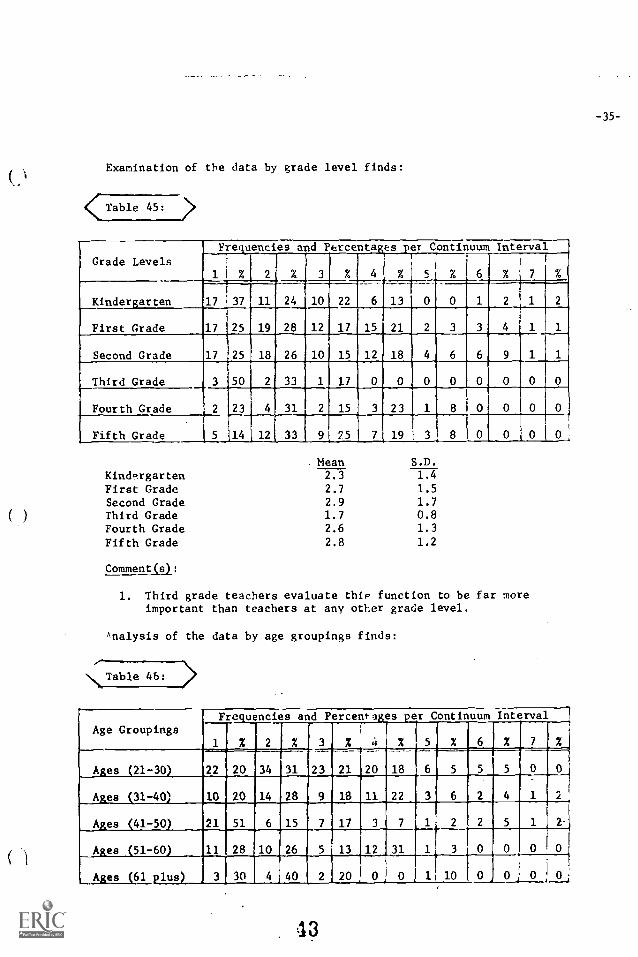
Examination of the data by grade level finds:
Table 45:
Grade Levels
Frequencies and Percentages per Continuum Interval
. %
7..°37
2
11
1
% 3 % 4 %
13
5 % 6 % 7 %
Kindergarten 17 24 10 22 6
First Grade 17 25 19 28 12 17 15 21 2
Second Grade 17 25 18 26 10 15 12 18 4 6 6 9
Third Grade 3 50 2 33 1 17 0 0 0 0 L 0
Fourth Grade 2 23 4 31 2 15 3 23
Fifth Grade 5 14 12 33 9 25 7 19 3
( )
KindergartenFirst GradeSecond GradeThird GradeFourth GradeFifth Grade
Comment(s):
Mean2.3
2.7
2.91.72.6
2.8
S.D.
1.4
1.5
1.70.81.3
1.2
1. Third grade teachers evaluate this function to be far moreimportant than teachers at any other grade level.
Analysis of the data by age groupings finds:
NTable 46:
Frequencies and Percents es per Continuum IntervalAge Groupings
-1 % 2 % 3 % 4 % 5 % 6 X 7 %
Ages (21-30) 22 20 34 31 23 21 20 18 6 5 5 5 0 0-
Ages (31-40) 10 20,14 28 9 18 11 22 3 6 2 4 1 2
Ages (41-50) 21 51 6 15 7 17 3 7 1 2 2 5 1 2
Ages (51-60) 11 28 10 5 13 12 31 1 3 0 0 0 0
t Ages (61 plus) 3 30 4 40 2 20 0, 0 J 1 10 0 0 0_, 0,
43
-36-
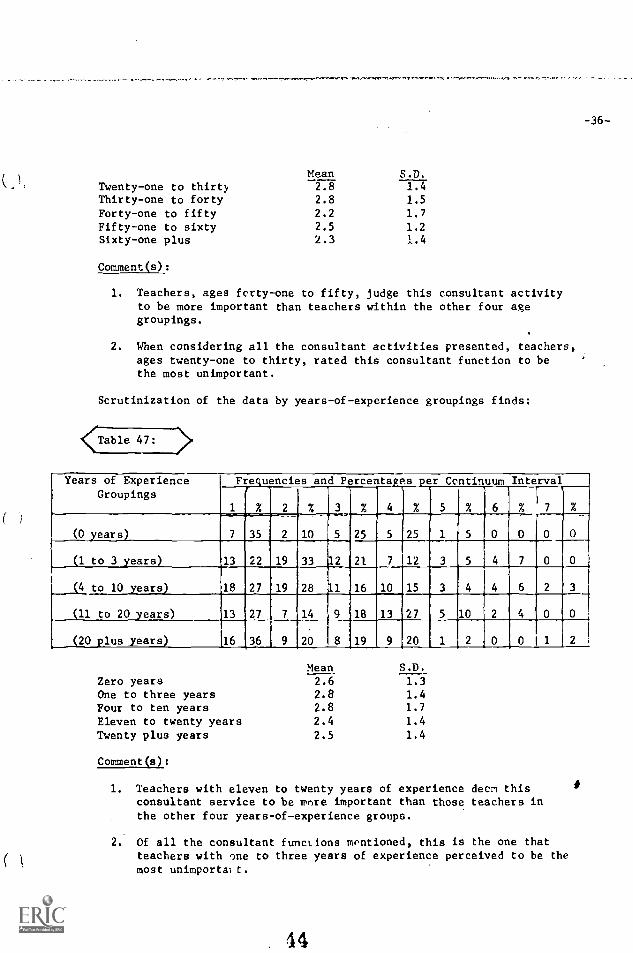
Mean S.D.
Twenty-one to thirty 2.8 1.4Thirty-one to forty 2.8 1.5Forty-one to fifty 2.2 1.7
Fifty-one to sixty 2.5 1.2
Sixty-one plus 2.3 1.4
Comment(s):
1. Teachers, ages forty-one to fifty, judge this consultant activityto be more important than teachers within the other four agegroupings.
2. When considering all the consultant activities presented, teachers,ages twenty-one to thirty, rated this consultant function to bethe most unimportant.
Scrutinization of the data by years-of-experience groupings finds:
Table 47:
Years of ExperienceGroupings
Frequencies and P rcentapfts per Continuum Interval
1 % 2 % 3 % 4 % 5 % 6 % 7
(0 years) 7 35 : 2 10 5 25 5 25 1 5 0 0 0
(1 to 3 years) 13 22 19 33 2 21 7 12 3 5 4
(4 to 10 years) 18 27 19 28 1 16 10 15 3 4 4 6 2 3
(11 to 20 years) 13 27 7 14 9 18 13 27 5 10 2 4 0 0
(20 plus years) 116 36 9 20 8 19 9 20 1 2 0 0 1 1 2
Mean S.D.
Zero years 2.6 1.3One to three years 2.8 1.4Four to ten years 2.8 1.7
Eleven to twenty years 2.4 1.4
Twenty plus years 2.5 1.4
Comment(s):
1. Teachers with eleven to twenty years of experience deem thisconsultant service to be more important than those teachers inthe other four years-of-experience groups.
2. Of all the consultant functions mentioned, this is the one thatteachers with one to three years of experience perceived to be themost unimportant.
44
-37-
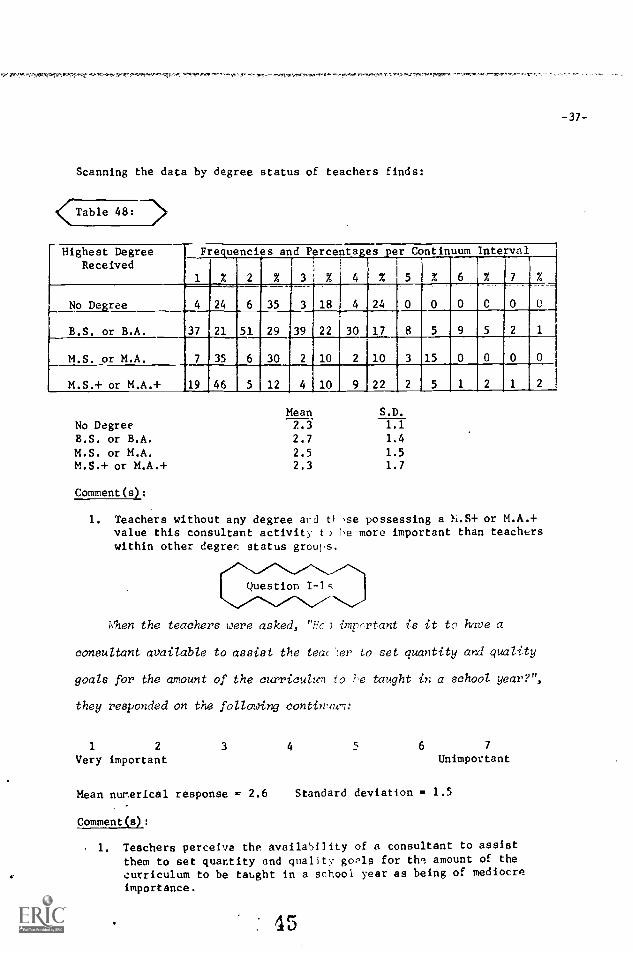
Scanning the data by degree status of teachers finds:
<Table 48:
Highest DegreeReceived
Frequencies and Percentages per Continuum Interval
% 2 % 3 % 4 % 6 % 7 %
No Degree 4 24 6 35 3 18 4 24
B.S. or B.A. 37 21 51 29 39 22 30 17
M.S. or M.A. 7 35 6 30 2 10 2 10 3 15
M.S.+ or M.A.+ 19 46 5 12 4 10 9 22
No DegreeB.S. or B.A.
M.S. or M.A.M.S.+ or M.A.+
Mean2.3
2.7
2.52.3
S.D.
1.1
1.4
1.5
1.7
Comment(s):
1. Teachers without any degree ard t1 )se possessing a h.S+ or M.A.+value this consultant activity t ) 1e more important than teacherswithin other degree status grouls.
Question I-lc,
When the teachers were asked, "Hc 7 important is it to have a
consultant available to assist the teacer to set quantity and quality
goals for the amount of the curriculum to 2-e taught in a school year?",
they responded on the following continum:
1 2 3 4 5 6 7
Very important Unimportant
Mean numerical response = 2.6 Standard deviation a 1.5
Comment(s):
1. Teachers perceive the availability of a consultant to assist
them to set quantity and quality goals for the amount of thecurriculum to be taught in a school year as being of mediocreimportance.
45

-38
Looking at the data by states finds:
< Table 49: >
State of TeacherMean
NumericalResponse
StandardDeviation
Pennsylvania Teachers 2.9 1.7
New York Teacners 2.3 1.3
Comment(s):
1. New York teachers feel this consultant service is much moreimportant than Pennsylvania teachers.
2. When considering all the consultant activities presented,Pennsylvania teachers assessed this function to be the mostunimportant.
Inspection of the data by school-type finds:
triable 50:
School-TypeMean 1
NumericalResponse
2.4
Standard
Deviation
1.0Pilot School Teachers
Demo School Teachers 2.6 1.6
Comment(s):
1. Pilot school teachers judge this consultant function to bemore important than demo school teachers.
46
-39-
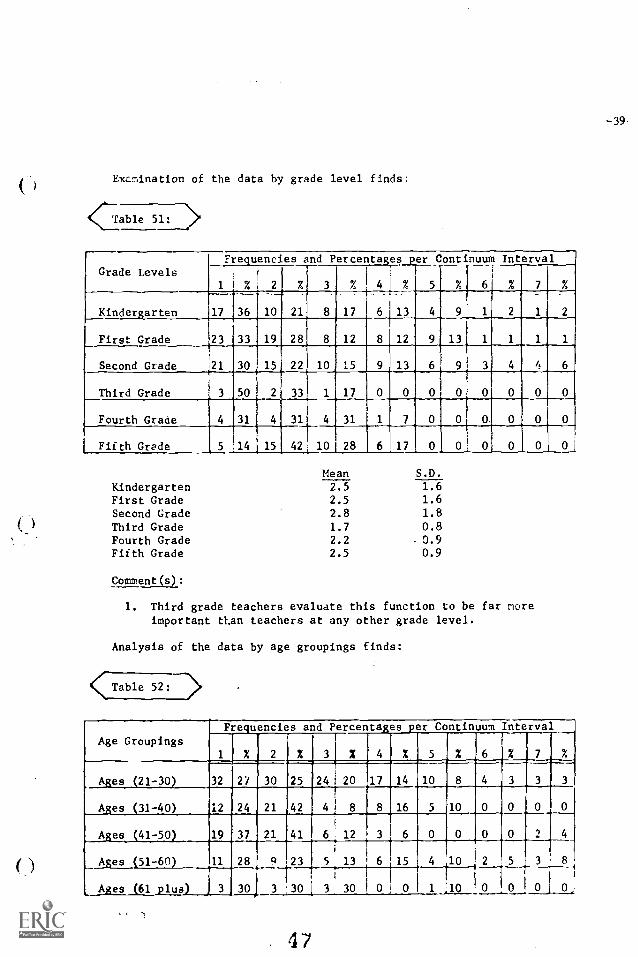
Excmination of the data by grade level finds:
<Ciable. 51: >
Grade LevelsFrequencies and Percentages per Continuum Interval
% 2 % 3 i % 4 % 5 % 6 % 7 %
Kindergarten 17 36
_
10 21 8 17 6 13 4
First Grade 23 33 19 28 8 12 8 12 9 13 1 1 1 1
Second Grade 21 30 15 22 10 15 9 13 6 9 3 4 4 6
Third Grade 50 2 33 1 17 0 0 0 0 0 0 0 0
Fourth Grace 4 31 4 31 4 31 1 7 0 0 0 0 0 0
Fifth Grade 5 14 15 42 101 28 6 17 0 0 0 0 0 0
Mean S.D.
Kindergarten 2.5 1.6
First Grade 2.5 1.6
Second Grade 2.8 1.8
Third Grade 1.7 0.8Fourth Grade 2.2 0.9Fifth Grade 2.5 0.9
Comment(s):
1. Third grade teachers evaluate this function to be far moreimportant tEan teachers at any other grade level.
Analysis of the data by age groupings finds:
Table 52:>
Age GroupingsFrequencies and Percentages per Continuum Interval
1 % 2 %
r
3 X 4 % 5 % 6 % 7 .
Ages (21-30) 32 2Y 30 25 24i 20 17 14 10t f
Ages (31-40) 12 24 21 421
4 1 8 8 16 5 10 0 0 0
(
Ages (41-50) 19 37 21 41 6 : 12 3 6 0 0 0
;
Ages (51-60) 11 28_, Q 23 5 13 ! 6 15 4 10 2 5. 3 8
;
Ages (61 plus) , 3 30 3 30 3 30 0 0 1 10 0 0 Oi 0,
4 '7
-40-
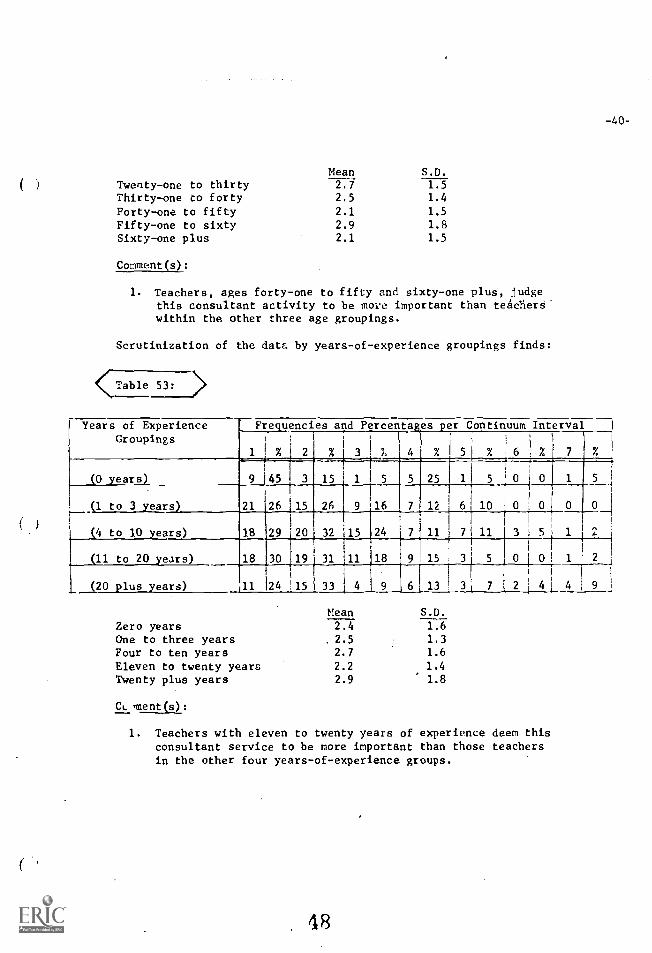
Mean S.D.
Twenty-one to thirty 2.7 1.5Thirty-one to forty 2.5 1.4
Forty-one to fifty 2.1 1.5
Fifty-one to sixty 2.9 1.8
Sixty-one plus 2.1 1.5
Comment(s):
1. Teachers, ages forty-one to fifty and sixty-one plus, judgethis consultant activity to be move important than teachers"within the other three age groupings.
Scrutinization of the data by years-of-experience groupings finds:
<:Table 53:
Years of ExperienceGroupings
Frequencies and Percentages per Continuum Interval
1 1 % 2 % 3 % 4 % 5 % 6 % 7 %
(0 years) 9 j45
21 26
3
15
15
26
1
9
5
16
5
7
25
12
1
6
5
10
0 0 1 5
1
0(1 to 3 years)
(4 to 10 years) 18 29 20 32 15 24 7 11 7 11 3 5 1
1
2-i
2.;
(11 to 20 years) 18 30 19 31 11 18 9 15 0
(20 plus years) Ill 24 15 33 4 9 6 13 3 7 1 2 1 41 4 9
Mean S.D.
Zero years 2.4 1.6
One to three years 2.5 1.3
Four to ten years 2.7 1.6
Eleven to twenty years 2.2 1.4
Twenty plus years 2.9 1.8
CL 'cent (s))
1. Teachers with eleven to twenty years of experience deem thisconsultant service to be more important than those teachersin the other four years-of-experience groups.
-41-
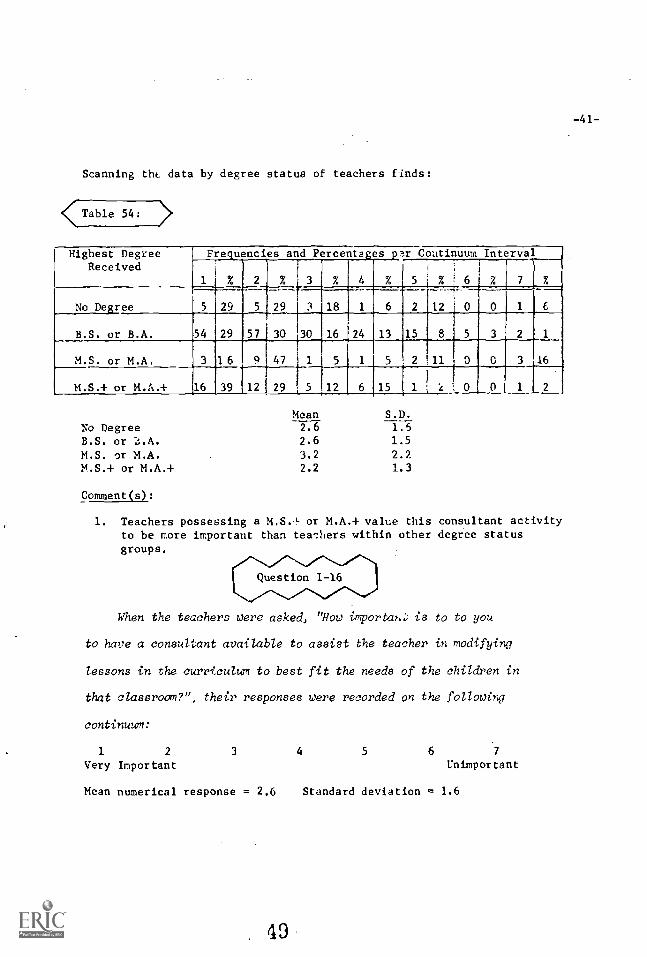
Scanning thi data by degree status of teachers finds:
< Table 54: >
Highest DegreeReceived
Frequencies and Percentages par Continuum Interval
1 % 2 %
29
3 % 4 %
6
5
2
%
-E
12
6
0
% 7 %
No Degree 5 29 5 3 18 1 0 1 6
B.S. or B.A. 54 29 57 30 30 16 24 13 15 8 5 3 2 1
M.S. or M.A. 3 16 9 47 1 5 1 5 2 11 , 0 0 3 16
M.S.+ or M.A.+ 16 39 12 29 5 12 6 15 1 k , 0 0 1 2
Mean S.D.
No Degree 2.6 1.6B.S. or .!,.A. 2.6 1.5
M.S. or M.A. 3.2 2.2
M.S.+ or M.A.+ 2.2 1.3
Comment(s):
1. Teachers possessing a M.S.1- or M.A.+ value this consultant activityto be more important than teachers within other degree statusgroups.
Question I -16
When the teachers were asked, "How importan is to to you
to have a consultant available to assist the teacher in modifying
lessons in the curriculum to best fit the needs of the children in
that classroom?", their responses were recorded on the following
continuum:
1 2 3 4 5 6 7
Very Important Unimportant
Mean numerical response = 2.6 Standard deviation = 1.6
49
-42--
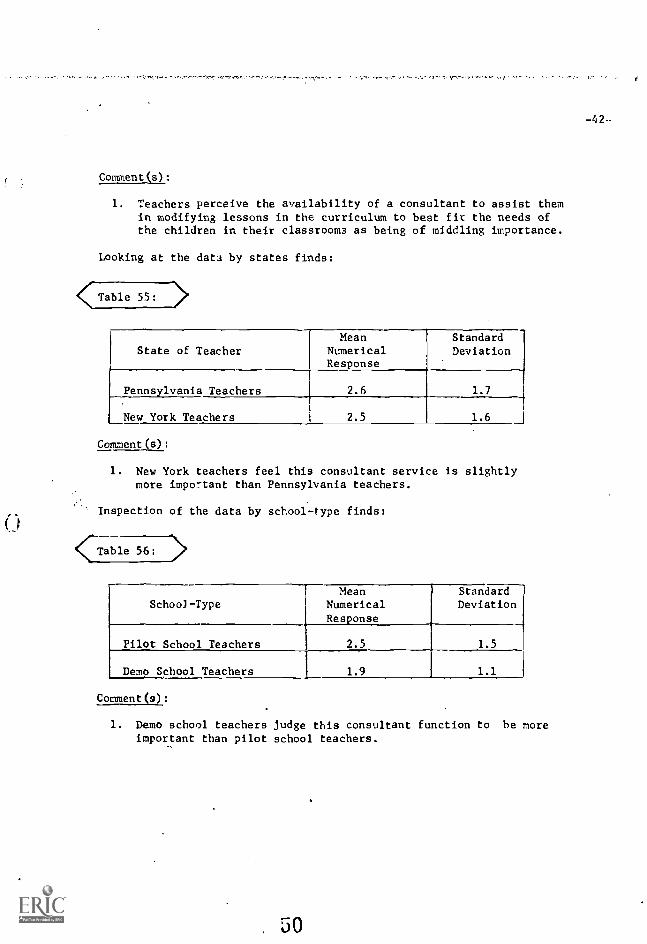
Comment(s):
1. Teachers perceive the availability of a consultant to assist themin modifying lessons in the curriculum to best fit the needs ofthe children in their classrooms as being of middling importance.
Looking at the data by states finds:
<(:Table 55:
State of TeacherMean
NumericalResponse
StandardDeviation
Pennsylvania Teachers 2.6 1.7
New York Teachers 2.5 1.6
Comment(s):
1. New York teachers feel this consultant service is slightlymore important than Pennsylvania teachers.
Inspection of the data by school-type finds:
<,--Table 56: 7;>
School-TypeMean
NumericalResponse
2.5
StandardDeviation
1.5Pilot School Teachers
Demo School Teachers 1.9 1.1
Comment(s):
1. Demo school teachers judge this consultant function to be moreimportant than pilot school teachers.
51
Examination of the data by grade level finds:
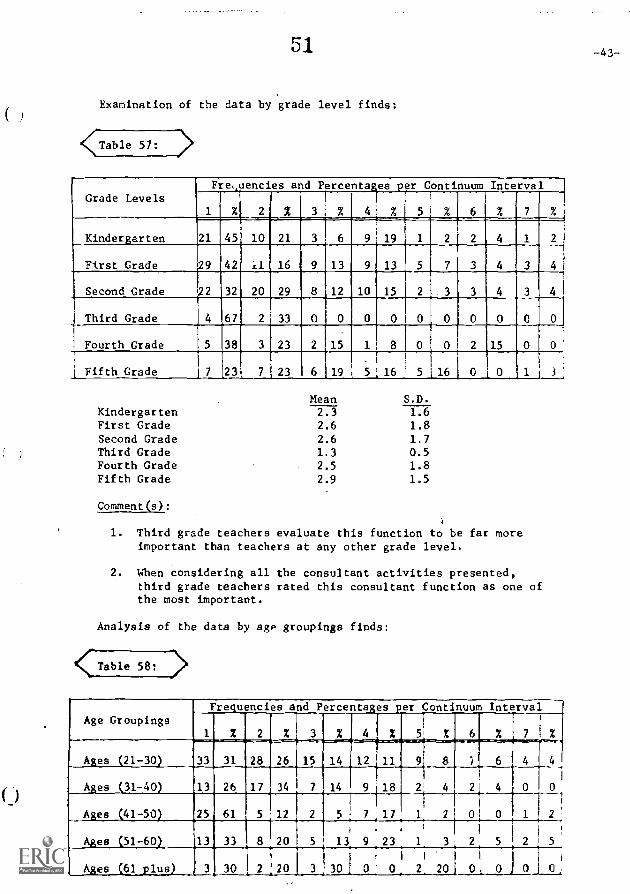
<Table 57:
Grade LevelsFre.,uencies and Percenta es per Continuum Interval
1 % 2 2 3 % 4 q 5 1 6 % 7
Kindergarten 21 45 10 21 3 6 9 19 1 2 2 4 1 2
First Grade 42 16 9 13 9 13 I 3 4 3 4
Second Grade 22 32 20 29 8 12 10 15 2 3 3 4 3 4
Third Grade 4 67 2 33 0 0 0 0 0 0 0 0 0 0
Fourth Grade 5 38 3 23 2 15 1 8 0 0 2 15 0 0
Fifth Grade j 7 23 7 23 6 19 a 5 16 5 116 0 L 0 J 1
KindergartenFirst GradeSecond GradeThird GradeFourth GradeFifth Grade
Comment(s):
Mean2.32.6
2.61.32.5
2.9
S.D.1.61.8
1.7
0.51.81.5
A
1. Third grade teachers evaluate this function to be far moreimportant than teachers at any other grade level.
2. When considering all the consultant activities presented,third grade teachers rated this consultant function as one ofthe most important.
Analysis of the data by age groupings finds:
Table 58: >
Age GroupingsFrequencies and Percenta:es .er Continuum Interval
2 2 % 3 % 4 % 5 % 6 % 7 I %
A:es 21-30 33 31 28 IIII
34
15
7
111111111111
14 9 18 2 4
ilIl
2
6
4
4 4
Ages (31-40) 13 26 17
Ages (41-50) 25 61 5 12 2 5. 1;17 0 0
1
Ages (51-60) 13 33 8
2
20
!20
5
3
13 9, 1 3,I I
0 0, 2, 201
2
0,
5
0
2
!
5
i
0,Ages (61 plus)_p 3 30
-43.-
-44-
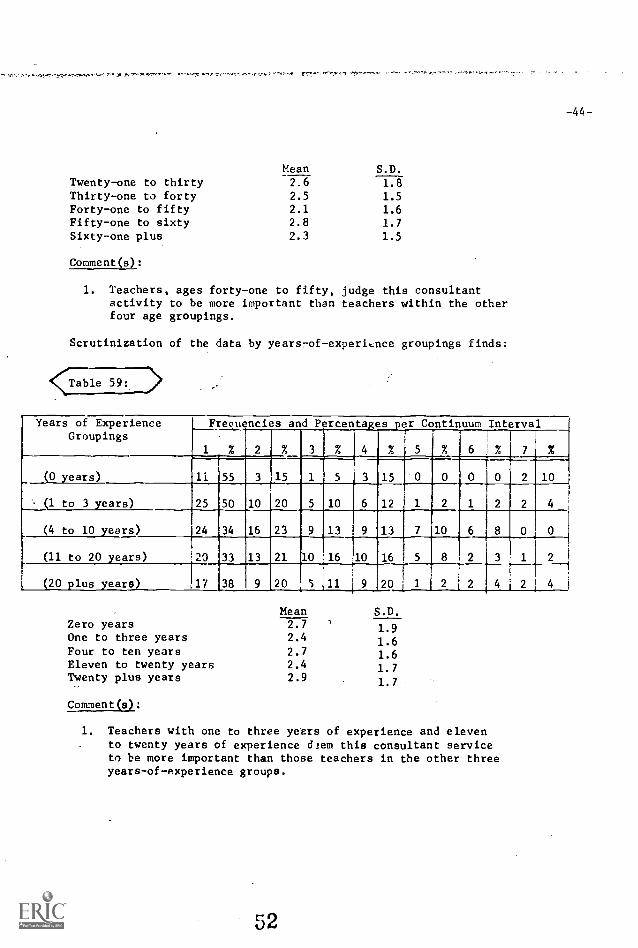
Mean S.D.
Twenty-one to thirty 2.6 1.8Thirty-one to forty 2.5 1.5Forty-one to fifty 2.1 1.6Fifty-one to sixty 2.8 1.7
Sixty-one plus 2.3 1.5
Comment(s):
1. Teachers, ages forty-one to fifty, judge this consultantactivity to be more important than teachers within the otherfour age groupings.
Scrutinization of the data by years -of- experience groupings finds:
Table 59: :Years of Experience
GroupingsFrequencies and Percentages per Continuum Interval
1 % 2 % 3 % 4 % 5 % 7 X
(0 years) 11 55 3 15 1 5 3 15 0 0 0
A-
0 2 10
%(1 to 3 years) 25 50 10 20 5 10 6 12 1 2 1 2 2 4
(4 to 10 years) 24 34 16 23 9 13 9 13 7 10 6 8 0 0
(11 to 20 years) 20 33 13 21 10 16 10 16 5 8 2 3 1 2
1 (20 plus_years) 17 38 9 20 5 11 9 20 1 2 2 4 2 I 4
Mean S.D.Zero years 2.7 1.9One to three years 2.4 1.6Four to ten years 2.7 1.6Eleven to twenty years 2.4 1.7Twenty plus years 2.9 1.7
Comment(s):
1. Teachers with one to three years of experience and elevento twenty years of experience diem this consultant serviceto be more important than those teachers in the other threeyears -of- experience groups.
52

-45-
Scanning the data by degree status of teachers finds:
Table 60: >Highest Degree
ReceivedFrequencies and P rcentagqs_per Continuum Interval
% 2 . % 3 % 4 % 5 % 6 % 7 %
No Degree 4 24 5 29 3 18 5 29 0 0 0 0 0 0
B.S. or B.A. 63 36 45 26 24 14 24 14 4 2 8 4 5 3
M.S. or M.A. 6 24 4 16 j 1 4 2 8 4 16 0 0 2 8
M.S.+ or M.A.+ 20 49 12 29 512 3 7 1 2 0 0 0 0
No DegreeMean S.D.
1.1
B.S. or B.A. 2.6 1.6
M.S. or M.A. 3.3 2.3
M.S.+ or M.A.+ 1.9 1.2
Comment(s):
1. Teachers possessing a M.S.+ or M.A.+ value this consultantactivity to be more important than teachers within otherdegree status groups.
2. Of all the consultant services mentioned, this is the onethat teachers with a M.S. or M.A. discerned to be the mostunimportant.
When the teachers were asked, "How important is it to you to
have a consultant available to meet with teachers on a grade level
basis after school or during planning periods to supply continuing
inservice experiences in the new curriculum?", they responded on the
following continuum:
1 2 3 4 5 6 7
Very important Unimportant
Mean numerical reapcnse = 2.5 Standard deviation = 1.4
53
-46-
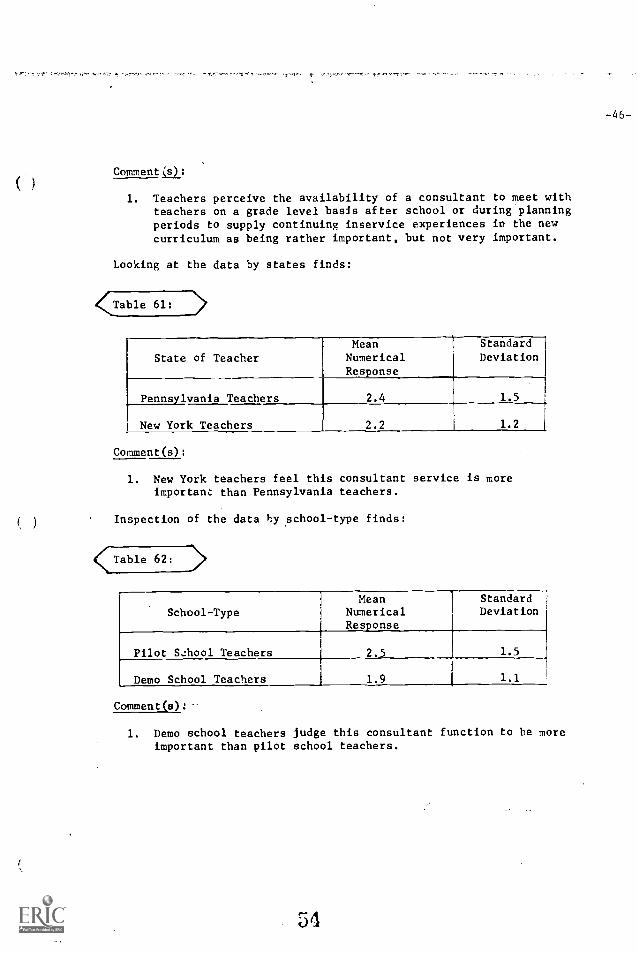
Commentisl:
1. Teachers perceive the availability of a consultant to meet withteachers on a grade level basis after school or during planningperiods to supply continuing inservice experiences in the newcurriculum as being rather important, but not very important.
Looking at the data by states finds:
Table 61:
State of Teacher
MeanNumericalResponse
StandardDeviation
Pennsylvania Teachers 2.4 1.5
New York Teachers 2.2 1.2
Comment(s):
1. New York teachers feel this consultant service is moreimportance than Pennsylvania teachers.
Inspection of the data by school-type finds:
< Table 62:
School-TypeMean
NumericalResponse
StandardDeviation
Pilot SAool Teachers 2.5 1.5
Demo School Teachers 1.9 1.1
Comment (3)
1. Demo school teachers judge this consultant function to be moreimportant than pilot school teachers.
JJ
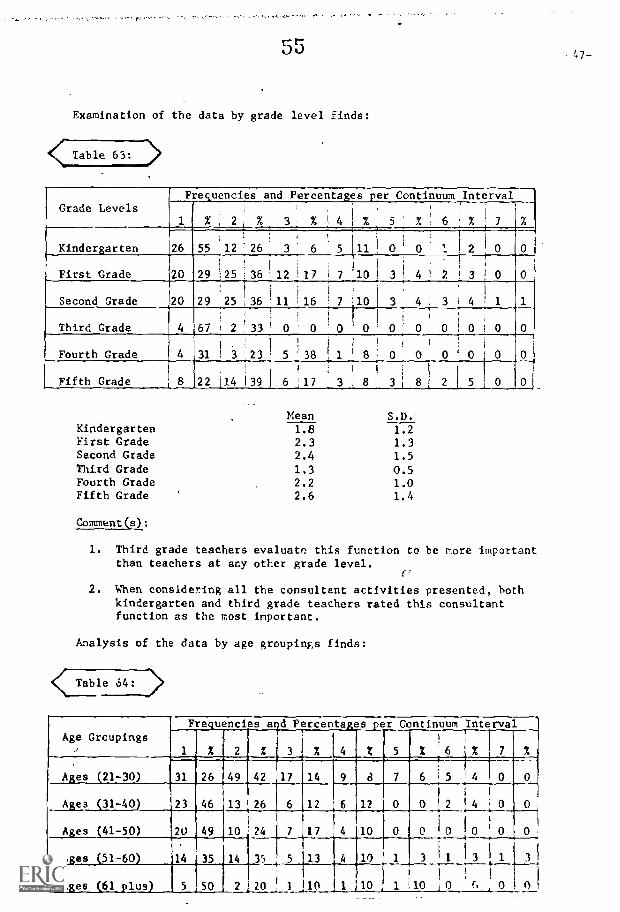
Examination of the data by grade level finds:
Table 63: >
Grade LevelsFrequencies and Percentages
i 4 i
per Continuum
% 5 % 6
Interval
% 7 %%, 21
3 %
Kindergarten 26 55 12 '26 3 6 5 11i
0P
1 ' 2 3 0
First Grade 20 29 251
:36 12 1.7 1 7 10 ' ' 2
1
3
Second Grade 20 29 251 I r
36 11 ! 161
! 7 10 I
311
, 4
Third Grade 4 67!
i 2
,
,
133!
0 ' 0
1
1
' 0 0 0 0 01
1 0 0
Fourth Grade 4 31I
! 3i !
,23 5 38 . 8 0
1
0 0 ' 0 0
Fifth Grade 8 22 114
!
139 6 1 171 i 3 8
,
3 i
i
8 E 2 5 0 0 1
Mean S.D.Kindergarten 1.8 1.2First Grade 2.3 1.3Second Grade 2.4 1.5Third Grade 1.3 0.5Fourth Grade 2.2 1.0Fifth Grade 2.6 1.4
Comment(s):
1. Third grade teachers evaluate this function to be more importantthan teachers at any other grade level.
2. When considering all the consultant activities presented, bothkindergarten and third grade teachers rated this consultantfunction as the most important.
Analysis of the data by age groupings finds:
< Table 64: ..;
Age GroupingsFrequencies and Percentages
I i
Z [4
per
Z
Continuum
5
1 'Z 6
Interval
% 7 %
0
1 X X 3
Ages 521-30) 31 26 49 42 17 14 9 d 7 6 '5 4 0
Ages (31-40) 23 46 13 26 6 12 6 12
I 1
1 2 1 4 0 0
Ages (41-50) 20 49 10 24 7 17 4 10 10 10 0 0
Ages (51-60) 14 35 14 35 i 5 13 4 10 1
t
3 1 1 3 1 3
Ages (61 plus) 5 ,50 2 20 1 1 10 1 ;10! ! P
1 10 0 (.! , 0 0
47-
-48-
Twenty-one to thirtyThirty-one to fortyForty-one to fiftyFifty-one to sixtySixty-one plus
Comment(s):
Mean :.D.
2.4 1.32.1 1.4
1.9 1.02.3 1.5
2.3 f 1.7
1. Teachers, ages forty-one to fifty, judge this consultant activityto be more important than teachers within the other four agegroupings.
Scrutinization of the data by years -of- experience groupings finds:
Table 6-5-:-7:>
Years of ExperienceGroupings
Freiluen6ies and Percentages per Continuum Interval,
,
5 ' % ' 6 . 7
1
%%
I
% % '
, I
,
4 t % '
(0 years) 8 40 5 2 '15 1 5 1 5 2 10 i 0 ' 0 1
(1 to 3 years) 21 36 23 40 ' 9 5 9 21
.
; 3
,
f
2
i
3 1 0 0 ,
! I
,
i
(4 to 10 years) 20 28 29 41 9 113 7 10 i 4 16 ' 2 E 3 ! 0 0
(11 to 20 }Teals) ,24 40 16 27 12 i20 1 6 10 1 1 1 2 1 1 !
(20 plus years) 18 40 13 29 8 !18 4 9 i 1 [2 ! 0 0 1 2
Mean S.D.
Zero years 2.3 1.5
One to three years 2.5 1.4
Four to ten years 2.2 1.2Eleven to twenty yt irs 2.1 1.3Twenty plus years
r.',omment(s):
2.3 1.3
1. Teachers with eleven to twenty years of experience deem this consul-tant service to be more important than those teachers in the otherfour years-of-experience gorups.
56

-49--a
Scanning the data by degree status of teachers finds:
Table 66:
Highest DegreeReceived
Pre uencies and Percenta es er Continuum Interval
1 % 2 7 3' % 4 ; % 5 % 6 % 7 %
No Degree 5 29 6 35 3 18 2 '12 1 6 0 0 0 0 '
B.S. or B.A. 51 29 62 35 28 15 20 Ill 8 5 7 4 1 1
M.S. or M.A. 7 37 8 42 3 16 0 1 0 0 , 0 1 5 0
M.S.+ or M.A.+ 27 66 11 27 2 5
1
1 1 2 0 0 0 0 0
No DegreeB.S. or B.A.M.S. or M.A.
n.s.+ or M.A.+
Mean2.2
2.4
2.1
1.5
S.D.
1.2
1.4
1.3
0.8
Comment(s):
1. Teachers possessing a M.S.+ or M.A.+ value this consultant activityto be more important than teachers within other degree statusgroups.
2. When considering all the consultant activities presented, teacherswith an M.S.+ or M.A.+ prized this consultant function as beingthe most important.
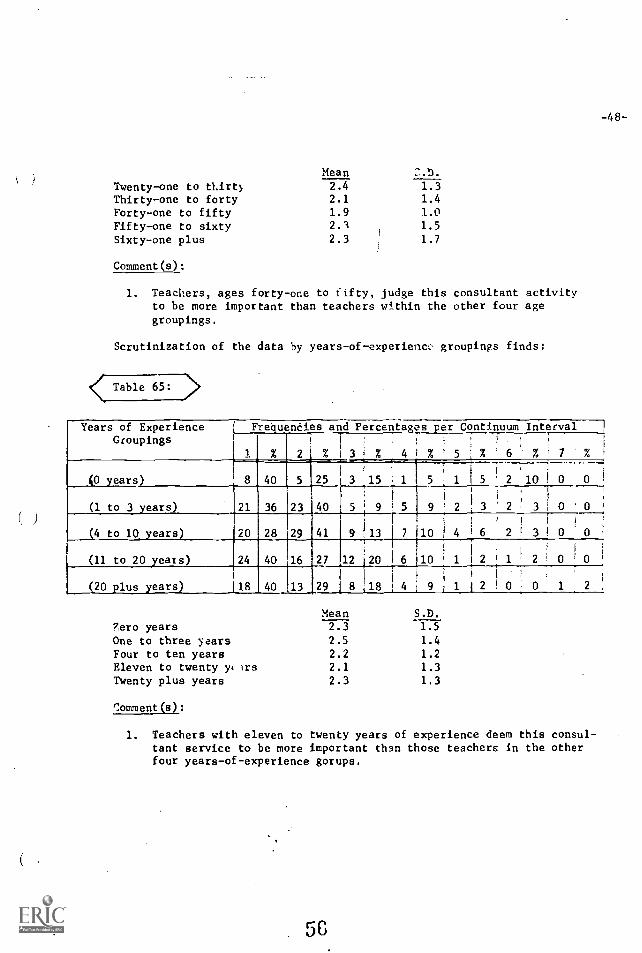
Question 1-18
When the teachers were asked, "How important is it to you to have
a consultant a,,ailable to answer questions about the general subject
matter area (science questions) upon which the innovative curriculum
is based; for example, serve as the "science expert" and handle questions
about science?", their responses were recorded on the following
continuum:
1 2 3 4 5 6 7
Very important Unimportant
Mean numerical response 2.5 Standard deviation - 1c
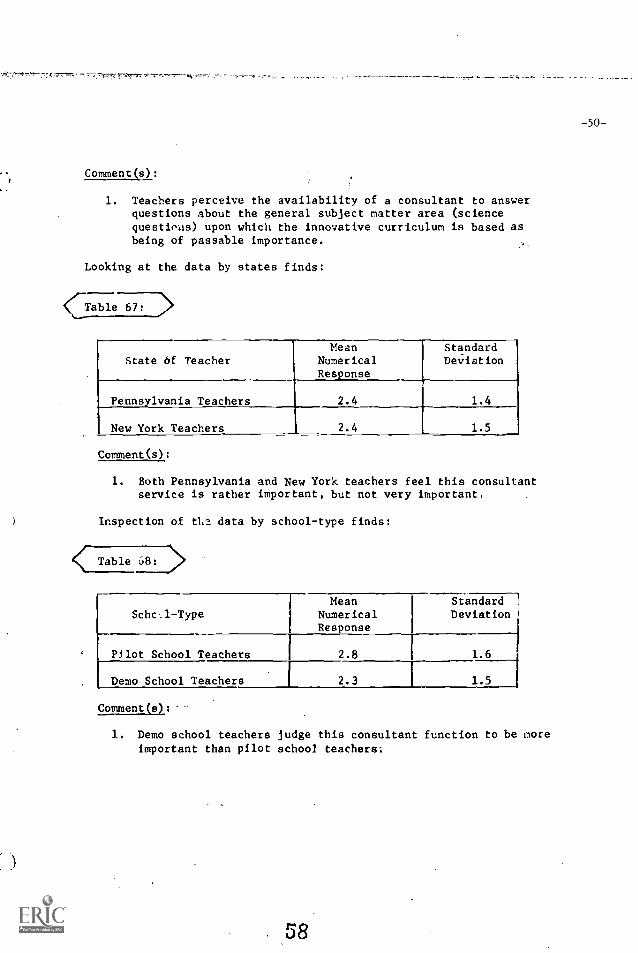
Comment(s):
1. Teachers perceive the availability of a consultant to answerquestions about the general subject matter area (sciencequestipas) upon which the innovative curriculum is based asbeing of passable importance.
Looking at the data by states finds:
Table 67: >
State bf TeacherMean
NumericalResponse
StandardDeviation
Pennsylvania Teachers 2.4 1.4
New York Teachers 2.4 1.5
Comment(s):
1, Both Pennsylvania ard New York teachers feel this consultantservice is rather important, but not very important.
Inspection of tha data by school-type finds:
Table 38:
Schc.1-TypeMean
NumericalResponse
StandardDeviation
Pilot School Teachers 2.8 1.6
Demo School Teachers 2.3 1.5
Comment (s) :
1. Demo school teachers judge this consultant function to be moreimportant than pilot school teachers:.
58
-50-
-51-
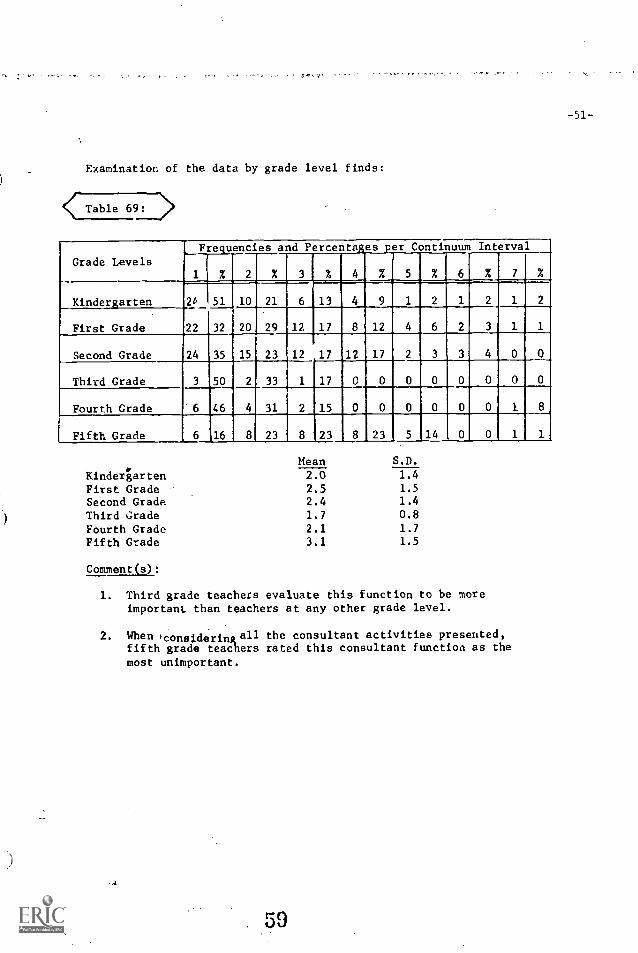
Examination of the data by grade level finds:
Table 69
Grade Levels
Frequencies and Percenta:es per Continuum Interval
1 % 2 % 3 % 4 X 5 % 6 % 7 Y.
Kindergarten 26 51 10 21 6 13 4 9 1 2 1 2 1 2
First Grade ,22 32 20 29 12 17 8 12 4 6 2 3 1 1
Second Grade 24 35 15 23 12 17 12 17 2 3 3 4 0
Third Grade 3 50 2 33 1 17 0 0 0 0 0 0 0 0
Fourth Grade 6 46 4 31 2 15 0 0 0 0 0 0 1 8
Fifth Grade 6 16 8 23 8 23 8 23 5 14 0
Mean S.D.
Kindergarten 2.0 1.4
First Grade 2.5 1.5
Second Grade 2.4 1.4
Third Grade 1.7 0.8
Fourth Grade 2.1 1.7
Fifth Grade 3.1 1.5
Comment(s))
1. Third grade teachers evaluate this function to be moreimportant than teachers at any other grade level.
2. When )considerinii all the consultant activities preseiited,fifth grade teachers rated this consultant function as themost unimportant.
50
-52-
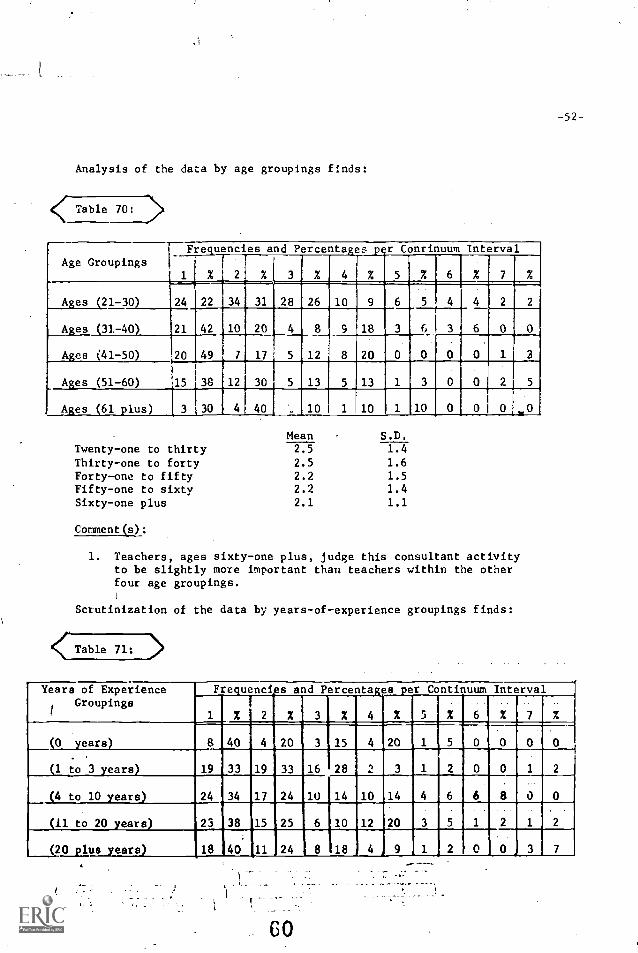
Analysis of the data by age groupings finds:
< Table 70:
Age GroupingsFrequencies and Percentages p r Continuum Interval
% 2 % 3 % 4 % 5 % 6 % 7 %
Ages (21-30) 24 22 34 31 28 26 10 9
Ages (31-40) 21 42 10
r
20 4 8 9 18 3 G 34--'---1---0
6
0
0
1
0
Ages (41-50) 20 49 7 17 5 12 8 20 0 0 3
Ages (51-60) 15 38 12 30 5 13 5 13
Ages (61 plus) 3 ,30 4 40 .. 10 1 10 1 10
Mean S.D.
Twenty-one to thirty 2.5 1.4
Thirty-one to forty 2.5 1.6Forty-one to fifty 2.2 1.5Fifty-one to sixty 2.2 1.4
Sixty-one plus 2.1 1.1
Comment(s):
1. Teachers, ages sixty-one plus, judge this consultant activityto be slightly more important than teachers within the otherfour age groupings.
Sctutinization of the data by years-of-experience groupings finds:
Table 71: >
Years of ExperienceGroupings
Frequencigs and Percentages per Continuum Interval
11
% 2
1
% 3 % 4 % 5 Z 6 % 7 %
(0 years) 8 40 4 20 3 15 4 20 1 5 0 0 0 0
(1 to 3 years) 19 33 19 33 16 28 2
-
3 1 2 0 0 1 2
(4 to 10 years) 24 34 17 24 10 14 10 14 4 6 6 8 0
(11 to 20 years) 23 ,38 15 b25 6 10 12 20 3 5 1 2 1 2
(20 plus years) .18 40 11 24 , 8 418 4 9 1 2 0 0 1
60

-53-
Mean S.D.
Zero years 2.5 1.6
One to three years 2.2 1.1
Four to ten years 2.7 1.7
Eleven to twenty years 2.3 1.5
Twenty plus years Al2.4 1.6
Comment(s):
1. Teachers with one to three years of experience deem thi; con-sultant service to be more important than those teachers in theother four years -of- experience groups.
Scanning the data by degree status of teachers finds:
<(7 Table 7)Highest Degree
ReceivedFrequencies and Percentages per Continuum Interval
X
-1
2% 3% 4 % 5% 6 %
I
7 *.
No Degree 47 3 18
1
3 18 2 12
B.S. or B.A. 55 31 48 27 34 19 24 14 10 6 5 3 1 1
M.S. or M.A. 8 47 5 29 3 18 0 0 0 0 0 0 1 6
M.S.+ or M.A.+ 20 49 10 24 3 7 5 12 0 0 2 5 1 2
Mean S.D.
No Degree 2.2 1.3B.S. or B.A. 2.4 1.4M.S. or M.A. 2.8 2.3
M.S.+ or M.A.+ 2.0 1.4
Comment(a):
1. Teachers possessing a M.S.+ or M.A.+ value this consultantactivity to be more important than teachers within otherdegree status groups.
When the teachers we e asked, " ow important is it to you to
have a consultant availabl6 aett.lt the teacher to employ teaching
techniques and clasercom management strategies that foster regular,
active student interaction with the materials of the curriculum?",
they responded on the following continuum:
1 2 3 4 5 6 7
Very importantG I.
Unimportant
-54-
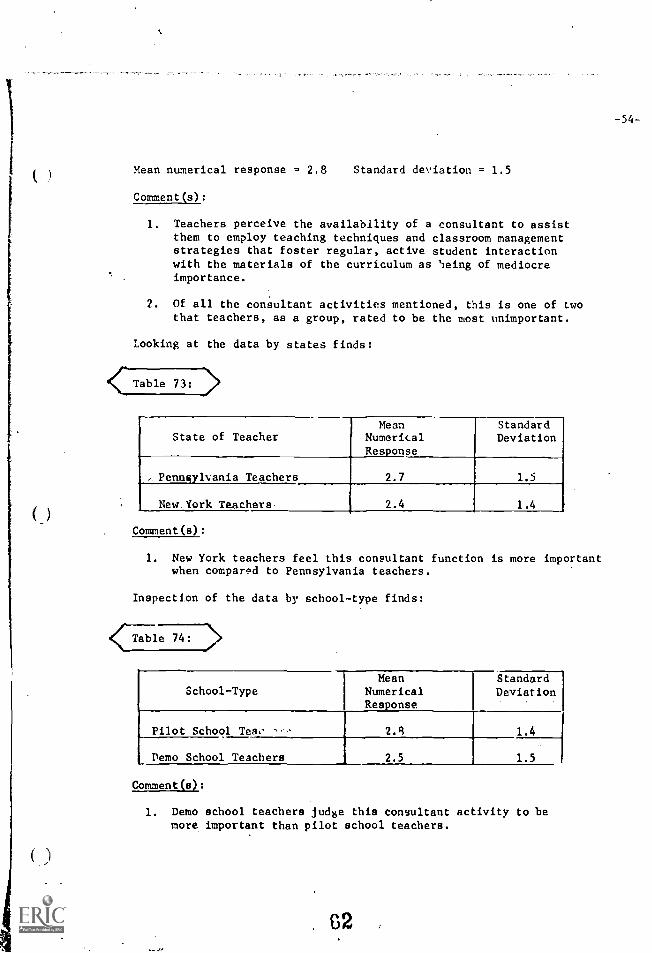
Mean numerical response = 2.8 Standard deviation = 1.5
Comment(s):
1. Teachers perceive the availability of a consultant to assistthem to employ teaching techniques and classroom managementstrategies that foster regular, active student interactionwith the materials of the curriculum as being of mediocreimportance.
2. Of all the consultant activities mentioned, this is one of twothat teachers, as a group, rated to be the most unimportant.
Looking at the data by states finds:
Table 73:
State of TeacherMean
NumericalResponse
StandardDeviation
,.Pennsylvania Teachers 2.7 1.5
New. York Teachers 2.4 1.4
Comment(s):
1. New York teachers feel this consultant function is more importantwhen compared to Pennsylvania teachers.
Inspection of the data by school-type finds:
<7a171e747>
School-TypeMean
NumericalResponse
StandardDeviation
Pilot School Tea. , 2.8
Demo School Teachers
Comment(s):
2.5
1.4
1.5
1. Demo school teachers judge this consultant activity to bemore important than pilot school teachers.
62
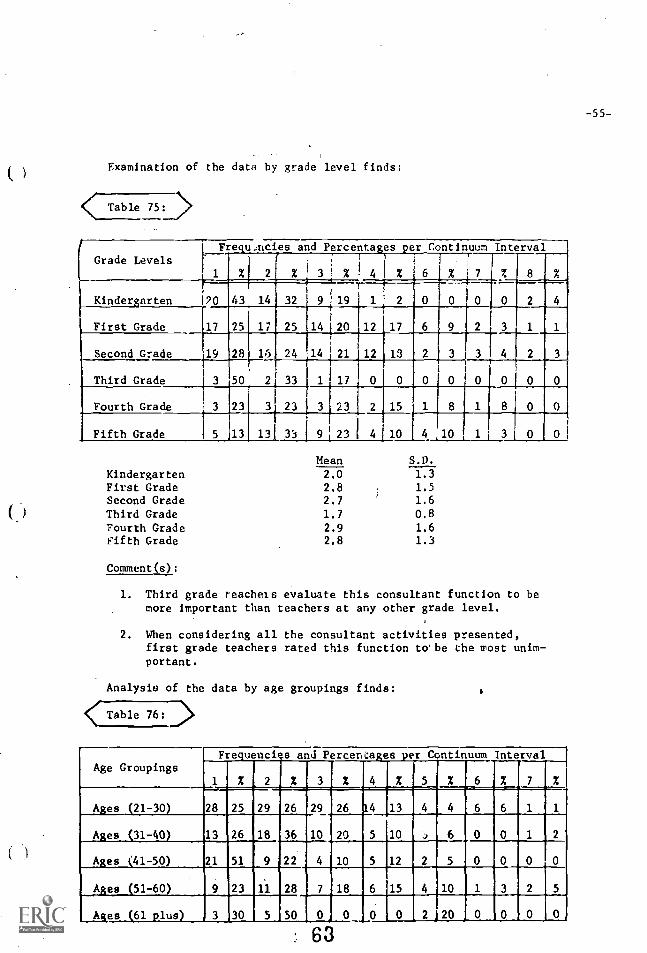
-55-
Examination of the data by grade level finds:
< Table 75:_.>
Grade LevelsFreu.mcies and Percenta:es er Continuum Interval
1
70
%
43 14 32 : 1:
i
6 % 8 %
Kindergnrten 2 0 0
First Grade 17 25 17 25 14 20 12 17 6 9 2 3 1 1
Second Grade 19 28 ló 24 14 21 12 13 2 3 3 4
Third Grade 3 50 2 33 1 0
Fourth Grade 3 ill 3 23 3 23 2 15 1 8 e 8 0 0
Fifth Grade 5 13 13 9 23 4 10 4 10 , 1 3 0 0
Mean S.D.
Kindergarten 2.0 1.3
First Grade 2.8 1.5
Second Grade 2.7 1.6
Third Grade 1.7 0.8
Fourth Grade 2.9 1.6Fifth Grade 2.8 1.3
Comment(s):
1. Third grade teachers evaluate this consultant function to bemore important than teachers at any other grade level.
2. When considering all the consultant activities presented,first grade teachers rated this function to be the most unim-portant.
Analysis of the data by age groupings finds:
< Table 76:
Age GroupingsFre.uenci s and Percenta:es er Continuum Interval
1 X 2 % 3 % 4 X 5 X 6 X__ 7 %
Ares 21-30 28 25 29 26 29 26 14 13 4 4
Ares 31-40 13 26 18 36 10 20 5 10 0
Ares '41-50) 21 51 9 22 4 10 5 12 2 5 0 0 0
Ares 51-60 28 7 18 6 15 4 10
Aes 61 .1us 3 30 5 50 0 0 0 0 2 20 0 0 0 0
63
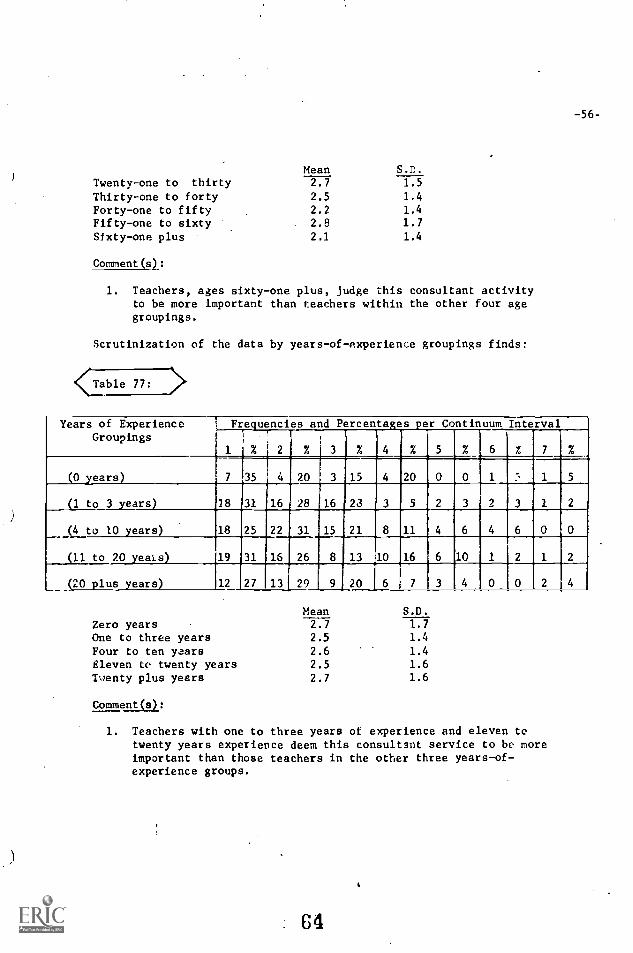
-56-
Mean S.D.
Twenty-one to thirty 2.7 1.5
Thirty-one to forty 2.5 1.4
Forty-one to fifty 2.2 1.4
Fifty-one to sixty 2.8 1.7
Sixty-one plus 2.1 1.4
Comment(s):
1. Teachers, ages sixty-one plus, judge this consultant activityto be more -Important than teachers within the other four agegroupings.
Scrutinization of the data by years-of-experience groupings finds:
<Table 77: ,)*
Years of ExperienceGroupings
_kregum1 % 2
Interval
% 3 % 4 % 5 % 6 % 7
(0 Years) 7 35 20 3 15 4 20 0 0 1 1 5
(1 to 3 years) 18 31 16 28 16 23 3 5 2 3 2
(4 to 10 years) 18 25 22 31 15 21 8 11 4 6 4 6 0 0
(11 to 20 yeas) 19 31 16 26 8 13 10 16 6 10 1 2 1 2
(20 plus years) 12 27 13 29 9 20 6 7 3 4 0 0 2 4
Mean S.D.
Zero years 2.7 1.7One to three years 2.5 1.4
Four to ten years 2.6 1.4
Eleven to twenty years 2.5 1.6
Twenty plus years 2.7 1.6
Comment(s):
1. Teachers with one to three years of experience and eleven totwenty years experience deem this consultant service to be moreimportant than those teachers in the other three years-of-experience groups.
64
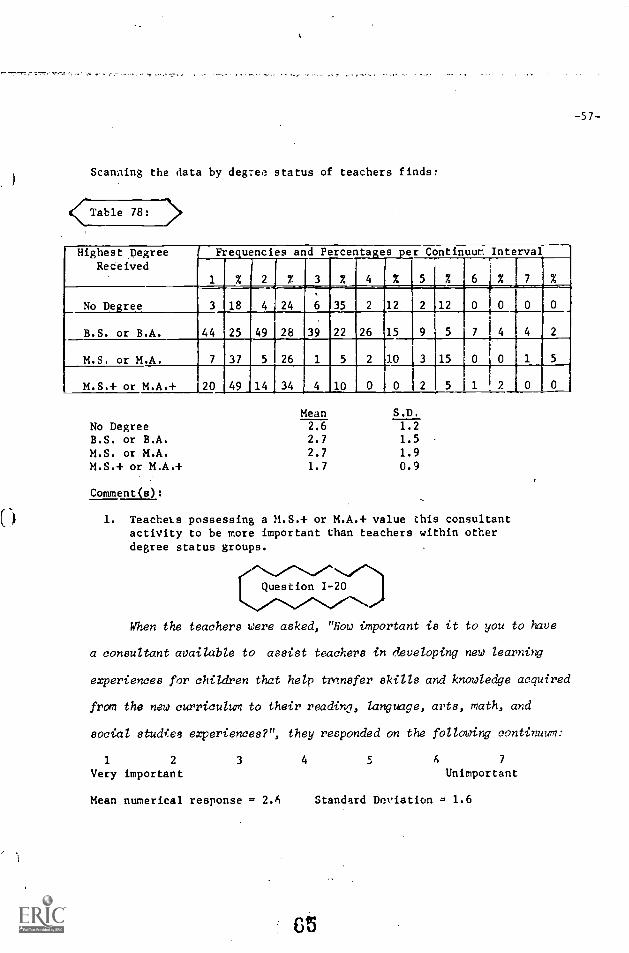
-57-
Scanning tha data by degree status of teachers finds:
Table 78: >Highest Degree
ReceivedFrequencies and
r l
Percentages
2 4
per
%
Continuum
5 1 %
Interval
% 7 %%
No Degree 3 18 4 24 6 35 2 12 2
x6
12 0 0 0 0
B.S. or B.A. 44 25 49 28 39 22 26 15 9 5 7 4 4 2
M.S. or M.A. 7 37 5 26 1 5 2 10 3 15 0 0 1 5
M.S.+ or M.A.+ 120 49 14 34 4 10 0 0 2
Mean S.D.
No Degree 2.6 1.2B.S. or B.A. 2.7 1.5
M.S. or M.A. 2.7 1.9
M.S.+ or M.A.+ 1.7 0.9
Comment(s):
1. Teachers possessing a M.S.+ or M.A.+ value this consultantactivity to be more important than teachers within otherdegree status groups.w
Question 1-20
When the teachers were asked, "How important is it to you to have
a consultant available to assist teachers in developing new learning
experiences for children that help transfer skills and knowledge acquired
from the new curriculum to their reading, language, arts, math, and
social studies experiences?", they responded on the following continuum:
1 2 3 4 5 6 7
Very important Unimportant
Mean numerical response = 2.6 Standard Deviation = 1.6
65
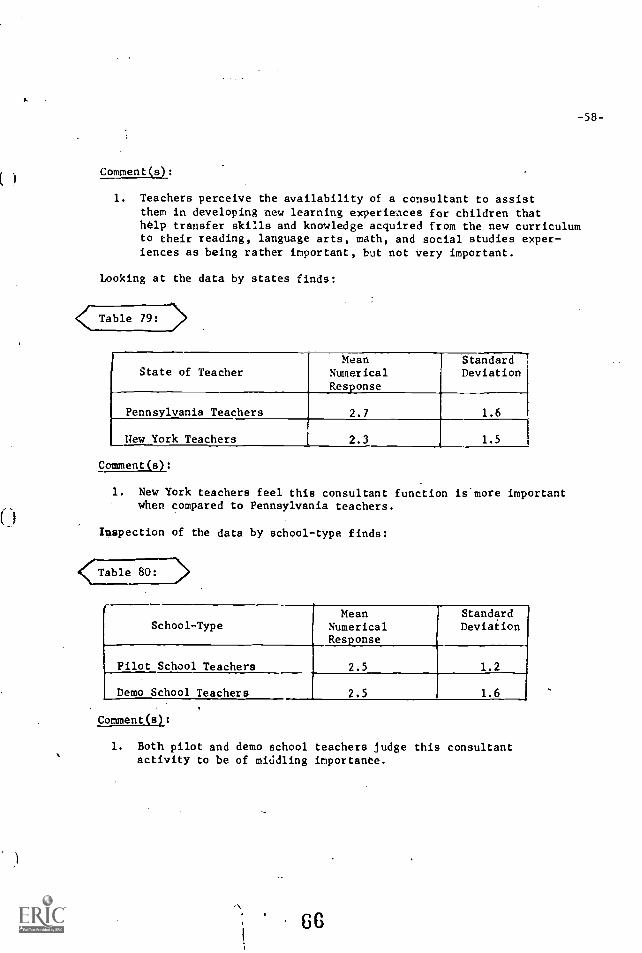
-58-
Comment(s):
1. Teachers perceive the availability of a consultant to assistthem in developing new learning experiences for children thathelp transfer skills and knowledge acquired from the new curriculumto their reading, language arts, math, and social studies exper-iences as being rather important, but not very important.
Looking at the data by states finds:
< Table 79:
State of TeacherMean
NumericalResponse
StandardDeviation
Pennsylvania Teachers 2.7 1.6
New York Teachers 2.3 1.5
Comment(s):
1. New York teachers feel this consultant function is'more importantwhen compared to Pennsylvania teachers.
Inspection of the data by school-type finds:
r______
School-TypeMean
NumericalResponse
StandardDeviation
Pilot School Teachers 2.5 1.2
Demo School Teachers 2.5 1.6
Comment(s):
1. Both pilot and demo school teachers judge this consultantactivity to be of middling importance.
66

Examination of the data by grade level finds:
<_Table 817-D>
Grade LevelsFrequencies and Percentages per Continuum Interval-1
% '
f
%
T :
I
3 % c 4 1 % 5 2 6 % 7 %
Kindergarten 22 47 10 21
t
11 23i
2 4 3 0 ,
First Grade 22 32 14 21 11 3.6 i11 16
Second Grade 25 37 13 19 12 i 18 i 8 12 3 4 4 5 3 4
Third Grade 3 50 3 50 0 0 0 0 0 0 0) 0 0 0
Fourth Grade 3 23 4 31 2 15
1
111
0
4
0 14
;
11 1 1
31
3
0
0
0
0
0
0
0
0Fifth Grade 6 li (14 39
Mean S.D.Kindergarten 2.0 1.3First Grade 2.7 1.7Second Grade 2.6 1.8Third Grade 1.5 0.6Fourth Grade 2.9 1.6
Fifth Grade 2.4 0.9
Comment(s):
1. Third grade teachers evaluate this consultant fu. ') befar more imp7irtant than teachers at any other gra.
Analysis of the data by age groupings finds:
< Table 32: >
Age GroupingsFrequencies and Percents es er Continuum Intervar--T
..,112
36 31 31 26
3
24
%
20
4
14
% 5
7
%
6
6 %4-
7----4-
%
Ages (21-30) 12 3 2 3 2
2Ages (31-40) 17 34 13 26 11 22 5 10 1 2 2 4 1
AgeJ41 -50) 21 51 8 20 9 22 1 2 2 4 0 0
Ages (51-60) 11 .8 8 21 7 18 4 10 2 5 6 15 1 3
Ages (61 plus) 5 50 2 20 1 10 1 10 1 10 0, 0
67
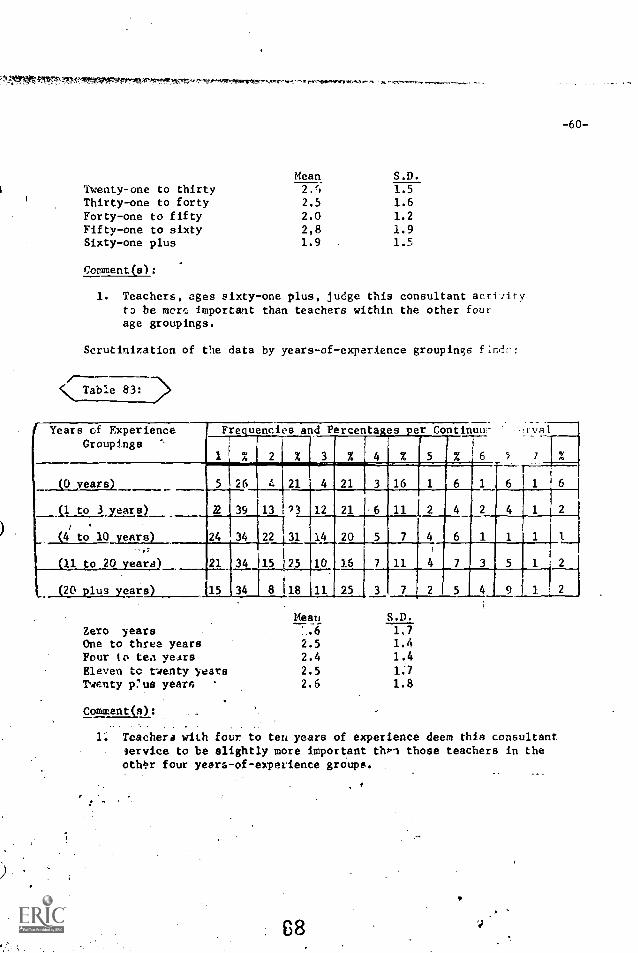
l'f!..5,1011.C.Inrroc,1
-60-
Mean S.D.
Twenty-one to thirty 2/ 1.5Thirty-one to forty 2.5 1.6
Forty-one to fifty 2.0 1.2
Fifty-one to sixty 2,8 1.9Sixty-one plus 1.9 1.5
Comment(s):
1. Teachers, ages sixty-one plus, judge this consultant activityto be mom important than teachers within the other fourage groupings.
Scrutinization of the data by years-of-experience groupings fridn:
/---Table 83:
Years of ExperienceGroupings
Frequencies and Percenta:es er Continuur ,2rval
% 2 % 3 % 4 % 5 % 6 ',
(0 years) 5 26 4 21 4 21 3 16 III 6 1
11 to 3,..ylars) 2 39 13 ?3 12 21 .6 11 e© 2
/ .
(4 to 10'yeAre) 24 34 22 31 14 20 5 7 4 6 1 1 1 1
11 to 20 yeara) 21 34 15 25 10 16 7 11 4 7 3 5
(20 plus years) 15 34 8 ,18 11 25 3 7 2
Zero yearsMean S.D.
17One to three years 2.5 1.4
Four to tea yews 2.4 1.4Eleven to twenty years 2.5 1.7
Twenty plus years 2.6 1.8
Comment(s):
Teachera with four to ten years of experience deem this consultantservice to be slightly more important then those teachers in theother four years-of-experience groups.
68
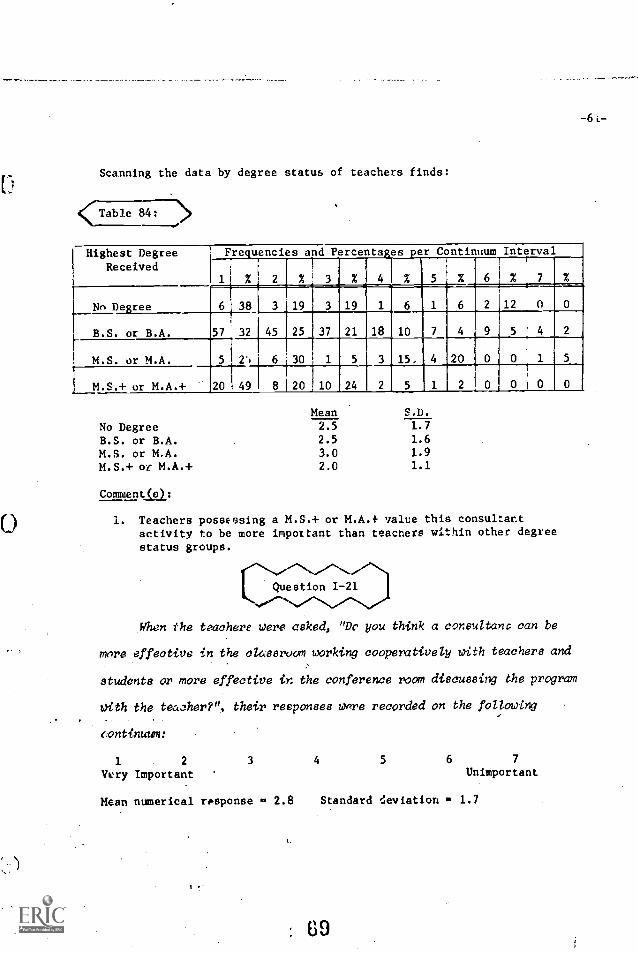
Scanning the data by degree status of teachers finds:
Highest DegreeReceived
Frequencies and Percents es per Continuum Interval
% % 3 % 6 % 7 X
Nn Degree
-,,-,
648
57 32
3 19 3 19 1 6 1 6 2 12 0 0
B.S. or B.A. 45 25 37 21 18 10 7 4 9 S 4 2
M.S. or M.A. 5 2') 6 30 1 5 3 15, 4 20 0 0 1 5
i M.S.+ or M.A.+ 20 ! 49 8 20 10 24 2 5 1 2 0
Mean S.D.
No Degree 2.5 1.7
B.S. or B.A. 2.5 1.6
M.S. or M.A. 3.0 1.9
M.S.+ or M.A.+ 2.0 1.1
Comment(s):
1. Teachers possessing a M.S.+ or M.A.f value this consultantactivity to be more important than teachers within other degreestatus groups.
Question I -21
When the teachere were asked, "Dc you think a consultant can be
more effective in the classroom working cooperatively with teachers and
students or more effective in the conference room discussing the program
with the teacher?", their responses wire recorded on the following
continuum:
1 2 3 4 5 6 7
Very Important Unimportant
Mean numerical response 1.. 2.8 Standard deviation - 1.7
69
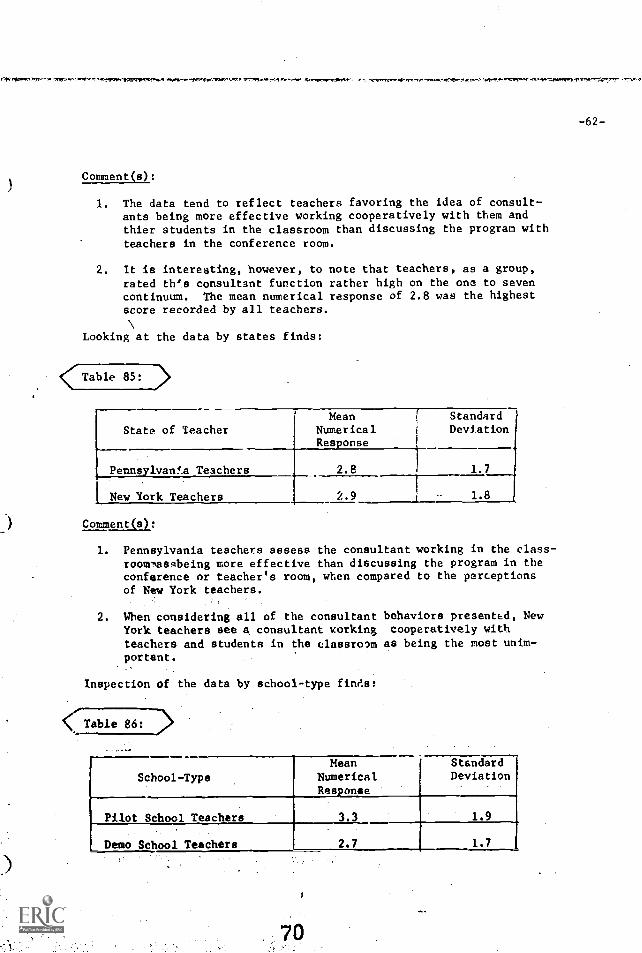
ri."^OPPM - AVIR?".
Comment(s):
-n, , ww,--ret -"raw-
-62-
1. The data tend to reflect teachers favoring the idea of consult-ants being more effective working cooperatively with them andthier students in the classroom than discussing the program withteachers in the conference room.
2. It is interesting, however, to note that teachers, as a group,rated th's consultant function rather high on the one to sevencontinuum. The mean numerical response of 2.8 was the highestscore recorded by all teachers.
Looking at the data by states finds:
<Table 85:
State of Teacher
Pennsylvar0A Teachers
New York Teachers
Comment(s):
MeanNumericalResponse
2.8
Standard '
Deviation
1.7
2.9 1.8
1. Pennsylvania teachers assess the consultant working in the class-reourAassbeing more effective than discussing the program in theconference or teacher's room, when compared to the perceptionsof New York teachers.
2. When considering all of the consultant behaviors presented, NewYork teachers see A consultant working cooperatively withteachers and students in the classroom as being the most unim-portant.
Inspection of the data by school-type fincls:
< Table 86: >
School-TypeMean
Numericali Response
3.3
StandardDeviation
1.9Pilot School Teachers
Demo School Teachers 2.7 1.7
70
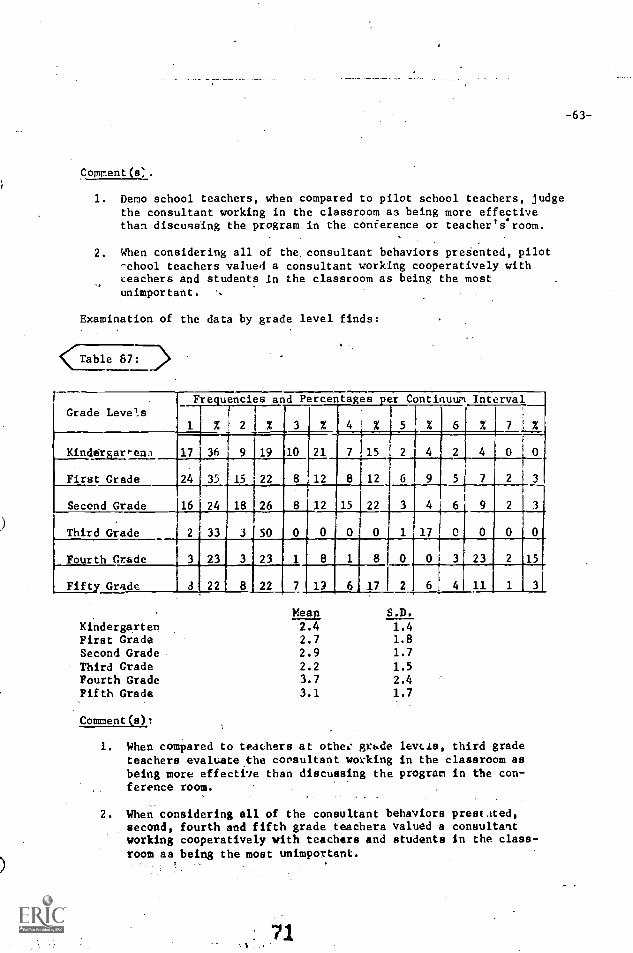
Comment (s;
-63-
1. Demo school teachers, when compared to pilot school teachers, judgethe consultant working in the classroom as being more effectivethan discussing the program in the conference or teacher's room.
2. When considering all of the, consultant behaviors pregented, pilot'-chool teachers valued a consultant working cooperatively withLeachers and students in the classroom as being the mostunimportant. ...
Examination of the data by grade level finds:
<Table 677)
r-
Grade LevelsFrequencies and Percentages
3 % 4
per
%
Continuum
5 % 6
Interval
% 7 ! %IA % 2
i
%
Kindergarf-ena 17 36 9 19 10 21 7 15
First Grade 24 35 15 22 8 12 8 12 9 11111 2 3
Second Grade 16 24 18 26 18 f 12 15 22 3 4
Third Grade 2 33 3 50 0 0 0 0 1 17 0 0 0 0
Fourth Grade 3 23 23 1 8 1 8 0 0 15-
Fifty Grade 8 8 22 7 19 6 17 6 4 11 1
Meap S.D.
Kindergarten 2.4 1.4First Grade 2.7 1.8
Second Grade 2.9 1.7
Third Grade 2.2 1.5Fourth Grade 3.7 2.4
Fifth Grade 3.1 1.7
Comment (s),:
1. When compared to teachers at other grade levels, third gradeteachers evaluate the consultant working in the classroom asbeing more effective than discussing the program in the con-ference room.
2. When considering all of the consultant behaviors preseted,second, fourth and fifth grade teachers valued a consultantworking cooperatively with teachers and students in the class-
room as being the most unimportant.
71
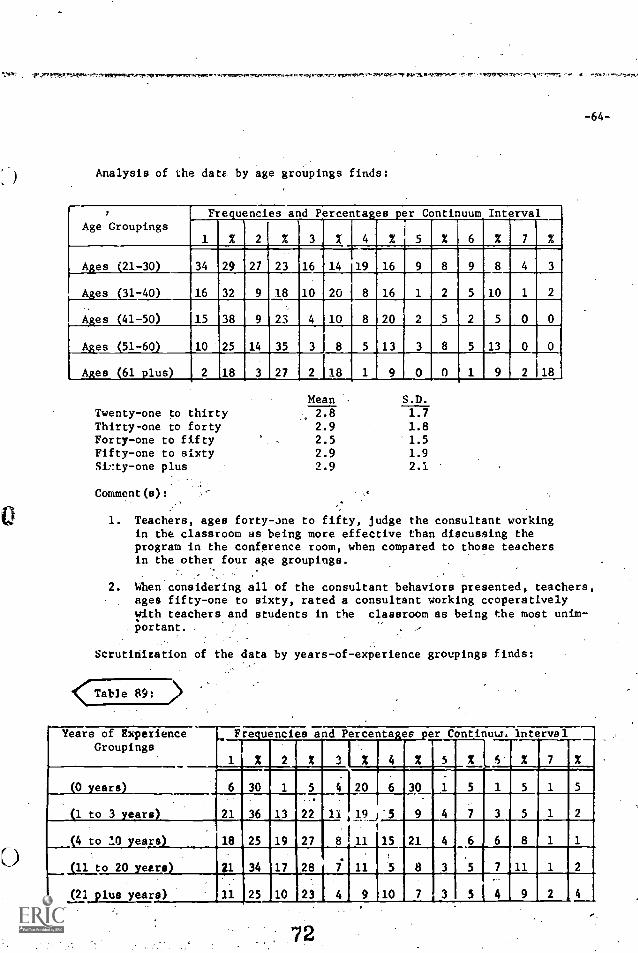
. "S"...7"1%
-64-
Analysis of the date by age groupings finds:
Age GroupingsFrequencies and Percentages per Continuum Interval
1 % 2 % 3 X 4 % 5 % 6 2 7 %
Ages (21-30) 34 29 27 23
a--16 14 119 16 9 8 9 8 4 3
Ages (31-40) 16 32 9 18 10 20 8 16 1 2 5 10 1 2
Ages (41-50) 15 38 9 23 4 10 8 20 2 5 2 5 0 0
Ages (51-60) 10 25 14 35 3 8 5 13 3 8 5 13 0
Ages (61 plus) 2 18 3 27 2 18 1 9 0 0 1 9 2 18
Mean S.D.
Twenty-one to thirty 2.8 1.7Thirty-one to forty 2.9 1.8Forty-one to fifty 2.5 1.5Fifty-one to sixty 2.9 1.9Si::ty -one plus 2.9 2.1
Comment(s):
1. Teachers, ages forty-ane to fifty, judge the consultant workingin the classroom as being more effective than discussing theprogram in the conference room, when compared to those teachersin the other four age groupings.
2. When considering all of the consultant behaviors presented, teachers,ages fifty-one to sixty, rated a consultant working cooperativelywith teachers and students in the classroom as being the most unim-portant.
Scrutinieation of the data by years-of-experience groupings finds:
<Table 89:
Years of ExperienceGroupings
Fre.uencies and Percenta:es er ContinuuN Interval
1 % 2 % 3 % 4 % 5 % 5 % 7 %
0 ears 6 1111 1 5 4 20 6 30 1 5 1 5 1 5
(1 to 3 years) 21 36 13 22 11 19±5I
11
9 4 7 3
Ye to 10 years) 18 25 19 27 8 15 21 4 6 6 8 1 1
(11 to 20 ears 21 34 17 28 7 11 5 8 3 5 7 11
(21 plus years) 11 25 10 23 4 9 10 7 3 5 4 9
72
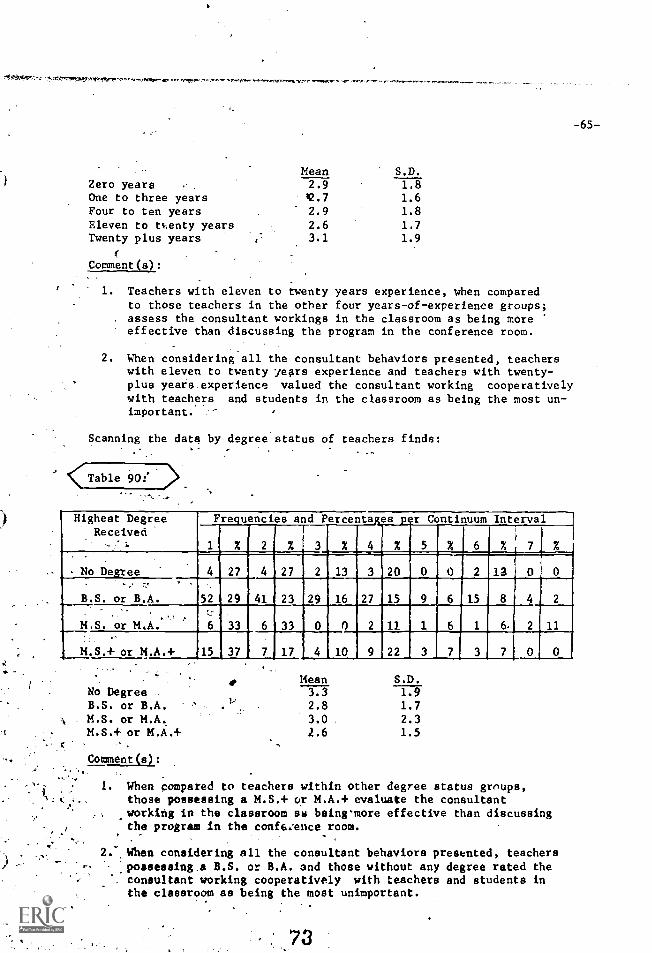
a-morn.,
Mean S.D.Zero years . 2.9 1.8One to three years #12.7 1.6Four to ten years 2.9 1.8Eleven to ti,enty years 2.6 1.7Twenty plus years 3.1 1.9
Comment(s):
1. Teachers with eleven to twenty years experience, when comparedto those teachers in the other four years-of-experience groups;assess the consultant workings in the classroom as being moreeffective than discussing the program in the conference room.
2. When considering all the consultant behaviors presented, teacherswith eleven to twenty years experience and teachers with twenty-plus years experience valued the consultant working cooperativelywith teachers and students in the classroom as being the most un-important.
Scanning the data by degree status of teachers finds:
-.
<Table 90:
Highest DegreeReceived
Frequencies and Percentages p r Continuum Interval
1 % 2 % 3 % 4 % 5 % 6 % 7 %
- No Degree 4 27 4 27 2 13 3 20 0 0 2 13 0 0,
.
B.S. or B.A. 52 29 41 23 29 16 27 15 9 6 15 8 4 2
M.S. or M.A. 6 33 6 33 0 0 2 11 1 6 1 6. 2 11
) M.S.+ or M.A.+ 015 37 , 7 17 ) 4 10 9 22 3 7 3 7 0 0
Mean S.D.No Degree 3.3 1.9B.S. or B.A. 2.8 1.7
M.S. or M.A. 3.0 2.3M.S.+ or M.A.+ 2.6 1.5
Comment(s):
1. When compared to teachers within other degree status groups,those possessing a M.S.+ or M.A.+ evaluate the consultantworking in the classroom as being more effective than discussingthe program in the conftilence room.
2.' When considering all the consultant behaviors presented, teachers.possessing.a B.S. or B.A. and those without any degree rated theconsultant working cooperatively with teachers and students inthe classroom as being the most unimportant.
73
-65-

When the teachers were asked, "Do you think the consultant's
time is used more effectively when the teachers are teaching Science --
A Process Approach or when they are not teaching Science--A Process
Approach on the clay he is working in their school?", they responded
on the following continuum:
1 2
More effectivewhen teachingS-APA
3
-66-
4 5 6 7
More effective whennot teaching S -APA.
Mean numerical response = 2.3 Standard deviation = 1.6
Comment(s):
1. The data tend to reflect teachers favoring the notion ofconsultants being more effective when they are teachingScience--A Process Approach than when they are not teachingScience--A Process Approach on the day he is working intheir school.
Looking at the data by states finds:
q(J:able 91: i>
State of TeacherMean
NumericalResponse
StandardDeviation
Pennsylvania Teachers 1.9 1.3
New York Teachers 2.3 1.6
Comment(s):
1. Pennsylvania teachers, when compared to New York teachers, assessgreater effectiveness of utilization of a consultant's time
Whet: they.are teachinglAUnce-74 Prc,Pess.Acooroach than when theyare not teaching Science-4 Process Approitt: on his visitation day.
74

0
0
Inspection of the data by school-type finds:
Talde 92: d>
School-TypeMean
NumericalResponse
StandardDeviation
Pilot School Teachers 2.7 1.7
Demo School Teachers 1.9 1.4
Comment(s).
1. When compared to pilot school teachers, demo school teachersregard higher the greater effectiveness of consultant utilizationwhen they are teaching Science--A Process Approach than when theyare not teaching Science--A Process Approach on visitation days.
2. When considering all of the consultant behaviors presented, demoschool teachers see the utilization of a consultant's time whenScience--A Process Approach teaching occurs as being the mostimportant.
Examination of the data by grade level finds:
< Table 93:
Grade LevelsFrequencies and Percentages
3 % 4
per Continuum
X 5 X 6
Interval
X 7 X1 % 2 %
Kindergarten 27 [ 57 12 26 3 3
First Grade 39 57 13 19 6 8 7 10 1 1 1 1
Second Grade 36 154_ 8 12 12 18 8 12 0 0 1 1
. ,
Third Grade 1 2 33 4 67 0 0 0 0 0 0 0 0 0 0
Fourth Grade 3 23 4 31 0 0 2 15 1 1 8
-..
1 8 2 15
Fifth Grade 9 26 14 40 4 11 5 14 2 6 1
75'
-67-
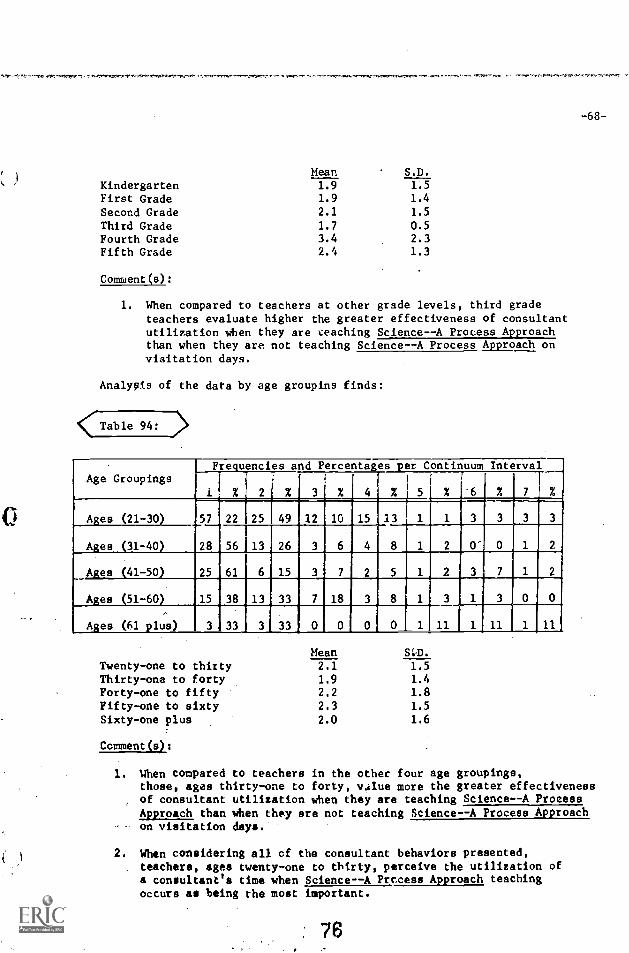
-68-
Mean S.D.
Kindergarten 1.9 1.5
First Grade 1.9 1.4
Second Grade 2.1 1.5
Third Grade 1.7 0.5
Fourth Grade 3.4 2.3Fifth Grade 2.4 1.3
Comment(s):
1. When compared to teachers at other grade levels, third gradeteachers evaluate higher the greater effectiveness of consultantutilization when they are reaching Science--A Process Approachthan when they are not teaching Science--A Process Approach onvisitation days.
Analysts of the data by age groupins finds:
< Table 94: >
Age GroupingsFrequencies and Percentages per Continuum Interval
1 2 2 2 3 X 4 2 5 2 6 X 7 2
Ages (21-30) 57 22 25 _49 12 10 15 13 1 1 3 3 3 3
Ages (31-40) 28 56 13 26 3 6 4 8 1 2 0' 0 1 2
Ages (41-50) 25 61 6 15 3 7 2 5 1 2 3 7 1 2
Ages (51-60) ,15 38 13 33 7 18 3 8 1 3 1 3 0 0
Ages (61 plus) 3 33 3 33 0 0 0 0 1 11 1 11 1 11
Mean S:D.
Twenty-one to thirty 2.1 1.5
Thirty-one to forty 1.9 1.4Forty-one to fifty 2.2 1.8Fifty-one to sixty 2.3 1.5
Sixty-one plus 2.0 1.6
Comment(s):
1. When compared to teachers in the other four age groupings,those, ages thirty-one to forty, value more the greater effectivenessof consultant utilization when they are teaching Science--A ProcessApproach than when they are not teaching Science--A Process pproachon visitation days.
2. When considering all cf the consultant behaviors presented,teachers, ages twenty-one to thirty, perceive the utilization ofa consultant's time when Science--A Prccess Approach teachingoccurs as being the most important.
76
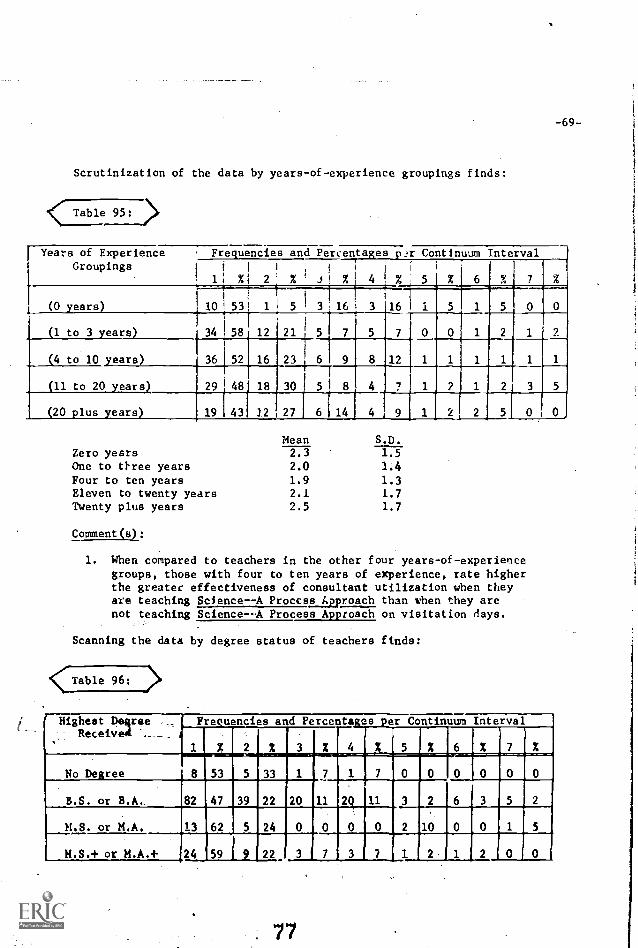
-69-
Scrutinization of the data by years-of-experience groupings finds:
Table 95: >
Years of ExperienceGroupings
Frequencies and Percentages p.!r Continuum Interval
1
1, X
Iiiji2 X` J a % i 4 1 X 5 % 6 .
(0 ears 10 53 1 5 1 3 I 16 1 3 16
1 to 3 ears) 34 58 12
i
21 5 7 5 7 0 0 1 2 1 .
4 to 10 years) 36
29i 48
16
18
23
30 5 8
8
4
12
11 to 20 years)
20 .1us ears) 19 43 12 27 6 14 4 9 1 2
Mean S.D.Zero years 2.3 1.5One to tFree years 2.0 1.4Four to ten years 1.9 1.3Eleven to twenty years 2.1 1.7Twenty plus years 2.5 1.7
Comment(s):
1. When compared to teachers in the other four years-of-experiencegroups, those with four to ten years of experience, rate higherthe greater effectiveness of consultant utilization when theyare teaching Science - -A Process Approach than 'Olen they arenot teaching Science-A Process Approach on visitation days.
Scanning the data by degree status of teachers finds:
< Table 96: >Highest Degree
Receivea -.__Frequencies and Percenta:es er Continuum Interval
1
.
X 2
1
X 3 X 4Mg 6 X 7 X
No Degree 8 53 5 33 1 7 1 7 0 0 0 0 0 0
B.S. or B.A. 82 47
62
39
5
22
24
20
0
11
0
2q
0
11
0
3
2
2
10
6
0
3
0
5
1
2
5M.S. or M.A. 13
M.S.+ or M.A.+ 24 59 9 22 3, 7 3 7 1 2 1 2 0 0
77
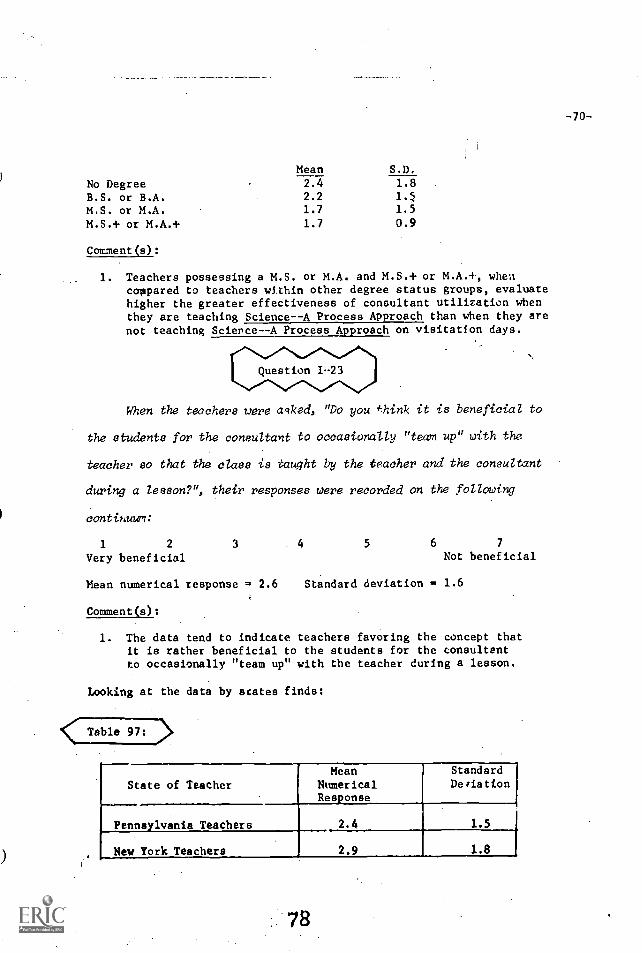
-70-
Mean S.D.
No Degree 2.4 1.8
B.S. or B.A. 2.2 1.5
M.S. or M.A. 1.7 1.5
M.S.+ or M.A.+ 1.7 0.9
Comment(s):
1. Teachers possessing a M.S. or M.A. and M.S.+ or M.A.4, whencoppared to teachers within other degree status groups, evaluatehigher the greater effectiveness of consultant utilization whenthey are teaching Science--A Process Approach than when they arenot teaching Science - -A Process Approach on visitation days.
When the teachers were agked, "Do you 4hink it is beneficial to
the students for the consultant to occasionally "team up" with the
teacher so that the class is taught by the teacher and the consultant
during a lesson?", their responses were recorded on the following
continuum:
1 2 3 4 5 6 7
Very beneficial Not beneficial
Mean numerical response 2.6 Standard deviation =, 1.6
Comment(s):
1. The data tend to indicate teachers favoring the concept thatit is rather beneficial to the students for the consultantto occasionally "team up" with the teacher during a lesson.
Looking at the data by states finds:
< Table 977)
State of TeacherMean
NumericalResponse
2.4
StandardDeviation
1.5Pennsylvania Teachers
New York Teachers 2.9 1.8
78
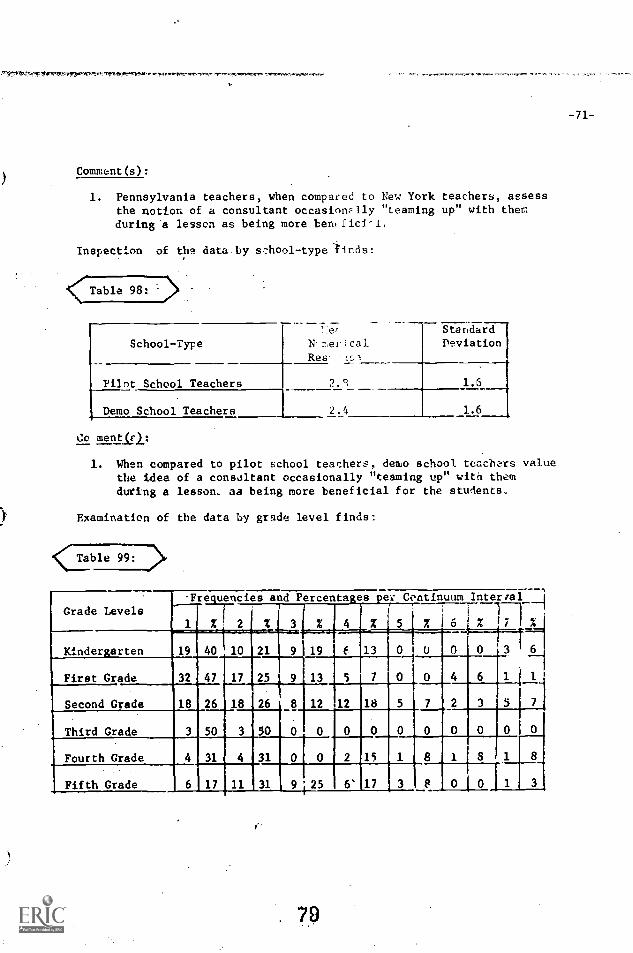
45,14",,IIvrrtor-rvt,
Comment(s):
-71-
1. Pennsylvania teachers, when compared to New York teachers, assessthe notion of a consultant occasionlly "teaming up" with thenduring a lesson as being more bentficii.
Inspection of tha data by 87:110°1-type finds:
Table 98: >
School-Type7:er
34, :em cal
Res- is
Pilot School Teachers
Demo School Teachers 2.4
Peviation
1.5
1.6
Co mentkl:
1. When compared to pilot school teachers, demo school teachers valuethe idea of a consultant occasionally "teaming up" with themduring a lesson. as being more beneficial for the students.
Examination of the data by grade level finds:
(Table 99:
Grade Levels-Frequencies and Percenta es e.: Continuum Interial
1 % 2 % 3 % Z 5 % ' % 7 %
Kindergarten 19 40 10 21 9 19 f 13 0 U 0
1First Grade 32 47 17 25 13 5 7 0 0 4 1
Second Grade 18 26 18 26 8 12 12 18 5 7 2 3 5
Third Grade 50 3 30 0 0 0 0 0 0 0 0 0
Fourth Grade II 31 4 31 0 0 2 15 1 8 1 8 1 8
Fifth Grade 17 11 31 9 25 6' 17 3 F 0 0 1 3
. 7.9
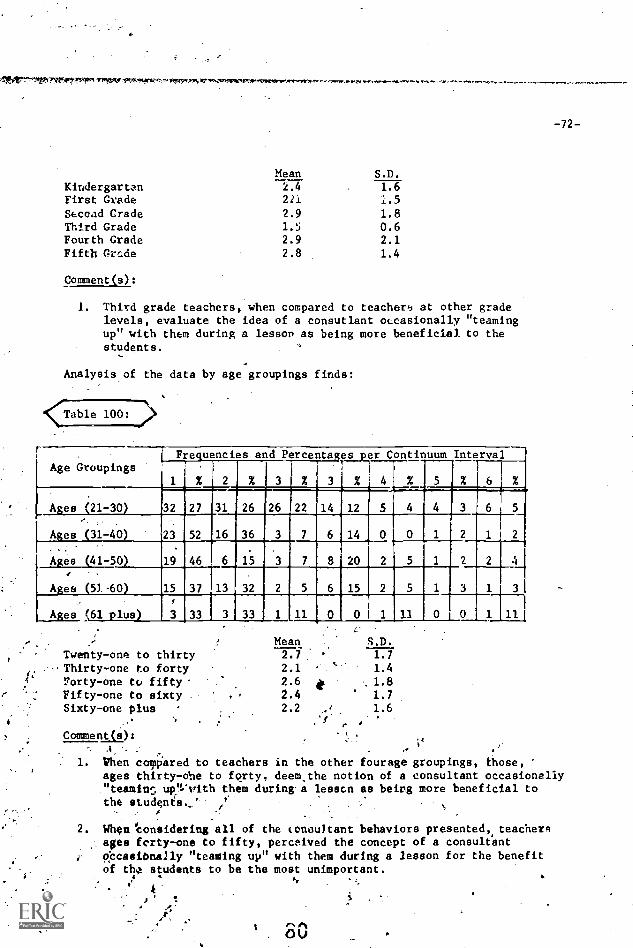
'ItYrrtMiV007rkrgg5,9 Itr.W.VINetr
Mean S.D.Kindergarten 2.4 1.6First Grade 221 /.5
Seccad Grade 2.9 1.8Third Grade 1.5 0.6Fourth Grade 2.9 2.1Fifth Grade 2.8 1.4
Comment(s):
1. Third grade teachers, when compared to teacher-s at other gradelevels, evaluate the idea of a consutlant occasionally "teamingup" with them during a lesson as being more beneficial to thestudents.
Analysis of the data by age,groupings finds:
Age GroupingsFrequencies and Percentages per
%
Continuum
4 % 5
Interval
2 6
--I
%1 % 2 % 3 2
.
3
Ages (21-30) 32 27 31 26 26 22 14 12 5 4
Ages 131-40) 23
19
52
46
16
6
36
15
3
3
-y
7
7
6
8
14
20
0/
2 5 1 2 2 4
. ...
Ages (41-50). ,
Ages (51 -60) 15 37 13 32 2 5 6 15
1 Ages (61 plus) 3 33 3 33 1 11 0 0
/
1 11 0 0 1 11
MeanTwenty-one to thirty 2.7
Thirty-one to forty 2.1
Vorty-one to fifty 2.6Fifty-one to sixty 2.4Sixty-one plus 2.2
Comment a):
it
S.D.
1.7
1.4
1.81.71.6
-72-
1. Wen compared to teachers in the other fourage groupings, those,ages thirty-ohe to fgrty. deem.the notion of a consultant occasionally"teamins up!Vvith them duringa lesscn as being more beneficial tothe students,: /'
2. When considering all of the tonaultant behaviors presented, teacherRages forty-one to fifty, perceived the concept of a consultantOcasiOnally "teaming pp" with them during a lesson for the benefitof tho students to be the most unimportant.
-U
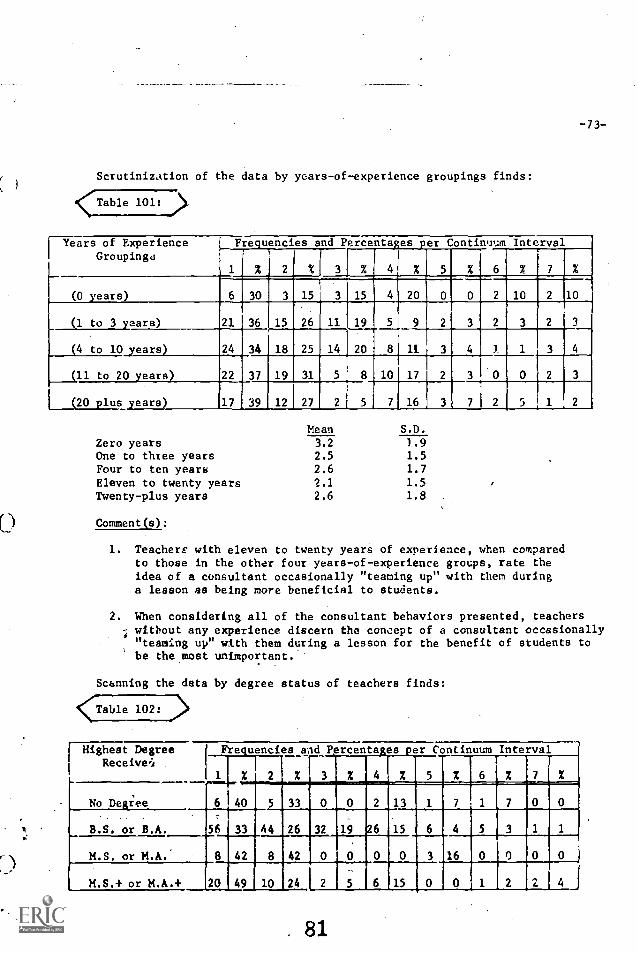
-73-
Scrutinization of the data by years-of-experience groupings finds:
Table 101:
Years of ExperienceGroupings
Frequencies and Percentages per Continuum Interval
% 2 %
r
3 % 4 % 5 % 6 % 7 %
(0 years) 6 30 3 15 3 15 4 20 0 0 2 10 2 10
(1 to 3 years) 21
.
36 15 26 11 19 5 9 2 3 2 3 2 3
(4 to 10_years) 24 34 18 25 14 20 8 11 3 4 .
(11 to 20 years) 22 37 19 31 5 8 10 17 3 0 0
(20 plus years) 17 39 12 27 2 5 7 16 3 7 2 5 1 2
Zero yearsMean S.D.
3.2 1.9One to three years 2.5 1.5Four to ten years 2.6 1.7
Eleven to twenty years ?.1 1.5Twenty-plus years 2.6 1.8
Comment(s):
1. Teachers with eleven to twenty years of experience, when comparedto those in the other four years-of-experience groups, rate theidea of a consultant occasionally "teaming up" with them duringa lesson as being more beneficial to students.
2. When considering all of the consultant behaviors presented, teacherswithout any experience discern the concept of a consultant occasionally"teaming up" with them during a lesson for the benefit of students tobe the most unimportant.'
Scanning the data by degree status of teachers finds:
Highest DegreeReceive's
Frequencies aAd Percentages per Continuum Interval
1 % 2 % 3 % 4 % 5 X 6 =ifix=d=i% 7 %
No Degree 6 40 5 33 0 0 2 13 1 7 1 7 0 0
B.S. or B.A. 56 33 44 26 32 19 26 15 6 4 5 3 1
M.S. or M.A. 8 42 8 42 0 0 0 0 3 16
M.S.+ or M.A.+ 20 49 10 24 2 5 6 15
81
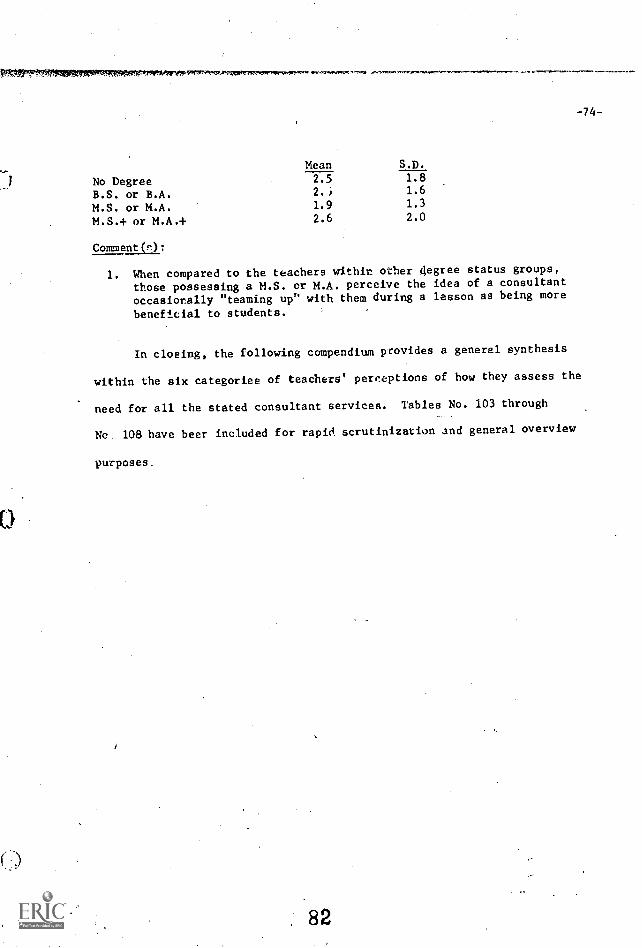
-74-
Mean S.D.
No Degree 2.5 1.8
B.S. or B.A. 2.) 1.6
M.S. or M.A. 1.9 1.3
M.S.+ or M.A.+ 2.6 2.0
Comment(r):
1. When compared to the teachers within other degree status groups,
those possessing a M.S. or M.A. perceive the idea of a consultant
occasionally "teaming up" with them during a lesson as being more
benef.icial to students.
In cloeing, the following compendium provides a general synthesis
within the six categoriee of teachers' perceptions of how they assess the
need for all the stated consultant services. Tables No. 103 through
Nc 108 have beer included for rapid scrutinization and general overview
purposes.
82
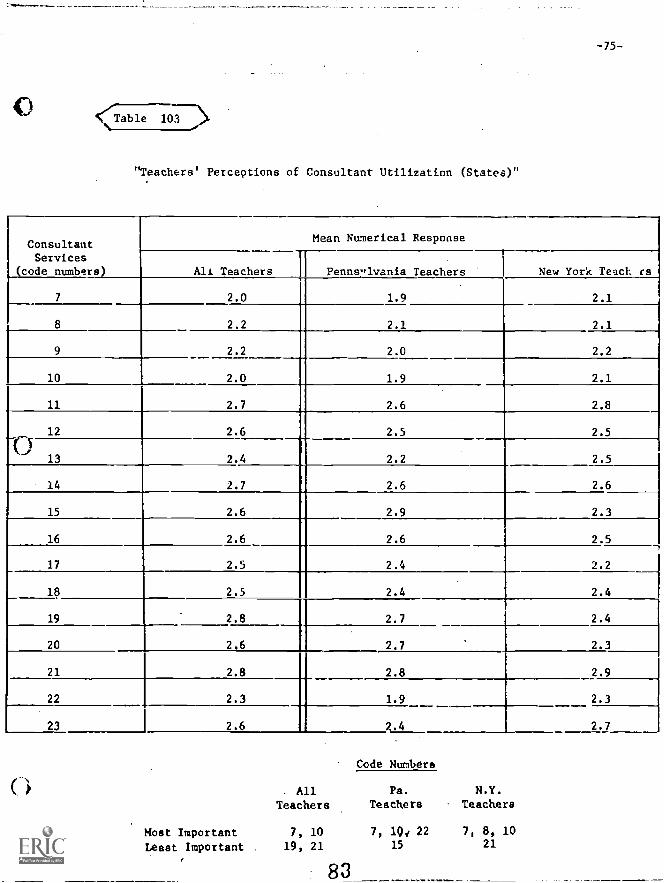
0
"Teachers' Perceptions of Consultant Utilization (States)"
-75--
ConsultantMean Numerical Response
Services(code numbers) All Teachers Penns"lvania Teachers New York Teach rs
7 2.0 1.9 2.1
8 2.2 2.1 2.1
9 2.2 2.0 2.2
10 2.0 1.9 2.1
11 2.7 2.6 2.8
12 2.6 2.5 2.5'i
13 2.4 2.2 2.5
14 2.7 2.6 2.6
15 2.6 2.9 2.3
16 2.6 2.6 2.5
17 2.5 2.4 2.2
18 2.5 2.4 2.4
19 2.8 2.7 2.4
20 2.6 2.7 2.3
21 2.8 2.8 2.9
22 2.3 1.9 2.3
n 2.6 2.4 2.7
Most Important
. AllTeachers
7, 10
Least Important . 19, 21
83
Code Numbers
Pa.
TeachersN.Y.
Teachers
7, lQt 22 7, 8, 1015 21
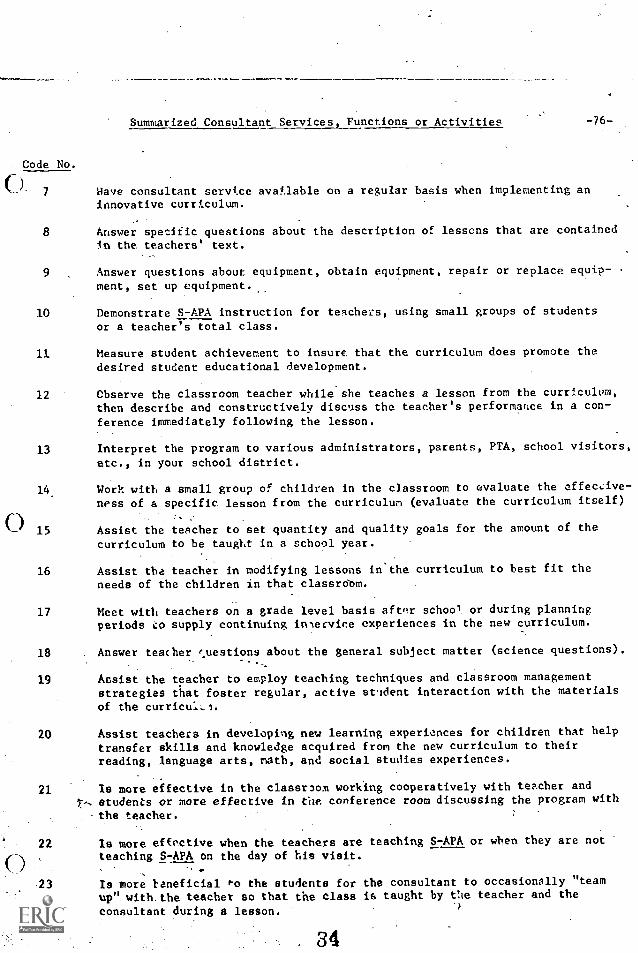
Code No.
(I). 7
Summarized Consultant Services, Functions or Activities -7b-
Nave consultant servi.ce avanable on a regular basis when implementing aninnovative curriculum.
8 Answer specific questions about the description of lessons that are containedin the teachers' text.
9 Answer questions about equipment, obtain equipment, repair or replace equip-
ment, set up equipment.
10 Demonstrate S-APA instruction for teachers, using small groups of students
or a teacher's total class.
11 Measure student achievement to insure that the curriculum does promote thedesired student educational development.
12 Observe the classroom teacher while she teaches a lesson from the curriculum,then describe and constructively discuss the teacher's performance in a con-ference immediately following the lesson.
13 Interpret the program to various administrators, parents, PTA, school visitors,
etc., in your school district.
14. Work with a small group of children in the classroom to evaluate the effec,:ive-ness of a specific lesson from the curriculum (evaluate the curriculum itself)
(I) 15 Assist the teacher to set quantity and quality goals for the amount of thecurriculum to be taught in a school year.
16 Assist the teacher in modifying lessons in'the curriculum to best fit theneeds of the children in that classroom.
0
17 Meet with teachers on a grade level basis aft(tr school, or during planningperiods supply continuing inlecvice experiences in the new curriculum.
18 Answer teacher questions about the general subject matter (science questions).
19 Assist the teacher to employ teaching techniques and classroom managementstrategies that foster regular, active ancient interaction with the materialsof the curricul-1.
20 Assist teachers in developing new learning experiences for children that helptransfer skills and knowledge acquired from the new curriculum to theirreading, language arts, math, and social studies experiences.
21 Is more effective in the classroom working cooperatively with teacher andstudents or more effective in the conference room discussing the program with
the teacher.
22 Is more effective when the teachers are teaching S-APA or when they are notteaching S-APA on the day of his visit.
23 Is more teneficial Po the students for the consultant to occasionally "team
up" with the teacher so that the class is taught by Cie teacher and the
consultant during a lesson.
34
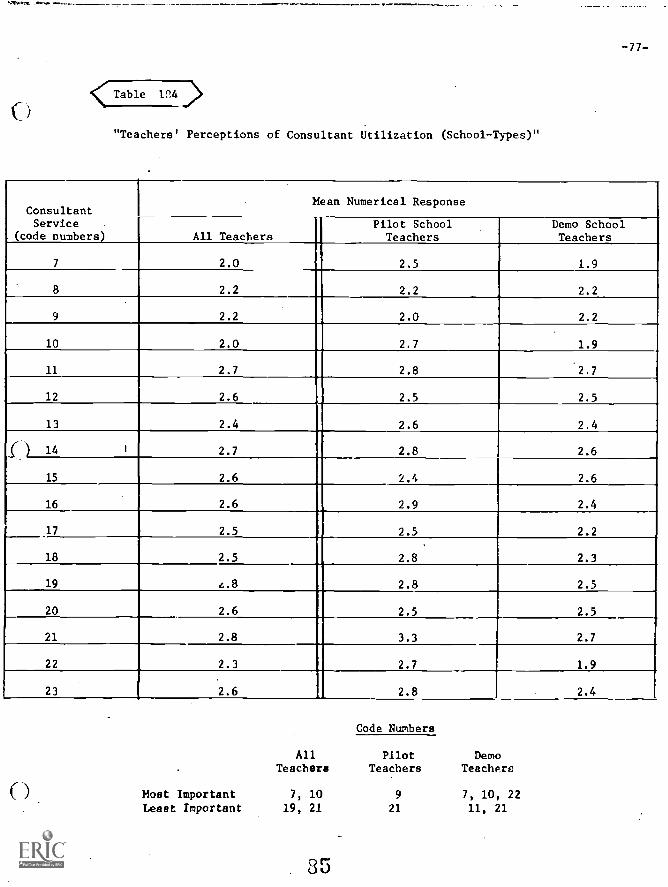
hac
Table 12,4 .s>
"Teachers' Perceptions of Consultant Utilization (School-Types)"
-77-
ConsultantService
(code numbers)
Mean Numerical Response
All TeachersPilot SchoolTeachers
Demo SchoolTeachers
7 2.0 2.5 1.9
8 2.2 2.2 2.2
9 2.2 2.0 2.2
10 2.0 2.7 1.9
11 2.7 2.8 2.7
12 2.6 2.5 2.5
13 2.4 2.6 2.4
f) 14 2.7 2.8 2.6
15 2.6 2.4 2.6
16 2.6 2.9 2.4
17 2.5 2.5 2.2
18 2.5 1 2.8 2.3
19 4.8 2.8 2.5
20 2.6 2.5 2.5
21 2.8 3.3 2.7
22 2.3 2.7 1.9
23 2.6 II 2.8 2.4
0
Code Numbers
All Pilot DemoTeachers Teachers Teachers
Most Important 7, 10 9 7, 10, 22Least Important 19, 21 21 11, 21
35
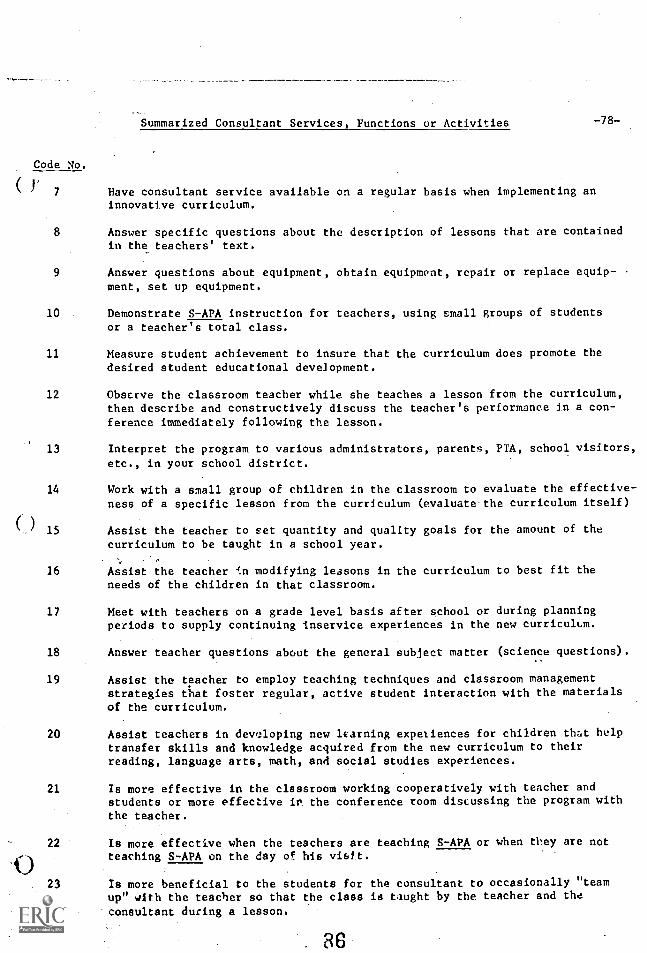
Code No.
( 7
Summarized Consultant Services, Functions or Activities -78-
Have consultant service available on a regular basis when implementing aninnovative curriculum.
8 Answer specific questions about the description of lessons that are containedin the teachers' text.
9 Answer questions about equipment, obtain equipment, repair or replace equip-ment, set up equipment.
10 Demonstrate S-APA instruction for teachers, using small groups of studentsor a teacher's total class.
11 Measure student achievement to insure that the curriculum does promote thedesired student educational development.
12 Observe the classroom teacher while she teaches a lesson from the curriculum,then describe and constructively discuss the teacher's performance in a con-ference immediately following the lesson.
Interpret the program to various administrators, parents, PTA, school visitors,
etc., in your school district.
Work with a small group of children in the classroom to evaluate the effective-ness of a specific lesson from the curriculum (evaluate the curriculum itself)
Assist the teacher to set quantity and quality goals for the amount of thecurriculum to be taught in a school year.
16 Assist the teacher 4.11 modifying lessons in the curriculum to best fit theneeds of the children in that classroom.
17 Meet with teachers on a grade level basis after school or during planningperiods to supply continuing inservice experiences in the new curriculum.
18 Answer teacher questions about the general subject matter (science questions).
19 Assist the teacher to employ teaching techniques and classroom managementstrategies that foster regular, active student interaction with the materialsof the curriculum.
20 Assist teachers in devcloping new learning expetiences for children that helptransfer skills and knowledge acquired from the new curriculum to theirreading, language arts, math, and social studies experiences.
21 Is more effective in the classroom working cooperatively with teacher andstudents or more effective in the conference room discussing the program withthe teacher.
22 Is more effective when the teachers are teaching S-APA or when they are not
0 teaching S-APA on the day of his visit.
23 Is more beneficial to the students for the consultant to occasionally "teamup" qith the teacher so that the class is taught by the teacher and theconsultant during a lesson.
36

-79-
Table 105>
"Teachers' Perceptions of Consultant Utilization (Grade Levels)"
Mean Numerical ResponseConsultantServices
_code numberq__All
TeachersKindergarten
TeachersGrade 1Teachers
Grade 2Teachers
Grade 3Teachers
grade 4Teachers
Grade 5Teachers
2.0 1.9 1.9 1.9 1.7 2.9 2.3
8 2.2 2.0 2.1 2.2 2.3 1.8 2.3
9 2.2 1.9 2.2 2.2 2.5 2.2 2.0
10 2.0 1.9 1.8 1.9 2.0 3.1 2.4
11 2.7 2.5 2.7 2.7 1.8 3.2 2.6
12 2.6 2.2 2.4 2.8 1.8 3.2 2.1
13 2.4 2.0 2.3 2.6 1.5 2.8 2.4
14 2.7 2.3 2.7 2.9 1.7 2.6 2.8
15 2.6 2.5 2.5 2.8 1.7 2.2 2.5
16 2.6 2.3 2.6 1 2.6 1.3 2.5 2.9
17 2.5 1.8 1 2.3 2.4 1.3 2.2 2.6
18 2.5 2.0 2.5 2.4 1.7 2.1 3.1
19 2.8 I 2.0 2.8 2.7 1.7 2.9 2.8
20 2.6 I 2.0 2.7 2.6 1.5 2.9 2.4
21 2.8 2.4 2.7 2.9 2.2 3.7 3.1
22 2.3 1.9 1.9 2.1 1.7 3.4 2.4
23 2.6 2.4 2.1 2.9 1.5 2.9 2.8
()
Code Numbers
All Grade Grade Grade Grade GradeTeachers Kindergarten One Two Three Four Five
Most Important 7, )O 17 30 7, 10 16, 17 8 9
Least Important 19, 21 11, 15 19 14, 21, 23 9 21 18, 21
37
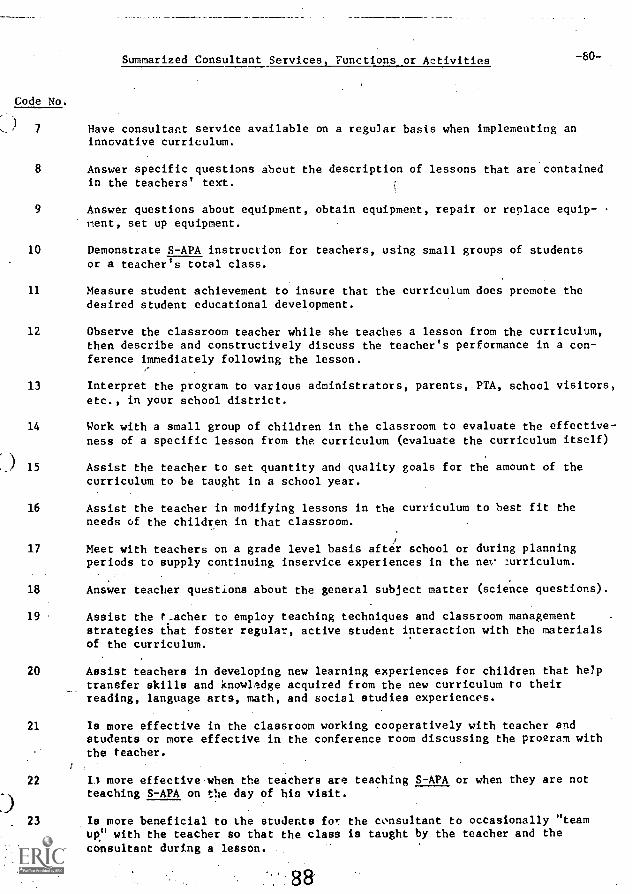
Summarized Consultant Services, Functions or Activities
Code No.
1
,., 7 Have consultant service available on a regular basis when implementing aninnovative curriculum.
8 Answer specific questions about the description of lessons that are contained
-80-
in the teachers' text.
9 Answer questions about equipment, obtain equipment, repair or replace equip-set up equipment.
10 Demonstrate S-APA instruction for teachers, using small groups of studentsor a teacher's total class.
11 Measure student achievement to insure that the curriculum does promote thedesired student educational development.
12 Observe the classroom teacher while she teaches a lesson from the curriculum,then describe and constructively discuss the teacher's performance in a con-ference immediately following the lesson.
13 Interpret the program to various administrators, parents, PTA, school visitors,etc., in your school district.
14 Work with a small group of children in the classroom to evaluate the effective-ness of a specific lesson from the curriculum (evaluate the curriculum itself)
,_) 15 Assist the teacher to set quantity and quality goals for the amount of thecurriculum to be taught in a school year.
16 Assist the teacher in modifying lessons in the curriculum to best fit theneeds of the children in that classroom.
17 Meet with teachers on a grade level basis after school or during planningperiods to supply continuing inservice experiences in the ne .7.urriculum.
18 Answer teacher questions about the general subject matter (science questions).
19 Assist the tacher to employ teaching techniques and classroom managementstrategies that foster regular, active student interaction with the materialsof the curriculum.
20 Assist teachers in developing new learning experiences for children that helptransfer skills and knowledge acquired from the new curriculum to theirreading, language arts, math, and social studies experiences.
21 Is more effective in the classroom working cooperatively with teacher andstudents or more effective in the conference room discussing the program withthe teacher.
22 13 more effective when the teachers are teaching S-APA or when they are notteaching S-APA on the day of his visit.
23 Is more beneficial to the students for the consultant to occasionally "teamup" with the teacher so that the class is taught by the teacher and theconsultant during a lesson.
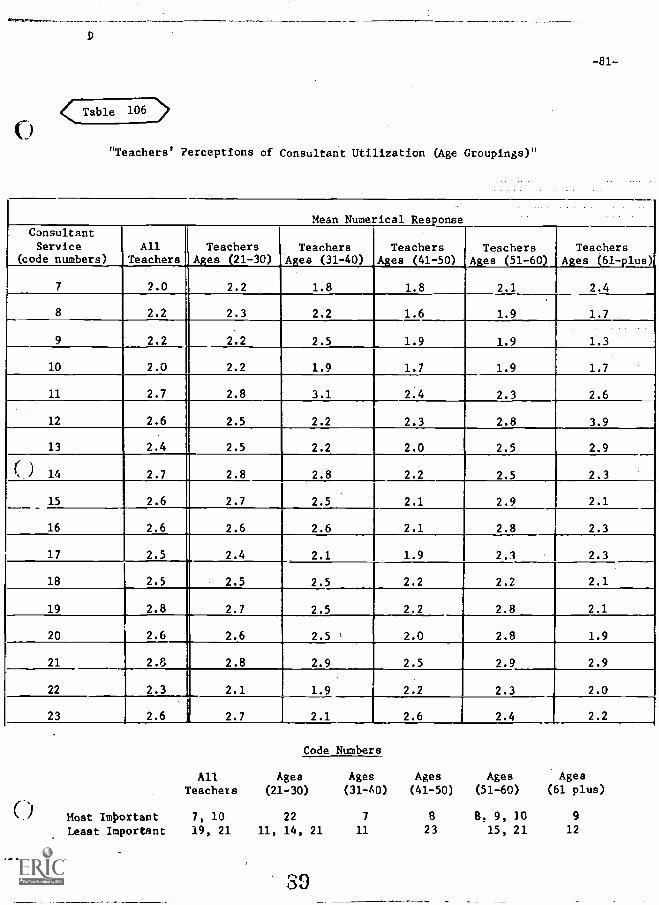
< Table 106
-81-
"Teachers' Perceptions of Consultant Utilization (Age Groupings)"
Mean Numerical ResponseConsultantService
(code numbers)All
TeachersTeachers
Ages (21-30)Teachers
Ages (31-40)Teachers
Ages (41-50)
1.8
TeachersAges (51-60)
2.1
TeachersAges (617plus)
2.47 2.0 2.2 1.8
8 2.2 2.3 2.2 1.6 1.9 1.7
9 2.2 2.2 2.5 1.9 1.9 1.3
10 2.0 1 2.2 1.9 1.7 1.9 1.7
11 2.7 2.8 3.1 2.4 2.3 2.6
12 2.6 2.5 2.2 2.3 2.8 3.9
13 2.4 2.5 2.2 2.0 2.5 2.9
( ) 14 2.7 2.8 2.8 2.2 2.5 2.3
15 2.6 2.7 2.5 2.1 2.9 2.1
16 2.6 2.6 2.6 2.1 2.8 2.3
17 2.5 2.4 2.1 1.9 2.1 2.3
18 2.5 2.5 2.5 2.2 2.2 2.1
19 2.8 2.7 2.5 2.2 2.8 2.1
20 2.6 2.6 2.5 1 2.0 2.8 1.9
21 2.8 2.8 2.9 2.5 2.9 2.9
22 2.3 2.1 1.9 2.2 2.3 2.0
23 2.6 2.7 2.1 2.6 2.4 2.2
Code Numbers
All Ages Ages Ages Ages Ages
Teachers (21-30) (31-A0) (41-50) (51-60) (61 plus)
Most Important 7, 10 22 7 8 8. 9, 10
Least Important 19, 21 11, 14, 21 11 23 15, 21 12
39
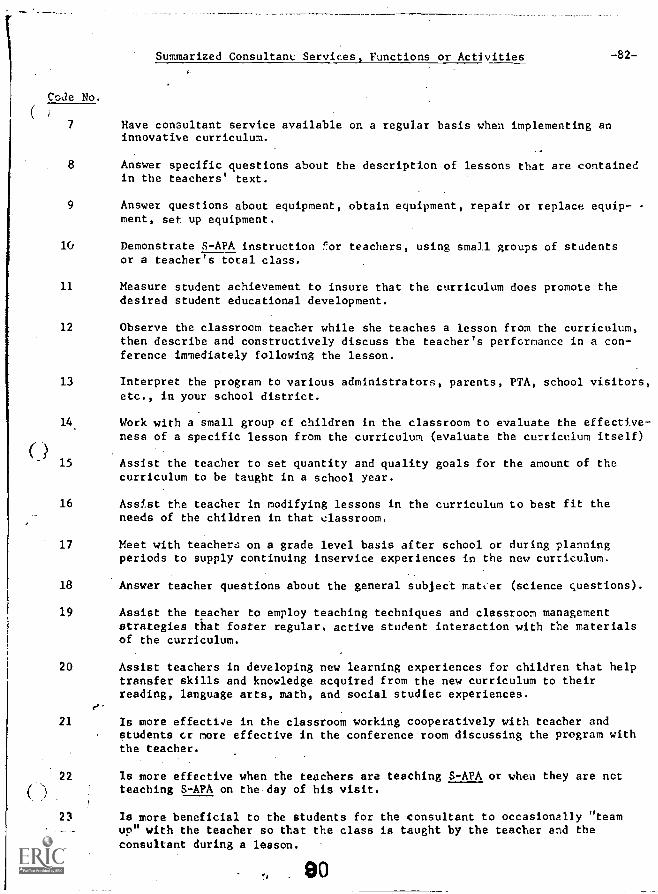
Summarized Consultant Services, Functions or Activities -82-
Code No.
7 Have consultant service available on a regular basis when implementing aninnovative curriculum.
8 Answer specific questions about the description of lessons that are containedin the teachers' text.
9 Answer questions about equipment, obtain equipment, repair or replace equip-ment, set up equipment.
10 Demonstrate S-APA instruction ror teachers, using small groups of studentsor a teacher's total class.
11 Measure student achievement to insure that the curriculum does promote thedesired student educational development.
12 Observe the classroom teacher while she teaches a lesson from the curriculum,then describe and constructively discuss the teacher's performance in a con-ference immediately following the lesson.
I)
Interpret the program to various administrators, parents, PTA, school visitors,etc., in your school district.
Work with a small group of children in the classroom to evaluate the effective-ness of a specific lesson from the curriculum (evaluate the curriculum itself)
Assist the teacher to set quantity and quality goals for the amount of thecurriculum to be taught in a school year.
16 Assist the teacher in modifying lessons in the curriculum to best fit theneeds of the children in that classroom.
17 Meet with teachers on a grade level basis after school or during planningperiods to supply continuing inservice experiences in the new curriculum.
18 Answer teacher questions about the general subject matter (science questions).
19 Assist the teacher to employ teaching techniques and classroom managementstrategies that foster regular, active student interaction with the materialsof the curriculum.
20 Assist teachers in developing new learning experiences for children that helptransfer skills and knowledge acquired from the new curriculum to theirreading, language arts, math, and social studiec experiences.
21 Is more effective in the classroom working cooperatively with teacher andstudents cr more effective in the conference room discussing the program withthe teacher.
22 Is more effective when the teachers are teaching S-APA or when they are notteaching S-APA on the day of his visit.
23 Is more beneficial to the students for the consultant to occasionally "teamup" with the teacher so that the class is taught by the teacher and theconsultant during a lesson.
7) 80
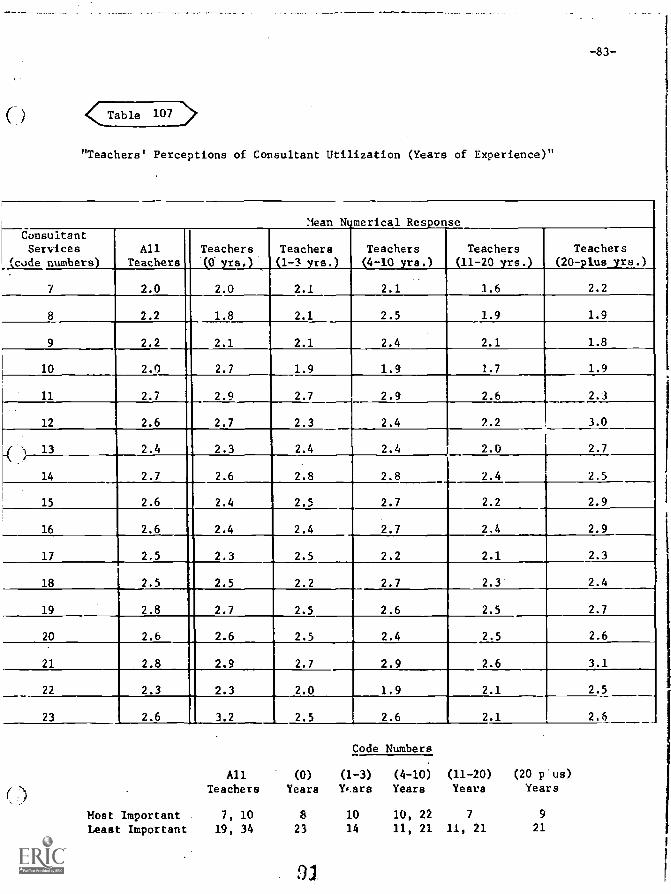
-83-
<Table 107 >
"Teachers' Perceptions of Consultant Utilization (Years of Experience)"
Mean Numerical Response
Teachers(4-10 yrs.)
Teachers(11-20 yrs.)
Teachers(20-plus yrs.)
ConsultantServices
"(code numbers)All
TeachersTeachers(0 yrs.)
Teachers(1-3 yrs.)
7 2.0 2.0 2.1 2.1 1.6 2.2
8 2.2 1.8 2.1 2.5 1.9 1.9
9 2.2 2.1 2.1 2.4 2.1 1.8
10 2.0 2.7 1.9 1.9 1.7 1.9
11 2.7 2.9 2.7 2.9 2.6 2.3
12 2.6 2.7 2.3 2.4 2.2 3.0
( ) "2.4 2.3 2.4 2.4 2.0 2.7
14 2.7 2.6 2.8 2.8 2.4 2.5
15 2.6 2.4 2.5 2.7 2.2 2.9
16 2.6 2.4 2.4 2.7 2.4 2.9
17 2.5 2.3 2.5 2.2 2.1 2.3
18 2.5 2.5 2.2 2.7 2.3 2.4
19 2.8 2.7 2.5 2.6 2.5 2.7
20 2.6 2.6 2.5 2.4 2.5 2.6
21 2.8 2.9 2.7 2.9 2.6 3.1
22 2.3 2.3 2.0 1.9 2.1 2.5
23 2.6 3.2 2.5 2.6 2.1 2.6
)
Code Numbers
All (0) (1-3) (4-10) (11-20) (20 p'us)
Teachers Years Y.ars Years Years Years
Most Important 7, 10 8 10 10, 22 7 9
Least Important 19, 34 23 14 11, 21 11, 21 21
9,1

Summarized Consultant Services Functious or Activities
Code No.
(
7 Have consultant service available on a regular basis when implementing aninnovative curriculum.
8 Answer specific questions about the description of lessons that are containedin the teachers' text.
9 Answer questions about equipment, obtain equipment, repair or replace equip-mer.Z, set up equipment.
10 Demonstrate S-APA instruction for teachers, using small groups of studentsor a teacher's total class.
11 Measure student achievement to insure that the curriculum does promote thedesired student educational development.
12 Observe the classroom teacher while she teaches a lesson from the curriculum,then describe and constructively discuss the teacher's performance in a con-ference inmediately following the lesson.
13 Interpret the program to various administrators, parents, PTA, school visitors,etc., in your school district.
14 Work with a small group of children in the classroom to evaluate the effective-ness of a specific lesson from the curriculum (evaluate the curriculum itself)
15 Assist the teacher to set quantity and quality goals for the amount of thecurriculum to be taught in a school yea:.
16 Assist the teacher in modifying lessons in the curriculum to best fit theneeds of the children in that classroom.
17 Meet with teachers on a grade level basis after school or during planningperiods to supply contiming ::nservice experiences in the new curriculum.
18 Answer teacher questi ns about the general subject matter (science questions).
19 Assist the teacher to employ teaching techniques and classroom managementstrategies that foster regular, active student interaction with the maverialsof the curriculum.
20 Assist teachers in developing new learning experiences for children that helptransfer skills and knowledge .acquired from the new curriculum to their
. reading, language arts, math, and social studies experiences.
21 Zs more effective in the classroom working cooperatively with teacher andstudents or more effective in the conference room eiscusling the program withthe teacher.
22 Is more effective when the teachers are teaching S-APA or when they are notteaching S-APA on the day of his visit.
23 Is more beneficial to the students for the consultant to occasionally "..leamup" with the teacher so that the class is taught by the teacher and theconsultant during a lesson.
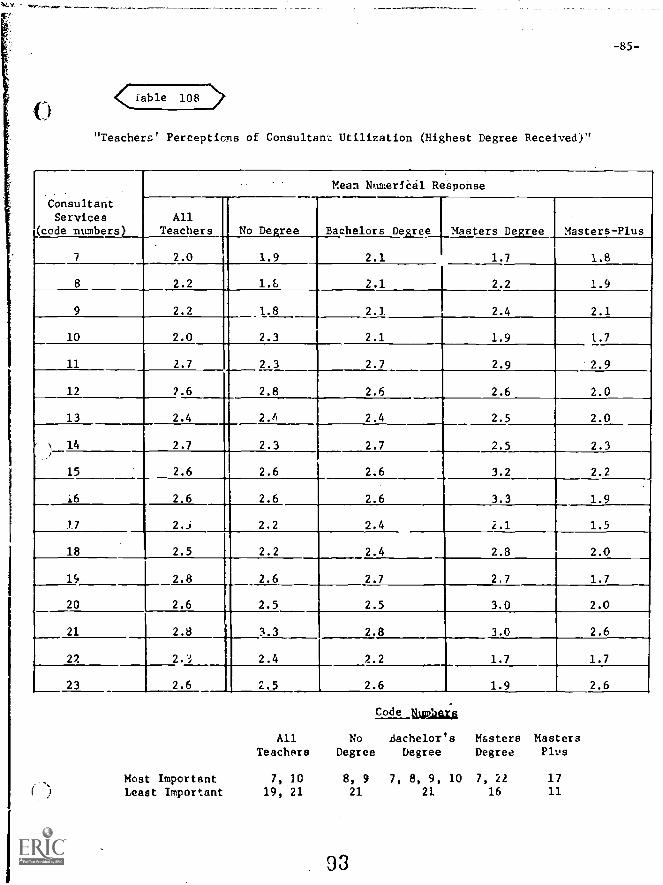
-85-
<Table 108
"Teachers' Perceptions of Consultant Utilization (Highest Degree Received)"
ConsultantServices
(code numbers)
Mean NumeriCal Response
AllTeachers No Degree Bachelors Degree Masters Degree Masters-Plus
7 2.0 1.9 2.1 1.7 1.8
8 2.2 1.& 2.1 2.2 1.9
9 2.2 1.8 2.] 2.4 2.1
10 2.0 2.3 2.1 1.9 1.7
11 2.7 2.3 2.7 2.9 2.9
12 7.6 2.8 2.6 2.6 2.0
13 2.4 2.6 2.4 2.5 2.0
14 2.7 2.3 2.7 2.5 2.3
15 2.6 2.6 2.6 3.2 2.2
i6 2.6 2.6 2.6 3.3 1.9
17 2.i 2.2 2.4 2.1 1.5
18 2.5 2.2 2.4 2.8 2.0
19 2.8 2.6 2.7 2,7 1.7
20 2.6 2.5 2.5 3.0 2.0
21 2.8 3.3 2.8 3.0 2.6
22 2.3 2.4 2.2 1.7 1.7
23 2.6 2.5 2.6 1.9 2.6
Code 1,10a4
All No Bachelor's Masters MastersTeachers Degree Degree Degree Plus
Most Important 7,)0 8, 9 7, 8, 9, 10 7, 22 17
Least Important 19, 21 21 21 16 11
33
C,rel.P.Or
Part II
"Principals' Perceptionu of Consultant Utilization"
9t1
-86--

-87-
During a series of inservice meetings for pilot and demonstration
school principals held at the Airport Inn, North Syracuse, New York,
during December, 1969, the enclosed document (see: Appendix) entitled
"FrinCipal's Perception of Teacher Preferences for the Utilization of
External Consultant Service" was administered to those in attendance.
Tha schools of diverse characteristics are distributei geographically
throughout the states of New York. and Peansylvania. Mese elementary
schools are a part of the Eastern Regional Institute for Education's
network of
tions, and
pilot and demonstration schools.
ERIE code numbeve are as follows:
Pilot Schools
The schools, their loca-
CodeNumber School Location
G1 F. S. Banford School Canton, N. Y.02 Cedar Road School E. Northport, N. Y.03 Cortland Campus School Cortland, N. Y.
04 Naple School Williamsville, N. Y.05 Nathanie] Rochester #3 Rochester, N. Y.06 Gen. E. S. Otis #30 Rochester, N. Y.07 C. C. Ring School JaTlestown, N. Y.02 Rosedale School White Plains, N. Y.09 Calvin Smith 3chot1 Painted Post, N. Y.10 Ticonderoga School T!.conderoga, N. Y.11 Trumansburg School Trumansburg, N. Y.12 Westmere School Albany, N. Y.15 Blessed Sacrament School Syracuse, N. Y.20 J. Henry Cochran School Williamsport, Penna.21 Fairview School Fairview, Penna.22 Wellaboro School Welluboro, Penna.23 Abraham Lincoln School Pittsburgh, Penna.24 Overloc'. School Pittsburgh, Penna.25 Shannock Valley School RJral Valley, Penna.26 Washington School Shamokin, Penna.29 St. Cyril of Alexandria Pittsburgh, Penna.

1
Demonstration Schools
CodeNumber
30
31
32
33
34
35
3637
School Location
CamTbell SchoolClinton SchoolG. Berton Davis SchoolFriendship SchoolGaidiners Avenue SchoolGroton SchoolHancock SchoolJohn Kennedy School
Campbell, N. Y.Clinton, N. Y.Malone, N. YFriendship, N. Y.Levittown, N. Y.
Groton, N, Y.Hancock, N. Y.Batavia, N. Y.
38 North Hill School Cheektowaga, N. Y.39 Onondega Hill. School Syracuse, N, Y.40 Park View School Kings Park, N. Y.41 Paulding School Tarrytown, N. Y.42 Scotchto-m Avenue School Goshen, N. Y.43 Sherman-Massey School Watertown, N. Y.Vi Sloatsburg School Sloatsburg, N. Y.45 Stevens School Scotia, N. Y.46 Watkins Glen School Watkins Glen, N. Y.50 Ben Avon School Pittsburgh, Penra.51 Boalsbittg School State College, Penna.52 Bright Township Schoo?. Beaver, Penna.53 Hamilton Setool Carlisle, Penna.54 Hoffman Avenue School Windber, Penna.
55 Inglewood School Lansdale, Penna.
56 Johnstille School Warminster, Penna,57 Lamar Township School Mill Hall, Penna.58 Lionville Szhool Dowingtown, Penna.
59 Norwood School Norwood, Penna.60 Roosevelt School Media, Penna.61 Smethport School Smethport, Penna.
62 Dr. Edward Tracy School Easton, Penna.63 White Oat: School McKeesport, Penna.64 Woodward School Lock Haven, Penl.a.
Ie principals -..ho responded to the questionnaire are:
Vance SanfordFrancis MelmAlexander JohnsonMabel HomburgLyman WeaverMahlon NorthropDonald Mahon
Pilot Schools
John Cerlson Ronald LenziBernadette Geary John McWhirterJoseph Merenda William StraessleyJohn Bourdon Sister Mary RobertaThomas Toomey Robert MeldrumHarold Weinstein James Cleary
John Dice Thomas Ahern
36
-88-
Albert CampRobert HinkelmanRonald ShearerChristian DwyerLawrence ByronDonald McCloyPaul SolleyDonald HobsonAngelo IaconoIrene McKelveyZita Muller
Demonstration Schools
Floyd NoreaultWinard ReddingMabel ScondrasCarlos GutierrezHarry GoreMathew PavlovichJames EschbachPansy DameronWarren SemmelArnold RedbordBarbara Hanrahan
James ShippyMae KlubeR. Allen DeHondEdward McDermottMolly AlterWilliam HiteJames MitchenerHerbert BuenemanJames PalumboGerald Brown
The primary goal of this questionnaire was to determine the prin-
cipals' perceptions of how important a given consultant function, ser-
vice or activity is, in the minds of the teachers. The collected data
have their foundations in the responses to the items on the question-
naire. As in any questionnaire-data gathering endeavor, many of the
items are not answered or scored, such is the case here.
The eata represent a summary of the principals' responses tu the
questions asked, signified by their mean numerical response on a one
to seven continuum. The data have also been tabulated under the
following two categories:
Number ofPrincipals
1. State of Principal
a. Pennsylvania principals 19
b. New York principals 25
2. School-type of Principal
a. Pilot school principals 24
b. Demonstration school principals 20
97
-39-
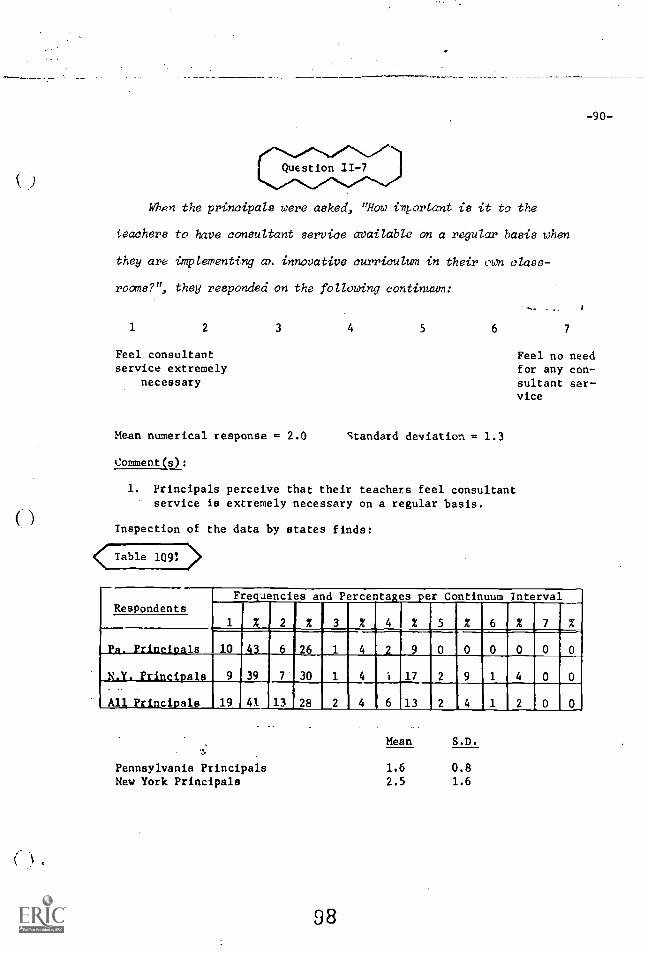
0.1.on the principals were asked, "How important is it to the
teachers to have consultant service available on a regular basis when
they are implementing a% innovative curriculum in their own class-
rooms?", they responded on the following continuum:
1 2 3 4 5 6 7
Feel consultantservice extremely
necessary
Mean numerical response = 2.0 Standard deviation = 1.3
Commenqs) :
1. Principals perceive that their teachers feel consultantservice is extremely necessary on a regular basis.
Inspection of the data by states finds:
< Table 109:
-90-
Feel no needfor any con-sultant ser-vice
RespondentsFrequencies and Percentages per Continuum Interval
% 2 2 3 % 4 % 5 % 6 % 7
Pa Prinsipals
N.Y. Principals
10 43 6 26 1 4 2 9 0 0 0
9 39 7 30 1 4 i 17 2 9 1 4
All Principals 19 41 13 28 2 4 6 13
Pennsylvania PrincipalsNew York Principals
98
Mean S.D.
1.6 0.82.5 1.6

( ) Comment(s):
1. Pennsylvania principals tend to feel that their teachersneed ccnsultant service on a regular basis more than theNew York principals.
Analysis of the data by school-types finds:
(Table 110:21
RespondentsFrequencies and Percentages per Continuum Interval
1 % 2 % 3 X 4 % 5 % 6 % 7%Pilot Schools 6 26 9 39 2 9 3 13 2 9 1 4 0 0
Demo Schools 13 62 4 19 1 5 2 10 1 5 0 0 0 0
All Principals 19 44 13 29 3 7 5 11 3 7 1 2 ,0 0
Pilot School PrincipalsDemo School Principals
Comment(s):
Mean S.D.
2.5 1.51.6 0.9
1. Demo school principals perceive that teachers feel consultantservice is extremely necessary on a regular basis more thanthe pilot school principals.
When the principals were asked, "How important is it to the
teachers to have a consultant available to answer specific questions
about the descriptions of lessons that are contained in the teachers
text (syllabus);', their responses were recorded on the following
continuum:
99
-91-
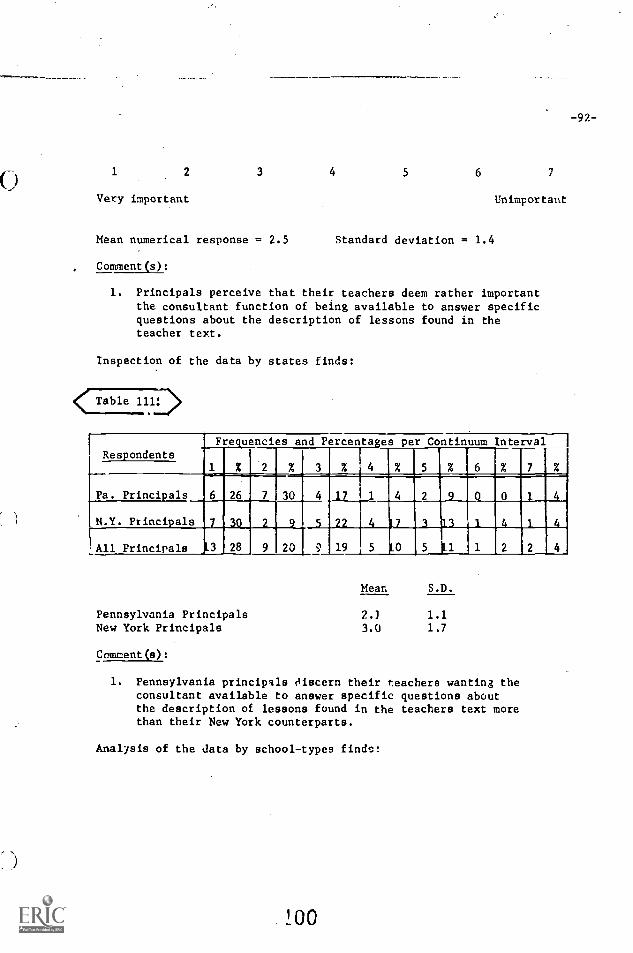
-92--
1 2 3 4 5 6
Very important
Mean numerical response = 2.5 Standard deviation = 1.4
Unimportant
Comment(s):
1. Principals perceive that their teachers deem rather importantthe consultant function of being available to answer specificquestions about the description of lessons found in theteacher text.
Inspection of the data by states finds:
< Table 1112D>
Fre.uencies and Percenta:es_per Continuum IntervalRespondents III
% 2 % 3 % 4 % 5 % 6 % 7 ri
Pa. Princi.als 6 26 7 30 4 17 1 IIIIIIIIIIIII0 III
N.Y. Princi.als 1111111111 . 1111111111111111111115 1E1111111111 1 MINI 4All Principals NEI 9 20 9 19
Pennsylvania PrincipalsNew York Principals
Comment(s):
Mean S.D.
2.] 1.13.0 1.7
1. Pennsylvania principals 4iscern their teachers wantin8 theconsultant available to answer specific questions aboutthe description of lessons found in the teachers text morethan their New York counterparts.
Analysis of the data by school-types finds:
W 0
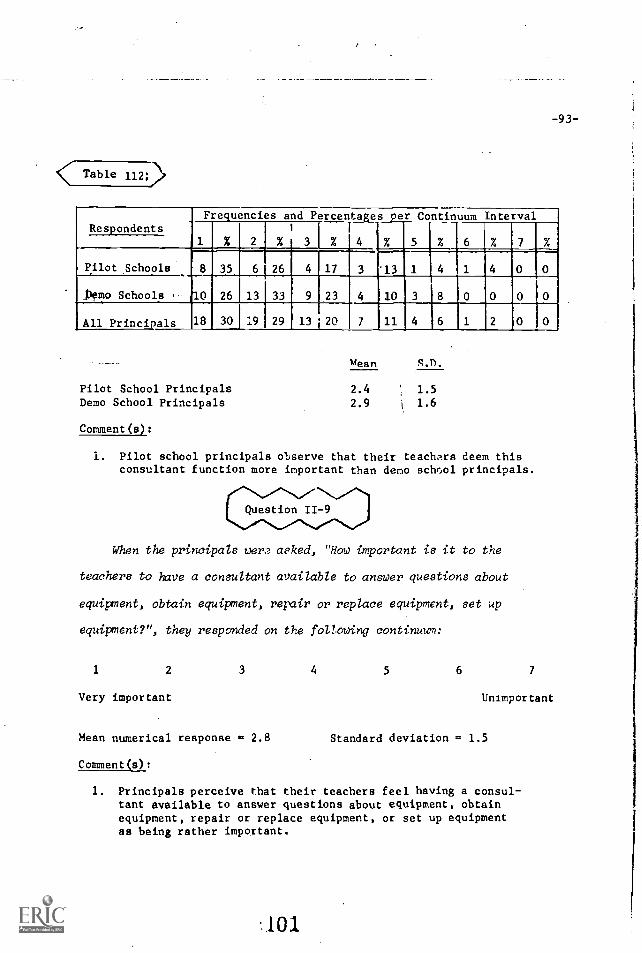
-93-
Table 112:>
Frequencies and Percentages per Continuum IntervalRespondents
1 % 2 % 3 % 4 % 5 % 6 % 7 %A
pilot Schools 8 35 6 26 4 17 3 '13 1 4 1 4 0 0
Slemo Schools .. 10 26 131 33 9 23 4 10 3 8 0 0 0 0
All Principals 18 30 :9 29 13 20 7 11 4 6 1 2 0
Pilot School PrincipalsDemo School Principals
Comment(s):
mean s.n.
2.4 1.5
2.9 1.6
1. Pilot school principals observe that their teachers deem thisconsultant function more important than demo school principals.
When the principals were a8ked, "How important is it to the
teachers to have a consultant available to answer questions about
equipment, obtain equipment, repair or replace equipment, set up
equipment?", they responded on the following continuum:
1 2 3 4 5 6 7
Very important Unimportant
Mean numerical response = 2.8 Standard deviation = 1.5
Comment(s):
1. Principals perceive that their teachers feel having a consul-tant available to answer questions about equipment, obtainequipment, repair or replace equipment, or set up equipmentas being rather important.
101
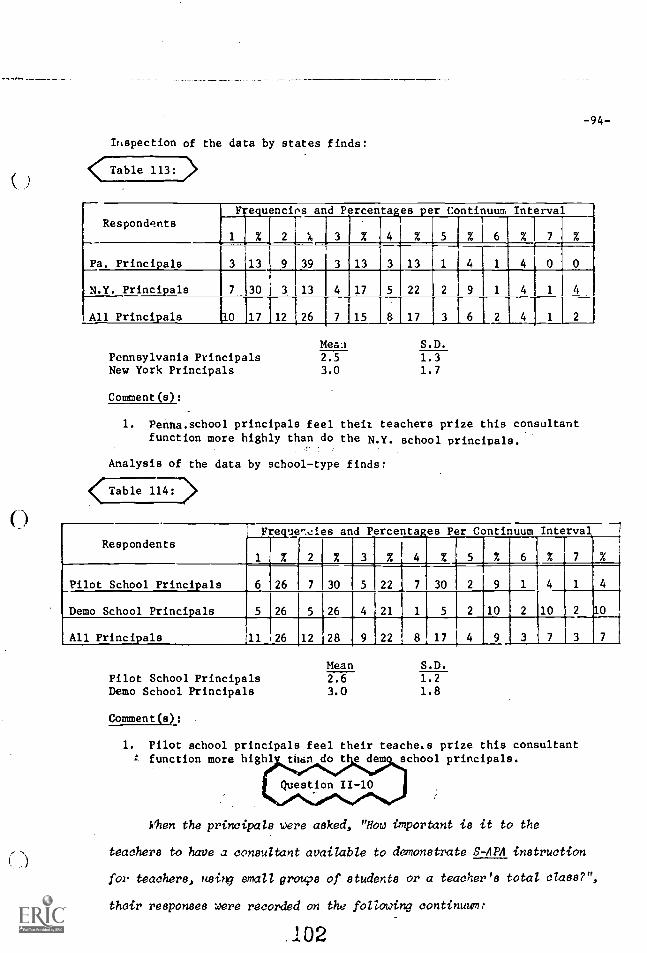
0
-94-
Inspection of the data by states finds:
<Table 113:)
RespondentsFrequencios and Percents es per Continuum Interval
1 % % 4 % 5 % 6 % 7
Pa. Principals 3 13 9 39 3 13 3 13 1 4
N.Y. Principals 7 30 3 13 4 17 5 22 2 9
All Principals 110 17 12 26 7 15 8 17 3 6 2 4 1 2
Pennsylvania PrincipalsNew York Principals
Comment(s):
Meai2.53.0
S.D.
1.31.7
1. Penna.school principals feel their teachers prize this consultantfunction more highly than do the N.Y. school principals.
Analysis of the data by school-type finds:
Table 1T.17:->
RespondentsFrequen.Aes
%
and Percentages Per Continuum Interval
2 % 3 % 4 % 5 % 6 % 7 %
Pilot School Principals 6 26 7 30 5 22 7 30 2 9 1 4 l III
Demo School Principals 5 26 5 26 4 21 1 5 2 10 2 10 2 i0
All Principals 11 26 12 28 9 22 8 17 4 9 3 7 3
Pilot School PrincipalsDemo School Principals
Comment(s):
Mean2.63.0
S.D.1.21.8
1. Pilot school principals feel their teaches prize this consultant= function more highl than do t e dem school principals.
When the principals were asked, "How important is it to the
teachers to have a consultant available to demonstrate S -APA instruction
for teachers, using small groups of students or a teacher's total class?",
their responses were recorded on the following continuum:
102
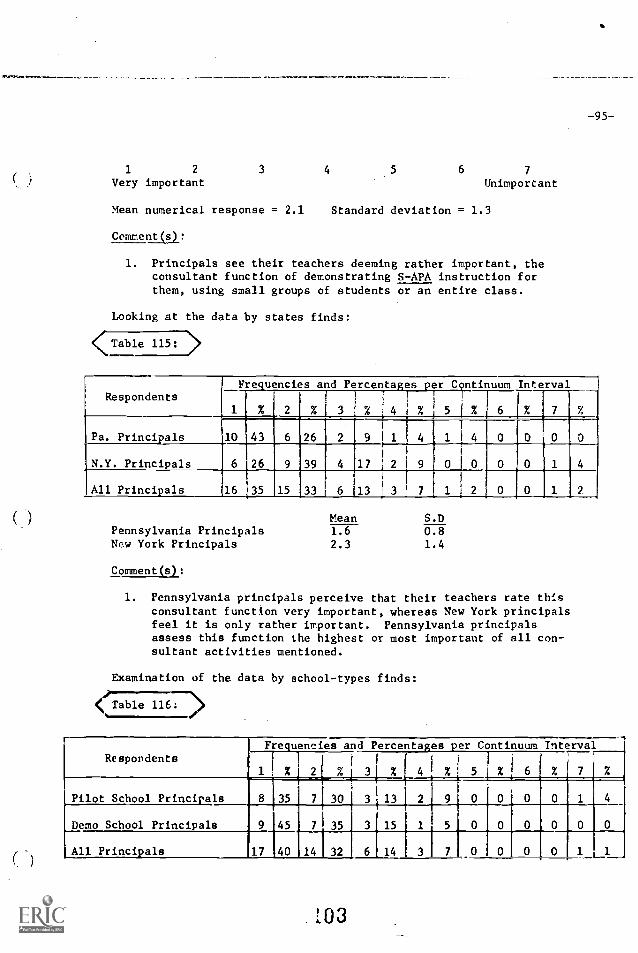
-95-
1 2 3 4 5 6 7
Very important Unimportant
Mean numerical response = 2.1 Standard deviation = 1.3
Comment(s):
1. Principals see their teachers deeming rather important, theconsultant function of demonstrating S-APA instruction forthem, using small groups of students or an entire class.
Looking at the data by states finds:
Table 115: >
Frequencies and Percentages per Continuum IntervalRespondents t ! '
1 % 2 l % 3 4 1 % 5 % 6 % 7 %__%
11
Pa. Principals 10 43 6 26 2 9 1 1 4 1 14I
N.Y. Principals 6 26 9 39 4 17 ' 2
I
All Principals 16 35 15 33 6 13 ! 3 7 1 2 0
Pennsylvania PrincipalsNew York Principals
Comment(s):
Mean1.6
2.3
S.D0.81.4
1. Pennsylvania principals perceive that their teachers rate thisconsultant function very important, whereas New York principalsfeel it is only rather important. Pennsylvania principalsassess this function the highest or most important of all con-sultant activities mentioned.
Examination of the data by school-types finds:
4C?Table 1167-)
RespondentsFrequencies and Percentages per Continuum Interval
1 % 2 % 3 % 4, % 5 % 6 % 7 %u
Pilot School Princiuls 8 35 7 30 3 13 2 9 0 0 0 0 1 4
Demo School Principals 9 45 7 35 3 15 1 5 0 0 0 0 0 0
All Principals 417 40 14 32 6114 3 7 0 0 0 0_ 1 1
.iO3
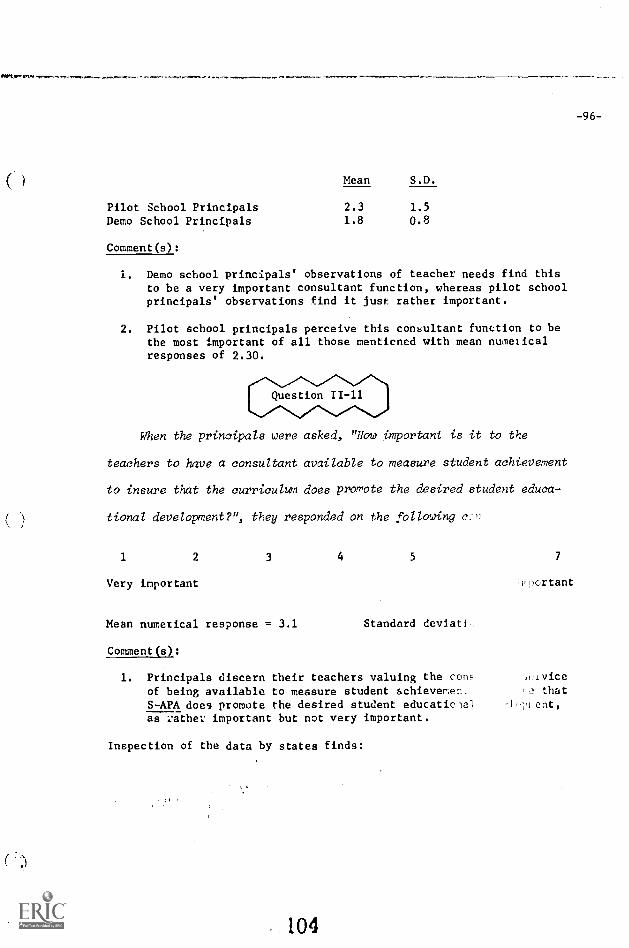
'Arty, row-
Pilot School PrincipalsDemo School Principals
Comment(s):
Mean S.D.
2.3 1.51.8 0.8
1. Demo school principals' observations of teacher needs find thisto be a very important consultant function, whereas pilot schoolprincipals' observations find it just rather important.
2. Pilot school principals perceive this consultant function to bethe most important of all those menticned with mean numericalresponses of 2.30.
When the principals were asked, "How important is it to the
teachers to have a consultant available to measure student achievement
to insure that the curriculum does promote the desired student educa-
tional development?", they responded on the following
1 2 3 4 5 7
Very important fr.portant
Mean numerical response = 3.1 Standard deviati
Comment(s):
1. Principals discern their teachers valuing the coneof being available to measure student achievemen_S-APA does promote the desired student educationalas zathev important but not very important.
Inspection of the data by states finds:
104
wlvicethat
,lope eat,
-96-
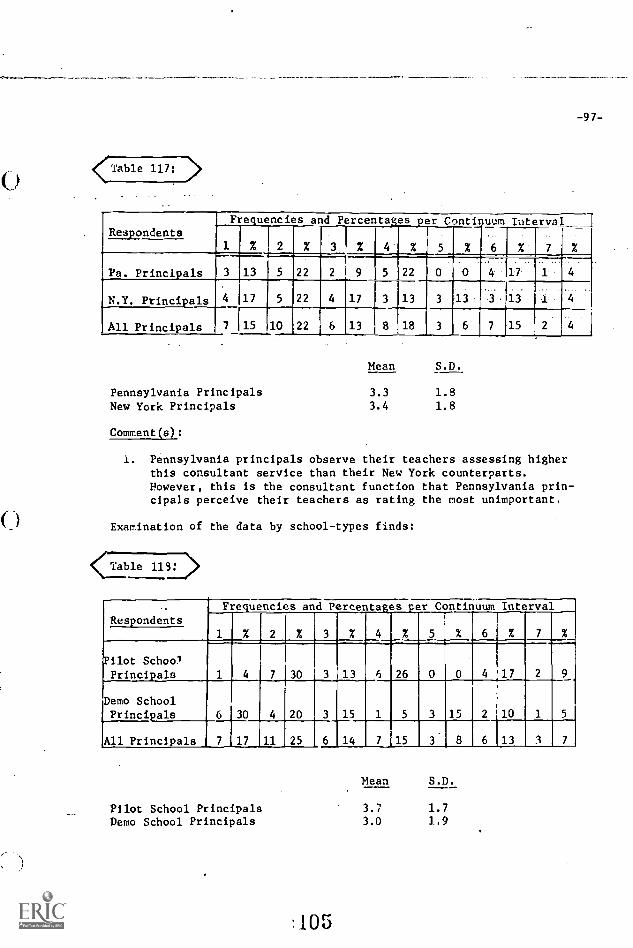
Table 117: >
-97-
RespondentsFrequencies and Percentages per Continuum Interval -]
1 % 2 % 3 I % 4' % 5 % 6 % 7 %
Pa. Principals 3 13 5 22 2 9 _45 22 0 0. ..
4
_
1. 7 1..
N.Y. Principals 4 17 5 22 4 17 3 13 3 13. 3 13
All Principals 7 15 10 22 6 13 8 18 3 6 7 15
Pennsylvania PrincipalsNew York Principals
Comment(s):
Mean S.D.
3.3 1.83.4 1.8
1. Pennsylvania principals observe their teachers assessing higherthis consultant service than their New York counterparts.However, this is the consultant function that Pennsylvania prin-cipals perceive their teachers as rating the most unimportant.
Examination of the data by school-types finds:
(!able 118.1)
RespondentsFrequencies and Percentages per Continuum Interval
3% 4 % 5 ° 6%'Pilot School
Principals 1 4 7 30 3 13 6 26 0 0 4 17 2 9
Demo SchoolPrincipals 6 30 4 20 3 15 1 5 3 15 2 10 1 5
All Principals 7 17 11 25 6 14 7 15 3 8 6 13 3 7
Pilot School PrincipalsDemo School Principals
105
Mean
3.7 1.73.0 1.9
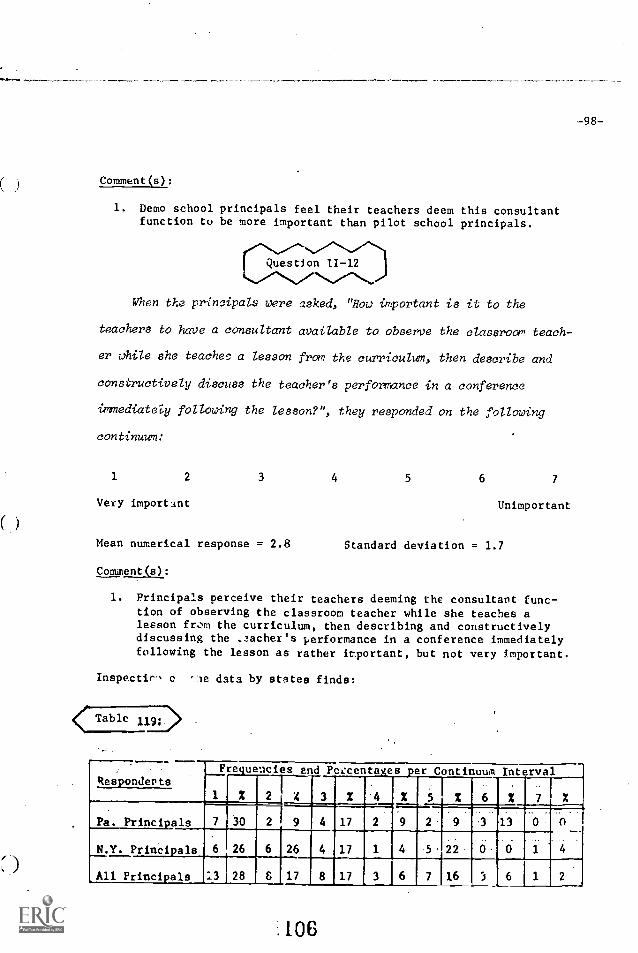
Comment(s):
1. Demo school principals feel their teachers deem this consultantfunction to be more important than pilot school principals.
uestion 11-12
When the prnaipals were asked, "How important is it to the
teachers to have a consultant available to observe the classroom teach-
er while she teache^ a lesson from the curriculum, then describe and
constructively discuss the teacher's performance in a conference
immediately following the lesson?", they responded on the following
continuum:
1 2 3 4 5 6 7
Very important Unimportant
Mean numerical response = 2.8 Standard deviation = 1.7
Comment(s):
1. Principals perceive their teachers deeming the consultant func-tion of observing the classroom teacher while she teaches alesson from the curriculum, then describing and constructivelydiscussing the .aacher's performance in a conference immediatelyfollowing the lesson as rather important, but not very important.
InspectirN c 'le data by states finds:
<(, Table 11.21>
-98-
Frequencies end Pc,..centages per Continuum IntervalRespondents
1 2 2 4 3 % 4 X 5 2 6 2 7 X. . . .
Pa. Principals 7 30 2 9 4 17 2 9 2 3 13 0 0
N.Y. Principals 6 26 6 26 4 17 1 4 5. 22
All Principals 13 28 6 17 8 17 3 6 7 16
.106
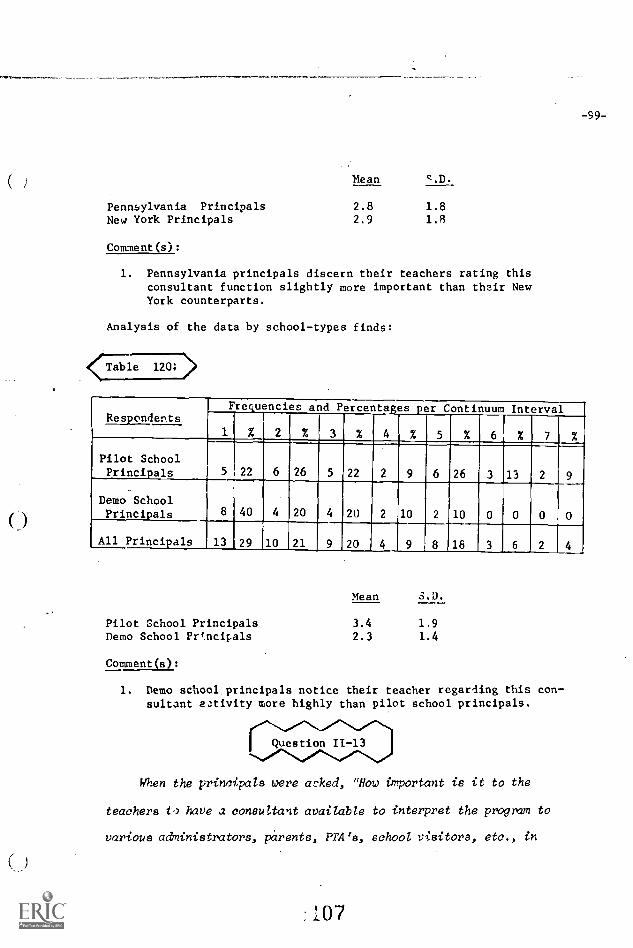
(_)
-99-
Pennsylvania PrincipalsNew York Principals
Comment(s):
Mean q.D.
2.8 1.82.9 1.8
1. Pennsylvania principals discern their teachers rating thisconsultant function slightly more important than their NewYork counterparts.
Analysis of the data by school-types finds:
<Table 120: j
RespondentsFrequencies and Percentages per Continuum Interval
1 % 2 % 3 % 4 % 5 % 6 % 7 %
Pilot SchoolPrincipals 5 22 6 26 5 22 2 9 6 26 3 13 2 9
Demo SchoolPrincipals 8 40 4 20 4 20 2 10 2 10
All Principals 13 29 10 21 9 20 4 9 8 18
Pilot School PrincipalsDemo School Principals
Mean
3.4 1.92.3 1.4
Comment(s):
I. Demo school principals notice their teacher regarding this con-sultant activity more highly than pilot school principals.
When the principals were c:.ked, "How important is it to the
teachers to have a consultant available to interpret the program to
various administrators, parents, PTA's, school visitors, etc., in
tot

-100-
your school. district?", they responded on the following continuum:
1 2 3 4 5 6 7
Very important Unimportant
Mean numerical response = 3.2 Standard deviat!cn = 1.8
Comment(s):
1. Principals perceive their teachers valuing the consultantfunction of interpreting the program to various administra-ttators, parents, PTA's, etc., as being not too important.
2. Of all the consultant activities mentioned, this is the onethe principals rated as being the most unimportant in the"eyes" of their teachers.
Inspection of the data by states finds:
<Table 121; )
RespondentsFrequencies and Percentages per Continuum Interval
1 % 2 2 3 % 4 X 5 X 6 X 7 y
Pa. Principals 2 9
22
5
3
8
1111
III
18
5
4
22
17
4
3
17
13
1
2
4
. 9
2 9 1 4
N.Y. Principals 5 4 17
All Principals 7 16 9 20 7 15 3 6 6 13 3
Pennsylvania PrincipalsNew York Principals
Comment(s):
Mean S.D.
3.3 1.7
3.5 2.0
1. Pennsylvania principals observe their teachers ,:.valuating thisconsultant service more highly than New York principals.
Examination of the data by school-types:
108

-101-
Table 122t >
RespondentsFrequencies and Percentages per Continuum Interval
1 % I 21 % 3 % 4 % 5 % 6 X 7
Pilot SChoolPrincipals . 4 17 2 9 4 17 4 17 3 13 4 17
Demo SchoolPrincipals 4 20 5 25 5 25 2 10 0 0 2 10 2 10
All Princi.als 8 18 7 17 9 21 ,6 14 3 8 6 14 3 -7
Pilot School PrincipalsDemo School Principals
Mean S.D.
3.7 1.8
3.2 1.9
Comment(s):
1. Demo school principals discern their teachers regarding this con-sultant function more important than pilot school principals.
2. Of all the consultant activities mentioned, this is the onedeco school principals perceive their teachers as rating themost taimportant.
When the principals were asked, "How important is it to the
teachers to have a consultant available to work .with a small group
of children in the classroom to evaluate the effectiveness of a
specific lesson from the curriculum?", they responded on the follow-
ing continuum:
1 2 3 4 5 6 7
Very important Unimportant
Mean numerical response = 3.2 Standard deviation = 1.7
100
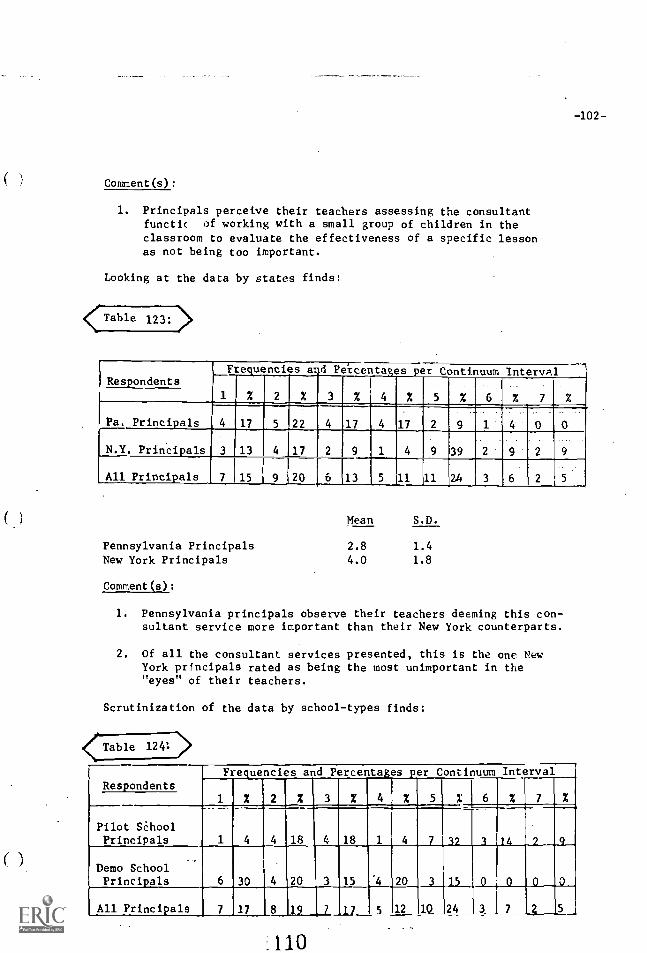
-102-
Comment(s):
1. Principals perceive their teachers assessing the consultantfunctic of working with a small group of children in theclassroom to evaluate the effectiveness of a specific lessonas not being too important.
Looking at the data by states finds:
<(lTable 123: >
RespondentsFrequencies avi Pei-C-entages per Continuum Interval
% 71 % 2 % 3 % 4 % 5 % 6
Pa. Principals 4 17 5 22 4 17 4 17 2 9 1 4 0 0
N.Y. Principals 3 13 4 17 2 9 1 4 9 39 2 9 2 9
All Principals 7 15 9 120 6 13 5 11 11 2.6 3 6 2 5
Pennsylvania PrincipalsNew York Principals
Comment(s):
Mean S.D.
2.8 1.4
4.0 1.8
1. Pennsylvania principals observe their teachers deeming this con-sultant service more important than their New York counterparts.
2. Of all the consultant services presented, this is the one NewYork principals rated as being the most unimportant in the"eyes" of their teachers.
Scrutinization of the data by school-types finds:
Table 124: >
RespondentsFrequencies and Percentages per Continuum Interval
1 % 2 % 3 % 4 % 5 % 6 % 7 %
Pilot SchoolPrincipals 1 4 4 18 4 18 1 4 7 32 3 1.4 2 9
Demo SchoolPrincipals 6 30 4 20 3 15 '4 20 3 15 0 0 0 0
All Principals 7 17 8 19 1 17 5_ 12 10 24 3 7 2 ___5
:110

( )
-103-
Pilot School PrincipalsDemo School Principals
Comment(s):
Mean S.D.
4.1 1.8
2.7 1.5
1. Demo school principals feel their teachers deem this consul-tant activity to be more important than pilot school principals.
2. Of all the consultant functions mentioned, this is the onepilot school principals perceive their teachers as rating themost unimportant.
When the principals were asked, "How important is it to the
teachers to have a consultant available to assist the teacher to set
quantity and quality goal3 for the amount of the curriculum to be
taught in a school year?", they responded on the following continuum:
1 2 3 4 6 7
Very important Unimportant
Mean numerical response = 2.8 Standard deviation = 1.5
Comment(s):
1. Principals perceive that their teachers deem the consultantfunction of assisting them to set quantity and quality goalsfor the amount of curriculum to be taught in a given schoolyear as bring rather important, but not very important.
Inspection of the data by states finds:
Table 125.7.>
Respondents
Pa. Principals
Frequencies and Percentages per Continuum Interval
9 10 43 3 13 0 2
7
9 1
N.Y. Principals
All Principals
3 13 7
S 11 17
30 6 26 3 13 3 13
36 8 18 11 1 2
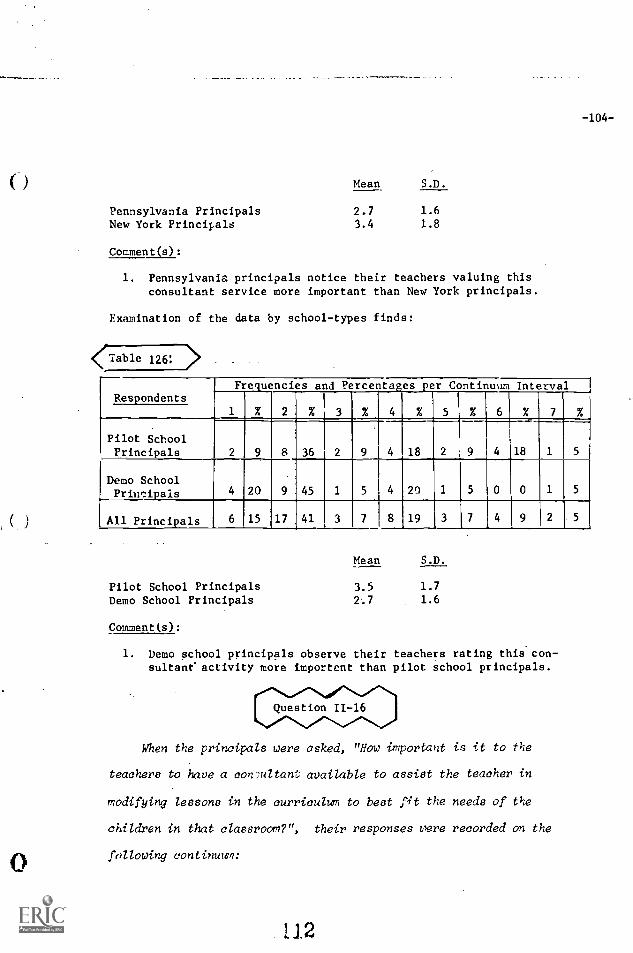
0
-104-
Pennsylvania PrincipalsNew York Principals
Comment(s):
Mean S.D.
2.7 1.6
3.4 1.8
1. Pennsylvania principals notice their teachers valuing thisconsultant service more important than New York principals.
Examination of the data by school-types finds:
`Table 126: >
RespondentsFrequencies and Percentages per Continuum Interval
1 % 2 % 3 % 4 % 5 % 6 % 7
Pilot SchoolPrincipals 2 9 8 36 2 9 4 18 2 9 4 18 1 5
Demo SchoolPrincipals 4 20 9 45 1 5 4 20 1 5 0 0 1 5
All Principals 6 15 17 41 3 7 8 19 3 7 4 9 2 5
Pilot School PrincipalsDemo School Principals
Comment(s):
Mean S.D.
3.52.7
1.7
1.6
1. Demo school principals observe their teachers rating this con-sultaneactivity more important than pilot school principals.
When the principals were asked, "How important is it to the
teachers to have a consultant available to assist the teacher in
modifying lessons in the curriculum to best fit the needs of the
children in that classroom?", their responses were recorded on the
following continuum:
112
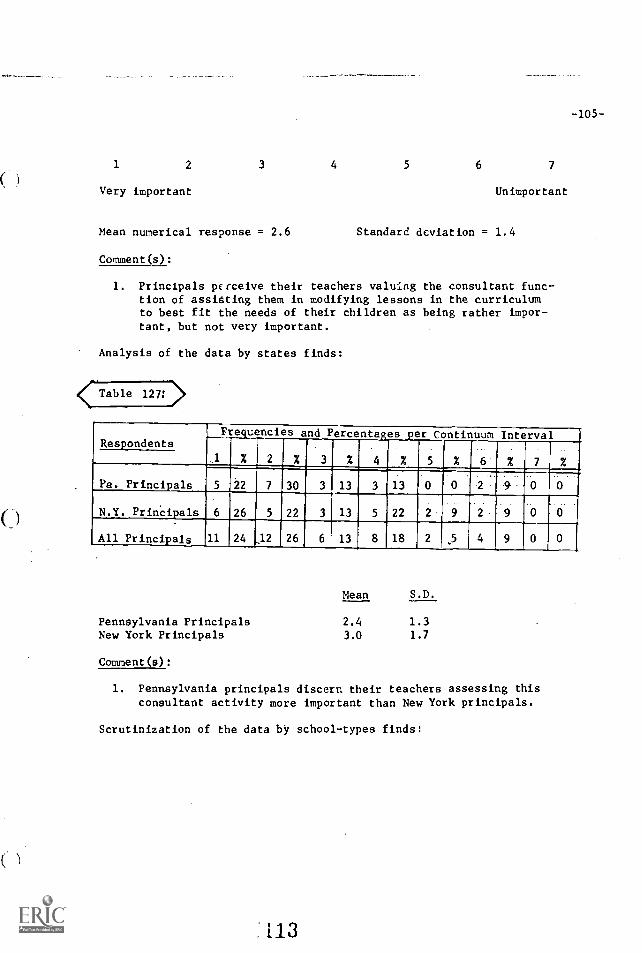
-105-
1 2 3 4 5 6 7
Very important Unimportant
Mean numerical response = 2.6 Standard deviation = 1.4
Comment(s):
1. Principals perceive their teachers valuing the consultant func-tion of assisting them in modifying lessons in the curriculumto best fit the needs of their children as being rather impor-tant, but not very important.
Analysis of the data by states finds:
< Table 127: >
RespondentsFrequencies and PercentaKes per Continuum Interval
% 2 % 3 % 4 % 5 % 6 % 7 %
Pa. Principals 5 22 7 30 3 13 3 13
N.Y. Principals 6 26 5 22 3 13 5 22 2 9 2.
All Principals 11 24 ,12 26 6 13 8 18 2 5 4 9 0
Pennsylvania PrincipalsNew York Principals
Comment(s):
Mean S.D.
2.4 1.33.0 1.7
1. Pennsylvania principals discern their teachers assessing thisconsultant activity more important than New York principals.
Scrutinization of the data by school-types finds:
113
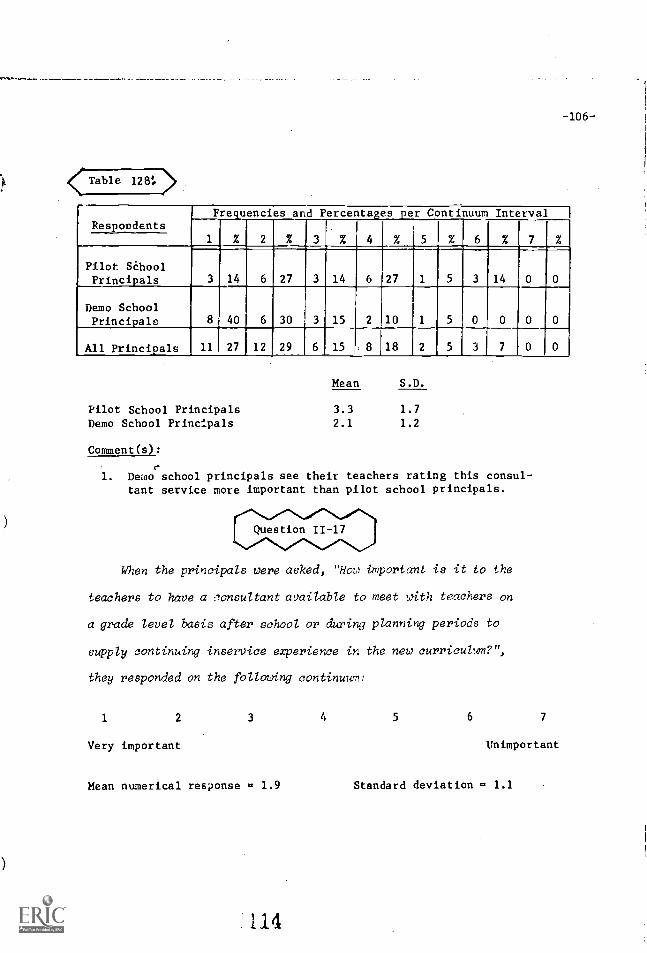
-106-
< Table 128:
RespondentsFrequencies and Percentages per Continuum Interval
% 2 % 3 % 4 % 5 % 6 % 7 .
Pilot SChoolPrincipals 3 14 6 27 3 14 6 27 1 5 3 14 0 0
Demo SchoolPrincipals 8 40 6 30 3 15 2 10 1 5 0 0 0 0
All Principals 11 27 12 29 6 15 8 18 2 5 3 7 0 0
Pilot School PrincipalsDemo School Principals
Mean S.D.
3.3 1.7
2.1 1.2
Comment(s):
1. Deno school principals see their teachers rating this consul-tant service more important than pilot school principals.
When the principals were asked, "How important is it to the
teachers to have a mnsultant available to meet with teachers on
a grade level basis after school or during planning periods to
supply continuing inservice experience in the new curriculum?",
they responded on the following continuum:
1 2 3 4 5 6 7
Very important Unimportant
Mean numerical response 1.9 Standard deviation r. 1.1
114
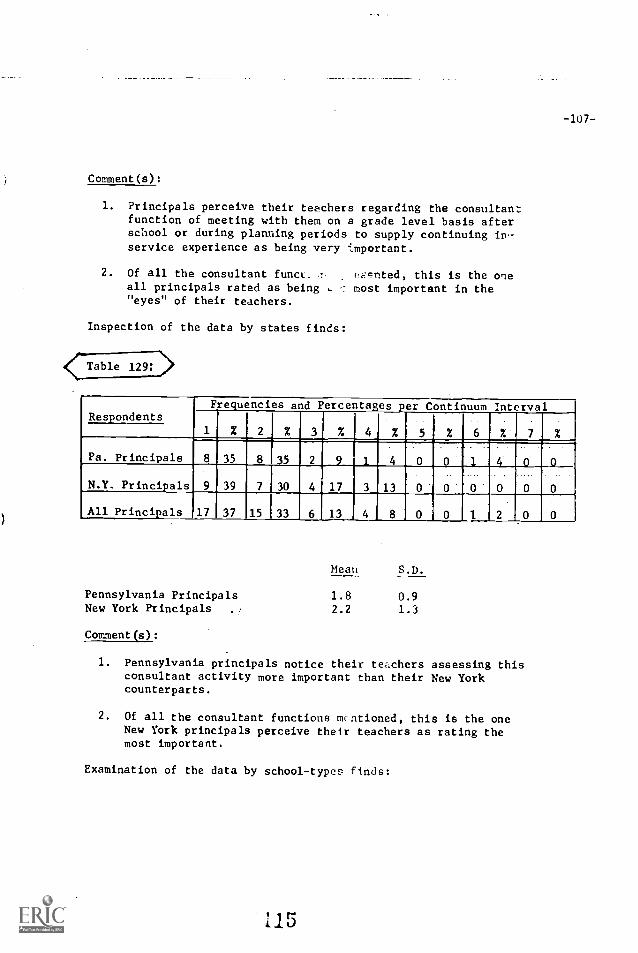
-107-
Comment(s):
1. Principals perceive their teachers regarding the consultantfunction of meeting with them on a grade level basis afterschool or during planning periods to supply continuing inservice experience as being very important.
2. Of all the consultant funcL_ a pF.nted, this is the oneall principals rated as being u ,:. most important in the"eyes" of their teachers.
Inspection of the data by states finds:
Frequencies and Percentages per Continuum IntervalRespondents
1 % 2 % 3 % 4 % 5 % 6 % 7 %
Pa. Principals 8 35 8 35 2 9 1 4 0 0 1 4 0 0
N.Y. Principals 9 39 7 30 4 17 3 0 0 0 0 0
All Principals 17 37 15 33 6 13
413
4 8 0 0 1 2 0 0
Pennsylvania PrincipalsNew York Principals
Comment(s):
Mean S.D.
1.8 0.92.2 1.3
1. Pennsylvania principals notice their teachers assessing thisconsultant activity more important than their New Yorkcounterparts.
2. Of all the consultant functions mentioned, this is the oneNew York principals perceive their teachers as rating themost important.
Examination of the data by school-types finds:
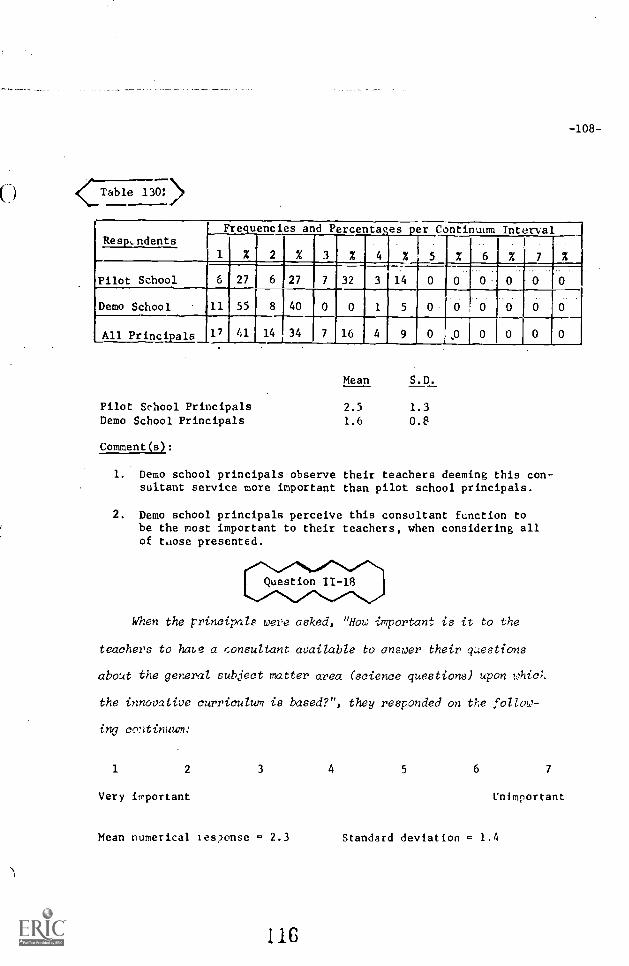
( )
-108-
Table 130:
Resp.ndentsFrequencies and Percenta es per Continuum Interval
1 % 2 % 3 % 4 % 5 % 6 % 7 %
Pilot School 6 27 6 27 7 32 3 14 0 0 0 0
Demo School 11 55 8 40 0 0 1 5 0 0
All Principals 17 41 14 34 7 16 4 9 0 ,0 0 0 0 0
Pilot School PrincipalsDemo School Principals
Comment (s) :
Mean S.D.
2.5 1.3
1.6 0.8
1. Demo school principals observe their teachers deeming this con-sultant service more important than pilot school principals.
2. Demo school principals perceive this consultant function tobe the most important to their teachers, when considering allof t,iose presented.
When the principals were asked, "How important is it to the
teachers to hags a consultant available to answer their questions
about the general subject matter area (science questions) upon which
the innovative curriculum is based?", they responded on the follow-
ing c:1:itinuum:
1 2 3 4 5 6 7
Very important Unimportant
Mean numerical les,lonse .., 2.3 Standard deviation = 1.4
116

-109-
Comment(s):
1. Principals perceive their teachers valuing the consultantfunction of answering their questions about the generalsubject matter area as being rather important, but not veryimportant.
Inspection of the data by states finds:
Table 131: >Respondents
Frequencies and Percentages per Continuum Interval
% 2 % 3 % 4 % 5 % 6 % 7 %
Pa. Princi . 6 26 9 39
N.Y. Princ1s 7 30 6 26 5 22 4 17 0 0 1 4 0 0
All Principals 13 28 15 33 6 13 5 11 0 0 2 4
Pennsylvania PrincipalsNew York Principals
Comment(s):
Mean S.D.
2.3 1.6
2.6 1.5
1. Pennsylvania principals discern their teachers rating this con-sultant fu,..tion slightly more important than New York princi-pals.
Exarination of the data by school-types finds:
RespondentsFrequencies and Percentages per Continuum Interval
% 2 % 3 % 4 % 5 % 6 % 7
Pilot SchoolPrincipals 5 23 8 36 4 18 4 18
Demo SchoolPrincipals 8 40 7 35 2 10 1 5. 0 0 1
All Principals 13 32 15 36 6 14 5 11
117
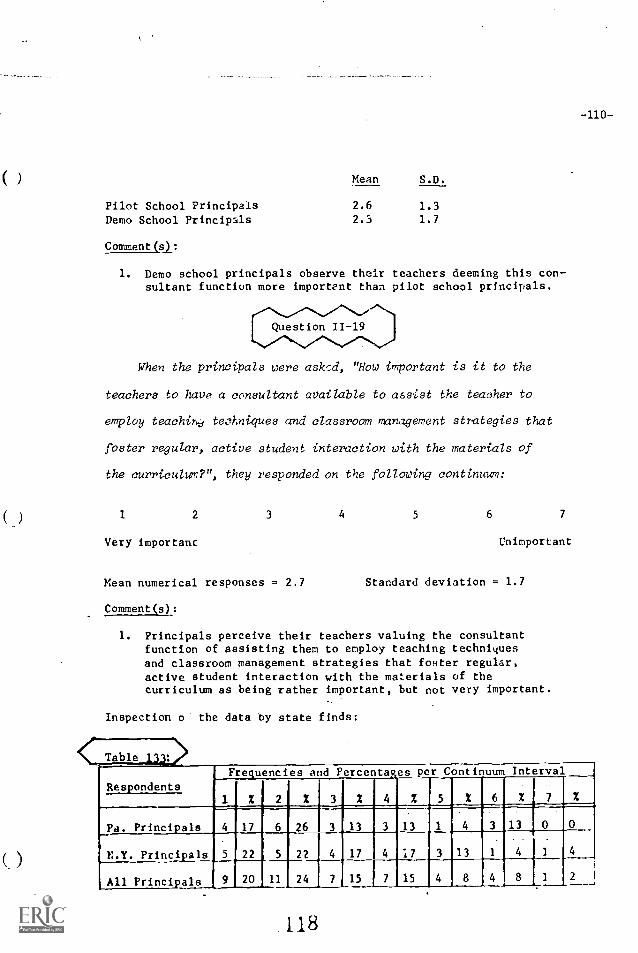
Pilot School PrincipalsDemo School Principals
Comment(s):
Mean S.D.
2.6 1.3
2.3 1.7
1. Demo school principals observe their teachers deeming this con-sultant function more important than pilot school principals.
When the principals were asked, "How important is it to the
teachers to have a consultant available to assist the teacher to
employ teachiny techniques and classroom management strategies that
foster regular, active student interaction with the materials of
the curriculurn?", they responded on the following continuum:
2 3 4 5 6 7
Very important Unimportant
Mean numerical responses = 2.7 Standard deviation = 1.7
Comment(s):
1. Principals perceive their teachers valuing the consultantfunction of assisting them to employ teaching techniquesand classroom management strategies that foster regular,active student interaction with the materials of thecurriculum as being rather important, but not very important.
Inspection o the data by state finds:
<(
-110-
Respondents
Frequencies
1
and Percentages per Continuum Interval
2 2 2 3 X 4 % 5 X 6 X 7 X
Pa. Principals 4 17 6 26 3 13 3 13 1 4 3 13 0
N.Y. Principals_ 5 22 5 22 4 17 4 17
15
3, 13
4 8
1
4___--
4
8
1
All Principals 9 20 11 24 7 15 7
118
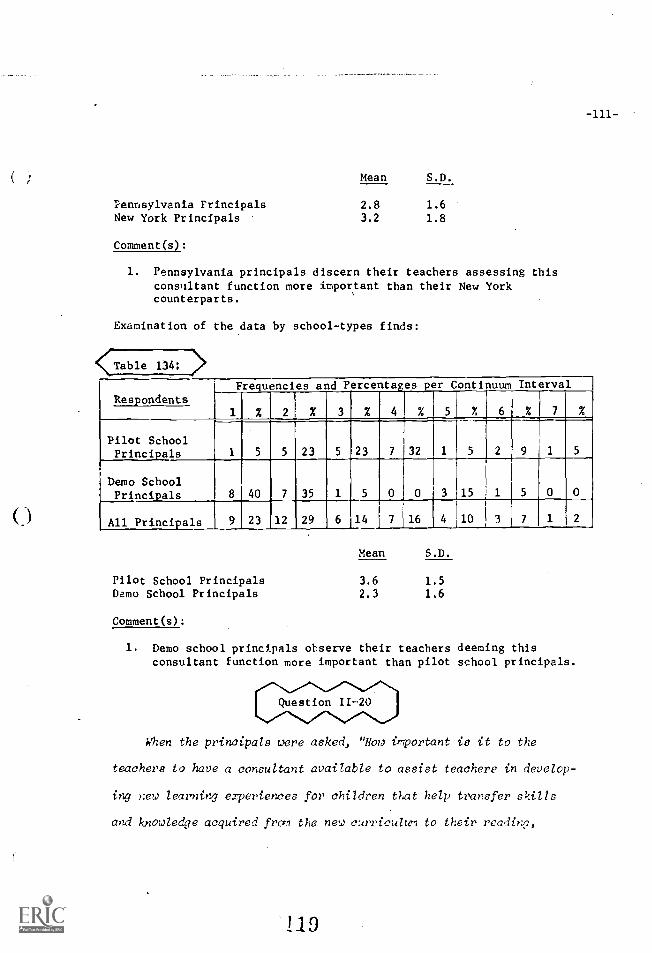
t
0
Pennsylvania PrincipalsNew York Principals
Comment(s):
Mean S.D.
2.8 1.63.2 1.8
1. Pennsylvania principals discern their teachers assessing thisconsultant function more important than their New Yorkcounterparts.
Examination of the data by school-types finds:
< Table 134:
Respondents1 Frequencies
2
and
%
Percentages
3 % 4
per
%
Continuum
5 % 6
Interval
% 71 %
Pilot SchoolPrinci.als 1 5 5 23 5 23 7 32
Demo SchoolPrincipals 8 40 7 35 1 5 0 0 3 15 1 5 0 0
All Princi.als 9 23 12 29 6 14 7 16 4 10 3
Pilot School PrincipalsDemu School Principals
Comment(s):
Mean S.D.
3.6 1.5
2.3 1.6
1. Demo school principals observe their teachers deeming thisconsultant function more important than pilot school principals.
When the principals were asked, "How important is it to the
teachers to have a consultant available to assist teachers in develop-
ing new learning experiences for children that help transfer skills
and knowledge acquired froi the new curriculu1 to their reading,
119
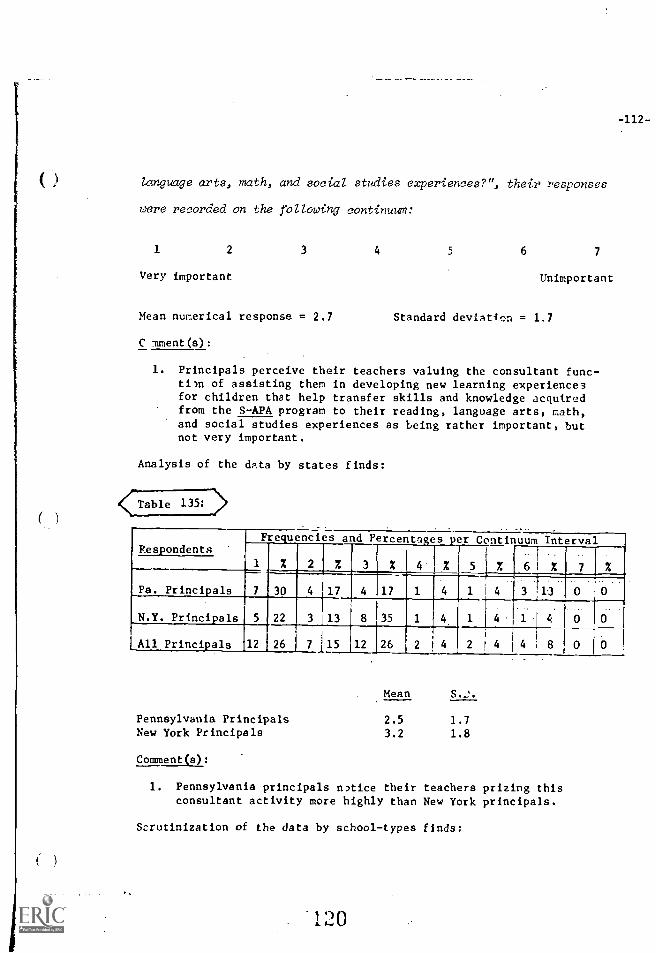
-112-
language arts, math, and social studies experiences?", their responses
were recorded on the following continuum:
1 2 3 4 5 6 7
Very important Unimportant
Mean numerical response = 2.7 Standard deviation = 1.7
C mment(s):
1. Principals perceive their teachers valuing the consultant func-ti)n of assisting them in developing new learning experiencesfor children that help transfer skills and knowledge acquiredfrom the S-APA program to their reading, language arts, math,and social studies experiences as being rather important, butnot very important.
Analysis of the data by states finds:
Table 135: )
RespondentsFre.uencies and Percentaes er Continuum Interval
2 X 3 X 1 4 2 5 X 6 1 X X
Pa. Princi.als S 4 17 4 17 1 4 1 4 3 13 0 0
N.Y. Princi.als 5 22 3 13 8 35 1 4 1 4 1 A
All Princi.als 12 26 7 j15 12 26 2 4 2 4 4 1
Pennsylvania PrincipalsNew York Principals
Comment(s):
Mean
2.5 1.73.2 1.8
1. Pennsylvania principals n'tice their teachers prizing thisconsultant activity more highly than New York principals.
Scrutinization of the data by school-types finds:
120

Table 1361 >
-113-
RespondentsFrequencies and Percentages per Continuum Interval 4
1 2 % 3 % 4 % 5 X. 6 % 7 %
Pilot SchoolPrincipals 5 23 3 14 8 36 3
F
14 4 18 4 18 2 9
Demo School9 45 4 20 5 25 0 0 2 10 0 0
..,
1
01
_Principals
All Principals 14 34 7 17 13 30 i 3 7 6_12 4 8
i
2 4
Pilot School PrincipalsDemo School Principals
Comment(s):
Mean S.D.
3.5 1.8
2.1 1.3
1. Demo school principals see their teachers judging this consul-tant service more important than pilot school principals.
uestion 11-21
When the principals were asked, "Do you think the teachers
believe that a consultant can be more effective in the classroom
working cooperatively with teachers and students or more effective
in the confer.nce room discussing the program with the teacher?",
they responded on the following continuum:
1 2 3 4 5 6 7
Believe consultant Believe consultantmore effective in more effective a-
classroom . way from classroom
Mean numerical response = 2.6 Standard deviation = 1.6
121
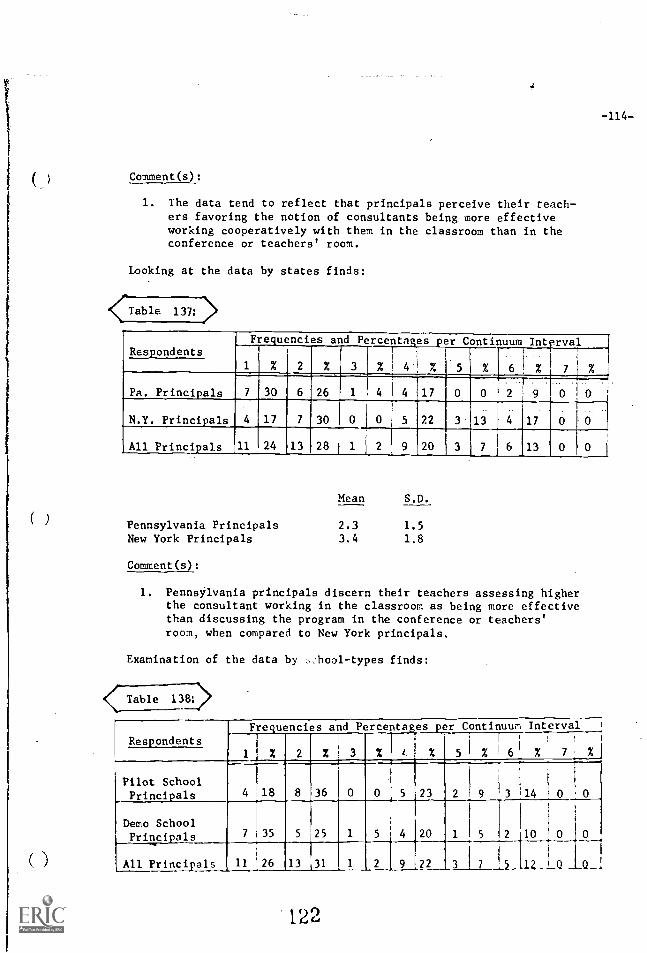
-114-
Comment(s):
1. The data tend to reflect that principals perceive their teach-ers favoring the notion of consultants being more effectiveworking cooperatively with them in the classroom than in theconference or teachers' room.
Looking at the data by states finds:
{Table 137: >
RespondentsFrequencies and Percentages
I
4
per
%
Continuum
5 % 6
IntFrval
1 !
% 7i%1 % 2 % 3 %
P. Principals 7 30 6 26 4 4 17 0 0 2
..
9
4-.
0 i 0
N.Y. Principals 4 17 7 30 0 0 5 22 3 13 4 17
All Principals _11 24 _13 28 1 2 9 20 3 7 6 13 0 0i
Pennsylvania PrincipalsNew York Principals
Mean S.D.
2.3 1.53.4 1.8
Comment(s):
1. Pennsylvania principals discern their teachers assessing higherthe consultant working in the classroom as being more effectivethan discussing the program in the conference or teachers'room, when compared to New York principals.
Examination of the data by 0,_hool-types finds:
Table 13.121>
Respondents
Frequencies and Percentages per Continuum Interval
1 X 2 % 3 X X 5 X 6 , X Xj
Pilot SchoolPrinci.als 4 18 8 36 0 0 5 23 14 0 0
Demo SchoolPrinci.als 7 35 5 25 1 5 4 20 2
1
10 0 0
All Principals 11 426 13 431 1 2 9 22 3 7 L112_ _Q 0_,
122
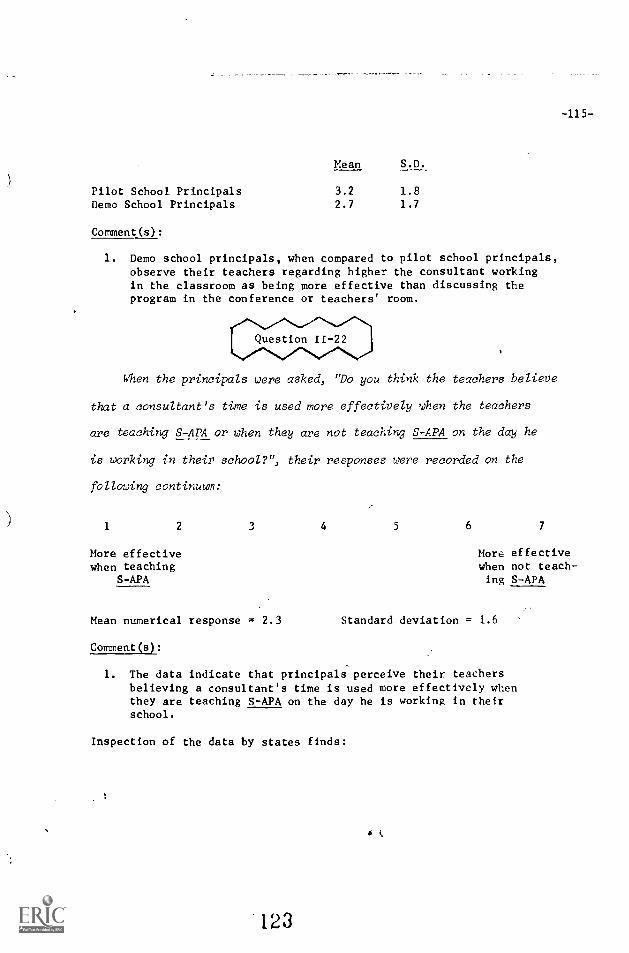
Pilot School. PrincipalsDemo School Principals
Comment(s):
Mean S.D.
3.2 1.8
2.7 1.7
1. Demo school principals, when compared to pilot school principals,observe their teachers regarding higher the consultant workingin the classroom as being more effective than discussing theprogram in the conference or teachers' room.
uestion 11-22
When the principals were asked, "Do you think the teachers believe
that a consultant's time is used more effectively when the teachers
are teaching S -APA or when they are not teaching S-APA on the day he
is working in their school?", their responses were recorded on the
following continuum:
1 2 3 4 5 6 7
-115-
More effective More effectivewhen teaching when not teach-
S-APA ing S-APA
Mean numerical response = 2.3 Standard deviation = 1.6
Comment(s):
1. The data indicate that principals perceive their teachersbelieving a consultant's time is used more effectively whenthey are teaching S-APA on the day he is working in theirschool.
Inspection of the data by states finds:
123
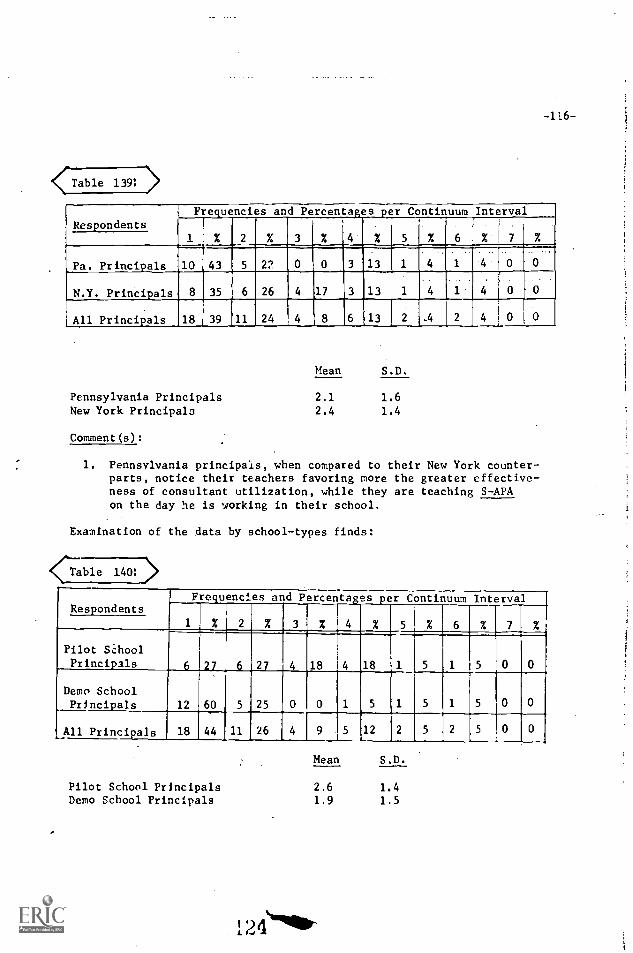
-116-
Table 139: >
RespondentsFrequencies and Percentages per Continuum Interval
1 X 2 X 3 X 4 % 5 % 6 %
Pa. Principals 10 43 5 22 0 0 3 13 1 4 1 4
N.Y. Principals 8 35 6 26 4 17 3 13 1 4 1
__O
4
All Principals 18 39 11 24 4, 8 6 ,13 2 .4 2 4 0 0
Pennsylvania PrincipalsNew York Principals
Comment(s):
Mean S.D.
2.1 1.62.4 1.4
1. Pennsylvania principals, when compared to their New York counter-parts, notice their teachers favoring more the greater effective-ness of consultant utilization, while they are teaching S-APAon the day he is 'working in their school.
Examination of the data by school-types finds:
(Table 140:
RespondentsFrequencies and Percentages per Continuum Interval
% 2 X 3 X 4 X 5 %
Pilot SchoolPrincipals 6
12_.
27
60
6
5
27
25
4
0
18
0
4
1
18
5
1
1
5
5
1
1
5
5
0
0
0
0Demo SchoolPrincipals
All Principals 18 44 11 26 4 9 5 12 2 5 2 5 0 0
Pilot School PrincipalsDemo School Principals
Mean S.D.
2.6 1.41.9 1.5
12e."11W
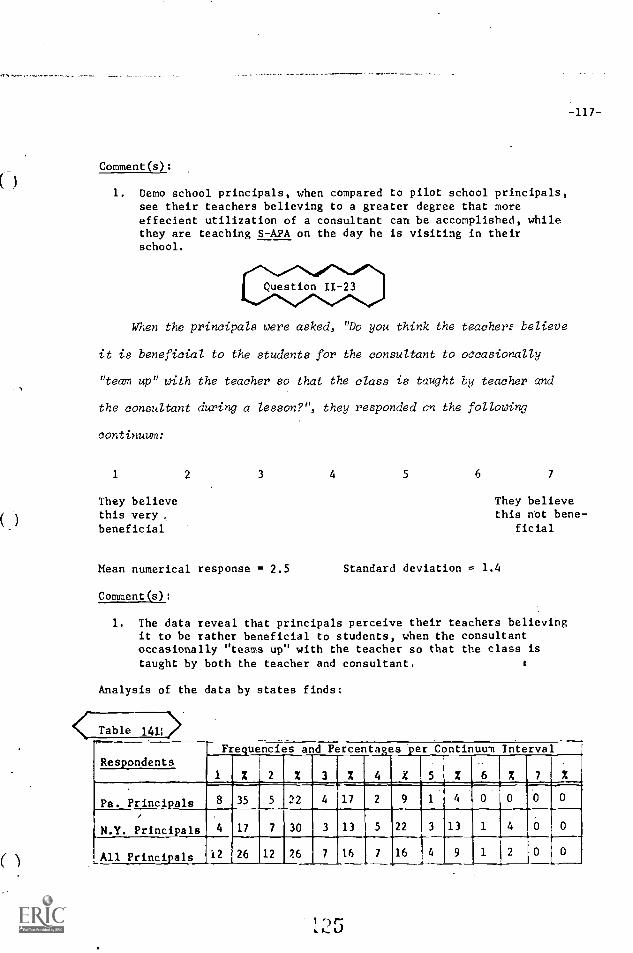
Comment(s):
-117-
1. Demo school principals, when compared to pilot school principals,see their teachers believing to a greater degree that moreeffecient utilization of a consultant can be accomplished, whilethey are teaching S-APA on the day he is visiting in theirschool.
When the principals were asked, "Do you think the teachers believe
it is beneficial to the students for the consultant to occasionally
"team up" with the teacher so that the class is taught by teacher and
the consultant during a lesson?", they responded on the following
continuum:
1
They believethis very .
beneficial
2 3 4 5 6 7
They believethis not bene-
ficial
Mean numerical response r 2.5 Standard deviation = 1.4
Comment (s)
1. The data reveal that principals perceive their teachers believingit to be rather beneficial to students, when the consultantoccasionally "teams up" with the teacher so that the class istaught by both the teacher and consultant.
Analysis of the data by states finds:
< Table 141: >Respondents
Frequencies and Pe rcentages per Continuum Interval
1 2 2 % 3 % 4 X 5 % 6 % 7 %
Pa. Principals 8 35 5 22 4 17 2 9 1 4 0 0
N.Y. Principals 4 17 7 30 3 13 5 22 3 13
,
,..All Principals "2 26 12 26 7 16 7 16 4
---
1 r)
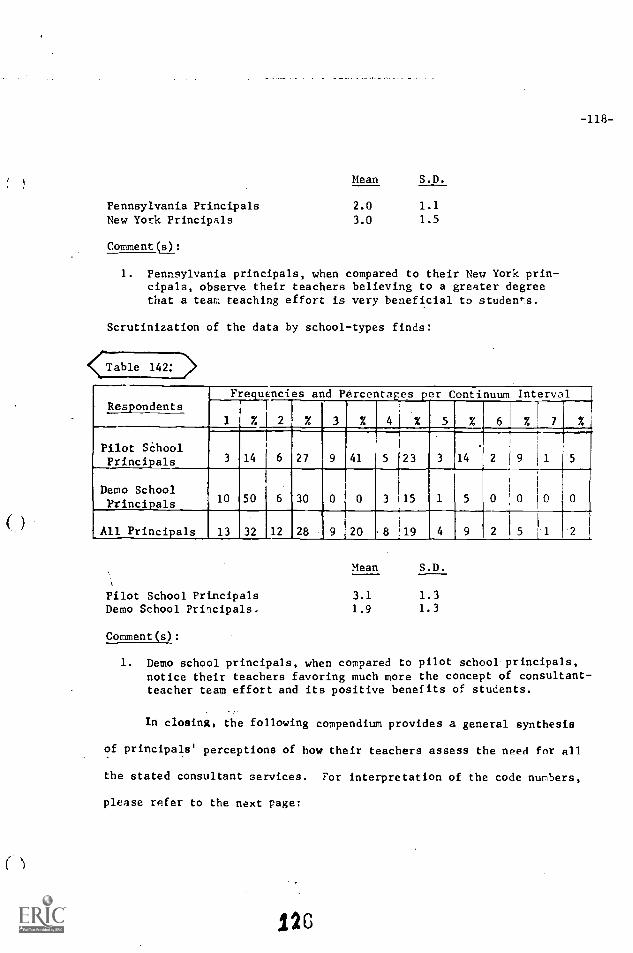
-118-
Pennsylvania PrincipalsNew York Principals
Comment(s):
Mean S.D.
2.0 1.1
3.0 1.5
1. Pennsylvania principals, when compared to their New York prin-cipals, observe their teachers believing to a greater degreethat a team teaching effort is very beneficial to studen,-s.
Scrutinization of the data by school-types finds:
Table 142:
Frequencies and Percentages per Continuum IntervalRespondents I
1
%] 2 % 3 % 4 % 5 % 6 % 7 %
Pilot SChoolPrincipals 3 14 6 27 9 41 5 23 3 14 9 1
Demo SchoolPrincipals 10 50 6 30 0 0 3 15 1 5 0 0
All Principals 13 32 12 28 9 20 8 19 2
Pilot School PrincipalsDemo School Principals.
Mean S.D.
3.1 1.31.9 1.3
Comment(s):
1. Demo school principals, when compared to pilot school principals,notice their teachers favoring much more the concept of consultant-teacher team effort and its positive benefits of students.
In closing, the following compendium provides a general synthesis
of principals' perceptions of how their teachers assess the need fnr all
the stated consultant services. For interpretation of the code numbers,
please refer to the next page:
120
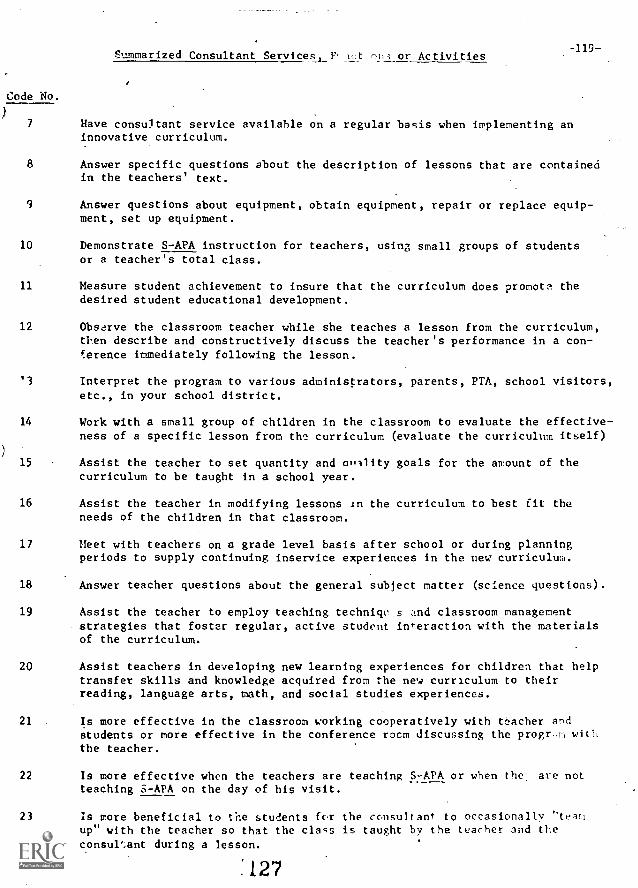
Summarized Consultant Services,_F,Iut Ofl3 or Activities
Code No.
-119-
7 Have consultant service available on a regular basis when implementing aninnovative curriculum.
8 Answer specific questions about the description of lessons that are containedin the teachers' text.
9 Answer questions about equipment, obtain equipment, repair or replace equip-ment, set up equipment.
10 Demonstrate S-APA instruction for teachers, using small groups of studentsor a teacher's total class.
11 Measure student achievement to insure that the curriculum does promote thedesired student educational development.
12 Observe the classroom teacher while she teaches a lesson from the curriculum,tl'en describe and constructively discuss the teacher's performance in a con-ference immediately following the lesson.
'3 Interpret the program to various administrators, parents, PTA, school visitors,etc., in your school district.
14 Work with a small group of children in the classroom to evaluate the effective-ness of a specific lesson from the curriculum (evaluate the curriculum itself)
15 Assist the teacher to set quantity and onllity goals for the amount of thecurriculum to be taught in a school year.
16 Assist the teacher in modifying lessons in the curriculum to best fit theneeds of the children in that classroom.
17 Meet with teachers on a grade level basis after school or during planningperiods to supply continuing inservice experiences in the new curriculum.
18 Answer teacher questions about the general subject matter (science questions).
19 Assist the teacher to employ teaching techniqu_s and classroom managementstrategies that foster regular, active student interaction with the materialsof the curriculum.
20 Assist teachers in developing new learning experiences for children that helptransfer skills and knowledge acquired from the new curriculum to theirreading, language arts, math, and social studies experiences.
21 Is more effective in the classroom working cooperatively with teacher andstudents or more effective in the conference rocm discussing the progr-n witILthe teacher.
22 Is more effective when the teachers are teaching S-APA or when thel are notteaching S-APA on the day of his visit.
23 Is more beneficial to the students for the consultant to occasionally ''tramup" with the teacher so that the class is taught by the teacher and theconsultant during a lesson.
127
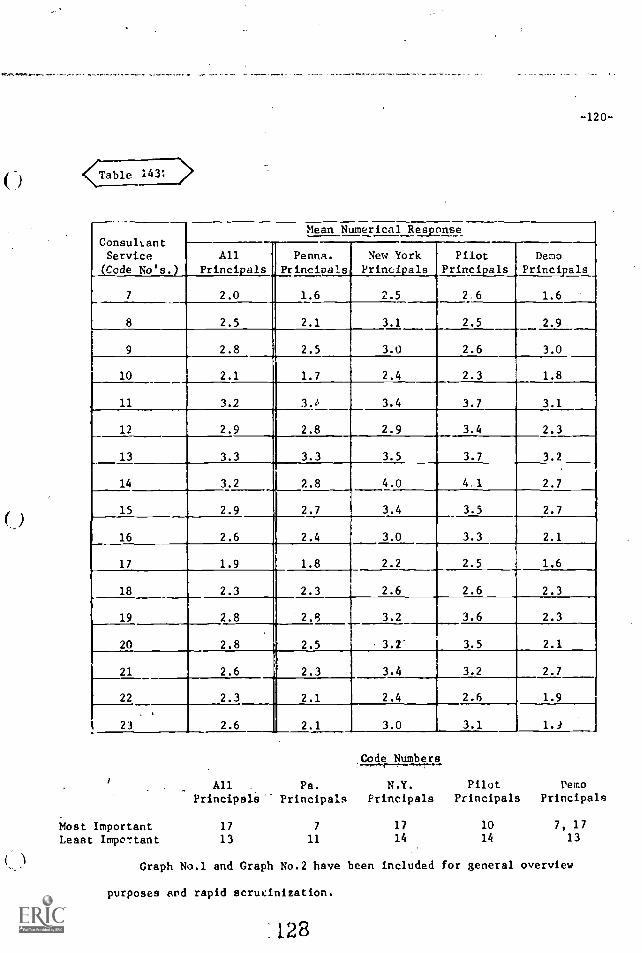
( )
-120-
Table 143: >
ConsullantService
Code No's.
Mean Numerical. Response
AllPrincipals
2.0
Penna.
Principals
1.6
New YorkPrincipals
2.5
Pilot
Principals
2..6
DemoPrincipals
1.67
8 2.5 2.1 3.1
3.0
2.5_
2.6
2.9
3.09 2.8 2.5
10 2.1 1.7 2.4 2.3 1.8
11 3.2 3./. 3.4 3.7 3.1
12 2.9 2.8 2.9 3.4 2.3
13 3.3 3.3 3.5 3.7 3.2
14 3.2 2.8 4.0 4.1 2.7
15 2.9 2.7 3.4 3.5 2.7
16 2.6 2.4 3.0 3.3 2.1
17 1.9 1.8 2.2 2.5 1.6
18 2.3 2.3 2.6 2.6 2.3
19 2.8 2.8 3.2 3.6 2.3
20 2.8 2.5 3.2' 3.5 2.1
21 2.6 2.3 3.4 3.2 2.7
22 2.3 2.1 2.4 2.6 1.9
23 2.6 2.1 3.0 3.1 1.)
All Pa.
Principals Principals Principals Principals Principals
Code Numbers
N.Y. Pilot Demo
Most Important 17 7 17 10 7, 17
Least Important 13 11 14 14 13
Graph No.1 and Graph No.2 have been included for general overview
purposes and rapid scruLinization.
128
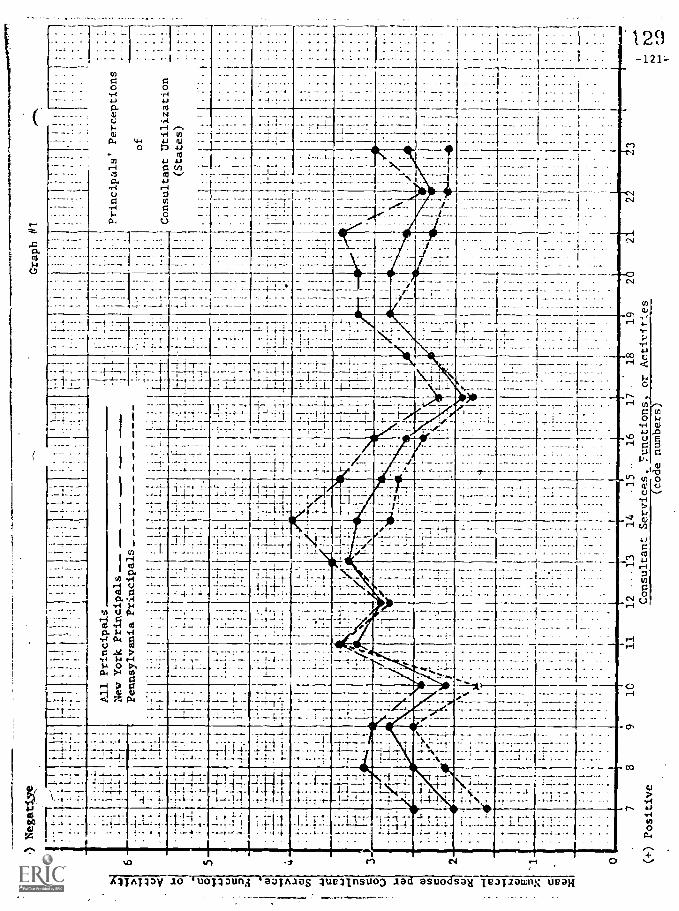
N 0
_rN
egat
1,
7 6 5 3 2 -1 0
Gra
ph#1
.;
...1
. 1 1
,I1'
r
_1-
14
11;
.!
(I
:I.
;!
,
1I
,
;;
1t
1I
I1
...
I. -
-;1.
1.1
;._
,...
.1I
._:-
.4...
.,S
Ill
:II'
.141
-!--
-.--
---7
-'-.4
HL
...
.1_
ii
t.,
;:
::
1:;,
.:,i':
;!'
:1'..
;:
;1
;_'
:..
:1.
1I
I.'
:'IP
I.:I
.11;
.;;;
1,1,
,1
1
,.
:!
- ;
...:.
14
:.
I'
;;
i' i
!
I.'
..
..
,.:.
_I:_
:1.
'.
Pal P
rinc
ipal
s,i-
;-;
--,
!!1
:__
,1
;,..
1i;
1-17
'I
I1-
I,;
!4
'Pr
inC
ipal
S' P
erce
ptio
ns!
:-
tN
ew Y
ork
Prin
cipa
ls-
- -
1;
i:
.{--
1...
14
.Pe
nnsy
lvan
ia P
rinc
ipal
s __
____
____
!.1
,1:
;1-
.;
.of
'.-L
.1
1I.
:.
1:.-
::
' ".
; _1
I.
: _I_
._:
.1
.:!
;H
1:.
ii_
.-
:
-1-i
-L-i
-. 4
I.-
,_.
.1
,
;'
:.
,;
Con
sulta
nt 'U
tiliz
atio
n.
...4.
;_
:...
1;
.1
,__!
..
I:.
[,
1;
,1
14
:-.:
4-i
--4-
I-,
.'!
I4
-4.4
-4
I11-
1t
.ii;
1;I
(Sta
tes)
-1-7
1'
1L
1,-
--*
-L .
I.,...4
4,4
_1.4
4:;
1 4
. I.
.i.._
l__,
, ..,_
,...
;1.
:;
I.-
.1..:
...1-
11.
-1-4
-1.
1:
,._
..
11
.;..
lii.4
,-.1
.1.
4,'..
1S11
--:
11:
11.
.14,
I1
;:
I'
..
i.
1.I
,:
'-I
1.1
;I
'-I
:I
.11.
11
4.
II
1I
.:
1 -
-1+
4.
I1,
.;
1 J
.1,
1IL
SI.-
....S
.-4.
1.1
1..f
..1,..
II_.
1.1:
..1.:
.,I
It..1
:-.
I-.
.-.1
....._
:--
SI
:-..1
.,
4-'
;.
:4,
-_,
11-
1_ '.
..Li
L .
1r.
1,
;,..
.,.;
,__;
!,
,..
;_.
;;
;.1
.I.
1....
14,-
1__;
__;
',-
;i
I.;
II_
L.1
.1:
; 4;4
;i
: .4.
1_1
:I
,I
_:I
.i. I
_;
L:
.,
;.
i__
._1_
1..
.t
I1
.,
;'t-.
TH
.-ri
p :1
.41.
,1.;,
:,I
LI
,41
1:1
_,
.
;I
.4.
_ il_
__-
..--:
.4. ,
4_1.
1.,
..
..1
..1.
.._ ,_
II
.:_
4I
_. 1
'..
!'
;I
1:_
_I.
I1_
.; L
iI.
J.;'4
111_
,-4
'1
I.I
';_
lltL
,,l'"
t-7
t14
-r'
1-4-
-I-4
''''r
Itir
-t._
ti
t-,
,1
c c
1-i
-1-1
-41
:--1
_.-
-;1
,L
I ...
,.t-
i-,,
.,i_
''
'-,
-1,_
1,,i-
t.t.
4, _
1_7_
.i-
1.r
-.--
----
--1
-I' -
1-,
-1-
- 1.
.. ...
; 1:
.:
.: .
; _I
:._
It _
l_.._
._-
1 1.
4 -
'1.
1-:-
-1-
-4 -
L.
1-4
;..;
,',
I.4.
t..:
I..:.
i:_i
14_
,1
I,
'.
1.__
._..
..;
,.;.
..
..
..1
1,_
.'
: i.1
_;._
,_1.
.1
i.
,1
..
,4
71,
.,,_
,:
;_..
.,
.-
1I.
.,,
;'
;I
.i
'1
;:
; -t
;.1
4i'4
4-. I
;4'
-}.
,:
1,
,..1
;.
1.
',
.
I7
Ht..
.-.
;-t -
:r
-.#
t-. 1
._;
_ 1
.1
,;
1'
-- -
',--
....1
_,...
,.,
t. 1
.;.
i_1
1:._
1-..
I. _
#:-
:-.
S
''
!--I
-1i-
1-1-
1--1
.1
1-l-
1i
I4
I'
:1
41
4.I
'1
1_
..
-1:
ir
;1-
.,I
;i
;
._i
_.;
._-_
..1.1
.1_3
;,
;1..
±1-
1 ft
i,_:
.I_
Li_
;..
__;_
._
. :I
0'
1,
..-
: ..
_.:..
;1
0 I-
iI.
:1
i,-L
L-.
;_.."
lk ;
r,
.,
,_
I...1
,_T
,,
'.t
LI.
.1.
,t,f
1. t
Illh
ib-.
1'
_14
.,L
I. L
I%
%1
11
,,
.
_I,
1.;
.,
.,
_%
L.
,,,t
.I
'.1
i -N
I1
.,
1,
,I
,,
,
-- j-
--i'
-i-
1-I
-t-
L_
;1
1;
.1-"
'.
I1
t _1
t1.
1-9
--
t.
t..,a
teff
ilik
111
.
1/
s't.'
1.
r1
rt
1--
AI''
''./
;1
..
1_{
.L. .
-.i
$1
_ I.
,.1..
-t
,1.
. ..."
,i,
.1t
,,r,
,,,,
...,,,
..-q
t.,
. t__
.4.
..,_
- _,
,t
,t._,
1i
t.,
,.
,,.-
1.4
:...
,.,..
,.
_,_.
,i
.....;
....
L..#
,;.'1
.Ti
)._
ri,,
.;4
,,
.1.
,. "
i'
1,
74-
1.,:
i2--
ieL
t 4L
i__i
; 1.-
,._-_
LI
" -, -
,I
'I
-I1
..
I4
,1.
;,
.;
-Ivv
..1
-,..
.,4..
::
I.;
4%11
:-,
1.
I.
..
.,4
'44
:4.
,,
..I
''-
44 -
1'
1
1_:
-..
;;
TI.
.,
.I
-i-
i,
';
'1
.1
.:
I
44
14
4f
-1,
,:
'4
I- f
t-t
,I, ,
4_,
.I
,,!:
,,,!,
ii.it,
i,,.,i
:.
..11
..__
,.,,
.II
:44
:H
I, ,:
H;
li,.;
....;
HI
.:i.
,,
.,
..
.I
..
:_;_
f1
1I
;,
.p
.,
.,
-I
It--
-:;1
1''.
';ii-
l,t
i,H
i:_,
;'
4;;
1I.
,, -
-;
0.
,r
r-;
-'
I;
P-1,
-1;
!!
:!
;'.
!;
1;1
;;
:;
::
iI
.,
..
I!
-.I
;;
L"
.,__.
-___
___
-rr
;;:
''
1'
'P
PI
:;
I4
i1
4-;
4'
iI
;,
L .
41
1
..
..
: ..
.;
.,
.._:
.p
..
,
I
L...
:III
...,;;
;.;,
:1,
:;
..
,,
1;p
H,
.4',,
:,
.:
1.
A.
I I
I,
I,
.1
.I
;
..
.;
,!
I
i,
*.;
II
;;
;
.:
i.
:
.I
1i
!*
.
1A
01A
1110
141
/.1C
11
11n
-,
(+)
Posi
tive
Consultant Services, Functions, or Activities
(code numbers)
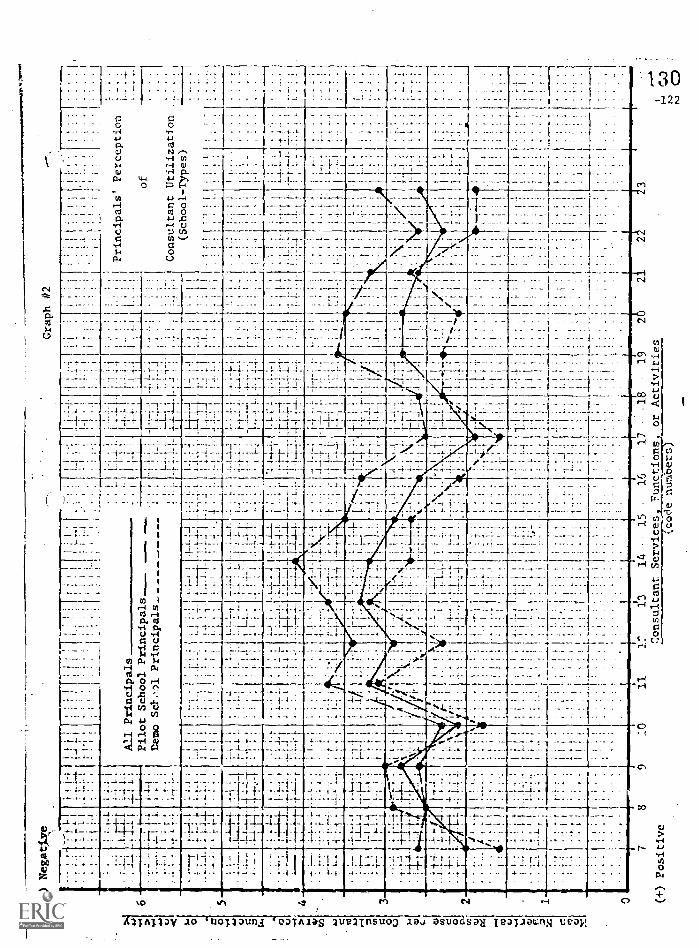
(-)
Neg
atpK
e7 2 1
Graph #2
..
....
--t.
1-
rL
I
._L
;I.
1'
'.
.
i-i.
1:,..
t.-L-
:.,_
;._ t.
..
7.i.
I,.
II-4
.--j
.,.
t - ' t
I
;
.:
7
I
.
.1.1
1711
ii
.:
II
7-I
_ -,
,I
1I
:...
1'
1
I.1,
'
I
,-
Ii
,f
L:-
IL.
4_L
I.,1
I:
1_;
.
1.1
,.
1.
.
1 ;II',
I1.
:.
1/
... .;
/I
:
I'
'.
.1
1.
1
:'
I,
..
.
.
_.
.L.
::
,- I,
"i_
1.
4,..1
.
I 1.
1:
1_.
4:1
1.,
t1,
.. ..
All
Principals
_ ,
I
I1
_1_
:
4.4
I
I;_
t!
-11,
iLt
.1
.& .1
_ 1.
.
.4. i
._i
;_t_
...1-
1-,
..7;
:1
.._1
_
_I.:
:.I
_41
::
..
,. I
,:
.I
./
t.
Principals' Perception
of
Consultant Utilization
.- ,
:
,_._
_
..4
_..
N.
,. '
t,
Pilot School Principals
, -4-
44.
4 4
:Demo
scr.
,:>3.
Principals_--------
::
;;
r":
'
'.i.
7; i:
1L.
._ ,
_ /.
_l_
I,
_--.
',--1
. i:I
t'
....-
.."-7
- ,
.'
-4.'
1;-.
1-.1
1
- :
. ,7
, ';
--r-
r...
,3,
:..
.
-t.1
-1-
: :-
17.1
_t_
Ii.
;- /
,.
:-7
',
: :.
t -.
,;
.:
..
., 4
. 1 1
,1
i
I:
1,;
, '
-' .i
i
, _
;I-
i
,
,...,.
1
71
1 , 1
.1
. 1
14
.1i
1_1
... t.
_.1.
_1
4,...
..,.
4.1
---,
--7
;.:
1..4
,-,
1
..,
. ..
{"
'
Lt' i
1., _
1.. ,
...,
_i
.- 1
i1
!r
;
4
I...
L_t
_I.
.i...
,.4
-L-
:'
1.
1
1
i ...:
;i
!_I
1.
,.
.
.1,,
..i41
/.1_:
..
,:.
,:
; ,I
1.
:I.
..
I1
7
! ,
(School-Types)
:;:I
'.
71.i
1!
',
..-
- --
':
_..
..;
__
...L
4,..1
._.1
._...
.4 ,
.1...
..t..-
4._
_;._
_,...
1_1.
1
-....
1:
t.
_..i
-1 .1
4-4
-
_t_.
4_...
t
iH I
.
...H
.. 1
_1._H.
t,
.;
..
1..: /
.,
.4
:,
_,!_
11.1
:t.
t.,:
'
2- 4
,%
LI,'
t.1
;;
':
'
-...,
...:
4.
'''' .t
,'
.i
:.-.1
-
/11_
1,.
L_._
.-
._j
,!
_._
.1_.
_
7 -t
4-1
4_,-
.4_1
_.1
-1-4
--1-
. L.
,,
1/1,
... i1
- i.
-:--
--.
1-4
4- -
,--1
---j
_,__
:,_,
/.:.
,4
F.
-.: _
14-1
---
f-t-
-1
-.4-
-' -
1-'-'
'. -
i.- I
-,-
:, _
i_
1-,
1- i.
---i.
-:-
.--t
1=4-
-4.-
-'
-I-.
1--'-
- ; _
L.',
t_4_
t__,
ii
,
L.L
.' -
,-
4-1-
'-i.
.1...
.../..
.i.-
÷ '-
-
,,
'
-
-.
,:
,.. ,
1.
I
II'l
.-
ri
;I-
nt
4--
.:
i
...
,
1 -..-
-4
.:
I
..
It-
-,
,I
'- ,
4,.,
11 - i
-7,
1'
',--t
-1-
7'7
-1-
-7--
.L
* T
, -1-
"-
,_
.
'-
._"
. __
-t-
_.L
...-
..--,
. -1_
,.'r
r
i-.1
4 4
.I
11-
i''
......
_i-'
-t-:
- r
.
4 -1.
./
..
,. -
,.-
----
-1
1,-1
-:-
,1
_I: .
..._
-1_
it
'-
r--
-r-I
..!1-
- -1
-4 _
l__
::
- .-
-'--"
*--
.I.
_..
_.1,
-;-f
-t--
4-
_1-
-114
-1 -
--
4
-4-
;..H
1
-I,-
i
--,'1
- 1
':
L1
1-
1:
.
.._:
A:
._:_
. _
._I
-
,I .
, ;.
!.
.'
'.
:
' ,
.I
7 -:
'
,.4
i 1I
1
1
-..
Ir
'7 -
',7
'','
7-V
;.1
,. .
4. '.
.
''
iti
. '
' .4.
1t
'"--/
-41
-t-
4,..
:._,
.,
.r;
- '- ' , ._
kIllk
.
.: _
.L ..
J
-.17
,,-;
--1-
:!
I
L.i.
;
_I.1 i
,
i_; _
4, L
- ,
',.,_
..1i
4
1_,
,,i,
-1-',
-i-
Ti
-
I,'
_i...
t_ I'
:4
-.,
,t
1,
i4_
,,,
,
,
;;
.
..1.,
......
,
I.
,.
I:
1
.i
-
,,
''
.
!;
1
'1
'
4 1-
, :
I.
1,
-
Ir-
I
j.- t-
i4
.4,
i.
:
!
:-
4....
.._,
..
..
,
!. .;.
-_.
4_,
:4_, -1
t-47
-,
___"
ttl..
-Li _
I!.
.1,1
_,I
,...4
..1
;: .
I _
:.
±-1
4./
1-
.-..; 7
l4_
4.
...,
4,,
'I
.
?'
%t
'1
;I
,
\''t
;:
.
,:
.1.
:t _
..
;,i
. L-i
,--- '
: t I
't -.1t
4I4
'r
1
",
.
S
,,
..-
: .1.
.,
."
' 1
'.-.
I 'f-
, t tI
'"%
'
1
ii'l
:
.,t
/---
1--
-'I-
1-'
:. 7
.4-
1
_I
-
7
,f
iI
I
,;
1. l
II
"41
11-N
I\;.
;
!I
;'
-
J I_ 1
'. ; f
7-.
. ''
-
I..7
,
;-
- .
I' ._
,`r
..,,
I7.
i I: .
I.
,
./.,
1.
I!
I.
.i-
Tt.
4
.._1_
, ".
:.4
..
t- __
A.
-;/i
.1
1
14.7
._:.
.L.
';1.-
-1.-
i'
._:_
..
I.
,
.,.'
AL
4- ,N
,
LiN
i
,'.
.1
I;
;4
;
y.:
?0-
;4:
-I
i'--;
,. , 4,
1,
1 kV
.'."
.; :
40.
--
1!
I,
I.
;,
".'
.I
,'4
'--1-
i
,.-
-i--1
-!-
1-1-
7'
:-
1
:.
i-.--
.1--
-
i."
7- -
.7 -
}-
7;
:.1
-I-
"--/
-t
7
`
L N
.,
,--0
-,,.-
:-"
1 '
'
L- :
A.
i
-'1
'
;;
-1
-I
,.
.1
1i
'.
. .
4 !-:
:L
1.
11
4i '
.I
.,...
1...
..
L-:.-
.,...
....-
...-
.I
1T
rI
,)-
1I
i;
;
i
.
.
4
:..
iI
1
,.
.
4 -,
-I -
I'
4,
.
!i
.
1i
1-
,
i;
1,,;-
'
,....1 I "1_,
11_
1
1
,,,1'
.;
1!
.,
,.
4
4,,,
-,
I.
..
,.
;.
I4
i1
?'
I:
I!
-.
,:
1
-.-
I;
.I
!I
-
''
4
'-tI
f..,
,,
..
I
tit!
- .
.., I:
4.
.4,
,4
4
'4I
;4
:,
:i
4
4..
:,
,.
..
1:
;4.
:L
ii
,,
,4
..
,;
i.
,
,4,
.. .
..
:
,_. .
.:
.:
:
.._
i'
I-;
L..
I.
.
.11
,_;
:_.
I
,
iI
1:4,
., 4
,
4,
..
4I.
,;
,
.!
4.
:;
.4
i I
4.
--
.
1.
L.
:4,
.:
..
1..
4.1
,.
,,,,
,
-.
-.
.
I'
, .'
...
.--
(+) Positive
1314
- IS
10-
1110
Consultant. Services,. Functions, or Activities
(code numbers)
Ll
0
Part III
"Consultants' Perceptions of Consultant Utilization"
l&I
-123-
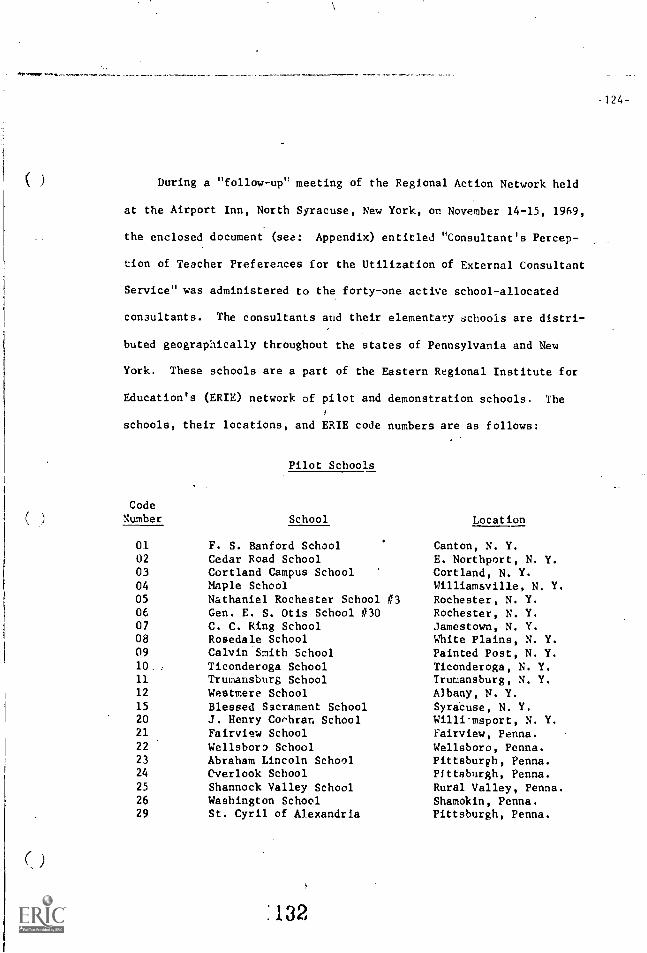
0
During a "follow-up" meeting of the Regional Action Network held
at the Airport Inn, North Syracuse, New York, or. November 14-15, 1969,
the enclosed document (see: Appendix) entitled "Consultant's Percep-
tion of Teacher Preferences for the Utilization of External Consultant
Service" was administered to the forty-one active school-allocated
consultants. The consultants and their elementary schools are distri-
buted geographically throughout the states of Pennsylvania and New
York. These schools are a part of the Eastern Regional Institute for
Education's (ERIE) network of pilot and demonstration schools. The
schools, their locations, and ERIE code numbers are as follows:
Pilot Schools
CodeNumber School Location
01
02
03
04
F. S. Banford SchoolCedar Road SchoolCortland Campus SchoolMaple School
Canton, N. Y.E. Northport, N. Y.Cortland, N. Y.Williamsville, N. Y.
05 Nathaniel Rochester School 1,`3 Rochester, N. Y.06 Gen. E. S. Otis School #30 Rochester, N. Y.07 C. C. Ring School Jamestown, N. Y.08 Rosedale School White Plains, N. Y.09 Calvin Smith School Painted Post, N. Y.10. Ticonderoga School Ticonderoga, N. Y.11 Trumansburg School Trumansburg, N. Y.12 Westmere School Albany, N. Y.15 Blessed Sacrament School Syracuse, N. Y.20 J. Henry CoPhran School Willi-msport, N. Y.21 Fairview School Fairview, Penna.22 Wellsboro School Wellsboro, Penna.23 Abraham Lincoln School Pittsburgh, Penna.24 Overlook School Pittsburgh, Penna.25 Shannock Valley School Rural Valley, Penna.26 Washington School Shamokin, Penna.29 St. Cyril of Alexandria Pittsburgh, Penna.
132
-124-

(_)
CodeNumber
Demonstration Schools
School Location
30
31
Campbell Central SchoolClinton School
Campbell, N. Y.Clinton, N. Y.
32 G. "Zerton Davis School Malone, N. Y.33 Friendship Central School Friendship, N. Y.34 Gardiners Avenue School Levittown, N. Y.35 Groton School Groton, N. Y.36 Hancock School Hancock, N. Y.37 John Kennedy School Batavia, N. Y.38 North Hill School Cheektowaga, N. Y.39 Onondaga Hill School Sjracuse, N. Y.40 Park View School Kings Park, N. Y.41 Paulding School Tarrytown, N. Y.42 Scotchtown Avenue School Goshen, N. Y.43 Sherman-Massey School Watertown, N. Y.
44 Sloatsburg School Sloatsburg, N. Y.45 Stevena School Scotia, N. Y.46 Watkins Glen School Watkins Glen, N. Y.50 Ben Avon School Pittsburgh, Penna.
51 Boalsburg School State College, Penna.52 Brighton Township School Beaver, Penna.53 Hamilton School Carlisle, Penna.54 Hoffman Avenue Schor. Windher, Penna.
55 Inglewood School Lansdale, Penna.56 Johnsville School Warminster, Penna.57 Lamar Township School Mill Hall, Penna.
58 Lionville School Downingtown, Penna.59 Norwood School Norwood, Penna.60 Roosevelt School Mecla, Penna.61 Smethport School Smethport, Penna.62 Dr. Edward Tracy School Easton, Penna.63 White Oak School McKeesport, Penna.64 Woodward School Lock Haven, Penna.
The consultants are presently full time teachors of science,
science education or elemcntary education at colleges or universities
in the states of Pennsylvania and New York. The consultants, their
schools and locations are as follows.
' 33
-125-
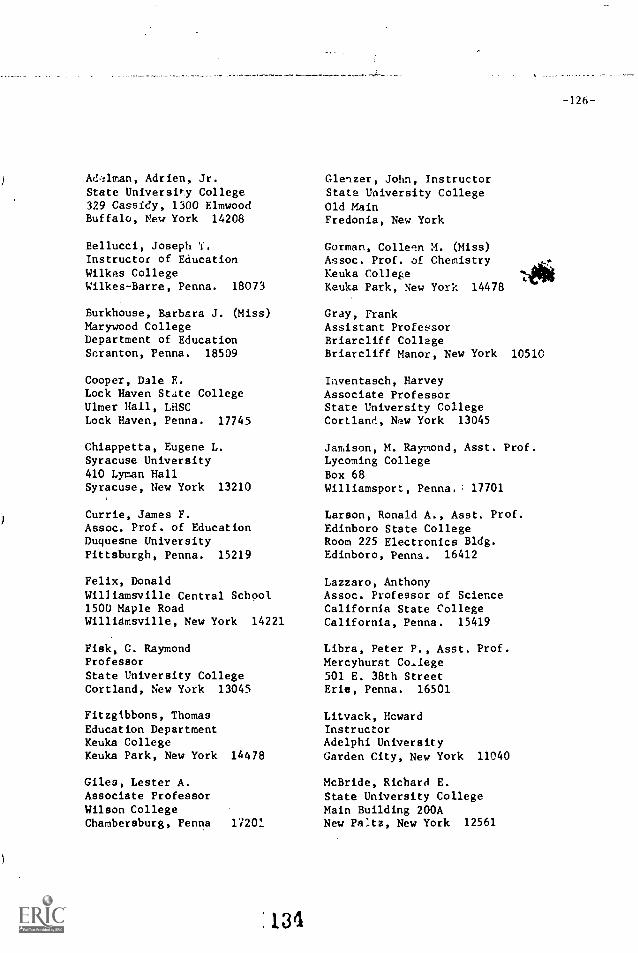
A&41man, Adrien, Jr.State University College329 Cassidy, 1300 ElmwoodBuffalo, New York 14208
Bellucci, Joseph T.Instructor of EducationWilkes CollegeWilkes-Barre, Penna. 18073
Burkhouse, Barbara J. (Miss)Marywood CollegeDepartment of EducationScranton, Penna. 18509
Cooper, Dale E.Lock Haven State CollegeUlmer Hall, LHSCLock Haven, Penna. 17745
Chiappetta, Eugene L.Syracuse University410 Lyman HallSyracuse, New York 13210
Currie, James F.Assoc. Prof. of EducationDuquesne UniversityPittsburgh, Penna. 15219
Felix, DonaldWilliamsville Central School1500 Maple RoadWilliamsville, New York 14221
Fisk, G. RaymondProfessorState University CollegeCortland, New York 13045
Fitzgibbons, ThomasEducation DepartmentKeuka CollegeKeuka Park, New York 14478
Giles, Lester A.Associate ProfessorWilson CollegeChambersburg, Penna 17201
134
Glenzer, John, InstructorState University CollegeOld MainFredonia, New York
Gorman, ColleenAssoc. Prof. ofKeuka CollegeKeuka Park, New
M. (Miss)Chemistry
York 14478
Gray, FrankAssistant ProfessorBriarcliff CollegeBriarcliff Manor, New York 10510
Iaventasch, HarveyAssociate ProfessorState University CollegeCortland, New York 13045
Jamison, M. Raymond, Asst. Prof.Lycoming CollegeBox 68Williamsport, Penna. : 17701
Larson, Ronald A., Asst. Prof.Edinboro State CollegeRoom 225 Electronics Bldg.Edinboro, Penna. 16412
Lazzaro, AnthonyAssoc. Professor of ScienceCalifornia State CollegeCalifornia, Penna. 15419
Libra, Peter P., Asst. Prof.Mercyhurst Co..lege
501 E. 38th StreetErie, Penna. 16501
Litvack, HcwardInstructorAdelphi UniversityGarden City, New York 11040
McBride, Richard E.State University CollegeMain Building 200ANew Feltz, New York 12561
-126-
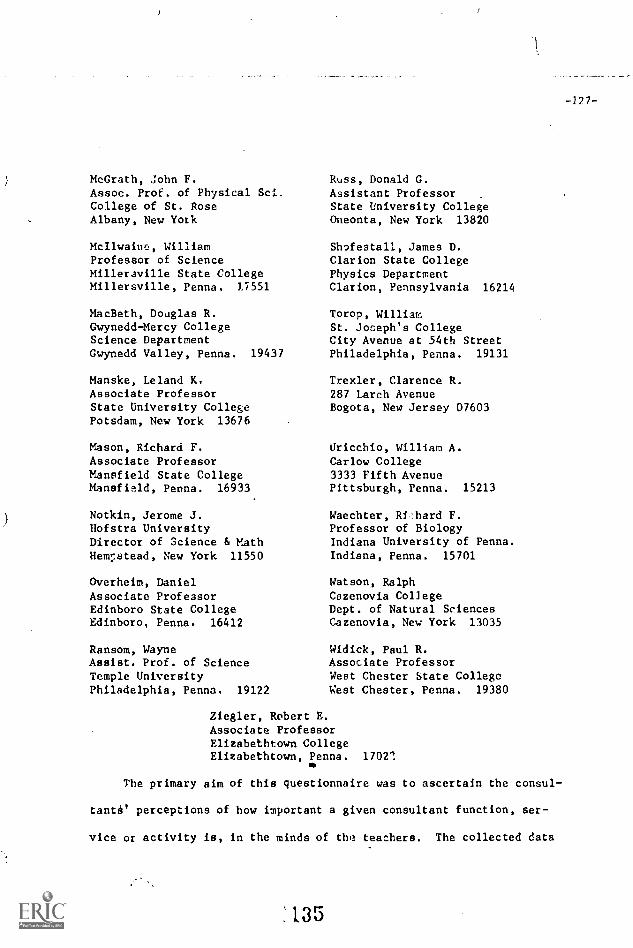
McGrath, John F.Assoc. Prof. of Physical Sci.College of St. RoseAlbany, New Yotk
McIlwaiue, WilliamProfessor of ScienceMillersville State CollegeMillersville, Penna. 17551
MacBeth, Douglas R.Gwynedd-Mercy CollegeScience DepartmentGwynedd Valley, Penna. 19437
Manske, Leland K.Associate ProfessorState University CollegePotsdam, New York 13676
Mason, Richard F.Associate ProfessorMansfield State CollegeMansfield, Penna. 16933
Notkin, Jerome J.Hofstra UniversityDirector of Science & MathHemr:atead, New York 11550
Overheim, DanielAssociate ProfessorEdinboro State CollegeEdinboro, Penna. 16412
Ransom, WayneAssist. Prof. of ScienceTemple UniversityPhiladelphia, Penna. 19122
-127-
Russ, Donald G.Assistant ProfessorState University CollegeOneonta, New York 13820
Shofestall, James D.Clarion State CollegePhysics DepartmentClarion, Pennsylvania 16214
Torop, WilliamSt. Joseph's CollegeCity Avenue at 54th StreetPhiladelphia, Penna. 19131
Trexler, Clarence R.287 Larch AvenueBogota, New Jersey 07603
Uricchio, William A.Carlow College3333 Fifth AvenuePittsburgh, Penna. 15213
Waechter, Ri-hard F.Professor of BiologyIndiana University of Penna.Indiana, Penna. 15701
Watson, RalphCazenovia Col]egeDept. of Natural SciencesCazenovia, New York 13035
Widick, Paul R.Associate ProfessorWest Chester State CollegeWest Chester, Penna. 19380
Ziegler, Robert E.Associate ProfessorElizabethtown CollegeElizabethtown, Penna. 17021
The primary aim of this questionnaire was to ascertain the consul-
tantB' perceptions of how important a given consultant function, ser-
vice or activity is, in the minds of the teachers. The collected data
:135
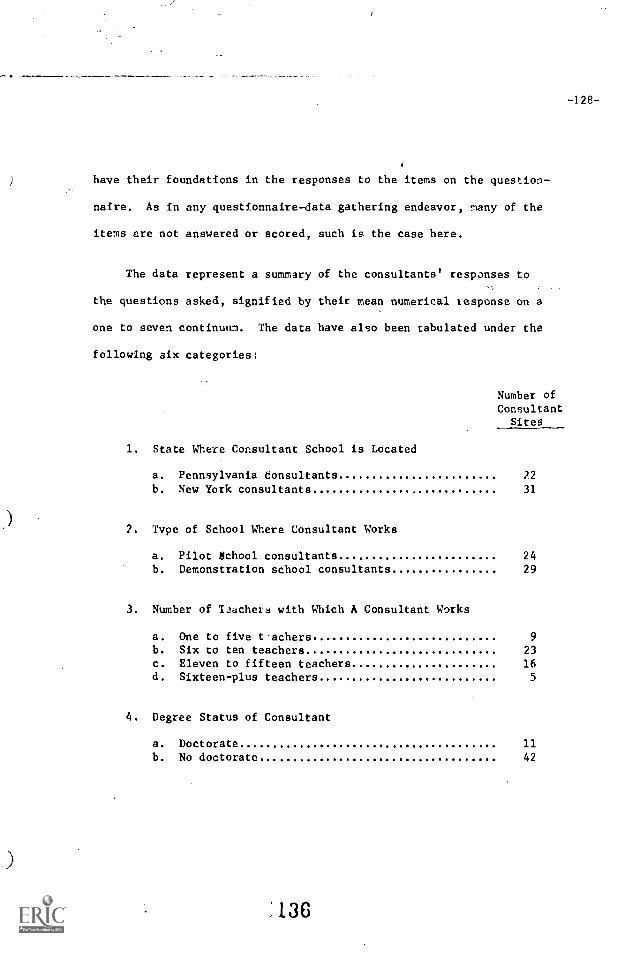
-128-
have their foundations in the responses to the items on the question-
naire. As in any questionnaire-data gathering endeavor, many of the
items are not answered or scored, such is the case here.
The data represent a summary of the consultants' responses to
the questions asked, signified by their mean numerical response on a
one to seven continuum. The data have also been tabulated under the
following six categories:
Number ofConsultant
Sites
1. State Where Consultant School is Located
a. Pennsylvania consultants 22
b. New York consultants 31
2. Type of School Where Consultant Works
a. Pilot School consultants 24
b. Demonstration school consultants 29
3. Number of Taachera with Which A Consultant Works
a. One to five t-achersb. Six to ten teachers 23
c. Eleven to fifteen teachers 16d. Sixteen-plus teachers 5
4. Degree Status of Consultant
a. Doctorate 11
b. No doctorate 42
:136
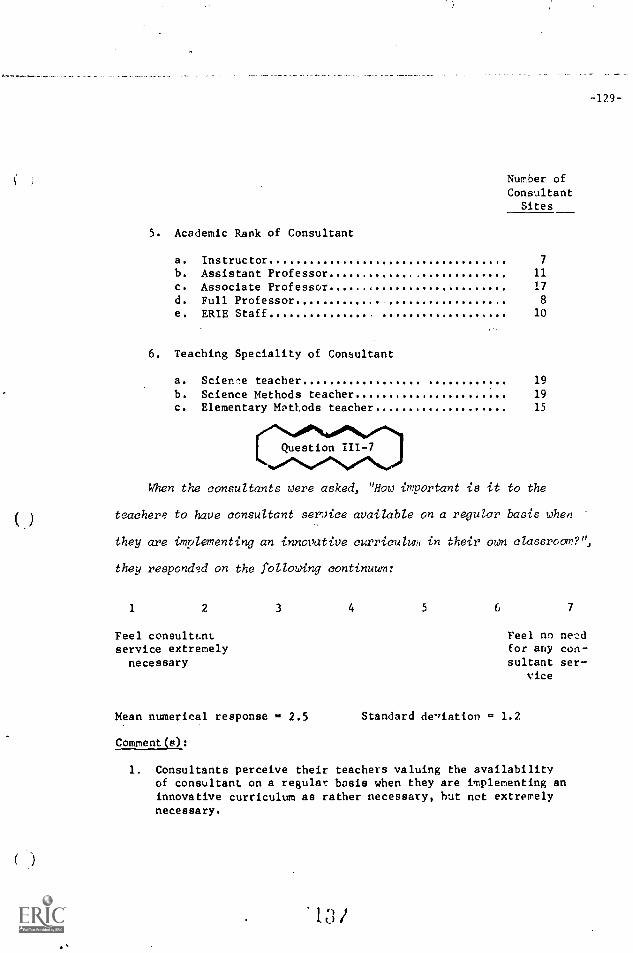
-129-
Number ofConsultant
Sites
5. Academic Rank of Consultant
a. Instructor 7
b. Assistant Professor 11
c. Associate Professor 17
d. Full Professor 8
e. ERIE Staff 10
6. Teaching Speciality of Consultant
a. Scien.le teacher 19
b. Science Methods teacher 19
c. Elementary MetLods teacher 15
When the consultants were asked, "How important is it to the
teachers to have consultant service available on a regular basis when
they are implementing an innovative curriculuw in their own classroom?",
they respond?d on the following continuum:
1 2 3 4 5 6 7
Feel consultmt Feel no needservice extremely for any con-
necessary sultant ser-vice
Mean numerical response 2.5 Standard deiation = 1.2
Comment(s):
1. Consultants perceive their teachers valuing the availabilityof consultant on a regular basis when they are implementing aninnovative curriculum as rather necessary, but not extremelynecessary.
I
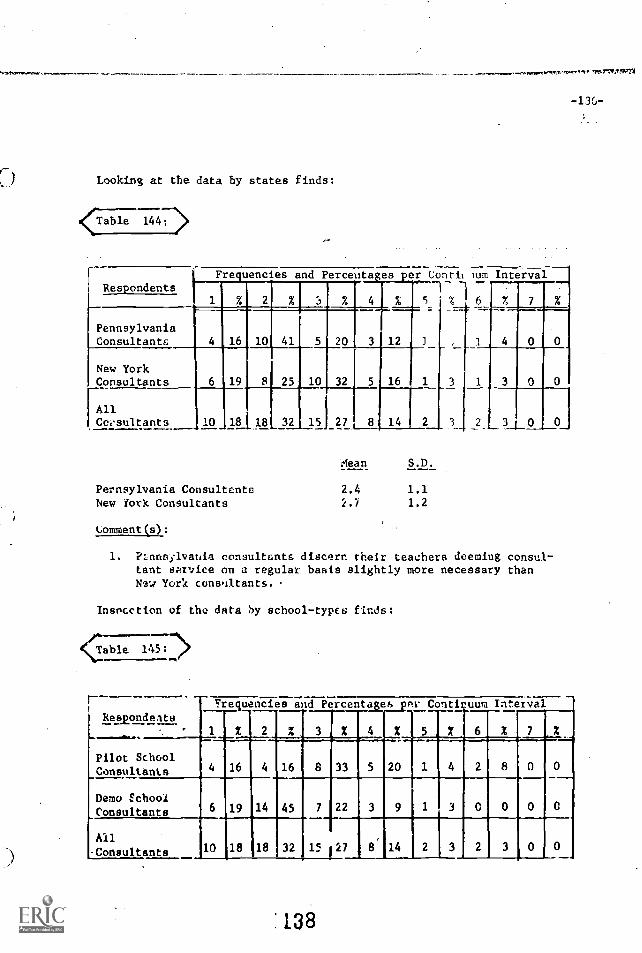
Looking at the data by states finds:
'ITab17 1447>
Respondents
PennsylvaniaConsultants
New YorkConsultants
AllCcesultants
Fre uencies and Percents es
F16
19
41
10
10 8
Pennsylvania ConsultantsNew fork Consultants
Comment(s):
32 15 27
er Conti i lum Interval
4
3
5
%
12
16
5 %6
Mean S.D.
2.4 1.12.7 1.2
11"0
3 0
1. Rznnsylvania consultants discern their teachers deeming consul-tant vavice on a regular basis slightly more necessary thanNew York consultants.
Insrcction of the data by school-types finds:
Table 1.77-1>.....1=11,,
-re,r144.tePra.
-13G-
RemondeltsFreciLrcies
1 2 2
and Percentampei
X 4 X
Contiruum
5
Interval
X 3 X 6 % 7 X0-----.,..,
Pilot SchoolConsultants 4 16 4 16 8 33 5 20 1 4 2 8 0
Demo SchoolConsultants 6 19 14 45 7 22 3 9 1 3
All
-Consultants 10 118 18 32 15 127 8 14
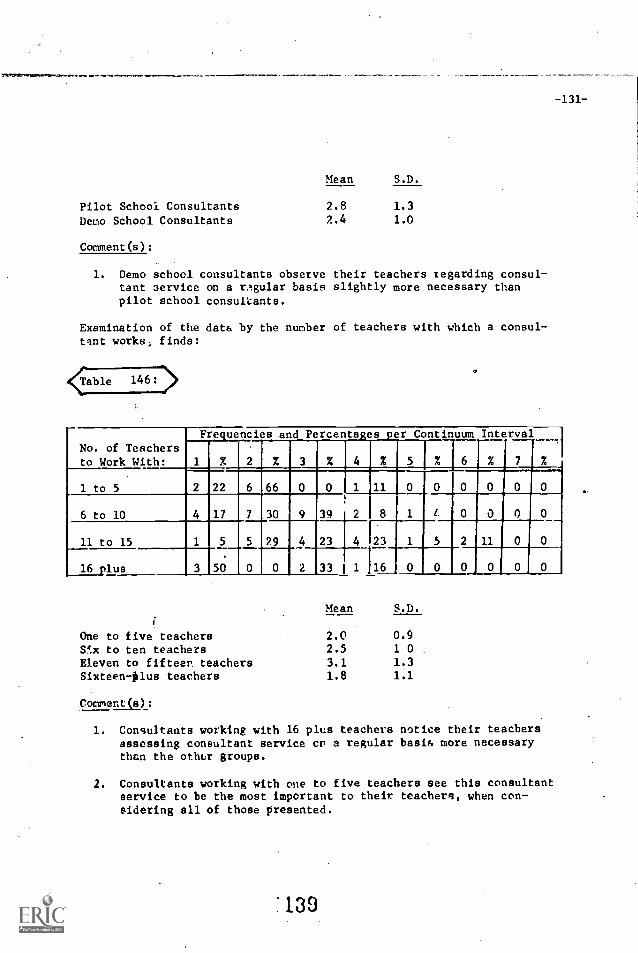
-131-
Pilot School ConsultantsDemo School Consultants
Comment(s):
Mean S.D.
2.8 1.32.4 1.0
1. Demo school consultants observe their teachers regarding consul-tant aervice on a r.gular basis slightly more necessary thanpilot school consultants.
Examination of the data by the number of teachers with which a consul-tant works, finds:
Table 146;
No. of Teachersto Work With:
411112sies
1 %
and Percentages per Continuum Interval
2 % 3 % 4 % 5 % 6 % 7 %
1 to 5 2 22 6 66 0 0 1 11 0
6 to 10 4 17 7 30 9 39 2 8 1 1 0 0 0
11 to 15 1 5
,
5 29 4 23 4 23 1 5 2 11 0
1Plus 3 50 0 1 0 2 33 1 1 .16 0
Mean S.D.
One to five teachers 2.0 0.9
Slx to ten teachers 2.5 1 0
Eleven to fifteen teachers 3.1 1.3
Sixteen-Plus teachers 1.8 1.1
Comment(s):
1. Consultants working with 16 plus teachers notice their teachersassessing consultant service or a regular basis more necessarythan the other groups.
2. Consultants working with one to five teachers see this consultantservice to be the most important to their teachers, when con-sidering all of those presented.
139
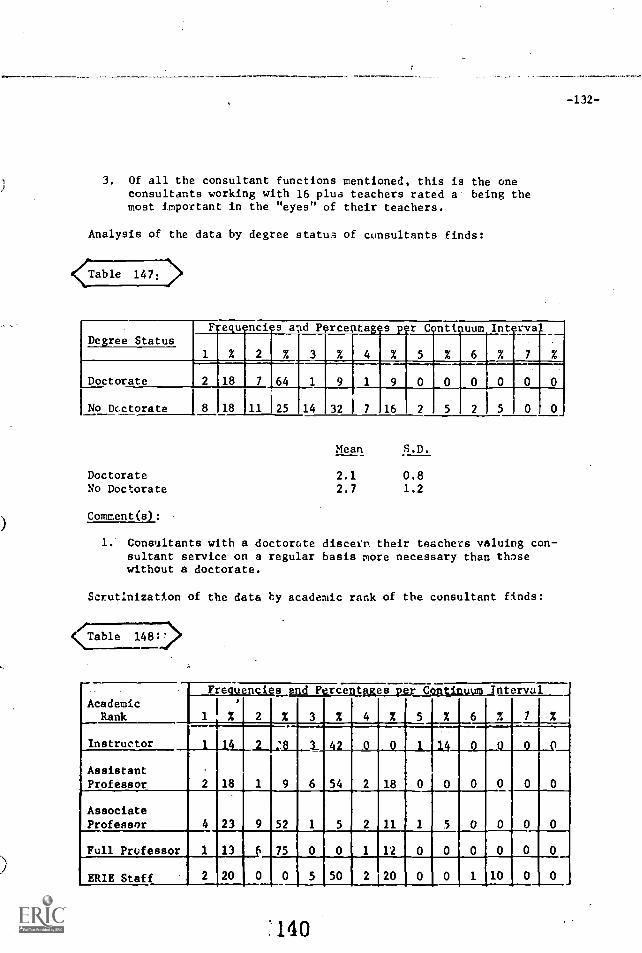
-132-
3. Of all the consultant functions mentioned, this is the oneconsultants working with 16 plus teachers rated a being themost important in the "eyes" of their teachers.
Analysis of the data by degree status of consultants finds:
Table 147: >
Degree StatusFrequencies avid Percentages per Continuum Interva
% 2 % 3 % 4 % 5 % 6 % 7-...4-...
0
%
0Doctorate 2 18 7 64 1 9 1 9 0 0 0 0
No Doctorate 8 18 111 25 14 32 7 16 2 5 2 5 0 0
DoctorateNo Doctorate
Comment(s):
Mean
2.12.7
S.D.
0.81.2
I.' Consultants with a doctorate discern their teachers valuing con-sultant service on a regular basis more necessary than thosewithout a doctorate.
Scrotlnization of the data by academic rank of the consultant finds:
Table 148:)'.
AcademicRank
Frequencle2_And Percentages Der Continuum
5 % 6
Tntervol_
% 7 %
,
% 2 % 3 % 4 %
Instructor 1 14_ I__
1
:8
9
3_
6 54
s
2
MN18 0 0
t
AssistantProfessor 2 18
AssociateProfessor 4 23 9 52 1 5 2 11
Full Professor 1
2
13
20
6`75
0 0
0 0
50
1
2
12
20
0
0
0
0
0
1
0
10
0
0
0
0ERIE Staff 5
140
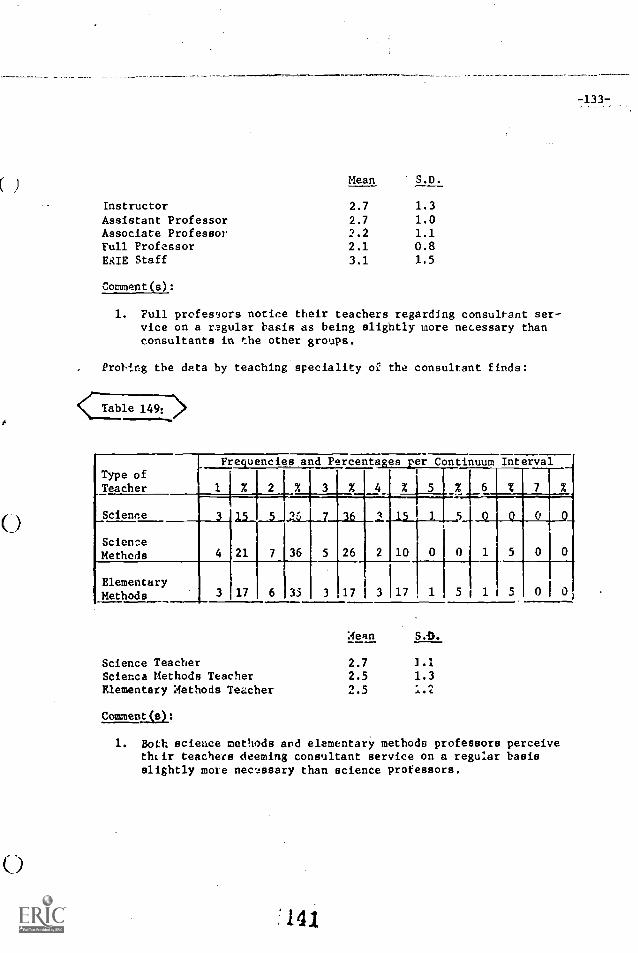
0
0
Mean S.D.
Instructor 2.7 1.3
Assistant Professor 2.7 1.0Associate Professor 2.2 1.1Full Professor 2.1 0.8ERIE Staff 3.1 1.5
Comment(s):
1. Full professors notice their teachers regarding consultant ser-vice on a regular basis as being slightly more necessary thanconsultants in the other groups.
Prol-ing the data by teaching speciality o;': the consultant finds:
Table 149:
Type ofTeacher
Frequencies
1
and Percentages per Continuum Interval
% 2 % 3 % 4 % 5 % 6 % 7 %
Science 3 15.-1-
21 7 36
.
26 2 10 0 0ScienceMethods 4
ElementaryMethods 3 17 6 35 3 17 3 17 1 5 1 5
Science TeacherScience Methods TeacherElementary Methods Teacher
Comment(s):
Mean S.D.
2.7
2.5
2.5
1.11.3
1. Both science methods and elementary methods professors perceivetheir teachers deeming consultant service on a regular basisslightly more necessary than science professors.
:141
-133-
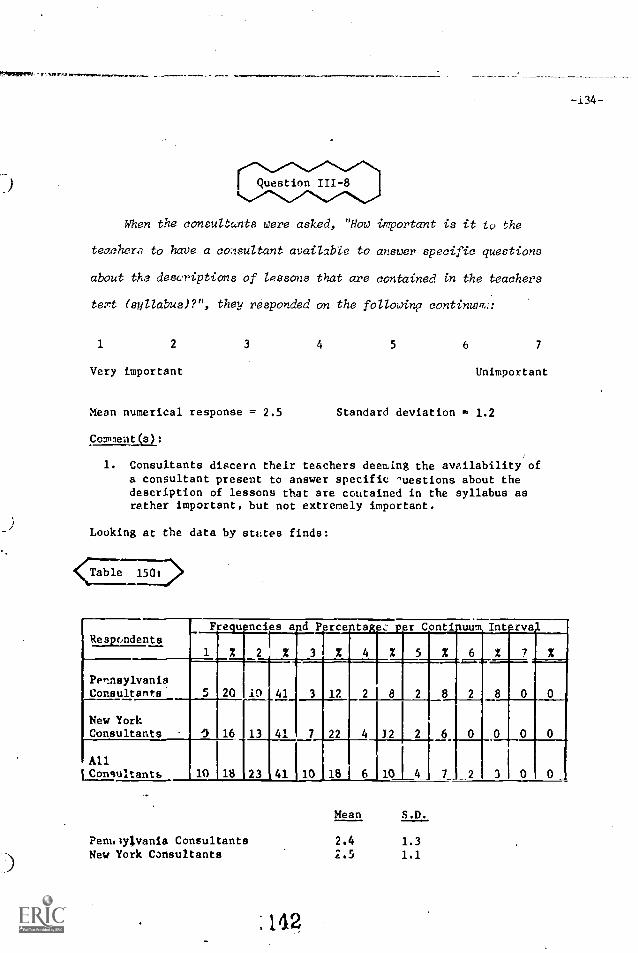
When the consultants were asked, "How important is it to the
teachers to have a consultant available to answer specific questions
about the descriptions of lessons that are contained In the teachers
text (sultabus)?", they responded on the following continmlin::
1 2 3 4 5 6 7
Very important Unimportant
Mean numerical response = 2.5 Standard deviation = 1.2
Comment(a):
1. Consultants discern their teachers deeming the availability ofa consultant present to answer specific -,uestions about thedescription of lessons that are contained in the syllabus asrather important, but not extremely important.
Looking at the data by states finds:
RespondentsFrequ ncies aid
2
Percentages
3 2 4
per
2
Contipuum
5 2 6
Int2rva
2 7 21 2 2
PennsylvaniaConsultants 5 20 10 41 3 12 2 8 2 8 2 8 0 0
New YorkConsultants 1 16 13 41 7 22 4 3.2 2 6 0 0 0 0
All1Consultants 10 18 23 41 10 18 i 6 10 0
Penutylvania ConsultantsNew York Consultants
Mean S.D.
2.4 1.32.5 1.1
-i34-
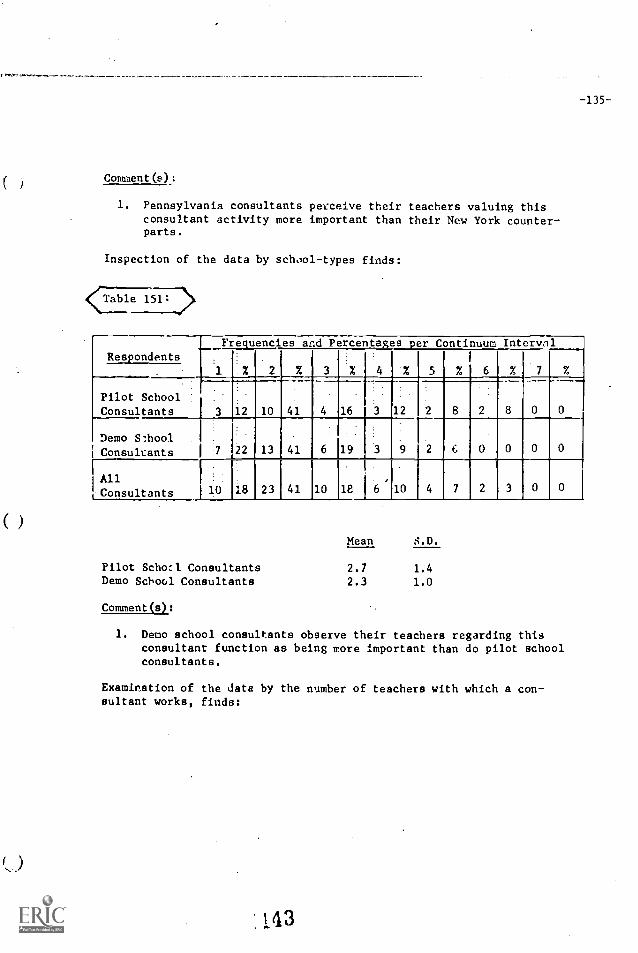
)
-135--
Comment(s):
1. Pennsylvania consultants perceive their teachers valuing thisconsultant activity more important than their New York counter-parts.
Inspection of the data by school-types finds:
<Table 1511
RespondentsFrequencies and Percentages per Continuum Interval
2 2 2 3 2 4 2 7 .
Pilot SchoolConsultants 3 12 10 41 4 16 3 12 2
A_
Demo S:hool .
Consultants 13 41 6 19 9 2 6 0 0
AllConsultants 10 18 23 41 10 18 6 10 4 7 2 3 0 0
Pilot Schott ConsultantsDemo School Consultants
Mean S.D.
2.7 1.4
2.3 1.0
Comment(s):
1. Demo school consultants observe their teachers regarding thisconsultant function as being more important than do pilot schoolconsultants.
Examination of the data by the number of teachers with which a con-sultant works, finds:
143
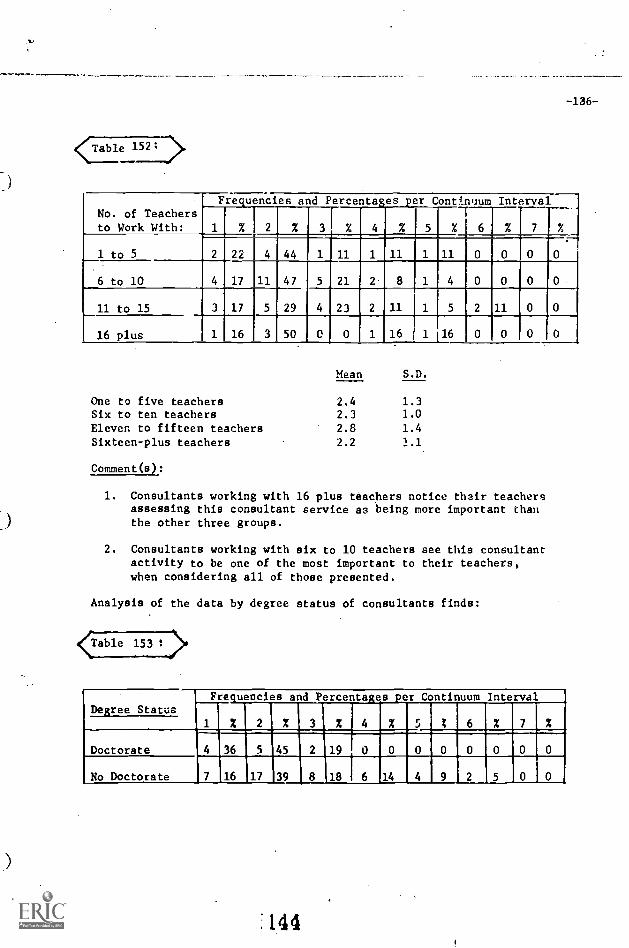
-136-
<Table 152;
No. of Teachersto Work With:
Frequencies and Percentages per Continuum Interval
1 % 2 X 3 % 4 % 5 % 6 % 7 %
1 to 5 2 22 4 44 1 11 1 11 1 11 0 0 0 0
6 to 10 4 17 11 47 5 21 8 1 4
11 to 15 3 17 5 29 4 23 2 11 1 5 2 11 0 0
16 plus 1 16 3 50 0 0 1 16 1 16 0 0 0 0
Mean S.D.
One to five teachers 2.4 1.3Six to ten teachers 2.3 1.0
Eleven to fifteen teachers 2.8 1.4
Sixteen-plus teachers 2.2 1.1
Comment(s):
1. Consultants working with 16 plus teachers notice their teachersassessing this consultant service as being more important thanthe other three groups.
2. Consultants working with six to 10 teachers see this consultantactivity to be one of the most important to their teachers,when considering all of those presented.
Analysis of the data by degree status of consultants finds:
<Table 153 t
Degree StatusFre.uencies and Percents:es er Continuum Interval
1 % 2 % 3 % 4 % 5 % 6 % 7 %
Doctorate 4 36 5 45 2 19 0 0 0 0 0 0 0 0
No Doctorate 7 16 ,17 39 8 18 6 14 4 9 2 5 0 0
144
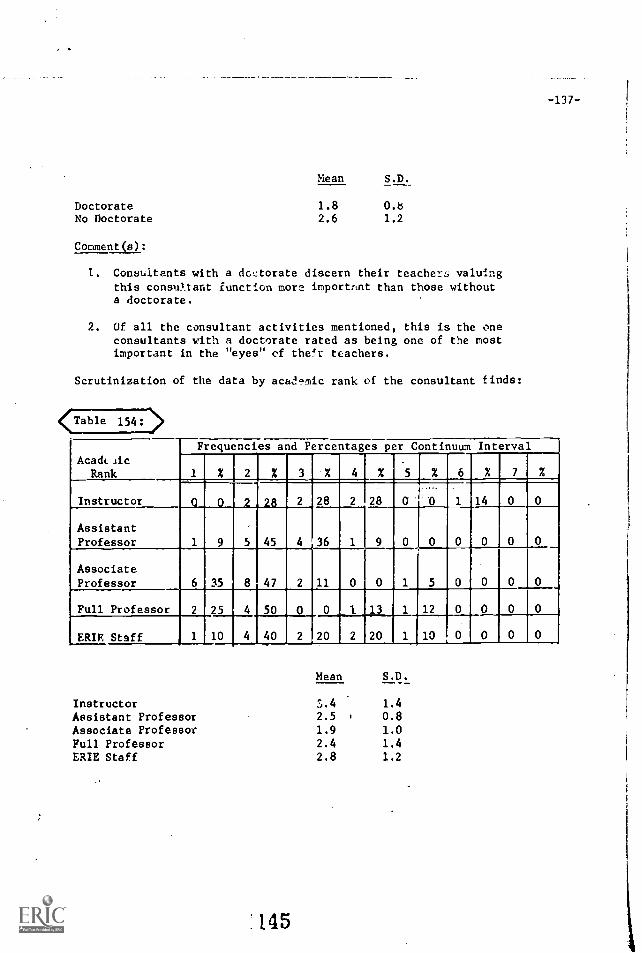
-137-
DoctorateNo Doctorate
Comment(s):
Mean
1.8 0.s2.6 1.2
I. Consultants with a doctorate discern their teachers valuingthis conslAtant function more important than those withouta doctorate.
2. Of all the consultant activities mentioned, this is the oneconsultants with a doctorate rated as being one of the mostimportant in the "eyes" of their teachers.
Scrutinization of the data by academic rank of the consultant finds:
<Table 154: >
Acadt_lic
Rank
Frequencies and Percentages per Continuum Interval
1 % 2 % 3 % 4 % 5 % 6 % 7 %
Instructor 0 0 2 28 2 28 2 28 0-0 1 14 0 0
AssistantProfessor 1 9 5 45 4 36 1 9 0 0 0 0 0 0
AssociateProfessor 6 35 8 47 2 11 0 0 1 5 0 0 0 0
Full Professor 2 25 4 50 0 0 I 13 1 12 0 0 0 0
ERIE Staff 1 10 4 40 2 20 2 20 1 10 0 0 0 0
Mean S.D.
Instructor 7).4 1.4
Assistant Professor 2.5 0.8Associate Professor 1.9 1.0Full Professor 2.4 1.4ERIE Staff 2.8 1.2
145
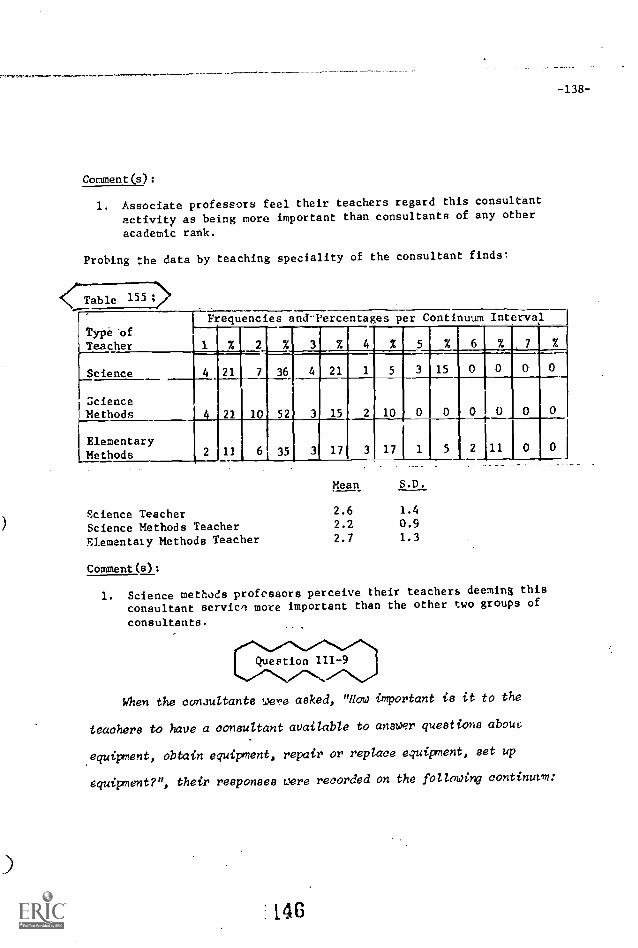
-138-
Comment(s):
1. Associate professors feel their teachers regard this consultant
activity as being more important than consultants of any other
academic rank.
Probing the data by teaching speciality of the consultant finds:
<(:.. Table 155
Frequencies and-Percentages per Continuum IntervalType ofTeacher 1 % 2 4 3 % 4 % 5 % 6 % 7 %
Science 4 21 7 361 4 21 1 5 3 15 0 0 0 0
ScienceMethods 4 21 10 52 3 15 2 10
ElementaryMethods 2 1] 6 35 3 17 3 17 1 5 2 11 0
Mean S.D.
Science Teacher 2.6 1.4
Science Methods Teacher 2.2 0.9
Elementary Methods Teacher 2.7 1.3
Comment(s):
1. Science methods professors perceive their teachers deeming this
consultant servicl more important than the other two groups of
consultants.
When the conJultants we,,e asked, "How important is it to the
teachers to have a consultant available to answer questions about
equipment, obtain equipment, repair or replace equipment, set up
equipment?", their responses were recorded on the following continum:
I46
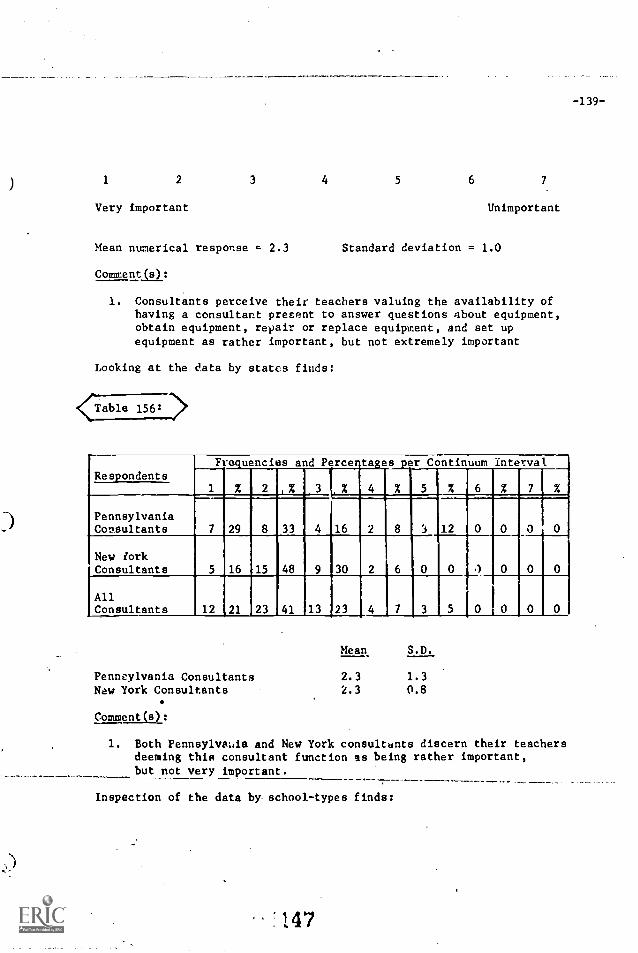
1 2 3 4 5 6
Very important Unimportant
Mean numerical response = 2.3 Standard deviation = 1.0
Comment(s):
1. Consultants perceive their teachers valuing the availability ofhaving a consultant present to answer questions about equipment,obtain equipment, repair or replace equipment, and set upequipment as rather important, but not extremely important
Looking at the data by states finds:
<Table 156:
RespondentsFrequencies and Percertages per Continuum interval
% 2 ,% ,3 % 4 % 5 % 6 % 7
PennsylvaniaConsultants 7 29 8 33 4 16 2 12
New forkConsultants 5 16 15 48 9 30 2 6 0 0 .
AllConsultants 12 .21 23 41 13 23
Pennsylvania ConsultantsNew York Consultants
Comment(s):
Mean S.D.
2.3 1.32.3 0.8
1, Both Pennsylvania and New York consultants discern their teachersdeeming this consultant function ss being rather important,but not very important.
Inspection of the data by- school -types finds:
47
-139-

-140-
Table
respondentsFrequencies and Percentages per Continuum Interval
1 % , 2 % 3 % 4 % 5 % 6 X 7 %
Pilot SchoolConsultants 5 20 10 41 6 25 2 8 1 4 0 0 0 0
Demo SchoolConsdltants 7 22 13 41 7 22
AllConsultants 12 21 23 41 113 23 4 7 3 5 0 0 0 0
Pilot School ConsultantsDemo School Consultants
Comment(s):
Mein
2.2
8-D:
0.92.3 1.1
1 school consultants observe their teachers( regarding thisconsultant activity as being slightly more important than doDemo school consultants.
Examination of the data by the number of teachers with which a con-sultant works, finds:
Table 158:
No. of Teachersto Work With:
Frequencies and Percentages per Continuum
6
Interval
X 7 X1 X 2 X 3 X 4 X 5 X
1 to 5 2 22 5 55 1 11 1 11 0 0 0 0 0
6 to 10 5 21 8 34 7 30 1 4 2 8 0 0 0
11 to 15 5 29 6 35 4 23 1 5 1 5 0 0 C 0
16 plus 0 0 4 66 1 16 1 16 0 0 0 0 0 0
Mean S.D.
One of five teachers 2.1 0.9Six to ten teachers 2.4 1.2
Eleven to fifteen teachers 2.1 0.9Sixteen-plus teachers 2.6 0.9
148
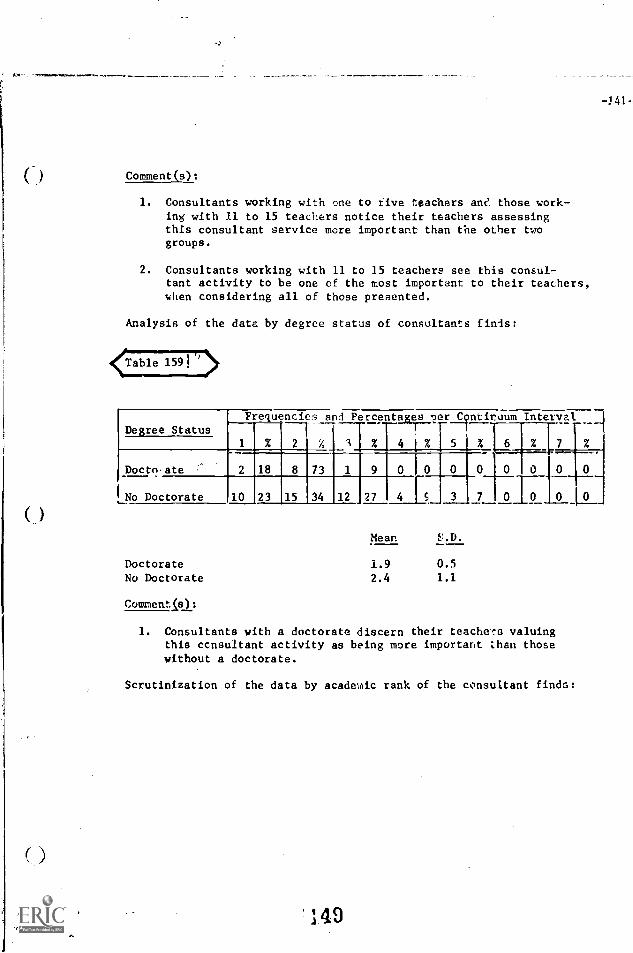
( )
-1 41 -
Comment(s):
1. Consultants working with one to rive teachers ant those work-ing with 11 to 15 teachers notice their teachers assessingthis consultant service more important than the other twogroups.
2. Consultants working with 11 to 15 teachers see this consul-tant activity to be one of the most important to their teachers,when considering all of those presented.
Analysis of the data by degree status of consultants finis:
Table 159r).
Frequencies and Percentages serSyntiruum Interval
----rDegree Status1 % % 4 % 5 % III % 7
Doctorate 2 18 8 73 1 9 0 0 0 0 0 0
__
0 Ill
,__No Doctorate 10 23 15 34 12 27 4 c
DoctorateNo Doctorate
CommentSe):
Mean-
1.9 0.5
2.4 1.1
1. Consultants with a doctorate discern their teache.70 valuingthis consultant activity as being more important than thosewithout a doctorate.
Scrutinization of the data by acadernic rank of the consultant finds:
'149
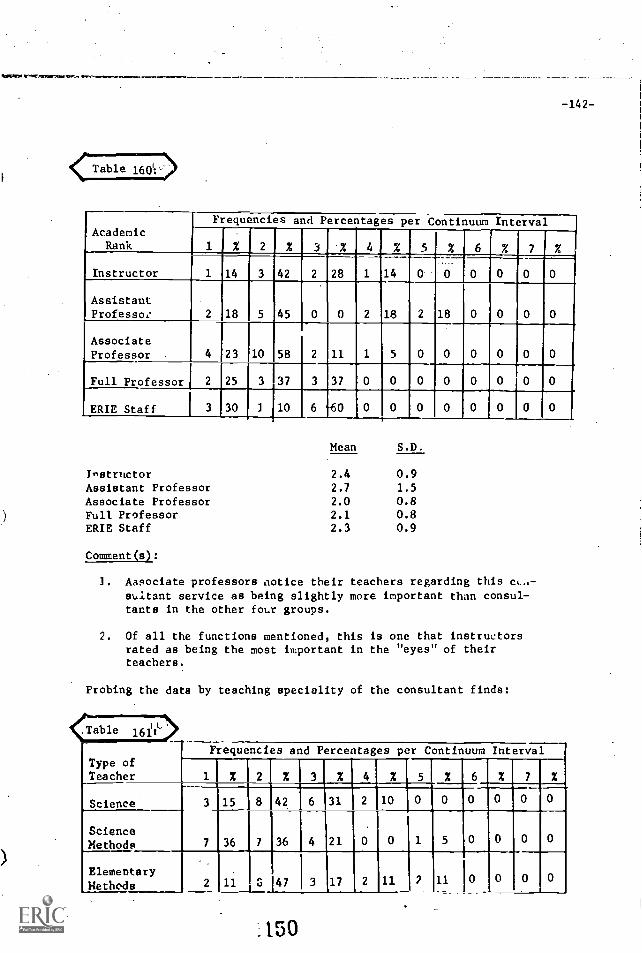
94:010111101,(01,0117010,es.r171,..,
Table 160
-142-
AcademicRank
Frequencies and Percentages per Continuum Interval
1 X 2 % 3 '% 4 X 5 % 6 % 7 %
Instructor 1 14 3 42 2 28 1 14 0 0 0 0 0 0
AssistantProfessor 2 18 5 45 0 0 2 18 2 18 0 0 0 0
AssociateProfessor 4 23 10 58 2 11 1 5 0 0 0 0 0 0
Full Professor 2 25 3 37 3 37 0 0 0 0 0 0 0 0
ERIE Staff 3 30 10 6 '160 0 0 0 0 0 0 0 0
Mean S.D.
Instructor 2.4 0.9Assistant Professor 2.7 1.5
Associate Professor 2.0 0.8Full Professor 2.1 0.8ERIE Staff 2.3 0.9
Comment(s):
Associate professors aotice their teachers regarding this cL"-sultant service as being slightly more important than consul-tants in the other foLr groups.
2. Of all the functions mentioned, this is one that instructorsrated as being the most important in the "eyes" of theirteachers.
Probing the data by teaching speciality of the consultant finds:
ble 1611.'L
Type ofTeacher
Frequencies and Percentages per Continuum Interval
1 X 2 X 3 X 4 X 5 % 6 X 7 X
Science 3 15 8 42 6 31 2 10 0 0 0
ScienceMethods 7 36 7 36 4 21 0 0 1 5 0
ElementaryMethods 2 11 S 47 3
,
17 2 11 2 11 0 0 0 0
.150
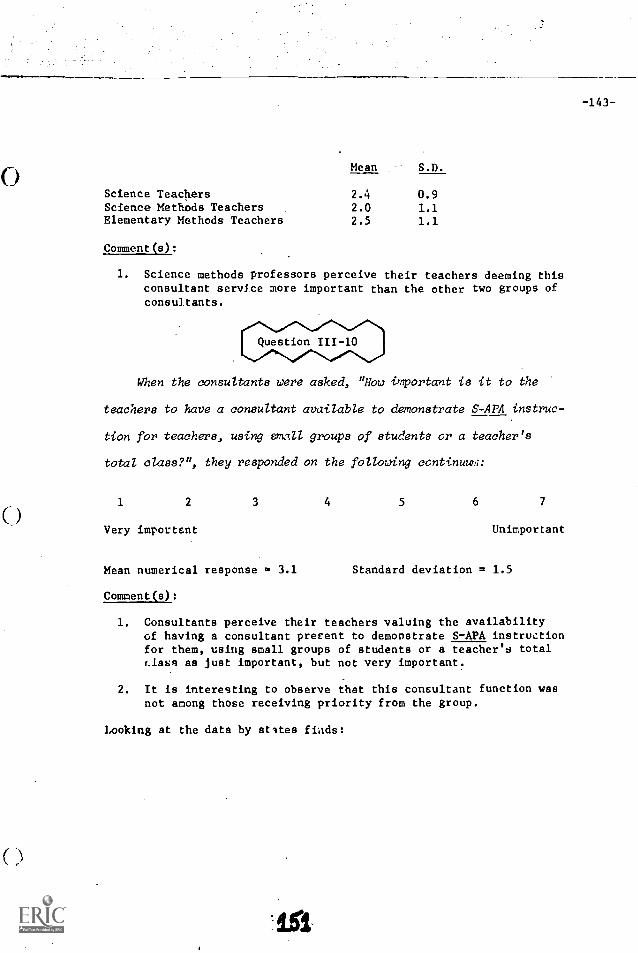
r...*11.,
0
0
()
Mean S.D.
Science Teachers 2.4 0.9Science Methods Teachers 2.0 1.1Elementary Methods Teachers 2.5 1.1
Comment(s):
1. Science methods professors perceive their teachers deeming thisconsultant service more important than the other two groups ofconsultants.
When the consultants were asked, "How important is it to the
teachers to have a consultant available to demonstrate S -APA instruc-
tion for teachers, using emit groups of students or a teacher's
total class?", they responded on the following continuum:
1 2 3 4 5 6 7
Very important Unimportant
Mean numerical response = 3.1 Standard deviation = 1.5
Comment(s):
1. Consultants perceive their teachers valuing the availabilityof having a consultant present to demonstrate S-APA instructionfor them, using small groups of students or a teacher's totalclass as just important, but not very important.
2. It is interesting to observe that this consultant function wasnot among those receiving priority from the group.
Looking at the data by states
-143-
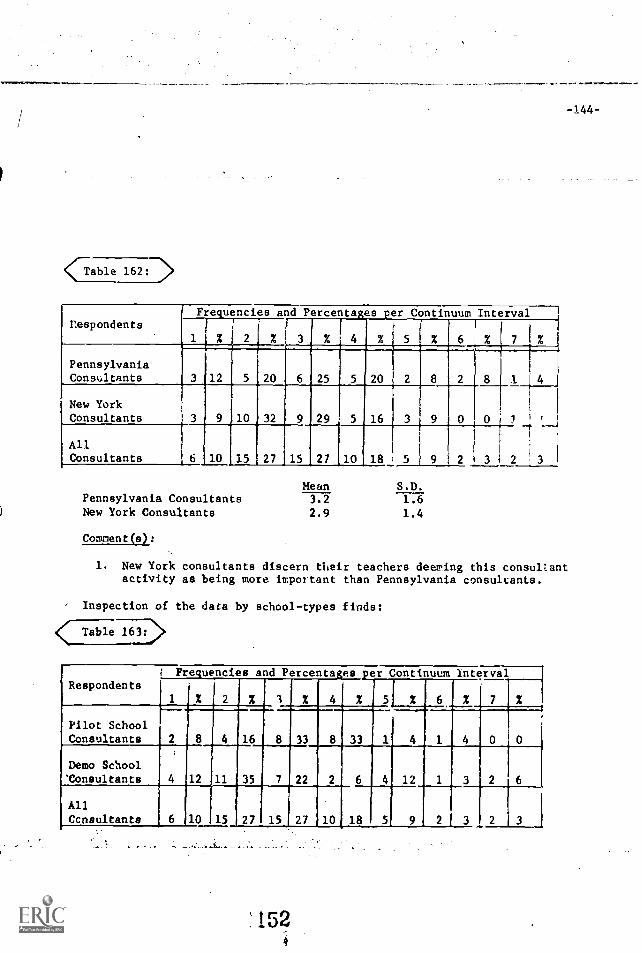
<-;able 162:7>
RespondentsFrequencies and Percentages per Continuum Interval
11
%'
2 %1
3 % 4 % 5 % 6
I
%_1 7 %
PennsylvaniaConsultants 3 12 5 20 6 25 5 20 2 8 2 8 1 4
New YorkConsultants 3 9 10 32 9
27
5
10
16
18
3
5
9
9 4
0
2
0
3
1-r
2
'
3
AllConsultants 6 10 15 '27
X29
15
Pennsylvania ConsultantsNew York Consultants
Mean3.2
2.9
S.D.1.6
1.4
-144-
Comment(s):
1. New York consultants discern their teachers deeming this consultantactivity as being more important than Pennsylvania consultants.
Inspection of the data by school-types finds:
Table 161..9),
RespondentsFrequencies and Percentages per Continuum
51 % 6
Interval
%1 % 2 % % 4 % 7
Pilot SchoolConsultants 2 8 4 16 8 33 8 33 1 4 1 4 0 0
Demo School'Consultants 4 12 11 35 7 22 2 6 4 12 1 3 2 6
AllConsultants 6 10 15 27 15 27 10 18 5 9 2 3
152

Pilot SchoolConsulta-Its
-145-
Mean S.D.
3.1 1,2
Demo SchoolConsultants 3.0 1.6
Comment(s):
1. fsoth pilot and demo school consultants observe their teachersregarding this consultant activity as being rather important,
but not extremely important.
Examination of the data by the number of teachers with which aconsultant works, finds:
(Table 164:
Nymber ofTeachers toWork With
Frequencies and Percenta:es .er Continuum Interval
1 ' % 2 3 X 4 % 5 % 6 % 7 %
1 to 5 1 11 lin 33 0 1 11' 1 11
6 to 10 3 34 5 21 2 3 13 0 0
It to 15 1 / 6 35 5 29 1 5 1 5 0
16 plugs 1 16 1 16 1 16 3 0 0 0 0 0
153
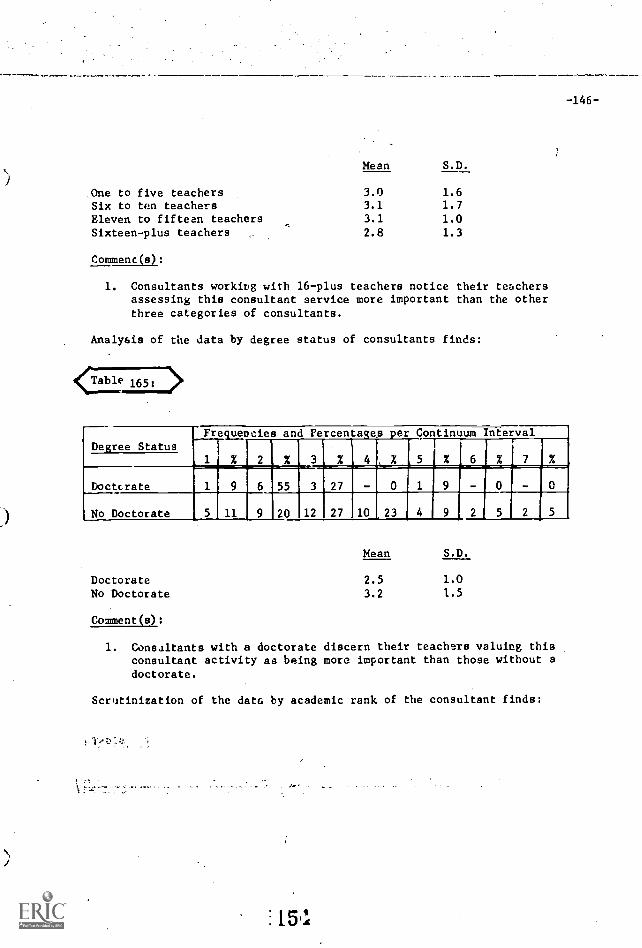
-146-
Mean
One to five teachers 3.0 1.6Six to ten teachers 3.1 1.7
Eleven to fifteen teachers 3.1 1.0Sixteen-plus teachers 2.8 1.3
Comment(s):
1. Consultants working with 16-plus teachers notice their teachersassessing this consultant service more important than the otherthree categories of consultants.
Analysis of the data by degree status of consultants finds:
Degree StatusFrequencies and Percentages per Continuum Interval
1 %. % 4 5
I
% 6
'
% 7
Doctcrate 1 9 6
_%
55 3 27 0 1 9
No Doctorate 5 11 9 20 12 27 10 23 4
DoctorateNo Doctorate
Comment(s):
Mean S.D.
2.5 1.0
3.2 1.5
1. Consultants with a doctorate discern their teachers valuing thisconsultant activity as being more important than those without adoctorate.
Scrutinization of the data by academic rank of the consultant finds:
15
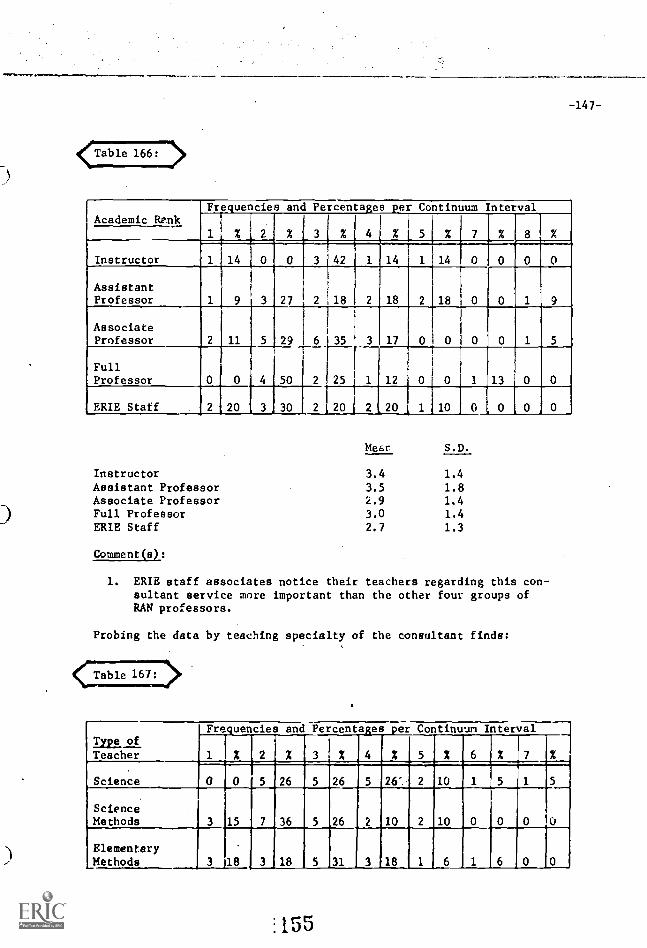
<Table 166: >
-147-
Academic REnkFrequencies and Percentages per Continuum. Interval
1 X 2 % 3 % 4 % 5 % 7 % 8
Instructor 1 14 3 42 1 14 1 14 0 0 0 0
AssistantProfessor 1 9 3 27 2 18 2 18 2 18
AssociateProfessor 2 11 5 29 6
2
35
25
3 17
FullProfessor 0 0 4
1
50
f
I
1 12 0 0 1 13
ERIE Staff 2 20 3 30 2 20 2, 20 4 1 10
Mear S.D.
Instructor 3.4 1.4
Assistant Professor 3.5 1.8Associate Professor 2.9 1.4Full Professor 3.0 1.4ERIE Staff 2.7 1.3
Comment(s):
1. ERIE staff associates notice their teachers regarding this con-sultant service more important than the other four groups ofRAN professors.
Probing the data by teaching specialty of the consultant finds:
<Table 167L>.
Type ofFrequencies and Percentages per Continuum Interval
1 X 2 % 3 X 4 X 5 X 6 X 7----1
1
X
5
Teacher
Science 0 0 5 26 5 26 5 26"' 2 10 1 5
ScienceMethods 3 15 7 5 ,_26 2 10 2 10 0 0 0 r0
0
ElementaryMethods 3 j18 3
.36
18 S 31 3 18 1 6 1 6 0
:155
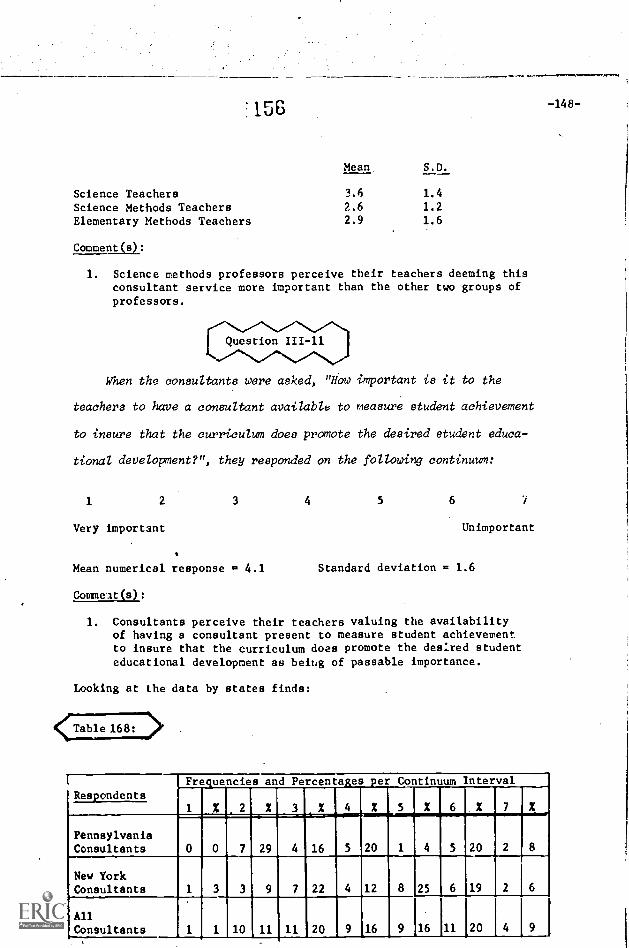
'156
Mean S.D.
Science Teachers 3.6 1.4
Science Methods Teachers 2.6 1.2
Elementary Methods Teachers 2.9 1.6
Comment(s):
1. Science methods professors perceive their teachers deeming thisconsultant service more important than the other two groups ofprofessors.
When the consultants were asked, "How important is it to the
teachers to have a consultant available to measure student achievement
to insure that the curriculum does promote the desired student educa-
tional development?", they responded on the following continuum:
1 2 3 4 5 6 7
Very important Unimportant
Mean numerical response = 4.1 Standard deviation = 1.6
commelt(s):
1. Consultants perceive their teachers valuing the availabilityof having a consultant present to measure student achievementto insure that the curriculum does promote the desired studenteducational development as being of passable importance.
Looking at the data by states finds:
Table 168: >
.....**VaPVW,MIPM
-148-
I
Respondents
Frequencies and Percentasgs per Continuum Interval
1 . 2 Z 3 Z d...4 2 5 X 6 Z 7
PennsylvaniaConsultants 0 0 7 29
r
4 16 5 20 1 4 5 20
New YorkConsultants 1 3 3 9 7 22 4 12 8 25 6 19
AlliConsultants 1 1 10 11 11 20 9 16 9 16 11 20 4 9
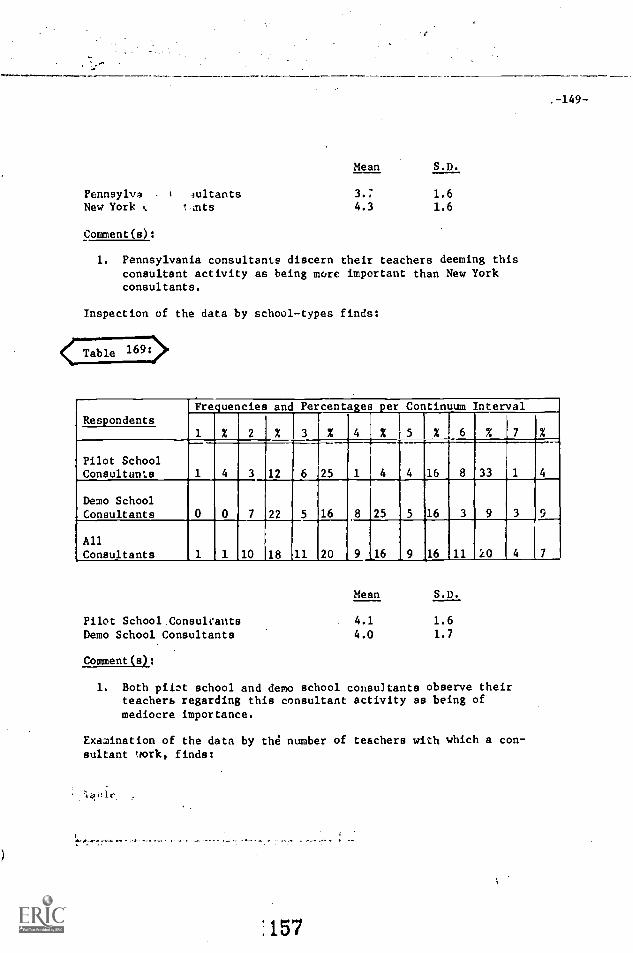
. -149-
Pennsylva 4ultantsNew York I alts
Comment(s):
Mean S.D.
3.7 1.64.3 1.6
1. Pennsylvania consultants discern their teachers deeming thisconsultant activity as being more important than New Yorkconsultants.
Inspection of the data by school-types finds:
Table 169>
RespondentsFre uencies and Percentages per Continuum Interval
1 % % 3
I
% 4 % 5 % 6 % 7 %
Pilot SchoolConsultants 1 4 3 12 6 25 1 4 4 16 8 33
Demo SchoolConsultants 0 0 7 22 5 16 8 25 5 16 3 9 3 9
AllConsultants 1 1 10 18 11 20 9 16 9 16 11 10 4 7
Pilot School.ConsulcantsDemo School Consultants
Comment(s):
Mean S.D.
4.1 1.64.0 1.7
1. Both pilot school and demo school consultants observe theirteachers regarding this consultant activity as being ofmediocre importance.
Examination of the data by the number of teachers with which a con-sultant tiork, finds:
:157
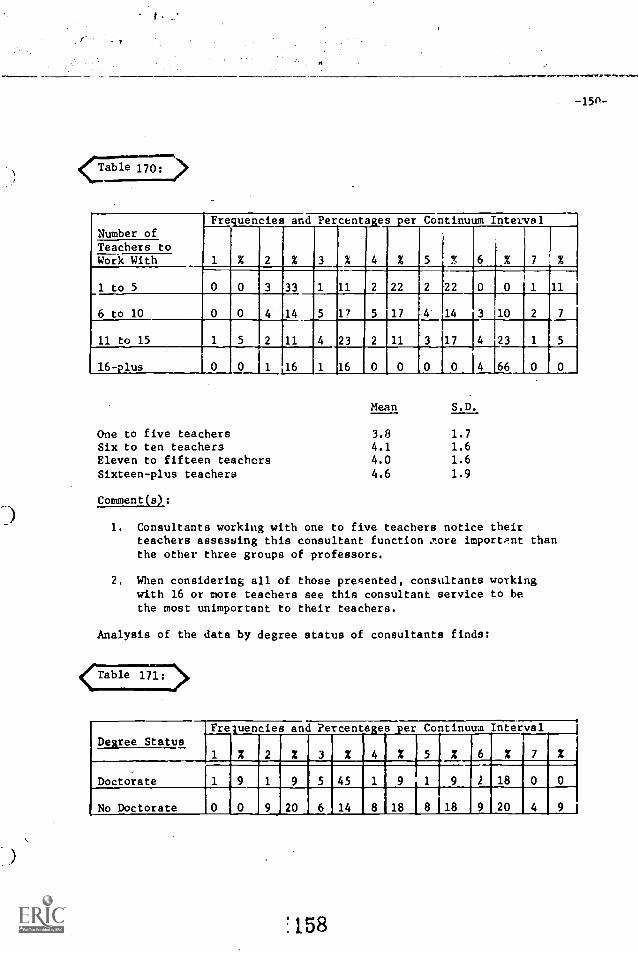
,..m.rsl-
-15n-
Number ofFrequencies and Percentages per Continuum Interval
% 4 % 5 % 6 % 7 %
Teachers toWork With
to 5 0 0 3 33 1 11 2 22 2 22 0 0 1 11_1
6 to 10 0 0 4 14 5 17 5 17 4 14 3 10
11 to 15 1 5 2 11 / 23 2 11 3 17 4 23
16-plus 0 0 1 16 1 16 0 0 0 0 4 66
Mean S.D.
One to five teachers 3.8 1.7
Six to ten teachers 4.1 1.6
Eleven to fifteen teachers 4.0 1.6
Sixteen-plus teachers 4.6 1.9
Comment(s):
1. Consultants working with one to five teachers notice theirteachers assessing this consultant function , *.ore important thanthe other three groups of professors.
2, When considering all of those presented, consultants workingwith 16 or more teachers see this consultant service to bethe most unimportant to their teachers.
Analysis of the data by degree status of consultants finds:
<Table 1T17>
Degree StatusFrequencies and Percentages per Continuum
6
Interval
% 7 , %1 % 2 2 3 % 4 % 5 %
Doctorate 1 9 1 9 5 45 1 9 1 9 2 18 0 0
No Doctorate 0 0 9 20 6 14 8 _18 8 18 20 4. 9
:158

-151-
DoctorateNc Doctorate
Comment(sl:
Mean S.D.
3.5 1.5
4.2 1.6
1. Consultants with a doctorate discern their teachers valuingthis consultant activity as being more important than thosewithout a doctorate.
Scanning the data by academic rank of the consultant finds:
< Table 1721>
Academicj Frequencies and Percentages per Continuum Interval
1
'i
% I 2 % 3 % 4 .% 5 1_, 6 1 % 7Rank
Instructor 0 0 1 14 1 14 1 14 0 0 3 42 1 14
AssistantProfessor 0 0 2 18 2 18 4 36 1 9 1
AssociateProfessor 1 5 6 35 5 29 0 0 3 17 1 5 1 5
FullProfessor 0 0 0 0 3 37 3 37 1 12 1 13 0 0
ERIE Staff 0 0 1 10 0 0 1 10 1 4 40 4 40
Mean S.D.
Instructor 4.9 1.9
Assistant Professor 4.0 1.6Associate Professor 3.3 1.7Full Professor 4.0 1.1
ERIE Staff 5.0 1.2
Comment(s):
1. Associate professors notice their teachers rcF,srding this con-sultant service as being more important than the consultants !.11the other four groups.
2. Of all the consultant functions mentioned, this is the one thatboth instructors and ERIE staff associates rated as being tmost unimportant in the "eyes" of their teachers.
:159
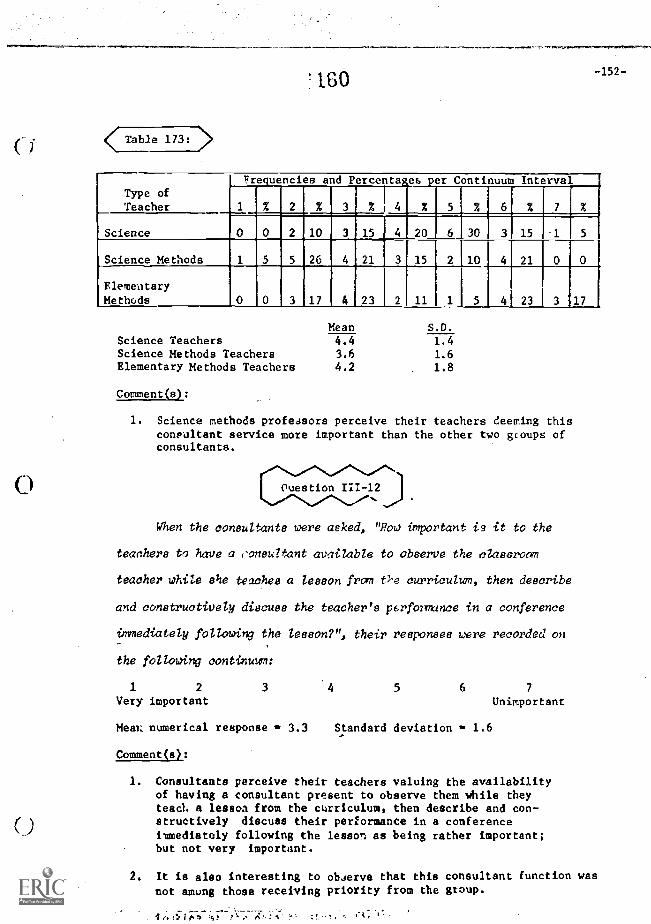
0
1.60
< Table 1731 >
-152-
Type ofTeacher
Frequencies and Percenta es per Continuum Interval
1 % 2 % 3 % 4 % 5 % 6 % 7 %
Science 0 0 2 10 3 15 4 20 6 30 3 15 L1 5
Science Methods 1 5 5 26 4 21 3 15 2 10 4 21 0
ElementaryMethods 0 0 3 17 4 23 2 11 1 5 4 23 3 17
Mean S.D.
Science Teachers 4.4 1.4Science Methods Teachers 3.6 1.6Elementary Methods Teachers 4.2 1.8
Comment(s):
1. Science methods professors perceive their teachers deeming thisconsultant service more important than the other two groups ofconsultants.
rues Lion 111-12... .
When the consultants were asked, "How important is it to the
teachers to have a consultant available to observe the classroom
teacher white she teaches a lesson from t?-e curriculum, then describe
and constructively discuss the teacher's performance in a conference
immediately following the lesson?", their responses were recorded on
the following continuum:
1 2 3 4 5 6 7
Very important Unimportant
Meat. numerical response sk 3.3
Comment(s):
Standard deviation 1.6
1. Consultants perceive their teachers valuing the availabilityof having a consultant present to observe them while theyteach a lesson from the curriculum, then describe and con-structively discuss their performance in a conferenceimaediately following the lesson as being rather important;but not very important.
2. It is also interesting to observe that this consultant function wasnot amung those receiving priority from the gtoup.
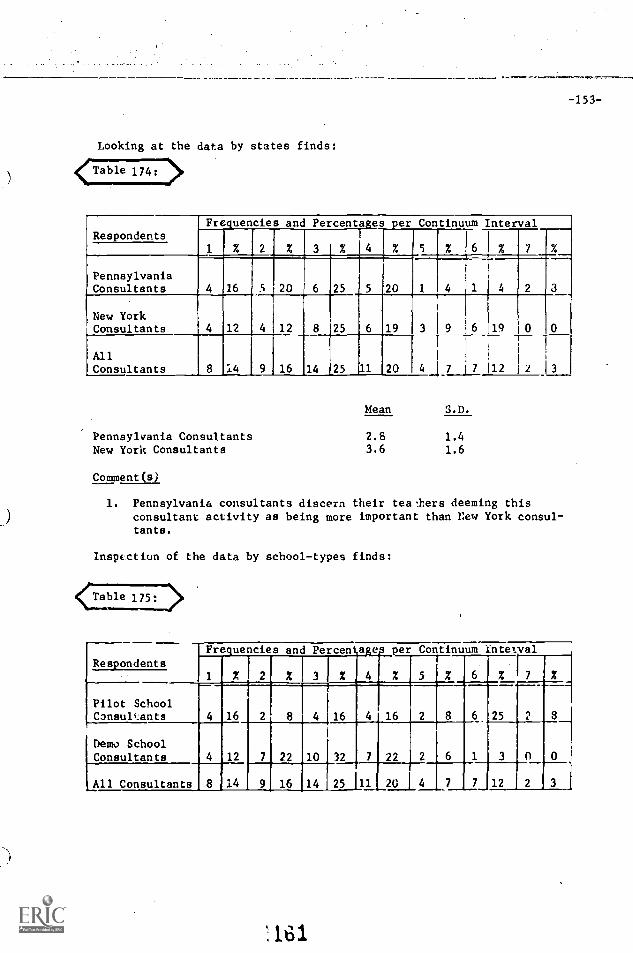
Looking at the data by states finds:
<Table 174:
-(vor* n*.wopenTIMr,--,
-153-
RespondentsFre.uencies and Percenta:es .er Continuum Interval
% 2 % 3 % 4 % 5 % 6 % 7%PennsylvaniaConsultants 16 5 20 6 25 5 20 1 IllNew YorkConsultants 4 12 4 12 8 25 6 19 3 9 6 19
AllConsultants 8 14 9 16 14 11111 20 4 7 7 12
Pennsylvania ConsultantsNew York Consultants
Mean S.D.
2.8 1.43.6 1.6
Comment(s)
1. Pennsylvania consultants discern their teachers deeming thisconsultant activity as being more important than New York consul-tants.
Inspection of the data by school-types finds:
RespondentsFrequencies and Percentage .er Continuum interval
I7 X1 X 2 X 3 X 4 X 5 XJ6 X
Pilot SchoolConsultants 4 16 2 8 4 16 4 16 2 8 6 25 8
Demo SchoolConsultants 4 12 7
9
22
16
10
14
32 7
25 11
22
20 4 7 7
3
12
fl
2
0
3All Consultants 8 14
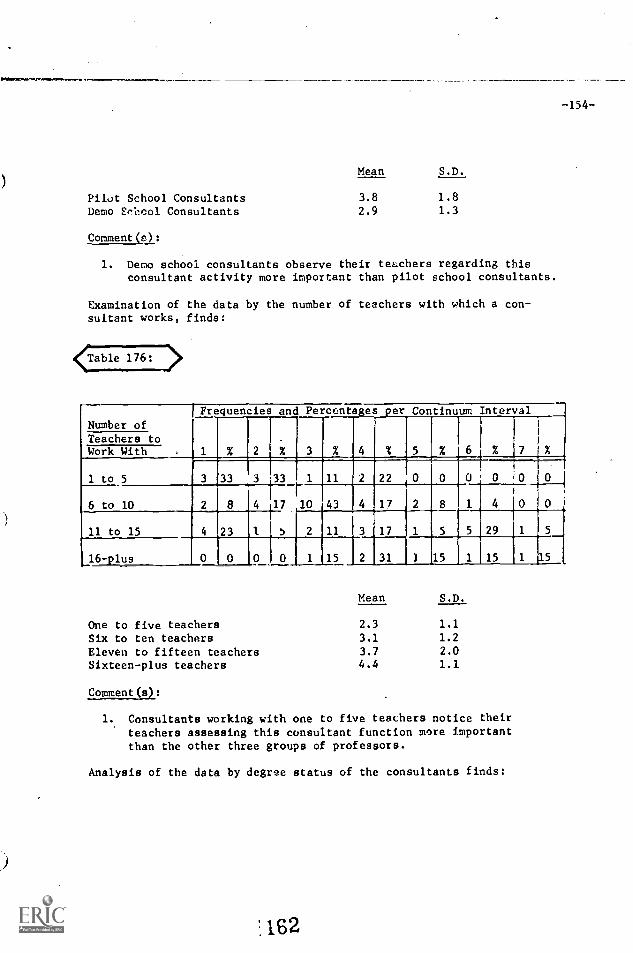
-154-
Pilot School ConsultantsDemo School Consultants
Comment(e):
Mean S.D.
3.8 1.8
2.9 1.3
1. Demo school consultants observe their teachers regarding thisconsultant activity more important than pilot school consultants.
Examination of the data by the number of teachers with which a con-sultant works, finds:
Table 176:
Number of
Frequencies and Percentaes er Continuum Interval
1 X 2 X 3 X 4 Y S X b X 7 %Teachers toWork With
I to 5 3 33 3 33 1 11 2 22 0 0 0 0 0
6 to 10 2 8 4 17 10 43 4 17 2 8 1 4 0
11 to 15 4 23 1 S 2 11 3 17 1 S 5 29
16-plus 0 0 0 0 1 15 2 31 1 15 1 15
Mean S.D.
One to five teachers 2.3 1.1
Six to ten teachers 3.1 1.2
Eleven to fifteen teachers 3.7 2.0
Sixteen-plus teachers 4.4 1.1
Comment(s):
1. Consultants working with one to five teachers notice theirteachers assessing this consultant function more importantthan the other three groups of professors.
Analysis of the data by degree status of the consultants finds:
'162
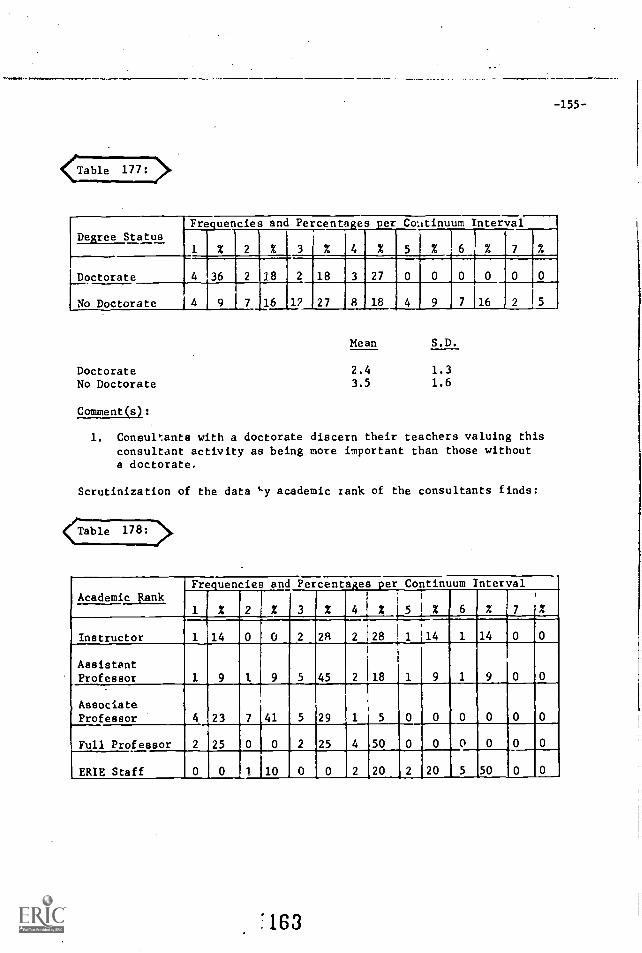
`Table 177: >
-155-
Degree StatusFrequencies and Percentages per Continuum Interval
1 % 2 % 3 % 4 % 5 % 6 % 7 %
1Doctorate
No Doctorate
4 36 2 18 2 18 3 27 0 0 0 0 0 0
4 9 7 16 1? 27 8 18 4 9 7 16 2 5
DoctorateNo Doctorate
Mean S.D.
2.4 1.33.5 1.6
Comment(s):
1. Consultants with a doctorate discern their teachers valuing thisconsultant activity as being more important than those withouta doctorate.
Scrutinization of the data '.17 academic tank of the consultants finds:
Table 178:
Academic sankFrequencies and Percentages per Continuum
i
Interval
1%2%3%4%51%6%7Instructor 1 14 0 0 2 2R 2 28 1114 1 14
AssistantProfessor 1 9 l 9 5 45 2 1
AssociateProfessor 4 23 7 41 5 29 1 5
Full Professor 2 25 0 0 2 25 4 50 0 0 0 0 0 01
ERIE Staff 0 0 l 10 0 0 2 £20 2 20 5 50 0 0
:163
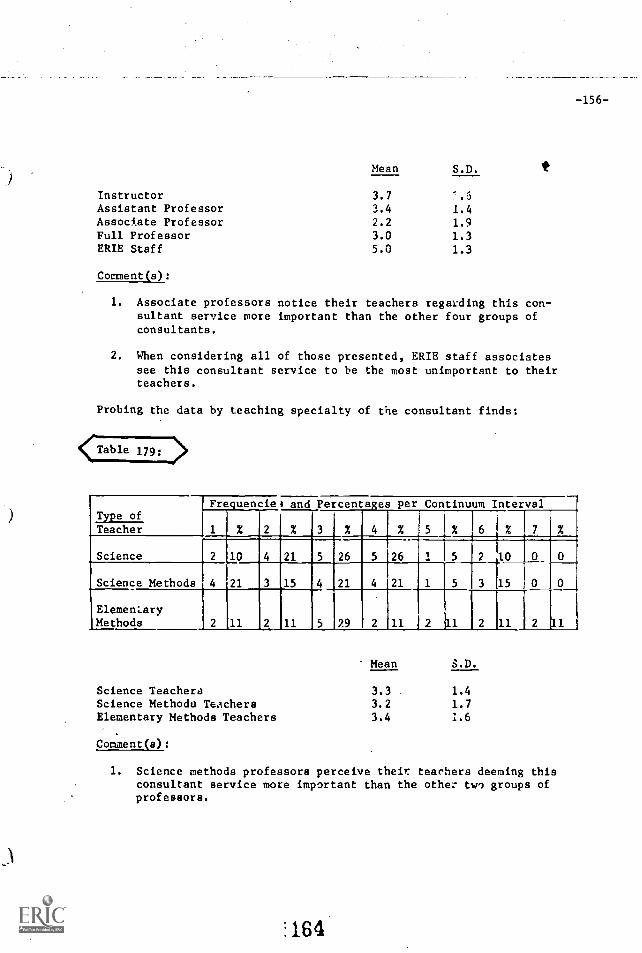
-156-
Mean S.D.
Instructor 3.7 7.6Assistant Professor 3.4 1.4Associate Professor 2.2 1.9Full Professor 3.0 1.3ERIE Staff 5.0 1.3
Comment(s):
1. Associate professors notice their teachers regarding this con-sultant service more important than the other four groups ofconsultants.
2. When considering all of those presented, ERIE staff associatessee this consultant service to be the most unimportant to theirteachers.
Probing the data by teaching specialty of the consultant finds:
<Table 179:
Type ofFrequenciei and Percentages per Continuum Interval
1 % 2 % 3 % 4 % 5 X 6 % 7 %Teacher
Science 2 10 4 21 5 26 5 26 1 5 2 10
Science Methods 4 21 3 15 4 21 4 21 1 5 3 15 0 0
ElementaryMethods 2 11 2 11 5 29 2 11 12 1 2 11 2 11
Mean S.D.
Science Teachers 3.3 1.4Science Methodo Teachers 3.2 1.7Elementary Methods Teachers 3.4 1.6
Comment(s):
1. Science methods professors perceive their, teachers deeming thisconsultant service more important than the other two groups ofprofessors.
:164
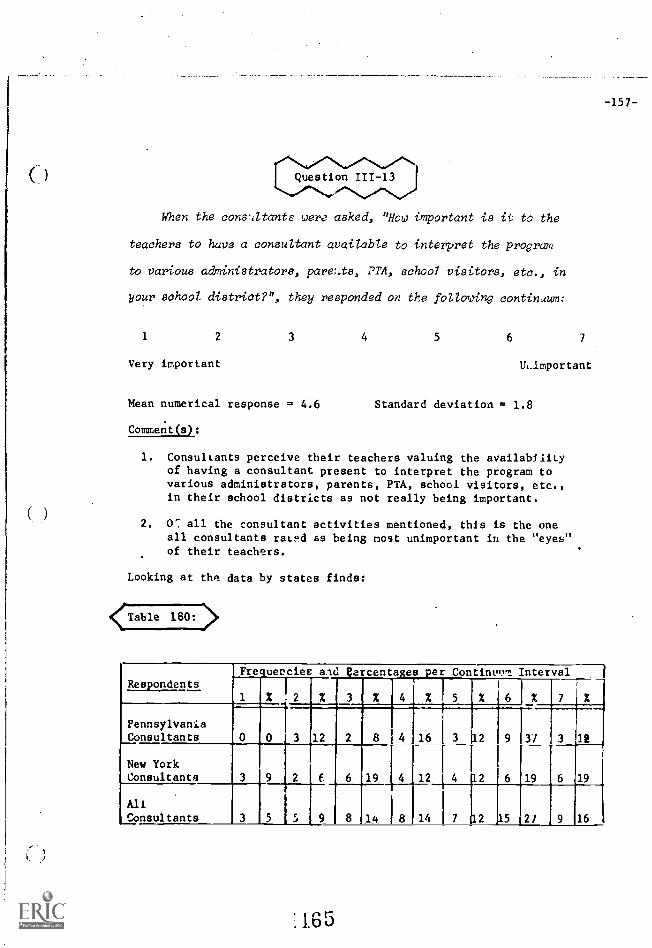
-157-
When the consatants were asked, "How important is it to the
teachers to have a consultant available to interpret the progrcon
to various administrators, pare4ts, 21A, school visitors, etc., in
your school district?", they responded on the following continuum:
1 2 3 4 5 6
Very important ULImportant
Mean numerical response = 4.6 Standard deviation = 1.8
Comment(s):
1. Consultants perceive their teachers valuing the availabilityof having a consultant present to interpret the program tovarious administrators, parents, PTA, school visitors, etc.,in their school districts as not really being important.
2. V all the consultant activities mentioned, this is the oneall consultants raid as being most unimportant in the "eyes"of their teachers.
Looking at the data by states finds:
RespondentsFreguerciec aid tercentages per Contint"." Interval
2 2 % 3 % 4 % 5 % 6 % 7
PennsylvaniaConsultants 0 0 3 12 2 8 4 16 3 12 9 37 3 12
New YorkConsultants 3 9 2 E. 6 19 4 12 4 12 6 19 6 19
AllConsultants 3 5 5 9 8 14 8 14 7 12 ,15 2/ 9 16
:1.65
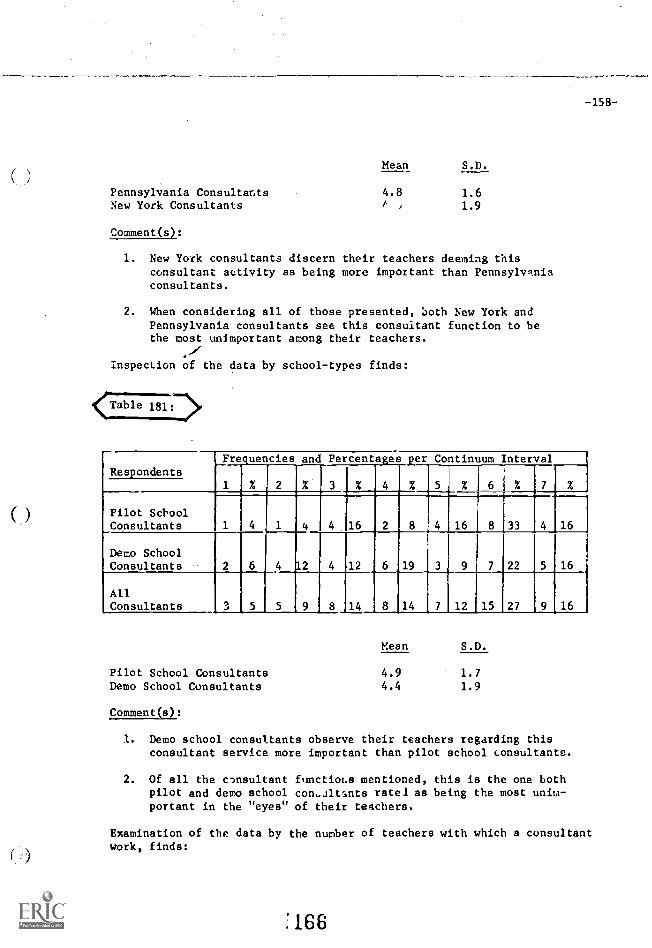
-158-
Pennsylvania ConsultantsNew York Consultants
Comment(s):
Mean S.D.
4.8 1.61.9
1. New York consultants discern their teachers deeming thisconsultant activity as being more important than Pennsylvaniaconsultants.
2. When considering all of those presented, both New York andPennsylvania consultants see this consultant function to bethe most unimportant among their teachers.
Inspection of the data by school-types finds:
<Table 1817>
RespondentsFre.uencies and Percenta:es per Continuum Interval
1% 2 3 % 4 % 5 % 6 % 7 %
Pilot SchoolConsultants 1 4 4 16 2 8 4 16 8 33 4 16
Demo SchoolConsultants 2 4 I2 4 12 6 19 3 9 7 22 5 16
AllConsultants 3 5 9 8 14 8 14 7 12 15 27 9 16
Pilot School ConsultantsDemo School Consultants
Comment(s):
Mean S.D.
4.9 1.74.4 1.9
1. Demo school consultants observe their teachers regarding thisconsultant service more important than pilot school consultants.
2. Of all the consultant functioLs mentioned, this is the one bothpilot and demo school con.ultants rate.' as being the most unim-portant in the "eyes" of their teachers.
Examination of the data by the number of teachers with which a consultantwork, finds:
:166
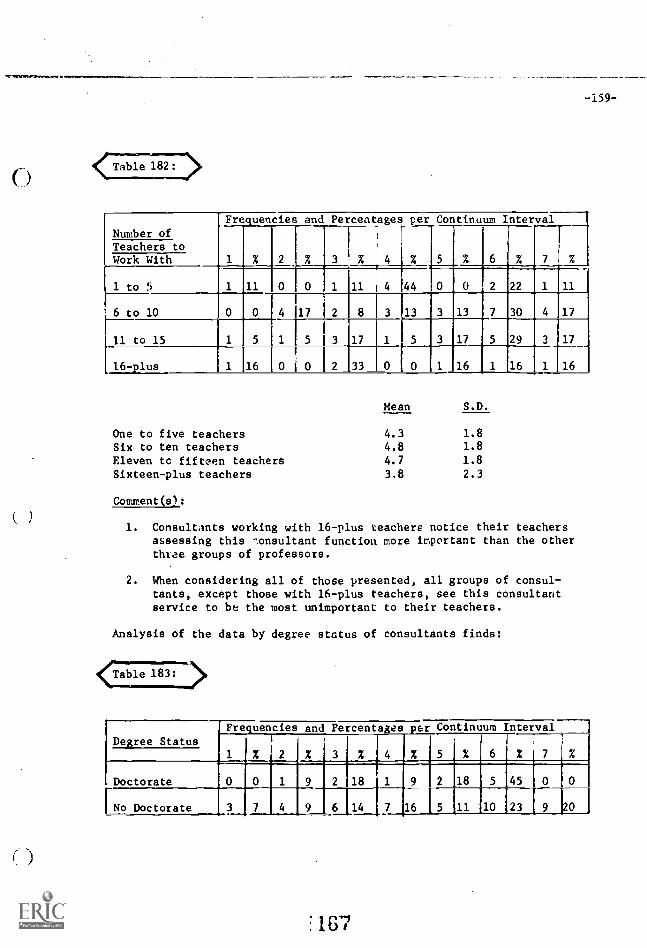
-159-
Number ofFrequencies and Percentages per
%
Continuum Interval
%
Teachers toWork With
1 to 5 1 11 0 0 1 11 4 44 0 0 2 22 1 11
6 to 10 0 0 4 17 2 8 3 13 3 13 7 30 4 17
11 to 15 1r 17 1 5 3 17 5 29 3 17
16-plus 1 16 0 0 2 33 1 16 1 16 1 16
Mean S.D.
One to five teachers 4.3 1.8Six to ten teachers 4.8 1.8
Eleven tc fifteen teachers 4.7 1.8
Sixteen-plus teachers 3.8 2.3
Comment(s)
1. Consultants working with 16-plus teachers notice their teachersassessing this .lonsultant function more important than the otherthtae groups of professors.
2. When considering all of those presented, all groups of consul-tants, except those with 16-plus teachers, see this consultantservice to be the most unimportant to their teachers.
Analysis of the data by degree status of consultants finds:
Table 183: -1),
Degree StatusFrequencies and Percentages
3%per Continuum
5%Interval
6% 71 % 2 X 4 %I_
%
Doctorate 0 0 1 9 2
6
18
14
11
7 16
2
l 5
18
11
5
10
45T
23
0
9
0
20No Doctorate 3 7 4 19
167
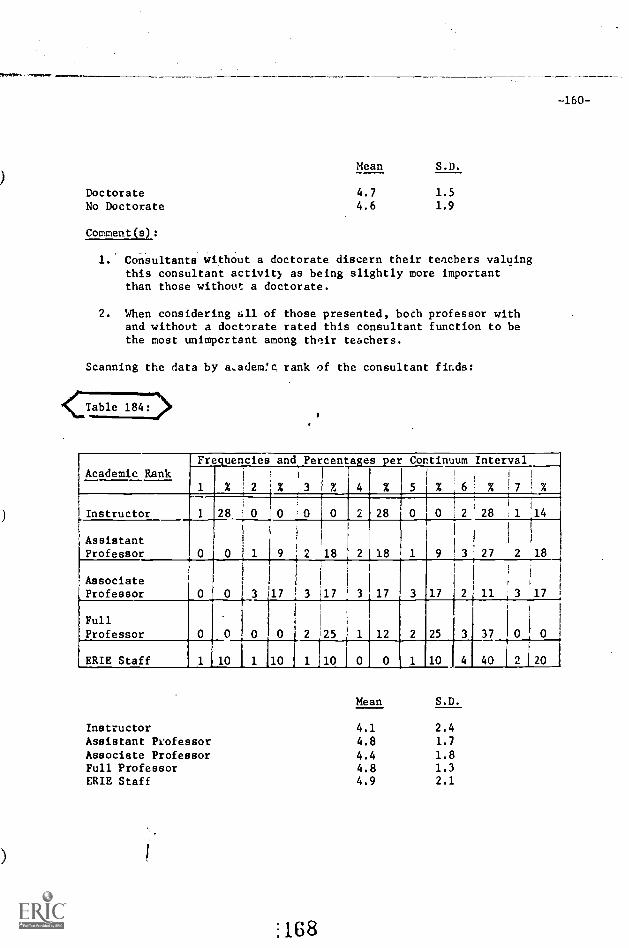
-160-
DoctorateNo Doctorate
Comment(s):
Mean S.D.
4.7 1.5
4.6 1.9
1. Consultants without a doctorate discern their teachers valuingthis consultant activity as being slightly more importantthan those without a doctorate.
2. When considering all of those presented, boch professor withand without a doctorate rated this consultant function to bethe most unimportant among their teachers.
Scanning the data by a.adem:c rank of the consultant finds:
<Table 184:>
Academic RankFrequencies and Percentages per Continuum Interval
1 % 2 % ' 3 % 4 % 5
!
% 6 %
Instructor 1
0
28,
0
0 1 0
1 9
0
2
0
18
2 j
2
28
18
0
1
0 2
9 3
28
27
1
i
2
14_____
1
18
AssistantProfessor
AssociateProfessor 1
3 17 3 17 f 3 17 3 17 2 11 3 17
FullProfessor 0 0 0 0 2 25 1 12 2 25 3 37
ERIE Staff 1 10 1 10 1 10 0 0 1 10 4 40 2 120
Mean S.D.
Instructor 4.1 2.4
Assistant Professor 4.8 1.7
Associate Professor 4.4 1.8Full Professor 4.8 1.3ERIE Staff 4.9 2.1
1.68
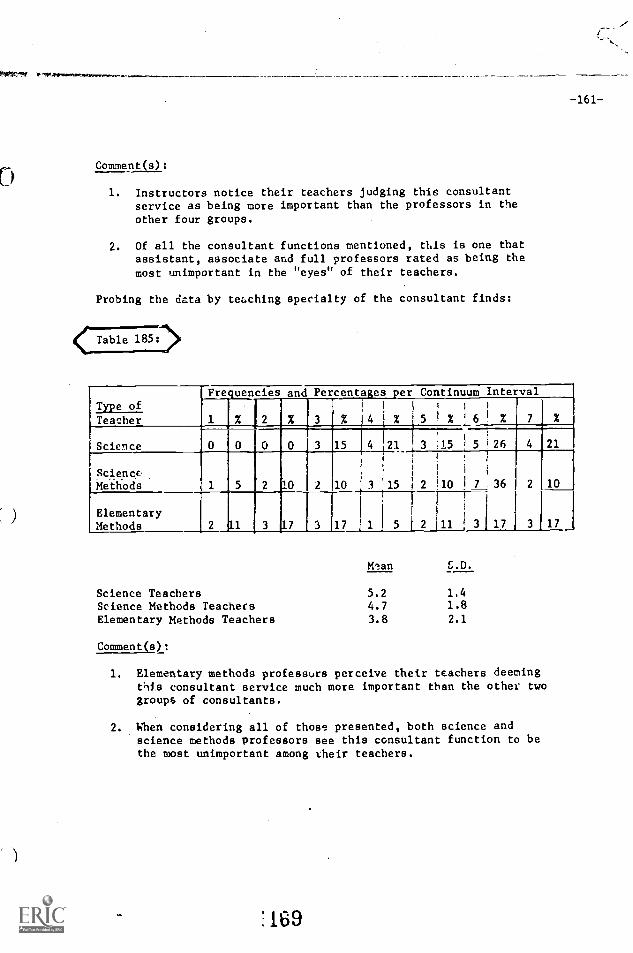
ftl,r7.7.1
161
Comment(s):
1. Instructors notice their teachers judging this consultantservice as being more important than the professors in theother four groups.
2. Of all the consultant functions mentioned, this is one thatassistant, associate and full professors rated as being themost unimportant in the "eyes" of their teachers.
Probing the data by teaching specialty of the consultant finds:
<CTable 185:)
Type ofFre uencies and
Ill %
Percentages per Continuum Interval
! !; 1
% '4 4 % 5 % I 6 ! % 7 %1 %Teacher
Science 0 0 0 0 1 3 15 4 121 3 151
i 5 26 4 21
1 ! i
Sciencc ii 1
MehOds 1 10 2 10 3 115 2 10 1 7 36 2 10
Elementary
r
!
IMethods 2 0.1 3 7 3 17 1 5 2 ill,' 3
-17 3 17
Klan
Science Teachers 5.2 1.4
Science Methods Teachers 4.7 1.8
Elementary Methods Teachers 3.8 2.1
Comment(s):
1. Elementary methods professurs perceive their teachers deemingells consultant service much more important than the other twogroups of consultants.
2. When considering all of those presented, both science andscience methods professors see this consultant function to bethe most unimportant among their teachers.
169
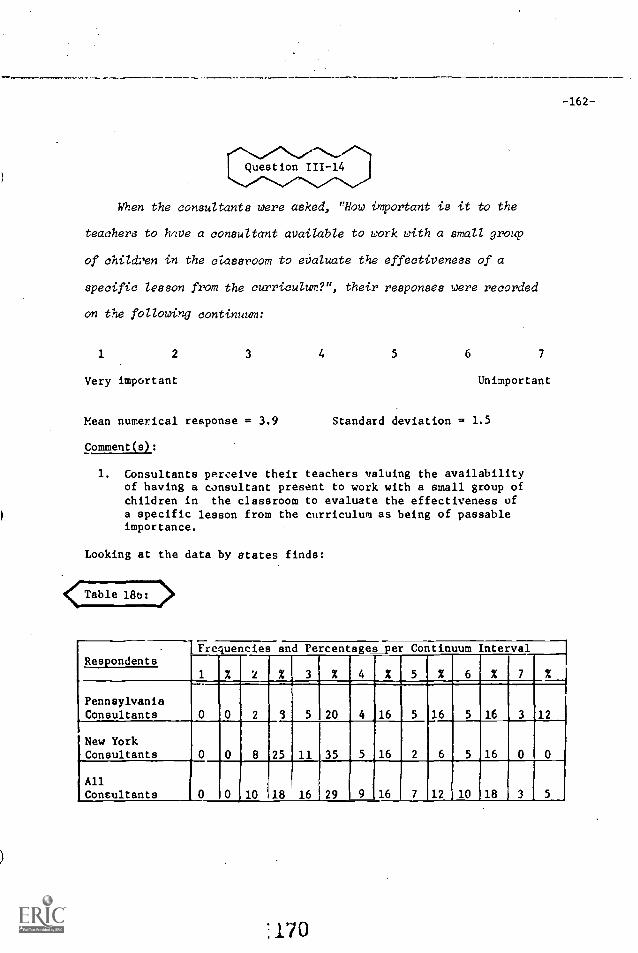
-162-
When the consultants were asked, "How important is it to the
teachers to have a consultant available to work with a small group
of children in the classroom to evaluate the effectiveness of a
specific lesson from the curriculum?", their responses were recorded
on the following continuum:
1 2 3 4 5 6 7
Very important Unimportant
Mean numerical response = 3.9 Standard deviation = 1.5
Comment(s):
1. Consultants perceive their teachers valuing the availabilityof having a consultant present to work with a small group ofchildren in the classroom to evaluate the effectiveness ofa specific lesson from the curriculum as being of passableimportance.
Looking at the data by states finds:
<Table 18b:
RespondentsFrequencies and Percentages per Continuum Interval
1% 2 2 3 % 4 Z 5 % 6 % 7%Pennsylvania
0 0 2 3 5 20 4 16 5 16 5 16 3 12,Consultants
New YorkConsultants 0 0 8 25 11 35 5 16 2 6 5 16
AllConsultants 0 0 10 18 16 29 9 16 7 12 10 18 3 5
170
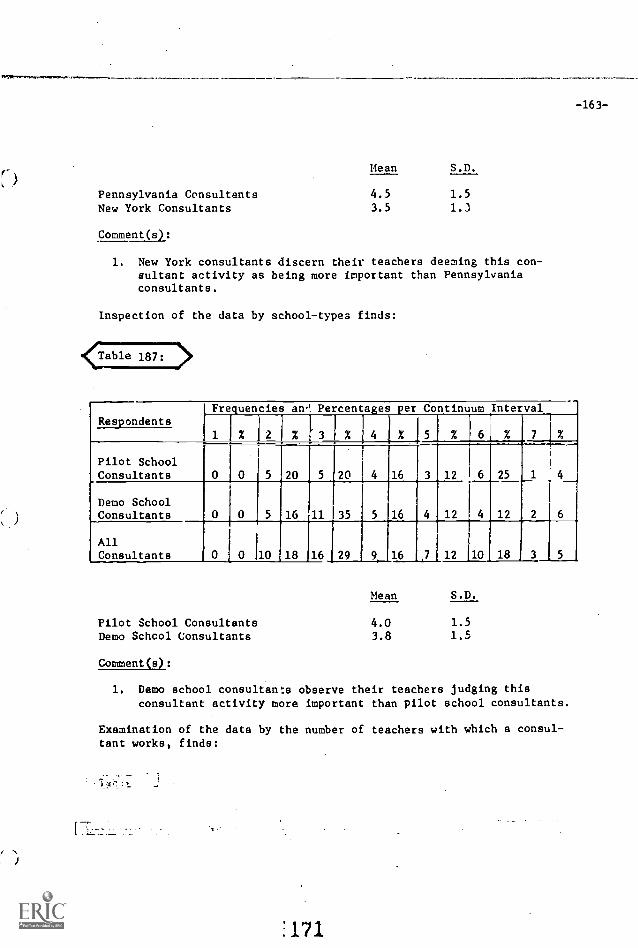
-163-
Pennsylvania ConsultantsNew York Consultants
Comment(s):
Mean S.D.
4.5 1.5
3.5 1.3
1. New York consultants discern their teachers deeming this con-sultant activity as being more important than Pennsylvaniaconsultants.
Inspection of the data by school-types finds:
<Table 187: 44>
RespondentsI Frequencies
1 %
an Percentages per Continuum Interval
2 % '3 % 4
v
% 5 % 6 % 7
1
%
Pilot SchoolConsultants 0 0 5 20 5 20 4 16 3 12 6 25 1 4
Demo SchoolConsultants 0 0 5 16 11 35 5 16 4
AllConsultants 0 0 10 18 16 29 9 16 7 12 10 18
Pilot School ConsultantsDemo Schcol Consultants
Comment(s):
Mean S.D.
4.0 1.5
3.8 1.5
1. Demo school consultants observe their teachers judging thisconsultant activity more important than pilot school consultants.
Examination of the data by the number of teachers with which a consul-tant works, finds:
171
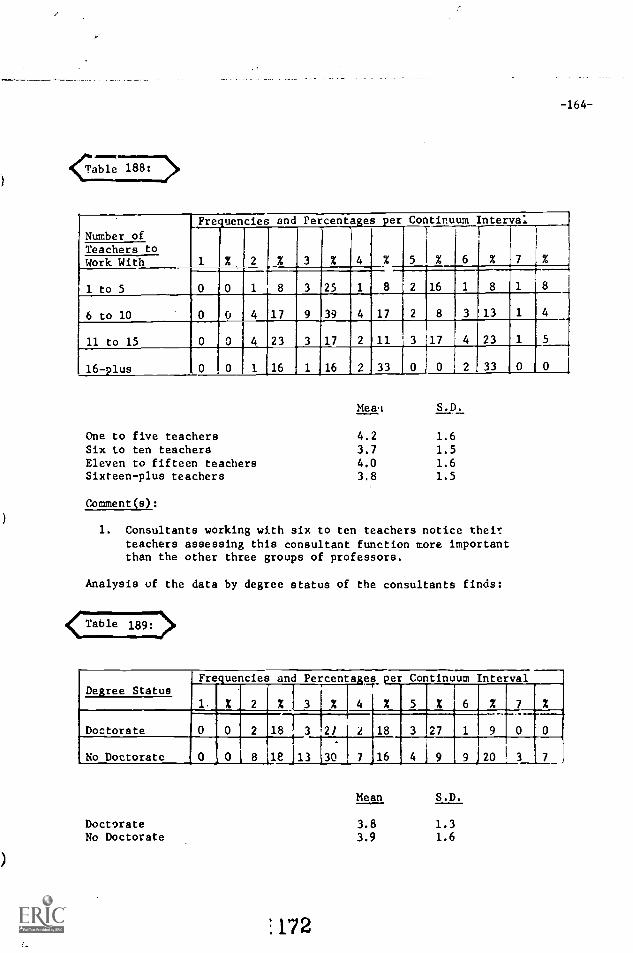
-164-
7.777)Erf'
Number of
Frequencies and Percentages per Continuum Interva.,
3
11
Teachers toWork With
1 to 5 0 0 1 8 3 25 1 8 2 16
6 to 10 0 0 4 17 9 39 4 17 2 8 3 13
11 to 15 0, 4
1
2 3
16
3
1
17
16
2
2
11
33
1 3
0
17
0
4
2
23
3316-plus
Mee: S.D.
One to five teachers 4.2 1.6Six to ten teachers 3.7 1.5Eleven to fifteen teachers 4.0 1.6Sixteen-plus teachers 3.8 1.5
Commentls):
1. Consultants working with six to ten teachers notice theirteachers assessing this consultant function more importantthan the other three groups of professors.
Analysis of the data by degree status of the consultants finds:
< Table 189: >
Degree StatusFre.uencies and Percentages er Continuum Intervalseall 7
111111Z 1 3 2 4 X
Doctorate 0 0 2 18 3 2/ 2 18 3 27 1
No Doctorate 0 0 8 lE 13 III 7 16 4 9 9 20
DoctorateNo Doctorate
172
Mean S.D.
3.8 1.33.9 1.6
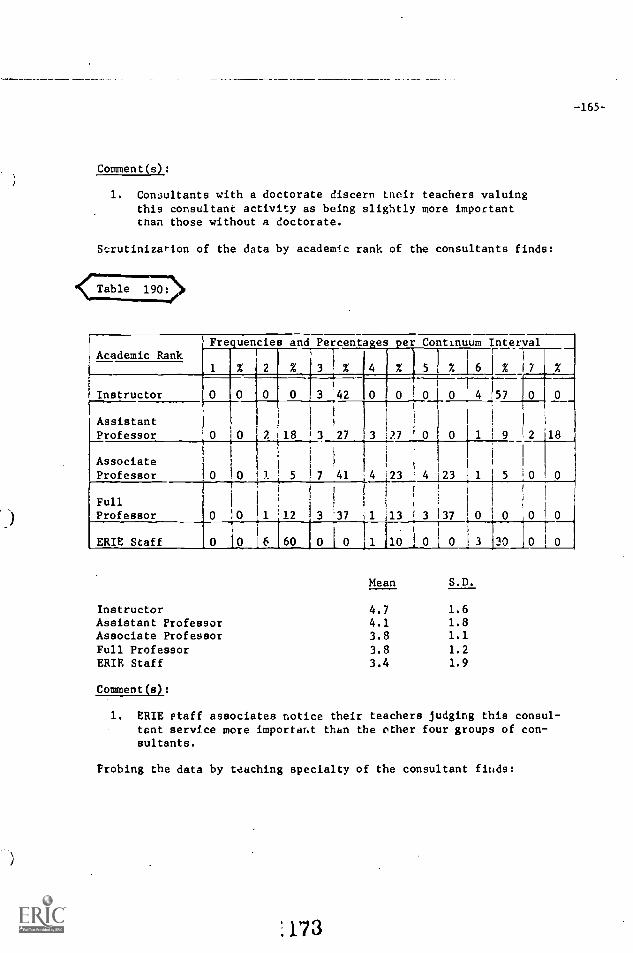
-165-
Comment(s):
1. Consultants with a doctorate discern tneir teachers valuingthis consultant activity as being slightly more importantthan those without a doctorate.
Scrutinization of the data by academic rank of the consultants finds:
Table 190:
Academic RankFrequencies and Percentages per Continuum Interval
1
1
% '2 %
,
3 % 4
i
% 5 %
r
6 I % 17 %
Instructor 0 0 0 0 3 42 0 0 0 0
0
4 457
1 9
0
2
1
0 -
18
AssistantProfessor 0 10 2 18 3 27 3 27 0
AssociateProfessor 0 0 11 5
0 0 1 12
7
3
41 i_le
37 1
23 1 4
13 t 3
23
37
1
0
5
0
0
0 0
FullProfessor
ERIE Staff 0 16 60 0 0 1 10 , 0 0 3 30
1
0 0
Mean S.D.
Instructor 4.7 1.6Assistant Professor 4.1 1.8Associate Professor 3.8 1.1
Full Professor 3.8 1.2ERIE Staff 3.4 1.9
Comment(s):
1. ERIE staff associates notice their teachers judging this consul-tant service more important than the other four groups of con-sultants.
Probing the data by teaching specialty of the consultant finds:
1173
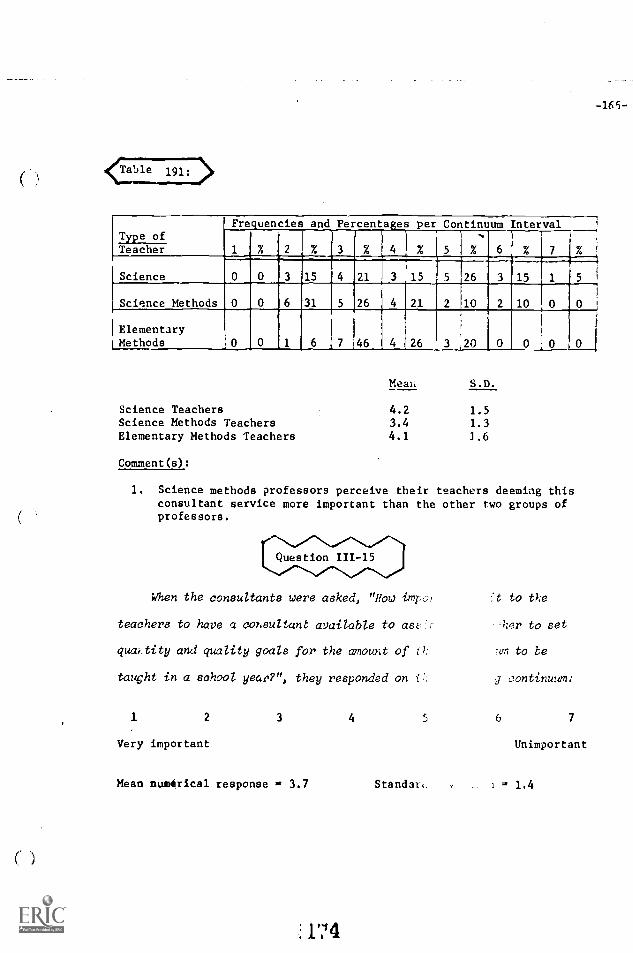
-165-
Type ofFrequencies and Percentages per Continuum Interval 1
1 _., % 2 % 4 X 5 % 6 % 7 %Teacher
Science
1
0 0 J 3 15 4 21 3 15 5 26
1--
3 15 1 5
Science Methods 0 0 6 31 5 26 4 21 2 10 2 10 0 0
Elementary1Methods 6 7 46 4 26 3 20 0 0 0 0
Mean S.D.
Science Teachers 4.2 1.5Science Methods Teachers 3.4 1.3Elementary Methods Teachers 4.1 3.6
Comment(s):
1. Science methods professors perceive their teachers deeming thisconsultant service more important than the other two groups ofprofessors.
When the consultants were asked, "How impo,
teachers to have a consultant available to ass::
qucatity and quality goals for the amount of
taught in a school year?", they responded on 1:.;
1 2
Very important
3
Mean numerical response 3.7
174
:t to tke
her to set
74.m to be
g continuum:
4 5 6 7
Unimportant
Standal.: = 1.4
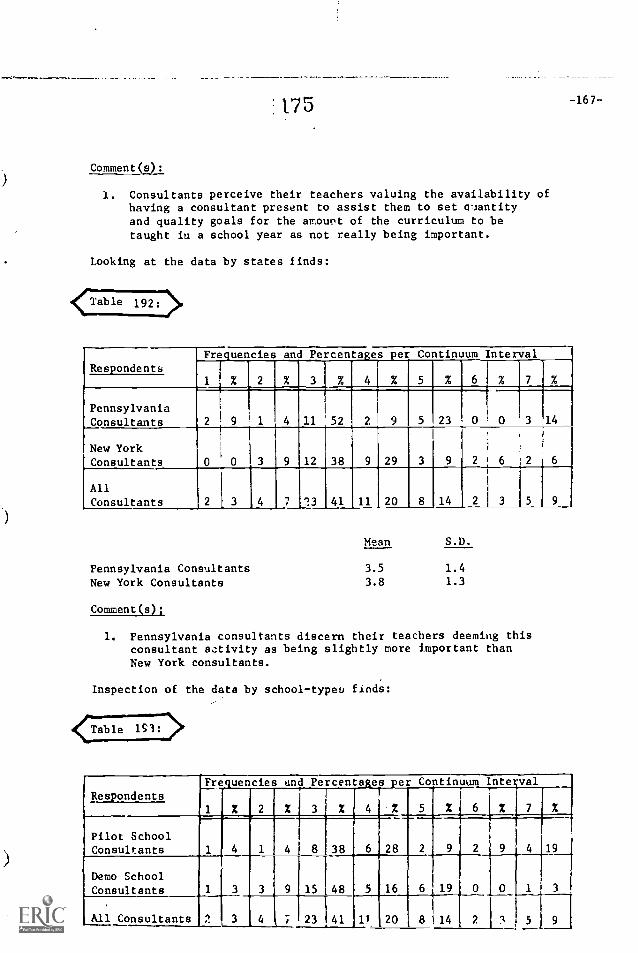
175
Comment(s):
1. Consultants perceive their teachers valuing the availability ofhaving a consultant present to assist them to set aiantityand quality goals for the amount of the curriculum to betaught in a school year as not really being important.
Looking at the data by states finds:
<Table 192:>
-167-
RespondentsFrequencies and Percentages per Continuum Interval
1 % 2 % 3 % 4 % 5 % 6 %
PennsylvaniaConsultants 2 9 1 4 11 52 2 9 5 23 0 0 314
New YorkConsultants 0 0 3 9 12 38 9 29 3 9 2 i 62 6
All
Consultants 2 3 4 7 13 41 11 20 8 14
Pennsylvania ConsultantsNew York Consultants
Mean S.D.
3.5 1.4
3.8 1.3
Comment(s);
1. Pennsylvania consultants discern their teachers deeming thisconsultant activity as being slightly more important thanNew York consultants.
Inspection of the data by school-typeu finds:
<Table 193: >
RespondentsFrequencies and Percentages per Continuum Irntelval
% 7 %1 % 2 %, 3 % 4 % 5 % 61
Pilot SchoolConsultants 1 4 1 4 8.38 6 28 2 9 2 9 4 19
Demo SchoolConsultants 1
2
3
3
3 9 15
23
148
41
5
11
16
20
6
8
19
14
0
2
0
3
1_
5
3
9All Consultants

-168-
Pilot School ConsultantsDemo School Consultants
Comment(s):
Mean S.D.
4.0 1.5
3.4 1.2
1. Demo school consultants observe their teachers judging thisconsultant service more important than pilot school consultants.
Examination of the data by the number of teaches with which a con-sultant works, finds:
Table 194:
Number ofFrequencies and Percentages
3
per Continuum Interval
1 X 2 X X 4 . 5 X 6 X 7 X
Teachersto Work With
1 to 5 0 0 1 11 4 44 1 11 3 33 0 0 0 0
6 to 10 1 4 1 4 13 56 4 17 3 13
11 to 15 1 5 1 5 4 23 5 29 2 11 1 5 3 ,17
16-plus 0 O 1 16 2 33 1 16 1 0 0 1 16 1 16
Mean S.D.
One to five teachers 3.7 1.1
Six to ten teachers 3.5 1.2
Eleven to fifteen teachers 4.1 1.7
Sixteen-plus teachers 3.6 1.5
Comment(s):
1. Consultants working with six to 10 teachers notice theirteachers assessing this consultant function more importantthan the other three groups of professors. Those workingwith 11 to 15 teachers see their teachers valuing this con-sultant activity as being rathe. unimportant.
Analysis of the data by degree status of consultants finds:
176
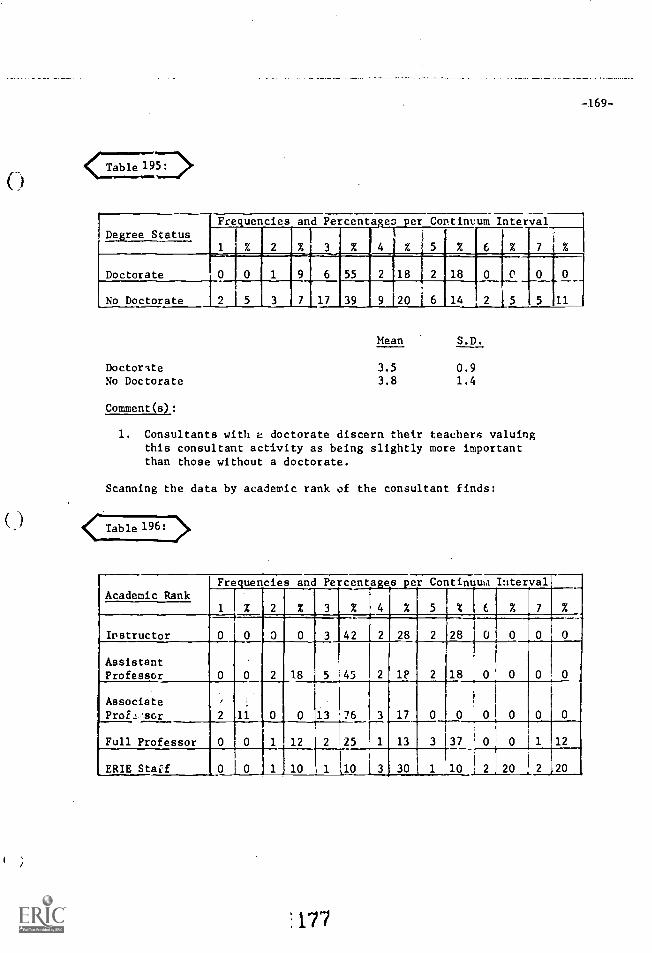
( )
Table 19D
-169-
Degree StatusFre uencies and Percenta ea er Continuum Interval
2 % 3 % 4 %:
3 5 % 6 % 7
Doctorate 0 0 1 9 6 55 2 18 12
1 6
18
14
0
1 2
C
5
0
5
0
11No Doctorate 2 5 3 7 17 39 9 120
DoctorateNo Doctorate
Mean S.D.
3.5 0.93.8 1.4
Comment(s):
1. Consultants with a doctorate discern their teachers valuingthis consultant activity as being slightly more importantthan those without a doctorate.
Scanning the data by academic rank of the consultant finds:
< Table 196:
Academic RankFrequencies and Percentages per Continuum Interval
1 % 2 % 3 % 4 % 5 % 6 % 7
Instructor 0 0 0 0 3 42 2 28 2 28
AssistantProfessor 0 0 2 18 5 45 2 1F 2 18 0 0 0 0
AssociateProf..1,,.scr 2 11 0 0 13 76 3
r"--
1
17
13
0 0 0 0 0 0
Full Professor 0 0 1 12 2 25 1 3 37 0 0 1 12
ERIE Staff ,0 1 0 1 10 1 1 10 1 3 30 1 10 2j 20 2 120
177

-170-
Mean S.D.
Instructor 3.9 0.9Assistant Professor 3.4 1.0
Associate Professor 2.9 0.8Full Professor 4.3 1.6ERIE Staff 4.8 1.7
Comment(s):
1. Associate professors notice their teachers judging this con-sultant service as being more important than the professorsin the other four groups.
2. Both full professors and ERIE staff associates evaluate theirteachers assessment this consultant activity as being ratherunimportant.
Probing the data by teaching specialty of the consultant finds:
4((fTable 197:
Type of TeacherFrequencies and Percentages per Continuum_Interval
1 X 2%1
3 %
1
4 %
_
5% 7 %
Science 0 0 2 10 9 47_ 2 10 4 21 1 5 1 5
Science Methods 2 10 1 5 7 36 5 26 1 5 1 5 2 10
ElementaryMethods 0 0 ',. 6 7 46 4 26 3 20 0 0 0 0
Mean S.D.
Science Teachers 3.8 1.4
Science Methods Tea:hers 3.7 1.7
Elementary Methods Teachers 3.6 0.9
Commenc(s))
1. Elementary methods professors perceive their teachers deemingthis consultant service slightly more important than theother two groups of consultants.
:178
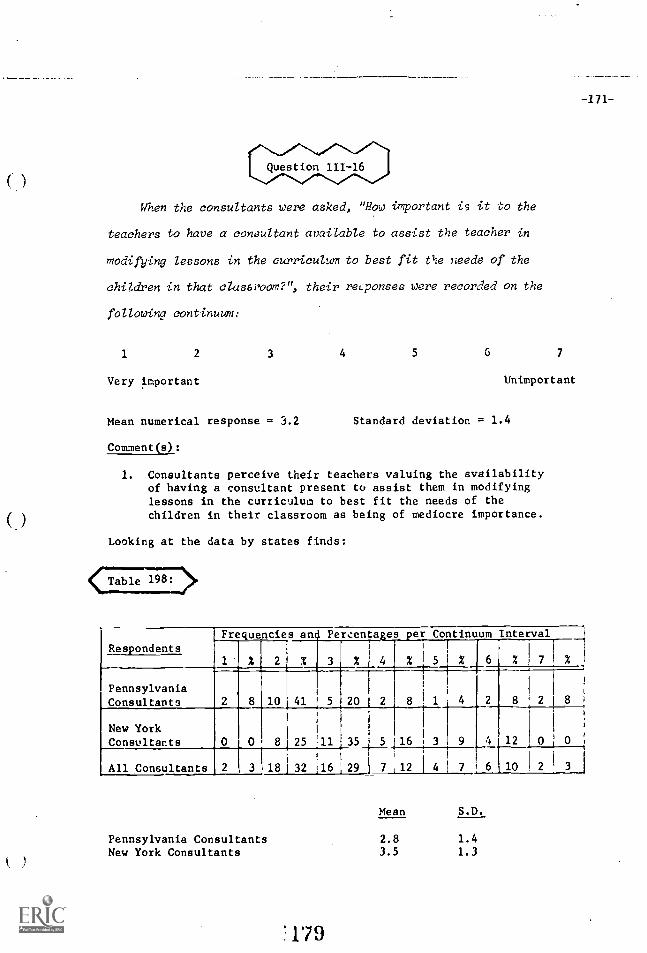
( )
-171-
When the consultants were asked, "How important is it 'co the
teachers to have a consultant available to assist the teacher in
modifying lessons in the curriculum to best fit the needs of the
children in that classroom?", their reLponses were recorded on the
following continuum:
1 2 3 4 5 6 7
Very important Unimportant
Mean numerical response = 3.2 Standard deviation = 1.4
Comment(s):
1. Consultants perceive their teachers valuing the availabilityof having a consultant present to assist them in modifyinglessons in the curriculum to best fit the needs of thechildren in their classroom as being of mediocre importance.
Looking at the data by states finds:
Respondents
Frequencies and Percentages per Continuum Interval
1 2 2 % 3 X 4 X
1
51 X 6 2 f 7 X
PennsylvaniaConsultants 2 8 10 41 5 20 4 2 8 2 8
New YorkConsultants 0 0 8 25 11 35 5 16 3 i 9 4 12 0 0
All Consultants 181 32 ;16 29 7 12 1 4 1 7 6 10 3
Pennsylvania ConsultantsNew York Consultants
:1'79
Mean S.D.
2.8 1.4
3.5 1.3

-172-
Comment(s):
1. Pennsylvania consultants discern their teachers deeming thisconsultant activity as being more important when comparingthe perceptions of New York cousoltants.
Inspection of the data by school-types finds:
Table 199:
RespondentsI Frequencies and Percentages per Continuum
%
Interval
6 % 7 %1 % 2 % 3 % j 4 % 5
Pilot SchoolConsultants 1 4 8 33 6 25 3 12 0 0 4 f16 2 1 8
Demo SchoolI Consultants 1 3 10 32 10 32 4 12 4 12 2 6 0 )
All Consultants 2 3 18 32 16 29 7 12 4 7 6 10 2 3
Pilot school consultantsDemo school consultants
Comment(s):
Mean S.D.
3.3 1.53.1 1.3
1. Demo school consultants observe their teachers judging thisconsultant service slightly more important when comparing theperceptions of pilot school consultants.
Examination of the data by the number of teachers with which a consul-tant works, finds:
No. of Teachersto Work With
L_Freuencies and Percentages per Continuum Interval
1 X 2 % 3 2 4 % 5 % 6 % 7 il_i
01 to 5 0 0 3 33 4 44 1 11 0 0 1 11 0
6 to 10 1 4 9 39 5 21 3 13
-___
4 17 1 4 0 0
11 to 15 1 5 3 17 6 35 3 17 3 17 1 5
16-plus 0 0, 3 50 1 16 0 0 0 0 1 16 1 16
180
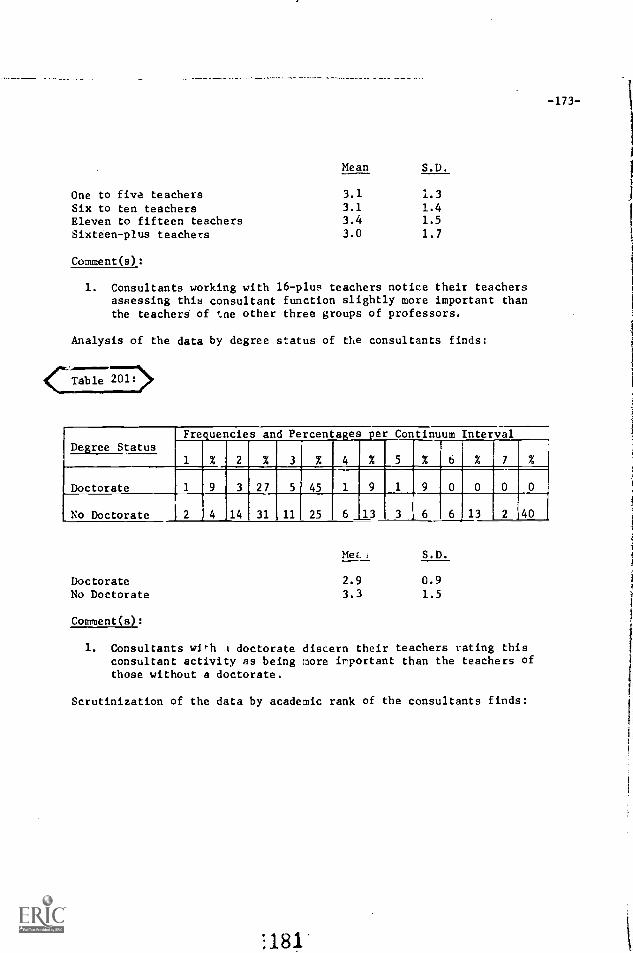
-173-
Mean S.D.
One to five teachers 3.1 1.3
Six to ten teachers 3.1 1.4Eleven to fifteen teachers 3.4 1.5
Sixteen-plus teachers 3.0 1.7
Comment(s):
1. Consultants working with 16-plus teachers notice their teachersassessing this consultant function slightly more important thanthe teachers of tne other three groups of professors.
Analysis of the data by degree status of the consultants finds:
Table 77737s)*
Degree StatusFrequencies and Percentages per Continuum Interval
1 % 2 3 % 4 % 5 7 %
Doctorate 1 9 3 27 5 45 1 9 1 9 0 0 0 0
No Doctorate 2 4 14 31 11_ 25 6 13 3 A 6 6 13 2 40
DoctorateNo Doctorate
Comment(s):
MeLt S.D.
2.9 0.9
3.3 1.5
1. Consultants wigt t doctorate discern their teachers rating thisconsultant activity as being more important than the teachers ofthose without a doctorate.
Scrutinization of the data by academic rank of the consultants finds:
181
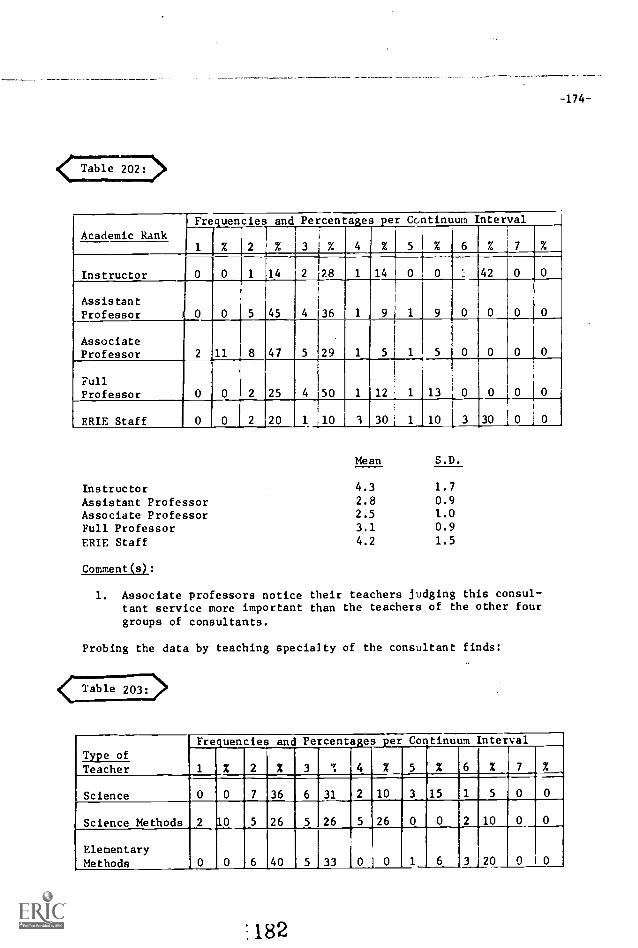
-174--
Academic RankFrequencies
1 % 2
and
%
Percentages per Continuum Interval
3 '% 4 % 5 % 6 % 7 %
Instructor 0 0 1 14 2 28 1 14 0 0 42 0
AssistantProfessor 0 0 5 45 4 36 1 9
AssociateProfessor 2 11 8 47 5 29 1 5 i 1
FullProfessor 0 0 2 25 4 50 1 12 1 13
I.
ERIE Staff 0 0 2 20 1 10 3 30 1 10 3 30 0 1 0
Mean S.D.
Instructor 4.3 1.7
Assistant Professor 2.6 0.9
Associate Professor 2.5 1.0
Full Professor 3.1 0.9
ERIE Staff 4.2 1.5
Comment(s):
1. Associate professors notice their teachers judging this consul-tant service more important than the teachers of the other fourgroups of consultants.
Probing the data by teaching specialty of the consultant finds:
< Table 203: >
Type of
Frequencies and Percentages per Continuum Interval
1 X 2 X 3 w 4 % 5 6 % 7 XTeacher
Science 0 0 7 36 6 31 2 10 3 15 1 5 0 0
Science Methods 2 10 5 26 5
.
26 5 26 0 0 2 10 0 0
ElementaryMethods 0 0 6 40 5 33 0 0 1 6 3 20 0 i 0
;182
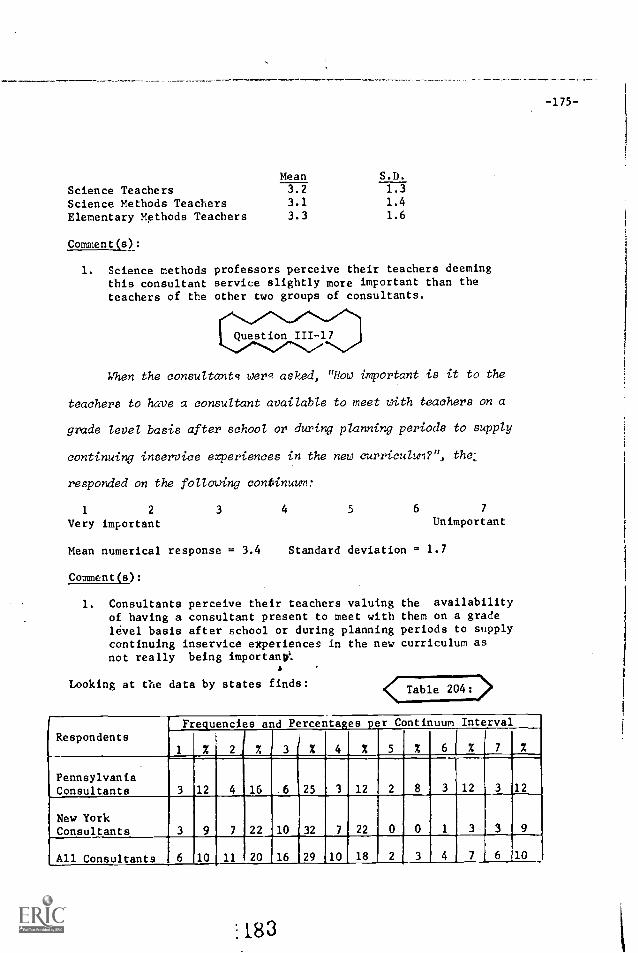
-175-
Mean S.D.
Science Teachers 3.2 1.3
Science Methods Teachers 3.1 1.4
Elementary Methods Teachers 3.3 1.6
Comment(s):
1. Science methods professors perceive their teachers deemingthis consultant service slightly more important than theteachers of the other two groups of consultants.
Question 111-17
When the consultants wers asked, "How important is it to the
teachers to have a consultant available to meet with teachers on a
grade level basis after school or during planning periods to supply
continuing inservice experiences in the new curriculum?", the:
responded on the following continuum:
1 2 3 4 5 6 7
Very important Unimportant
Mean numerical response = 3.4 Standard deviation = 1.7
Comment(s):
1. Consultants perceive their teachers valuing the availability
of having a consultant present to meet with them on a gradelevel basis after school or during planning periods to supplycontinuing inservice experiences in the new curriculum asnot really being importanle.
Looking at the data by states finds: Table 204: >
RespondentsFrequencies and Percentages per Continuum Interval
1 % % 3 % 4 % 5 % 6 [ % 7
PennsylvaniaConsultants 3 12 4 16 6 25 12 3 12 3 12
New YorkConsultants 3 9 7 22 10 32 7 22
All Consultants 6 10 11 20 16 29 10 18 2 3 4 7 6 10
183
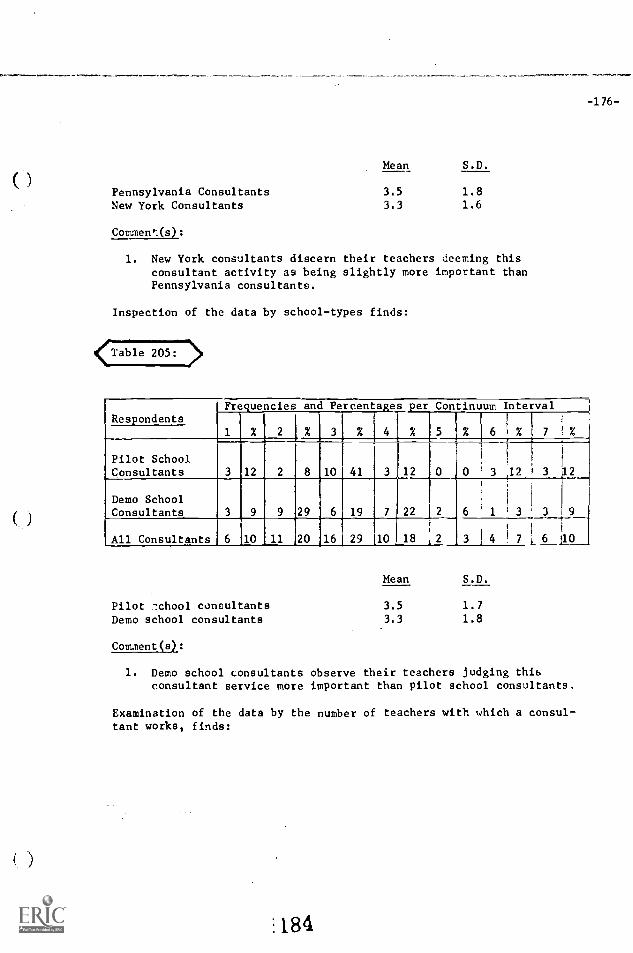
( )
-176-
Pennsylvania ConsultantsNew York Consultants
Comment(s):
Mean S.D.
3.5 1.83.3 1.6
1. New York consultants discern their teachers deeming thisconsultant activity as being slightly more important thanPennsylvania consultants.
Inspection of the data by school-types finds:
Icable 205:
Respondentsand Percentages per Continuum Interval,Frequencies
% 2 % 3 % 4 % 5 % 6 % 7 %
Pilot SchoolConsultants 3 12 8 10 41 3 12 0 0 3
i
J2 3 12
1
9
Demo SchoolConsultants 3 9 9 29 6 19 7 22 2 6 1
I
1 3 3
All Consultants 6 10 11 20 15 29 10 18 i2 3 4
1
! 7 6 110
Pilot -chool consultantsDemo school consultants
Com.nent(s):
Mean S.D.
3.5 1.73.3 1.8
1. Demo school consultants observe their teachers judging thisconsultant service more important than pilot school consultants.
Examination of the data by the number of teachers with which a consul-tant works, finds:
184
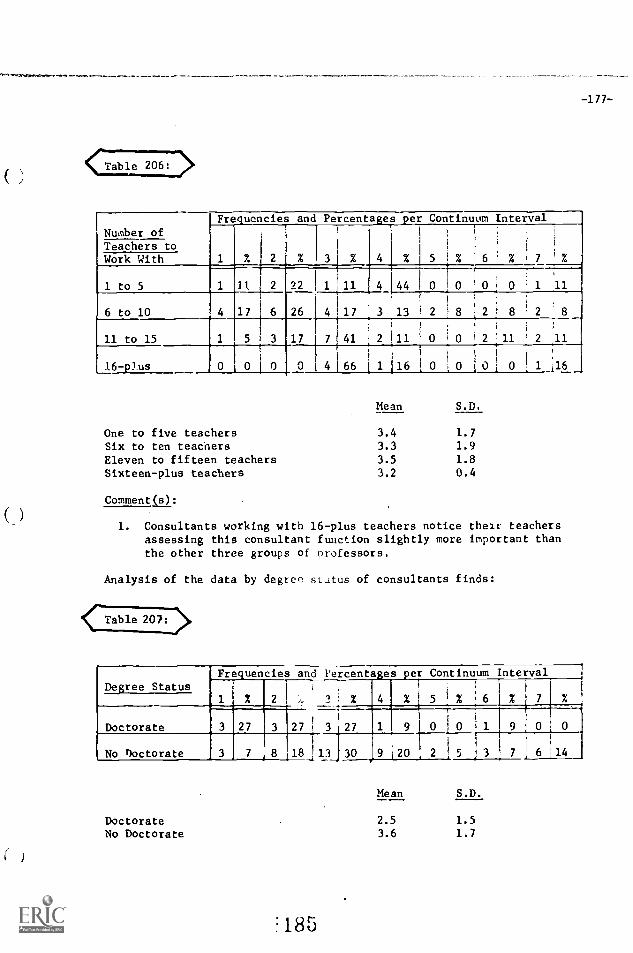
(Table 206: >
-177--
[ Number ofto
Frequencies and Percentages per Continuum Interval
1 % 2 %
1
% 5
f
% 6
I
% : 7 ' %
TeachersWork With
1 to 5 1 ll 2 22 ' 11 4 44 0 f 0 0 ' 1 11
6 to 10 4 17 6 26 4 17 3 13 i 2!
8 2 8 ! 2 8
11 to 15 1 5 3 17 7 41 2 11 0 ' 0 2i
11 1 2 11
16-plus 4 66 1 il6 ! 0 1_0 0 1 1 ;16
Mean S.D.
One to five teachers 3.4 1.7
Six to ten teachers 3.3 1.9
Eleven to fifteen teachers 3.5 1.8
Sixteen-plus teachers 3.2 0.4
Comment(s):
1. Consultants working with 16-plus teachers notice their teachersassessing this consultant function slightly more important thanthe other three groups of professors.
Analysis of the data by degree status of consultants finds:
Degree StatusFrequencies and Percentages
2 % 4
per Continuum
% i 5 i% ! 6
Interval
% 71 1
2 'f.
o
Doctorate 3 27f
27 ; 3 27 9i
1 0 1 9 1 0
No Doctorate 3 7 , 8
I
0.8 ! 13 30 9 20 2i
1 5 j 3 7 1 6 14
DoctorateNo Doctorate
185
Mean S.D.
2.5 1.53.6 1.7
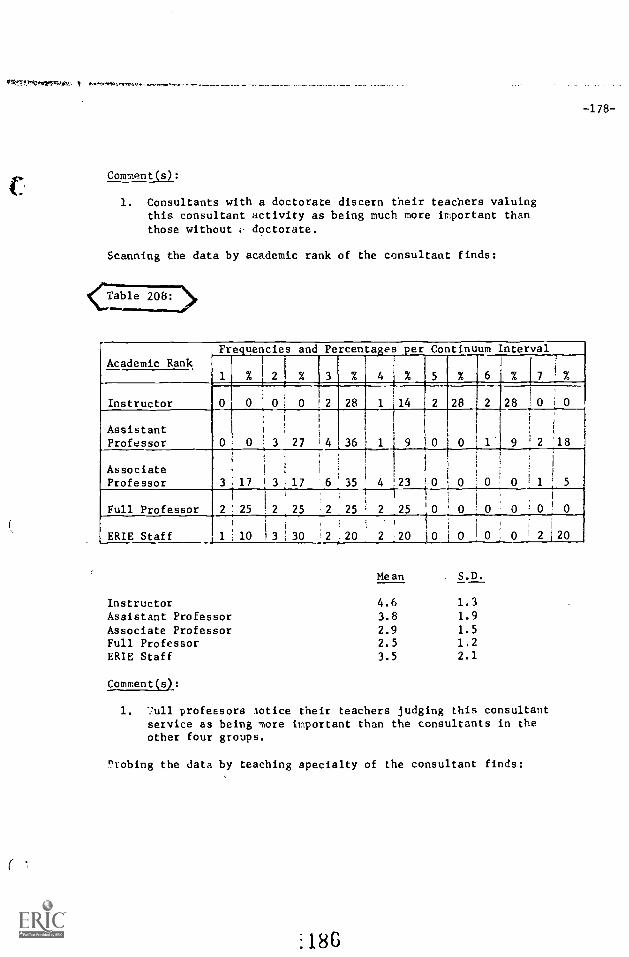
-178-
Comment(s):
1. Consultants with a doctorate discern their teachers valuingthis consultant activity as being much more important thanthose without e doctorate.
Scanning the data by academic rank of the consultant finds:
((:Table 208: 14>
Academic RankFrequencies and Percentajes per Continuum Interval
1 % 7
Instructor 0 1 0 ( ! 2 28 1
I
il4 2 28 2 28 0 ;
AssistantProfessor 0 0
i
I
3 27 !4 36 ( 9 2 '18
AssociateProfessor
-.
I
3 17 3 17 '6 35 4 !23 0 0 0 0 1! 5
Full Professor
i
2 25 ! 2 25 .2 25 2 25 0 0 0 0
I
0!
ERIE Staff 1 I 10 ! 3 30 ' 2:20 2 20 10 0 01
0 2 20
InstructorAssistant ProfessorAssociate ProfessorFull ProfessorERIE Staff
Comment(s):
Mean S.D.
4.6
3.8
2.92.5
3.5
1.31.9
1.51.22.1
1. profeEsors .notice their teachers judging this consultantservice as being more important than the consultants in theother four groups.
7robing the data by teaching specialty of the consultant finds:
186
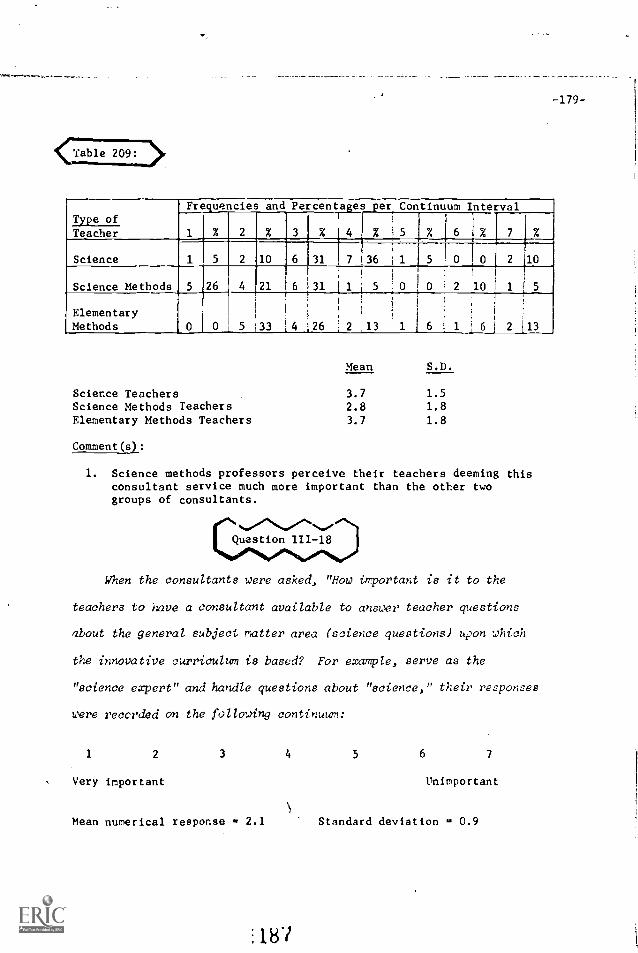
-179-
<Table
Type ofFrequencies and Percentages_per Continuum Interval
1 % 2 % 3 I % 4 % , 5 % 6 % 7 %Teacher
Science 1 5 2 10 6 31 736 _1 1 5 , 0 1 0 2 10
Science Methods 5 26 4 21 6 31 1 5 0 . 0
:
1
!
2 10 1 .
ElementaryMethods 5 33 14 126 , 2 13
i
1 1 6 1 1 6 1 2 L13
Mean S.D.
Science Teachers 3.7 1.5Science Methods Teachers 2.8 1.8Elementary Methods Teachers 3.7 1.8
Comment(s):
1. Science methods professors perceive their teachers deeming thisconsultant service much more important than the other twogroups of consultants.
Question 111-18
When the consultants were asked, "How important is it to the
teachers to have a consultant available to answer teacher questions
about the general subject matter area (science questions) upon which
the innovative curriculum is based? For example, serve as the
"science expert" and handle questions about "science," their responses
were reccrded on the following continuum:
1 2 3 4 5 6 7
Very important Unimportant
Mean numerical response 2.1 Standard deviation 0.9
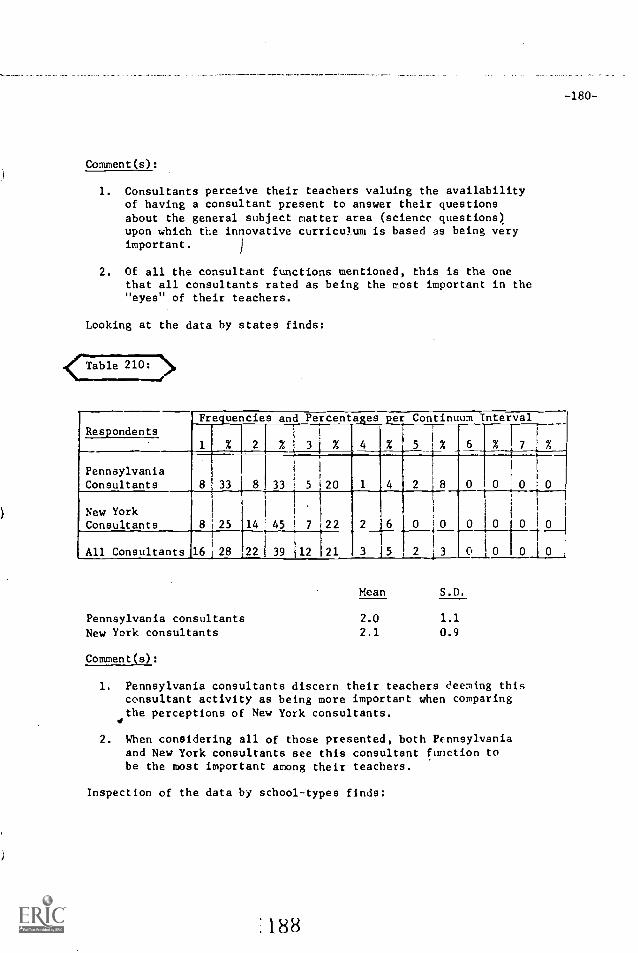
-180-
Comment(s):
1. Consultants perceive their teachers valuing the availabilityof having a consultant present to answer their questionsabout the general subject matter area (science questions)upon which the innovative curriculum is based as being veryimportant.
2. Of all the consultant functions mentioned, this is the onethat all consultants rated as being the most important in the"eyes" of their teachers.
Looking at the data by states finds:
Tab le 210:
RespondentsFrequencies and Percentages per Continuum Interval.
% 7 %1 % 2
l
% 3 j % 4 % 5 6
PennsylvaniaConsultants 8 33
1
81 33
i
1
5 120 1 4 2
fr
; 8 0 0
0
0
0
, 0
1
i 0
New YorkConsultants 8 25
1
14 ' 45 7
i
122 2 6 0
t
!
1 04
0
All Consultants 16 28 221 39 12 1t 21 3 5 2I
; 3 0 0 0 1 0
Pennsylvania consultantsNew York consultants
Comment(s):
Mean S.D.
2.0 1.1
2.1 0.9
1. Pennsylvania consultants discern their teachers deeming thisconsultant activity as being more important when comparingthe perceptions of New York consultants.
2. When considering all of those presented, both Pennsylvaniaand New York consultants see this consultant function tobe the most important among their teachers.
Inspection of the data by school-types finds:
188
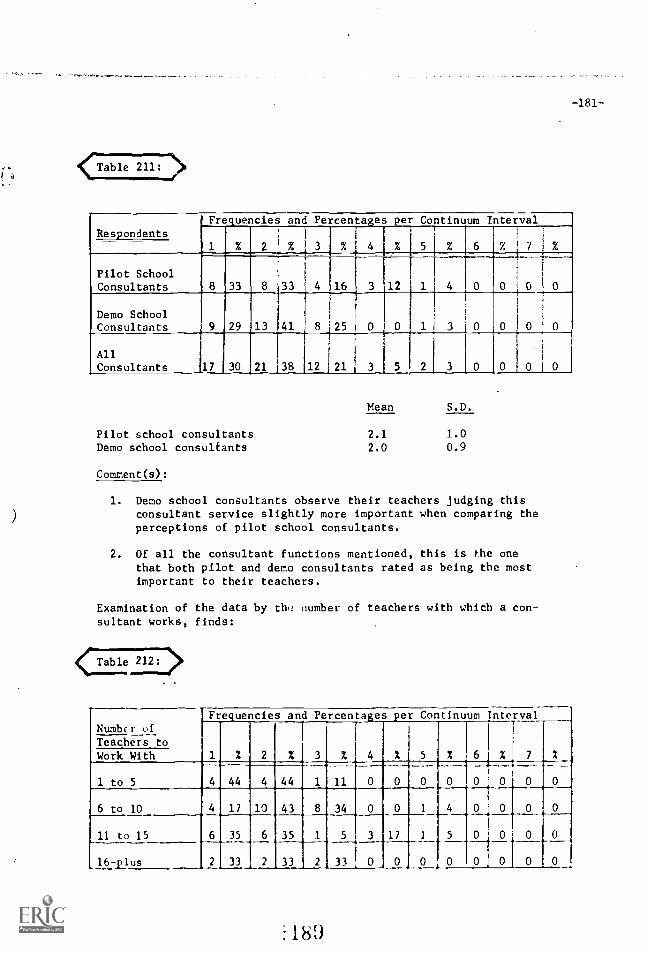
-181--
<Table 211: >
Respondents'Frequencies ana Percentages per Continuum Interval
% 2 % 3 %
T
4 % 5 % 6 7. I 7 I
Pilot SchoolConsultants 33 4 16 3 12 1 4 0
i f--=;
I
' 0!
0i
Demo SchoolConsultants 9 29 13 41 ' 8 25 0 0 1 3 0
I I
1
0 ,
I
AllConsultants 17 30 21 38 12 21 3 5 2 3 0 0 0 j 0
Pilot school consultantsDemo school consultants
Comment(s):
Mean S.D.
2.1 1.02.0 0.9
1. Demo school consultants observe their teachers judging thisconsultant service slightly more important when comparing theperceptions of pilot school consultants.
2. Of all the consultant functions mentioned, this is the onethat both pilot and demo consultants rated as being the mostimportant to their teachers.
Examination of the data by th,: number of teachers with which a con-sultant works, finds:
Table 212:
Number ofFrequencies
2
and
%
Percentages
3 %
per Continuum
5 X
0
Interval
f---
0
%
0
1 X
Teachers to
Work With
1 to 5 4 44 4 44 1 11 0 0 0 0 0
6 to 10 4 17 10 43 8 34 0 1 4 0 0 0
11 to 15 6
2
35
33
6
2
35
33
1
2
S 3 17 1 5
,
0 0 0
0
0
016721us 33 0 0 0 0 0 0
189
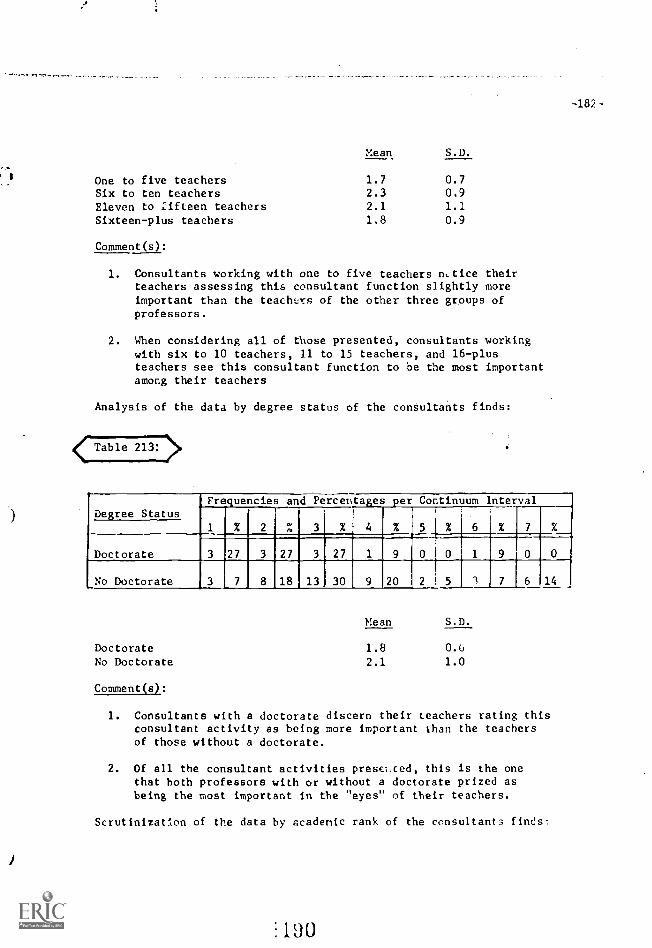
I
-182-
One to five teachersSix to ten teachersEleven to fifteen teachersSixteen-plus teachers
Comment(s):
Mean S.D.
1.7
2.32.1
1.8
0.70.91.1
0.9
1. Consultants working with one to five teachers nLtice theirteachers assessing this consultant function slightly moreimportant than the teachers of the other three groups ofprofessors.
2. When considering all of those presented, consultants workingwith six to 10 teachers, 11 to 15 teachers, and 16-plusteachers see this consultant function to be the most importantamong their teachers
Analysis of the data by degree status of the consultants finds:
Table 213: >
Degree StatusFrequencies and Percentages per Continuum Interval
1 % 2 % 3 % 4 % 5 % 6 7 %
Doctorate 3 27 3 X27 3 27 1 9 0 0 1 9 0 0
No Doctorate 3 7 8 18 13 30 9 20 2 5 3 7 6 14
DoctorateNo Doctorate
Comment(s):
Mean S.D.
1.8 0.0
2.1 1.0
1. Consultants with a doctorate discern their teachers rating thisconsultant activity as being more important than the teachersof those without a doctorate.
2. Of all the consultant activities presc;ited, this is the onethat both professors with or without a doctorate prized asbeing the most important in the "eyes" of their teachers.
Scrutinizaton of the data by academic rank of the consultants finds:
190
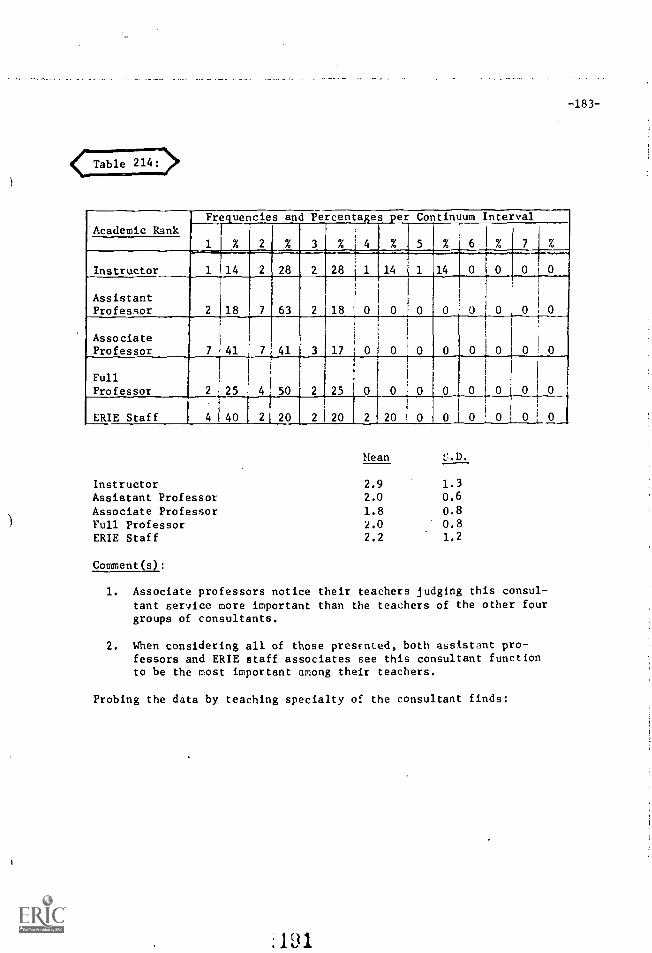
-183-
Table 2147>
Academic RankFrequencies and Percentages
3., ,
Continuum Interval
1% 2 % % 5 % 6 I % 7
%
Instructor 1 14 2 28 2 28 1 14 1 14 0 0
AssistantProfessor 2 18 7 63 2 18 'i 0 0 0 0 0 0 0 1 0
AssociateProfessor 71 41 7 41 3 17 ,
i I
, 0 0 0 0 F 0I
0
FullProfessor
f
2 i 25 50 2 25 0 0 0 0 0 0 0
ERIE Staff
. i
4 1 40 2 20 2 20 1 2 20 1 0 0 0 0 0 0
InstructorAssistant ProfessorAssociate ProfessorFull ProfessorERIE Staff
Mean D.
2.9
2.0
1.82.02.2
1.30.6
0.80.81.2
Comment(s):
1. Associate professors notice their teachers judging this consul-tant service more important than the teachers of the other fourgroups of consultants.
2. When considering all of those presented, both assistant pro-fessors and ERIE staff associates see this consultant functionto be the most important among their teachers.
Probing the data by teaching specialty of the consultant finds:
:191
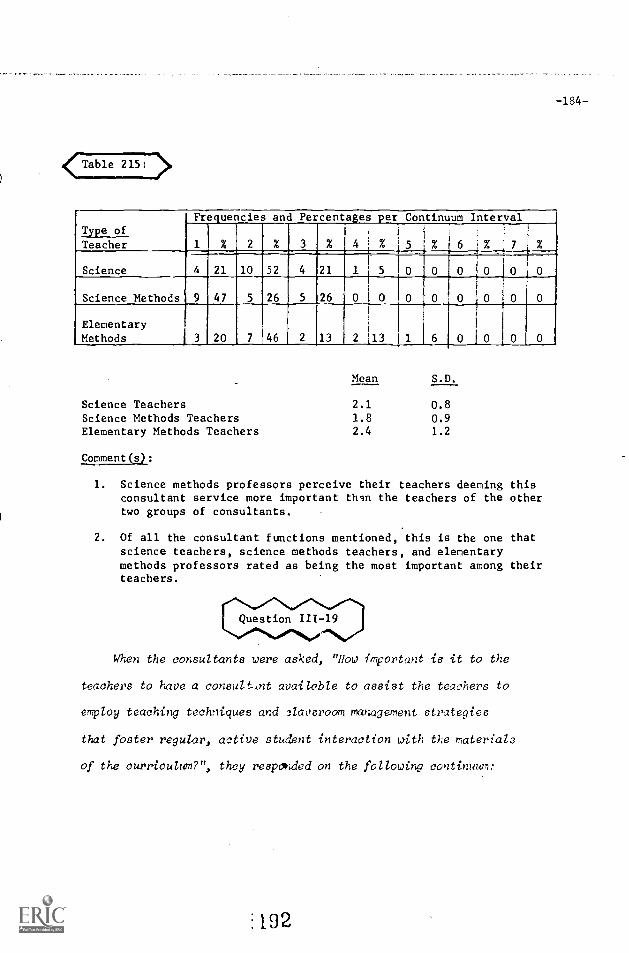
-184-
<Table 215:
Type ofFrequencies and Percentages per Continuum Interval
I %r
2 % 3 4 . %r5 % 6 .% ' 7 %Teacher
Science
t
4 21 10 52
26
4
5
21
26
11
0 1 0
0
0
1
0
0
6
_i _____
0 i0
0
i
0
+
1
0100
0
0
__
0
0Science Methods 9 47 5
ElementaryMethods 3 20 7 46 2 13
7.
2 113
Science TeachersScience Methods TeachersElementary Methods Teachers
Comment(s):
Mean S.D.
2.1
1.82.4
0.8
0.91.2
1. Science methods professors perceive their teachers deeming thisconsultant service more important than the teachers of the othertwo groups of consultants.
2. Of all the consultant functions mentioned, this is the one thatscience teachers, science methods teachers, and elementarymethods professors rated as being the most important among theirteachers.
When the consultants were asked, "How important is it to the
teachers to have a consultant availoble to assist the teachers to
employ teaching techniques and classroom management strategies
that foster regular, active student interaction with the materials
of the curriculum?", they responded on the following continuum:
192
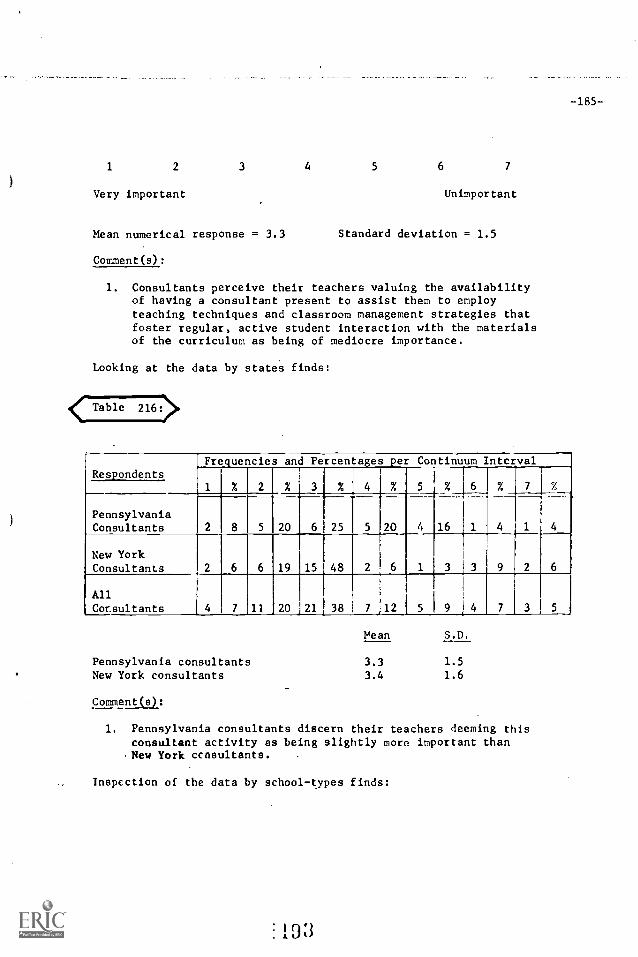
-185-
1 2 3 4 5 6 7
Very important Unimportant
Mean numerical response = 3.3 Standard deviation = 1.5
Comment(s):
1. Consultants perceive their teachers valuing the availabilityof having a consultant present to assist them to employteaching techniques and classroom management strategies thatfoster regular, active student interaction with the materialsof the curriculum as being of mediocre importance.
Looking at the data by states finds:
< Table 216>
RespondentsFrequencies and Percentages per Continuum Interval
1 % 2 % 3 % 4 % 5 % 6 % 7 %
PennsylvaniaConsultants 2 8 5 20 6 25 5 20 4 16 1
New YorkConsultants 2 6 6 19 15 48 2 6 1 3 3
All
Consultants 7 11 20 21 38 7 12 5 9
Pennsylvania consultantsNew York consultants
Comment(s):
Mean
3.3
S.D.
1.5
3.4 1.6
1. Pennsylvania consultants discern their teachers deeming thisconsultant activity as being slightly more important thanNew York consultants.
Inspection of the data by school-types finds:
19:3
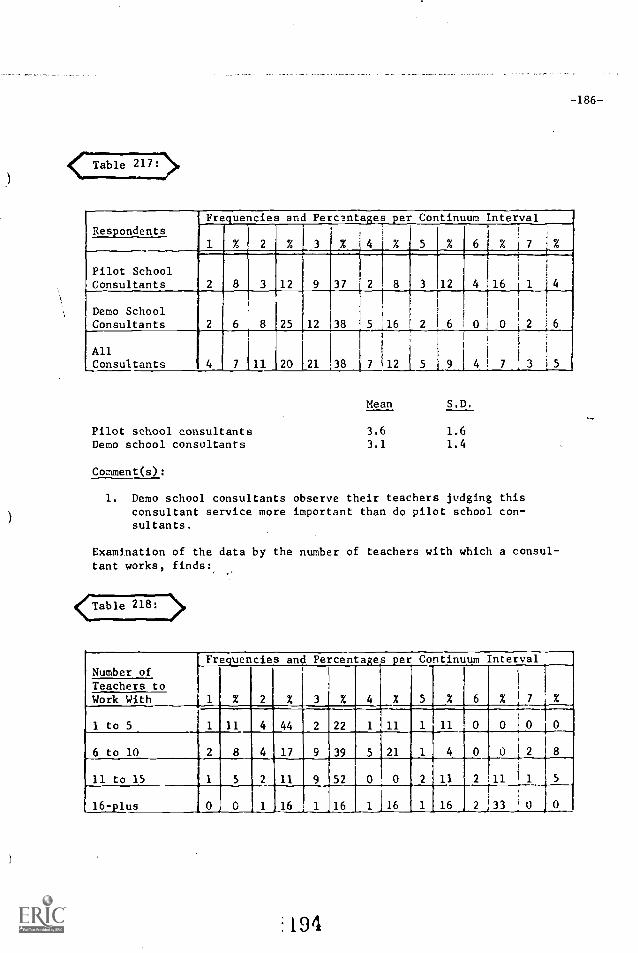
-186-
Table 217:>,
Respondents1 Frequencies and Percentages per Continuum Interval
1 % 2 % 3 % 4!% 5 % 6 % i 7 :,..
Pilot SchoolConsultants 3 12 9 37 2I 8
1
5 A.6
3
, 2
12
6
4
0
16
0
r-
4 1
2
T-
4
6
Demo SchoolConsultants 2 6 8 25 12 38
AllConsultants
+
4 7 11 20 21 381
I 7 112 5 9 4 7 f 3 5
Pilot school consultantsDemo school consultants
Comment(s):
Mean S.D.
3.6 1.6
3.1 1.4
1. Demo school consultants observe their teachers judging thisconsultant service more important than do pilot school con-sultants.
Examination of the data by the number of teachers with which a consul-tant works, finds:
<' Table 218:
Number ofFrequencies and Percentages per Continuum Interval
Teachers toWork With 1 % 2 % 3 % 4 X 5 X 6 %
1
7
1 to 5 1 11 4 44 2 22 1 11 1 11
6 to 10 2 8 4 17 9 39 5 21 1 4 0
11 to 15 1 5 2 11 9 52 0 0 2 11 2 11 1
16-plus 0 0 1 16 1 16 1 16 1 16 2 33 U 0
'194
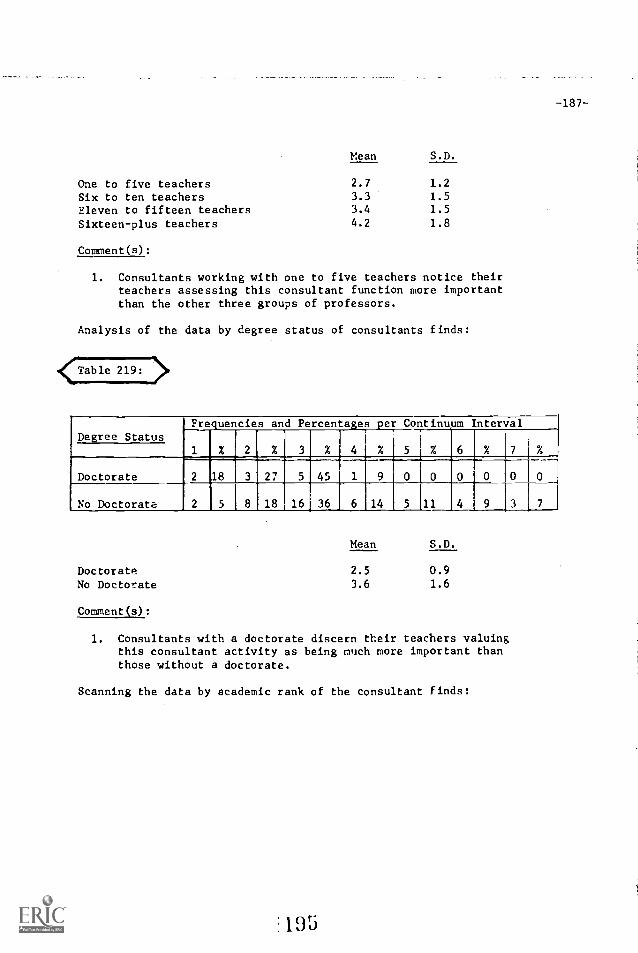
-187-
Mean S.D.
One to five teachers 2.7 1.2
Six to ten teachers 3.3 1.5Eleven to fifteen teachers 3.4 1.5
Sixteen-plus teachers 4.2 1.8
Comment(s):
1. Consultants working with one to five teachers notice theirteachers assessing this consultant function more importantthan the other three groups of professors.
Analysis of the data by degree status of consultants finds:
<Table 219:
Degree StatusFreuencies and Percenta:es er Continuum Interval
1 1E1111 3 % 4 %% 6 %
Doctorate 2 8 3 27 5 45
No Doctorate 2 5 8 18 16 36 6 14 5 11 4 9 3 7
DoctorateNo Doctorate
Comment(s):
Mean S.D.
2.5 0.93.6 1.6
1. Consultants with a doctorate discern their teachers valuingthis consultant activity as being much more important thanthose without a doctorate.
Scanning the data by academic rank of the consultant finds:
195
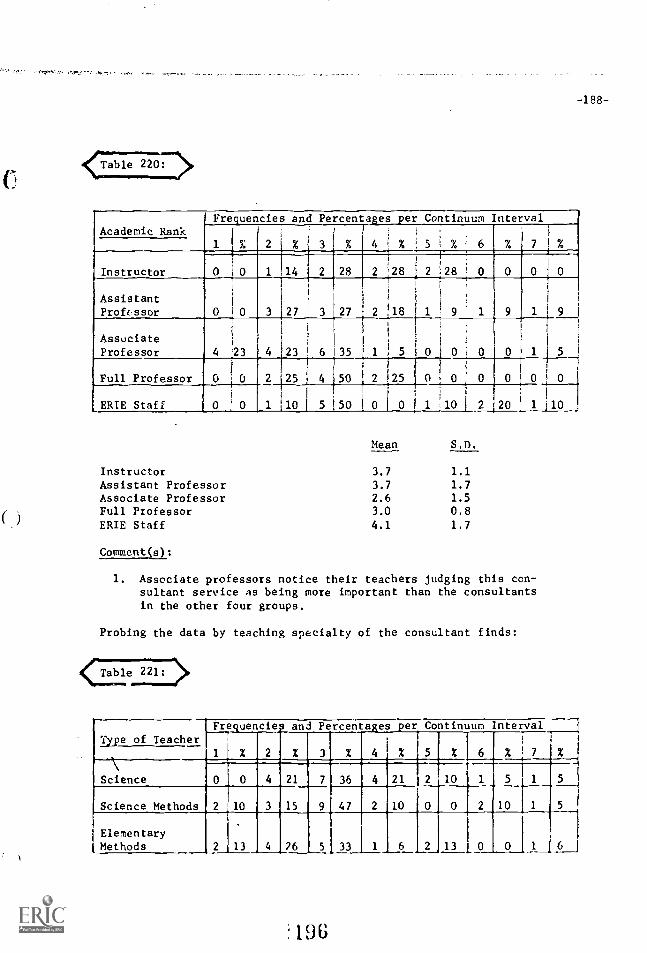
-188-
Table 2207>
Frequencies and Percentages per Continuum IntervalAcademic Rank
% 3 % i % 5 i % 6 % 7 1 %
0
0
Instructor 0 0 1 14 2 28 2 ,2828 2 128 ' 0 0 0 0
AssistantProfessor 0 0 3 27 3 27 2 !18 1 9 : 1 9 1 9
AssociateProfessor 4 23 4 23 6 35 ' 1 0
i
5 0 0 i 0 0 1 5
fi
Full Professor 0 ' 0 2 25 4 50 2 125 0 0 0 0 0 0
ir i
ERIE Staff 0 j 0 1 10 5 50 0 i 0 1 1(:) I 2 20 1 10
-I-
InstructorAssistant ProfessorAssociate ProfessorFull ProfessorERIE Staff
Comment(s):
Mean S.D.
3.7
3.7
2.63.0
4.1
1.1
1.7
1.5
0.8
1.7
1. Associate professors notice their teachers judging this con-sultant service as being more important than the consultantsin the other four groups.
Probing the data by teaching specialty of the consultant finds:
4(Table 221:
Frequencies and Percentages per Continuum IntervalType of Teacher
1 % 2 % 3 % 4 % 5 % 6 % 7 %
Science 0 0 4 21 7 36 4 21 2 10 1 5 1 5
Science Methods 2 10 3 15 9 47 2 10 0 0 2 10 1 5
Elementary[Methods 2 13 4 26 5 33 1 6 2 13 i o 0 1 6 1
196
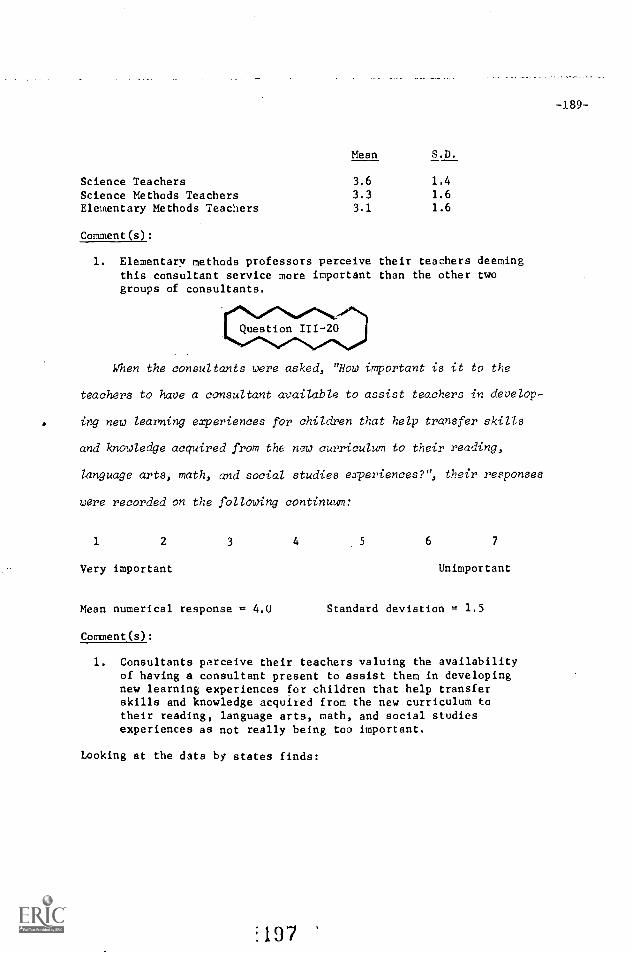
-189-
Mean S.D.
Science Teachers 3.6 1.4
Science Methods Teachers 3.3 1.6
Elementary Methods Teachers 3.1 1.6
Comment(s):
1. Elementary methods professors perceive their teachers deemingthis consultant service more important than the other twogroups of consultants.
When the consultants were asked, "How important is it to the
teachers to have a consultant available to assist teachers in develop-
ing new learning experiences for children that help transfer skills
and knowledge acquired from the new curriculum to their reading,
Language arts, math, and social studies experiences?", their reeponses
were recorded on the following continuum:
1 2 3 4 5 6 7
Very important Unimportant
Mean numerical response = 4.0 Standard deviation = 1.5
Comment(s):
1. Consultants perceive their teachers valuing the availabilityof having a consultant present to assist them in developingnew learning experiences for children that help transferskills and knowledge acquired from the new curriculum totheir reading, language arts, math, and social studiesexperiences as not really being too important.
Looking at the data by states finds:
:197
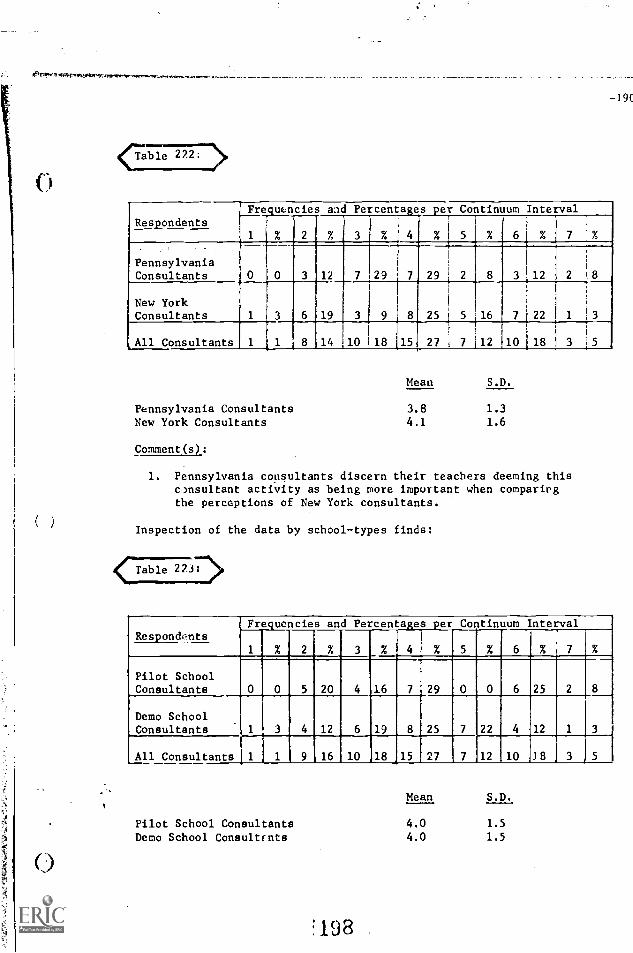
0
-19C
7,7177e 222:
RespondentsFrequencies and Percentages per Continuum Interval
1 % % 3 % 4
i
% 1 % 6' % 7 %
PennsylvaniaConsultants 0 0 3 12 7 29 7
I
1
29 1 2 8 3 12 2 8
New YorkConsultants 1 3 6 19 3
10
9
18
8
15
1
25
27 i
5
7
16
12
7
10
122
118
1
3
3
i5All Consultants 1 1 8 14
Pennsylvania ConsultantsNew York Consultants
Comment(s):
Mean S.D.
3.8 1.3
4.1 1.6
1. Pennsylvania consultants discern their teachers deeming thiscrnsultant activity as being more important when comparingthe perceptions of New York consultants.
Inspection of the data by school-types finds:
Table 221>
RespondentsFrequencies and Percentages per Continuum Interval
1 % 2 % 3 % 4 % 5 % 6 % 7
Pilot SchoolConsultants 0 0 5 20 4 16 7 29 0 0 6 25
Demo SchoolConsultants 1 3 4 12 6 19 8 25 7 22 4 12 1 3
All Consultants 1 1 9 16 10 18 15 27 7 12 10 38
Pilot School ConsultantsDemo School Consultants
198
Mean S.D.
4.0 1.5
4.0 1.5
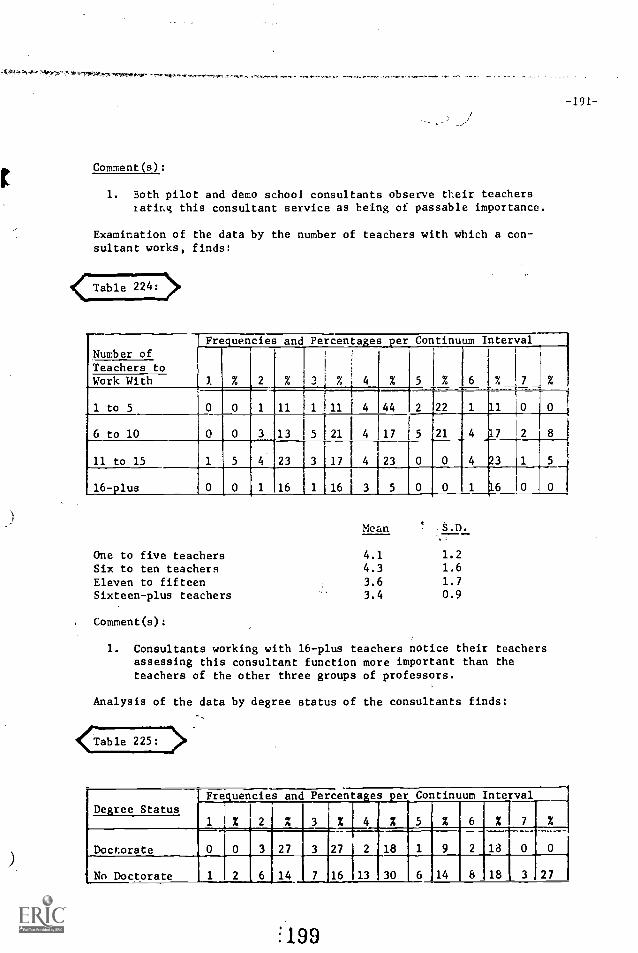
r
-191-
Comment(s):
1. Both pilot and demo school consultants observe their teachersratirog this consultant service as being of passable importance.
Examination of the data by the number of teachers with which a con-sultant works, finds:
< Table 224: >
Number ofto
Frequencies and Percentagesper Continuum Interval
1. % 2 % 3 % : 4 5 7 %
TeachersWork With
1 to 5 1 11 1 11 i 4 144
.---------------
22 1 11 0 0
6 to 10 0 0 3 13 5 21 4 17 5 21 4 17 2 8
11 to 15 1 5 4
_
23 3 17 4 23 0 0 4 3 1 5
16 plus 0 0 1 16 1
1
16 5 0 0 1 16 10 0
Mean S.D.
One to five teachers 4.1 1.2
Six to ten teachers 4.3 1.6
Eleven to fifteen 3.6 1.7
Sixteen-plus teachers 3.4 0.9
Comment(s):
1. Consultants working with 16-plus teachers notice their teachersassessing this consultant function more important than theteachers of the other three groups of professors.
Analysis of the data by degree status of the consultants finds:
1/:Table 225: >
Degree StatusFrequencies and Percentages per Continuum Interval
1 % 2 'A 3
i
% 4 % 5 X 6 % 7 %
Doctorate 0 0 3 27 3 27 2 18 1 9 2 18 0 0
No Doctorate 1 2 6 14 7 16 13 30 6 14 8 18 I 3 27
199
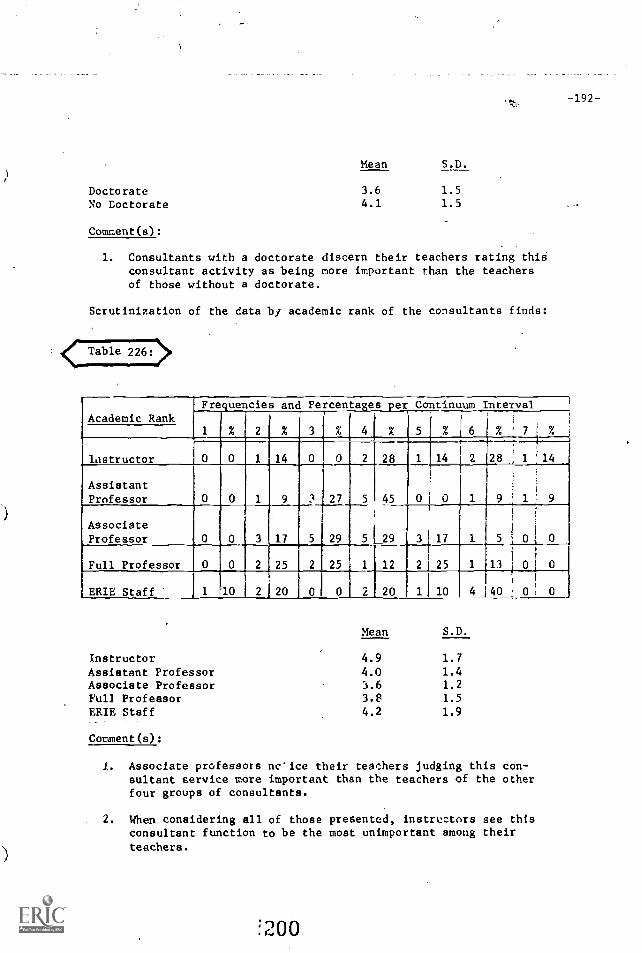
-192--
DoctorateNo Doctorate
Comment(s):
Mean S.D.
3.6 1.54.1 1.5
1. Consultants with a doctorate discern their teachers rating thisconsultant activity as being more important than the teachersof those without a doctorate.
Scrutinization of the data by academic rank of the consultants finds:
Table 226:
Academic RankFrequencies and Percentages per Continuum Interval
1 % % 3 ' 4 % 5 % 6 % ' 7 %
lastructor 0 0 1 14 0 0 2 28 1 14 2
--J,.4.--
28 1; 14
AssistantProfessor 27 5 45 0 0 1 9 s 1 !
AssociateProfessor 0 0 3 17 5 29 5 29 3 17
s
5 I 0 i 0
Full Professor 2 25 2 25 1 12 2 25 1 I13;
0 1 0
ERIE Staff 1 10 2120 0 0 2 20 1 10 4!
40 j 0: 0
InstructorAssistant ProfessorAssociate ProfessorFull ProfessorERIE Staff
Comment(s):
Mean S.D.
4.9
4.03.6
3.84.2
1.7
1.41.21.5
1.9
I. Associate professors nc'ice their teachers judging this con-sultant service more important than the teachers of the otherfour groups of consultants.
2. When considering all of those presented, instru: tors see thisconsultant function to be the most unimportant among theirteachers.
`) 00r..
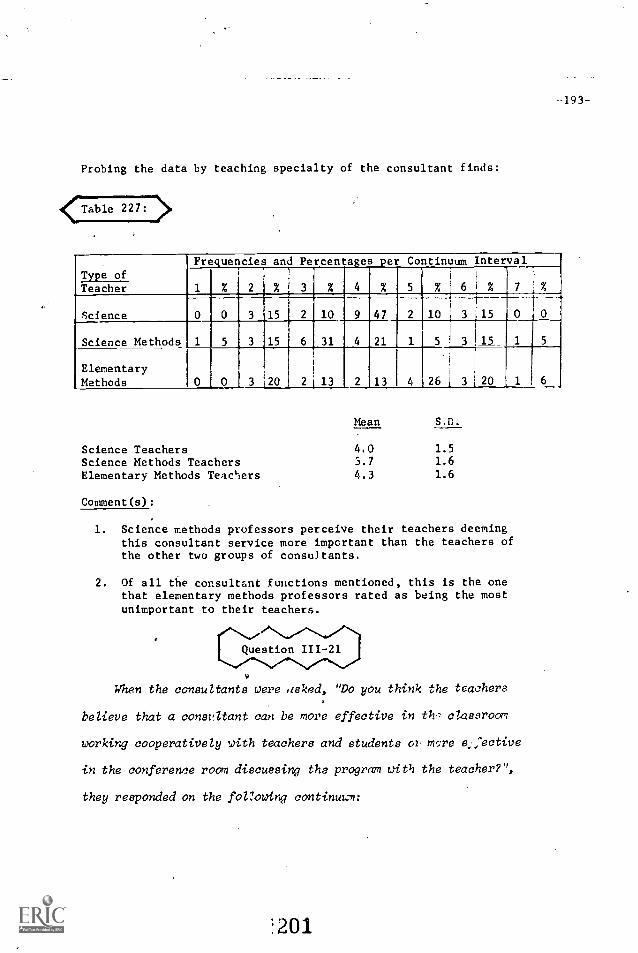
-193-
Probing the data by teaching specialty of the consultant finds:
(Table 227: >
Type ofFrequencies and Percentages per Continuum Interval
1 % 2 % 3 % 4 % 5 %
1
6 I %
1
7Teacher
Science 0 0 3 15 2 10 9 47 2 10 3 115 0 1 0
Science Methods 1 5 3 15 6 31 4 21 1 5 3 15 1 5
ElementaryMethods 0 0 3 20 2 13 2 13 4
i
26 1 3 20 1 6
Mean S.D.
Science Teachers 4.0 1.5
Science Methods Teachers 3.7 1.6
Elementary Methods Teachers 4.3 1.6
Comment(s):
1. Science methods professors perceive their teachers deemingthis consultant service more important than the teachers ofthe other two groups of consultants.
2. Of all the consultant functions mentioned, this is the onethat elementary methods professors rated as being the mostunimportant to their teachers.
When the consultants were asked, "Do you think the teachers
believe that a consvltant can be more effective in th, classroom
working cooperatively with teachers and students Or mcre e.:ective
in the conference room discussing the program with the teacher?",
they responded on the fol7owing continuul:
2O1
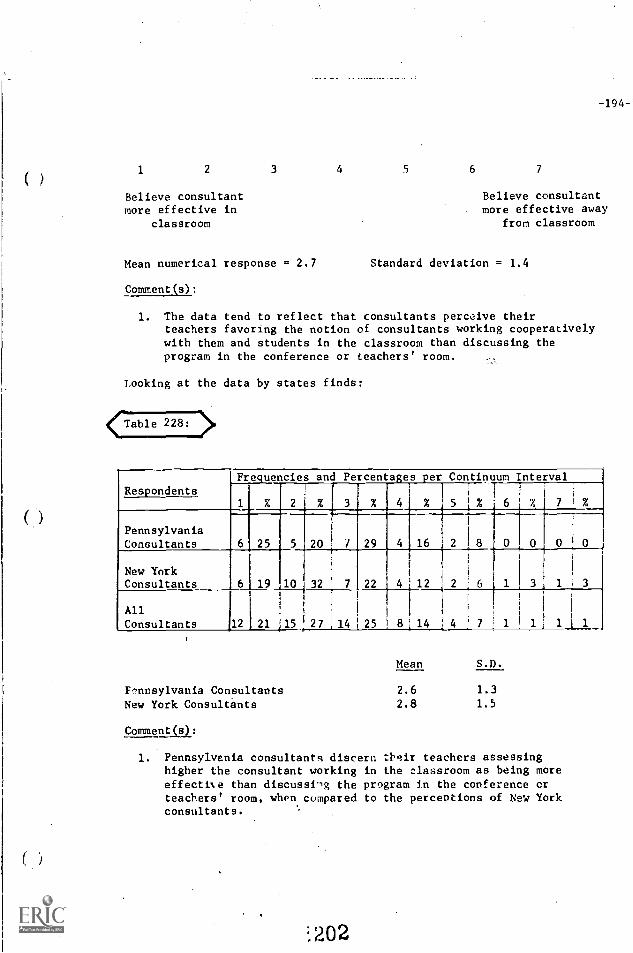
-194-
1 2 3 4 5 6 7
Believe consultant Believe consultantmore effective in more effective away
classroom from classroom
Mean numerical response = 2.7 Standard deviation = 1.4
Comment(s):
1. The data tend to reflect that consultants perceive theirteachers favoring the notion of consultants working cooperativelywith them and students in the classroom than discussing theprogram in the conference or teachers' room.
Looking at the data by states finds:
<Table 228: 0)0
RespondentsFrequencies and Percentages per Continuum Interval
1 % 2 % 3 % 4 % 5 I%
i
2 18
6
0
i %
0
7
0±
%
0
PennsylvaniaConsultants 6 25 5 20 7 29 4 16
New YnrkConsultants 6 19 10 32 7 22 4 12
I
1 6 1 3 1 3
AllConsultants 12 21 15 27 14 25 81 14 1
I
1
Frinsylvania ConsultantsNew York Consultants
Comment(s):
Mean S.D.
2.6 1.3
2.8 1.5
1. Pennsylvania consultants discern :hair teachers assessinghigher the consultant working in the classroom as being moreeffective than discussiig the program in the conference crteachers' room, when compared to the perceptions of New Yorkconsultants.
202
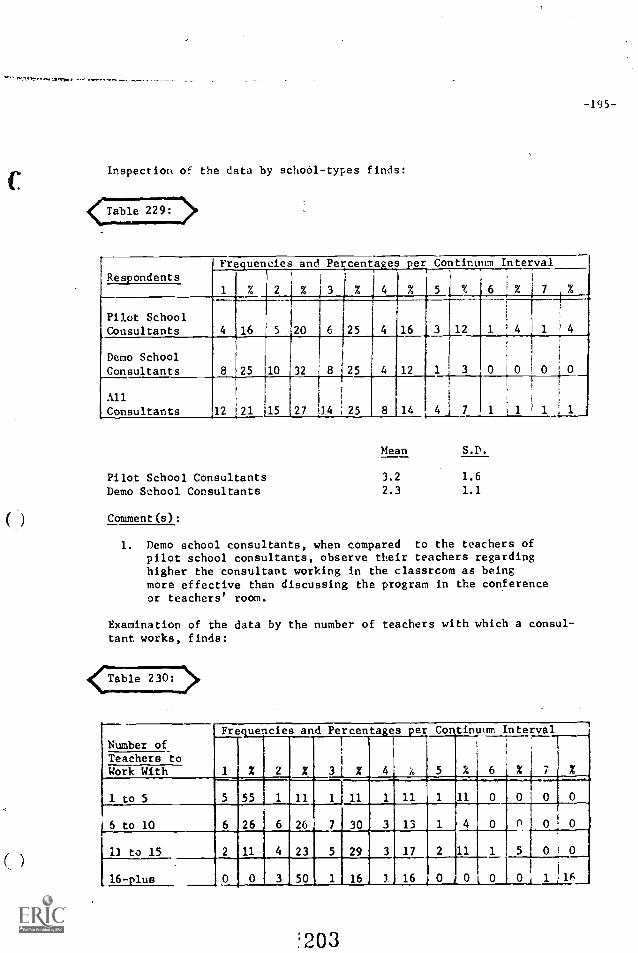
C
-195-
Inspection of the data by school-types finds:
Table 229:
Respondents
Frequencies and Percentages per Continuum Interval
% 2 % 3 % 4 % 5 % 6 % 7 , %
Pilot School,Consultants
Demo School
Consultants
4 16 5 20 6 25 4 16 3 12
8 25 10 32 8 25 4 12 1 3 0 0 1 0 ;
All
Consultants 12 21 15 27 14 ; 25 8 14 4 t 7 1 1 1 1
Pilot School ConsultantsDemo School Consultants
Mean S.D.
3.2 1.6
2.3 1.1
Comment(s):
1. Demo school consultants, when compared to the teachers ofpilot school consultants, observe their teachers regardinghigher the consultant working in the classrcom as beingmore effective than discussing the program in the conferenceor teachers' room.
Examination of the data by the number of teachers with which a consul-tant works, finds:
`.Table 230:
Frequencies and Percentages per Continuum Interval
Number of 1
Teachers toWork With 1 X 2 X 3 % 4 i. 5 * 6 % 7 .
1 to 5 5 55 1 11 1 11 1 11 1 11 0 0 0 0
6 to 10 6 26 6 26 7 30 3 13 4 0 P 0 0
11 to 15 2 11 4 23 5 29
f
3 17 2 11 1 5 0 0
16-plus 0 0 3 50 1 16 ) 16 0 t 0 L 0 Oj 1 16
203

-196-
Mean S.D.
One to five teachers 2.2 1.5
Six to ten teachers 2.4 1.2
Eleven to fifteen teachers 3.1 1.4
Sixteen-plus teachers 3.6 2.1
Comment(s):
1. When compared to the teachers of the other three groups ofprofessors, consultants working with one to five teachersnotice their teachers emphasizing more the greater effective-ness of a consultant working in the classroom in contrastto discussing the program in the conference or teachers' room.
Analysis of the data by degree status of consultants finds:
<Table 231: >
Degree StatusFrequencies and Percentages per Continuum Interval
% 2 % 3 % 4 i % 5 % 6 % 7 .
Doctorate 5 45 111127 III27000000No Doctorate 7 16 ,12 27 11 25 8 18
DoctorateNo Doctorate
Comment(s):
Mean S.D.
1.8 0.92.9 1.5
1. Consultants with a doctorate discern their teachers assessinghigher the consultant working in the classroom as being moreeffective than discussing the program in the conference orteachers' room, when compared to the perceptions of thosewithout a doctorate.
2. When considering all of the consultant behaviors presented,professors with a doctorate see a consultant working coopera-tively with teachers and students in classro'ms as being themost important among teachers.
Scanning the data by academic rank of the consultant finds:
:204
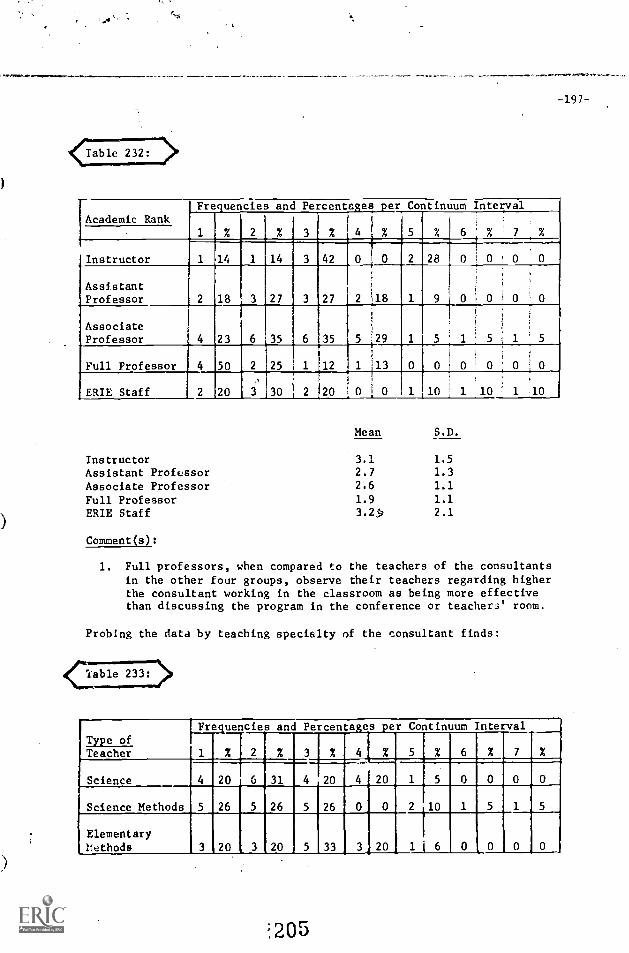
-197-
<Table 232: >
Academic RankFrequencies and Percentages per Continuum Interval
1 % 2 % 3 % 4 1 % 5 % 6 %
Instructor 1 14 1 14 3 42i
2 28 t I
AssistantProfessor 2 18 3 27 3 27 2 i18 1 9 0
1
1 ,
,
Associate4 23 6 35 6 35
i
1
5 :29 1 5,Professor
Full Professor 4
2
50
20
2
3
25
30
1 1
2
12
20
t
1 113
, 0 I 0
0
1
0 f 0
10 1 1
0
:10 '
0
1
0
10ERIE Staff
Mean S.D.
Instructor 3.1 1.5
Assistant Professor 2.7 1.3
Associate Professor 2.6 1.1
Full Professor 1.9 1.1
ERIE Staff 3.29 2.1
Comment(s):
1. Full professors, when compared to the teachers of the consultantsin the other four groups, observe their teachers regarding higherthe consultant working in the classroom as being more effectivethan discussing the program in the conference or teachers' room.
Probing the data by teaching specialty of the consultant finds:
Type ofFrequencies and Percentages per Continuum Interval
1 % 2 % 3 % 4 % 5 % 6 % 7Teacher
Science 4 20 G 31 4 20 4 20
Science Methods 5 26 5 26 5 26 0 0 2 10
ElementaryMethods 3 20 3 20 33 3, 20 1 j 6
205
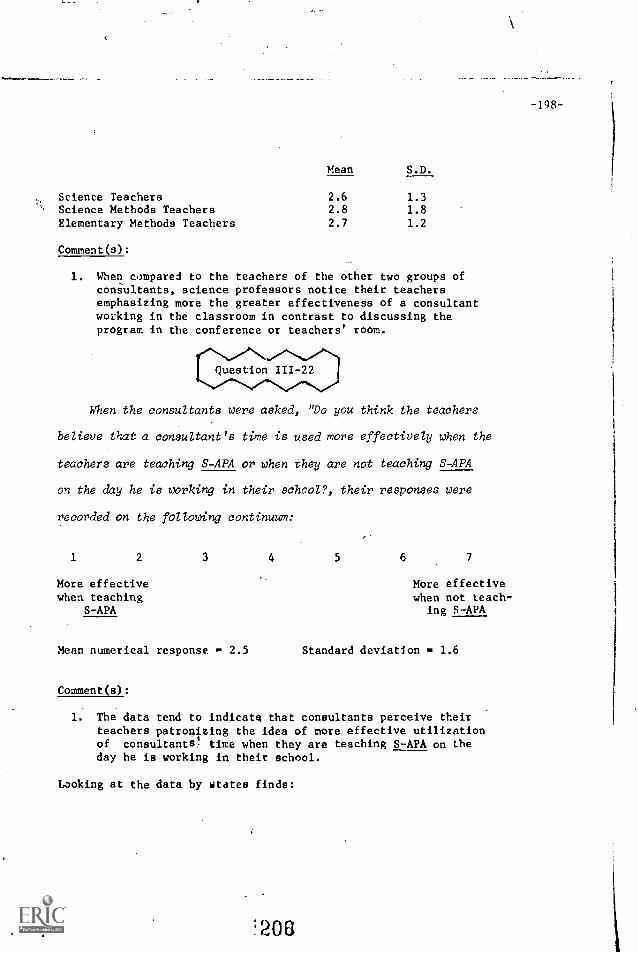
Mean S.D.
Science Teachers 2.6 1.3Science Methods Teachers 2.8 1.8Elementary Methods Teachers 2.7 1.2
Comment(s):
1. When compared to the teachers of the other two groups ofconsultants, science professors notice their teachersemphasizing more the greater effectiveness of a consultantworking in the classroom in contrast to discussing theprogram in the conference or teachers' room.
Question 111-22
When the consultants were asked, "Do you think the teachers
believe that a consultant's time is used more effectively when the
teachers are teaching S -APA or when they are not teaching S-AFA
on the day he is working in their schcol?, their responses were
recorded on the following continuum:
1 2 3 4 5 6 7
More effective More effectivewhen teaching when not teach-
S-APA ing S-APA
Mean numerical response = 2.5 Standard deviation = 1.6
Comment(s):
1. The data tend to indicate that consultants perceive theirteachers patronizing the idea of more effective utilizationof consultants.' time when they are teaching S-APA on theday he is working in their school.
Looking at the data by titates finds:
206
-198-
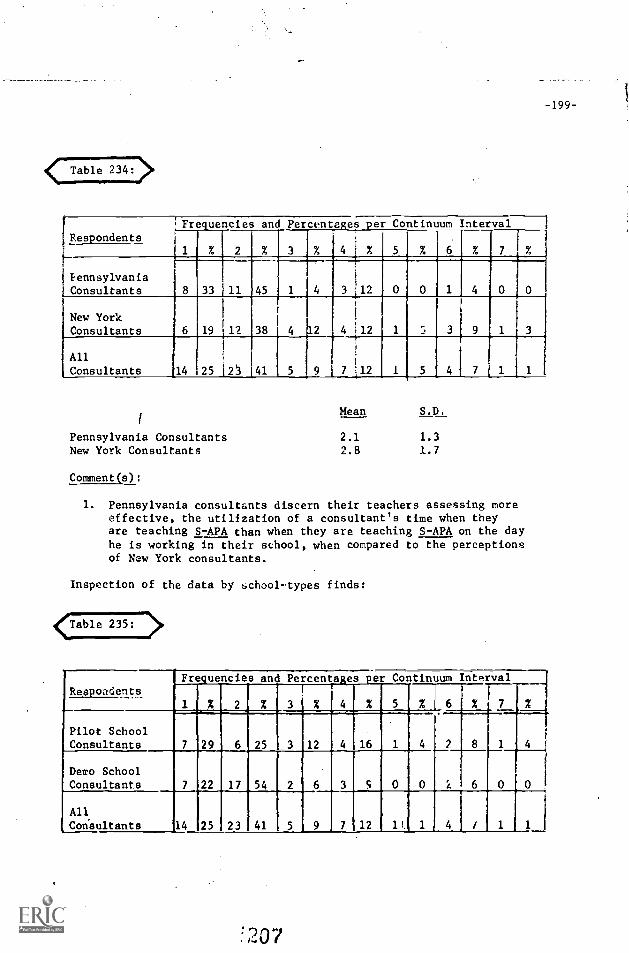
-199-
< Table 234: >
rRespondentsFrequencies and Percentages per Continuum Interval
1 % 2 % 3 % 41% % 5 % 6 % 7 i %
PennsylvaniaConsultants 8 33 11 45 1 4
1
3 I1.2 0 0 1 4 0 i 0
New YorkConsultants 6 19 12 38 4 2
1
4 1.2 1 3 3 9 1 3
All
Consultants 14 25 23 41 5 9 7 l2 1 5 4 7 1 1
Pennsylvania ConsultantsNew York Consultants
Comment(s):
Mean S.D.
2.1 1.3
2.8 1.7
1. Pennsylvania consultants discern their teachers assessing moreeffective, the utilization of a consultant's time when theyare teaching S-APA than when they are teaching S-APA on the dayhe is working in their school, when compared to the perceptionsof New York consultants.
Inspection of the data by school -types finds:
able 235:
RespondentsFrequencies and Percentages
3 % 4
per
%
Continuum
5 % 6
Interval
% 7 %% 2 %
Pilot SchoolConsultants 7 29 6 25 3 12 4 16 1 4 2 8 1
1
4 '
Demo SchoolConsultants 7 22 17 54 2 6 3 ; 0 0 1 6 0 0
All
Con'aultants 14 25 23 41 5 9 7 _12 1!. 1 i 4 / 1
.207
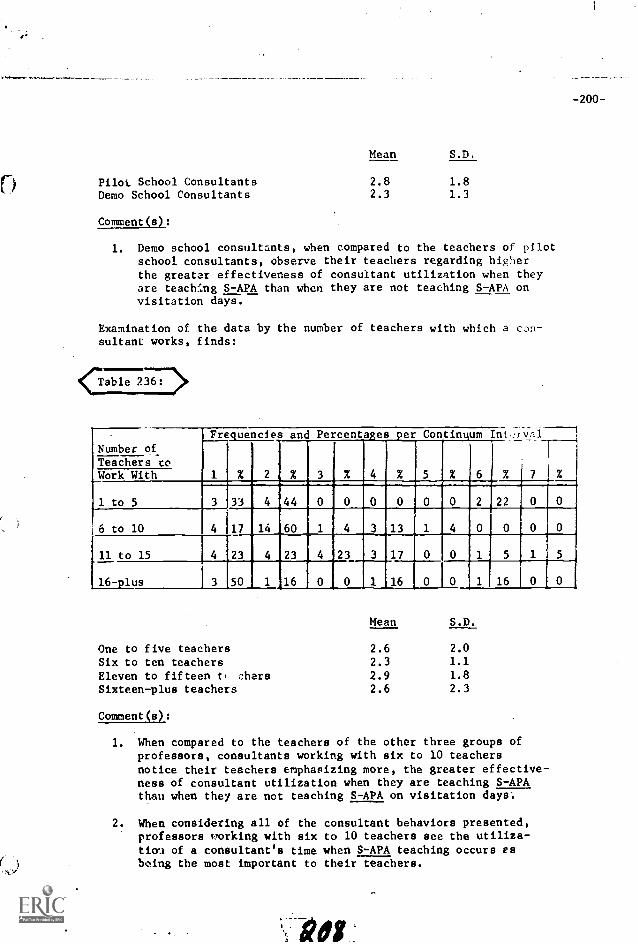
-200-
Pilot School ConsultantsDemo School Consultants
Comment(s):
Mean S.D.
2.8 1.82.3 1.3
1. Demo school consultants, when compared to the teachers of pilotschool consultants, observe their teachers regarding higherthe greater effectiveness of consultant utilization when theyare teaching S-APA than when they are not teaching S-APA onvisitation days.
Examination of the data by the number of teachers with which a con-sultant works, finds:
Number of
Frequencies and Percentages per Continuum Int,_!lval
1 X 2 3 % 4 % 5 % 7
1
%
Teachers toWork With
1 to 5 3 33
/
44 0 0
4
0 0 0 0 2 22 0 0
6 to 10 4 17 14_60 1 4 3 13 1 4 0 0 0 0
11 to 15 4 23 4 23 4 23 3 17
16-plus 3 50 1 _16 0 i 0 1 16 0 0 1 16
Mean S.D.
One to five teachers 2.6 2.0
Six to ten teachers 2.3 1.1
Eleven to fifteen t, chars 2.9 1.8
Sixteen-plus teachers 2.6 2.3
Comment(s):
1. When compared to the teachers of the other three groups ofprofessors, consultants working with six to 10 teachersnotice their teachers emphasizing more, the greater effective-ness of consultant utilization when they are teaching S-APAthan when they are not teaching S-APA on visitation days:
2. When considering all of theprofessors working with sixtio of a consultant's timebeing the most important to
consultant behaviors presented,to 10 teachers see the utilize-when S-APA teaching occurs estheir teachers.
POI
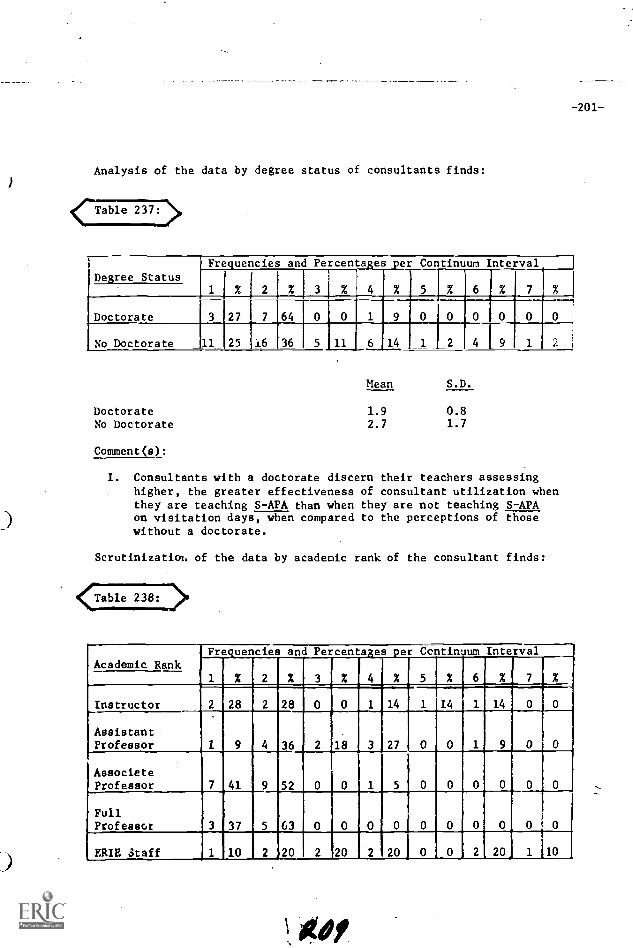
-201-
Analysis of the data by degree status of consultants finds:
Table 237: >
Degree StatusFrequencies and Percentages per Continuum Interval
I% 2 % 3 % 4 X 5 % 6 X 7
Doctorate 3 27 7 64 0 0 1 9 0 0 0 0 0 0
No Doctorate __11 25 16 36 5 11 6 14 1 1 2
DoctorateNo Doctorate
Comment(s):
Mean S.D.
1.9 0.82.7 1.7
1. Consultants with a doctorate discern their teachers assessinghigher, the greater effectiveness of consultant utilization whenthey are teaching S-APA than when they are not teaching S-APAon visitation days, when compared to the perceptions of thosewithout a doctorate.
Scrutinizatiol. of the data by academic rank of the consultant finds:
Table 238: >
Academic Rank2
and
X
Percentages
3 % 4
per
X
Centinlum
5 % 6
Interval
% 7 X
_Frequencies
1 X
Instructor 2 28 2 28 0 0 1 14 1 14 1 14
AssistantProfessor 1 9 4 36 2 18 3 27 0 0 1 9 0 0
AssocieteProfessor 7 41 9 52 0 0 1 5 0 0 0 0 0 0
FullProfessor 3 37 5 63 0 0 0 0 0 0 0 0 0 0
ERIE Staff 1 10 2 _20 2 _20 2 20 0 0 2 20.
1 10
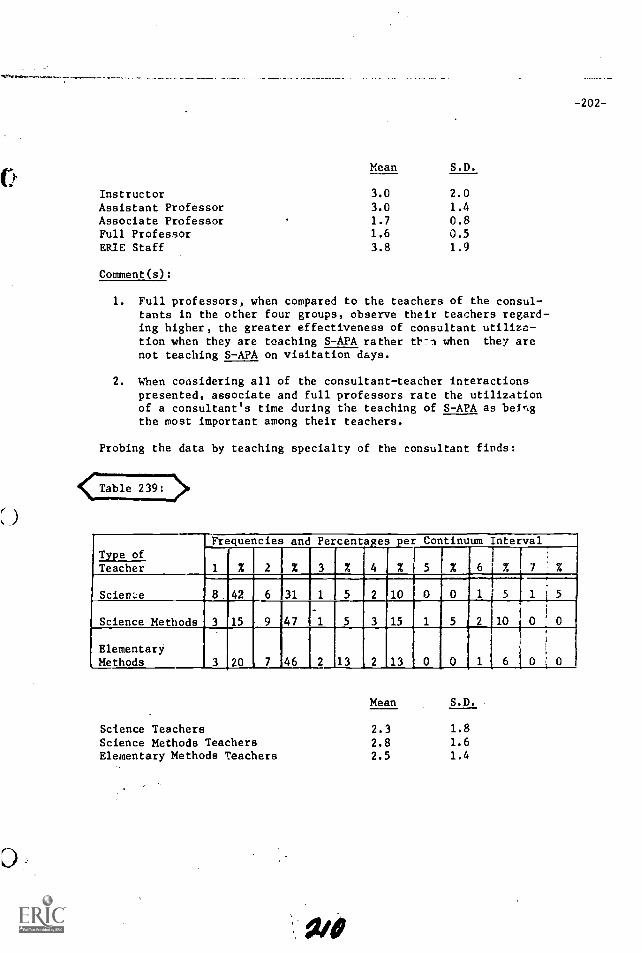
.1,t4
().
-202-
Mean S.D.
Instructor 3.0 2.0
Assistant Professor 3.0 1.4
Associate Professor 1.7 0.8Full Professor 1.6 0.5
ERIE Staff 3.8 1.9
Comment(s):
1. Full professors, when compared to the teachers of the consul-tants in the other four groups, observe their teachers regard-ing higher, the greater effectiveness of consultant utiliza-tion when they are teaching S-APA rather th-n when they arenot teaching S-APA on visitation days.
2. When considering all of the consultant-teacher interactionspresented, associate and full professors rate the utilizationof a consultant's time during the teaching of S-APA as beingthe most important among their teachers.
Probing the data by teaching specialty of the consultant finds:
<Table 239:
Type ofFrequencies and Percentages per Continuum Interval,
6 % 7 ' %1 % 2 % 3 % 4 2 5 %Teacher
Sciem:e 8 42 6 31 1 5 2 10 0 0 1 5 1 '
Science Methods 3 15 9 47 3 15 1 5 L2 101
0 ' 0
Elementary, Methods 3 20 7 46 2 13 2 13 0 0 1 6
i
0 I 0
Mean S.D.
Science Teachers 2.3 1.8
Science Methods Teachers 2.8 1.6Elementary Methods Teachers 2.5 1.4
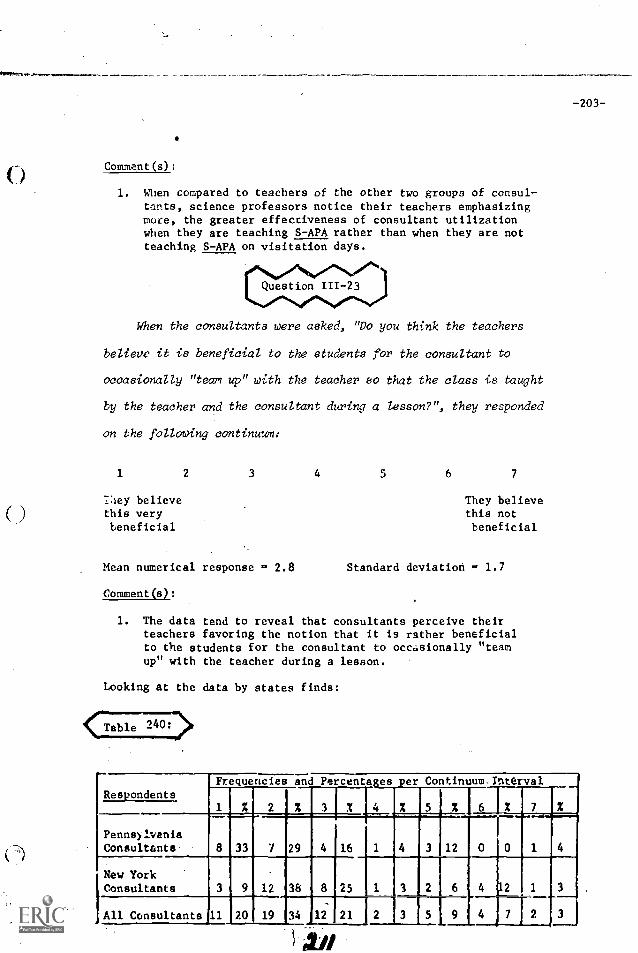
Cs)
-203-
Comment(s):
1. When compared to teachers of the other two groups of consul-t-ints, science professors notice their teachers emphasizingmore, the greater effectiveness of consultant utilizationwhen they are teaching S-APA rather than when they are notteaching S-APA on visitation days.
When the consultants were asked, "Do you think the teachers
believe it is beneficial to the students for the consultant to
occasionally "team up" with the teacher so that the class is taught
by the teacher and the consultant during a lesson?", they responded
on the following continuum:
1
24ey believethis verybeneficial
2 3 4 5 6 7
They believethis notbeneficial
Mean numerical response = 2.8 Standard deviation = 1.7
Comment(s):
1. The data tend to reveal that consultants perceive theirteachers favoring the notion that it is rather beneficialto the students for the consultant to occasionally "teamup" with the teacher during a lesson.
Looking at the data by states finds:
RespondentsFree uencias and Percentages per Continuum.Tnterval
1 % 2 2 3 1 4 2 5 2 6 2 7 2
PennsylvaniaConsultants 8 33 7 29 4 16 1 4 3 12
New YorkConsultants 3 9 12 38 8 25 1 3 2 6 4 12 1
All Consultants 11 20 19 34 12 21 2 3 5 9 4 7 2
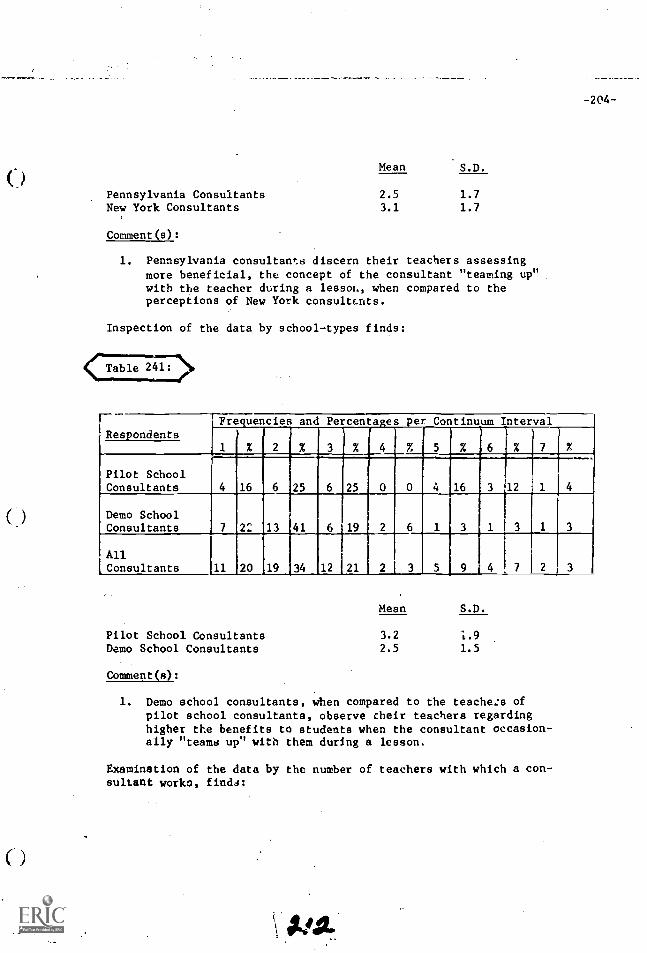
-204-
Pennsylvania ConsultantsNew York Consultants
Comment(s):
Mean S.D.
2.5 1.73.1 1.7
1. Pennsylvania consultants discern their teachers assessingmore beneficial, the concept of the consultant "teaming up" .
with the teacher during a lessor., when compared to theperceptions of New York consultents.
Inspection of the data by school-types finds:
< Table 241: >
RespondentsFrequencies and Percentages per. Continuum Interval
1 % 2 % 3 %
1
4 % 5 %
i
6 % 7 %
Pilot SchoolConsultants 4 16 6 25 6 25 0 0 4 16 3 12
Demo SchoolConsultants 7 22 13 41 6 19 2 6 1 3 1 3 1 3
[ConsultantsLConsultants 11 20 19 34 12 21 2 3 5 9 4
Pilot School ConsultantsDemo School Consultants
Comment(n):
Mean S.D.
3.2 1.92.5 1.5
1. Demo school consultants, when compared to the teache:s ofpilot school consultants, observe their teachers regardinghigher the benefits to students when the consultant occasion-ally "teams up" with them during a lesson.
Examination of the data by the number of teachers with which a con-sultant worko, findd:
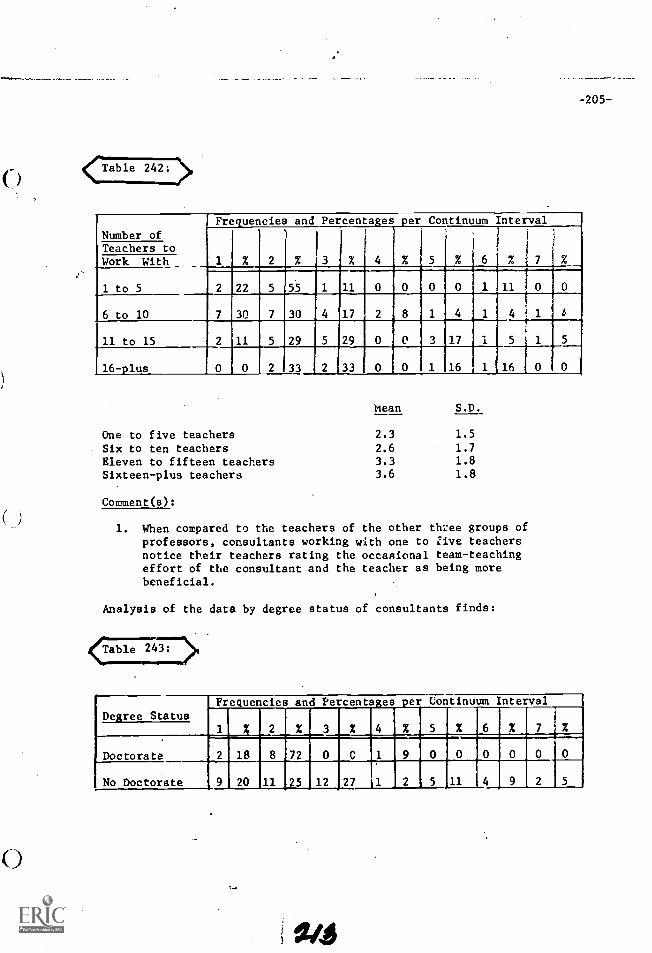
-205-
<Table 242:
Number ofFrequencies and Percentages per Continuum Interval
1
1
Teachers toWork With % 5 . 6 % 1 7 %
1 to 5 2 22 5 55 1 11 0 0 0 0 1 11 10 0
6 to 10 7 30 7 30 4 17 2 8 1 4p
1 4 ! 1 l
11 to 15 2 11 5 29 5 29 0 0 3 17 1
16-plus 0 0 2 33 2 33 0 0 1 16 1 16 0 0
Mean S.D.
One to five teachers 2.3 1.5
Six to ten teachers 2.6 1.7
Eleven to fifteen teachers 3.3 1.8
Sixteen-plus teachers 3.6 1.8
Comment(s):
1. When compared to the teachers of the other three groups ofprofessors, consultants working with one to ;Ave teachersnotice their teachers rating the occasional team-teachingeffort of the consultant and the teacher as being morebeneficial.
Analysis of the data by degree status of consultants finds:
'=21477),
Degree StatusFre.uencies
1
and Percenta:es
% 11111111111 %
er
Ill,
Continuum
5X
Interval
6 11111111111
Doctorate 2
9
18
20
8
11
I/I
25
0
12
C
27
1
1
9
2
0
1111
0
11
0
4
0
9
I 0
5No Doctorate
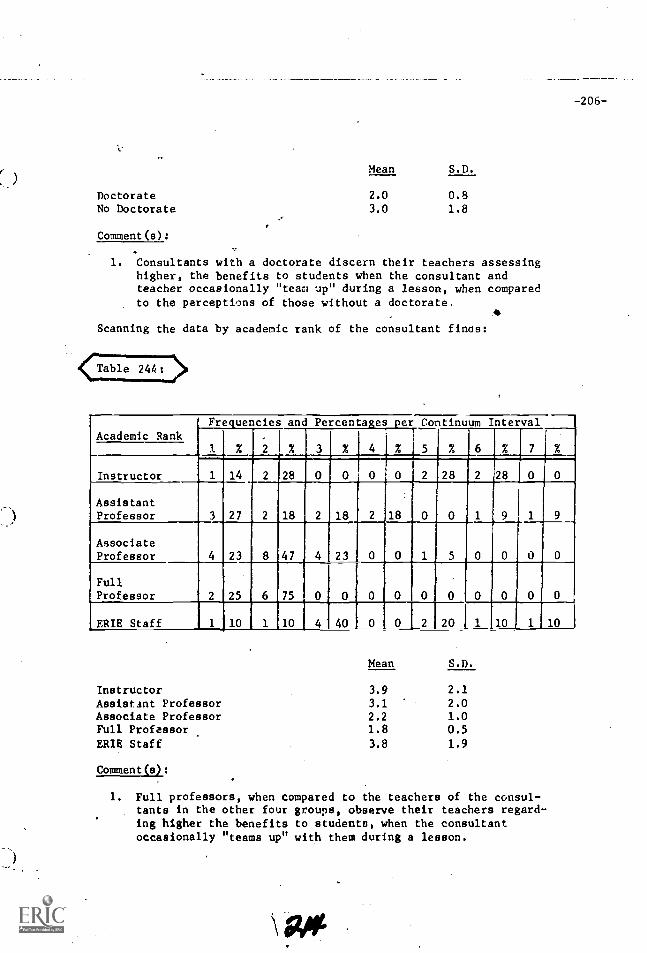
-206-
Mean S.D.
Doctorate 2.0 0.8No Doctorate 3.0 1.8
Comment(s):
1. Consultants with a doctorate discern their teachers assessinghigher, the benefits to students when the consultant andteacher occasionally "team up" during a lesson, when comparedto the perceptions of those without a doctorate.
Scanning the data by academic rank of the consultant finds:
Table 244: >
Academic RankFrequencies and Percentages per Continuum Interval
1 % 2 76 3 % 4 % 5 % 6 % 7
Instructor 1 14 2 28 0 0 0 0 2 28 2 28 0
AssistantProfessor 3 27 2 18 2 18 2 18 0 0 1 9
_O
1 9
AssociateProfessor 4 23 8 47 4 23 0 0 1 5 0 0 0 0
FullProfessor 2 25 6 75 0 0 0 0 0 0 0 0 0 0
ERIE Staff 1 10 1 10 4 40 0 0 2 20 1 10 1 10
Mean S.D.
Instructor 3.9 2.1
Assistant Professor 3.1 2.0Associate Professor 2.2 1.0Full Professor 1.8 0.5
ERIE Staff 3.8 1.9
Comment(s):
1. Full professors, when compared to the teachers of the consul-tants in the other four groups, observe their teachers regard-ing higher the benefits to students, when the consultantoccasionally "teams up" with them during a lesson.
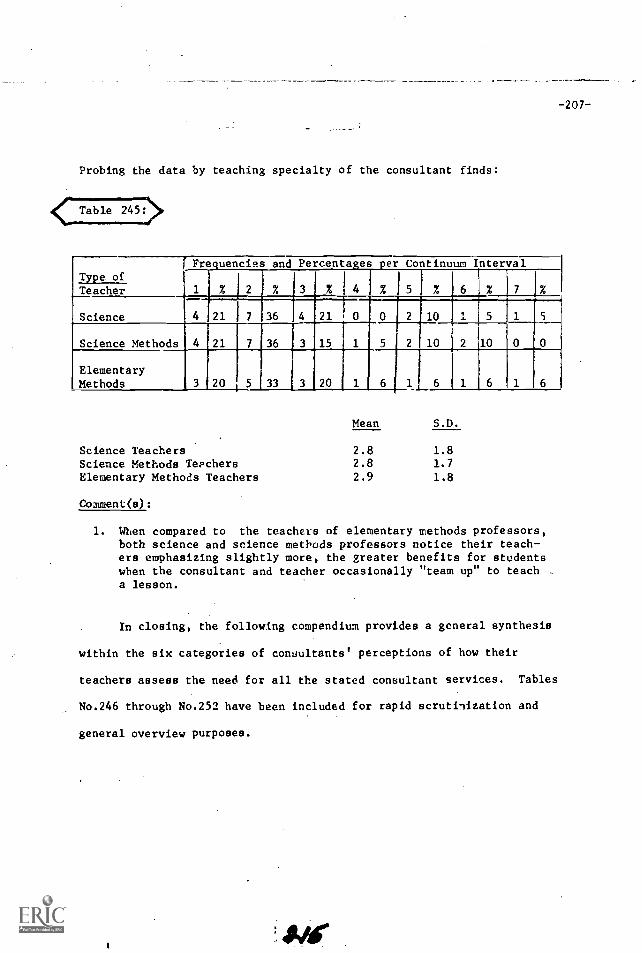
-207-
Probing the data by teaching specialty of the consultant finds:
< Table 2777>
Type ofFrequencies and Percentages per Continuum Interval
1 % 2 % 3 % 4 %_] 5 % 6 % 7 %Teacher
Science 4 21 7 36 4 21 0 0 2 10 ...
Science Methods 4 21 7 36 3 15 2 10 2 10
ElementaryMethods 3 20 5 33 3 20
Mean S.D.
Science Teachers 2.8 1.8Science Methods Teachers 2.8 1.7Elementary Methods Teachers 2.9 1.8
Comment(s):
1. When compared to the teachers of elementary methods professors,both science and science methods professors notice their teach-ers emphasizing slightly more, the greater benefits for studentswhen the consultant and teacher occasionally "team up" to teacha lesson.
In closing, the following compendium provides a general synthesis
within the six categories of conuultantsi perceptions of how their
teachers assess the need for all the stated consultant services. Tables
No.246 through No.252 have been included for rapid scrutinization and
general overview purposes.
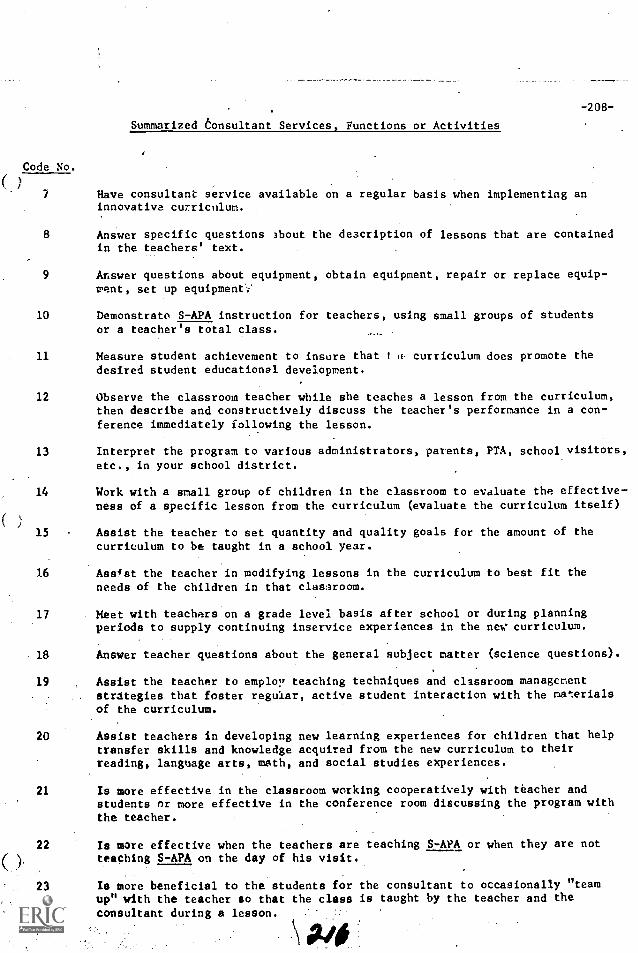
-208-
Summarized Consultant Services, Functions or Activities
Code No.
(7 Have consultant service available on a regular basis when implementing an
innovative curriculum.
( )
15 Assist the teacher to set quantity and quality goals for the amount of thecurriculum to be taught in a school year.
16 Assist the teacher in modifying lessons in the curriculum to best fit theneeds of the children in that classroom.
8 Answer specific questions about the description of lessons that are containedin the teachers' text.
9 Answer questions about equipment, obtain equipment, repair or replace equip-ment, set up equipment:'
10 Demonstrate S-APA instruction for teachers, using small groups of studentsor a teacher's total class.
11 Measure student achievement to insure that t u curriculum does promote thedesired student educational development.
12 Observe the classroom teacher while she teaches a lesson from the curriculum,then describe and constructively discuss the teacher's performance in a con-ference immediately following the lesson.
13 Interpret the program to various administrators, patents, PTA, school visitors,etc., in your school district.
14 Work with a small group of children in the classroom to evaluate the effective-ness of a specific lesson from the curriculum (evaluate the curriculum itself)
17 Meet with teachers on a grade level basis after school or during planningperiods to supply continuing inservice experiences in the new curriculum.
18 Answer teacher questions about the general subject matter (science questions).
19 Assist the teacher to employ teaching techniques and classroom managementstrategies that foster regular, active student interaction with the materialsof the curriculum.
20 Assist teachers in developing new learning experiences for children that helptransfer skills and knowledge acquired from the new curriculum to theirreading, language arts, math, and social studies experiences.
21 Is more effective in the classroom working cooperatively with teacher andstudents or more effective in the conference room discussing the program withthe teacher.
22
23
Is more effective when the teachers are teaching S-APA or when they are notteaching S-APA on the day of his visit.
Is more beneficial to the students for the consultant to occasionally "teamup" with the teacher so that the class is taught by the teacher and theconsultant during a lesson.
PO
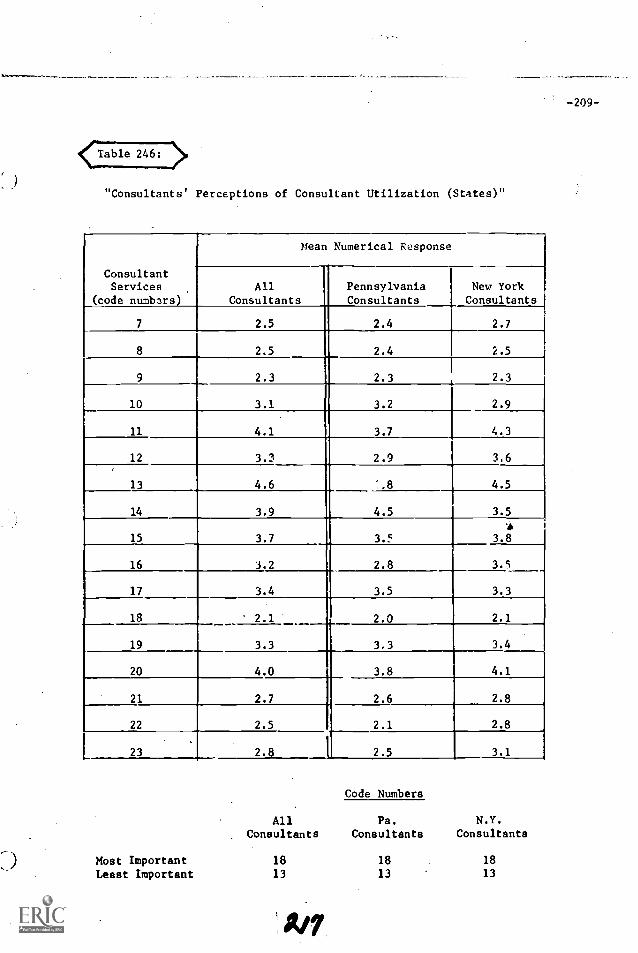
-209-
<Table 246: >
"Consultants' Perceptions of Consultant Utilization (States)"
ConsultantServices
(code numbars )
Mean Numerical Response
All
ConsultantsPennsylvaniaConsultants
New YorkConsultants
7 2.5 2.4 2.7
8 2.5 2.4 2.5
9 2.3 2.3 2.3
10 3.1 3.2 2.9
11 4.1 3.7 4.3
12 3.3 2.9 3.6
13 4.6 ..8 4.5
14 3.9 4.5 3.5
15 3.7 3.5 3.8
16 3.2 2.8 3.5
17 3.4 3.5 3.3
18 2.1 2.0 2.1
19 3.3 3.3 3.4
20 4.0 3.8 4.1
21 2.7 2.6 2.8
22 2.5 2.1 2.8
23 2.8 2.5 3.1
Code Numbers
All Pa. N.Y.
Consultants Consultants Consultants
Most Important 18 18 18
Least Important 13 13 13
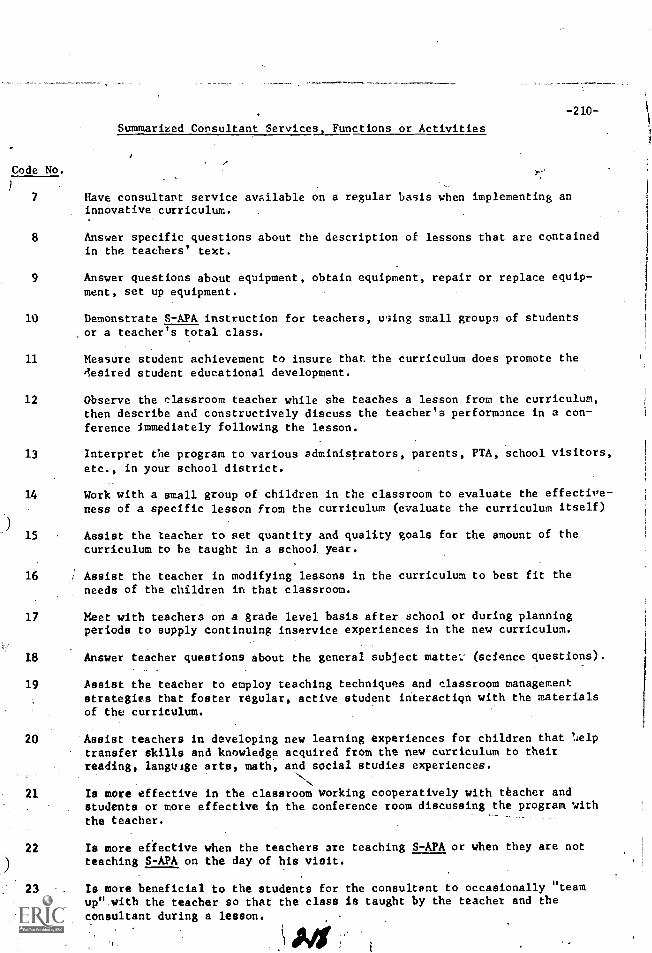
-210-
Summarized Consultant Services Functions or Activities
Code No.
7 Have consultant service available on a regular basis when implementing aninnovative curriculum.
8 Answer specific questions about the description of lessons that are containedin the teachers' text.
Answer questions about equipment, obtain equipment, repair or replace equip-ment, set up equipment.
10 Demonstrate S-APA instruction for teachers, using small groups of students, or a teacher's total class.
11 Measure student achievement to insure that the curriculum does promote thedesired student educational development.
12 Observe the classroom teacher while she teaches a lesson from the curriculum,then describe and constructively discuss the teacher's performance in a con-ference immediately following the lesson.
13 Interpret the program to various administrators, parents, PTA, school visitors,etc., in your school district.
14 Work with a small group of children in the classroom to evaluate the effective-ness of a specific lesson from the curriculum (evaluate the curriculum itself)
-) 15 . Assist the teacher to set quantity and quality goals for the amount of thecurriculum to be taught in a school. year.
16 I Assist the teacher in modifying lessons in the curriculum to best fit theneeds of the children in that classroom.
17 Meet with teachers on a grade level basis after school or during planningperiods to supply continuing inservice experiences in the new curriculum.
18 Answer teacher questions about the general subject matte (science questions).
19 Assist the teacher to employ teaching techniques and classroom managementstrategies that foster regular, active student interactiqn with the materialsof the curriculum.
20 Assist teachers in developing new learning experiences for children that 1.1elptransfer skills and knowledge acquired from the new curriculum to theirreading, language arts, math, and social studies experiences.
21 Is more effective in the classroom working cooperatively with teacher andstudents or more effective in the conference room discussing the program with
22
the teacher.
Is more effective when the teachers are teaching S-APA or when they are notteaching S-APA on the day of his visit.
23 Is more beneficial to the students for the consultant to occasionally "teamup".with the teacher so that the class is taught by the teacher and theconsultant during a lesson.
414
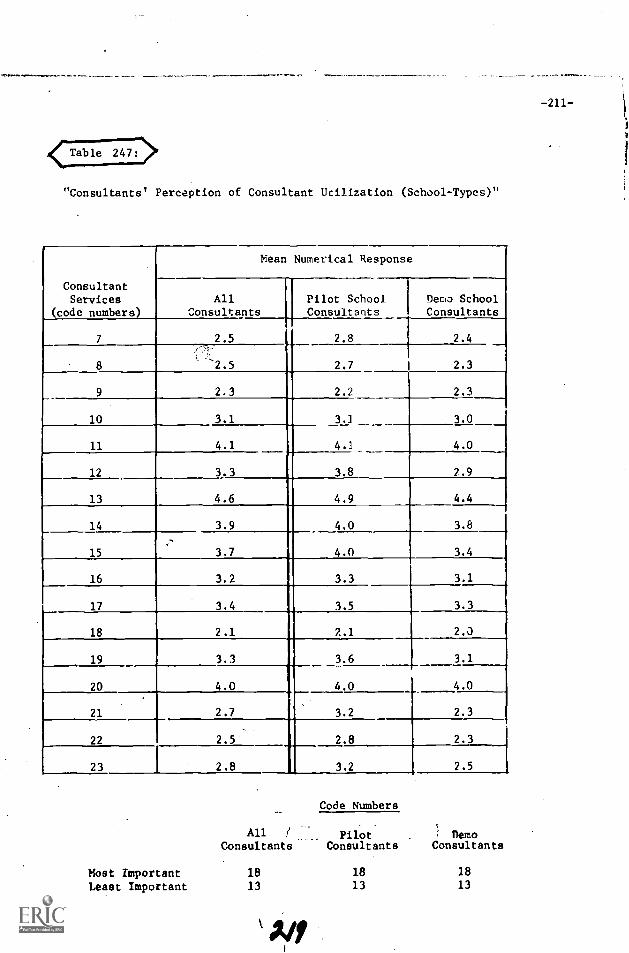
-211-
"Consultants' Perception of Consultant Utilization (School-Types)"
ConsultantServices
(code numbers)
Mean Numerical Response
AllConsultants
Pilot SchoolConsultants
Demo SchoolConsultants
7 2.5 2.8 2.4
8
',-''
2.5 2.7 2.3
9 2.3 2.2 2.3
10 3.1 3.1 3.0
11 4.1 4.1 4.0
12 3.3 3.8 2.9
13 4.6 4.9 4.4
14 3.9 4.0 3.8
15 3.7 4.0 3.4
16 3.2 3.3 3.1
17 3.4 3.5 3.3
18 2.1 2.1 2.0
19 3.3 3.6 3.1
20 4.0 4.0 4.0
21 2.7 3.2 2.3
22
..,
2.5 2.8 2.3
23 2.8 3.2 2.5
Code Numbers
All / Pilot : DemoConsultants Consultants Consultants
Most Important 18 18 18
Least Important 13 13 13
$1,
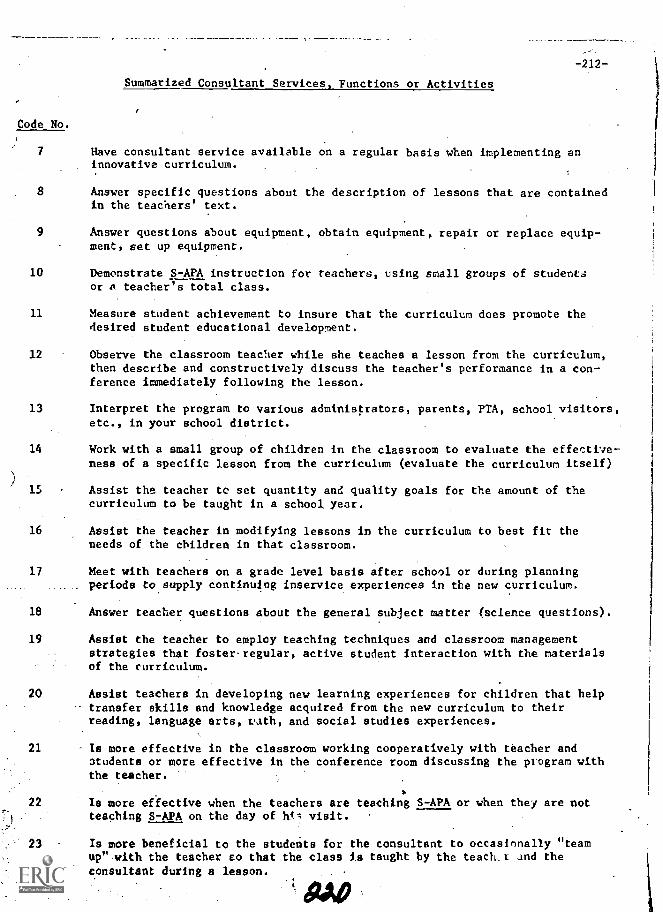
._,
Code No.
Summarized Consultant Services, Functions or Activities
i
-212-
7 Have consultant service available on a regular basis when implementing an I
innovative curriculum.
8 Answer specific questions about the description of lessons that are containedin the teachers' text.
9 Answer questions about equipment, obtain equipment, repair or replace equip-ment, set up equipment.
10 Demonstrate S-APA instruction for teachers, using small groups of studentsor a, teacher's total class.
11 Measure student achievement to insure that the curriculum does promote thedesired student educational development.
12 Observe the classroom teacher while she teaches a lesson from the curriculum,then describe and constructively discuss the teacher's performance in a con-ference immediately following the lesson.
13 Interpret the program to various administrators, parents, PTA, school visitors,etc., in your school district.
14 Work with a small group of children in the classroom to evaluate the effective-ness of a specific lesson from the curriculum (evaluate the curriculum itself)
15 Assist the teacher to set quantity and quality goals for the amount of thecurriculum to be taught in a school year.
16 Assist the teacher in modifying lessons in the curriculum to best fit theneeds of the cbildren in that classroom.
17 'Meet with teachers on a grade level basis after school or during planningperiods to supply continuing inservice experiences in the new curriculum.
18 Answer teacher questions about the general subject matter (science questions).
19 Assist the teacher to employ teaching techniques and classroom managementstrategies that foster-regular, active student interaction with the materialsof the curriculum.
20 Assist teachers in developing new learning experiences for children that helptransfer skills and knowledge acquired from the new curriculum to theirreading, language arts, vath, and social studies experiences.
21 Is more effective in the classroom working cooperatively with teacher andatudents or more effective in the conference room discussing the program withthe teacher.
22 Is more effective when the teachers are teaching S-APA or when they are notteaching S-APA on the day of hi.; visit.
23 Is more beneficial to the students for the consultant to occasionally "teamup".with the teacher co that the class is taught by the teacher and theconsultant during a lesson.
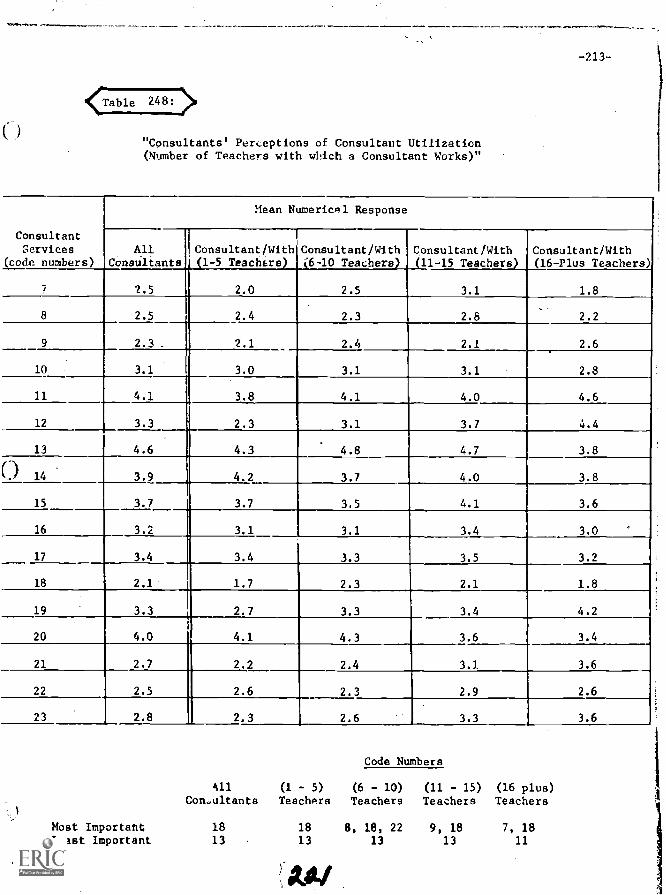
-213-
<Table 248:
"Consultants' Perceptions of Consultant Utilization(Number of Teachers with which a Consultant Works)"
ConsultantServices
(code numbers)
Mean Numerical Response
AllConsultants
Consultant/With1-5 TeachErsi__56
I 2.0
Consultant/With-10 Teachers)
2.5
Consultant/With(11-15 Teachers
3.1
Consultant/With16-Plus Teachers)
1.87 2.5
8 2.5 2.4 2.3 2.8 2.2
2.3 _ 2.1 2.4 2.1 2.6
10 3.1 I 3.0 3.1 3.1 2.8
11 4.1 j 3.8 4.1 4.0 4.6
12 3.3 2.3 3.1 3.7 4.4
13 4.6 4.3 4.8 4.7 3.8
C) 14 3.9 4.2 3.7 4.0 3.8
15 3.7 3.7 3.5 4.1 3.6
16 3.2 3.1 3.1 3.4 3.0
17 3.4 3.4 3.3 3.5 3.2
18 2.1 1.7 2.3 2.1 1.8
19 3.3 2.7 3.3 3.4 4.2
20 4.0 4.1 4.3 3.6 3.4
21 2.7 2.2 2.4 3.1 3.6
22 2.5 2.6 2.3 2.9 2.6
23 2.8 2.3 2.6 3.3 3.6
Code Numbers
All (1 - 5) (6 - 10) (11 - 15) (16 plus)Consultants Teachers Teachers Teachers Teachers
Most Important 18 18 8, 18, 22 9, 18 7, 18Least Important 13 13 13 13 11
UI
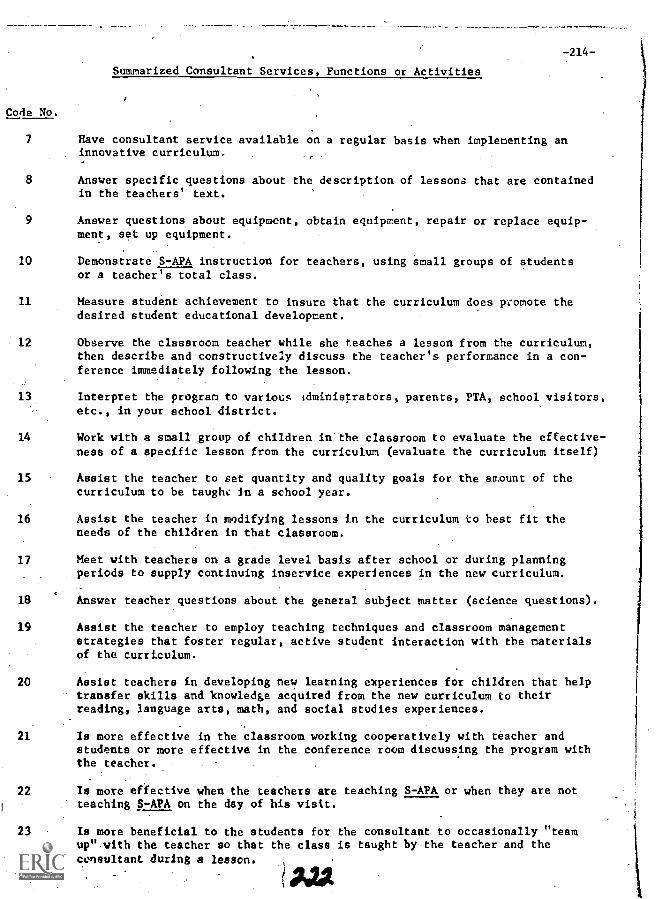
Code No.
7
7214-
Summarized Consultant Services, Functions or Activities
Have consultant service available on a regular basis when implementing aninnovative curriculum. .
8 Answer specific questions about the description of lessons that are containedin the teachers' text.
9 Answer questions about equipment, obtain equipment, repair or replace equip-ment, set up equipment.
10 Demonstrate S-APA instruction for teachers, using small groups of studentsor a teacher's total class.
11 Measure student achievement to insure that the curriculum does promote thedesired student educational development.
12 Observe the classroom teacher while she teaches a lesson from the curriculum,then describe and constructively discuss the teacher's performance in a con-ference immediately following the lesson.
13 Interpret the program to various administrators, parents, PTA, school visitors,etc., in your school district.
14 Work with a small group of children in the classroom to evaluate the effective-ness of a specific lesson from the curriculum (evaluate the curriculum itself)
15 Assist the teacher to set quantity and quality goals for the amount of thecurriculum to be taught: in a school year.
16 Assist the teacher in modifying lessons in the curriculum to best fit theneeds of the children in that classroom.
17 Meet with teachers on a grade level basis after school orperiods to supply continuing inservice experiences in the
Answer teacher questions about the general subject matter18
during planningnew curriculum.
(science questions).
19 Assist the teacher to employ teaching techniques and classroom managementstrategies that foster regular, active student interaction with the materialsof the curriculum.
20 Assist teachers in developing new learning experiences for children that helptransfer skills and knowledge acquired from the new curriculum to theirreading, language arts, math, and social studies experiences.
21 Is more effective in the classroom working cooperatively with teacher andstudents or more effective in the conference room discussing the program withthe teacher.
22 Is more effective when the teachers are teaching S-APA or when they are notteaching S-APA on the day of his visit.
23 Is more beneficial to the students for the consultant to occasionally "teamup".with the teacher so that the class is taught by the teacher and theconsultant during a lesson.
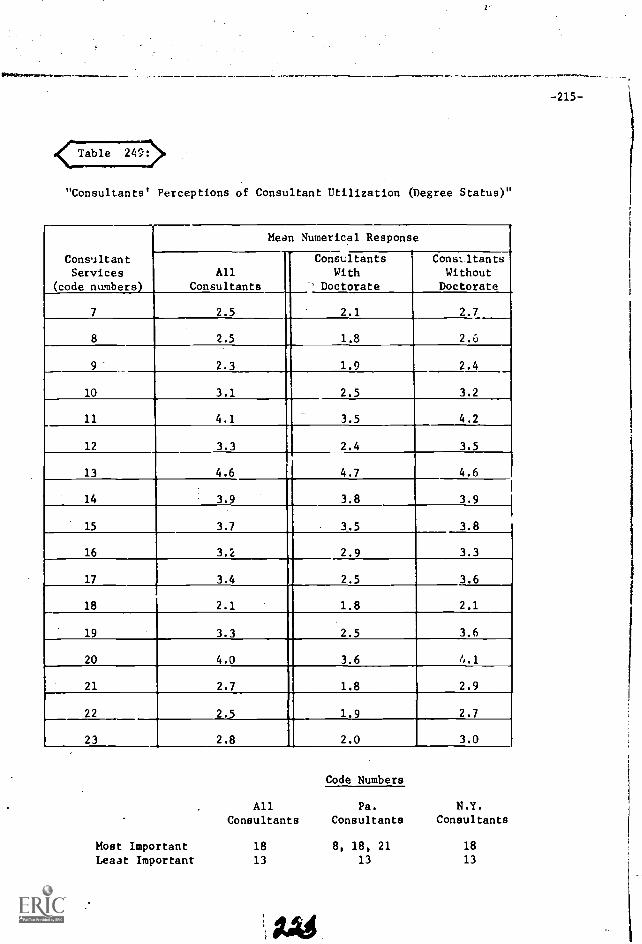
-215-
<Table 24;7>
"Consultants' Perceptions of Consultant Utilization (Degree Status)"
Mean Numerical Response
ConsultantServices
(code numbers)
All
Consultants
ConsultantsWith
' Doctorate
Cons:ltantsWithout
Doctorate
7 2.5 2.1 2.7
8 2.5 1.8 2.6
9 2.3 1.9 2.4
10 3.1 2.5 3.2
11 4.1 3.5 4.2
12 3.3 2.4 3.5
13 4.6 4.7 4.6
14 3.9 3.8 3.9
15 3.7 3.5 3.8
16 3.2 2.9 3.3
17 3.4 2.5 3.6
18 2.1 1.8 2.1
19 3.3 2.5 3.6
20 4.0 3.6 4.1
21 2.7 1.8 2.9
22 2. 1.9 2.7
23 2.8 2.0 3.0
Code Numbers
All Pa. N.Y.
Consultants Consultants Consultants
Most Important 18 8, 18, 21 18
Leaat Important 13 13 13
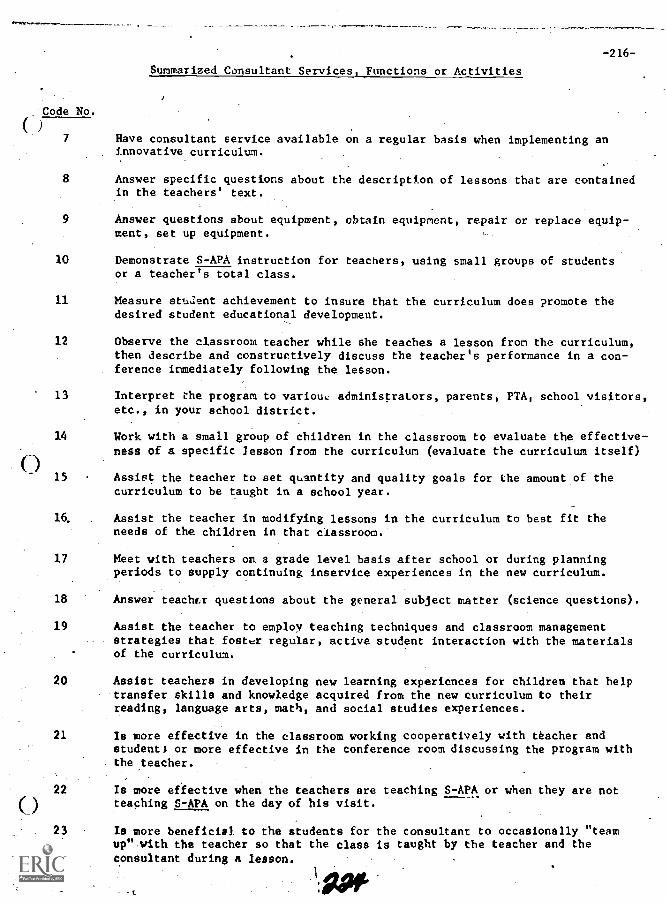
Summarized Consultant Services, Functions or Activities
-216-
Code No.
7 Have consultant service available on a regular basis when implementing aninnovative curriculum.
8 Answer specific questions about the description of lessons that are containedin the teachers' text.
9 Answer questions about equipment, obtain equipment, repair or replace equip-ment, set up equipment.
10 Demonstrate S-APA instruction for teachers, using small groups of studentsor a teacher's total class.
11 Measure student achievement to insure that the curriculum does promote thedesired student educational development.
12 Observe the classroom teacher while she teaches a lesson from the curriculum,then describe and constructively discuss the teacher's performance in a con-ference immediately following the lesson.
13 Interpret the program to variouL administrators, parents, PTA, school visitors,etc., in your school district.
14 Work with a small group of children in the classroom to evaluate the effective-ness of a specific lesson from the curriculum (evaluate the curriculum itself)
(-) 15 Assist the teacher to set quantity and quality goals for the amount of thecurriculum to be taught in a school year.
16. Assist the teacher in modifying lessons in the curriculum to best fit theneeds of the children in that classroom.
17 Meet with teachers on a grade level basis after school or during planningperiods to supply continuing inservice experiences in the new curriculum.
18 Answer teachcr questions about the general subject matter (science questions).
19 Assist the teacher to employ teaching techniques and classroom managementstrategies that foster regular, active student interaction with the materialsof the curriculum.
20 Assist teachers in developing new learning experiences for children that helptransfer skills and knowledge acquired from the new curriculum to theirreading, language arts, math, and social studies experiences.
21 Is more effective in the classroom working cooperatively with teacher andatudenti or more effective in the conference room discussing the program withthe teacher.
Is more effective when the teachers are teaching S-APA_ or when they are notteaching S-APA on the day of his visit.
22
23 Is more beneficial to the students for the consultant to occasionally "teamup" with the teacher so that the class is taught by the teacher and theconsultant during a lesson.
1:00
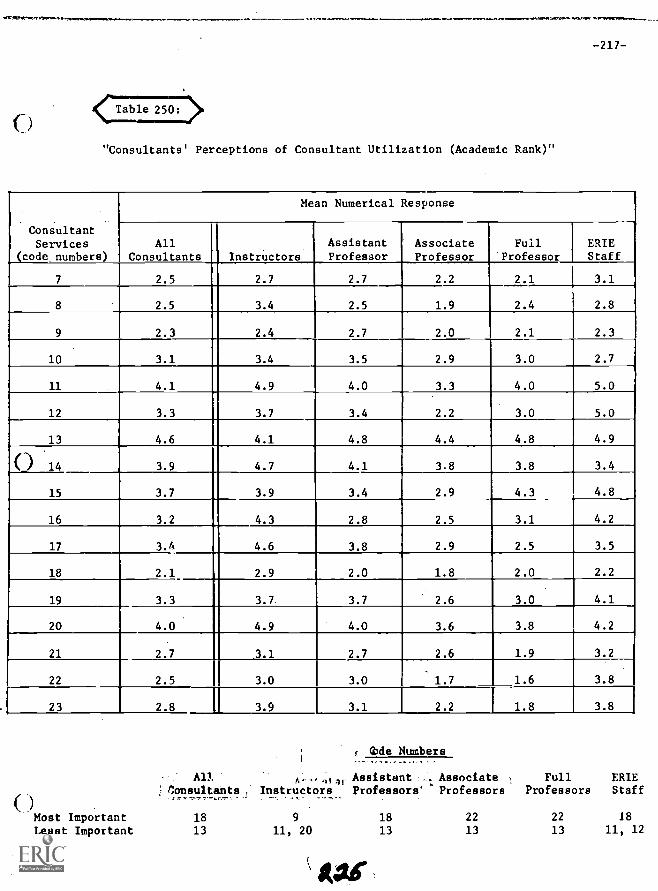
11C.Rtel,SVP140.
0 Cable 250:
"Consultants' Perceptions of Consultant Utilization (Academic Rank)"
-217-
ConsultantServices
(code numbers)
Mean Numerical Response
AllConsultants Instructors
AssistantProfessor
AssociateProfessor
FullProfessor
ERIEStaff
7 2.5 2.7 2.7 2.2 2.1 3.1
8 2.5 3.4 2.5 1.9 2.4 2.8
9 2.3 2.4 2.7 2.0 2.1 2.3
10 3.1 3.4 3.5 2.9 3.0 2.7
11 4.1 4.9 4.0 3.3 4.0 5.0
12 3.3 3.7 3.4 2.2 3.0 5.0
13 4.6 I 4.1 4.8 4.4 4.8 4.9
() 14 3.9 4.7 4.1 3.8 3.8 3.4
15 3.7 3.9 3.4 2.9 4.3 4.8
16 3.2 4.3 2.8 2.5 3.1 4.2
17 3.4 4.6 3.8 2.9 2.5 3.5
18 2.1 2.9 2.0 1.8 2.0 2.2
19 3.3 3.7. 3.7 2.6 3.0 4.1
20 4.0 4.9 4.0 3.6 3.8 4.2
21 2.7 3.1 2.7 2.6 1.9 3.2
22 2.5 3.0 3.0 1.7 1.6 3.8
23 2.8 3.9 3.1 2.2 1.8 3.8
)
e Numbers
Al?. a A, Assistant . Associate Full ERIEnonsultants . Instructors Professors' Professors Professors Staff
Most Important 18 9 18 22 22 18
Least Important 13 11, 20 13 13 13 11, 12
!Me
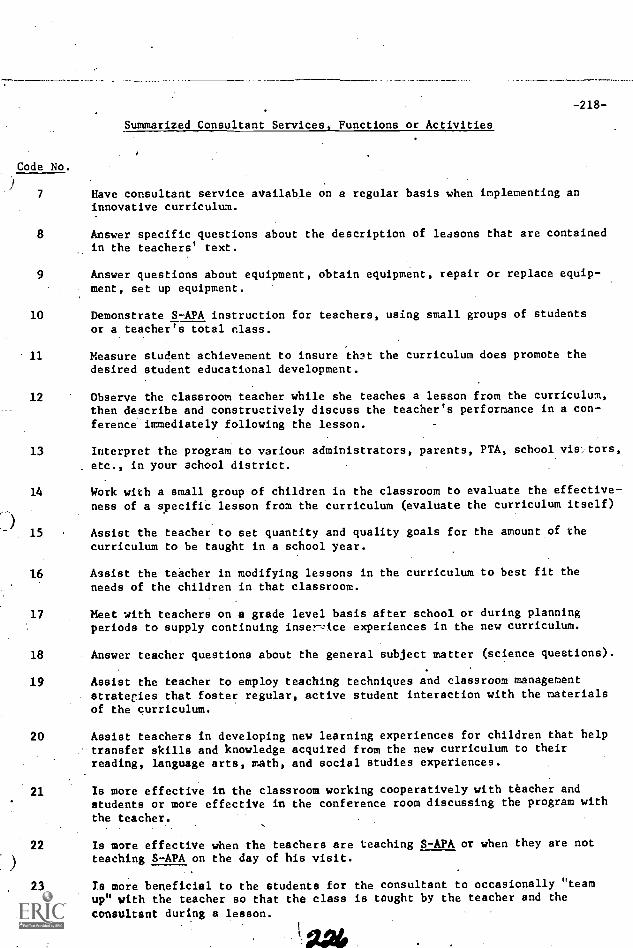
Summarized Consultant Services, Functions or Activities
-218-
Code No.
7 Have consultant service available on a regular basis when implementing aninnovative curriculum.
8 Answer specific questions about the description of lessons that are containedin the teachers' text.
9 Answer questions about equipment, obtain equipment, repair or replace equip-ment, set up equipment.
10 Demonstrate S-APA instruction for teachers, using small groups of studentsor a teacher's total class.
11 Measure student achievement to insure that the curriculum does promote thedesired student educational development.
12 Observe the classroom teacher while she teaches a lesson from the curriculum,then describe and constructively discuss the teacher's performance in a con-ference immediately following the lesson.
13 Interpret the program to various administrators, parents, PTA, school visltors,etc., in your school district.
14 Work with a small group of children in the classroom to evaluate the effective-
ness of a specific lesson from the curriculum (evaluate the curriculum itself)
-) 15 Assist the teacher to set quantity and quality goals for the amount of thecurriculum to be taught in a school year.
16 Assist the teacher in modifying lessons in the curriculum to best fit theneeds of the children in that classroom.
17 Meet with teachers on a grade level basis after school or during planningperiods to supply continuing insence experiences in the new curriculum.
18 Answer teacher questions about the general subject matter (science questions).
19 Assist the teacher to employ teaching techniques and classroom managementstrategies that foster regular, active student interaction with the materialsof the curriculum.
20 Assist teachers in developing new learning experiences for children that helptransfer skills and knowledge acquired from the new curriculum to theirreading, language arts, math, and social studies experiences.
21 Is more effective in the classroom working cooperatively with teacher andstudents or more effective in the conference room discussing the program withthe teacher.
22 Is more effective when the teachers are teaching S-APA or when they are notteaching S-APA on the day of his visit.
23 Is more beneficial to the students for the consultant to occasionally "teamup" with the teacher so that the class is taught by the teacher and the
consultant during a lesson.
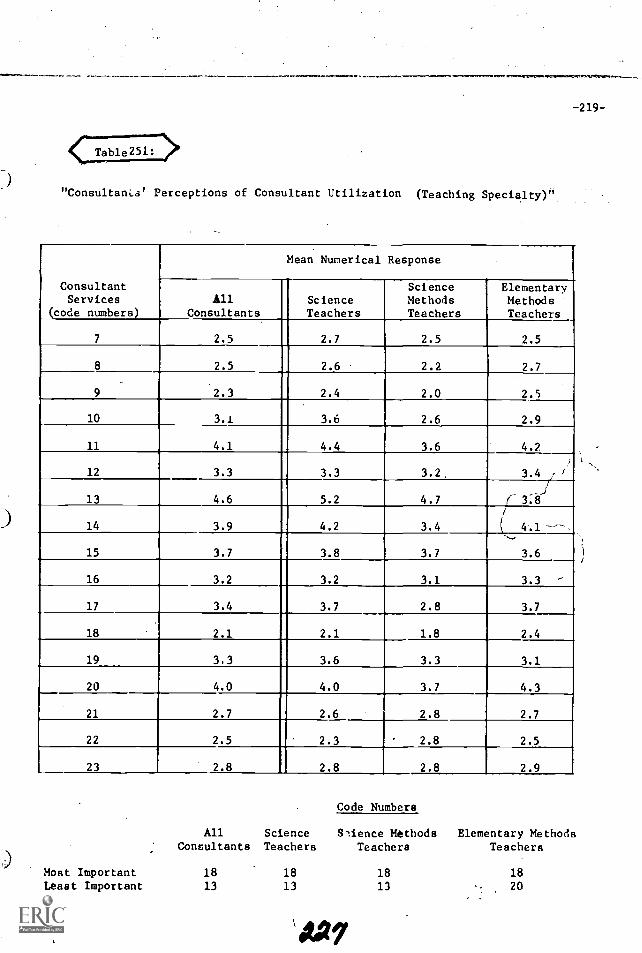
-219-
Cable251: >"Consultani.s' Perceptions of Consultant Utilization (Teaching Specialty)"
ConsultantServices
(code numbers )
Mean Numerical Response
AllConsultants
ScienceTeachers
ScienceMethodsTeachers
ElementaryMethodsTeachers
7 2.5 2.7 2.5 2.5
8 2.5 2.6 2.2 2.7
9 2.3 2.4 2.0 2.5
10 3.1 3.6 2.6 2.9
11 4.1 4.4 3.6 4.2
12 3.3 3.3 3.2 3.4 -J
13 4.6 5.2 4.7 / 3.83
14 3.9 4.2 3.4
/
4.1 -^I
15 3.7 3.8 3.7 3.6
16 3.2 3.2 3.1 3.3 -
17 3.4 3.7 2.8 3.7
18 2.1 2.1 1.8 2.4
19 3.3,..
3.6 3.3 3.1
20 4.0 4.0 3.7 4.3
21 2.7 2.6 2.8 2.7
22 2.5 2.3 2.8 2.5
23 2.8 2.8 2.8 2.9
Code Numbers
All Science Science Methods Elementary MethodsConsultants Teachers Teachers Teachers
Most Important 18 18 18 18Least Important 13 13 13 20
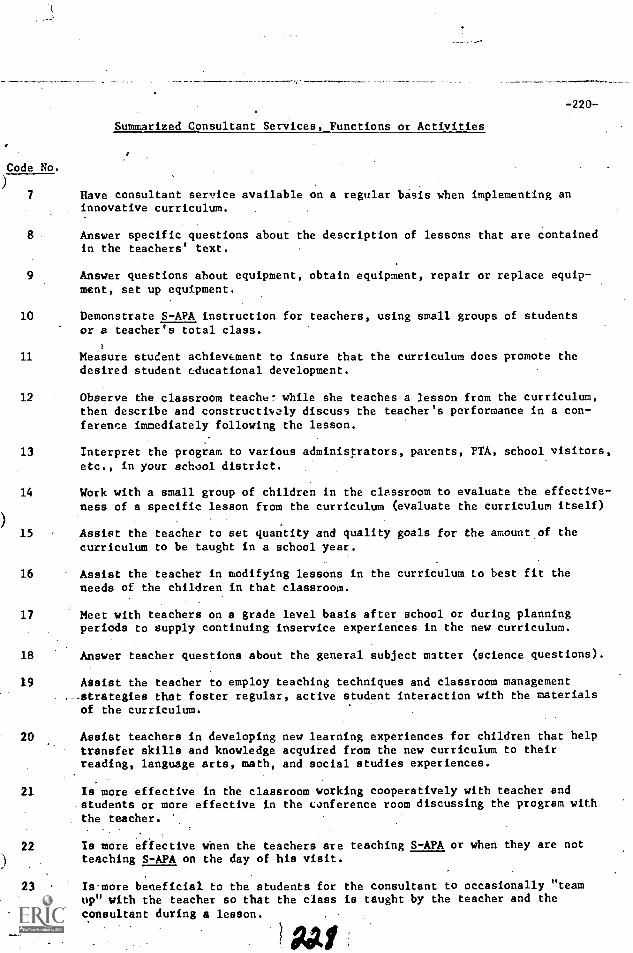
Summarized Consultant Services, Functions or Activities
-220-
Code No.
7 Have consultant service available on a regular basis when implementing aninnovative curriculum.
10
11
Answer specific questions about the description of lessons that are containedin the teachers' text.
Answer questions about equipment, obtain equipment, repair or replace equip-ment, set up equipment.
Demonstrate S-APA instruction for teachers, using small groups of studentsor a teacher's total class.
Measure student achievement to insure that the curriculum does promote thedesired student educational development.
12 Observe the classroom teache- while she teaches a lesson from the curriculum,then describe and constructively discuss the teacher's performance in a con-ference immediately following the lesson.
13 Interpret the program to various administrators, parents, PTA, school visitors,
etc., in your school district.
14 Work with a small group of children in the classroom to evaluate the effective-ness of a specific lesson from the curriculum (evaluate the curriculum itself)
) 15 Assist the teacher to set quantity and quality goals for the amount of thecurriculum to be taught in a school year.
16 Assist the teacher in modifying lessons in the curriculum to best fit theneeds of the children in that classroom.
17 Meet with teachers on a grade level basis after school or during planningperiods to supply continuing inservice experiences in the new curriculum.
18 Answer teacher questions about the general subject matter (science questions).
19 Assist the teacher to employ teaching techniques and classroom management_strategies that foster regular, active student interaction with the materialsof the curriculum.
20 Assist teachers in developing new learning experiences for children that helptransfer skills and knowledge acquired from the new curriculum to theirreading, language arts, math, and social studies experiences.
21 Is more effective in the classroom working cooperatively with teacher andstudents or more effective in the conference room discussing the program withthe teacher.
22 Is more effective when the teachers are teaching S-APA or when they are notteaching S-APA on the day of his visit.
23 Is more beneficial to the students for the consultant to occasionally "teamup"-with the teacher so that the class is taught by the teacher and theconsultant during a lesson.
1 Po If
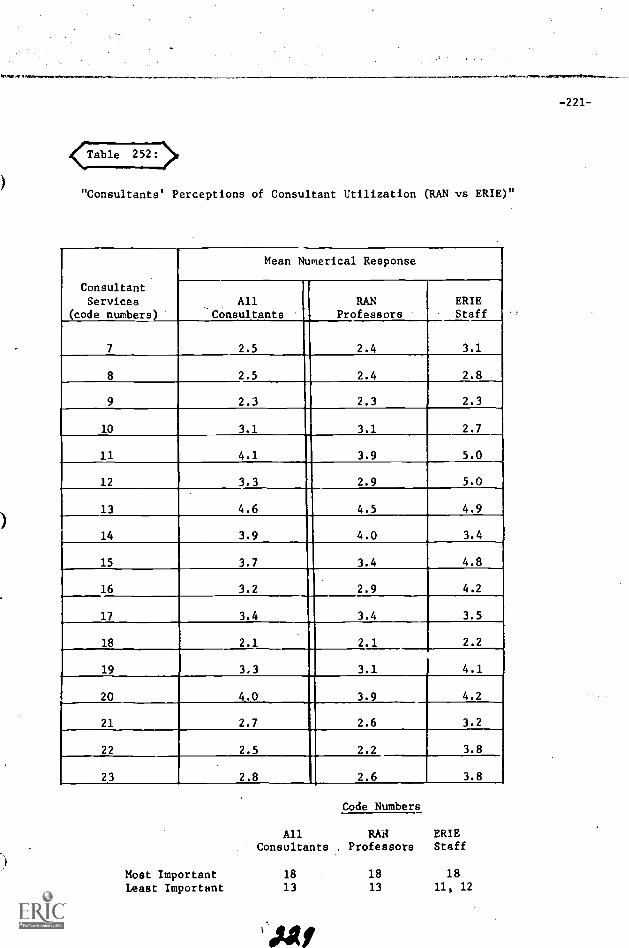
.r.61.001'10WM.No
"Consultants' Perceptions of Consultant Utilization (RAN vs ERIE)"
Consultant
Services(code numbers)
Mean Numerical Response
_All
ConsultantsRAN
ProfessorsERIEStaff
7 2.5 2.4 3.1
8 2.5 2.4 2.8
9 2.3 2.3 2.3
10 3.1 3.1 2.7
11 4.1 3.9 5.0
12 3.3 2.9 5.0
13 4.6 4.5 4.9
14 3.9 4.0 3.4
15 3.7 3.4 4.8
16 3.2 2.9 4.2
17 3.4 3.4 3.5
18 2.1 2.1 2.2
19 3.3 3.1 4.1
20 4.0 3.9 4.2
21 2.7 2.6 3.2
22 2.5 2.2 3.8
23 2.8 2.61 3.8
Code Numbers
All RAA ERIEConsultants Professors Staff
Most Important 18 18 18
Least Important 13 13 11, 12
'
-221-
0
0
Part IV
"Data Summary"
In this section an attempt has been madeto bring together the mean-numerical-responsesof those individuals within a given educationalsetting. It provides a general synthesis withinthe five settings of the groups' perceptions ofhow they assess the teacher's need for all thestated consultant services. This summary alsocontains the code numbers of the most importantand least important consultant activities asperceived by and for the teachers by all threegroups of educators.
-222-
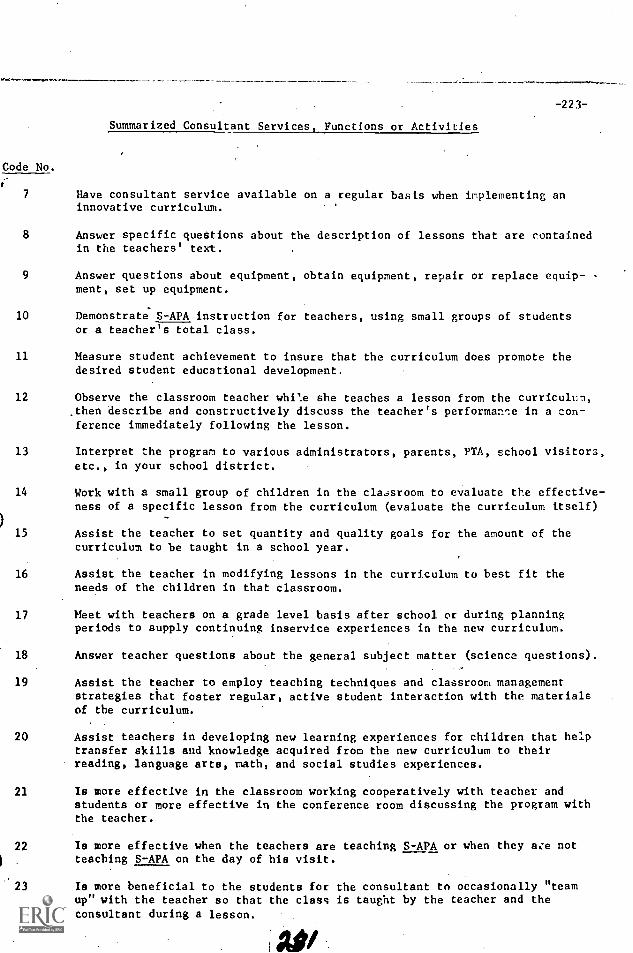
Summarized Consultant Services, Functions or Activities
-223-
Code No.
7 Have consultant service available on a regular basis when implementing aninnovative curriculum.
8 Answer specific questions about the description of lessons that are containedin the teachers' text.
9 Answer questions about equipment, obtain equipment, repair or replace equip-ment, set up equipment.
10 Demonstrate S-APA instruction for teachers, using small groups of studentsor a teacher's total class.
11 Measure student achievement to insure that the curriculum does promote thedesired student educational development.
12 Observe the classroom teacher while she teaches a lesson from the curriculum,.then describe and constructively discuss the teacher's performan,:e in a con-ference immediately following the lesson.
13
14
) 15
Interpret the program to various administrators, parents, PTA, school visitors,etc., in your school district.
Work with a small group of children in the classroom to evaluate the effective-ness of a specific lesson from the curriculum (evaluate the curriculum itself)
Assist the teacher to set quantity and quality goals for the amount of thecurriculum to be taught in a school year.
16 Assist the teacher in modifying lessons in the curriculum to best fit theneeds of the children in that classroom.
17 Meet with teachers on a grade level basis after school or during planningperiods to supply continuing inservice experiences in the new curriculum.
18 Answer teacher questions about the general subject matter (science questions).
19 Assist the teacher to employ teaching techniques and classroom managementstrategies that foster regular, active student interaction with the materialsof the curriculum.
20 Assist teachers in developing new learning experiences for children that helptransfer skills and knowledge acquired from the new curriculum to theirreading, language arts, math, and social studies experiences.
21 Is more effective in the classroom working cooperatively with teacher andstudents or more effective in the conference room discussing the program withthe teacher.
22 Is more effective when the teachers are teaching S-APA or when they ace notteaching S-APA on the day of his visit.
23 Is more beneficial to the students for the consultant to occasionally "teamup" with the teacher so that the class is taught by the teacher and theconsultant during a lesson.
kV
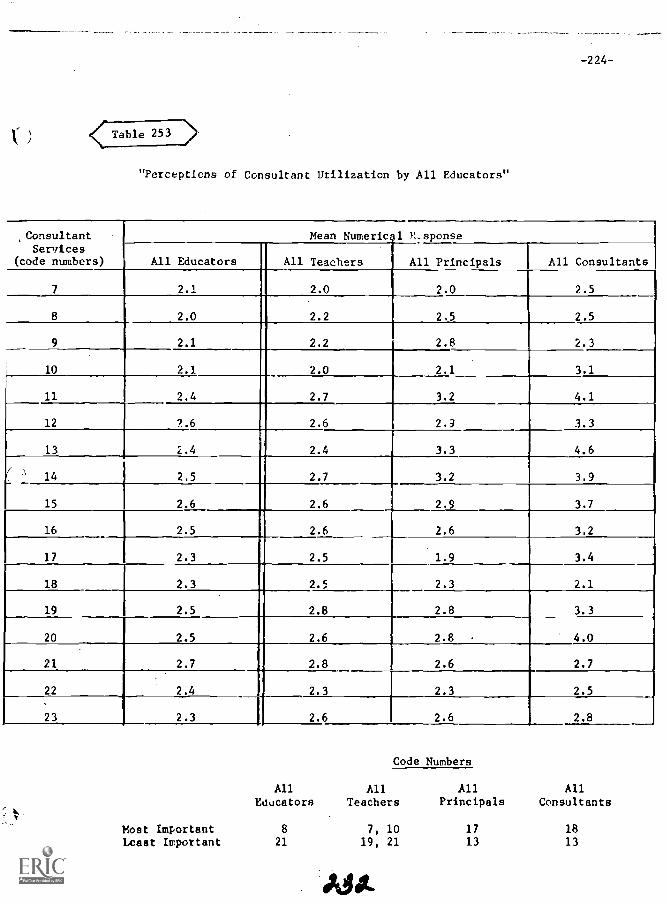
<Table 253 >'
"Perceptions of Consultant Utilization by All Educators"
-224-
,ConsultantServices
(code numbers)
Mean Numerical Y_sponse
All Educators All Teachers All Principals 1 All Consultants
7 2.1 2.0 2.0 2.5
8 2.0 2.2 2.5 2.5
9 2.1 2.2 2.8 2.3
10 2.1 2.0 2.1 3.1
11 2.4 2.7 3.2 4.1
12 7.6 1 2.6 2.9 3.3
13 2.4 1 2.4 3.3 4.6
14 2.5 1 2.7 3.2 3.9
15 2.6 1 2.6 2.9 3.7
16 2.5 2.6 2.6
1.9
l 3.2
3.417 2.3 2.5
18 2.3 2.5 2.3 2.1
19 2.5 2.8 2.8 3.3
20 2.5 2.6 2.8 4.0
21 2.7 2.8 2.6 2.7
22 2.4 2.3 2.3 2.5
23 2.3 2.6 2.6 2.8
Code Numbers
All All All AllEducators Teachers Principals Consultants
Most Important 8 7, 10 17 18Least Important 21 19, 21 13 13
Met

Summarized Consultant Services,. Functions or Activities
-225-
Code No.
k7Have consultant service available on a regular basis when implementing aninnovative curriculum.
8 Answer specific questions about the description of lessons that are containedin the teachers' text.
Answer questions about equipment, obtain equipment, repair or replace equip-ment, set up equipment.
10 Demonstrate S-APA instruction for teachers, using small groups of studentsor a teacher's total class.
11 Measure student achievement to insure that the curriculum does pronote thedesired student educational development.
12 Observe the classroom teacher while she teaeliv,'"a lesson from the curriculum,then describe and constructively discuss the Leacher's performance in a con-ference immediately following the lesson.
13 Interpret the program to various administrators, parents, PTA, school visitors,etc., in your school district.
14. Work with a small group of children in the classroom to evaluate the effective-
ness of a specific lesson from the curriculum (evaluate the curriculum itself)
0 15 Assist the teacher to set quantity and quality goals for the amount of thecurriculum to be taught in a school year.
16 Assist the teacher in modifying lessons in the curriculum to best fit theneeds of the children in that classroom.
17 Meet with teachers on a grade level basis after school or during planningperiods to supply continuing inservice experiences in the new curriculum.
18 Answer teacher questions about the general subject matter (science questions).
19 Assist the teacher to employ teaching techniques and classroom managementstrategies that foster regular, active student interaction with the materialsof the curriculum.
20 Assist teachers in developing new learning experiences for children that helptransfer s%Ills and knowledge acquired from the new curriculum to theirreading, language arts, math, and social studies experiences.
21 Is more effective in the classroom working cooperatively with teacher andstudents or more effective in the conference room diFcussing the program withthe teacher.
22 Is more effective when the teachers are teaching S-APA or when they are notteaching S-APA on the day of his visit.
23 Is more beneficial to the students for the consultant to occasionally "teamup" with the teacher so that the class is taught by the teacher and theconsultant during a lesson.
14.41
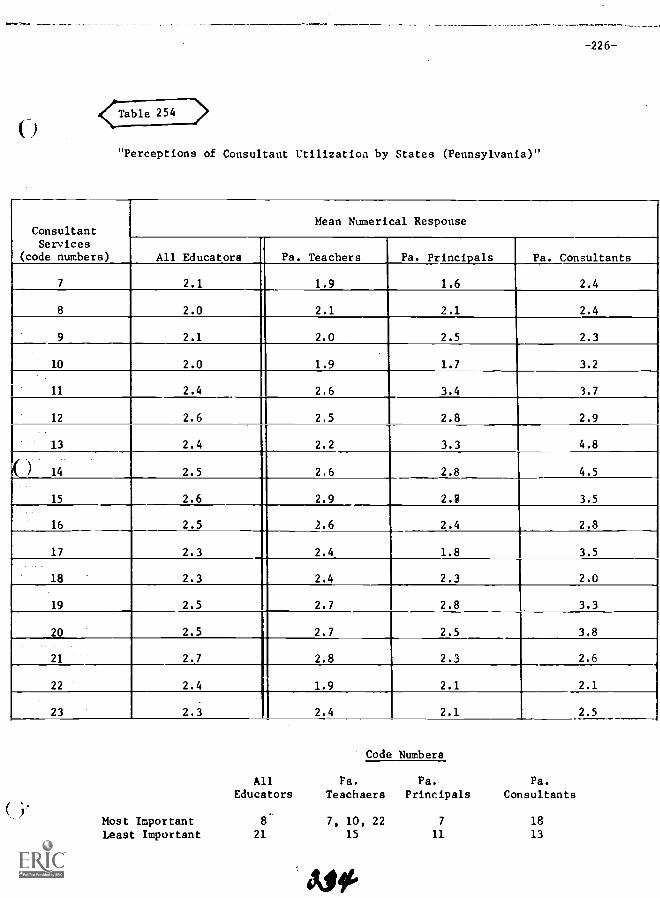
-226-
"Perceptions of Consultant Utilization by States (Pennsylvania)"
ConsultantServices
(code numbers)
Mean Numerical Response
All Educators Pa. Teachers Pa. Principals Pa. Consultants
7 2.1 1.9 1.6 2.4
8 2.0 2.1 2.1 2.4
9 2.1 2.0 2.5 2.3
10 2.0 1.9 1.7 3.2
11 2.4 2.6 3.4 3.7
12 2.6 2.5 2.8 2.9
13 2.4 2.2 3.3 4.8
( ) 14 2.5 2.6 2.8 4.5
15 2.6 2.9 2.7 3.5
16 2.5 2.6 2.4 2.3
17 2.3 2.4 1.8 3.5
18 2.3 2.4 2.3 2.0
19 2.5 2.7 2.8 3.3
20 2.5 2.7 2.5 3.8
21 2.7 2.8 2.3 2.6
22 2.4 1.9 2.1 2.1
23 2.3 2.4 2.1 2.5
Most ImportantLeast Important
Code Numbers
All Fa. Pa. Pa.
Educators Teachaers Principals Consultants
8 7, 10, 22 7 18
21 15 11 13
At*
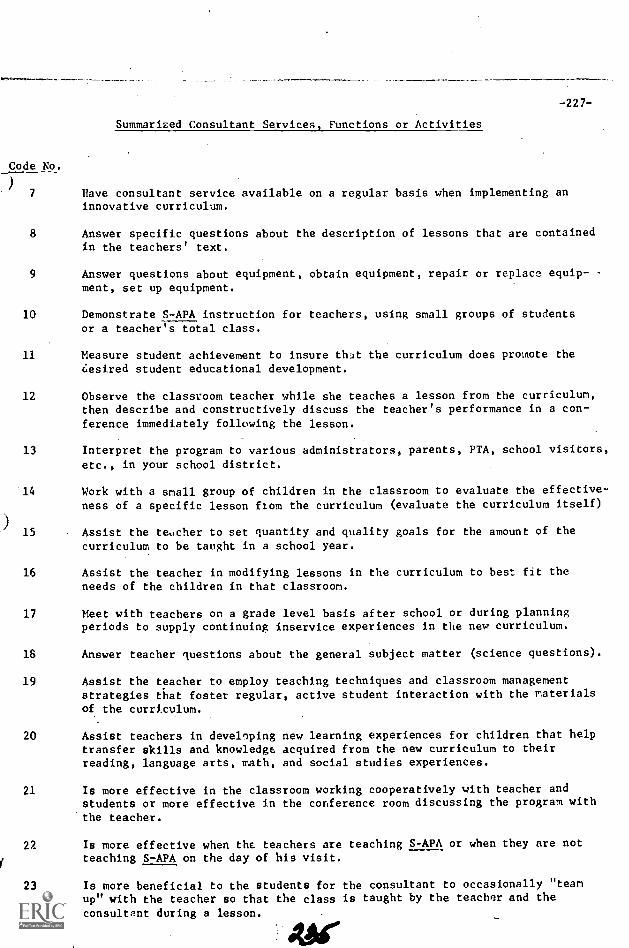
Code No.
)
-227-
Summarized Consultant Services, Functions or Activities
Have consultant service available on a regular basis when implementing aninnovative curriculum.
8 Answer specific questions about the description of lessons that are containedin the teachers' text.
9 Answer questions about equipment, obtain equipment, repair or replace equip-ment, set up equipment.
10 Demonstrate S-APA instruction for teachers, using small groups of studentsor a teacher's total class.
11 Measure student achievement to insure that the curriculum does promote the6esired student educational development.
12 Observe the classroom teacher while she teaches a lesson from the curriculum,then describe and constructively discuss the teacher's performance in a con-ference immediately following the lesson.
13 Interpret the program to various administrators, parents, PTA, school visitors,
etc., in your school district.
14 Work with a small group of children in the classroom to evaluate the effective-ness of a specific lesson from the curriculum (evaluate the curriculum itself)
Assist the teacher to set quantity and quality goals for the amount of thecurriculum to be taught in a school year.
16 Assist the teacher in modifying lessons in the curriculum to best fit theneeds of the children in that classroom.
17 Meet with teachers on a grade level basis after school or during planningperiods to supply continuing inservice experiences in the new curriculum.
) 15
18 Answer teacher questions about the general subject matter (science questions).
19 Assist the teacher to employ teaching techniques and classroom managementstrategies that foster regular, active student interaction with the materialsof the curriculum.
20 Assist teachers in developing new learning experiences for children that helptransfer skills and knowledge acquired from the new curriculum to theirreading, language arts, math, and social studies experiences.
21 Is more effective in the classroom working cooperatively with teacher andstudents or more effective in the conference room discussing the program withthe teacher.
22 Is more effective when the teachers are teaching S-APA or when they are notteaching S-APA on the day of his visit.
23 Is more beneficial to the students for the consultant to occasionally "teamup" with the teacher so that the class is taught by the teacher and the
consultant during a lesson.
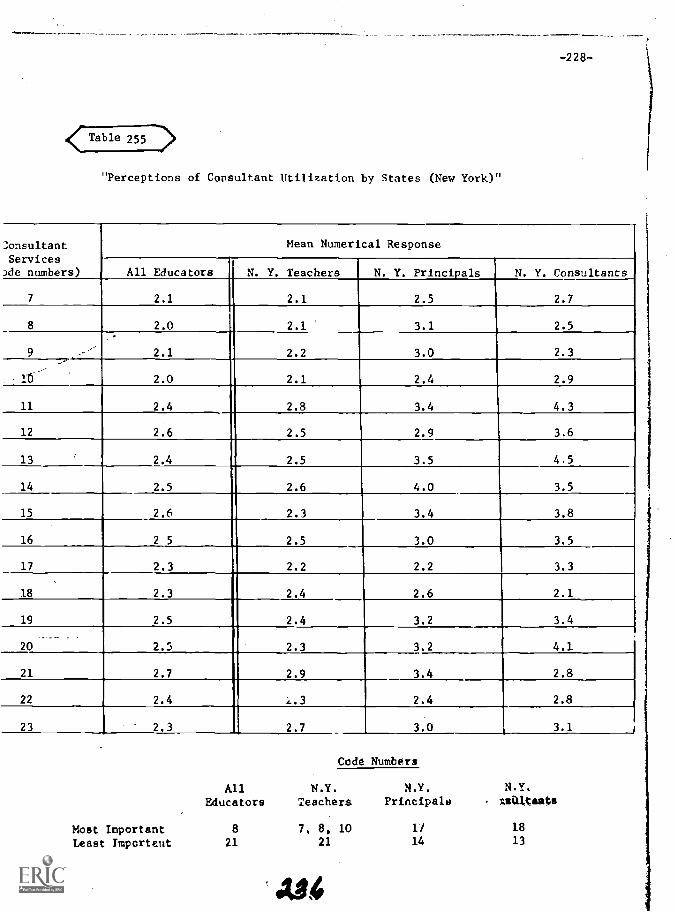
-228-
Table 255 3>
"Perceptions of Consultant Utilization by States (New York)"
:onsultantServices
ade numbers)
Mean Numerical Response
All Educators N. Y. Teachers N. Y. Principals N. Y. Consultants
7 2.1 2.1 2.5 2.7
8 2.0 2.1 3.1 2.5
9 2.1 2.2 3.0 2.3
10 2.0 2.1 2.4 2.9
11 2.4 2.8 3.4 4.3
12 2.6 2.5 2.9 3.6
13 2.4 2.5 3.5 4.5
14 2.5 2.6 4.0 3.5
15 2.6 2.3 3.4 3.8
16 2 5 2.5 3.0 3.5
17 2.3 2.2 2.2 3.3
18 2.3 2.4 2.6 2.1
19 2.5 2.4 3.2 3.4
_ ._.
20 2.5 2.3 3.2 4.7
21 2.7 2.9 3.4 2.8
22 2.4 ',..3 2.4 2.8
23 2.3 2.7 3.0 3.1
Code Numbers
All N.Y. N.Y. N.Y.
Educators Teachers Principals taattalts
Most Important 8 7, 8, 10 11 18
Least Important 21 21 14 13

Summarized Consultant Services, Functions or Activities
-229-
Code No.
)
7 Have consultant service available on a regular basis when implementing aninnovative curriculum.
8 Answer specific questions about the description of lessons that are containedin the teachers' text.
9 Answer questions about equipment, obtain equipment, repair or replace equip-ment, set up equipment.
10 Demonstrate S-APA instruction for teachers, using small groups of studentsor a teacher's total class.
Measure student achievement to insure that the curriculum does promote thedesired student educational development.
12 Observe the classroom teacher while she teaches a lesson from the curriculum,then describe and constructively discuss the teacher's performance in a con-ference immediately following the lesson.
13 Interpret the program to various administrators, parents, PTA, school visitors,etc., in your school district.
14 Work with a small group of children in the classroom to evaluate the effective-ness of a specific lesson from the curriculum (evaluate the curriculum itself)
15 Assist the teacher to set quantity and quality goals for the amount of thecurriculum to be taught in a school year.
16 Assist the teacher in modifying lessons in the curriculum to best fit theneeds of the children in that classroom.
17 Meet with teachers on a grade level basis after school or during planningperiods to supply continuing inservice experiences in the new curriculum.
18 Answer Leacher questions about the general subject matter (science questions).
19 Assist the teacher to employ teaching techniques and classroom managementstrategies that foster regular, active student interaction with the materialsof the curriculum.
20 . Assist teachers in developing new leaning experiences for children that helptrannfer skills and knowledge c.cquired from the new curriculum to theirreading, language arts, math, and social studies experiences.
21 Is more effective in the classroom working cooperatively with teacher andstudents or more effective in the conference room discussing the program withthe teacher.
22 Is more effective when the teachers are teaching S-APA or when they are notteaching S-APA on the day of hie visit.
23 Is more beneficial to the students for the consultant to occasionally "teamup" with the teacher so that the class is taught by the teacher and theconsultant during a lesson.
A7
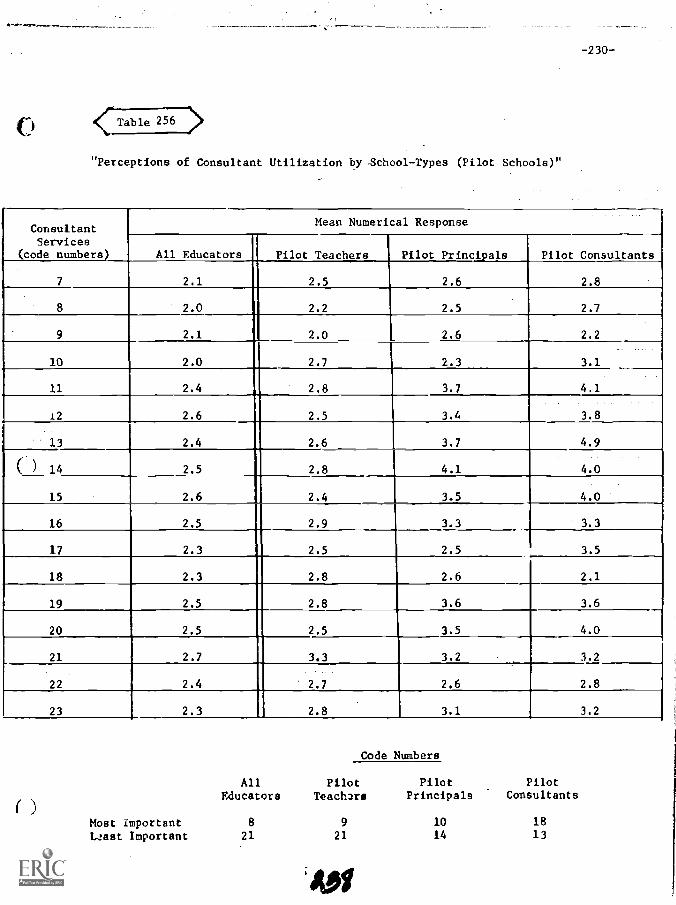
-230--
Table 257)
"Perceptions of Consultant Utilization by School-Types (Pilot Schools)"
ConsultantMean Numerical Response
Services(code numbers) All Educators Pilot Teachers Pilot Principals Pilot Consultants
7 2.1 2.5 2.6 2.8
8 2.0 2.2 2.5 2.7
9 2.1 2.0 2.6 2.2
10 2.0 2.7 2.3 3.1
11 2.4 2.8 3.7 4.1
2.6 2.5 3.4 3.8
13 2.4 2.6 3.7 4.9
) 14 2.5 2.8 4.1 4.0
15 2.6 2.4 3.5 4.0
16 2.5 2.9 3.3 3.3
17 2.3 2.5 2.5 3.5
18 2.3 2.8 2.6 2.1
19 2.5 2.8 3.6 3.6
20 2.5 2.5 3.5 4.0
21 2.7 3.3 3.2 3.2
22 2.4 2.7 2.6 2.8
23 2.3 2.8 3.1 3.2
Code Numbers
All Pilot Pilot PilotEducators Teachers Principals Consultants
Most important 8 9 10 18
Uast Important 21 21 14 13
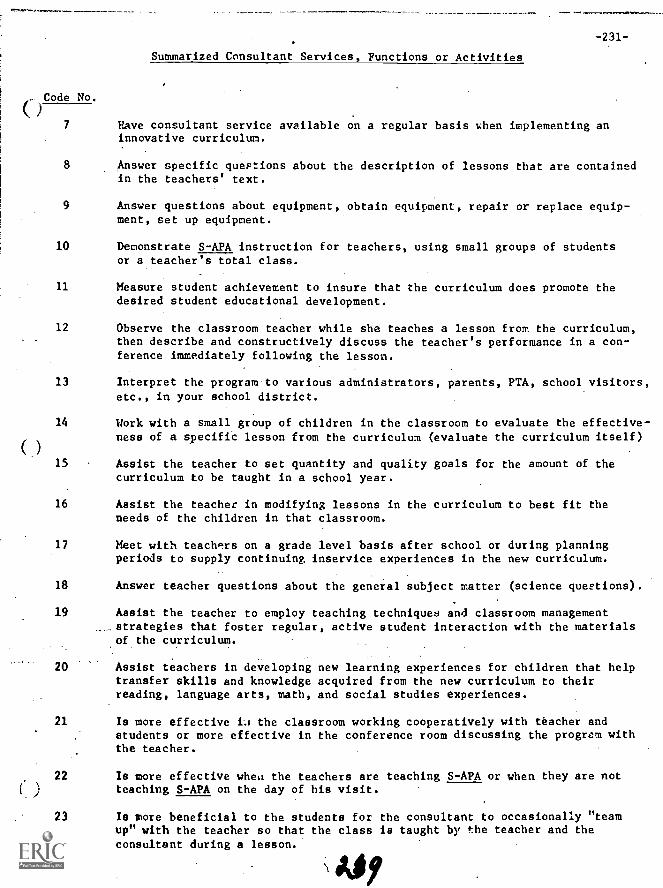
Summarized Consultant Services, Functions or Activities
, Code No.
-231-
7 Have consultant service available on a regular basis when implementing aninnovative curriculum.
8 Answer specific questions about the description of lessons that are containedin the teachers' text.
Answer questions about equipment, obtain equipment, repair or replace equip-ment, set up equipment.
10 Demonstrate S-APA instruction for teachers, using small groups of studentsor a teacher's total class.
11 Measure student achievement to insure that the curriculum does promote thedesired student educational development.
12 Observe the classroom teacher while she teaches a lesson from the curriculum,then describe and constructively discuss the teacher's performance in a con-ference immediately following the lesson.
13 Interpret the program to various administrators, parents, PTA, school visitors,etc., in your school district.
14 Work with a small group of children in the classroom to evaluate the effective-
)
ness of a specific lesson from the curriculum (evaluate the curriculum itself)
15 Assist the teacher to set quantity and quality goals for the amount of thecurriculum to be taught in a school year.
16 Assist the teacher in modifying lessons in the curriculum to best fit theneeds of the children in that classroom.
17 Meet with teachers on a grade level basis after school or during planningperiods to supply continuing inservice experiences in the new curriculum.
18 Answer teacher questions about the general subject matter (science questions).
19 Assist the teacher to employ teaching techniques and classroom managementstrategies that foster regular, active student interaction with the materialsof the curriculum.
20 Assist teachers in developing new learning experiences for children that helptransfer skills and knowledge acquired from the new curriculum to theirreading, language arts, math, and social studies experiences.
21 Is more effective in the classroom working cooperatively with teacher andstudents or more effective in the conference room discussing the program withthe teacher.
22 Is more effective when the teachers are teaching S-APA or when they are not
( ) teaching S-APA on the day of his visit.
23 Is more beneficial to the students for the consultant to occasionally "teamup" with the teacher so that the class is taught by the teacher and theconsultant during a lesson.
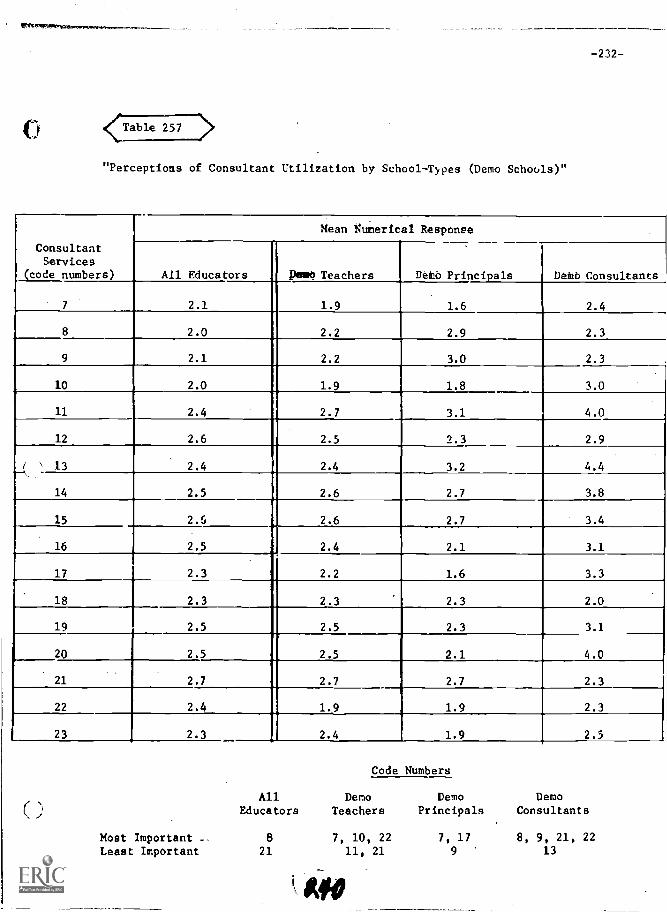
-232-
<Table 257 >
"Perceptions of Consultant Utilization by School-Types (Demo Schools)"
ConsultantServices
(code numbers)
Mean Numerical Responee
All Educators peso Teachers Deft Principals
1.6
DAMO Consultants
2.47 2.1 I 1.9
8 2.0 1 2.2 2.9 2.3
2.1 1 2.2 3.0 2.3
10 2.0 1.9 1.8 3.0
11 2.4 2.7 3.1 4.0
12 2.6 2.5 2.3 2.9
4 13 2.4 2.4 3.2 4.4
14 2.5 1 2.6 2.7 3.8
15 2.6 1 2.6 2.7 3.4
16 2.5 2.4 2.1 3.1
17 2.3 2.2 1.6 3.3
18 2.3 2.3 2.3 2.0
19 2.5 I 2.5 2.3 3.1
20 2.5 2.5 2.1 4.0
21 2.7 2.7 2.7 2.3
22 2.4 1.9 1.9 2.3
23 2.3 2.4 1.9 2.5
Most Important _-Least Important
Code Numbers
All Demo Demo DemoEducators Teachers Principals Consultants
8 7, 10, 22 7, 17 8, 9, 21, 2221 11, 21 9 13
MD
( )
0
APPENDIX
The points elaborated upon and the data tablespresented in this report are only a few of many thatcan be extracted from the multitude of existingpossibilities. Because of economic and time constraints,the data have not been presented as a result of stringentand sophieticated statistical treatments. This appendixhas been provided for those who wish to pursue a morethorough comprehensive study. The appendix containsthe original questionnaires administered to teachers,principals and consultants. One will also find copesof the initial computer printouts associated with theresponses of teachers, principals and consultantsdelineating sum of squares, means, standard deviations,number of individuals, and variances.
-233-
-234-
questionnaire and Computer Printout
"Consultant Utilization Preferences"
(Teachers)
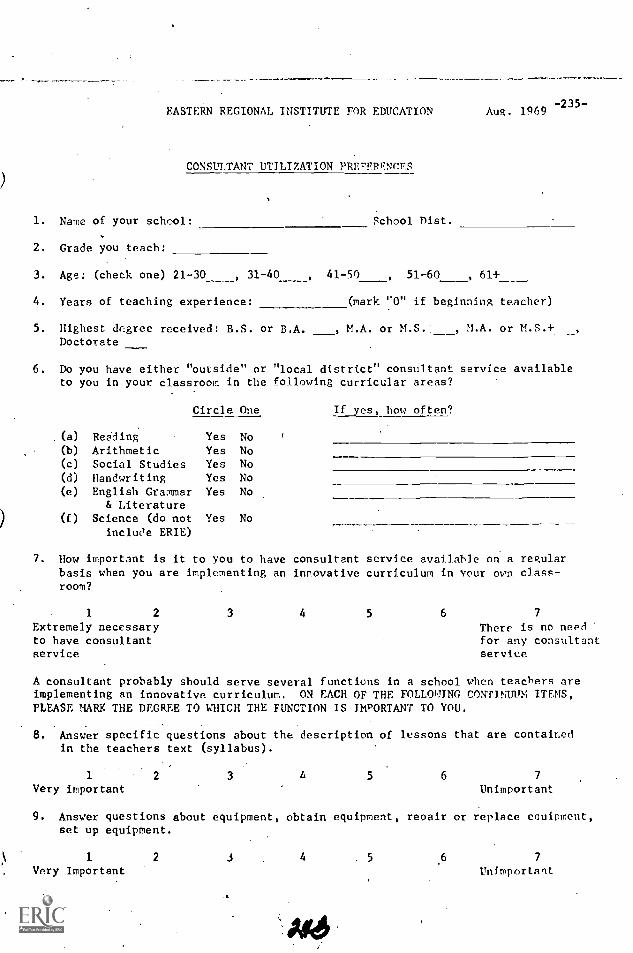
EASTERN REGIONAL INSTITUTE FOR EDUCATION
CONSULTANT UTILIZATION PRErFRENCFS
1. Name of your school:
2. Grade you teach:
School fist.
Aug. 1969-235-
3. Age: (check one) 21-30 , 31-40 , 41-50 , 51-60 ,
4. Years of teaching experience: (mark "0" if beginning teacher)
5. Highest degree received: B.S. or B.A. , M.A. or M.S."__, M.A. or M.S.+Doctorate
6. Do you have either "outside" or "local district" consultant service availableto you in your classroom in the following curricular areas?
Circle One If yes, how often?
. (a) Reading Yes No(b) Arithmetic Yes No(c) Social Studies Yes No(d) Handwriting Yes No(e) English Grammar Yes No
& Literature(f) Science (do not
include ERIE)Yes No
7. How important is it to you to have consultant service available on a regularbasis when you are implementing an innovative curriculum in your own class-room?
1 2
Extremely necessaryto have consultantservice
3 4 5 6 7
There is no needfor any consultantservice
A consultant probably should serve several functions in a school when teachers areimplementing an innovative curriculum. ON EACH OF THE FOLLOWING CONTINUM ITEMS,PLEASE MARX THE DEGREE TO WHICH THE FUNCTION IS IMPORTANT TO YOU.
. Answer specific questions about the description of lessons that are containedin the teachers text (syllabus).
1 2 3 6 5 6 7
Very important Unimportant
9. Answer questions about equipment, obtain equipment, repair or replace eouipment,set up equipment.
1 2 3 4
Very Important5 6 7
Unimportant
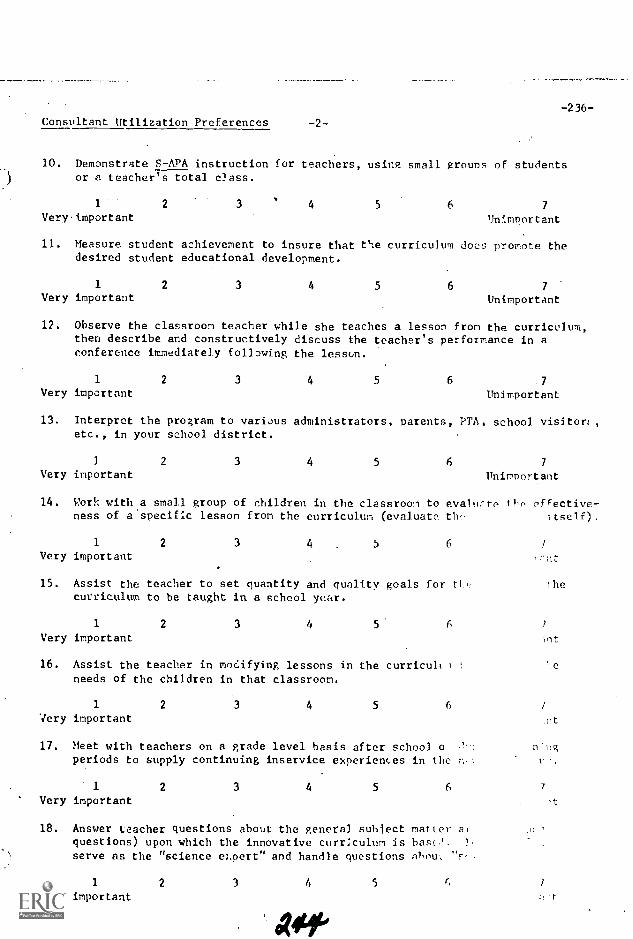
-236-Consultant Utilization Preferences -2-
10. Demonstrate S-APA instruction for teachers, using small groups of studentsor a teacher's total c?ass.
1
Very)important2 3 4 5 6 7
Unimportant
11. Measure student achievement to insure that the curriculum does promote thedesired student educational development.
1
Very important2 3 4 5 6 7
Unimportant
12. Observe the classroom teacher while she teaches a lesson from the curriculum,then describe and constructively discuss the teacher's performance in aconference immediately following the lesson.
1
Very important2 3 4 5 6 7
Unimportant
13. Interpret the program to variJus administrators, parents, PTA, school visitor:,etc., in your school district.
1
Very important2 3 4 5 6 7
Unimportant
14. Work with a small group of children in the classroom to evaluate the effective-ness of a 'specific lesson from the curriculum (evaluate thy) itself).
1
Very important2 3 4 5 6
15. Assist the teacher to set quantity and quality goals forcurriculum to be taught in a school year.
1 2 3 4 5
Very important
16. Assist the teacher in mo6ifying lessons in the curricula t
needs of the children in that classroom.
1 2 3 4 5 6
Very important
17. Meet with teachers on a grade level basis after school operiods to supply continuing inservice experiences in the r,
1 2 3 4 5 6
Very important
18. Answer teacher questions about the general suhiect natter a)questions) upon which the innovative curriculum is base{. 1
serve as the "science eLpert" and handle questions AT,ntiL "Fe
1
Very important2 3 4 5
the
int
Le
7
it
7
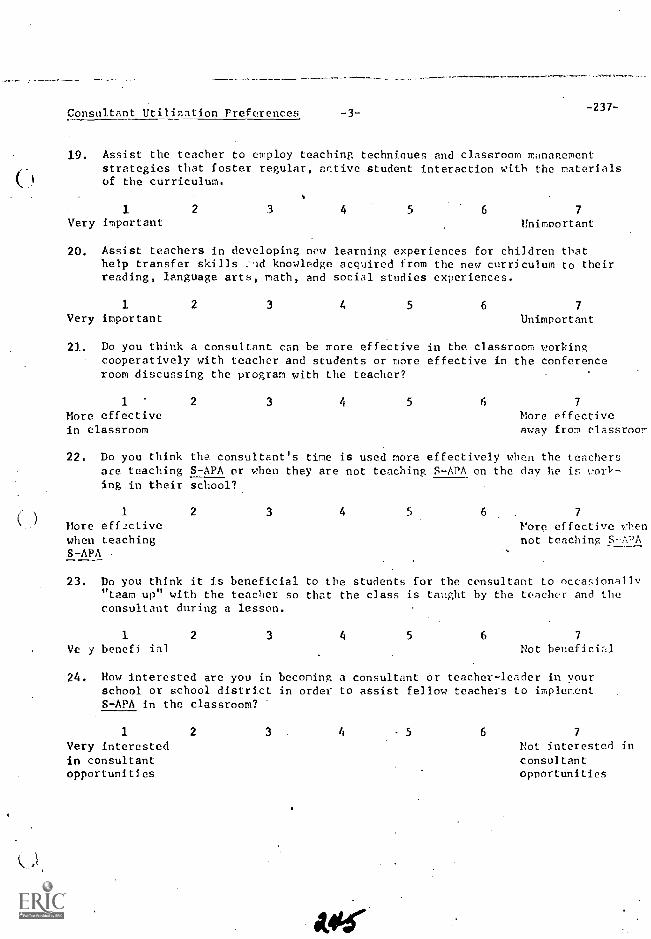
)
Consultant Utilization Preferences -3--237-
19. Assist the teacher to employ teaching technicues and classroom managementstrategies that foster regular, active student interaction with the materialsof the curriculum.
1
Very important2 3 4 5 6 7
Unimportant
20. Assist teachers in developing new learning experiences for children thathelp transfer skills :Ad knowledge acquired from the new curriculum to theirreading, language arts, math, and social studies experiences.
1
Very important2 3 4 5 6 7
Unimportant
21. Do you think a consultant can be more effective in the classroom workingcooperatively with teacher and students or more effective in the conferenceroom discussing the program with the teacher?
1 2
More effectivein classroom
3 4 5 6 7
More effectiveaway from classroom
22. Do you think the consultant's time is used more effectively when the teachersare teaching S-APA or when they are not teaching S-APA on the day he is worv-ing in their school?
1
More eff2ctivewhen teachingS-APA
2 3 4 7
Yore effective whennot teaching S-APA
23. Do you think it is beneficial to the students for the consultant to occasionally"team up" with the teacher so that the class is taught by the teacher and theconsultant during a lesson.
1 2 3 4 5 6 7
ye y benefi ial Not beneficial
24. Now interested are you in becoming a consultant or teacher-leader in yourschool or school district in order to assist fellow teachers to implementS-APA in the classroom?
1 2 3 . 4 5 6 7
Very interested Not interested inin consultant consultantopportunities opportunities
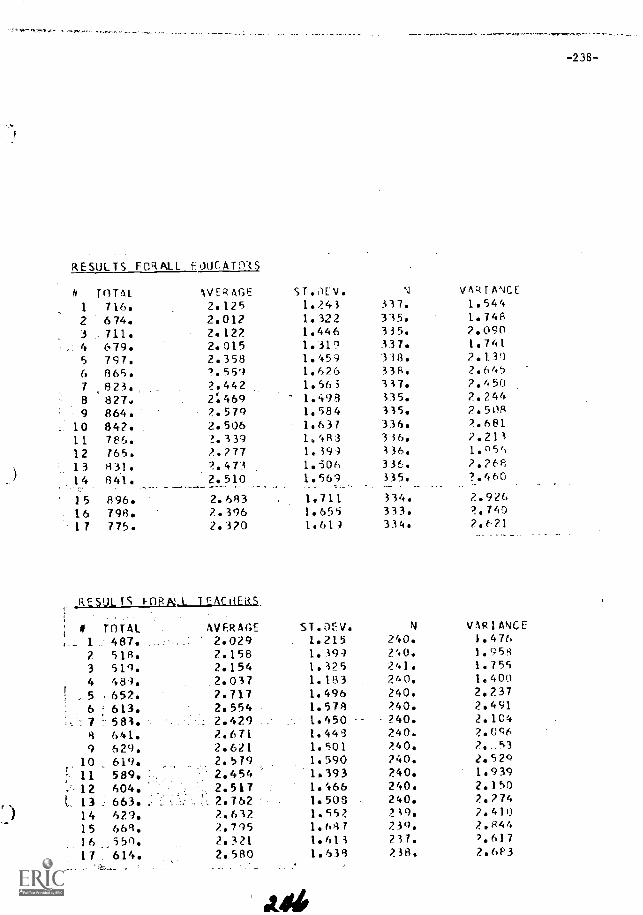
RESULTS FURALL FOICATM$
ST.OEV. VARIANCETOTAL AVERAGE1 716. 2.125 1.243 337. 1.5442 674. 2.012 1.322 335. 1.7483 711 2.122 1.446 335. 2.0904 679. 2.015 1.319 337. 1.7415 797. 2.358 1.459 338. 2.1306 865. 559 1.626 338. 2.6457 823. 2.442 1.56 337. 2.4508 8274 2:469 1.498 535. 2.2449 864. 2.579 1.584 335. 2.508
10 842. 2.506 1.637 336. 2.68111 786. x.339 1. 483 336. 2.21312 T65. 2.277 1. 399 336. 1.95'13 831. 473 1.506 336. 2.26814 841. 2.510 1.569_ . 335. ?.460
/ 5 896. 2. 683 1.711 334. 2.92616 798. 2.396 1.655 333. 2.7401 7 775. 2.370 1.61: 334. 2.671
RESULTS FORAIL TEACHFRS
: 0 TOTAL1 487.2 518.3 519.4 489.5 652.6 ' 613.
583.8 641.9 629.
10 619.11 589.12 604.
( 13 : 663.14 627.15 668.16 550.17 614.
AVER AGE STDEV. VARIANCE2.029 1.215 240. 1.4762.158 1. 39-9 240. 1.9582.154 1.325 241. 1.7552.037 1.183 240. 1.4002.717 1.496 240. 2.237
2.554 1.578 740. 2.491
2.429 1.450 240. 2.1042.671 1.449 240. 2.0q62.621 1.501 740. 7.-532.579 1.590 240. 2.52Q2.454 1.393 240. 1.9392.517 1.466 240. 2.1502.762 1.503 240. 2.774
2.632 1.552_ 739. 7.4102.775 1.687 23g.2.321 1.613 231. 7.6172.580 1.639 238. 2.683
It"
-238-
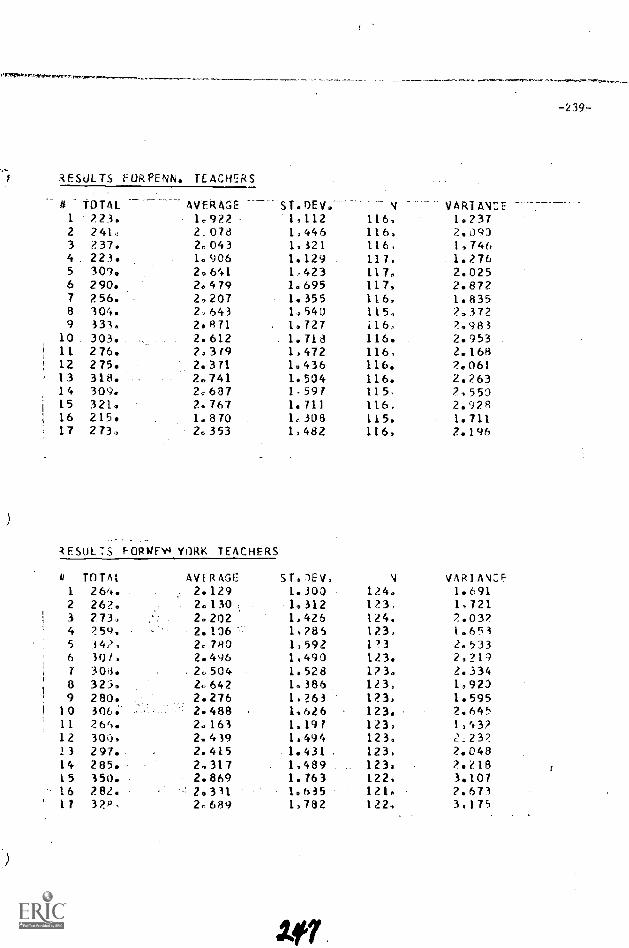
-239--
RESULTS FORPENN. TEACHERS
N VAR1AN:E4 TOTAL AVERAGE1 223. 1.922 1,112 116, 1.2372 241, 2.078 1)446 116, 2.0933 237. 2.043 1,321 116, 1,7464 223. 1.906 1.129 117, 1.2765 309. 2.641 1.423 117, 2.0256 290. 2.479 1.695 117, 2.8727 256. 2,207 1.355 116. 1.8358 304. 2,643 1.540 115, ?.3729 333. 2.871 1.727 i16, ?,983
10 303. 2.612 1.718 116. 2.95311 276. 2.319 1,472 116, 2.16812 275. 2.371 1.436 116. 2.06113 318. 2.741 1.504 116. 2.26314 309. 2.:687 1,59/ 115, 2,55015 321, 2.767 1.711 116. 2.92816 215. 1.870 1,308 115. 1.71117 273, 2.353 1)482 116. 2.196
RESULTS FORV/Pel YORK TEACHERS
TOTAL AVI RAGE ST,DEV, I VARIANCEI 264. 2.129 1.300 124. 1.6912 262. 2.130 1,312 123, 1,7213 273., 2.202 1.426 124. 2.0324 259, 2.116 1.285 123, 1.6535 34,2, 2.,780 1,592 1?3- 2.5336 301, 2.496 1,490 123. 2,2137 303. .2o504 1.528 123. 1.3348 325, 2,,642 1.386 123, 1,9209 280. 2.276 1,263 123, 1.595
ID 306. 2.488 1.626 123. 2.64511 266. 2.163 1.197 123, 1,43212 300, 2.439 1,494 123, 2=23213 297. 2.415 1.431 123, 2.04814 285. 2.317 1,489 123. 2.21815 350. 2.869 1.763 122. 3.10716 282. 2.331 1.635 121. 2.67317 32g. 2.689 1,782 122, 3,175
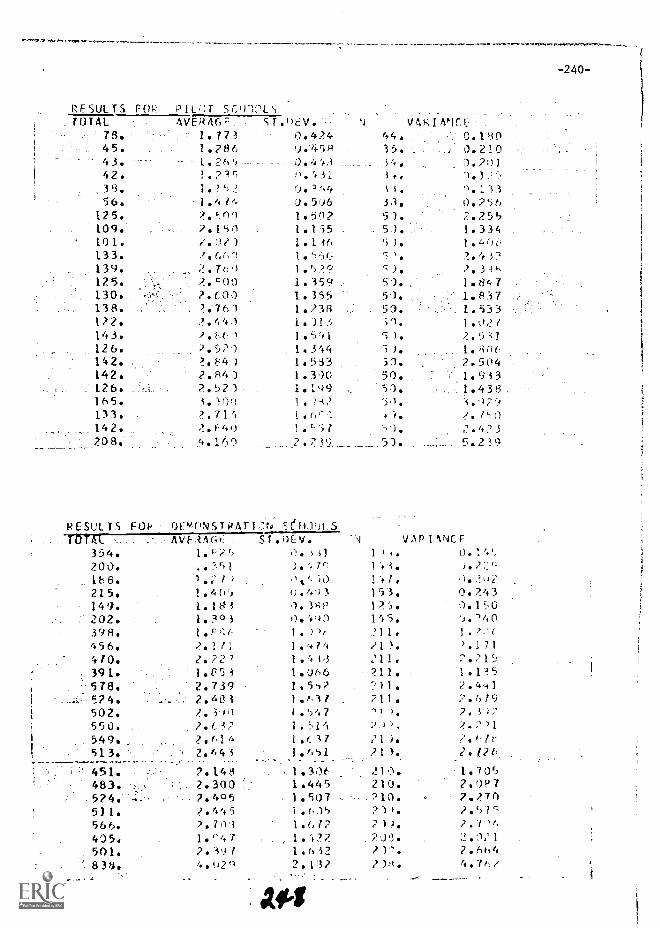
..
0'4'2354. 1.25 0. t1 1 ) #. .1
.?:]('200. ,:',',1 ,.).41() 1 .1-.3 .
1118. 1.2/4 04450 141.15
i'1
.
?i,2.31
215. 1.405 0.404 0.24303 1. 3+P 25. 0.150149. 1.1
202. 1. ?03 0.490 145. 9.'140
398. 1.!: 1. )).' 1.7,,l
456. 2.1/1 ,'111):
410. 2..2271.4./41.44,3 ,211.
;.,..'..?1171
391. 3.053 1.066 ?.11. l 12.5 !
2.6831.5? 24411.e.,lt 211. 2.579
578. 2.739 3)1.
I .5'.?
;??,"'.)5504 74,7?..i'Vt
1. 51'. 7.) ),
502. -,1 ,,
C 37 21 1.
513. ' 2.443 1.651 21). .
549. 2.614 1.
,,. - ... - ----- -------..-....-- - - - .
2.126
H 451. . ,.r.:- 2.143 : ,.1.306 210. 1.705483. :: '- -: 2.300 '," 1.445 210.
210.2,0?7
15 23511. 2.445 .3. 7.270574. -.4,0 ,-2.4O5
7,701566. 1.677 ,2)?. :,1.=6
405. 1.°47 . 1.422 203. .N 12
501. 2.'4,91 1.532 211. 2.6644.762838. 4.020 2.132 2 )o.
_._...., . ',' , ... . ...-- ____-
RESULTS FO. PILM- S(:UT,ILSN VNRIANC.ETOTAL AVER/16F ST.0EV.
',.78. :'-': : :- 1.773 0.424 44. ''. 0.18045. 1.786 14-458 35. ', - ., 3.21043. 1.26'9 1).444 34. 0.20142. 1.7 0.43138. 1.1')2 0.1/,4 li. °.11356. -1.474 0.506 30. 0.256
125. 2.500 1.59? 51. 2.25h109. . 2.150 1.135 51..- 1.334101. /..9,fl i..l 16 ,;).
133. 1.7(,0 1.,4.40 ''.''. 2.433
--.
139. - 2 -760 1.'329 ;3. 315125. ' 2.500 1.359 53. 1.847130. '..H: 2.700 1.355 51.138. . 2.761 1.238 50. :" H:._ 1,533122. 2.441 1.113 il. 1.0271 4 3 . ' ,0 1.41 51. 2.531126. 2.523 1.344 " _ 1.807142. 2.e4) 1.533 31. 2.504142. 2.843 1.300 50. ''' 1.933126. 2.521 1.109 51. .1.,438165. 4.303 1.02 51,
133. 2.714 1.0:: +). ?.0-10142. 2. !"'40 1 .'-'5 / S i. 2.4? 3208. 4.1/03 2 .239, 53. _ ___:___ 5.239
RESULTS FOP 0EY3NSTRAT12N n1104STDTAI. ..... AVEtL SI.OEV. 'A IJAPII,NCF
-240-
114
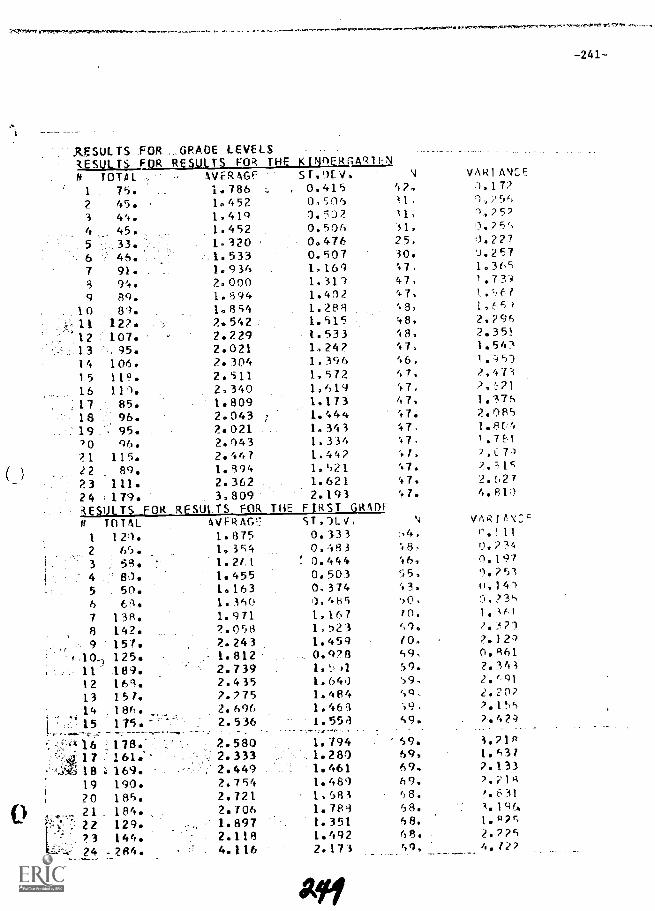
Z,112V4.1,
:
RESULTS .FOR , , GRAOE LEVELSRESULTS FOR RESULTS FOR THE K INMEROAR 1 FN
R TOTAL AVak4GF S T,F)E V. \I VAR] AN',...E
1 75. La 786 - . 0.415 '.2. ,1,1722 45. 1.452 0.,505 U. 1,25,.3 44. 1,419 0.502 31, -1,2524 45. 1,452 0.506 31. '1.25',5 33. 1.320 0.476 25, '1.2276 46. 1.533 0.507 30. 0.2577 91. 1.936 1.169 +7, 1.3653 94. 2.000 1,319 47, 1.7349 89. 1.994 1.411 +7, 1.'4 ,
10 81. 1,1354 1.283 +8 1,65-111 122 2.542 1.515 48, 2,79512 107. 2.229 1.533 48. 2.35313 - 95. 2.021 1,242 47, 1.54114 106. 2.304 1.396 46. 1.=.059
15 113 2.511 1.572 +7. 2.'17316 1143. 2,340 1.619 +7, 2,'_,71
17 85. 1.809 1,173 47, 1.376,18 96. 2.043 : 1.444 +7. 2.0.8519 95.'0 96.
2.0212.043
1.343 47,1.334 +7
1.8C+3.7161
21 115. 2.447 1.44? + I, ? ,C 7.1
12 89. 1.894 1. '.2 1 '4-7+ 2, 31c23 111. 2.362 -: 1.621 +7. 2.62724 ; 179. 3,809 2.193 47. 4. R 11
RESAT'S FOR RESULTS FOR THE FIRST GRADEP TOTAL AVFR AG': S7,71._C N VAP,10",t,:'
1 121. 1.875 0.333 :.4. 0.1112 65. 1.354 0.483 48, 0.2-84
3 . 58(4 1.21.1 ! 0.444 '.16, (1,197
4 8). 1.455 0.503 55. /). 251
5 50. 1.163 0.374 +3. ".14115 68. 1.360 0,4115 60, !). ?3,,
7 138. 1.971 1.167 70. 1. 36,1
8 142 2.058 1,723 '194 2....12)
9 157. 2.243 1.459 (0, 2.12110, 125. 1.812: 01. 928 59, 0, 861
11 189. 2.739 1.1', j1 69. 2.34312 168. 2.4 35 1, 640 i9, 2. (.91
13 157. 2.275 1.484 ..,9, 2.20714 18. 2. 696 1.468 '19. 21615 175. 2.536_ .. _.. 1.558 59.
.2.42)
.
14 i 76' 2.580 11794 59. 3.21°17 : 161. 2.333 : 1.280 69, l 63118 .;:, 169. 2.449 : 1 461 69, 2.13319 190. 2.754 1.489 69. 2. 2 18
20 185. 2.721 1,683 58. ?,63121 184 2.706 1.783 68. 3.1(46.
22 129. 1.897 1.351 48. 1..87C
73 144. 2.118 1.492 68. 2.72524 .2R4. 4.116 2.173 59, 4.77
Aft
-241-
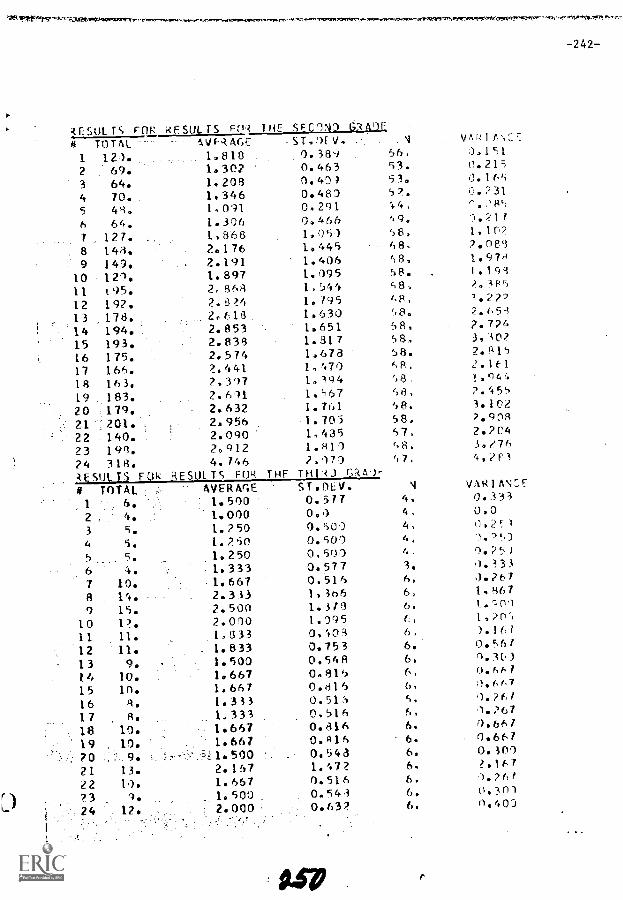
r)
4FSO1 iS FOR RESULTS cm THE SECT4) G'49E# TOTAL AYf-RA64- ST,IFV1 12). 1.818 0.389
2 69. 1.302 0.463
3 64. 1.208 0.40)
4 70. 1.346 0.483
5 48. 1,091 0,291
6 64. 1.316 0,466
7 127. 1,863 1,05)
8 148. 2.176 1.445
9 149. 2.191 1.406
10 129. 1.897 1.195
11 t95. 2.861 1.544
12 192. 2.826 1.795
13 178. 2.618 1.63014 194. 2.853 1.651
15 193. 2.838 1.317
16 175. 2.574 1.678
17 166. 2.441 1,470
18 163. 7.397 1.194
19 183. 2.611 1.567
20 179. 2.632 1.7f.1
21 201. 2.956 1.705
22 140. 2.090 1,435
23 198. 2.912 1.811
24 318. 4.746 7,17)2SIJTSF-1494 TOTAL AVERAr.F. ST. nv.
1.500 0.5771.000 0.01.250 0.5J)1.250 0.5001.250 0.5001.333 0.577
1 6.
2 4.
3 5.
4 5.
5.
7 10. 1.667 0.5148 14. 2.3.33 1,166
9 15. 2.500 1.373
10 12. 2.010 1.395
11 11. 1.333 0,401
12 11. 1.833 0.753
13 9. 1.500 0.548
14 10. 1.667 0.814
15 10. 1.667 0.814
16 1, 1.333 0.515
17 8, 1.133 0,516
18 10. 1.667 (Lew.
19 10. 1.667 0.116
70 9. z41.500 0.548
21 13. 2.147 1.472
22 10. 1.667 0.516
23 9. 1.500 0.543
24 12, 2.000 0.632
rvr,+p1_rcvr-,m,r,ITfe'MV,P't
-242-
4 vAkTr4Cr66. 0.15153. 0.21553. 0.16552. 6.23144, 9.08',
',9. 1.21r
58. 1.1f17
48, 7.0695 8, 1.97d58. 1.19158, ?.185f,8, 1.227',8., 2.65'1
58. 2.72458, 3.A0258. 2.815(), 2.1i-1
58 1.94458, ,.45558. 3.10258, 7.90857, 2.2C458. 3.?7657, 4..)F 1
4 VIR1AN:F4, 0.13;4, 0.04, 1125)4, 1.75)4 0.25 /
3. 0.A336, 0.2676, 1,8676. 10'101
e. 1,,rr,
6, 1.1(,7
6. 0.56(6. 1.1G)6, 0.4676, ). 41.7
6, 0.7( /
6, 1.2676. 0.6676. 0.6676. 0.3096, ?.1676. 0.7676 0.016. 0.40J
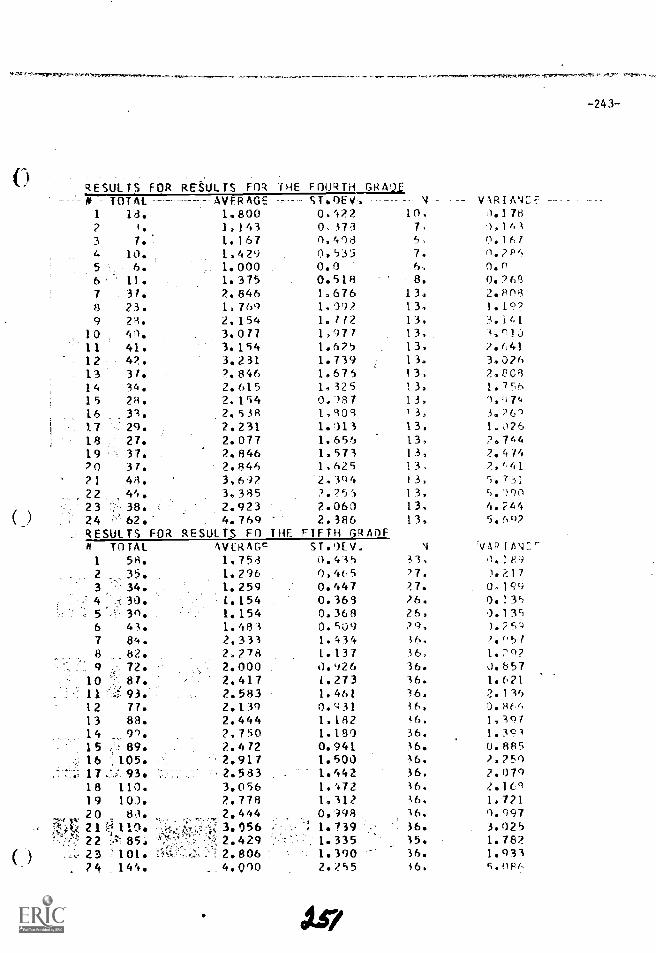
RESULTS FoR RESULTS FOR THE FOURTH G1.....21.21,
N TOTAL AVER AGE ST.OEV.1 13. 1.800 0,4722 1. 1,143 0, 3733 7. 1.167 0,40134 10. 1,429 0,5355 6. 1. 000 0.06 11. 1.375 0.5187 31. Z. 846 1.6768 23. 1,769 1.0979 2.. 2. 154 1. 112
10 10. 3.077 1,97711 41. 3. 154 1.62512 42. 3.2 31 1.73913 31. '.846 1.67514 34. 2.615 1.32515 28. 2.154 0.38716 31. . ? 538 1,30817 29. 2.231 1.11318 27. 2.077 1.65619 37. 2. 846 1.57320 37. 2.846 1.62521 48. 3,697. 2. 39622 44. 3,385 2. ?5()23 :.,*:--. 38. 2.923 2.060
( ) 24 ''' 62. 4. 769 2. 386.:., RESULTS FOR RESULTS FO THE FIFTH GRAOF
(_ )
M TOTAL AVERAW7 ST.1EV,1 58. 1.758 0.4352 35. 1.296 0, 4653 ' 34. 1.259 0.4474 :f; 30. 1.154 0.3635 ::' 3n. 1.154 0,3686 414 1.483 0.5097 84. ).33.3 1.4348 82. 2.218 1.131
.. 72. 2.000 0.92610 ::". 87. 2.417 1.27311 z:,''' 93. 2.583 1.46112 77. 2.139 0.93113 88. 2.444 1,18214 9'). 2.750 1.18015 ..:. 89. 2. 472 0.94116 ';105. 2.917 1.50017 :,;.' 93. 2.583 1.44218 110. 3.056 1.'.7219 100. 2.778 1,31220 10. 2.444 0.99821 q 11% 3.056 1.73922 :85, 2.429 1.33523 .'101 :" 2.806 1.390 -'24 144. 4.090 2.255
'4 VARIAN:5F10. 0.178
7, 0,1416-, 0.1() /7. n.?P46, n.n8. O.. 2IY9
13. 2.80813. 1.1c)*)13. -3.. i 4113, 3,r1,1)13, 7.(J4113. 3.02613, 2,0O 113. 1.74613, 9.974!3, 3076113. 1. 02613, 7,74413, 2.41413. 7. (4113, 5.71.ci13, 5.99913. 4,24413, 5.602
,4 'VAPE/4.7.'
33, '1.1 1-', q'77. 3.2_1777. 0.16976,4 0.13526, 0.13579, ).75"-)36. ?.°5736, 1.70236. 0.85736. 1.62136, 2.13436, ),86616. 1,39736. 1.39136. 0.88536. ).25036, 2.07936. . 1 (.836. 1.72116. 9.09736. 3.02535. 1.78236. 1.933i6. 5.0Pe%
-243-
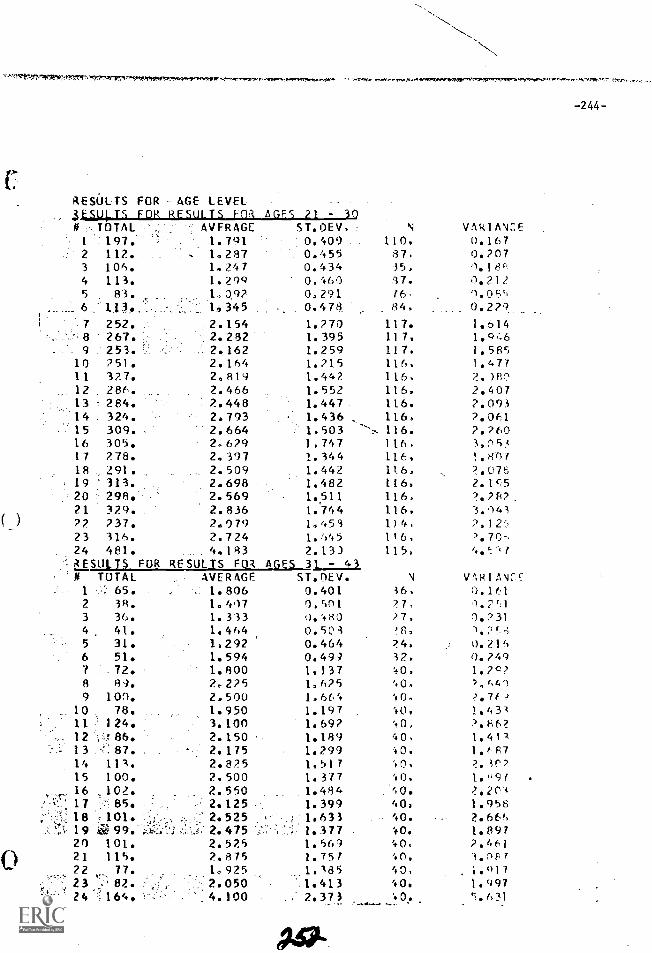
''')'-1.1VIrs.rmr,,,,,,,,w,p,o.rvexrm.
RESULTS FOR AGE LEVEL4iSUI,TS FOR RFSUI TS FOR AGFS 71 30N TOTAL :'; AVERAGE ST.OEV, , N VARJANZE
1 :197. ' 1.791 f, 0.609 110. 0.1672 112. , 1.287 0.455 87, 0.2073 104. 1.247 0.434 351 0.18P4 113. 1.299 0.460 37, 0.2125 83. 1.0.97 0,291 76, 9,05c,
.--- 6- WIP-. 4/ 345 0.478, 84, 0.2791 7 252. 2.154 1.270 117. 1.614
8 267. 2.282 1. 395 11 7. 1.9469 253. 1 ,. 2.162 1.259 117.
10 2514 2.164 1.215 11431.5851,477
1.44211 327. 2,819, 116,12 286, 2.466 1.552 116.
2. )/1,72,407
13 28443 2.448 1.447 116.22,006913
15 309. .
14 324. 2.7932.664 1.503
1.436 111166:
2.26016 305. 2,629 13747 116 , 3,75317 278. 2. 397 1. 344 1161 I 3, e/18 , 291. 2.509 1.442 11.6319 313. 2. 698 1.482 1163
;33.(-1i.)
20 298. 2.569 1.511 116, 2.2E221 329. 2. 836 116.
( ) 72 737. 2.0791.744
1) 4, -;..{-;42'1,1
23 23314 2.7241. 4531. f)45 116, ). 70-,
24 . 481. . 4.183 2.13) 115, 4, L. ilL i
20 101.
8 101
RESULTS FOR RESULTS FOR AGES 31 43N TOTAL
1 :: 65.2 38.3 36.
6 51.
4 41135 31.
7 . 72.8 89.9 100.
10 78.11 1 24012 ? 86.1 3 . 87.14 113.15 100.16 102.
'''' 17 : 85.
0 21 115.22 77.23 -... 82.
,:. 24 164.
AVERAGE ST.DEV \I VAR I A \I:1511.806 0.401 36, 0.1
1,4'17 0,401 ?7, '1.2x)11.333 0.480 7 7 .
1.8002.225
1.2921.594
1.464
0.499
0.5030.464
1. /37 40.'.0.
24.32.
'8,1::)) ... 2,22?:14. ,1"9:
1. ?c'..?
2.500 1.66613675
'.0, ,,,,71")1.950 403 1.4313.100
1.1971.692 40, 2.862
2.150 1.189 60, 1 1
2.175 1.299 40.1i.i8;
2.825 40. , 3r?
2.50011517 2.
60, 1.'4912.550
1. 377'40. (1,2041.484
2.525
2.5252.475
1.3991.6331.377
40.
40..0.
:".64661:
1.897
2.125 , 40. 1.958
925
I: 756597
1.38540, 3.2572. 875
1.01110 60,2.050 1.413 .0.4.100 2.373 - .40. ,i631__._
-244-
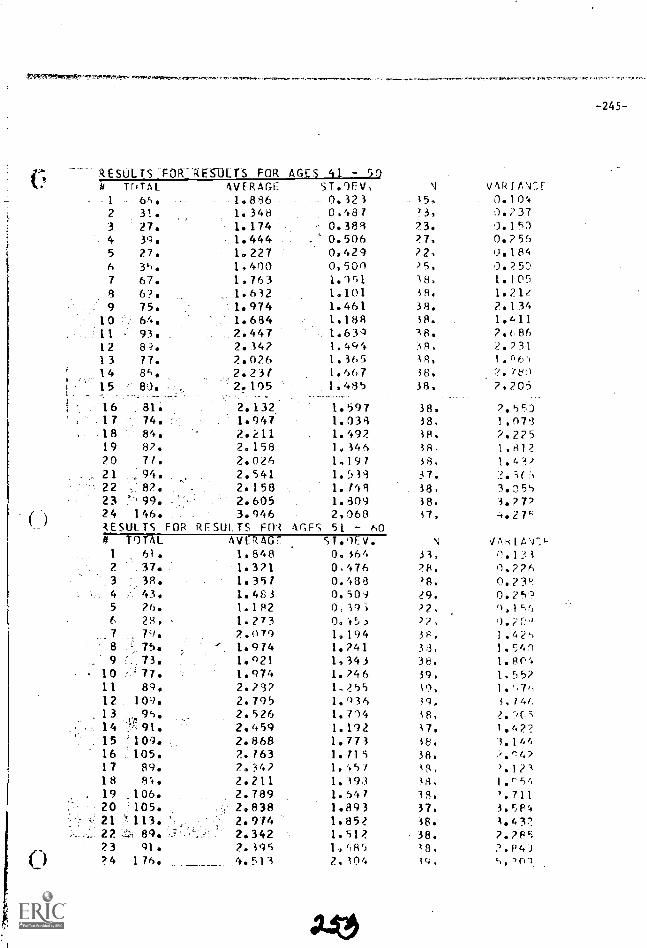
-245-
RESULTS 'FOR-REOLT5 FOR AGES 41 - 50vAR1rs4;:i4 TrITAL AVERAGE ST.1FV,
1 65. 1.886 0.321 15, 0.1042 31. 1.348 0,481 ?3,
3 27. 1.174 0.388 73. 0.15;)
4 39. 1.444 0.506 ?7. 0.2565 27. 1.227 0,429 12, 0.1846 36. 1,400 0,500 ?5, 0.2557 67. 1.763 1.051 18, 1.1058 6?. 1.632 1.101 58. 1.2129 75. 1.974 1.461 38. 7.134
10 64. 1.634 1.188 38. 1.411Al 93. 2.447 1.631 18. 7.68612 89. 2.342 1.494 38, 2.73113 77. 2.026 1.365 IP,
14 8k. 2.231 1.667 38. ?.7t4,)
15-
81. 2.105 1,485 38. 7.705
16 81. 2.132 1.597 38. 2.553.17 74. r 1.947 1.038 38, 1.07'3-18 84. 2.211 1.492 2.22519 8 ?. 2.158 1.346 18, 1.Al220 71. 2.026 1,197 58, 1.43221 ,.94. 2.541 1.538 37. 2,,r5()
22 82. 2.158 1.748 38,23 99. . 2.605 1.309 38, 3.27724 146.. 3.946 2,068 37, 4.2753ESULTS FOR RESULTS FOIl TOTAL AVERAGE
AGE; 51 60sir.OEV. VAklA\J:1-
1 61. 1.848 0.464 33,2 37.. 1.321 0,476 28, '1.7263 39. 1.397 0.433 ?S. 0.23P4 43. 1.483 0.504 29. 0.2525 26. 1.182 0,393 q41)6 28. - 1.273 22,
79. 2.079 1.194 36, 1.4275. '. 1.974 1.741 39,
9 73. 1.921 1,343 36,10 77. 1.974 1.246 39, 1.55?11 89. 2.28? 1?55 59,
12 109. 2.795 1.q3613 96. 2.526 1.714 18, 2.7Cs14 2.459 1.192 17. 1.42215 A09. 2.868 1.773 38. 1.14!,
16 105. 2.763 1.715 38. 2.r:to
17 89. 2.34? 1.457 19, 2.12118 8A. 2.211 1.393 18, 1.c51.
19 .105.. 2.789 1.547 18. '.711
20 :105. 2.838 1.893 37. 3.1584
21 113 2.914 1.852 38. 1.43722 89.:: 2.342 1.512 38. 7.217;;
?3 91. 2.195 1.'015 18,24 176. 4.513 2.104 5.,01
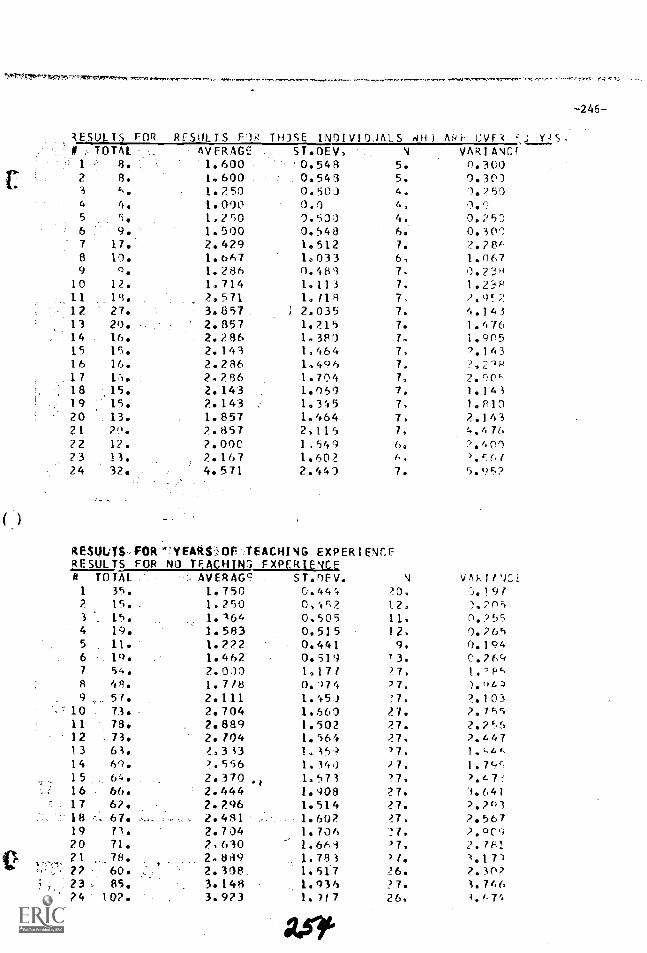
-246-
RESULTS FOR RESAT'S FIR TH)SE 11401V10JALS WHA APi. (JOH( Y),S.
# :- TOTAL- AVERAGE ST*OEV, N VARTANCf1
2
34
56
7-8
9101112131415161718192021?22324
': 8. ., '1.600 0.548 5. 0.3008. 1.600 . 0.543 5, 9.3006. 1.250 0.501 4. 0.2504 1.090 0.0 4, 0.!-35. 1,2r)0 0.500 4. 1.2579. 1.500 0.548 6.. 0.309
17.', 2.429 1.512 7. 2.28610. 1.667 1033 6, 1.067°. 1.286 0.483 7. 0.23H
12. la 714 1.113 7, 1.2:3P15. 2,571 1,118 7, 2.q!,2
27. 3.857 ; 2.035 7. 4.14320. 2.857 1.215 7. 1.47616. . 2.236 1.380 7. I.Po515. 2.143 1,464 7, /.14316. 2.286 1.496 7. .2.2"
.1,4. . 2.286 1.704 7, 2.,,e-,
151, 2.143 1.069 7. 1.14315. 2.143 : 1.345 7, 1.1.10
. 13. 1.857 1.464 7, 2.14329. 2.857 2,116 7, 4,4761 ?. 7.000 1,549 6, 2.60013. 2.167 1.602 6, 2, X6732. 4.571 2.441 7. 5.95?
REsuos,FOR4'YEARVOr'./EACHING EXPER1ENCFRESULTS FOR NO TEACHINS EXPEFMNCE
ST.0FV. N `7(0,1V1:-.1li TOTAL - - AVERAGq.1 35. 1.750 0,444 20, -).19 (2 15. 1. 250 0,4'32 12,3 15. 1. '364 0,505 11,
1- '2,2114!
4 19. 1.593 0.51 5 12,0(5 11. 1. 222 0.441 9, )))...:
6 19.7 54.
I. 4622. 009
0.5191,17 1
'13.27,
0.2691.'W,
8 4(1. 1. 718 0. 974 '7.9 57. 2.111 I. 45 ) _!7, ?..101
10 73. 2.704 1,660 27.?.7c:r,
11 78. 2. 889 1.502 77. 2.2 c.`,12 . 73. 2.704 1.564 77, 2.4471 3 63. 2, 3 33 I, 35') '7, 1, ',(.614 60. 2.556 1. 14,) 27, 1.7c.:615 64. 2.370 t 1. 573 27, -,,,t.16 . 66. 2.444 1.908 27. 3.64117 62. 2.296 1.514 27. 2.2/1118 -", 67. 2.481' 1.602 77, 2.56719 73. 2.704 1.706 !7. 7,,c1( "1?0 7!. 2,630 1.661 2.78121 78. 2.889 1. 791.703 21. 3.170
' 22 60. 2. 3013, 1 . 517 26. ,2., 30223 : 85. 3.148 1.936 27. 1, 74624 107. 3. 9?..3 1. )17 26. 4 . (-7'.
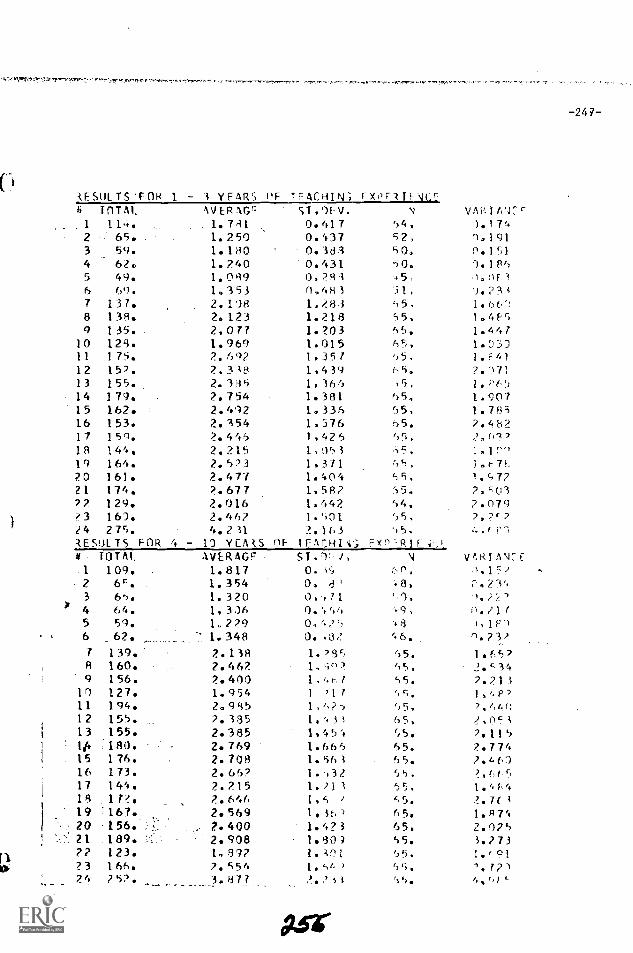
-247-
FSOLTS47-014 1 - 3 YEARS OF TFACHINC, rX0F1IF-71r-VARIA'.1.75ii TOTAL 1VERAG7. ST,OEV. V
1 114.2 65.3 59.4 620
1.7811.2501.1801.240
0.417. 0.6370.3830.431
54,52,50,50.
'1.174(1.1910.151
5 49. 1.089 0,281 .5,6 69. 1.353 11,483 'i1, 1.2347 137. 2.118 1,284 55. 1.6(68 138. 2.123 1.213 55. 1.4Fr,9 135. 2.077 1.203 55. 1..447
10 129. 1.969 1.015 65, 1.03311 175. 2.692 1.357 55, 1.4!12 151. 2,318 1.439 65. 2.17113 /55. 2.385 1,365 "15, 1.P6514 179. 2.754 1.381 65. 1.90715 162. 2.412 1.335 65, 1.78516 153. 2.354 1.576 55. 2.48217 159. 2.465 1.425 55,18 146. 2.215 1,051 :15> 1.1(-1
19 164. 2.513 1.371 45,20 161. 2.477 1.404 55. 1.c.)77
21 174. 2.677 1.582 :15. 2,50322 129. 2.016 1.642 54. 2.17923 160. 2.46? 1.';01 65,14 27C 4.211 2.163 ')5,RESULTS FOR 4 - 10 YEAS flF 1F.A(7.331.34:, F-Xn.143.15 ,i';
Ve.'itI A \I7 Cii TOTAL AVERAGE ST.174, V
1 109. 1.817 O. C1 (:'0, )15?2 V. 1.354 0. 8 8,3 65. 1.320 0,',11 '.1, ).2.(.?4 64. 1.306 0.6665 59. 1.229 0. ,'5 '.8 1.1F16 _62. 1.348 O. .3? 6. 1.132
7 139. 2.138 1.28r, 45. 107,518 160. 2.462 1,'-i°2 '15, 2.5149 156. 2.400 1 .'.7 55. 2.213
10 127. 1,954 1 '1 r ,,,;.. 1,4P211 194. 2..955 1.6?-, 55,12 155. 2.335 1, '. 31 65, 2,17)13 155. 2.385 1,454 (.,5. 2.1151/. 180. 2.769 1.565 65. 2.77415 176. 2.708 1.56i 55. 2.,4C)16 173. 2.65? 1.532 56, 2, {;' 5,
17 144. 2.215 1.211 55, 4
IR 172. 2.645 1,6' I 55. 2.7(319 167. 2.569 1.36'1 65. 1R7420 A56. 2.400 1.423 65. 2.02521 .189. 2.908 1.301 55. /.27322 123. 1.37? 1.1N 45. 1.'91?3 166. 2.554 1.5',4 55. i.r2124 257. 3.877 2.211 65.
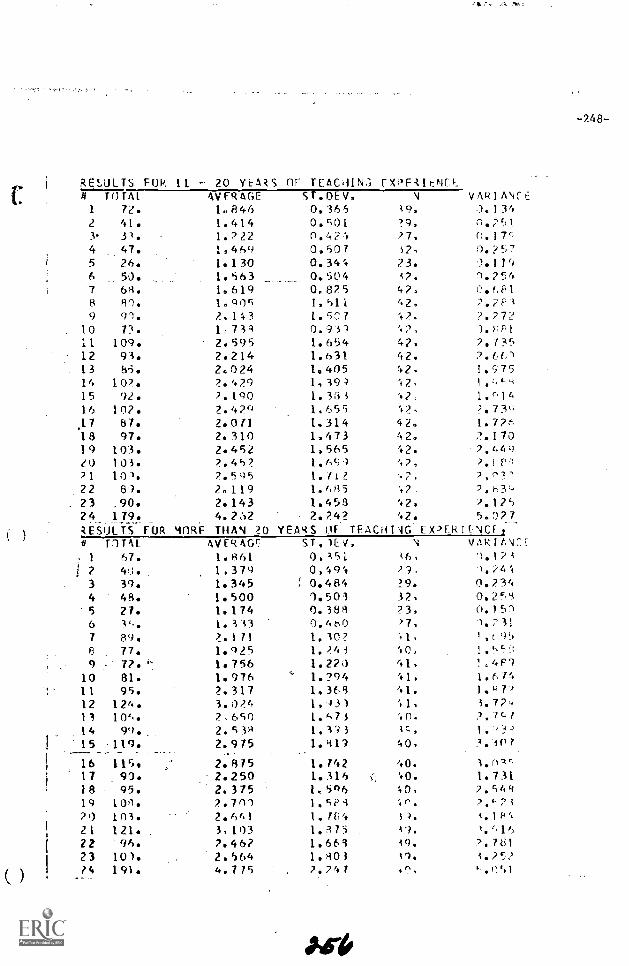
-248-
RESULTS FOP, 11 - 20 YEARS Or TEAC41N3 FXPFAIENICE_1# TOTAL AVERAGE ST.DEV. N VAR1 ANCE
1 72. 1.846 0.365 19, ).1342 41. 1.414 0.501 79. ;,;
3 33. 1.222 0.474 27,(r:
4 47. 1.469 0.507 i?, 0.3575 26. 1.130 0.344 ?3. ).1196 50. 1.563 _._ 0.504 4?, (1.2567 68. 1.619 0.875 4 ?, 0. ',81.8 60. 1.905 1,511 -42. 2.2F9 91. 2,143 1.907 ,,?,,
?)..2t-!F:1)10n
73.109.
1,7182.595
0.9'3? 2,1.654 42, 2.735
12 93. 2.214 1.631 42. ?66113 Eli. 2.024 1.405 42. I.r:C(514 102. 2.429 1.394 42 , I. ,-,15 92. 2.190 1.3iii 47: 1.n1416
.17107.
87.?.4292.071
1.655 W ,
1.314 42.?.73,1.7?-,
18 97. 2.310 1,473 42. 2.17019 103. 2.452 1.565 ' +2. 7.44,)20 103. 2.452 1,6c;,4 47, 2.1,21 101. 7.595 1. (i? i. ,..°71
22 89. 2.119 1.(685 47. 7, h3423 ,90. 2.143 1.458 42. 2.12524 4.2;12 2.24? ' +2.
5..127lESUTS FOR 40R.F THAN 20 YEARS 11F TEACH! AG Ex',ER I c_:NCE- td T1TAL AVERAV ST. )CV, N VAI-;IAN 7..:
67.tr .) .39.
1.8611,3791.345
0.151 -A6,
0,494 )9.; 0.484 29.
1.124i.24't0.234
4 48. 1.500 1.503 32. 0.2c.856
27.74`,.
1.1741.313
0.388 ?3,0.460 )7,
,(1).2.531
7 89. 2.171 1.30? '.1. 1 05, t
F3 77. 1.925 1. )4i '40, 1.!.,
9 7?. i' 1.756 1.220 41. !,4F9
1011
81.95.
1.9762.317
, 1.294 41,1.368 41.
il .6, 774
12 124. 3.024 1,43) '.1. 3.77,-13 104 2.650 1.673 '.0, 7,/cr14 99. 2.538 1,333 sc, 1.:c2-,15 119. 2.975 1.819 40, 3.)0716 115. 2.875 1.742 40. i. rl'Ar'17 90. 2.250 1.316 40. 1.73118 95. 2.375 11 596 40, 7.94819 100. 7.701 I,9P3 :0. 7.'-2
20 103. 2.641 1.184 3'4. 4.1w,21 121. 3,103 1.375 49. ?.r,11322 96. 7.46? 1.664 49, 7,78123 101. 2.564 1.103 sr). s.24"..274 191. 4.775 7.747 4r.,, i-.+111
AO*
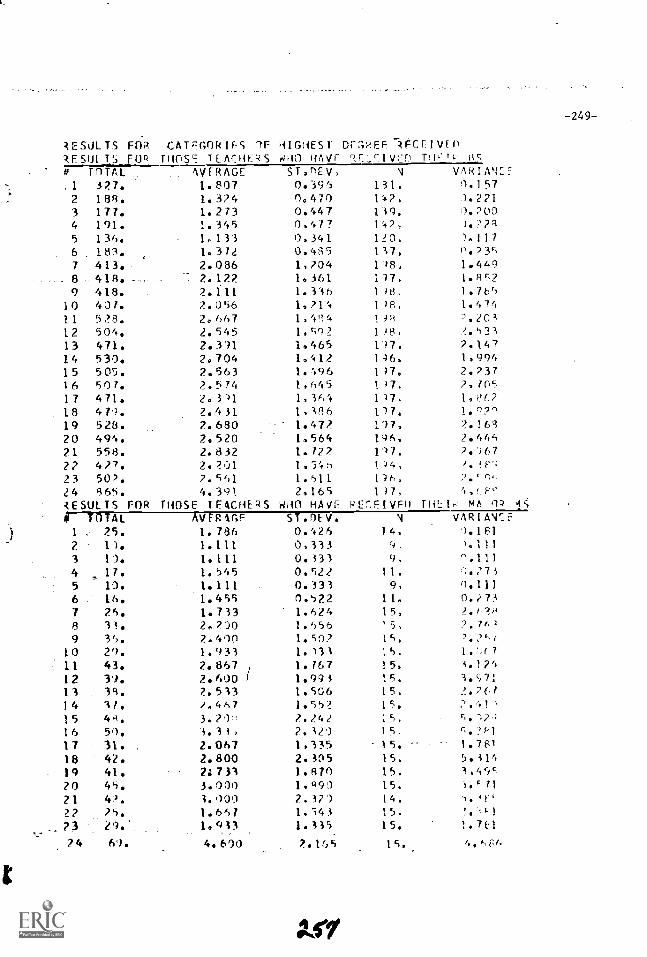
-249-
2ESOL TS FO'RRESIll TS FOr4
CATEGOR IFS OFTHOSP. TEACHERS
HIGHES 1i4,11 WWI
Di-;EF: 2ECE1VErr" EL': 1 VEn THt-'1-' lic
0 TOTAL AVERAGE ST.OEV, I VAR I A'10:-.
1 327. 1.807 0.396 131. 0.1572 188. 1. 324 0.470 142, 1.2213 177. 1.273 0.447 139. 0. ? 004 191. 1.345 0.47? 142, 4.2795 136. 1, 133 0.341 120, -.'.1176 183. 1. 371 0.435 137, 0.23C7 413. 2.086 1,704 118, 1.44?8 418. .. 2.122 1.361 117, 1.8579 418. 2.111 1.336 1 48, 1.76')
10 401. 2.056 1.214 1 48, 1.47411 529. 2 ,,667 1.484 1 8 , 2.10312 504. 1.545 1 cin 2 1 48, 2.53313 471. 2.391 1.465 117.
2 194t7t14 530. 2.704 1.412 136, 1:915 505. 2.563 1.496 197. 2.23716 507. 2.574 1,645 1 )7, 2, 7(0517 471. 2. 3)1 1, 37.4 117, 1, ez7,2
18 479. 2.431 1,386 1)7. 1. c.?"19 528. 2.680 1.472 117, 2.16920 494. 2.520 1.564 116, 2.44521 558. 2. 8 32 1. 722 117. 2.16722 427. 2.201 1.546 1 )4. 4. if'"=
23 50'. 7.551 1.511 1)6,24 R65. 4.391 2,165 1 )7, ,!,i'''2E SUL TS FOR THOSE TEACHERS WHO HAVE fl,Fe- I VP) THEY. MA IP Itii TOTAL XVER AGF ST.OEV. NI VARIANCE-
1 , 25. 1.786 0.426 14. I . 1P1
2 11. 1.111 0,333 9 ,3 11. 1.111 0. 133 (?, '):::1171113
47.,
17. 1.545 0.522 11.5 10. 1.111 0.333 9, 0.1116 16. 1.455 0.522 11. 0.2737 26. L.733 1.624 15, 2. 1:2,i4
8 31. 2.200 1.1)56 1 5, ?.7tA
9 35. 2.400 1.902 15, ?. p..71011
20.43.
1.9332.867 1
1. /331
15.15.
1 .: 7
12 39. 2.600 1.943 15. 1.,,7113 38. 2. 533 1.506 15, 2. 76114 37. 2.467 1.552 15. :'.41 '15 49. 3. 2,/,' 2.142 15. r, . -I ,.) 1
1 6 50. 3., 31 , 2, 320 15, 5.!P117 31. 2.067 1.335 15. 1.7E118 42. 2.800 2. 305 15. 5.31419 41. 2:733 1.870 15. 1,49c20 45. 3.000 1.'991 15. 3. r 7121 47. 3. 000 2.320 14. I..."22 75. 1.667 1.543 15. !,, 'F-1
23 29.' 1.933 1.335 15. 17n24 69. 4.690 2.165 15. 4.0,1"
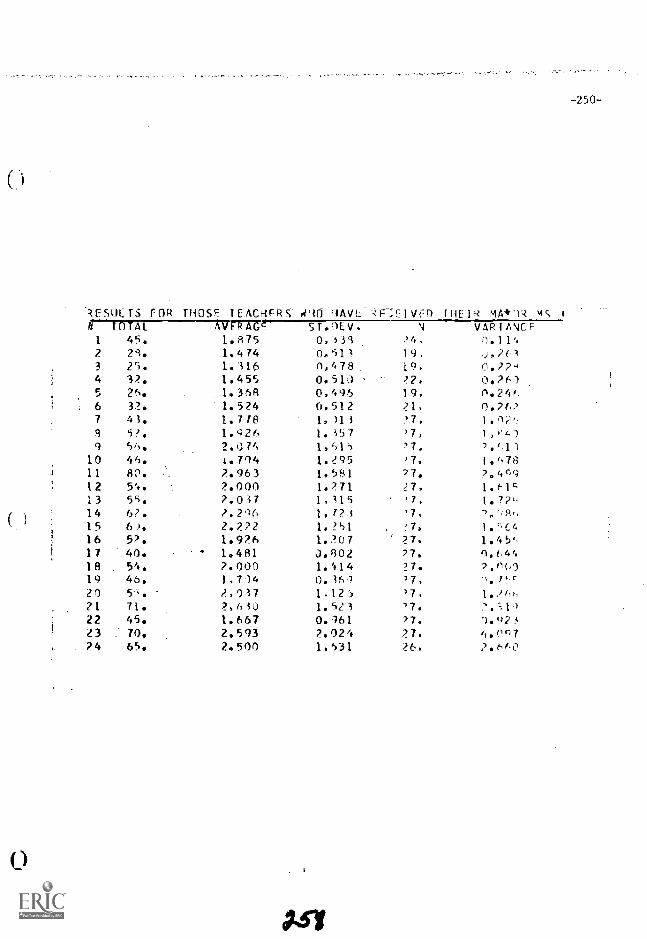
0
'4ES111_ TS r--OR THOSE TEACHERS- 011M -11./1.: QF :El VD HIE IR MA*14 ,ISN TOTAL AVrrAV" ST.DEV, V VA111/1\1F
1
234567
1
9101112131415161718192021222324
45.2'1.25.32.26.32.43.5,./.5f1.46.80.54.55.67,fo.57.40.54.46.5- .71.45.70.65.
L.8751.4741.3161.4551.3681.5241.7 /81.9262.074t.7042.9632.0002.037
2'162.2??1.9?61.4812.0001,7142,037?,e, 301.6672.5932.500
0,3330.5110,478 ,0.5100,4960.5121. )11.3571,61i1.2951.5811.2711,3151. 1231.2511.2070.8021.4140,3!,,)1.1251.5230.3612.0241.531
,'4,19,19.2.
19,21,'7.)7,>7.27,77.27,)7,'7.)_-,
27.77.?7.'7.)7.'7.'7.
27.26.
XsT
-250-
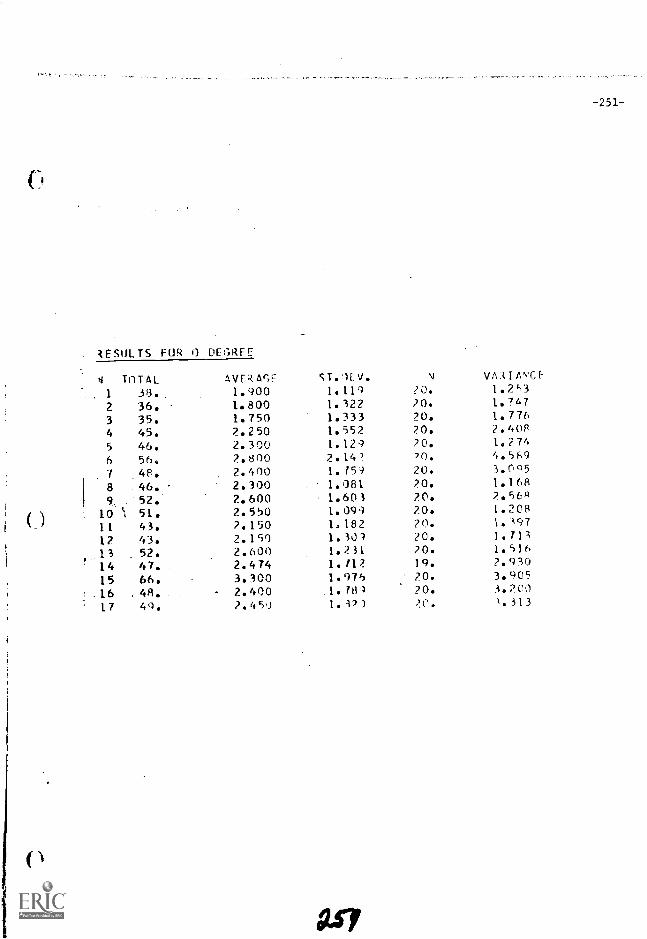
( )
lESOLTS FOR 0 DEGRFr
ST.0LV. N VA:tlAYCEH TOTAL AVIRAr,F
1 30. 1.900 1.119 20. 1.253
2 36. 1.800 1.322 20. 1.747
3 35. 1.750 1.333 20. 1.776
4 45. 2.250 1.552 20. 2.40P
5 46. 2.300 1.129 20. 1.274
6 56. 2.800 2.147 20. 4.5F+9
7 ,48. 2.400 1.759 20. 3.095
8 46. 2.300 1.081 70. 1.168
(4, 52. 2.600 1.603 70. 2.568
10 51. 2.550 1.099 70. 1.208
11 43. 7.150 1.182 70. 1.9712 43. 2.150 1.101 20. 1.71;
13 52. 2.600 1.231 70. 1.516
14 47. 2.474 1.712 19. ?.930
15 66. 3.300 1.976 20. 3.905
16 48. 2.400 1.?81 20. 3.200
17 49. 2.451 I. If) 70. 1.313
(247
-251-
-252-
Questionnaire and Computer Printout
"Principal's Perception of Teacher Preferencesfor the Utilization of External Consultant Service"
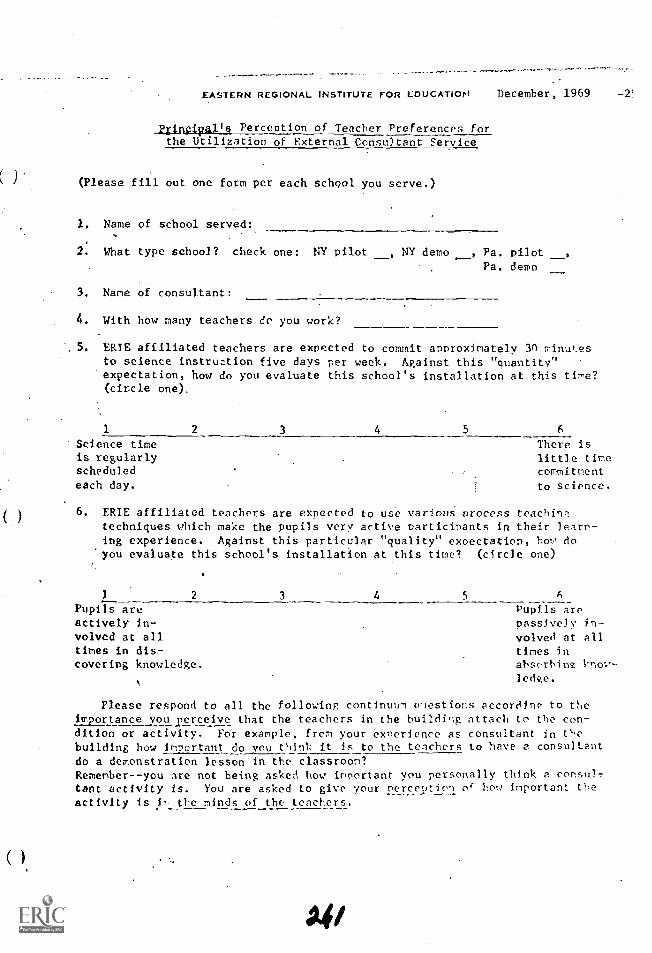
( )
EASTERN REGIONAL INSTITUTE FOR EDUCATION December, 1969 -2'
kringiyalla Perception of Teacher Preferences forthe Utilization of External Consultant Service
(Please fill out one form per each school you serve.)
1, Name of school served:
2. What type school? check one: NY pilot NY demo , Pa. pilot ,
Pa. demo
3. Name of consultant:
4. With how many teachers do you work?
5. ERIE affiliated teachers are expected to commit approximately 3f/ minutesto science instruction five days per week. Against this "quantity"expectation, how do you evaluate this school's installation at this tire?(circle one).
1 2 3 4 5 6
Science time There isis regularly little timescheduled commitmenteach day. to science.
6. ERIE affiliated teachers are expected to use various procesS teachinrtechniques which make the pupils very active participants in their learn-ing experience. Against this particular "quality" expectation, how doyou evaluate this school's installation at this time? (circle one)
1 2 3 4 5 6
Pupils are Pupils areactively in- passively in-volved at all volved at alltimes in dis- times incovering knowledge. ahserhinz know-
ledAze.
Please respond to all the following continuum wiestions accordinr to theimportance you perceive that the teachers in the building attach to the con-dition or activity. For example, from your exnerience as consultant in thebuilding how important do you think it is to the teachers to have P consultant
do a demonstration lesson in the classroom?Remember- -you are not being asked how important you personally think a consul-Cant activity is. You are asked to give your rercoptien of how important theactivity is it the minds of the teachers.
44/
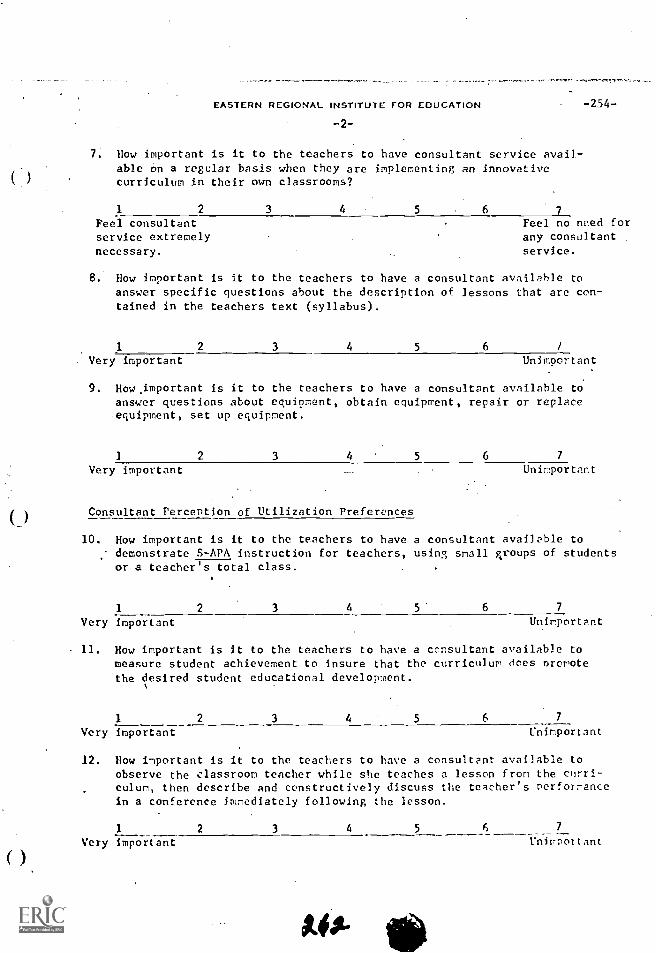
( )
EASTERN REGIONAL INSTITUTE FOR EDUCATION -254-
-2-
7 How important is it to the teachers to have consultant service avail-able on a regular basis when they are implementing an innovativecurriculum in their own classrooms?
1 2 3 4 5 6 7Feel consultant Feel no need forservice extremely any consultantnecessary. service.
8. How important is it to the teachers to have a consultant available toanswer specific questions about the description of lessons that are con-tained in the teachers text (syllabus).
1 2 3 4 5 6
Very important Unimportant
9. How.important is it to the teachers to have a consultant available toanswer questions about equipment, obtain equipment, repair or replaceequipment, set up equipment.
2
Very important3 4 5 6 7
Unimportant
Consultant Perception of Utilization Preferences
10. How important is it to the teachers to have a consultant available todemonstrate S-APA instruction for teachers, using small groups of studentsor a teacher's total class.
1
Very important2 3 4 5 6 7
Unimportant
11. How important is it to the teachers to have a consultant available tomeasure student achievement to insure that the curriculum does nromotethe desired student educational development.
1 2
Very important4 5 6 7
Unimportant
12. How important is it to the teachers to have a consultant available toobserve the classroom teacher while she teaches a lesson from the curri-culum, then describe and constructively discuss the teacher's performancein a conference immediately following the lesson.
1 2 3 4 5 6 7
Very important Un)nortant
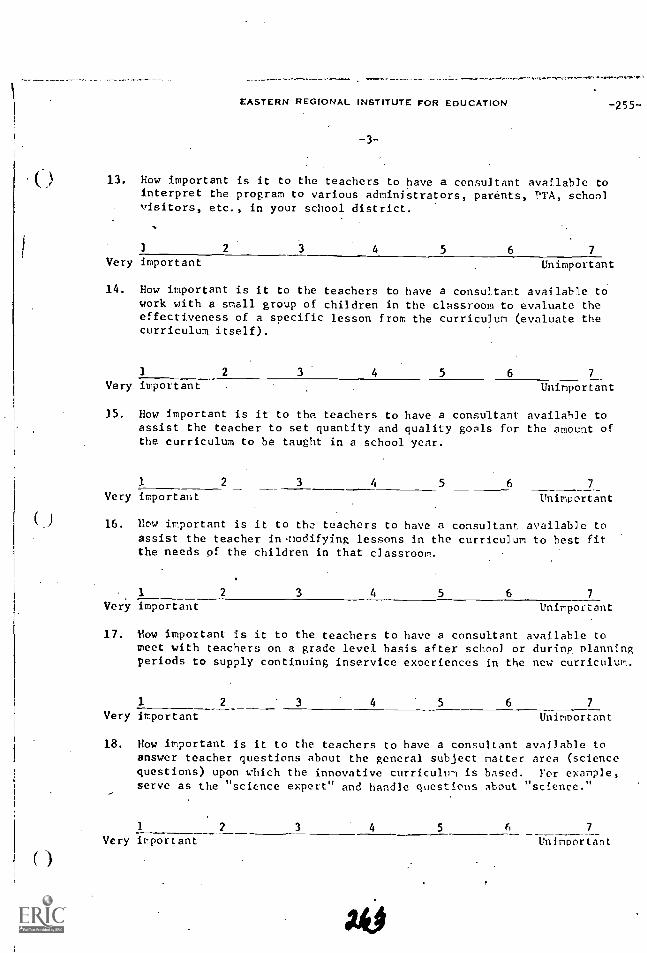
( )
EASTERN REGIONAL INSTITUTE FOR EDUCATION
-3-
13. How important is it to the teachers to have a consultant available tointerpret the program to various administrators, parents, PTA, schoolvisitors, etc., in your school district.
1
Very important
-255-
4 5 6 7
Unimportant
14. How important is it to the teachers to have a consultant available towork with a small group of children in the classroom to evaluate theeffectiveness of a specific lesson from the curriculum (evaluate thecurriculum itself).
1 2 3 4 5 6 7
Very important Unimportant
15. How important is it to the teachers to have a consultant available toassist the teacher to set quantity and quality goals for the amount ofthe curriculum to be taught in a school year.
1
Very important2 3 4 5 6 7
Unimportant
16. how important is it to the teachers to have a consultant available toassist the teacher in.modifying lessons in the curricu]um to best fitthe needs of the children in that classroom.
1 2 3 4 5 6 7
Very important Unimportant
17. Eow important is it to the teachers to have a consultant available tomeet with teachers on a grade level basis after school or during planningperiods to supply continuing inservice experiences in the new curriculum.
1 2
Very important3 4 5 6 7
Unimportant
18. How important is it to the teachers to have a consultant available toanswer teacher questions about the general subject natter area (sciencequestions) upon which the innovative curriculum is based. For example,serve as the "science expert" and handle questions about "science."
1 2 3 4 5 6 7-------Very important Unimportant
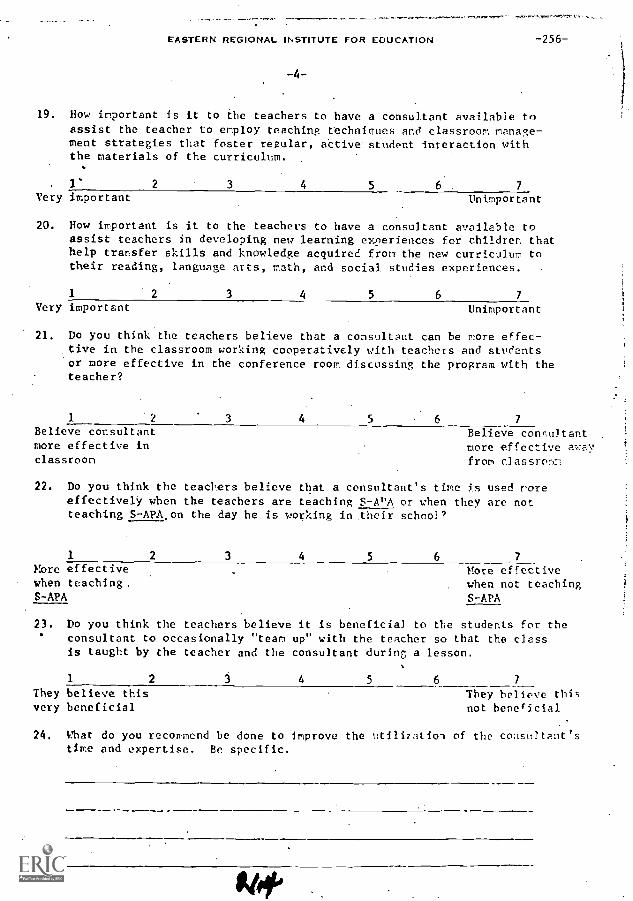
EASTERN REGIONAL INSTITUTE FOR EDUCATION
-4-
-256-
19. How important is it to the teachers to have a consultant available toassist the teacher to employ teaching techniques and classroom manage-ment strategies that foster regular, active student interaction withthe materials of the curriculum.
2 3 4 5 6 .
Very important Unimportant
20. How important is it to the teachers to have a consultant available toassist teachers in developing new learning experiences for children thathelp transfer skills and knowledge acquired from the new curriculum totheir reading, language arts, math, and social studies experiences.
.
1 2 3 4 5 6 7
Very important Unimportant
21. Do you think the teachers believe that a consultant can be more effec-tive in the classroom working cooperatively with teachers and studentsor more effective in the conference room discussing the program with theteacher?
1 2 3 4 5 7
Believe consultant Believe consultantmore effective in more effective awayclassroom from classroon
22. Do you think the teachers believe that a consultant's time is used moreeffectively when the teachers are teaching S-APA or when they are notteaching S-APA.on the day he is working in their school?
2
More effectivewhen teaching.S-APA
3 4 5 6 7
More effectivewhen not teachingS-APA
23. Do you think the teachers believe it is beneficial to the students for theconsultant to occasionally "team up" with the teacher so that the classIs taught by the teacher and the consultant during a lesson.
1 2 3 4 5 6 ___7_They believe this They believe thisvery beneficial not beneficial
24. Mat do you recommend be done to improve the utilization of the consultant'stime and expertise. Be specific.
AI*
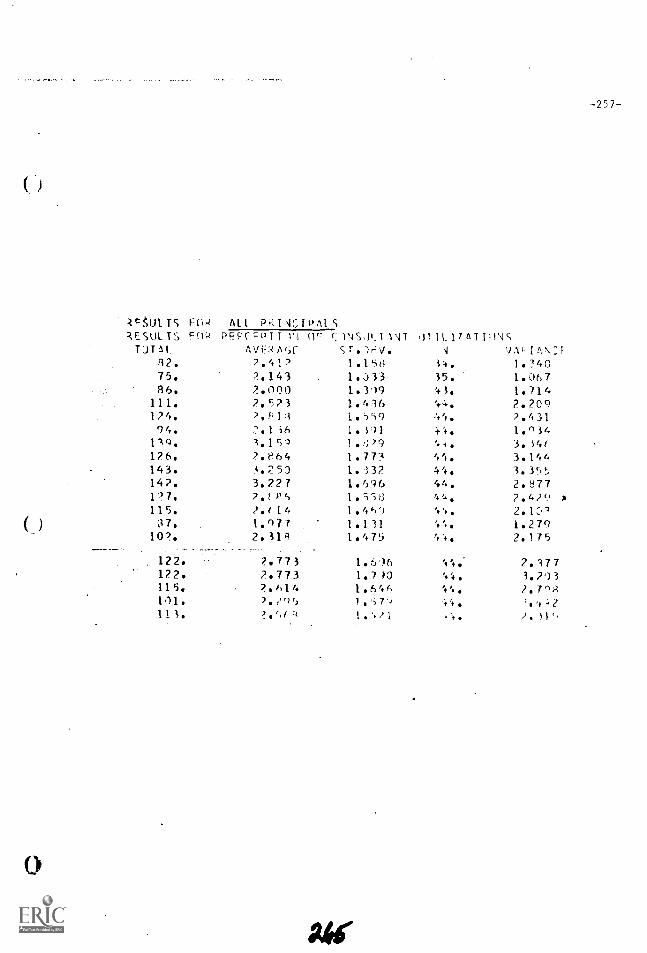
0
RFULTS F(1qRESULTS coo
All PkiACIPAISAIILPATIUNS
J VAL1AN F
PEPCP9I1 vi wrAVOVA:
F:1\IST\NTSTe/r:V.
92. 2.41? 1.1 14. 1.34075. 2.143 1.333 35. 1.06786. 2.000 1.309 43. 1.714111. 2.523 1.416 44. 2.209124. 2.fl11 1.559 44. 2.43194. 3.136 1.101 -1.'te 16°34
1.15') 1.2.9 41. 3.341,126. 2.e64 1.773 44. 3.144143. 3.250 1.332 44. 3.35''J
14 ?. 3.227 1.1,96 44. 2.877127. 2.F94) 1.956 44. 2.42r) A
115. ..114 1.469 44. 2.133j7. 1,977 1.131 44. 1.279
102. 2.319 1.475 . 2.175
122. 2.773 1.616 44; 2.977122. 2.773 1.7)0 44. 1.203115. 7.614 1.646 44. 2.79A101. 2.1' >5 1. 'i 7') . .?.'t =0211 ?.`,(u 1.'.)1 r. 2 .')1`.,
PAC
-257-

-258-
lESIILTS FTIR NEW YiiRK R:-tINC1PALS2ESULTS FOR PERCEPT IIN OF C.:INSULT/01T ilTIL 1/ATI1NS
TOTAL AVER AGE ST.1EV. 1 `JAk 1 AN ;F57. 2.714 1.1'+(:, 21. 1. 31451. 2.L2'2 1. ).)_F 21. 1.09763. '2.520 1.61C 21. 2..54',71. 3.080 1.77b 2'1. 3.16075. 3.000 1.7)3 25. 7.91751. ?,175 1.459 24. 7.1'436. i.1,10 1..173 2'.,.. 3.5774. 2.°.--) 1.721 23. -3. ?(..798. 3.!,20 '.')44 25. . 4.177
190. 4.000 1.848 25. 3.41794. 3.360 1.753 25. 3.17.375. 3.000 1. Tad ?5. 2.91756. 2.74) 1. 1.Y,1) 2:5 1.6'1064. 2.1-.6) 1.414 7H). 7.17:179. 3.160 1.77? 27). .1.14.)19. 3.16n 1.795 25. 3.22395. 3.400 3.14 >? 25. 3.41761. 2.440 , 1.417 25. 7. 00776. 3.C)40 1.4'15 2.i. 7.2(.7
2ESUITS FT,' dFN \ISYI VA \11t) 0,A :sr: ll'At S1ES0L TS F0 PF!.q1IPT r1N I1F c)NS /111NT 11_14A11 rJS
TOTAL AVERAGE ST .Dt:V. \I V.A;fro,!:--725. '. 1.523 1.033 13. 1.07734. 7.125 0.957 15. 0.91731. 1.637 ).' i1 1 )., ').6,,i40. 1.1')9 1.1 )1 12. 1.2114R. .).cY26 1.A4'1 1 . 1,Q.'+1)
32. 1.684 0 . 1,15 11. 11.7e454. 3.363 1.16? 12. 3.4f ,,R53. 2.782 1.732 H. 3.17563. 3.316 1.711 1'. 7.F-,L93. ?.781 1.'437 1 '. 2. P. 452. 2.737 1. 'i'i!i 12 7.4i'746. 2.421 1.3'0 14. 1.81314. 1.789 0.355 1.9 0.73143. 2.263 1.559 H. 2.42754. ?.42 1. ', /1 12. ).5,r,4R. 7.52f, 1.f,7 ; 1). 7.81'-44. 2.316 1 a 4-,5 1 ?. 7.11739. 2051 1.545 11. 7.3'il,38. ?.00) 1.054 12 1.111
44$
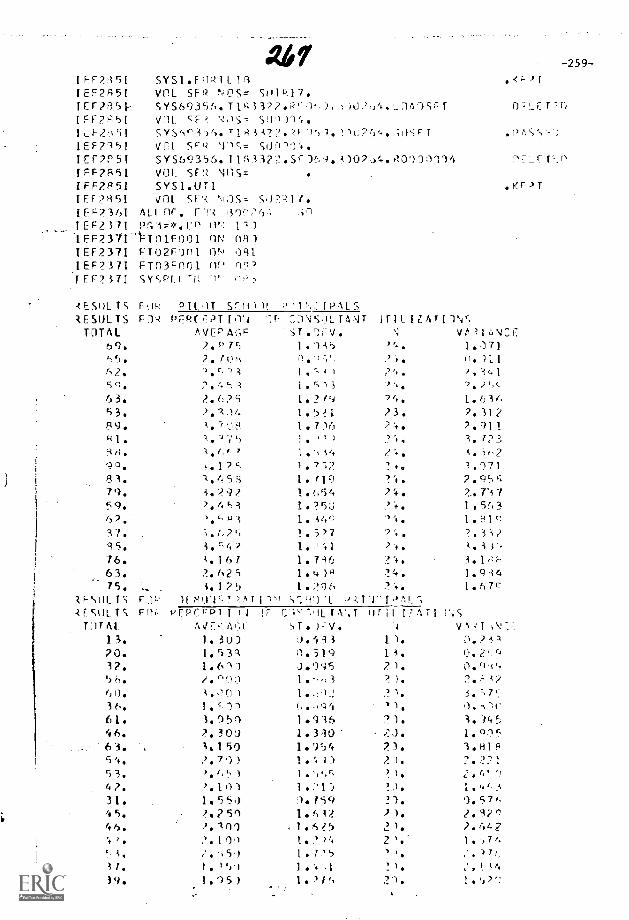
-65Z
.A. IldSAS c61_, kit) 100dCOI3
N0 10CdeO13 ILCZA3I (U0 NU tooJIu14, icteJI. (t 6A*=Wd ILieJ31
,;9,f66ii ?;Li JU 11V /.10.S =SLN lUA
IstieJJI =SON J.JS ILIA ISeZJJI
1/C.L1tC,COo'tc,c0.f,r:1C3S*.LtAb11 '95£59.SAS 15u1d3I S(,« is ?-,JS 1LIA
1 iStit. c,ris =sic ie_H --1ea3.1
L 1;,1 los =SON iIdS ion 158Z31 -1161,3'1SAS 1,ce..4-d
1 (C)L'1 d IPt. 'CL 4tu. 1 GS i 't C9
,;.00 '1 t',:!' f6£ I coi 'c! °94, .-i ) et C i: 91 -6l U5(:,4 19
w: +, (_ 1., lito-ri 0.. :, I '94. i.i.,c ..t . :-L-- -1 ( (J,,l' Wr f!.1lcc: (C p,,...1 uci? ,-?c, iiot,0 L. e ;t,c.(-, (A,9I ZE ri';,?*0 LEI 61 u btic..,1 oe Lie-l; t. T 46 4,c: (11 I '£1
1.'\+'1', r /\( 1,-, ,rAP.-i]tV tVit:1 S!.t liV: I 1! ill 1' vili.....,t'D :IL t i 1 toJ),Lirt ..I_JJ sliHsD-
...., ivclAr:He tH-1:.."; kt_livCi3VC;43( ,-.1.1 slinsdl 3L,J1 .4,,... .r1e,1 rie I 4 ''. 'St -16.1 42;: tit +.A.1 (m?') *i: 4:9
4.,/i9bi I /91..1 91 !,s i r 4,,,,,, It ,_ 1 7,,..4. Sb
10 'c .,,6 Le', i 'AC)(.. 'Lt. ',A1,:.'1. *,c, :0;$ T V. ef ,-, ', cc) i.-';1 ti' f.1.:S'i /..4 '15.
L i..,L 'c 4-, l 4i S'; '1 te4.. tiL li56L "ii bid *I /t Lil
[LC ' i ..;.. ''.,_.t.' t sc I ,, 'L,e, e, t? ,/..-1. e 4').1. 'Ph
c.'.2' ".c c L, [ (11.,'t 1H i tbe .te 9ii .1 1-C*. 68 Z ii e. e I?51 -*/Cr..? *Es
')E9I ',,,,e. F,/ i1 !,e:)( `Pi -).,,(.. ,,,, t ,-. / ,,,,,',: *b,, l*rc'e. ..,,,, l2"'i r, ' i . C. l Li
l'Ic 'u 0.41 4., }s01 .e "-_,L)
(2.C i r,i (7,- C 1 (ii 41 ' e .. J2,R "1c VA t A:.,:..,'IS dt)V,t3Av 11/161 '.0.t_ lIV-21111 f IN-V111'SM:: L, r.ui IcH )HD0 6CJ SlinS32
SlVril !,;1 , 0 ii L1LJS .1P ild -il.0 Si lfiS73r,
.A. IldSAS c61_, kit) 100dCOI3
N0 10CdeO13 ILCZA3I (U0 NU tooJIu14, icteJI. (t 6A*=Wd ILieJ31
,;9,f66ii ?;Li JU 11V /.10.S =SLN lUA
IstieJJI =SON J.JS ILIA ISeZJJI
1/C.L1tC,COo'tc,c0.f,r:1C3S*.LtAb11 '95£59.SAS 15u1d3I S(,« is ?-,JS 1LIA
1 iStit. c,ris =sic ie_H --1ea3.1
L 1;,1 los =SON iIdS ion 158Z31 -1161,3'1SAS 1,ce..4-d
0
Questionnaire and Computer Printout
"Consultant's Perception of TerIcher Preferences forthe Utilization of External Consultant Service"
-260-
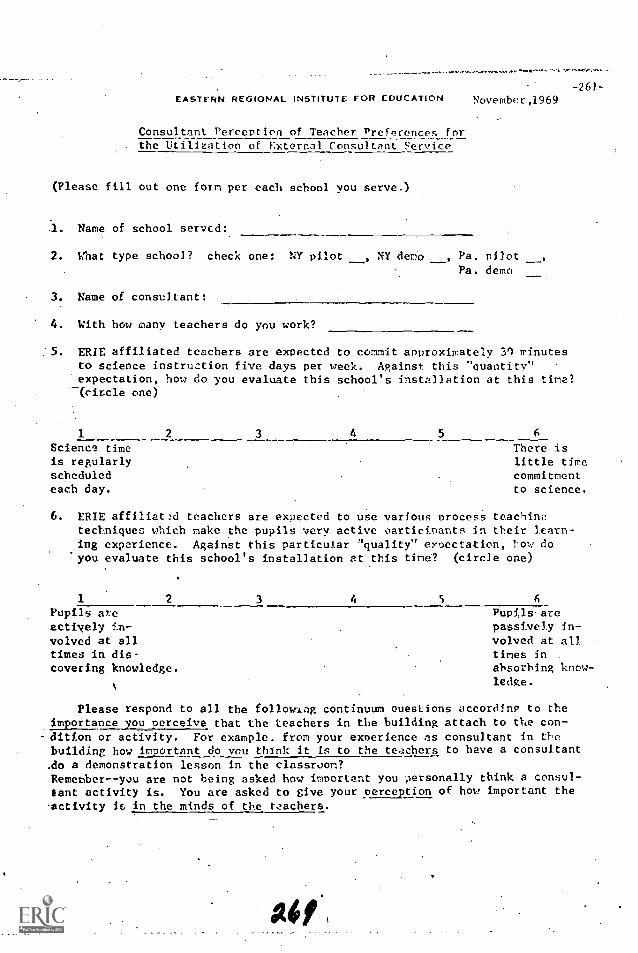
EASTERN REGIONAL INSTITUTE FOR EDUCATION
Consultant Perception of Teacher Preferences for. the Utilization of External Consultant service
(Please fill out one form per each school you serve.)
November,1969
1. Name of school served:
2. That type school? check one NY pilot , NY demo , Pa. pilotPa. demo
3. Name of consultant:
4. With how many teachers do you work?
-261-
:5. ERIE affiliated teachers are expected to commit approximately 30 minutesto science instruction five days per week. Against this "quantity"expectation, how do you evaluate this school's installation at this tire?(circle one)
1
Science timeis regularlyscheduledeach day.
2 3 4 5 6
There islittle timecommitmentto science.
6. ERIE affiliated teachers are expected to use various procesS teachinetechniques which make the pupils very active oarticipants in their learn-ing experience. Against this particular 'quality" expectation, how doyou evaluate this school's installation at this time? (circle one)
1 2 3 4 5 6
Pupils are Pupils. are
actively in- passively in-volved at all volved at alltimes in dis- times incovering knowledge. ahsorhing know-
%ledge.
Please respond to all the followl.ng continuum Questions accordinp to theimportance you perceive that the teachers in the building attach to the con-
- dition or activity. For example. from your experience ns consultant in thebuilding how important do you think it Is to the teachers to have a consultant.do a demonstration lesson in the classroom?Rememberyou are not being asked how imoortant you ersonally think a consul-tant activity is. You are asked to give your perception of how important theactivity it in the minds of the teachers.
Af
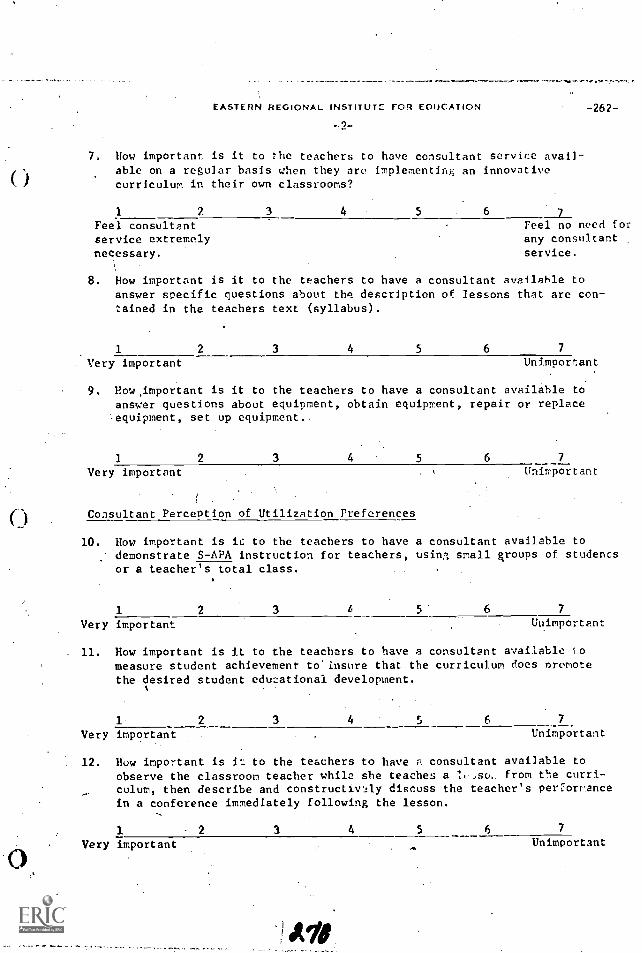
C
EASTERN REGIONAL INSTITUTE FOR EDUCATION
7. now important is it to the teachers to have consultant service avail-able on a regular basis when they are implementing an innovativecurriculum in their own classrooms?
-262-
1 2 3 4 5 6 _a_Feel consultant Feel no need for
service extremely any consultant
necessary. service.
\
8. How important is it to the teachers to have a consultant available toanswer specific questions about the description of lessons that are con-tained in the teachers text (syllabus).
1 2 3 4 5 6 7
. Very important Unimportant
9. How important is it to the teachers to have a consultant available toanswer questions about equipment, obtain equipment, repair or replaceequipment, set up equipment..
1 2 3 4 5 6 7
Very important
Consultant Perception of Utilization Preferences
Unimportant
10. How important is it to the teachers to have a consultant available todemonstrate S-APA instruction for teachers, using small groups of studentsor a teacher's total class.
1 2 3 4 5 6 7
Very important Unimportant
11. How important is it to the teachers to have a consultant available tomeasure student achievemenr to'insure that the curriculum does nromotethe desired student edutational development.
1 2 3 4 5 6 7
Very important Unimportant
12. How important is it to the teachers to have a consultant available toobserve the classroom teacher while she teaches a 1,-,so- from tte curri-culum, then describe and constructively discuss the teacher's perorriancein a conference immediately following the lesson.
1 2 3 4 5 6 7
Very important Unimportant
Aid

EASTERN REGIONAL INSTITUTE FOR EDUCATION/
13. How important is it to the teachers to have a consultant available tcinterpret the program to various administrators, parents, ''TA, schoolvisitors, etc., in your school district.
1.
Very important2 6 7
-263--
Unimportant
14. How ilAportant is it to the teachers to have a consultant available towork with a small group of children in the classroom to evaluate theeffectiveness of a specific lesson from the curriculum (evaluate thecurriculum itself).
1 2 3 4 5 6 7
Very important Unimportant
15. How important is it to the teachers to have a consultant available toassist the teacher to set quantity and quality goals for the amount ofthe curriculum to be taught in a school year.
1 2 3 4 5 6 7
Very important Unimportant
16. flow important is it to the teachers to Iv.ve a consultant available toassist the teacher in.modifying lessons in the curriculum to best fitthe needs of the children in that classroom.
1
Very important2 3 4 5 6 7
Unimportant
17. How important is it to the teachers to have a consultant available tomeet with teachers on a grade level basis after school or during planningperiods to supply continuing inservice experiences in the new curriculum.
1 2 3 4 5Very important Unimportant
18. How important is it to the teachers to have a consultant available toaaswer teacher questions about the general subject matter area (sciencequestions) upon which the innovative curriculum is based. For example,
serve as the "science expert" and handle questions about "science."
1 2 3 4 5 6 7
Very important Unimportant
ti
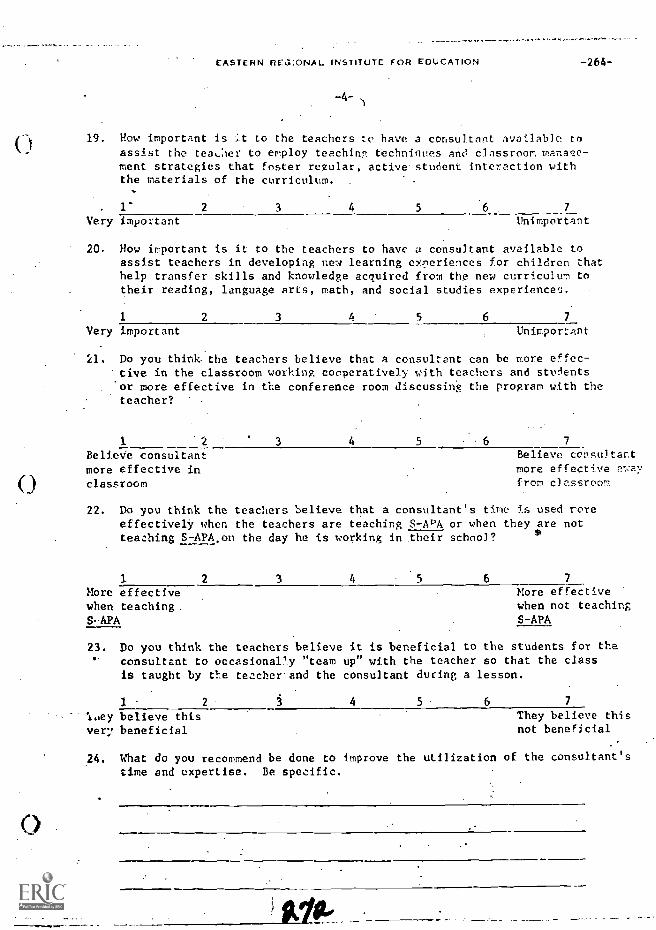
0
0
.-----1
EASTERN REGIONAL INSTITUTE FOR EDUCATION
-4--
-264-
19. Bow important is it to the teachers to have a consultant available to
assist the tea,:ler to employ teechin7 techniuues and classroom mana,ze-ment strategies that foster regular, active student interaction withthe materials of the curriculum. .
1' 2 3 4 5 7
Very important Unimportant
20. How important is it to the teachers to have a consultant available toassist teachers in developing new learning eyneriences for children thathelp transfer skills and knowledge acquired from the new curriculum totheir reading, language arts, math, and social studies experiences.
1 2 3 4 5 6 7
Very important Unimportant
21. Do you think- the teachers believe that a consultant can be more effec-tive in the classroom working cooperatively with teachers and studentsor more effective in the conference room discussing the program with theteacher?
1 '2BelieVe consultantmore effective in
classroom
3 4 5 6 7
Believe consultantmore effective a- :ay
from classroom
22. Do you think the teachers believe that a consultant's tine is used moreeffectively when the teachers are teaching S-AMA or when they are notteaching S-APA,on the day he is working in their school?
1
More effectivewhen teaching.S APA
2 3 4 5 6 7
More effectivewhen not teachingS-APA
23. to you think the teachers believe it is beneficial to the students for theconsultant to occasionalr'y "team up" with the teacher so that the classis taught by Ole teacher and the consultant during a lesson.
1 2 3 4 5 6 7
ley believe this They believe this
very beneficial not beneficial
24. What do you recommend be done to -improve the utilization of the consultant'stime and expertise. Be specific.
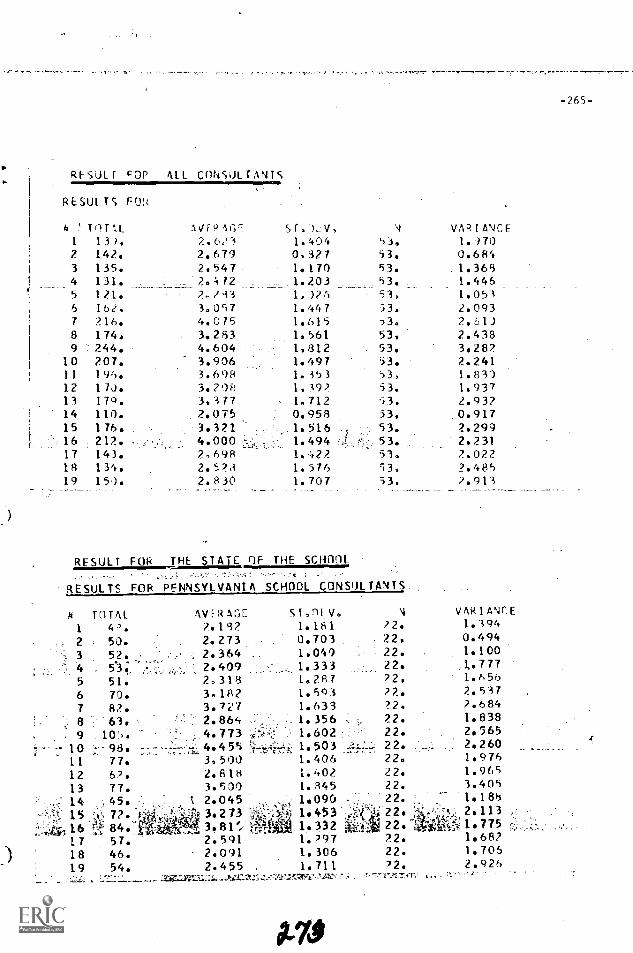
RESULT cOP ALL CONSULTANTS
RESULTS F0 4
4 ' Ti)T.L AVI-9"C,9 SI, )LV, A VAR I ANCE
1 1.3? 2, 62 1.404 53. 1.1702 142. 2.679 0.827 53. 0.6843 135. 2.547 1.170 53. 1.3684 131. .- 2.412 1.203 _ 53. 1.4465 121. 2,. /13 1.026 53, 1.0516 162, 3,057 1.447 53. 2.0937 216. 4.075 1.615 53. 2.108 174, 3.253 l 561 53, 2.4389 244. 4.604 . 1,812 53. 3.282
10 207. 3.906 : 1.497 53. 2.24111 196. 3.698 1. 353 53, 1.83012 17J. 3.208 1.192 53, 1.93713 179. 3.377 1.712 53. 2.93?14 110. 2.075 0.958 53. 0.91715 176. 3.321 1.516 53. 2.29916 212. ,-.'. 4.000 J....,::- 1.494 53. 2.23117 143. 2,698 1.'422 51. 2.02218 134. 2.57 1.576 53. 2.48519 150. 2.830 I. 707 33, 7.913
RESULT FOR THE STATE OF THE SCHOOL
RESULTS FOR PENNSYLVANIA SCHOOL CONSUL TANT.
4 TOTAL AV E '2 Ar,E st,nt v. N VAR I ANCE
1 4R. 2.132 1.181 22. 1.394
2 ' 50. 2.273 0.703 22, 0.494
3 52. . .. . 2.364 1.049 22. 1.100
4 . 5.3;. . , .; 2.409 1.333 22. ..1.777
5 51. 2.318 1,287 221 1.656
7 82. 3.727
2..6583471.
1.633 22.
72.6 70. 3.18?
9 105. ' 4.773 1.602 : :' 22. 2.5651.838
..
8 : 63, ''l 2.86', 1.356
t-7 10 - 98. - ---L------.-- 4.455 1.503 ..:.:-.:-.:J. 22. ........ 2.260.
11 77. 3. 500 1.406 22e 1.976
12 6? 2.818 1.402 22. 1.965
13 77. 3.500 1. 845 22. 3.405
14 . 45. 2.045 1090 22. 1.186
7?. ' 4;03.213 1.453 3 : 22. '' I :".', 2.11316 !---1" 84. 3 1 -= 22. 1.43i: 1 77517 57. 2.591 1.297 22. 1.68?
18 46. 2.091 1.306 22. 1.706
19 51.. 2.455 . 1.711 22 2 9264411 ;
-265-

RESULTS FOR NEW YOvK SCHOOL CONSULTANTS
711 I it AVf R 1iI 91. 2,92 9) 2,9583 83, .6774 78. 2.5165 70. 2.2586 97. 2,9687 134. 4. 3)38 111. 3.5119 139. 4.484
10 109. 3.51611 119, 3.83912 108. 3.43413 107. 3. 29014 65. 2.09115 104. 3. 35516 128. 4.12917 2. 77418 83. 2.83919 95. 3.087
J
ST .1)C1.'.520.,7951.2491.1220.8151. 3541.`17'-)1,6'01.9641.3871.3191.3341.6370.87)1.5821.6071.5211.6951.680
RFSULT FOP THE TYPE IF SCHOOL
RESULTS FOR PILOT SCHOOL CONSULTANTS
of TOTAL1 79.2 69.3 66.4 64.
51.6 75.7 99.8 , 90. 3.7509 117. 4.875
10u 96. 4.00011 97; 4.04212 80. 3.33313 83. 3.45814 50o 2.08315 86.` 3.58316 96.. 4.000t17 77.
fa3. 208
18 67. 2.79219 77. 3.238
NVFP, AG":3.29?2.87521.7502.667
?Of13.1254.125
ST.r)EV,1,6C1,0351.3271.3730,9321,1911.5971.7751.650
ay 1.4741.4881.5231.6631.0181.5861.5321.6151.3171.383
31.31.31.31.
vARIA'JCF2,195,).63?1.5591.2580.665I. P32
JI. 2.49?31. 7.71831. 3.85031. 1.92531. 1.74011. 1.79131. 1.68031. 0.75731. 2.50331. 2.58331. 2.314
2.87331. 2.824
24.24.24.24,'4.
24,24.24.24.;24.24.24.24.24.24,24.24.
VAR 1 A9CF2.5631.0711.7611.8840, 8SA1.4182.5493.1522.7232.1742.216?.3192.7811.0362.5142.3482.6073.3033.563
-266-
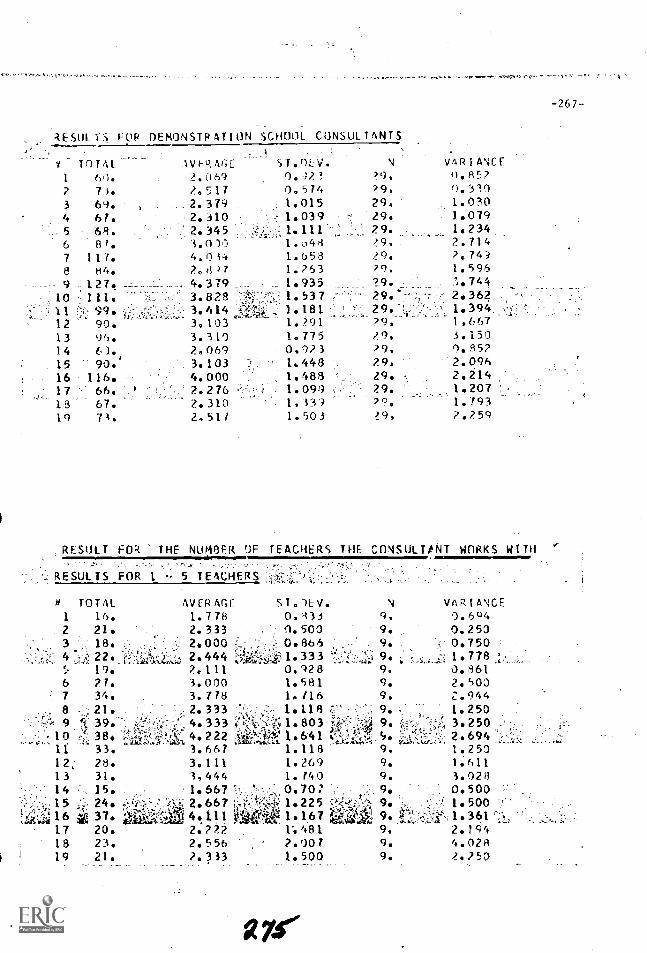
R E SUL N FOP DEMONSTRATION SCHOOL CONSUL T ANTS
I ANCE1 TOTAL IVI-R AGE ST.9E_V N VAR
1 6k). 7.069 9.';73 29.2 73. 7.517 0, 574 79, 0.3393 69. , 2.319 1,015 29. 1.0304 6T. 2.310 = 1.039 ' 29. 1.0795 6;3. 2.345 :=.%.;: 1. 111 : ,,,.. 29. 1.2346 81. 3,030 1.04,3 79, 2.7147 117. 4. n i4 1.653 29. 7,7418 84. ?. tt )7 1.263 ? 9. 1.596
1.935 ?9.10 111. 3.828 ,..., 1.537 ,- -. 29. ---- ,, ';- 2.362
'' .., 11 ''.". 99. ,--.',..- - 3.414 1,181 ',"- 29. '... -`, ': 1.39412 90.
,,,..,.:t,;;_.,3.103 1,291 29. 1,667
13 96. 3.310 1.775 29. _.1)5014 6), 2.069 0.92 3 29. 0.852
1 15 90. 3.103 ":. 1.448 29, 2.O916 116. 4.000 1.483 29. 2.21417 66.
. .2.276 1.099 79 1.207
18 67. 2.310 1,i3') ?0, 1.79319 73. 2.511 1.503 29. 2.259
RESULT FOR THE NUMBER f)F TEACHERS THE CONSULTPNT WORKS WITH
RESULTS FOR 1 - 5 TEACHERS
t$ TOTAL AVER AGE ST . -)E V. N VAR I ANCEL 16. 1.778 0.'333
: .,9. 9.694
2 21. 2.333 (1.500 : 9. 0.2503 ?AB. .: , ; 1:: 2.000 '...; 0.866 : ..: , 9. ''. 0.750
= 4 '.;,: 22. :?,:i'Az'.41.4 2.444 1,7:?if,'.:: 1.333 '';' .: '': ; 9. 7. :- 1.778.`.. 19, 2.111 0.728 9. 0.8616 27. 3.000 1.581 9. 2.5007 34. . 3. 778 1. 116 9, Z.944
. .. 8 ::, 21. .. '... 2.333 ..' 1.118 ,..,:- : ".: 9. .. r- 1.2509 'i 39..- z '..''' '..'.': 2.": 4.333 :i'-''):1':6 1. 803 ;f.'ir .: :4 9. 3.250 .'..,-.
., ',, io ,;:!, 38* ,:,::,;',,, 4. 222 :,ii:e144,,,! 1. a 641 ;.",i,.;' cs,:i:AL
1.2699.
12; 28. 3.111 9.13 31. 1,444 1. 140 9. 3,020
1.567 0.70: ,' ":. 9. . 0.500, 15 :',i',, 24. 2.667 ,,.1'., 2',-4 1.225 E:*..,i;:;,,, 9. 1 1.500
,Ltii:,,,L 16 i 37. ... LI 4.111 .!?01.167 ga ,-.1. 9.I.,.. - 1.36117 20. 2.222 1..681 9,
2+18 23. 2.556 ?.007 9. 4.02881 19 21. 2.333 1.500 9. 250
_
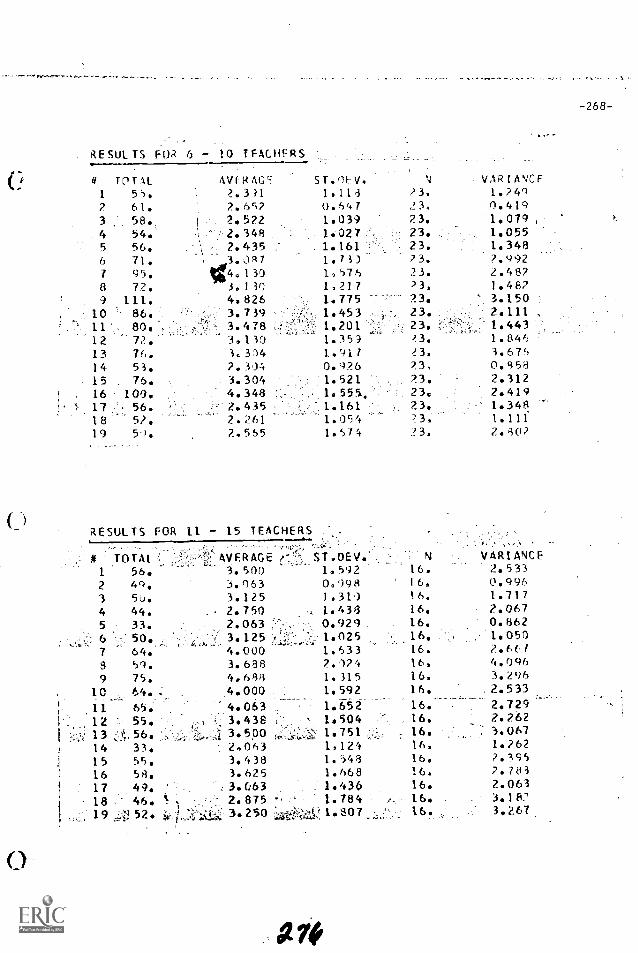
RESULTS FOR 6 - 10 TFACHFRS
# TOTAL AVRAG": sr.oEV. 4 VARtlikiCF
1 55. 2.3)1 1.113 23. 1.24g2 61. 2.692 0.647 23. 0.4193 : 58. J 2.522 1.039 23. 1.0794 54. j-2.348 .
1.027 * 23. 1.0555 56, \ : 2.435 . 1,161: 23. 1.3486 71. , 3.37 1.733- 23. ?.992
7 95. /t.130 1,576 23. 2.4928 72. 3.130 1,217 23, 1.48?9 111. 4.826 1.775 -, 23. 3.15010 ' 86. 3.739 1.453 23. 2.11111 80. 3.478 '; 1.201' 23, 1.44312 72. 3.130 1.359 23. 1.84613 76. 3.314 1.917 23. 3.676
14 53. 2.304 0.926 ?3. 0.85915 . 76. 3.304 1.521 2.3, 2.31216 ' 100. 4.348 1.555. 23. 2.41917 56. 2.435 1.161 73. 1.34818 5?. 2.261 1.054 23. 1.11119 50. 2.565 1.674 23. 2.902
RESULTS FOR 11 - 15 TEACHERS
TOTAL1 56.2 49.3 5u.
4 44.5 33.
64;9 5q.9 75.
10 64.:11 65.12 ;. 55.1314 33.15 55.16 58.
17 49.18 46. .
19w 52.
AVERAGE3. 5003. 0633.1252.7502.0633.1254.0003.6984.6894.0004.0633.4383.5002,0633.4383.6253.0632.8753.250
C_)
ST.OEV. * N VARIANCE1,592 16. 2.5330,099 16, 0.996
1.310 16. 1.7171.439 16. 2.0670.929 16. 0.8621.025
,16. 1.050
1.633 16. 2.6672.12', 16, 4.0961.315 16. 3.2961,592 16. ,2.533
_...-.....
1.652 16.._
2.7291.504 16. 2.2621.751 ,,,.:. 16. 3.0671.124 16. 1.2621.149 16. 2.3951.668 16. 2.7831.436 16. 2.0631.784 16. ', 3.1811.807 -, 16. 3.267
-268-
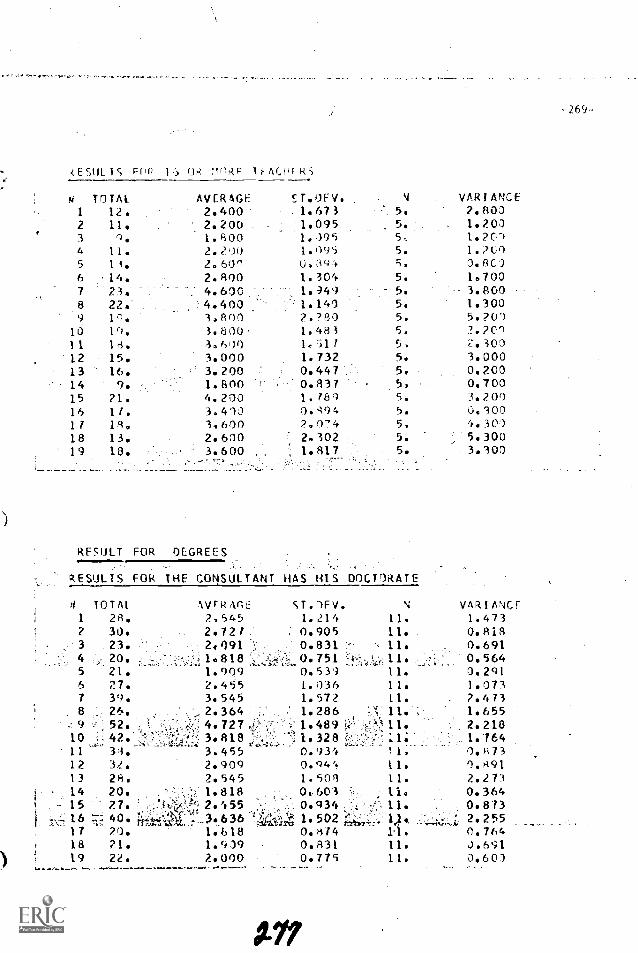
ESULIS FrIP !InRE li-ACHFRS
VARIANCE4. TOTAL AVER AGE Er.OFV.1 12. 2.400 1.673 5. 2.8032 11. 2.200 1.095 5. 1.2003 1 1.800 1.595 5 1.20744 II. 2.290 5. 1.2005 1 2.601 0.394 5. 0.6C16 14. 2.800 1.304 5. 1.7007 23. 4.600 1.49 5. 3.8008 22. 4.400 1.143 5. 1.3009 1,-), 3.800 2.?85 5. 5.200
10 1(). 3.800 1.483 5. 2.20111 15. 3.610 1.51/ 5, '%.300
12 15. 3.000 1.732 5. 3.00013 16. 3.200 0.447 5. 0.20014 9. 1.800 0.837 5, 0.70015 21. 4.200 1./89 5. 3.20016 17. 3.410 5.494 5. 0.30017 18. 3,600 2.074 5, 4.30018 13. 2.600 2.302 5. 5.30019 18. 3.600 . 1.817 5. 3.100
RESULT FOR DEGREES..RESULTS FOR THE CONSULTANT HAS HIS DOCTORATE
4 TOTAL1 28.2 30.3 23.
21.6 27.7 39.8 26.
10 ;; 426
11 33.
AVritr0E2,5452.7272,0911.8181.9092.4ti53.5452.3644.7273.8183.4552.9092.5451.8182.4553.6361.6181.9392.000
1213
14
32.28.20.
15 27.16 :7; 40.17 20.18 21.19 22.
S T. 1FV.
1.2140.9050.8310.7510.53')1.5361.572
' 1.2861.4891.3280.9340.94,1.5000.6030.9341.5020.8/40.8310.775
A77
VAR I ANGF
11. 1.47311. 0.81811. 0.69111. 0.56411. 0.29111. 1.07311. 2.47311. 1.65511. 2.210:1. 1.16411. 0.87311. 0.89111. 2.27111. 0.36411. 0.873
2.2551.1 0.76411. 3.69111. 0.601
-269-
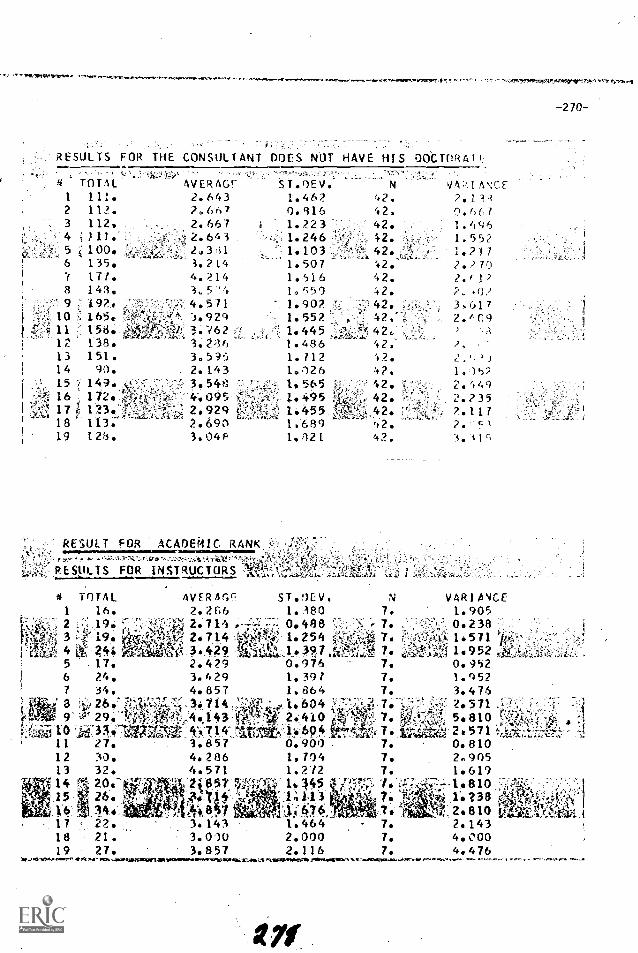
;
'
RESULTS FOR THE CONSULTANT
1
234
6
8" 91011
13141516171819
TOTAL111.112.112.71100":
135.177.143.1.92.165.
t38.151.
90.49.149.
112.123.113.-
` .
'4-
AVERAGE
%II),
t
,
2.6432.2.667
4-113:6
42145
4.571
3.7623.2;163.5952.14335"4.00952,9292 903,04P
DOES NOT HAVE HIS 9OCTOR4Tr-
ST.OEV. N ANCF1.462 42. 2.1 3'-q0.916 42. 0.6611.223 42. 1.4961.246 42. 1.5521.103 42. , 1.2171.507 :2. 2. )71)1.516 42.1.550 42. 2. .0/1.902 42. 3,6171.552 2.1 091.445 -4'r 42 2
1.486 4-2;1.112 '.2.1.026 42,1.565 2.449
1.052
1495 42.1.455 Z,14-,XT, 42. .4; 2.1171.689 21.021 42. 3. Al5
RESULT FOR 'ACADEi.IIC RANK, c , _ ;
P StIL 1 S FOR INSTRUCTORS %-?,1-- - rfd
e TOTAL AVER Ar,f7 S T. 9E V. NI VAR I ANCE2.26 1.380 77. 1.9051 16.
2 r"-.: ,1(:), -," .",,,r.:.:''4.,I 2.71' ,.. 01.24:48 -.':?':- -' 7: ,,..- ----,-1.;1';,: 01! 527381;,,r. 1.r, -..,; ..3 r'f 19. 'Vlr'' 2.714 ''-"---t
-270-
"-
*.; 4 &.' Vti, lit AV, 'ii1+2 9, e-'- 1.397 --r,:e 7. ii,1,-Y.4:;.; 1.952 01..4.f.r'!-;....-'...,:1,._-.5 17. : 2.429 0.976 7. 0.9526 24. 3.429 1.391 7.
7. 3.4761.952
7 34. 4.857 1.864.:. : i N4'1 . ,-'i ";/ 2: ? 571 J'.7-'7'.'3 .;,., 2b ..;"e°,':;;;
.17. ,-*/ 4 I 604 7 '. ....0,, . . - ....-.i,t1' ...'e :.4v...--- .* .- ..,41,9" -:.r.`' 29,,1,%y`,..-0 , .:.4.143 , ...2.4 /0 ,f; ':,,,&' "Nr,..,,,,k-q.. 7. V.,..!....1,'--,,-.., 5. 8101,4I-7,i. .10 .' i.7733 .1';;II .77:::-ft.17t- -16714' 't it -4''.1'.'604' vi''.?ro,&,..; / . 1.17.ititc....-''' 2 b 571 :'eliTi.j..-t".7:7;::;." '4
11 244 . 3067 0.90) . 7. 0.81012 N3. 4.286 1.704 7. 2., 90513141511$-:.
171819
32..r.(4- 20
:;-- ..28.
.., I, 34..-..' 22.
21.27.
'''''''.,,''
....: .ii.,.- .
:'
.
4.571 1.212 7. 1.61921357 F'-'''f- '''7,i' I. 34 47"-(. 1. -:'-,t7;::;=7:-;.16.810t 47,
't-4"4" '.:W:lt-A 4.'-' '.' '1.41) --, 7. 1:238::..14.3, fli-',, ,to -...:.7... -,,,i,' 2.810 1.1.
3.143 1.464 - 7. 2.1433.010 2.000 7. 4.0003.857 2.116 7. 4.476
liff.4.1**14,.,no,asimPtakalffilfrtafriesinrsrp3AMO.L.,,A7W-1-2.1147.W.ORrOstoalrne
elf
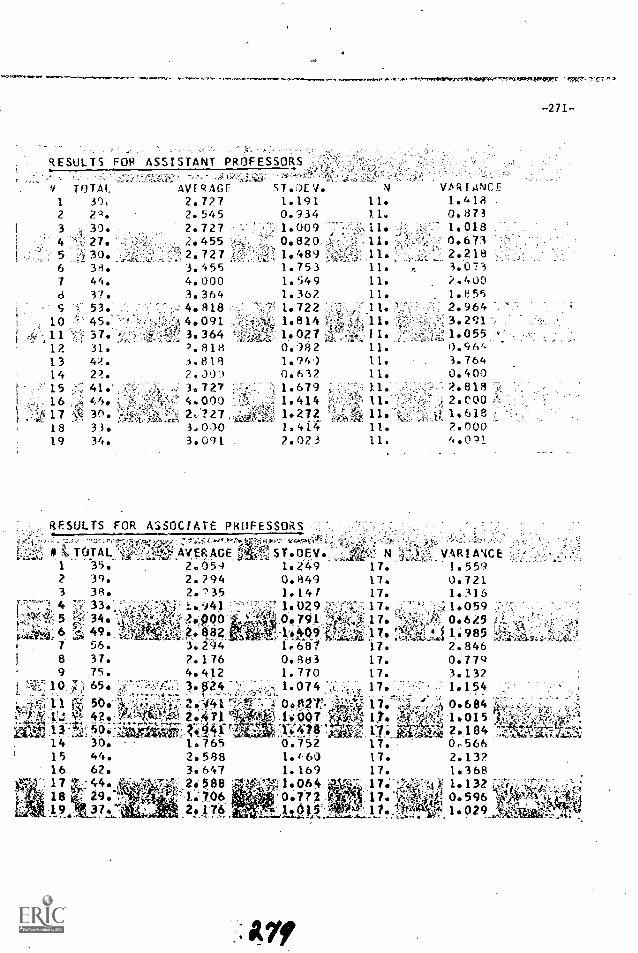
I
RESULTS FOR ASSISTANT PROFESSORS
0 TOTAL AVERAGE ST.OEV. N VARIANCE1 30,
2 2P.3 H4 30.4 27.5 jr 30.6 38.7 44.d 37.
2.7272.5452.7272.4552.7273.4554.0003.364
1.1910.9341.0090.820.1.4891.7531.5491.362
11.11.11.
: 11. ;
,11.11.11.11.
1.4110.8731.0180.6732.2183.0732.4001. e 55
S 53. 4.818 1.722 2.96410 45. 4.091 1.814 i 11. 2- 3.29111 37. 3.364 1.027 1. 1.05512 31. 7.818 0.982 11. 0,96'-13 42. 1.919 1.94 ) 11. 3.76414 2. 2. )3 0.632 11. 0.40015 41.' 3.727 1.679 U. 2.81916 44. 4.000 1.414 11. 2.00017 3° 2:'727 1.272 g' '4;1,11 -f 1.61918 33. O'0 1.414 11. 2.00019 34 3 . 09 1 2.023 11. 4.091
RESULTS FOR ASSOC( ATE PROFESSORS ,.----..----.TOTAL: AVERAGE
1 .35. 2.0592 39. 2.2943 313 2.7354 7:1 33., ; I.,, 9415 ,Vii, 34 ''.- ?.0006 --:a. 49. ..,'4, 2, 8827 56. 3.2948 37.
15 44. 2.58816 62. 3.647
1..." ". 17 Ti'i,', 44. '''''' 2.58818 .<'; 29* ' .7 1:10619 ' ,ir,.: 2. 176...,. . ..
2.1769 75 4.412
10 ;1: 65. 3.a244.k.17.. 11 a 50..
2.471
14-t42'
30.' 1.765
.
-271-
STOP/. N ANCE1.249 17. 1.5590.849 17. 0.7211.141 17. 1.3161.029 p-'1A: 17. 1.0590* 791 17. 0.6254.40_ 17. 'ZA4 1.989/.687 17. 2.8460.883 17. 0.779
{
1.770 17. 3.1321.074 17. ''' 1.154
....,.
1 7. . -;-_,., -,.; 0.684 ii.o....., .. . :047
0.7521. e 601.1691.064,0072
tAkeit:
1,7* ;4114:YeA 1.0151-1 deract14 2.18417. 056617. 2.13217. 1.36817. 1.13217. 0 596
1.029 .
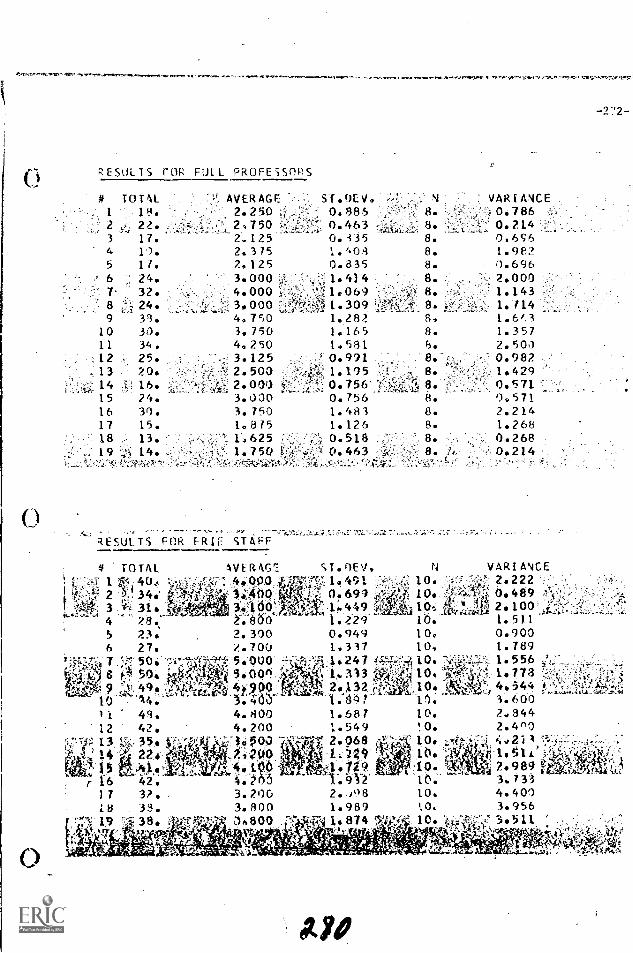
0
RESULTS (-OR FULL PROFESSORS
# TOTAL1 19.2 22.
17.4 19.,5 17.6 24.7. 32.8 x 24.9 38.
10 30.11 34.12 25.13 20.14 16.15 24.16 30.17 15.18 13.19 14.
RESULTS
AVERAGE2.250
,t2,7502-1252.3752.1253.0004.0003.0004.7503.7504.250
'3.1252.5002.001
-3.0301.7501.875
'.1'36251.750
FOR ER IF STAFF
TOTAL1
,14 2 34.3 315 23.6 27.
50:g 5049 ;k 44,to 4.
11 48,12 42.13 L'4 3514 ik 2?.15 PA,41
r f6 42.17 3?. .
18 33.19 38.
AVERAG`l
U401;1.-, .34 06::1:66.62.300.2.7005.0005499r!'
-,z,A 4i 9 003.466
r
4.8004.200
(:)p
0.4(4.4.00
053.2003.900tan 800
S 1.0EV.0.8860.463 "r,0. -3351.4-09
0.8351.4141.0691.3091.2821,1651.5810.9911.1950.756'0.7561.4831.1260.518,0.463
(.1.1/EV!, 1.4910.6991;4491.7290.9491.3171.247
2.132
1.6871.5492.068
,14/29
2. i981.9891.874
VAR 1AICE0.7860.2140.6961.9820.6962.0001.1431.1141.6/,31.3572.5030.9821.4290.5710.5712.2141.2680.2680.214
-272-
N VARIANCE10. ' 2.22210. 0.489I() `.kir 2.100 . ,,,:10. 1.511'10. 0.90010, 1.78910. 1.55610. 1.77310. 4.54411. 3.60010. 2,8440. 2.4°0
IN .'q- tiv211 't10. M1
.- 1.514'10. 2.98910. 3.73310. 4.40010. 3.95610. 3011
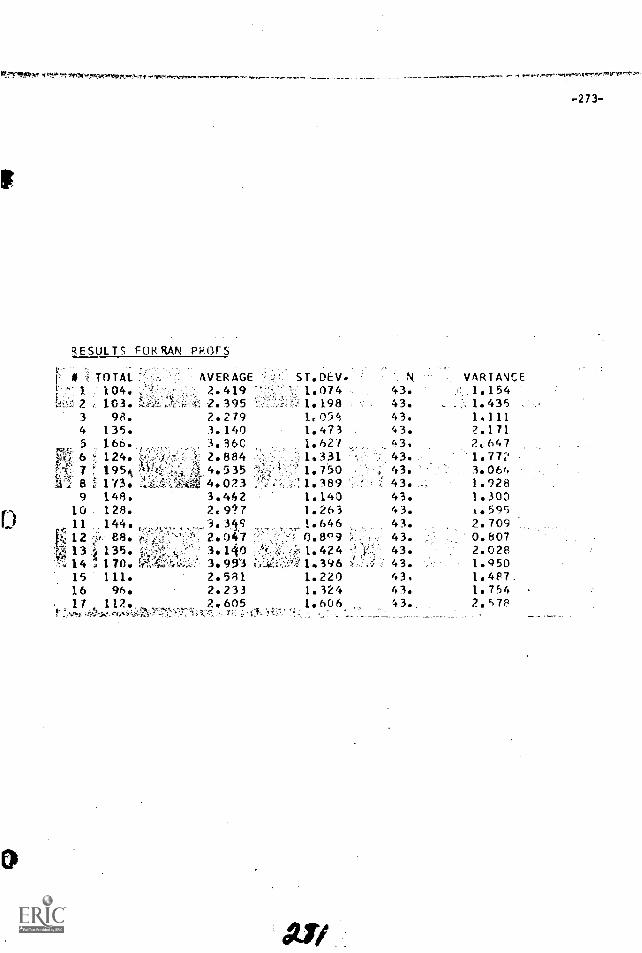
0.:1°.5,937? ,t.,` .
I
w ,11
RESULTS FORRAN PROFS
"' i ST. DEV,1.0741.1981,0541.4731.62 I
:,: 1,331i" 1.750
-r: .:.. 1.3891.1401.2631.646
, 0.8°9.,!... ..:,. ,;?. 1.424;,1:.:-;::,',:1,''' 1.396
1.2201.3241.606
3`..f- !, Z Y. ' . .'
,
.
-r: :
. ''' .,. '!,
'.;;-. ..::''.. *K.:.-t,' < :
1 I
NI,
43.
43,43.43143. .
43.43. ,....43.43.43.43.43.43.43.43.t3..
..
.
VARIANCEJ! 1.154-;, 1.435
1.1112.1712,6471.7723.0641.9281.3001.5952.7090.8072.0281.9501.4871.7542.57P
r # i'. TOTAL ',,-. : AVERAGE1 . 104. 2.4192 .? 103.
''2. 395
3 98. 2.2794 135. 3.1405 166. 3.360
W.;44) 6 t 124. 'f., ; ,''' . 1: ' .;.. 2.884c,k,.,,,: 7 1954, ,.' a 4.535
8 1 173. ..-...4..-..i....:A.,ta 4.0239 148. 3.442
10 128. 2.9'?11 144. 3.3i912 -..i:,. 88. 2.04713 7t1 135. 3.1i0'zi or ',..1.,: . ,,
'..', 14 :, 170. it',..4,..; `,W;,:-.:.:: 3.987315 111 2.58116 966 2.23317 112s 2,605
F ' -,,,,. 4.)--z...,-,....i,,,Z7"..:7-'-::'i'A%-.- f-:: :;,
AT/
-273-
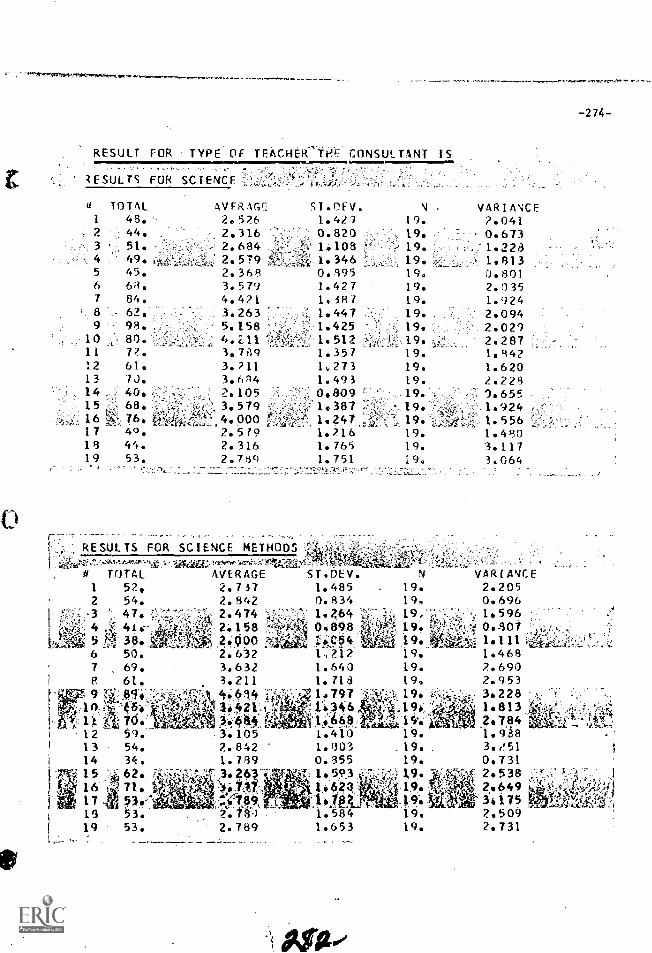
MA,
RESULT FOR
0 TOTAL1 48.'2 44..3 51. 2.6844 49. 2.5795 45. 2.36A6 68. 3.579
TYPE OF TEACHER TPE CONSULTANT IS
AVERAGF:2.526
.2.316
789
10111213141516171819
84.62.98.80.
61.7J.40.68.76.49.44.53.
4.4213.2635.158
3.7893.7113.684ZeI053.5794.0002.5792.3162.789
ST.OFV.1.42'70.8201.1081 3460.1951.4271.3871.4471.4251.5121.3571 y 2731.493
RESULTS FOR SCIENCE METHODS
19.19.19.19.19.19.19.19.19.19.19.19.19.
-274-
VARIANCE7.0410.6731.2281.8130.8012.0351.9242.0942.0292.2871.9421.6202.228
, 0.809 :::.'' 19. 1.655-'-: 1.387 7-:',- ..:19. % 1.924
1.247 19., , ,-
9 1.556..,..,f
1.216 19. 1.4901.765 19. 3.1171.751 19. 3.064
TOTAL AVERAGE ST .DEV.1 52.2 54.
-3 47445 V1,38.6 50.7 69.P, 61.9 ;' 49it , 70.12 59.13 54.14 34.15 .- -, 62.16 r 71.17 53.
2.7372.8422.474 `2,::-
2.49°2.632
...4
3.6323.2114$.44514 :34;421
i 3ii,40.3.1052.8421.789
,..:71. 3* 263'$ii,1,.0''.
,..eot4
1.4850.834
1,. 1.2.64,0,898.;.: !SY.1..2121.6401.713
v 1,7971046.4;668J1.4101.1030.3551.541 4.1.623
i
19 53. 2.78-2 1.584
I,- ..-19 53. 2.789 1.653
N19.19.19,-19.19.19.19.
19,19.
19.
VARIANCE2.2050.6961.596
1.1111.4682.6902.9533.2281.8132.7841.9183.,!510.7312.5382.64931752.5092.731
. 19. .
19.
19.19.19419.
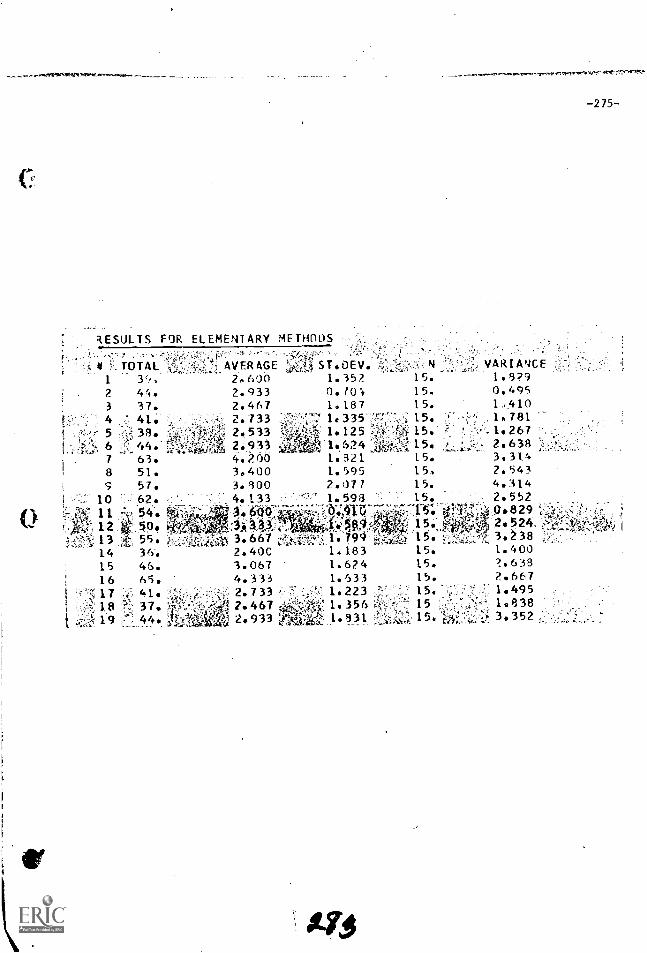
0
RESULTS FOR ELEMENTARY METHODS. . _
-,ti :.. TOTAL '1,..,:,:,,,,.. ) AVERAGE )-.2.:t ST , OEV. --.; ..:..: N ..,;,: VARIANCE1 3,!,2 44.3 37.4 ,*: 41.5 ;I:,. 33.
1 , 6 :: 44.
8 51.7 63.
9 57.10 '-' 62.
2.600 1.35? 15.2.933 0.70 '', 15.2.467 15.1.187
-" 2.733 ,-''''.': I c 335' :;'1,-, : 15. :f! :''
';',4rk.11:i, 2s 533 :,-.7;14,..,,i I s 125 :-., 't : P A 15. -7 !;.
.1::,,',:47A,;;:rs:; 2. 931 1.624 : '&4,1' :.: 15. ;.,,,.;
3.400:
1.595 15,4. b 1.321 15.()
3.300 2.071 15.: 4133 ''''.7'''' 1.598 ,I : 15.
1.8290.4951...4101.781
;-. 1.2672.638
2.5433.314
4.314.- 2.552
11 ;.';=. 54. :''''-- *.600:7..7:7,-,47,t,C;Ift1;,71---,:i>..715.. .0,829 .-1,-;'..T,:
12 .',, 5 . ';i0,0:, ;I: ;:i2;01,:f-4, ' .15'4,,, 1
3 * 5 =:..,. '..;:::::,i,tilk 36667 :.:'...t.I"-,t'... i i. 94 tl,:i:,-.,c,.:4-15 '::-.,...,,,
14151617
-1.
19
36-. 2.400 1.18346. 3.067 1.62465. 4.333 1.633
;;.,;'. 41. 2.733 ' 7' : ' 1.223 :;:. 154
..:37s :z'''.&'':' .,°:It'i 2.467 -.4. -14- -' 1.356 ',f.1,:e' -"
L 4 .":.01 .. '...ki-A-''' 933 e,;C:::.a:z',.:' 1. i9':. 44. A,4 4. k :.. ',t;,,:
Arl
15. 1.40015. 2.63815. 2.667
,:: --":: ..s. 1.49515 r. 1.83815 3.352::;'51'.: -....:, V:
-275-