document de travail - banque de france · document de travail n° 291 direction gÉnÉrale des...
TRANSCRIPT

DOCUMENT
DE TRAVAIL
N° 291
DIRECTION GÉNÉRALE DES ÉTUDES ET DES RELATIONS INTERNATIONALES
BANKS' FINANCIAL CONDITIONS AND THE TRANSMISSION OF MONETARY POLICY:
A FAVAR APPROACH
R. Jimborean, J-S. Mésonnier
September 2010

DIRECTION GÉNÉRALE DES ÉTUDES ET DES RELATIONS INTERNATIONALES
BANKS' FINANCIAL CONDITIONS AND THE TRANSMISSION OF MONETARY POLICY:
A FAVAR APPROACH
R. Jimborean, J-S. Mésonnier
September 2010
Les Documents de travail reflètent les idées personnelles de leurs auteurs et n'expriment pas nécessairement la position de la Banque de France. Ce document est disponible sur le site internet de la Banque de France « www.banque-france.fr ». Working Papers reflect the opinions of the authors and do not necessarily express the views of the Banque de France. This document is available on the Banque de France Website “www.banque-france.fr”.

Banks’ financial conditions and the transmission of monetary
policy: a FAVAR approach∗
Ramona Jimborean† and Jean-Stephane Mesonnier‡
September 2010
∗We would like to thank Karim Barhoumi, Florin Bilbiie, Stefano Neri, Tao Zha and an anonymousreferee, as well as participants at the Second IJCB Financial Stability Conference on the Theory and prac-tice of macroprudential supervision hosted by the Banco de Espana (Madrid), the 2010 CEA Conference(Quebec), the 2010 Transmission Channel workshop of the Basel Committee Research Task Force (Paris)and seminars at the Banque de France and the ECB, for valuable comments and suggestions. We arealso grateful to Benoıt Mojon and Dalibor Stevanovic for sharing their codes with us. Jocelyne Tanguyprovided excellent research assistance. Last but not least, we thank our colleagues from the French Su-pervisory Authority for granting us an access to the BAFI database and, in particular, Stephane Chouardwho coded the requested extraction routines. The views expressed in this paper are those of the authorsand do not necessarily reflect those of the Banque de France.
†Banque de France, Direction des Etudes et des Relations Internationales et Européennes, Service desRelations Européennes, 49-1487 SRE, 39 rue Croix des Petits Champs, 75001, Paris, Tel: +33 1 42 92 6130, Email: [email protected].
‡Banque de France, Direction des Etudes Monétaires et Financières, Service de Recherche en EconomieFinancière, 41-1391 RECFIN, 39 rue Croix des Petits-Champs, 75001, Paris, Tel: + 33 1 42 92 91 63,Email: [email protected].
1

Abstract
We propose a novel approach to assess whether banks’ financial conditions, as reflectedby bank-level information, matter for the transmission of monetary policy, while recon-ciling the micro and macro levels of analysis. We include factors summarizing large setsof individual bank balance sheet ratios in a standard factor-augmented vector autoregres-sion model (FAVAR) of the French economy. We first find that factors extracted frombanks’ liquidity and leverage ratios predict macroeconomic fluctuations. This suggests apotential scope for macroprudential policies aimed at dampening the procyclical effects ofadjustments in banks’ balance sheets structure. However, we also find that fluctuationsin bank ratio factors are largely irrelevant for the transmission of monetary shocks. Thus,there is little point monitoring the information contained in bank balance sheets, above theinformation already contained in credit aggregates, as far as monetary policy transmissionis concerned.
JEL Classification: E44; E52; G21.Keywords: Monetary transmission; Credit channel; Factor Augmented Vector Autoregres-sion (FAVAR).
Résumé
Nous proposons une méthodologie originale pour évaluer dans quelle mesure la situationfinancière des banques, telle que mesurée à l’aune de ratios de bilans au niveau individuel,importe pour la transmission de la politique monétaire, tout en réconciliant les niveauxd’analyse micro- et macroéconomique. Nous insérons ainsi dans le cadre standard d’unmodèle FAVAR macroéconomique des facteurs qui résument un large ensemble de sériesde ratios bilantiels bancaires individuels. Nous trouvons en premier lieu que les quelquesfacteurs extraits de séries de ratios de leviers ou de liquidité de l’actif bancaire prédisentpour partie les fluctuations macroéconomiques. Ceci tend à légitimer la mise en place depolitiques macroprudentielles visant à atténuer les effets procycliques des ajustements debilans bancaires. Cependant, nous trouvons également que les facteurs tirés des ratiosbancaires importent peu pour la transmission de chocs monétaires à l’économie. En con-clusion, du point de vue de la transmission de la politique monétaire et dans la mesureoù les agrégats de crédit habituels font déjà l’objet d’un suivi attentif, l’information addi-tionnelle contenue dans les bilans bancaires individuels semble présenter peu d’intérêt.
Classification JEL: E44; E52; G21.Mots-clés: Transmission de la politique monétaire; canal du crédit; modèles FAVAR.
2
1 Introduction
The subprime crisis and the fears of a widespread credit crunch it has fueled over 2008-2009
in most developed economies has highlighted the importance of sound financial conditions
of banks for the ability of monetary policy rate cuts to effectively curb the contraction in
credit supply to the economy. Over the last decade, the dominant view of the monetary
policy transmission mechanism mainly pointed to the importance of the expectations
channel of monetary policy, where monetary policy influences output and prices merely
through the expected path of future short term rates.1 By contrast, the recent crisis
helped dramatically to revive the complementary “credit” view, according to which banks’
individual reactions to monetary policy decisions matter much for the overall level of
activity. As in previous episodes of wide-ranging bank capital depletion, like in the US in
the early 1990s or in Japan later in that decade (cf. Bernanke and Lown, 1991; Woo, 2003),
empirical assessments of the bank lending and the bank capital channels have recently
gained a heightened attention in both academic and policy circles (see e.g. Adrian and
Shin, 2009a).
However, the practical relevance of the credit channel for monetary policy has been
one of the most fiercely debated empirical issues in monetary policy for at least two
decades.2 Broadly speaking, empirical research has followed two main routes so far, one
based on detailed individual bank information, the other based on measures of credit at
the aggregate level, but both remain relatively inconclusive regarding the macroeconomic
significance of financial frictions at the bank’s level. We propose here a new approach that
reconciles the use of both types of data: microeconomic bank data for a large population
of French banks and a rich macroeconomic database for France. While the choice of this
1See for instance Blinder (1998), Bernanke (2004) and Woodford (2005).
2For a general perspective on the credit channel issue, and the usual distinction between the so-calledbank lending channel and the balance sheet channel of monetary policy transmission, see Bernanke andGertler (1995). For a view of this debate at the euro area level, see Angeloni et al. (2003).
3

country is partly dictated by issues of data availability, testing the importance of banks’
financial conditions for monetary policy transmission is of particular interest in the case of
France because its financial system is (still) largely bank-based rather than market-based.
As hinted above, a first strand of the applied literature has endeavoured to identify
the role of bank heterogeneity and loan supply effects at the micro level, running panel
data regressions on bank balance sheet data in order to investigate the determinants of
individual credit fluctuations (see for instance Kashyap and Stein, 1995; Ehrmann et al.,
2001). These studies have highlighted the impact of several banks’ characteristics, such
as total assets’ size, capitalization and liquidity ratios, on a differentiated response of
bank loans to monetary policy shocks. Typically, the traditional bank lending channel
of monetary policy transmission appears then to be stronger for small, poorly capitalized
and/or less liquid credit institutions.3 However, a limit to the policy relevance of this
literature is that little can be inferred from the results of micro data studies about the
macro consequences of bank balance sheet constraints. As argued by Ashcraft (2006), on
the basis of such panel data regressions, one cannot tell whether the financial frictions, at
play in the bank lending channel and affecting for instance small banks, do really account
for a significant part of the dampening of real activity that follows to a monetary policy
tightening.
A second strand of the literature then relies on the estimation of small monetary VARs
at the macro level, following notably Bernanke and Blinder (1992).4 Indeed, impulse
response functions derived from simple structural VAR models that factor in a few macro
variables (e.g. GDP, inflation and a measure of the policy stance) provide a useful device
for evaluating monetary policy transmission. By adding a credit aggregate variable to
3See for instance Kishan and Opiela (2000), Gambacorta and Mistrulli (2004), Engler et al. (2005) forthe US, Italy and Austria respectively, and Loupias et al. (2002) for France.
4See also Ramey (1993), as well as Den Haan et al. (2007), Ehrmann and Worms (2004) and Hulsewig,Winker and Worms (2004) for more recent contributions.
4

this basic framework, it should be easy to gauge the impact of monetary policy shocks on
total credit and the role of credit supply restrictions in economic downturns. In practice,
however, things turn out to be trickier.
First, the estimated response of total bank loans to a monetary policy shock appears
often to be muted and non-significant (Bernanke and Gertler, 1995). A closer inspection of
the dynamics of various aggregate bank credit series -contrasting e.g. loans to households
versus loans to non-financial firms, or short term vs long term loans- shows that this
may result from a compensation effect of diverging responses of the main components in
banks’ loan portfolio (Den Haan et al., 2007; Mesonnier, 2008). In turn, this hints that
a small VAR including only one credit variable is probably misspecified. A solution to
this misspecification problem could then be to add several aggregate loan series to the
VAR; but, as it is well-known, the inclusion of additional variables in standard VARs is
restricted by the degrees-of-freedom problems.5 Second, the information basis contained in
a standard VAR with a handful of macroeconomic and aggregate credit variables appears
to be too narrow, so that a proper identification of credit supply effects remains out of
reach. As a matter of fact, by using a simple VAR framework, it is generally not possible to
tell whether credit contracts after an interest rate hike because banks face a deteriorated
balance sheet and then ration some borrowers within a process of deleveraging (loan supply
effect) or because the deteriorated outlook has shifted down the demand for bank credit
(loan demand effect). Overall, these limitations suggest that an empirical strategy that
would rely on a data-rich environment a la Stock and Watson (2002) and would exploit
information on heterogeneity in individual banks’ financial conditions and the way they
change through time could be more appropriate to detect the potential active role of banks
in the transmission of the monetary policy shocks.
In this paper, we propose to examine the strength of the credit channel while reconciling
5Nevertheless, Giannone, Lenza and Reichlin (2009) propose to overcome this dimensionality problemand estimate such a large scale monetary VAR using Bayesian techniques.
5

the micro and macro levels of analysis into an integrated estimation framework. Following
Bernanke, Boivin and Eliasz (BBE, 2005) and Boivin and Gianonni (2009), we employ
a factor-augmented vector autoregression model (FAVAR) that we extend to explicitly
include factors reflecting relevant fluctuations in a set of individual bank balance sheet
ratios. A key feature of the BBE framework is to extract estimates of macroeconomic
factors that affect the data of interest by exploiting the information contained in a large
set of economic indicators. According to BBE (2005), the FAVAR framework leads to a
better identification of the monetary policy shock compared to standard VARs, since it
accounts explicitly for the large information set that central banks do monitor in practice
and also because it does not require to take an ‘ex ante’ stand on the appropriate measure
of economic concepts such as inflation or real activity, that are treated as latent common
components. Finally, another appealing feature of the FAVAR approach is that the impulse
response functions to a monetary policy shock can be computed for any variable included
in the data set, while the dimensionality of the estimated VAR is kept reasonably low.
We implement this methodology in the case of France over the period 1993-2009, with
quarterly data. The novelty of our approach consists in the parallel extraction of dynamic
factors from large datasets of bank balance sheet indicators. Using French supervisory
sources, we construct an original database of disaggregated bank financial ratios for a
large set of French credit institutions, making up to 70% of total domestic bank credit. We
consider this way, in our application, the information contained both in a macroeconomic
database comprising a large number of macroeconomic indicators and in a microeconomic
database. We then use the FAVAR setup to quantify the specific impact of banks’ financial
conditions, if any, on the response of key macroeconomic variables to monetary policy
shocks.
While our methodology closely follows on Boivin and Gianonni (2009), who focus on the
role of international factors in the transmission of US monetary policy, our interest in the
6

role of bank level information is to our knowledge quite a novelty in the FAVAR literature.
We are aware of only a few recent studies that go along a similar route. Gilchrist, Yankov
and Zakrajsek (2009) extract unobserved factors from a broad array of corporate bond
spreads and study the macroeconomic impact of shocks to these measures of credit risk
in a FAVAR model of the US economy. Boivin, Gianonni and Stevanovic (2009) perform
a similar exercise, but implement a different identification scheme of credit shocks which
allows an economic interpretation of the (transformed) PCA factors. While close in spirit
to ours, these studies do however not deal directly with monetary policy transmission and
do not consider disaggregated bank data. By contrast, Dave et al. (2009) investigate
the dynamic response of both credit aggregates and bank level loan growth measures to
a monetary policy shock using disaggregated US bank data. However, they mainly focus
on the differentiated responses of different types of loans, in the spirit of Den Haan et
al. (2007), and do not use their FAVAR model to assess as we do whether fluctuations
in banks’ financial conditions (and their dispersion) significantly alter the transmission of
monetary shocks to the broader macroeconomy.
Thematically, our work of course fits in with the abundant credit channel literature.
However, more specifically, it can be related to a series of recent attempts to bridge the
gap between microeconomic information about the health of financial institutions and
the macroeconomy. Among these are recent studies by Adrian and Shin (2009b) that
highlight the procyclical role of US investment banks’ leverage, as well as somewhat earlier
research by Peek, Rosengreen and Tootell (1999, 2003), who use a summary of US bank
level supervisory information to identify the effect of loan supply shocks on GDP and
its main sub-components.6 The latter notably find that bank supervisory information
predict macroeconomic fluctuations, and they provide evidence that this information is
in fact used by the Federal Reserve to conduct monetary policy. However, they do not
6Their summary variable is the percentage share of bank assets that fall within the CAMEL 5 ratingcomputed by the US Federal Reserve (i.e. the share of the riskiest part of the regulated US bankingsystem).
7

formally examine the consequences of fluctuations in their bank health indicator for the
transmission of monetary shocks.
Our main results are twofold. First, it appears that the first two principal components
extracted from banks’ liquidity or leverage ratios are quite correlated with industrial pro-
duction and housing market conditions and that they predict macroeconomic fluctuations.
This suggests a potential scope for macroprudential policies aiming at dampening the pro-
cyclical effects of changes in banks’ balance sheets structure. Second, we nevertheless find
that the fluctuations in banks’ financial conditions do not matter much per se for the
transmission of monetary policy shocks to the French economy. In other words, there is
little point monitoring the information contained in bank balance sheets above the infor-
mation already contained in credit aggregates, as far as monetary policy transmission is
concerned.
The rest of the paper is organized as follows. Section 2 reviews the econometric frame-
work and the estimation approach, with a detailed presentation of the data used in our
estimation. In Section 3 we present the latent factors and the comovements between the
macro and micro factors. Section 4 investigates the role of the bank-level factors in the
monetary policy transmission mechanism. Section 5 concludes.
2 Econometric Framework: FAVAR
We aim to evaluate the importance of individual banks’ financial conditions for monetary
policy transmission in the case of France, a country for which we have access to a rich
supervisory database. In other words, we seek to estimate to what extent the specific
response of banks’ financial conditions enhances or mitigates the effect of monetary policy
on the economy. In this section, we first describe the empirical model and the estimation
approach. This doing, we closely follow the lines of Boivin and Giannoni (2009).
8

2.1 Description of FAVAR
We consider an econometric framework based on a standard macro FAVAR model, that we
extend to include additional factors summarizing the financial health of individual banks.
We assume that the macroeconomic conditions can be adequately summarized by a K× 1
vector of unobserved components or factors, Ct, while another K∗ × 1 vector of factors
C∗t is enough to describe the financial conditions of the banking sector. Note that, in
what follows, the variables related to microeconomic information on banks will always be
denoted with a star (∗). In practice, we can assess the state of the economy and the health
status of resident banks using (1) a large vector of macroeconomic indicators (denoted by
Xt) and (2) a vector of individual bank balance sheet indicators for a large number of
banks (denoted by X∗t ). These vectors are of dimension N × 1 and N∗ × 1, respectively.
We assume that the macroeconomic indicators are related to the state of the econ-
omy and that disaggregated bank balance sheet ratios are related to the overall financial
conditions of the banking sector according to the following observation equations:
Xt = ΛCt + et (1)
X∗t = Λ∗C∗t + e∗t (2)
where Λ and Λ∗ are matrices of factor loadings and the N×1 (and N∗×1) vectors et and e∗t
stand for (mean-zero) series-specific components. By construction, these specific terms are
uncorrelated with the common components Ct or C∗t within each equation, but are allowed
to be serially correlated and (weakly) correlated across indicators. Note that the number
of common factors is assumed to be small relative to the number of indicators (N > K
and N∗ > K∗). Within this framework, Ct and C∗t represent two sets of components,
common to all data series in each block and, in general, correlated across the two sides of
9

the economy (macro conditions vs bank financial conditions).
The common factors should be understood as pervasive forces that drive the common
dynamics of the data in each block, summarizing at each date either the state of the “real”
economy or the financial strength of banks, as reflected by the equations (1) - (2). The
variables in Xt are then taken as noisy measures of the underlying unobserved factors Ct.
This means, for instance, that GDP growth, which belongs to the vector of macro series, is
a noisy measure of “real activity”, while the liquidity or leverage ratio of a bank j, which
belongs to the vector of banking sector series, is a noisy measure of the financial health of
the overall banking sector. We note that, in principle, it is not restrictive to assume that
Xt depends only on the current values of the factors, since Ct might capture arbitrary lags
of some fundamental factors.7
The dynamics of the common factors, i.e. the transition equation, are modeled as a
structural VAR:
Φ0
C∗t
Ct
= Φ(L)
C∗t−1
Ct−1
+
v∗t
vt
(3)
where Φ0 is a matrix of appropriate size on which we later impose some restrictions, Φ(L)
is a lag polynomial of finite order, and the “structural” shocks vt and v∗t are assumed to
be i.i.d. with zero mean and diagonal covariance matrix Q and Q∗ respectively. These
shocks are uncorrelated, but anyone of them may affect common factors of the other block
(French economy versus banks’ financial conditions) immediately or over time, through
the off-diagonal elements of Φ0 and Φ(L). By premultiplying both sides of (3) by Φ−10 ,
7Stock and Watson (1999) refer to (1) as a dynamic factor model.
10

the structural VAR has then the following reduced-form representation:
C∗t
Ct
=
Ψ11(L) Ψ12(L)
Ψ21(L) Ψ22(L)
C∗t−1
Ct−1
+
u∗t
ut
(4)
where the reduced-form innovations ut and u∗t may be cross-correlated.
Since we are interested in characterizing the effects of monetary policy on the economy,
we want to include in the vector of macroeconomic common components an observable
measure of the monetary policy stance. As it is commonly the case in VAR studies
of monetary policy in European countries, we consider here that the 3-months money
market rate, Rt, (i.e. the 3-months PIBOR before 1999 and the 3-months EURIBOR
afterwards) is an appropriate measure of the monetary policy stance in France over the
period from 1993 to 2009. The short term interest rate is thus allowed to have a pervasive
effect throughout the economy and is considered as a common component of all macro
data series. This way, we can write
Ct =
Ft
Rt
(5)
where Ft is a vector of latent macroeconomic factors summarizing the behavior of the rest
of the French economy.
2.2 Estimation
We estimate the empirical model using Boivin and Gianonni’s (2009) variant of the two-
step principal component approach developed notably by Stock and Watson (2002) and
BBE (2005).
The first step consists of extracting separately principal components from Xt and X∗t
in order to obtain consistent estimates of the common factors under the structure laid
11

out. As stated above, we impose the constraint that the short term interest rate is one of
the factors for the set of macroeconomic series. This guarantees that the other estimated
latent factors recover dimensions of the common dynamics that are not captured by the
short term interest rate. Starting from an initial estimate of Ft, denoted by F(0)t and
obtained as the first K − 1 principal components, we thus iterate through the following
steps:
1. Regress Xt on F(0)t and Rt, to obtain λ
(0)R .
2. Compute X(0)t = Xt − λ
(0)R Rt.
3. Estimate F(1)t as the first K − 1 principal components of X
(0)t .
4. Back to 1.
As far as the common factors spanning individual bank balance sheet data are con-
cerned, we do not impose any constraint in the first step. We simply estimate F ∗t as the
first K∗ principal components of X∗t , where X∗t collects series of individual bank ratios as
explained below in the data section.
In the second step, the short term rate is added to the estimated macroeconomic factors
Ft and the VAR in Ct and C∗t (equation 4) is estimated. The matrix polynomial Ψ21(L)
is then of particular interest, since it captures the lagged effect of banking conditions on
macroeconomic factors. Note that the VAR coefficients Ψij(L) are identified provided that
the variance-covariance matrix of the innovations[
u∗′
t , u′t
]′is non-singular. In particular,
a sufficient condition for the coefficients in Ψ21(L) to be identified is that the factors
standing for banking conditions do Granger-cause macroeconomic factors, an issue that
we explore below.
12

2.3 Data Description
We use two distinct sets of data for the estimation of the FAVAR: a bank level one and
a macroeconomic one, both over the period 1993:2 to 2009:1, with quarterly frequency.
Regarding the first dataset, a distinctive feature of our study is that we make use of a large
database of disaggregated bank balance sheet information as collected by the French su-
pervisory agency (Commission bancaire). This database is particularly attractive because
of its exhaustive coverage of all credit institutions chartered in France.8 Nevertheless, its
time depth is limited - bank balance sheets details are only available (with this broad cov-
erage and under consistent reporting guidelines) since the first quarter of 1993. Although
this tends to limit econometric investigations, it may also be noted that the year 1993
coincides with the adoption of Bank of France’s independence by law, as well as with the
launch of the last stage of the convergence process towards the EMU. This way, the pe-
riod from 1993 to 2009 may be seen more convincingly as a single monetary policy regime,
without any significant structural break (a point that we will discuss more in depth below,
while presenting the impulse response functions computed from the FAVAR).
The macroeconomic dataset comprises 68 macroeconomic series, 60 series for the
French economy and 8 series for the German economy. All macro series have been trans-
formed to induce stationarity when necessary, as indicated in the Appendix. Other details
about data sources and definitions are also provided in the Appendix. The inclusion of
some key German series is motivated by the fact that the French monetary policy was
largely tied to the monetary policy of the German Bundesbank during the run-up to
the EMU and, notably, from 1993 on, within the frame of the European exchange rate
mechanism. Including measures of both French and German activity, inflation and money
prevents the implicitly estimated monetary policy function within the FAVAR to suffer
8Note that this balance sheet information is collected on a territorial basis, which means that creditgranted by subsidiaries of French banking groups abroad is not reported.
13

from significant structural breaks due to the introduction of the euro and the consecutive
delegation of the French monetary policy to the ECB. In particular, we rely on the fact
that both countries, taken together, account for roughly half of the GDP of the entire euro
area and behave (partly by construction) in a quite similar way to the euro area average
which is the relevant aggregation level for the ECB since 1999.
Our initial bank-level dataset, with some 620 credit institutions at sample end, is
not directly suitable for the purpose of factor analysis because of (1) the high degree of
heterogeneity between institutions of different types and (2) the wide-ranging process of
concentration within the French banking sector during the 1990s: indeed, the number of
institutions shrunk by a factor 2.5 over the period from 1993 to 2009, implying that many
banks were not observable over the whole period. Selecting an adequate sub-sample of
banks involves thus a difficult trade-off. The right balance has to be struck between, on
the first hand, keeping enough individual banks to catch something of the dispersion of
banks’ financial conditions in the estimated factors, and, on the second hand, discarding
enough a-typical small institutions so that the few PC factors we extract from the final
sample are economically meaningful.
To alleviate the heterogeneity issue and focus on “banks” as commonly understood (i.e.
credit institutions whose business is to some large extent to collect deposits from the public
and grant credits to non-financial agents), we first removed several categories of specialized
credit institutions. These special categories include specialized financial institutions (such
as leasing banks, customer credit institutions, factoring institutions etc.), municipal credit
institutions and regional development institutions. We also dropped the regional branches
of the three large mutualist and cooperative banks (in order to avoid double counting when
the group head also reports for the entire network), the regional saving banks affiliated
to a large savings bank network (whose individual ratios were suspected to be affected by
important within-network transfers), as well as the branches of foreign held commercial
14

banks (whose credit policy and financial health may be relatively immune to local economic
conditions).9 Finally, we also dropped commercial banks that operate only in the French
overseas territories. Overall, this preliminary cleaning leaves us with a population of 105
banks at sample end, accounting for 77% of total customer credit and 79% of total assets
in the initial database.10
At this stage of the database cleaning process, the population of banks remains still
very heterogenous in terms of assets size and business profile. A quarter of these institu-
tions are very small banks, mainly private banks, local banks or specialized institutions,
with a total of assets below 500 millions euro each at sample end. Since the unobserved
factors C∗t are extracted by unweighted principal components analysis, keeping so many
small banks implies that the information from the small banks ratios (that have little
macroeconomic significance but are often more volatile) can have a disproportionate bear-
ing on the estimated factors, which would be detrimental to their economic significativity.
We thus chose to drop from the above selected categories the banks belonging to the first
quartile in terms of mean total assets.11 Besides, as the FAVAR approach requires a bal-
anced dataset, we are forced to keep only the banks for which we have data over the entire
period 1993-2009.12
Combined, these two steps reduced the population to a sample of 60 banks, making
up nearly 71% of total customer credit (and 71% of total bank assets). For each of these
9For instance, Peek and Rosengreen (2000) show that the lending capacity of branches of Japanesebanks in the US, in the late 1990s, was heavily constrained by the capital crunch faced by the motherinstitutions in Japan, leading to severe restrictions in the US commercial mortgage market.
10Customer credit is defined throughout as loans to non-banks in the supervisory database.
11The 26 banks thus discarded have average total assets below 405 millions euros over 1993-2009.
12This doing, we obviously created a potential for a selection bias problem. An alternative, oftenconsidered in papers running panel regressions on individual bank data, consists of reconstructing mergersand acquisitions backward in time, in order to keep information both from target and buying banks beforethe M&A (cf. for instance Loupias et al., 2002). This approach means in practice adding the correspondingbalance sheet items of both banks prior to the merger. We think this method would be inappropriate forthe purpose of our analysis, since it would end up creating individual measures of banks’ financial healththat did not exist in reality, adding this way uncontrolled sources of noise into the data.
15

banks, we constructed three different financial ratios as defined below in more details.
Finally, a visual inspection of these ratios, cross-checked with the results of standard
Bai and Perron tests of mean stability, revealed large statistical breaks for about half of
these institutions, the bulk of them being again smaller banks accounting together for
some 2% of total credit. We could check that these breaks are generally not explained
by either acquisitions or changes of regulatory category, but may reflect other sources of
statistical noise like changes in capital detention or business lines, about which we have
no information in the database. We thus decided to correct for the biggest breaks using
a simple statistical procedure along the lines of Den Haan et al. (2007). More precisely,
for each ratio dataset, we computed growth rates of the ratio series and identified outliers
as values distant from the cross sectional mean by more than 2.63 standard deviations.
We replaced these outlier growth rates by the corresponding cross sectional means. Index
ratio series were then reconstructed using the corrected growth rates and starting from
the initial level values of the ratios. Finally, we dropped 8 banks, mainly market banks,
that presented more than 20% outliers for at least one of the ratios.13
The resulting final sample consists of 52 commercial and cooperative banks accounting
for 70% of total loans granted by all credit institutions at sample end (and 69% of total
assets). Figure (1) shows the share of our sample in the total of bank loans over the whole
period (1993:1-2009:1). This share increased somehow through time, staying between 66%
and 70% since early 1997.
For each bank in the sample, we define three ratios that capture key dimensions of a
bank’s financial situation: one liquidity ratio and two leverage ratios, a total (or broad)
leverage ratio and a credit (or narrow) leverage ratio. Both types of ratios have been
identified in the empirical panel literature as important determinants of banks’ reaction
to monetary policy shocks, in line with the standard descriptions of the credit channel
13In the final ratio datasets, the outlier detection procedure implied a correction of 3% of the observationsin the case of the broad leverage ratio, and less than 2% for the other ratios.
16

and the renewed versions of the same theory (like the bank capital channel of Van den
Heuvel, 2002). The introduction of total leverage ratios is also motivated by Adrian and
Shin’s (2009c) recent findings that the total leverage of at least some US credit institutions
is highly procyclical and their proposal that banks’ leverage should be more closely and
systematically monitored in a macroprudential perspective.14
We compute firstly an indicator of bank liquidity (labelled LIQ in the following), which
we define as the ratio of liquid assets to total assets. Liquid assets are computed as the
sum of cash, interbanking transactions, securities bought under repurchase agreements
and securities held in the trading portfolio.
Secondly, we define our broad measure of leverage (LEV1) as the ratio of total assets
to tier one capital. This broad leverage ratio is thus the inverse of the capitalization ratio
often considered in earlier panel data studies.15 Finally we also compute a narrow measure
of leverage (LEV2), defined as the ratio of customer credit to tier one capital. Although
less frequently used in the academic literature, this second leverage ratio is monitored by
the French regulators on a regular basis, which motivates its inclusion in our study.16
Table (1) presents some descriptive statistics for our sample in 1999 Q1. Note that the
sample, although relatively small and centered on banks of relatively close types, is still
quite diverse along the standard dimensions explored by the credit channel literature, be
it in terms of size (with total assets ranging from 268 millions euro to 1,390 bns euro),
liquidity (with a ratio between 1% and 99%), or leverage (with a broad ratio between 1.2
and 125).
Factor estimation using principal components requires stationary times series.17 Al-
14Regulatory capital ratios would have been equally interesting candidates, but this information was notavailable with enough time depth to be used in a time series analysis.
15See, for instance, Kishan and Opiela (2000) and Loupias et al. (2002) for the French case.
16Cf. for instance Commission bancaire (2009, p. 69 et sq.)
17Although simple methods have been proposed to estimate consistent factors from non-stationary panel
17

though it seems reasonable to assume from an economic point of view that bank ratios
should be stationary, standard unit root tests reveal that it is not always the case from a
statistical point of view in our sample.18 Neglecting the results of such tests and keeping
stochastic trends in the ratio datasets may lead to inconsistent estimates of the bank ratio
factors and spurious correlations of these factors with the most persistent macroeconomic
series in our database, in particular interest rates. We thus took the first difference of
the individual ratio series that showed a unit-root at the 95% probability level, and left
other ratios series unchanged.19 Last, note that, following common practice, all macro and
micro series were demeaned and standardized before extraction of the factors by PCA.
2.4 Specification of the FAVAR
The empirical model presented above is a dynamic factor model that links a large set
of observable indicators to a small set of common components through the observation
equations (1) - (2). The evolution of the common components is then specified by the
transition equation (3) or its reduced-form representation (4). Theoretically, to the extent
that we keep a sufficiently large number of common components from the PCA of each
data block, the estimated factors collected in Ct and C∗t span the same space than the
unknown “true” factors or latent variables that drive the set of noisy indicators Xt and X∗t .
The issue of the number of factors selected is thus an important one in theory. In practice,
however, there is still no clear consensus about the right analytical criteria for the choice of
this number and numerous applications rely on judgemental or empirical evidence like, for
instance, the change induced to the estimated impulse response functions (IRF) when new
factors (accounting for a smaller part of the database variance) are added to the FAVAR
data (see the PANIC methodology by Bai and Ng, 2004), such methods are not suited for datasets mixingstationary and non-stationary series. Besides, the FAVAR approach requires stationary factors.
18We ran ADF tests with a constant and a number of lags selected according to the AIC.
19Between 64% and 83% of the ratios were considered as having a unit root, depending of the type ofratio.
18

model.20
In our case, it should be borne in mind that the class of specifications we can consider
is severely constrained by the sample size (64 quarters of observations), which especially
limits the number of lags in (4) as the number of factors gets larger. We want to include
more than one common component from a given bank ratio dataset, in order to assess
the potential impact of bank heterogeneity on the economy. Nevertheless, small sample
size prevents us from including simultaneously common components from all three ratio
datasets. We do then consider three distinct FAVAR models, replacing X∗t with each of
the three ratio datasets in turn.
We thus based the choice of the numbers of factors on two empirical criteria. Firstly,
we computed Bai and Ng (2002) PCP2 and IC2 criteria, which indicated a maximum
number of two factors for each of the three ratio datasets for the baseline sample of
banks. Secondly, for each type of bank ratio, we estimated a FAVAR with up to six
macroeconomic factors (including the short rate) and up to three common components
from individual bank series. It appears that the form of the IRF to monetary policy shocks
is quite robust to the inclusion of additional factors when at least four macro factors are
included in the model. Whatever the bank ratio considered, our preferred specification of
the corresponding FAVAR thus includes four macroeconomic factors and two bank ratio
factors, and the transition equation (4) has 1 lag.21
20This is the route followed e.g. by BBE (2005), Boivin and Giannoni (2009) and Boivin, Mojon andGianonni (2008).
21Results from standard tests of lag selection were mixed. The Schwartz information criterium suggestedone lag in the various FAVAR models, generally in line with the Hannan-Quinn criterium, while the Akaikeinformation criterium suggested from 2 to 5 lags depending on the model.
19

3 Bank balance sheets factors and macroeconomic dynamics
We first aim at clarifying how the factors summarizing French macroeconomic dynamics
relate to disaggregated bank-level factors, as extracted separately from three microeco-
nomic datasets of individual liquidity and leverage ratios. In this section, we thus use
the common factors extracted from our various datasets and first determine the fraction
of fluctuations in indicators of real activity, inflation, credit aggregates and interest rates
that can be explained by macro and bank-level factors respectively. This first simple look
at correlations and Granger causalities suggests that there is potentially a scope for a
macroprudential regulation of banks’ leverage and liquidity with a view of limiting the
extent of macroeconomic fluctuations induced by banks’ behavior. In the next section,
we will then compare the impulse responses of various key macroeconomic variables when
bank ratio factors are allowed to interact with macro factors or alternatively when this
additional feedback mechanism is artificially shut down.
3.1 Interpreting the latent factors: a first look
We start by examining how the macro and bank ratio or micro factors are correlated with
each others and with key macro variables, in an attempt to roughly characterize these
latent factors. Figure (2) shows the estimated macro factors, while the bank ratio factors
are plotted in Figures (3) to (5).
Table (2) first reports the correlations of the first three macro factors (excluding of
course the short term interest rate, which we force to be the fourth macro factor as
explained above) with a selection of macroeconomic variables. The first latent macro
factor obviously stands for a measure of the business cycle, with a high positive correlation
to GDP growth and its components and a negative correlation to unemployment. The
second macro factor is also positively correlated with GDP growth, but can be more easily
characterized as driven by longer term interest rates, while the third macro factors tends
20

to capture the dynamics of inflation.
Table (3) reports the correlation of the micro factors, as extracted separately from
each of the three bank ratio datasets, with the macro factors. The first LIQ component is
strongly correlated with the business cycle macro factor (and with opposite sign with the
short term interest rate), while the second bank liquidity component is mostly correlated
with the second macro “long term rate” factor, and the correlation coefficients is smaller.
The second LEV1 factor and the first LEV2 factor have similar correlation profiles and are
strongly correlated to the short term interest rate. The other two leverage factors are also
correlated with the “interest rate” and “business cycle” macro factors, but the correlation
is weaker. Overall, these preliminary calculations confirm the intuition that banks adjust
key dimensions of their balance sheets to fluctuations in real activity and market interest
rate conditions. We do not know however to what extent such adjustments are active,
as part of their asset-liability management policy, or passive, as an effect of changes in
demand for credit. Neither can we determine on the basis of this evidence alone whether
changes in bank conditions have an impact on macro conditions.
3.2 Comovements between macro and micro factors
In a second step, we investigate to what extent French macroeconomic variables are ex-
plained by macro versus bank-based factors. To do this, we regress each macro variable on
the three macro factors (including the short term interest rate) or the first two bank-based
factors obtained for a given type of bank ratio, taking each type of ratio in turn. Table
(4) reports the fraction of variance of the series listed (i.e. the R2 of the least squares
regressions) that is explained by the macro factors and the bank ratio factors of each type
(i.e. either related to liquidity or leverage, broadly or narrowly defined), respectively.
As apparent in the first row of the table, the entire macroeconomic dataset, Xt, is on
average strongly correlated with the common factors. The R2 of the macro factors is of
21

0.56, showing that the macro factors capture a good part of fluctuations in the French
economy overall. As could be expected, the first three PCA factors of each set of individual
bank ratios are less correlated with the macro series on average, with an R2 of between
0.11 and 0.28, depending on the type of bank ratio considered.
When looking more closely at selected macroeconomic indicators, we first find that
quarterly growth rates of real GDP, industrial production, HICP inflation, employment
and non-residential investment present high correlations with the macro factors (R2 statis-
tics of 0.84, 0.88, 0.81, 0.80 and 0.67 respectively), while it is far less so for consumption
(be it consumption of durable or non-durable goods). Macro factors also do a good job in
tracking market and credit interest rates. The important point here is that most of the
fluctuations in very cyclical variables are captured by only four macro factors. Note that
the macro factors do also explain some 62% of the variance in house prices and 70% of
the variance in housing loans.
Regarding the results of regressions on bank-level common components, we first find
that bank liquidity and credit leverage factors explain a substantial part of the variance
of housing prices (between 22% and 32%). The correlation with contemporaneous house
price growth, while saying nothing about the direction of causality, highlights the fact that
the recent boom and bust in housing prices over the last decade was largely associated
with changes in individual banks’ balance sheet. Rolling regressions over eight years period
(not reproduced here to save space) show that this correlation was in fact higher, above
60%, over the decade from 1995 to 2005 which corresponds to the boom episode in France.
Second, bank liquidity ratios are highly correlated with average bank interest rates for
new loans, notably housing loans and investment loans to non-financial firms.
22

3.3 Do banks’ financial conditions predict macro fluctuations?
The correlations discussed so far shed some light on the interrelation between macroeco-
nomic conditions and the balance sheets of individual credit institutions. However, we
do not know so far whether changes in banks’ balance sheets are passively driven by the
macroeconomy or whether they actively contribute to shaping the business cycle, as the
bank lending channel would suggest, or at least can help to predict it.
In a first attempt at identifying the information content of banks’ financial conditions
for future macroeconomic conditions, we computed standard Granger causality tests within
each of the three FAVAR models with bank ratio factors. Table (5) reports in rows the
results of tests of the joint significance of bank-level factors of a given type (as stated in
columns heads) in a regression of each macro factor over all lags of all macro factors and
lags of the bank ratio components. Under the null hypothesis, bank-level factors have no
predictive power. The upper panel reports results of estimations over the whole sample,
while the lower panel restricts to the period before the onset of the subprime crisis in
2007Q3.
The results show that the three types of bank ratios do not have the same informational
content for macroeconomic conditions. The information extracted from narrow (respec-
tively large) bank leverage predicts three (two) of the macro factors over the whole period,
and of up to four macro factors over the pre-crisis period (at the 10% level). In particular,
bank leverage factors consistently predict the short term interest rate and the “business
cycle” factor one quarter ahead. In contrast, factors summarizing bank liquidity mainly
predict the second macro factor, and, over the pre-crisis period, the “business cycle” fac-
tor. By the way, these results confirm that the coefficients Ψ21(L) in the reduced form
model (equation 4) are determinate, at least some of them.
While preliminary, the outcome of these causality tests suggests that microprudential
regulations of liquidity or leverage of credit institutions should also matter in a macropru-
23

dential perspective.22
4 Implications for the Monetary Transmission Mechanism
We have documented so far that common components from key individual banks’ bal-
ance sheet ratios commove with selected macroeconomic variables and, to some extent,
drive changes in broad macroeconomic conditions. A natural question that arises then is
whether the endogenous reaction of individual banks to an unexpected monetary policy
impulse significantly alters the response of aggregate variables of interest (like GDP or
consumer price inflation). The standard theory about the credit channel of monetary pol-
icy transmission suggests that the endogenous response of banks may amplify the effects of
a monetary tightening, e.g. due to an increase in the external finance premium required by
banks in face of an induced deterioration of borrowers’ creditworthiness (financial acceler-
ator effects) or, similarly, a rise in the external finance premium faced by banks following
an induced deterioration in their own assets value (bank capital channel). Alternatively,
theories of credit rationing suggest that capital shortages or liquidity constraints on the
side of banks may, on the contrary, dampen the response of bank credit to monetary policy
attempts at loosening overall financial conditions.
We investigate here this issue within the FAVAR framework presented above in section
2, following a general approach initiated by Boivin and Gianonni (2009). More precisely,
we compare the impulse response functions (IRF) of selected macroeconomic variables to
a 100 bp monetary policy shock under alternative hypotheses regarding the coefficients
Ψ21(L) in equation 4, which links macro factors to lagged bank-level factors. The difference
between the IRF when this block of coefficients is set to zero and when it is left unrestricted
provides a measure of how important the endogenous response of individual banks’ balance
sheets is for the monetary transmission mechanism in France. In other words, the larger
22Note however that our measure of leverage is the total asset ratio to book equity capital, whichsignificantly differs from the ratio of capital to risk-weighted assets usually monitored by bank supervisors.
24
the difference, the more a model of monetary policy transmission which includes only
money and credit aggregates is misspecified.
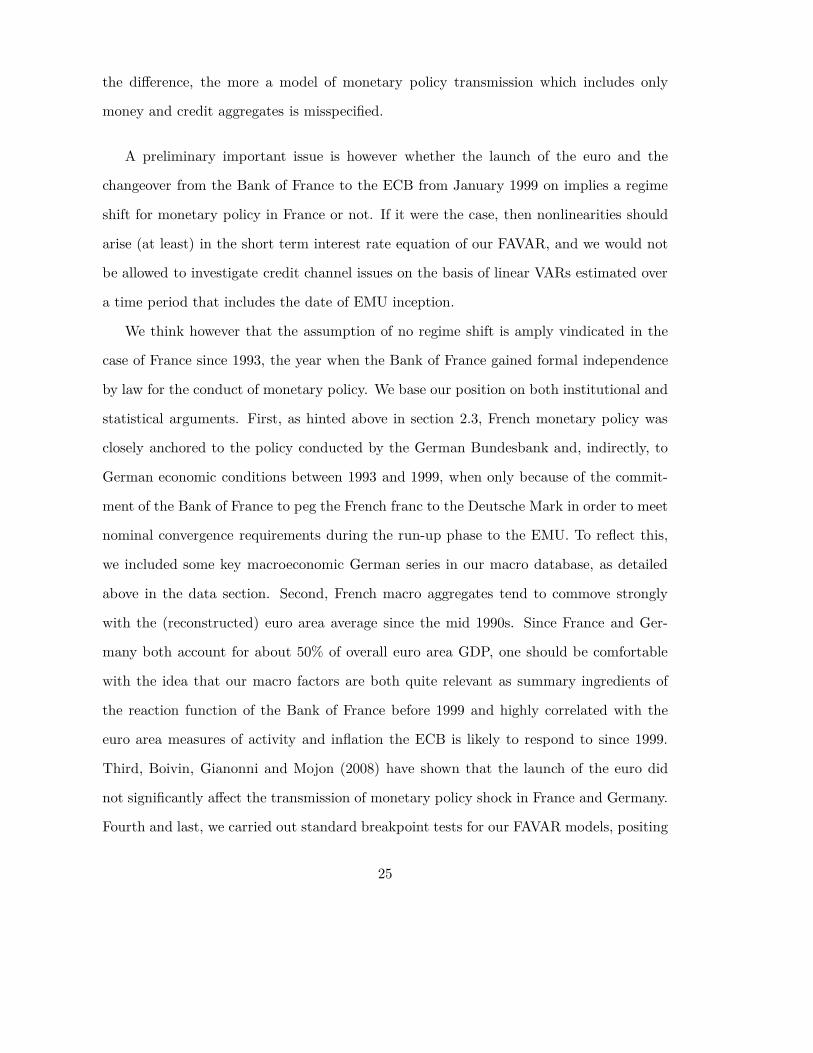
A preliminary important issue is however whether the launch of the euro and the
changeover from the Bank of France to the ECB from January 1999 on implies a regime
shift for monetary policy in France or not. If it were the case, then nonlinearities should
arise (at least) in the short term interest rate equation of our FAVAR, and we would not
be allowed to investigate credit channel issues on the basis of linear VARs estimated over
a time period that includes the date of EMU inception.
We think however that the assumption of no regime shift is amply vindicated in the
case of France since 1993, the year when the Bank of France gained formal independence
by law for the conduct of monetary policy. We base our position on both institutional and
statistical arguments. First, as hinted above in section 2.3, French monetary policy was
closely anchored to the policy conducted by the German Bundesbank and, indirectly, to
German economic conditions between 1993 and 1999, when only because of the commit-
ment of the Bank of France to peg the French franc to the Deutsche Mark in order to meet
nominal convergence requirements during the run-up phase to the EMU. To reflect this,
we included some key macroeconomic German series in our macro database, as detailed
above in the data section. Second, French macro aggregates tend to commove strongly
with the (reconstructed) euro area average since the mid 1990s. Since France and Ger-
many both account for about 50% of overall euro area GDP, one should be comfortable
with the idea that our macro factors are both quite relevant as summary ingredients of
the reaction function of the Bank of France before 1999 and highly correlated with the
euro area measures of activity and inflation the ECB is likely to respond to since 1999.
Third, Boivin, Gianonni and Mojon (2008) have shown that the launch of the euro did
not significantly affect the transmission of monetary policy shock in France and Germany.
Fourth and last, we carried out standard breakpoint tests for our FAVAR models, positing
25

the first quarter of 1999 as a possible break date. Table (6) presents the results of multi-
variate Chow sample-split tests. As it is well known that such tests tend to over-reject the
null of no break in samples of common sizes, we followed Candelon and Lutkepohl (2001)
and computed bootstrapped p-values (with 5000 replications). The results show that the
null of no break in the FAVAR coefficients due to the inception of the euro is confirmed
in all cases, at the 26% level for the “purely macro” model without bank factors and at
levels above 56% for the models with LIQ, LEV1 and LEV2 bank-level factors.
Finally, figures (6), (7) and (8) show the estimated impulse response functions of
selected macroeconomic indicators to an unexpected tightening of monetary policy by 25
basis points. In each figure, the solid lines represent the responses computed for the FAVAR
model based on the sole macro factors while the dashed lines stand for the responses when
the macro model is augmented with two common components extracted from one of the
individual bank ratio datasets (LIQ, LEV1 and LEV2 respectively). The impulse responses
are plotted along with the 70% confidence intervals.23
Regarding first the responses computed for the FAVAR model limited to the macro
factors, the results look in line with usual findings and economic intuition. Following an
unexpected monetary policy tightening, activity declines over the first 6 quarters and re-
sume slowly thereafter. Industrial production gets back to its original level within three
years, while GDP reverts more slowly. Investment, either residential or not, and invento-
ries react more than consumption, while within consumption, consumption of durables is
more negatively affected by an interest rate hike than is the consumption of non-durable
goods. The rate of unemployment reacts sluggishly and employment, which reaches a
low after three years, reverts very slowly to the original level, which may be consistent
with conventional wisdom for France over this period. Interestingly, consumption prices
23We use Kilian’s (1998) bootstrap procedure to compute the confidence intervals. Note that we boot-strap both the estimation of the factors and of the coefficients, so that the confidence intervals also accountfor estimation uncertainty about the unobserved factors.
26

as measured by the HICP decrease slowly over the first three years without the initial
upswing or “price puzzle” that is often obtained within small macro VAR models. The
response of the GDP deflator exhibits some price puzzle, but it is also more muted and
globally non-significant. Housing prices react vigorously and on impact to an interest rate
hike and reach their low within two years. Long term government bond yield as well as
the various bank loan interest rates react also positively on impact to the monetary policy
tightening. Interest rate on C&I loans, which are mostly short term loans indexed on short
term market rates, adjust almost completely, while the pass-through of the short rate to
interest rates on housing loans, which are in France mostly long term fixed rate mortgage
loans, is significantly positive but muted, in line with previous findings for this country.24
Regarding the response of the various types of bank loans at the aggregate level, housing
loans decrease over the first two years, while corporate loans, and notably shorter term
C&I loans, react positively in the short run and recede thereafter.
The “puzzling” positive response of short term C&I loans to a monetary tightening
has already been documented on US data (cf. Kashyap and Stein, 1995; Morgan, 1998;
Den Haan et al., 2007). Several types of explanations for this temporary increase can be
found in the literature. A first line of reasoning points to a demand effect by firms, which
may have to finance an inventory buildup following a monetary tightening or have to
bear temporarily a higher cost for their working capital (cf. Bernanke and Gertler, 1995).
Other authors look for supply effects by banks themselves, which may want to optimize
the return on their credit portfolio and/or adjust their (risk-weighted) assets structure
to keep complying with capital regulation in spite of the adverse effects of the monetary
tightening on their interest revenues and hence on their equity base (cf. Van den Heuvel,
2002; Den Haan et al., 2007). These banks would therefore shift their portfolio towards
short term loans and out of longer term credit, which either typically yield fixed interest
rates (like mortgage loans) or require a higher capital coverage (like long term loans to
24Cf. for instance Coffinet (2005).
27

non-financial firms, at least under Basel I bank capital regulations). However, even if
banks aim at reducing loan supply, this may be delayed by prevailing loan commitments
to the benefits of larger firms, which account for the bulk of commercial bank credit.
Indeed, large firms frequently borrow from commercial banks under loan commitment
contracts so as to secure the volume and conditions of the loans they have over a pre-
agreed period. As Morgan (1998) shows in the US case, loans without commitments do
contract after a tightening monetary policy shock, while small firms also complain about
tighter credit conditions offered by banks. Meanwhile, loans under commitments do not
falter, or they even increase.25 In our case, the significant positive short term response
of inventories points towards a dominant role of credit demand by firms in the positive
response of C&I loans to a monetary shock. Besides, the similar responses of these loans
in the macro FAVAR and in the model augmented for common components extracted from
total leverage ratios (LEV1) hints that the potential bearing of loans supply effects due
to bank capital constraints is limited here.
Overall, figures (6), (7) and (8) show that the responses in the models with bank level
ratio factors are very close, and at least not significantly different at the 70% level of con-
fidence, to the responses obtained in the simpler models that include only macroeconomic
information. Our exercise suggests thus that the specific reaction of individual banks to a
monetary policy shock and the feedback of the induced changes in bank balance sheets on
macroeconomic variables do not significantly alter the transmission process of monetary
policy to the macroeconomy. This does not mean that the banking system and the way
it interacts with non-financial private agents is a pure veil, but merely that the informa-
tion already included in monetary macro variables like aggregate flows of bank credit for
housing or corporate investment purpose is sufficient to capture the macroeconomic con-
sequences of the credit channel. To that extent, the differentiated reactions to monetary
25Note that the argument about loan commitments may also be relevant to explain the shape of theresponse of bank loans for investment purpose.
28

policy shocks that are associated with heterogeneities in individual bank’s balance sheet
structures appear to be largely irrelevant from a macroeconomic point of view.
How do our findings relate with earlier literature? Considering the vast amount of
studies on the credit channel, we find it more useful to focus this discussion on the differ-
ences between this study and two contributions by Ramey (1993) and Peek et al. (1999,
2003), which have particularly close connections with two dimensions of our approach.
In a somewhat older paper, Ramey (1993) did a counterfactual exercise that is formally
close to the one we conducted in this section. Using a small scale VAR model of the US
economy with four variables (output, money, credit and the Fed funds rate), she sets
alternatively to zero the coefficients of the policy variable in either the money or credit
equation, which is equivalent, she claims, to shutting down either the money or credit
channel of monetary transmission. She then compares the impulse responses of output
to a policy shock she obtains with either restricted models to the impulse response from
the unrestricted VAR and concludes that the credit channel in unimportant in explaining
monetary transmission. In his discussion of her paper, Bernanke (1993) sharply criticizes
Ramey’s reading of her results, pointing notably that (1) they are consistent with both
the money and the credit views, as both views imply a quick reduction in bank liabilities,
and that (2) this device alone cannot solve the age-old identification issue of bank loan
supply vs demand effects. Although we agree with Bernanke’s point, we think that they
do not apply to the results presented in this paper. First, we are not interested in assessing
the relative strength of the money channel (or, to put it in more modern terms, of the
interest rate channel) vis-a-vis the credit channel in the particular case of the French
economy. Since our macroeconomic database includes a list of credit aggregates and bank
loan interest rates as well as monetary aggregates, our (restricted) baseline FAVAR with
only macro factors does not exclude the possibility of operative bank lending and balance
sheet channels. Our point is merely to assess the macroeconomic relevance of findings
29

of the empirical literature in the vein of Kashyap et al. (2000), showing that individual
banks with different characteristics in terms of notably liquidity and capitalization react
differently to monetary shocks, which creates a potential for credit restrictions by at least
some banks. Neither do we claim that we can identify (the absence of) loan supply effects
using our methodology. Indeed, we cannot tell a priori whether changes in banks’ financial
conditions as captured by the factors are exogenous or driven by some other shocks to loan
demand: even innovations to the second factors, which take more account of changes in
heterogeneity of the ratios across banks, can reflect the adjustment to idiosyncratic, e.g.
industry specific shocks that affect the customers of some banks more than others and
thus the demand for credit addressed to those banks. To conclude on this, we thus do
not read our results as proving that loan supply effects are unimportant. Instead, we just
conclude that, at least in normal times, this heterogeneity in banks’ financial conditions
does not matter much for explaining monetary transmission at the macro level.
More recently, Peek et al. (1999, 2003) also tried to reconcile micro bank information
with macro outcomes as they used detailed confidential supervisory information to con-
struct an aggregate indicator of banks’ financial health (the share of assets held by banks
viewed by bank regulators as likely to fail, i.e. those with a “CAMEL” rating of 5). Run-
ning univariate regressions, they first find that their bank health variable (but no other
summaries of bank leverage and liquidity ratios) contains useful marginal information to
forecast unemployment and inflation up to four quarters ahead, which suggests that the
Federal Reserve should look carefully at such bank level information from supervisory
sources to conduct monetary policy. On the basis of PROBIT models of the Fed’s target
rate decisions, they also find that the Fed does actually take into account this information.
In their second paper, they then provide evidence that shocks to their CAMEL indicator
do reflect shocks to bank credit supply, which implies that part of the forecasting power of
the bank health indicator for output has a causal interpretation. Our results contrast with
theirs on two points. Firstly, contrary to part of their first findings, our Granger causality
30

tests reported above suggest that even simple bank leverage ratios do help to improve
forecasts of macroeconomic activity. Secondly and more importantly, Peek et al. (2003)
do not formally examine, as we do, the consequences of monetary policy shocks, although
they point in their conclusion to the relevance of their study for quantitative assessments
of the bank lending channel. Instead, they focus on the (difficult) task of identifying loan
supply shocks per se and show that such effects matter for US macroeconomic fluctuations.
However, the mere fact that loan supply shocks exist and are important is a necessary but
not a sufficient condition to prove that banks’ reactions to monetary policy shocks, as a
consequence of financial frictions that constrain adjustments to their balance sheets, do
amplify the effects of the policy moves. Indeed, as Peek et al. (2003) show that their
findings are robust when the bank health indicator has been priorily orthogonalized with
respect to the Fed funds rate (and other state variables), one may think that it is the ex-
ogenous part in innovations to banks’ health which matters (i.e. true loan supply shocks),
not necessarily the endogenous reaction to other shocks. To conclude, their results do not
contradict ours as far as the credit channel is concerned, but instead suggest interesting
avenues for further research on the effects of shocks to banks financial conditions using
our FAVAR framework.
5 Conclusion
In this paper we aim to quantify whether changes in banks’ financial conditions at the
microeconomic level matter at the macroeconomic level, notably by altering the monetary
policy transmission mechanism. Using a unique and comprehensive database of individual
bank balance sheets, we set up a FAVAR framework that allows us to summarize both
overall macroeconomic conditions in the French economy and the financial conditions of
banks resident in France with a small number of factors.
Within this framework, we first provide evidence that the information contained in
31

three types of individual bank financial ratios -capitalization, liquidity and leverage ratios-
explains a substantial part of macroeconomic fluctuations in some aggregate variables,
most notably those related to the housing market (housing prices, residential investment
and housing loans). Moreover, we find that the first two principal components extracted
from individual bank leverage and liquidity ratios have a significant predictive power for
macroeconomic conditions, which suggests that there is potentially a scope for active
macroprudential policies aimed at constraining changes in these ratios.
Finally, we compare the impulse response functions of alternative FAVAR models that
either allow for or restrict the feedback effects of bank-level factors on macroeconomic
ones. We find that the information contained in individual bank ratios, including changes
in balance sheets heterogeneity among banks, does not matter much for the transmission
of monetary policy shocks.
This work could be extended in at least three ways. First, instead of following the
methodology of Boivin and Gianonni (2009), we could implement the recently developed
dynamic hierarchical factor model of Ng et al. (2009), whose advantage consists in distin-
guishing series-specific variations from two types of common variations: those from factors
that are common to units within a block, and those from factors that are common across
blocks. This could allow us to simultaneously consider the inclusion of all three kinds
of bank ratios within the same FAVAR model. Second, it could be interesting to look
at the effects of real demand shocks and see whether bank factors are relevant for the
transmission of such shocks to the economy (as per the financial accelerator hypothesis).
Finally, taking stock of the results of causality tests presented here and as suggested above
by our discussion of Peek et al. (2003), we could investigate within a FAVAR framework
the macroeconomic consequences of shocks to trends or dispersion in banks’ leverage or
liquidity conditions, in the spirit of the tests developed by Gilchrist et al. (2008). This is
but left for further research.
32

References
[1] Adrian, T. and Shin, H. S. (2009a): Prices and quantities in the monetary policy
transmission mechanism. FRBNY Staff reports, No. 396, October.
[2] Adrian, T. and Shin, H. S. (2009b): Financial intermediaries and monetary economics.
FRBNY Staff reports, No. 398, October.
[3] Adrian, T. and Shin, H. S. (2009c): Financial Intermediaries, Financial Stability, and
Monetary Policy. Jackson Hole Economic Symposium Proceedings, Federal Reserve
Bank of Kansas City, 287-334.
[4] Angeloni, I., Kashyap, A. and Mojon, B. (eds.) (2003): Monetary Policy Transmission
in the Euro Area. Cambridge: Cambridge University Press,122-161.
[5] Ashcraft, A. (2006): New Evidence on the Lending Channel. Journal of Money, Credit
and Banking, 38, 751–76.
[6] Bai, J. and Ng, S. (2002): Determining the number of factors in approximate factor
models. Econometrica, 70, 191-221.
[7] Bai, J. and Ng, S. (2004): A PANIC attack on unit-roots and cointegration. Econo-
metrica, 72(4), 1127-1177.
[8] Bernanke, B. S. (1993): How important is the credit channel in the transmission
of monetary policy? A comment. Carnegie-Rochester Conference Series on Public
Policy, 39, 47-52.
[9] Bernanke, B. S. (2004): The Logic of Monetary Policy. remarks before the National
Economists Club, December 2, 2004.
[10] Bernanke, B.S. and Blinder, S.A. (1992): The Federal Funds Rate and the Channels
of Monetary Transmission.The American Economic Review, 82(4), 901-921.
33

[11] Bernanke, B. S., Boivin, J. and Eliasz, P. (2005): Measuring Monetary Policy: A
Factor Augmented Vector Autoregressive (FAVAR) Approach. Quarterly Journal of
Economics, 120(1), 387-422.
[12] Bernanke, B.S. and Gertler, M.L. (1995): Inside the Black Box: The Credit Channel
of Monetary Policy Transmission. Journal of Economic Perspectives, 9(4), 27-48.
[13] Bernanke, B. and Lown, C. (1991): The credit crunch, Brookings Papers on Economic
Activity. 1991 :2, pp. 205-239.
[14] Blinder, A. (1998): Central Banking in Theory and Practice, Cambridge: MIT Press.
[15] Boivin, J. and Giannoni, M. P. (2009): Global Forces and Monetary Polcy Effec-
tiveness. Chapter in NBER volume on International Dimensions of Monetary Policy,
Mark Gertler and Jordi Galı eds., The University of Chicago Press.
[16] Boivin, J., Giannoni, M. P. and Mojon, B. (2008): How has the euro changed the
monetary transmission? NBER Macroeconomic Annuals, forthcoming.
[17] Boivin, J., Gianonni, M. and Stevanovic, D. (2009): Dynamic effects of credit shocks
in a data-rich environment. Unpublished manuscript, University of Montreal..
[18] Candelon, B. and Lutkepohl, H. (2001): On the reliability of Chow-type tests for
parameter consistency in multivariate dynamic models. Economic Letters, 73, 155-
160.
[19] Coffinet, J. (2005): The single monetary policy and the interest rate channel in France
and in the euro area. Banque de France Bulletin Digest,139, July.
[20] Commission Bancaire (2009): Rapport annuel de la Commission bancaire 2008. Paris:
Banque de France.
[21] Dave, C., Dressler, S. J. and Zhang, L. (2009): The Bank Lending Channel: a FAVAR
Analysis. Villanova School of Busniess Economics Working Paper, 4.
34

[22] Den Haan, W. J., Sumner, S. W. and Yamashiro, G. (2007): Bank loan portfolios and
the monetary transmission mechanism. Journal of Monetary Economics, 54, 904-924.
[23] Ehrmann, M., Gambacorta, L., Martinez-Pages, J., Sevestre and P., Worms, A.
(2001): The role of banks in monetary policy transmission in the Euro area. Eu-
ropean Central Bank Working paper series, 105.
[24] Ehrmann, M. and Worms, A. (2004): Bank networks and monetary policy transmis-
sion. Journal of the European Economic Association, MIT press, 2(6), 1148-1171.
[25] Engler, P., Jokipii, T., Merkl, C., Rovira Kaltwasser, P. and Vinhas de Souza, L.
(2005): The Effect of Capital Requirement Regulation on the Transmission of Mon-
etary Policy: Evidence from Austria. Working Paper, 99, Central Bank of Austria,
Vienna.
[26] Gambacorta, L. and Mistrulli, P. E. (2004): Does bank capital affect lending behav-
ior? Journal of Financial Intermediation, Elsevier, 13(4), 436-457.
[27] Giannone, D., Lenza, M. and Reichlin, L. (2009): Monetary analysis with disaggre-
gated variables. Unpublished manuscript, ECB, February 2009.
[28] Gilchrist, S., Yankov, V. and Zakrajsek, E. (2009): Credit market shocks and eco-
nomic fluctuations: evidence from corporate bond and stock markets. forthcoming in
Journal of Monetary economics.
[29] Hulsewig, O., Winker, P. and Worms, A. (2004): Bank lending in the transmission of
monetary policy: A VECM analysis for Germany. Jahrbucher fur Nationalokonomie
und Statistik, 224(5), 511-529.
[30] Kashyap, A. K. and Stein, J. C. (1995): The impact of monetary policy on bank
balance sheets. Carnegie-Rochester Conference Series on Public Policy, 42, 151-195.
35

[31] Kashyap, A.K. and Stein, J.C. (2000): What do a million observations on banks
say about the transmission of monetary policy. American Economic Review, 90(3),
407-428.
[32] Kilian, L. (1998): Small-Sample Confidence Intervals for Impulse Response Functions.
Review of Economics and Statistics, 80(2), 218-230.
[33] Kishan, R.P. and Opiela, T.P. (2000): Bank Size, Bank Capital and the Bank Lending
Channel, Journal of Money, Credit and Banking, 32(1), 121-141.
[34] Loupias, C., Savignac, F. and Sevestre, P. (2002): Is there a bank lending channel in
France? Evidence from bank panel data. Notes d’Etudes et de Recherche, 92, Banque
de France.
[35] Mesonnier, J.-S. (2008): Bank loan portfolios, bank heterogeneity and the bank lend-
ing channel: new macro evidence for France. Unpublished manuscript.
[36] Morgan, D. P. (1998): The credit effects of monetary policy: evidence using loan
commitments. Journal of Money, Credit and Banking, 30(1), 102-118.
[37] Ng, S., Moench, E. and Potter, S. (2008): Dynamic Hierarchical Factor Models.
Working Paper presented at the NBER annual conference, 2009.
[38] Peek, J. and Rosengren, E. (2000): Collateral damage: Effects of the Japanese bank
crisis on real activity in the United States. American Economic Review, 90(1), 30-45.
[39] Peek, J., Rosengren, E. and Tootell, G. (1999): Is bank supervision central to central
banking? The Quarterly Journal of Economics, 114, 629-653.
[40] Peek, J., Rosengren, E. and Tootell, G. (2003): Identifying the macroeconomic effect
of loan supply shocks; Journal of Money, Credit and Banking, 35 (6), December,
932-946.
36

[41] Ramey, V. (1993): How important is the credit channel in the transmission of mone-
tary policy? Carnegie-Rochester Conference Series on Public Policy, 39, 1-45.
[42] Stock, J. H. and Watson, M. W. (1999): Forecasting Inflation; Journal of Monetary
Economics, 44, 293-335.
[43] Stock, J. H. and Watson, M. W. (2002): Macroeconomic Forecasting Using Diffusion
Indexes. Journal of Business and Economic Statistics, 20(2), 147-162.
[44] Van den Heuvel, S.K. (2002): Does Bank Capital Matter for Monetary Policy Trans-
mission? Federal Reserve Bank of New York Economic Policy Review, 8(1), 259-265.
[45] Woo, D. (2003): In search of capital crunch : supply factors behind the credit slow-
down in Japan. Journal of Money, Credit and Banking, 35(6), December, Part I,
1019-38.
[46] Woodford, M. (2005): Central Bank Communication and Policy Effectiveness. Pro-
ceedings of the Federal Reserve Bank of Kansas City Economic Symposium at Jackson
Hole 2005.
37

Appendix: Data Sets
1 - Macroeconomic series
Format contains series number; data span (in quarters); transformation code and seriesdescription as appears in the database. The transformation codes are: 1 - no transforma-tion; 2 - first difference; 4 - logarithm; 5 - first difference of logarithm. The series weretaken from Monetary Statistics database of Bank de France, Bank of International Settle-ment (BIS), EUROSTAT database, IN/IP INSEE database and OI/OP OECD database.
France
1 1993:1-2009:1 1 EMU 3-month EURIBOR, total, end of period2 1993:1-2009:1 5 Total loans of French credit institutions, SA3 1993:1-2009:1 5 Total loans to NFIs, SA4 1993:1-2009:1 5 Loans to NFIs for cash needs, SA5 1993:1-2009:1 5 Loans to NFIs for investing needs, SA6 1993:1-2009:1 5 Total loans to households, SA7 1993:1-2009:1 5 Mortgage loans to households, SA8 1993:1-2009:1 5 Monetary aggregate M3, outstanding amounts at the end of the period (stocks)9 1993:1-2009:1 5 Gross domestic product at market price, chain linked volumes, reference
year 2000, SA10 1993:1-2009:1 1 Production of total industry, index, SA11 1993:1-2009:1 5 Final consumption of households and NPISH’s (private consumption),
chain linked volumes, reference year 2000, SA12 1993:1-2009:1 5 Private consumption of households, durable goods,
chain linked volumes, reference year 2000, SA13 1993:1-2009:1 5 Private consumption of households, non-durable goods,
chain linked volumes, reference year 2000, SA14 1993:1-2009:1 5 Exports of goods and services, chained volume estimates, SA15 1993:1-2009:1 5 Imports of goods and services, chained volume estimates, SA16 1993:1-2009:1 5 Gross fixed capital formation of financial institutions, goods and services, SA17 1993:1-2009:1 5 Gross fixed capital formation of public services, goods and services, SA18 1993:1-2009:1 5 Gross fixed capital formation of households, goods and services, SA19 1993:1-2009:1 5 Gross fixed capital formation of households, building and civil engineering, SA20 1993:1-2009:1 5 Gross fixed capital formation of households, real estate services, SA21 1993:1-2009:1 5 Gross fixed capital formation of NFIs, goods and services, SA22 1993:1-2009:1 5 Gross fixed capital formation of NFIs, building and civil engineering, SA23 1993:1-2009:1 5 Gross fixed capital formation of all sectors, goods and services, SA24 1993:1-2009:1 5 Employees, full time equivalent, SA25 1993:1-2009:1 5 Unemployment rate, BIT definition, SA26 1993:1-2009:1 1 Increase in stocks, end of period (%)27 1993:1-2009:1 5 Construction costs, total, cost of materials, NSA, Index, 1953 Oct = 10028 1993:1-2009:1 5 Cost of construction: multiple dwellings, end of period29 1993:1-2009:1 5 CAC40, end of day30 1993:1-2009:1 5 Oil price, brent crude -1 month forward, level31 1993:1-2009:1 5 GDP Deflator, index publication base SA32 1993:1-2009:1 5 Consumer price index, harmonised, SA33 1993:1-2009:1 5 Consumer price index, end of period34 1993:1-2009:1 5 CPI (households, base 1998) - Food and non-alcoholic drinks35 1993:1-2009:1 5 CPI (households, base 1998) - Alcoholic drinks
38

36 1993:1-2009:1 5 CPI (households, base 1998) - Clothing and footwear37 1993:1-2009:1 5 CPI (households, base 1998) - Housing, water, gas, electricity and other combustibles38 1993:1-2009:1 5 CPI (households, base 1998) - Furniture, domestic equipment and house keeping39 1993:1-2009:1 5 CPI (households, base 1998) - Health40 1993:1-2009:1 5 CPI (households, base 1998) - Transportation41 1993:1-2009:1 5 CPI (households, base 1998) - Communications42 1993:1-2009:1 5 CPI (households, base 1998) - Leisure and culture43 1993:1-2009:1 5 CPI (households, base 1998) - Hotels, cafes and restaurants44 1993:1-2009:1 5 CPI (households, base 1998) - Other goods and services45 1993:1-2009:1 5 PPI - Buldings46 1993:1-2009:1 5 PPI - Extractive industry, energy, water, wastes management and depolutting47 1993:1-2009:1 5 PPI - Manufacturing industry48 1993:1-2009:1 1 Long-term interest rate on government bonds49 1993:1-2009:1 1 Average rate on loans to NFIs < 1 year, new contracts50 1993:1-2009:1 1 Average rate on loans to NFIs > 1 year, new contracts51 1993:1-2009:1 1 Average rate on consumer loans to households, new contracts52 1993:1-2009:1 1 Average rate on mortgage loans to households, new contracts53 1993:1-2009:1 1 Consumer confidence indicator, SA54 1993:1-2009:1 1 Food-processing industry - production capacity utilization, %, SA55 1993:1-2009:1 1 Consumption goods industry - production capacity utilization, %, SA56 1993:1-2009:1 1 Automobile industry -production capacity utilization, %, SA57 1993:1-2009:1 1 Equipment industry - production capacity utilization, %, SA58 1993:1-2009:1 1 Intermediary goods industry - production capacity utilization, %, SA59 1993:1-2009:1 1 Business climate in industry60 1993:1-2009:1 1 Business climate in trade services
Germany
61 1993:1-2009:1 5 Monetary aggregate M2, outstanding amounts at the end of the period (stocks)62 1993:1-2009:1 5 Gross domestic product at market price, chain linked volumes, reference year 2000, SA63 1993:1-2009:1 5 Employees, persons (Thousands, SA)64 1993:1-2009:1 5 Unemployed persons (Thousands, SA)65 1993:1-2009:1 5 Gross domestic product, implicit price deflator, SA66 1993:1-2009:1 5 HICP, SA67 1993:1-2009:1 1 Consumer confidence indicator, SA68 1993:1-2009:1 1 Long-term interest rate on government bonds
* NFI - non-financial institutions; NPISH - non-profit institutions serving households; PPI - Producer Price Index;SA - seasonally adjusted.
2 - Disaggregated bank balance sheet series
Format contains series number; data span (in quarters); bank identification code (CIB)and the name of the credit institutions as appears in the database. The ratios werecomputed using balance sheet information from the BAFI database which is maintainedby the French Banking Supervisory Authority (ACP).
Liquidity and Leverage ratios
No. CIB Period Credit institution1 7 1993:2-2009:1 CUMUL BQ POP HORS AGREMENT COLLECTIF SCM2 10057 1993:2-2009:1 STE BORDELAISE DE CIT IND ET COMMERCIAL3 10096 1993:2-2009:1 LYONNAISE DE BANQUE L,B,4 10178 1993:2-2009:1 BANQUE CHAIX5 10188 1993:2-2009:1 BANQUE CHALUS6 10228 1993:2-2009:1 BANQUE LAYDERNIER
39
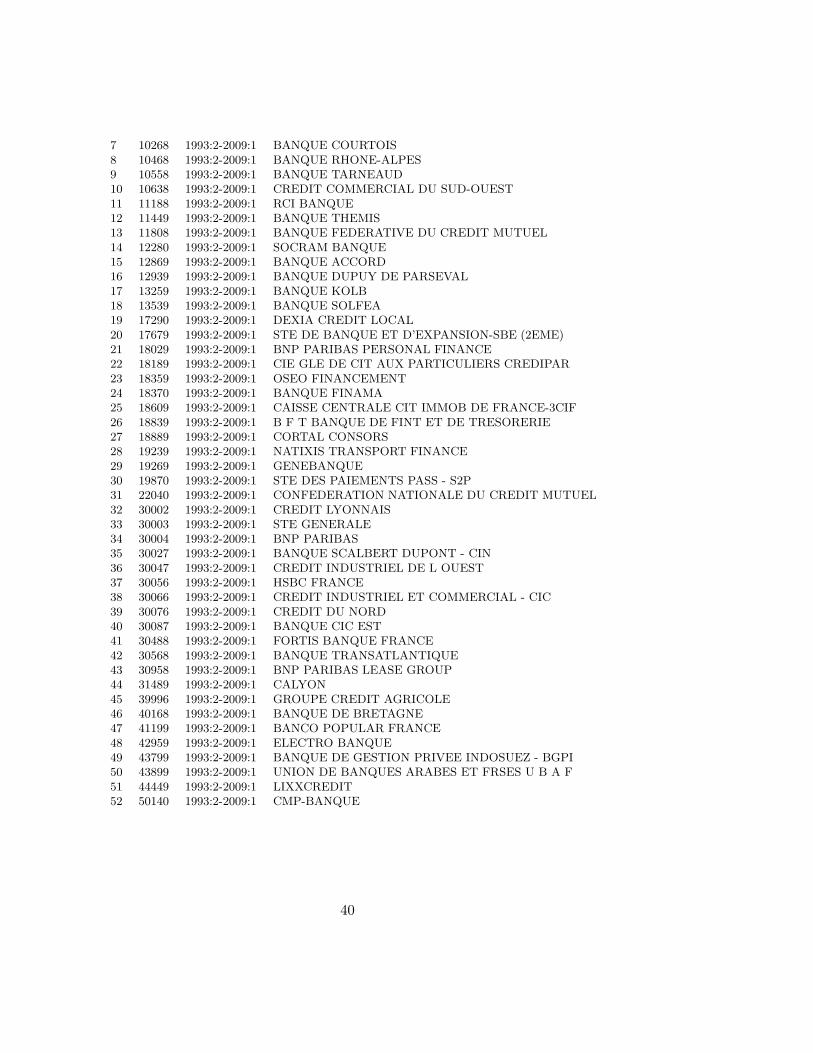
7 10268 1993:2-2009:1 BANQUE COURTOIS8 10468 1993:2-2009:1 BANQUE RHONE-ALPES9 10558 1993:2-2009:1 BANQUE TARNEAUD10 10638 1993:2-2009:1 CREDIT COMMERCIAL DU SUD-OUEST11 11188 1993:2-2009:1 RCI BANQUE12 11449 1993:2-2009:1 BANQUE THEMIS13 11808 1993:2-2009:1 BANQUE FEDERATIVE DU CREDIT MUTUEL14 12280 1993:2-2009:1 SOCRAM BANQUE15 12869 1993:2-2009:1 BANQUE ACCORD16 12939 1993:2-2009:1 BANQUE DUPUY DE PARSEVAL17 13259 1993:2-2009:1 BANQUE KOLB18 13539 1993:2-2009:1 BANQUE SOLFEA19 17290 1993:2-2009:1 DEXIA CREDIT LOCAL20 17679 1993:2-2009:1 STE DE BANQUE ET D’EXPANSION-SBE (2EME)21 18029 1993:2-2009:1 BNP PARIBAS PERSONAL FINANCE22 18189 1993:2-2009:1 CIE GLE DE CIT AUX PARTICULIERS CREDIPAR23 18359 1993:2-2009:1 OSEO FINANCEMENT24 18370 1993:2-2009:1 BANQUE FINAMA25 18609 1993:2-2009:1 CAISSE CENTRALE CIT IMMOB DE FRANCE-3CIF26 18839 1993:2-2009:1 B F T BANQUE DE FINT ET DE TRESORERIE27 18889 1993:2-2009:1 CORTAL CONSORS28 19239 1993:2-2009:1 NATIXIS TRANSPORT FINANCE29 19269 1993:2-2009:1 GENEBANQUE30 19870 1993:2-2009:1 STE DES PAIEMENTS PASS - S2P31 22040 1993:2-2009:1 CONFEDERATION NATIONALE DU CREDIT MUTUEL32 30002 1993:2-2009:1 CREDIT LYONNAIS33 30003 1993:2-2009:1 STE GENERALE34 30004 1993:2-2009:1 BNP PARIBAS35 30027 1993:2-2009:1 BANQUE SCALBERT DUPONT - CIN36 30047 1993:2-2009:1 CREDIT INDUSTRIEL DE L OUEST37 30056 1993:2-2009:1 HSBC FRANCE38 30066 1993:2-2009:1 CREDIT INDUSTRIEL ET COMMERCIAL - CIC39 30076 1993:2-2009:1 CREDIT DU NORD40 30087 1993:2-2009:1 BANQUE CIC EST41 30488 1993:2-2009:1 FORTIS BANQUE FRANCE42 30568 1993:2-2009:1 BANQUE TRANSATLANTIQUE43 30958 1993:2-2009:1 BNP PARIBAS LEASE GROUP44 31489 1993:2-2009:1 CALYON45 39996 1993:2-2009:1 GROUPE CREDIT AGRICOLE46 40168 1993:2-2009:1 BANQUE DE BRETAGNE47 41199 1993:2-2009:1 BANCO POPULAR FRANCE48 42959 1993:2-2009:1 ELECTRO BANQUE49 43799 1993:2-2009:1 BANQUE DE GESTION PRIVEE INDOSUEZ - BGPI50 43899 1993:2-2009:1 UNION DE BANQUES ARABES ET FRSES U B A F51 44449 1993:2-2009:1 LIXXCREDIT52 50140 1993:2-2009:1 CMP-BANQUE
40

Figures and Tables
Table 1: Descriptive statistics (2009Q1).
Mean Median SD Min Max
Assets (billions of euros) 99.5 5.4 255 0.3 1390% of total bank assets 1.3 0.1 3.4 0.0 18.6Loans (billions of euros) 27.1 1.9 62.9 0.0 334% of total bank loans 1.4 0.1 3.1 0.0 16.6Liquidity (LIQ) 0.22 0.29 0.23 0.01 0.99Broad leverage (LEV1) 20.5 29.1 26.1 1.18 124.7Narrow leverage (LEV2) 8.0 11.6 11.23 0.18 50.52
Table 2: Correlations between the macro factors and selected macro variables.
Variable F1 F2 F3
Interest rate -0.49 0.50 0.15GDP 0.57 0.69 -0.07IPI 0.79 -0.44 0.22Employment 0.75 0.39 -0.23Unemployment -0.65 -0.42 -0.02Consumption 0.33 0.18 -0.19Consumption durable 0.11 0.13 -0.14Consumption nondurable 0.06 0.12 -0.10Non-Res. Investment 0.67 0.43 -0.18Inventories 0.78 -0.00 0.04Res. Inv. by Hh 0.46 0.43 -0.02Housing prices 0.58 -0.02 0.25HICP 0.16 0.17 0.87GDP deflator 0.20 -0.28 0.54Total loans 0.61 -0.20 0.33Housing loans 0.60 -0.47 0.30Inv. corporate loans 0.54 -0.51 0.07C and I loans 0.59 0.01 0.02France 10y yield -0.48 0.71 -0.01Int. rate C and I loans -0.57 0.60 0.08Int. rate invt. loans -0.72 0.55 0.13Int. rate housing loans -0.63 0.67 -0.11
41

Table 3: Correlation between bank ratio factors and macro factors.
Variables F1 LIQ F2 LIQ F1 LEV1 F2 LEV1 F1 LEV2 F2 LEV2
Fmacro1 -0.70*** 0.07 -0.33*** -0.47*** -0.61*** 0.29**Fmacro2 0.61*** 0.39*** 0.40*** 0.47*** 0.47*** -0.35***Fmacro3 -0.05 -0.21* 0.00 -0.01 0.01 0.01Interest rate 0.76*** -0.31** 0.38*** 0.64*** 0.67*** -0.49***
Note. * Denotes significance at 10% level. ** Denotes significance at 5%level.*** Denotes significance at 1% level.
Table 4: R2 for regressions of selected French macro indicators on various sets of macroand bank ratio factors (sample 1993:2 - 2009:1).
All macro LIQ LEV1 LEV2factors factors factors factors
(1) (2) (3) (4)
All France data Xt 0.56 0.24 0.15 0.17(average over all French data)
Selected FR indicators
Interest rate 1.00 0.68 0.56 0.69GDP 0.84 0.16 0.02 0.00IPI 0.87 0.83 0.62 0.71Employment 0.80 0.11 0.02 0.05Unemployment 0.68 0.03 0.03 0.04Consumption 0.19 0.05 0.01 0.03Consumption durable 0.05 0.01 0.03 0.01Consumption nondurable 0.04 0.02 0.01 0.00Non-Res. Investment 0.67 0.06 0.02 0.05Inventories 0.69 0.27 0.23 0.26Res. Inv. by Hh 0.46 0.06 0.01 0.01Housing prices 0.62 0.32 0.22 0.33HICP 0.81 0.01 0.00 0.00GDP deflator 0.41 0.14 0.11 0.08Total loans 0.56 0.28 0.14 0.16Housing loans 0.70 0.57 0.43 0.48Inv. corporate loans 0.60 0.49 0.25 0.33C and I loans 0.45 0.13 0.08 0.08France 10y yield 0.80 0.70 0.60 0.64Int. rate C and I loans 0.89 0.71 0.62 0.78Int. rate invt. loans 0.95 0.82 0.69 0.83Int. rate housing loans 0.91 0.85 0.75 0.79
42

Table 5: Granger-causality tests for bank factors affecting macro factors. Table reportsp-values.
LIQ LEV1 LEV2
All sample (1993:2009)
F1 0.92 0.00 0.00F2 0.00 0.15 0.08F3 0.50 0.89 0.86Interest rate 0.73 0.00 0.00
Before 2007-2009 crisis
F1 0.02 0.06 0.06F2 0.00 0.01 0.00F3 0.21 0.02 0.05Interest rate 0.21 0.00 0.01
Table 6: Multivariate Chow tests of a structural break in 1999 Q1.
p-value (%)
Macro factors only 0.26Macro + LIQ factors 0.56Macro + LEV1 factors 0.58Macro + LEV2 factors 0.57
Note. Bootstraped p-values (5000 replica-tions).
43

0
10
20
30
40
50
60
70
80
90
100
Sha
re o
f tot
al lo
ans
(%)
1993q1 1997q1 2001q1 2005q1 2009q1
Figure 1: Share of the banks in sample in total loans granted by all resident credit insti-tutions, 1993-2009.
1993Q2 1995Q2 1997Q2 1999Q2 2001Q2 2003Q2 2005Q2 2007Q2 2009Q2−2
−1.5
−1
−0.5
0
0.5
1
1.5
2
2.5
3Macroeconomic factors
First PC "cycle"Second PC "long rates"Third PC "prices"Short term interest rate
Figure 2: Macro factors.
44

1993Q2 1995Q2 1997Q2 1999Q2 2001Q2 2003Q2 2005Q2 2007Q2 2009Q2−1
−0.5
0
0.5
1
1.5First and second components from Liq ratio datasets
F1LiqF2Liq
Figure 3: LIQ factors.
1993Q2 1995Q2 1997Q2 1999Q2 2001Q2 2003Q2 2005Q2 2007Q2 2009Q2−1
−0.5
0
0.5
1
1.5First and second components from Lev1 ratio datasets
F1Lev1F2Lev1
Figure 4: LEV1 factors.
45

1993Q2 1995Q2 1997Q2 1999Q2 2001Q2 2003Q2 2005Q2 2007Q2 2009Q2−1
−0.5
0
0.5
1
1.5
2First and second components from Lev2 ratio datasets
F1Lev2F2Lev2
Figure 5: LEV2 factors.
46

1 4 8 12 16−1
−0.5
0
0.5
1EA STR
1 4 8 12 16−1
−0.5
0GDP
1 4 8 12 16−0.5
0
0.5IPI
1 4 8 12 16−1
−0.5
0
0.5Employment
1 4 8 12 16−200
0
200
400Unemployment
1 4 8 12 16−1
−0.5
0
0.5Consumption
1 4 8 12 16−1
0
1
2Consumption durable
1 4 8 12 16−1
0
1
2Consumption nondurable
1 4 8 12 16−1
−0.5
0
0.5Non−Res. Investment
1 4 8 12 16−1
−0.5
0
0.5Inventories
1 4 8 12 16−1
−0.5
0Res. Inv. by Hh
1 4 8 12 16−1
−0.5
0
0.5
1Housing prices
1 4 8 12 16−1
0
1
2HICP
1 4 8 12 16−2
0
2
4GDP deflator
1 4 8 12 16−1
−0.5
0
0.5
1Total loans
1 4 8 12 16−1
0
1
2Housing loans
1 4 8 12 16−1
−0.5
0
0.5
1Inv. corporate loans
1 4 8 12 16−1
0
1
2C&I loans
1 4 8 12 16−0.5
0
0.5France 10y yield
1 4 8 12 16−0.5
0
0.5
1Int. rate C&I loans
1 4 8 12 16−0.5
0
0.5
1Int. rate invt. loans
1 4 8 12 16−0.5
0
0.5Int. rate housing loans
Figure 6: Impulse responses to an identified monetary policy shock. Model with macrofactors only (solid line) vs model augmented with bank LIQ factors (dashed line).
47

1 4 8 12 16−1
−0.5
0
0.5
1EA STR
1 4 8 12 16−1
−0.5
0GDP
1 4 8 12 16−0.5
0
0.5IPI
1 4 8 12 16−1
−0.5
0
0.5Employment
1 4 8 12 16−200
0
200
400Unemployment
1 4 8 12 16−1
−0.5
0
0.5Consumption
1 4 8 12 16−1
0
1
2Consumption durable
1 4 8 12 16−1
0
1
2Consumption nondurable
1 4 8 12 16−1
−0.5
0
0.5Non−Res. Investment
1 4 8 12 16−1
−0.5
0
0.5Inventories
1 4 8 12 16−1
−0.5
0Res. Inv. by Hh
1 4 8 12 16−1
−0.5
0
0.5
1Housing prices
1 4 8 12 16−1
0
1
2HICP
1 4 8 12 16−2
0
2
4GDP deflator
1 4 8 12 16−1
−0.5
0
0.5
1Total loans
1 4 8 12 16−1
0
1
2Housing loans
1 4 8 12 16−1
−0.5
0
0.5
1Inv. corporate loans
1 4 8 12 16−1
0
1
2C&I loans
1 4 8 12 16−0.5
0
0.5France 10y yield
1 4 8 12 16−0.5
0
0.5
1Int. rate C&I loans
1 4 8 12 16−0.5
0
0.5
1Int. rate invt. loans
1 4 8 12 16−0.5
0
0.5Int. rate housing loans
Figure 7: Impulse responses to an identified monetary policy shock. Model with macrofactors only (solid line) vs model augmented with bank LEV1 factors (dashed line).
48

1 4 8 12 16−1
−0.5
0
0.5
1EA STR
1 4 8 12 16−1
−0.5
0GDP
1 4 8 12 16−0.5
0
0.5IPI
1 4 8 12 16−1
−0.5
0
0.5Employment
1 4 8 12 16−200
0
200
400Unemployment
1 4 8 12 16−1
−0.5
0
0.5Consumption
1 4 8 12 16−1
0
1
2Consumption durable
1 4 8 12 16−1
0
1
2Consumption nondurable
1 4 8 12 16−1
−0.5
0
0.5Non−Res. Investment
1 4 8 12 16−1
−0.5
0
0.5Inventories
1 4 8 12 16−1
−0.5
0Res. Inv. by Hh
1 4 8 12 16−1
−0.5
0
0.5
1Housing prices
1 4 8 12 16−1
0
1
2HICP
1 4 8 12 16−2
0
2
4GDP deflator
1 4 8 12 16−1
−0.5
0
0.5
1Total loans
1 4 8 12 16−1
0
1
2Housing loans
1 4 8 12 16−1
−0.5
0
0.5
1Inv. corporate loans
1 4 8 12 16−1
0
1
2C&I loans
1 4 8 12 16−0.5
0
0.5France 10y yield
1 4 8 12 16−0.5
0
0.5
1Int. rate C&I loans
1 4 8 12 16−0.5
0
0.5
1Int. rate invt. loans
1 4 8 12 16−0.5
0
0.5Int. rate housing loans
Figure 8: Impulse responses to an identified monetary policy shock. Model with macrofactors only (solid line) vs model augmented with bank LEV2 factors (dashed line).
49

Documents de Travail
280. D. Durant et L. Frey, “Une Première comparaison des droits à pension des ménages français et américains,” Avril 2010
281. G. Bertola, A. Dabusinskas, M. Hoeberichts, M. Izquierdo, C. Kwapil, J. Montornès and
D. Radowski, “Price, Wage and Employment Response to Shocks: Evidence from the WDN Survey,” May 2010
282. J. Montornès and J-B. Sauner-Leroy, “Wage-setting Behavior in France: Additional Evidence from an Ad-hoc Survey,” May 2010
283. R. Bourlès, G. Cette, J. Lopez, J. Mairesse and G. Nicoletti, “Do product market regulations in upstream sectors
curb productivity growth? Panel data evidence for OECD countries,” June 2010 284. Ph. Askenazy, Th. Breda and D. Irac, “Innovation and Advertising: Theory and Evidence,” May 2010
285. M. Lemoine and C. Mougin, “The Growth-Volatility Relationship: New Evidence Based on Stochastic Volatility
in Mean Models,” July 2010
286. C. Bouthevillain and G. Dufrénot, “Are the effects of fiscal changes different in times of crisis and non-crisis? The French Case,” July 2010
287. S. Avouyi-Dovi, D. Fougère and E. Gautier, “Wage rigidity, collective bargaining and the minimum wage:
evidence from french agreement data,” July 2010
288. P. Askenazy, C. Célérier et D. Irac, “Vente à distance, internet et dynamiques des prix,” juillet 2010
289. G. Dufrénot, P. Frouté and C. Schalck, “The French Regions’ Borrowing Behaviours,” july 2010
290. C. Bordes and L. Clerc, “The ECB art of central banking and the separation principle,” August 2010
291. R. Jimborean and J-S. Mésonnier, “Banks' financial conditions and the transmission of monetary policy: a FAVAR approach,” September 2010
Pour accéder à la liste complète des Documents de Travail publiés par la Banque de France veuillez consulter le site : http://www.banque-france.fr/fr/publications/documents_de_travail/documents_de_travail_10.htm For a complete list of Working Papers published by the Banque de France, please visit the website: http://www.banque-france.fr/fr/publications/documents_de_travail/documents_de_travail_10.htm Pour tous commentaires ou demandes sur les Documents de Travail, contacter la bibliothèque de la Direction Générale des Études et des Relations Internationales à l'adresse suivante : For any comment or enquiries on the Working Papers, contact the library of the Directorate General Economics and International Relations at the following address : BANQUE DE FRANCE 49- 1404 Labolog 75049 Paris Cedex 01 tél : 0033 (0)1 42 92 49 55 ou 62 65 ou 48 90 ou 69 81 email : [email protected] [email protected] [email protected] [email protected]