do we really know that the wto increases trade?/media/mas/monetary policy and economics... ·...
TRANSCRIPT

Do We Really Know That The WTO Increases Trade?
Occasional Paper No. 24 September 2002
by
Andrew K Rose
Haas School of Business University of California, Berkeley
Economic Policy Department Monetary Authority of Singapore
DO WE REALLY KNOW THAT THE WTO INCREASES TRADE?
BY
ANDREW K ROSE*
SEPTEMBER 2002
* B.T. ROCCA JR. PROFESSOR OF INTERNATIONAL BUSINESS, ECONOMIC
ANALYSIS AND POLICY GROUP, HAAS SCHOOL OF BUSINESS AT THE UNIVERSITY OF CALIFORNIA, BERKELEY, NBER RESEARCH ASSOCIATE, AND CEPR RESEARCH FELLOW. I THANK: ROB FEENSTRA, AND JEFF FRANKEL FOR COMMENTS AND ENCOURAGEMENT; AND THE MONETARY AUTHORITY OF SINGAPORE FOR HOSPITALITY. I WAS INSPIRED BY ASHER ISAAC AND AN EASE 13 PAPER BY DAVID LI AND CHANGQI WU. THE DATA SET AND A CURRENT VERSION OF THE PAPER ARE AVAILABLE AT MY WEBSITE. THE VIEWS IN THIS PAPER ARE SOLELY THOSE OF THE AUTHOR AND SHOULD NOT BE ATTRIBUTED TO THE MONETARY AUTHORITY OF SINGAPORE.
JEL CLASSIFICATION NUMBER: F13, F15 KEYWORDS: EMPIRICAL, BILATERAL, PANEL, GRAVITY, GATT, GSP, INTERNATIONAL, MULTILATERAL, PANEL
ECONOMIC POLICY DEPARTMENT MONETARY AUTHORITY OF SINGAPORE
Andrew K. Rose, Haas School of Business, University of California, Berkeley, CA 94720-1900 Tel: (510) 642-6609 / Fax: (510) 642-4700 E-mail: [email protected] / URL: haas.berkeley.edu/~arose
DO WE REALLY KNOW
THAT THE WTO INCREASES TRADE?
Page ABSTRACT
i
I. INTRODUCTION
1
II. A PERSON OF STRAW?
3
III. NERDY STUFF
5
IV. BLAH, BLAH, BLAH
8
V. A THOUSAND WORDS
11
VI. TA-DA
15
VII. RAISING DEFLECTOR SHIELDS
18
VIII. PARTING SHOTS
28
Appendices 29 Figures 31 References 33
Economic Policy Department, Monetary Authority of Singapore
MAS Occasional Paper No. 24, Sep 2002 i
ABSTRACT
This paper estimates the effect on international trade of multilateral trade
agreements: the World Trade Organization (WTO), its predecessor the
Generalized Agreement on Tariffs and Trade (GATT), and the Generalized
System of Preferences (GSP) extended from rich countries to developing
countries. I use a standard “gravity” model of bilateral trade and a large
panel data set covering over fifty years and 175 countries. Despite an
extensive search, I am basically unable to find positive significant effects of
GATT/WTO membership on trade. The GSP does seem to have a strong
effect, and is associated with an approximate doubling of trade.
Economic Policy Department, Monetary Authority of Singapore

MAS Occasional Paper No. 24, Sep 2002 1
I INTRODUCTION Heresy
1.1 Economists disagree about a lot, but not everything. Almost all
of us think that international trade should be free.1 Accordingly, the
multilateral organization charged with freeing trade – the World Trade
Organization (WTO) – is probably the most popular international institution
inside the profession, certainly compared with its obvious rivals, the IMF and
the World Bank. This makes much of the furor over the WTO unfathomable
to most of us. But should we – and the protestors – really care about the
WTO at all? Do we really know that the WTO and its predecessor the
General Agreement on Tariffs and Trade (GATT) have actually had a
substantial positive effect on trade?
1.2 Maybe not. While theory, casual empiricism, and strong
statements abound, there is, to my knowledge, no compelling quantitative
evidence showing that the GATT/WTO has actually encouraged trade. In
this paper, I provide the first comprehensive empirical study of the effect of
the postwar multilateral agreements on trade. It turns out that membership
in the GATT/WTO is not associated with increased trade, once standard
factors (such as the effect of income on trade) have been taken into account.
Not all multilateral trade liberalizing institutions have been ineffectual; I find
that the Generalized System of Preferences (GSP) extended from the North
to developing countries approximately doubles trade. Thus the data and
methodology clearly can deliver strong results. I conclude that we currently
do not have strong empirical evidence that the GATT/WTO has
systematically played a strong role in encouraging trade.
1 Kearl et. al. (1979, p. 30) show that 97% of economists surveyed in 1976 agreed
(generally or with provisions) that “Tariffs and import quotas reduce general economic welfare.” Alston et. al. (1992, p. 204) show that 93% agreed with this statement in 1990.
Economic Policy Department, Monetary Authority of Singapore
MAS Occasional Paper No. 24, Sep 2002 2
Plain Vanilla 1.3 At the outset, let me state that I am a mainstream economist
with no anti-trade or anti-WTO agenda.2 To make my argument as
persuasive as possible I use accepted techniques, a conventional empirical
methodology, and two standard data sets. I also examine the sensitivity of
my results extensively. Thus, any interest in this paper lies solely in its
results; by design, there is no other innovation.
1.4 The next section of the paper provides motivation, while
sections III and IV present the methodology and data set respectively. A
graphical event study of accession to the GATT/WTO is presented in section
V. The main results are discussed in section VI, followed by sensitivity
analysis. The paper closes with a brief conclusion.
2 Ask my colleagues if you don’t believe me.
Economic Policy Department, Monetary Authority of Singapore

MAS Occasional Paper No. 24, Sep 2002 3
II A PERSON OF STRAW? 2.1 Does anyone believe that the multilateral trading system
increases trade? The WTO, for one. It states that its “overriding objective is
to help trade flow smoothly, freely, fairly and predictably.”3 And it believes
that the system has been working. The WTO trumpeted the fiftieth
anniversary of the multilateral trading system in 1998 affirming “… The
achievements of the system are well worth celebrating. Since the General
Agreement on Tariffs and Trade began operating from Geneva in 1948,
world merchandise trade has increased 16 fold … world trade now grows
roughly three times faster than merchandise output … this advance ranks
among the great international economic achievements of the post-world war
era …”4 Further, “The past 50 years have seen an exceptional growth in
world trade. Merchandise exports grew on average by 6% annually. Total
trade in 2000 was 22-times the level of 1950. GATT and the WTO have
helped to create a strong and prosperous trading system contributing to
unprecedented growth.”5
2.2 While some (mostly non-economists) might disagree with the
view that trade should be freed by the multilateral system, it is hard to find
dissent with the view that trade has been liberalized by the system. For
instance, the Economist declared in 1999 “For five decades the world’s
multilateral trade-liberalising machinery … has, in all likelihood, done more to
attack global poverty and advance living standards right across the planet
3 Taken from http://www.wto.org/wto/english/thewto_e/whatis_e/inbrief_e/inbr02_e.htm 4 Press brief available at http://www.wto.org/wto/english/thewto_e/minist_e/min96_e/
chrono.htm. 5 Taken from http://www.wto.org/english/thewto_e/whatis_e/inbrief_e/inbr01_e.htm.
Alternatively, the WTO at http://www.wto.org/english/the wto_e/whatis_e/tif_e/ fact4_e.htm states “GATT was provisional with a limited field of action, but its success over 47 years in promoting and securing the liberalization of much of world trade is incontestable. Continual reductions in tariffs alone helped spur very high rates of world trade growth ...” Finally, the agreement establishing the WTO states that its objective is “… expanding the production of and trade in goods and services, … by entering into reciprocal and mutually advantageous arrangements directed to the substantial reduction of tariffs and other barriers to trade …”, available at http://www.wto.org/english/docs_e/legal_e/04-wto.pdf.
Economic Policy Department, Monetary Authority of Singapore
MAS Occasional Paper No. 24, Sep 2002 4
than any other man-made device … such is the power of trade.”6 There are
innumerable estimates of the effect of this or that GATT round on country x
or industry y; all implicitly assume that the multilateral trading system
matters.
6 Economist, December 2, 1999.
Economic Policy Department, Monetary Authority of Singapore

MAS Occasional Paper No. 24, Sep 2002 5
III NERDY STUFF 3.1 Quantifying the effects of the multilateral system on trade
seems a worthy objective. Luckily, it is also feasible. To estimate the effect
of multilateral trade agreements on international trade, I rely on the standard
“gravity” model of bilateral trade, which explains (the natural logarithm of)
trade with (the logs of) the distance between the countries and their joint
income. I augment the basic gravity equation with a number of extra
conditioning variables which affect trade, in order to account for as many
extraneous factors as possible. These include: culture (e.g., whether a pair
of countries share a common language), geography (e.g., whether none,
one or both are landlocked), and history (e.g., whether one colonized the
other). The idea is to control for as many “natural” causes of trade as
possible. The search for effects of multilateral agreements is conducted in
the residual.
3.2 For those unfamiliar with the gravity model, it is a completely
conventional device used to estimate the effects of a variety of phenomena
on international trade. Unusually for economics, it is also a successful
model, in two senses. First, the estimated effects of distance and output (the
traditional gravity effects) are sensible, economically and statistically
significant, and reasonably consistent across studies. Second, the gravity
model explains most of the variation in international trade. That is, the
model seems reliable and fits the data well. A fine track for this train.7
3.3 The exact specification of the gravity model used is:
ln(Xijt) = β0 + β1lnDij + β2ln(YiYj)t + β3ln(YiYj/PopiPopj)t + β4Langij + β5Contij
+ β6Landlij + β7Islandij +β8ln(AreaiAreaj) + β9ComColij + β10CurColijt
+ β11Colonyij + β12ComNatij + β13CUijt + β14FTAijt, + ΣtφtTt
+ γ1Bothinijt + γ2Oneinijt + γ3GSPijt + εijt
7 One recent empirical reference is Frankel (1997). Theoretical discussions can be
found in Deardorff (1998) and Anderson and van Wincoop (2002).
Economic Policy Department, Monetary Authority of Singapore

MAS Occasional Paper No. 24, Sep 2002 6
where i and j denotes trading partners, t denotes time, and the variables are
defined as:
• Xijt denotes the average value of real bilateral trade between i and j at time t,
• Y is real GDP,
• Pop is population,
• D is the distance between i and j,
• Lang is a binary “dummy” variable which is unity if i and j have a common language and zero otherwise,
• Cont is a binary variable which is unity if i and j share a land border,
• Landl is the number of landlocked countries in the country-pair (0, 1, or 2).
• Island is the number of island nations in the pair (0, 1, or 2),
• Area is the area of the country (in square kilometers),
• ComCol is a binary variable which is unity if i and j were ever colonies after 1945 with the same colonizer,
• CurCol is a binary variable which is unity if i and j are colonies at time t,
• Colony is a binary variable which is unity if i ever colonized j or vice versa,
• ComNat is a binary variable which is unity if i and j remained part of the same nation during the sample (e.g., France and Guadeloupe, or the UK and Bermuda),
• CU is a binary variable which is unity if i and j use the same currency at time t,
• FTA is a binary variable which is unity if i and j both belong to the same regional trade agreement,
• {Tt} is a comprehensive set of time fixed effects,
• β and φ are vectors of nuisance coefficients,
• Bothinijt is a binary variable which is unity if both i and j are GATT/WEO members at t,
• Oneinijt is a binary variable which is unity if either i or j is a GATT/WEO member at t,
• GSPijt is a binary variable which is unity if i was a GSP beneficiary of j or vice versa at t, and
• εij represents the omitted other influences on bilateral trade, assumed to be well behaved.
Economic Policy Department, Monetary Authority of Singapore

MAS Occasional Paper No. 24, Sep 2002 7
3.4 The parameters of interest to me are γ1, γ2, and γ3. The first
coefficient is the most interesting; it measures the effect on international
trade if both countries are GATT/WTO members. The second coefficient
measures the trade effect if one country is a member and the other is not.
Of less interest to me is γ3, which measures the effect of the GSP on trade.
3.5 I estimate the gravity model using ordinary least squares,
computing standard errors which are robust to clustering by country-pairs. I
also include a comprehensive set of year-specific “fixed” effects to account
for such factors as the value of the dollar, oil shocks, and so forth. Since the
data set is a (country-pair x time) panel I also use “random effects” (GLS)
and “fixed effects” (“within”) estimators as robustness checks.
Economic Policy Department, Monetary Authority of Singapore

MAS Occasional Paper No. 24, Sep 2002 8
IV BLAH, BLAH, BLAH 4.1 The trade data for the regressand comes from the “Direction of
Trade” (DoT) CD-ROM data set developed by the International Monetary
Fund (IMF). It covers bilateral merchandise trade between 178 IMF trading
entities between 1948 and 1999 (with gaps); a list of the countries is
included in Appendix 1. (Not all the trading entities are “countries” in the
traditional sense of the word; I use the word simply for convenience.) I
include all countries for which the Fund provides data, so that almost all
global trade is covered.8 Bilateral trade on FOB exports and CIF imports is
recorded in American dollars; I deflate trade by the American CPI for all
urban consumers (1982-1984=100; taken from www.freelunch.com). An
average value of bilateral trade between a pair of countries is created by
averaging all of the (four possible) measures potentially available (exports
from i to j, imports into j from i, and so forth). It is well known that trade has
grown quickly since the Second World War, and that is reflected in this data
set. From 1948 through the end of the sample in 1999, global trade
increased on average by over eight percent annually.
4.2 Population and real GDP data (in constant American dollars)
have been obtained from standard sources: the Penn World Table, the
World Bank’s World Development Indicators, and the IMF’s International
Financial Statistics.9 I exploit the CIA’s World Factbook for a number of
country-specific variables.10 These include: latitude and longitude, land
area, landlocked and island status, physically contiguous neighbors,
language, colonizers, and dates of independence. I use these to create
8 Though I am forced to drop observations from the regression analysis if they have no
usable data for e.g., output. 9 I use the Glick-Rose data set practice; wherever possible, I use “World Development
Indicators” (taken from the World Bank’s WDI 2000 CD-ROM) data. When the data are unavailable from the World Bank, I fill in missing observations with comparables from the Penn World Table Mark 5.6, and (when all else fails), from the IMF’s “International Financial Statistics” (converting national currency GDP figures into dollars at the current dollar exchange rate). The series have been checked and corrected for errors.
10 Available at http://www.odci.gov/cia/publications/factbook/index.html.
Economic Policy Department, Monetary Authority of Singapore
MAS Occasional Paper No. 24, Sep 2002 9
great-circle distance and the other controls. I add information on whether
the pair of countries was involved in a currency union, using Glick-Rose
(2002).11 I obtain data from the World Trade Organization to create an
indicator of regional trade agreements, and include: ASEAN, EEC/EC/EU;
US-Israel FTA; NAFTA; CARICOM; PATCRA; ANZCERTA; CACM,
SPARTECA, and Mercosur.12 I initially assume that all RTAs have the same
effect on trade, but relax this assumption below.
The Unusual Suspects
4.3 To all this, I add the key variables of GATT/WTO membership.
The website of the WTO provides dates for accession of its members to the
GATT/WTO.13 Thirty-two trading entities were either founding members
(technically “contracting parties”) of the GATT or were covered because of
their relationship with a founding member (e.g., French Polynesia and
Bermuda). These countries began the sample in 1948 covered by the
GATT, and include many countries of interest (e.g., Belgium, Brazil, Canada,
India, the Netherlands, South Africa, the United Kingdom, and the United
States).
4.4 After GATT’s creation, outsiders joined over time. For
instance, Italy and Sweden were among the nine countries that acceded in
1950, Germany joined in 1951 (along with Austria, Peru, and Turkey), and
Japan joined in 1955. By 1960, 50 countries were covered by the GATT; by
1970 the number had risen to 90, and by 1990 to 112. As of July 2002,
there were a total of 158 trading partners covered by membership in the
WTO; there were also a number (29) of WTO “observers” who are required
11 “Currency union” means essentially that money was interchangeable between the
two countries at a 1:1 par for an extended period of time, so that there was no need to convert prices. The basic source for currency union data is the IMF’s Schedule of Par Values and issues of the IMF’s Annual Report on Exchange Rate Arrangements and Exchange Restrictions. I supplement this with information from annual copies of The Statesman’s Yearbook.
12 Available at http://www.wto.org/english/tratop_e/region_e/region_e.htm. 13 Available at http://www.wto.org/english/thewto_e/gattmem_e.htm.
Economic Policy Department, Monetary Authority of Singapore

MAS Occasional Paper No. 24, Sep 2002 10
to begin negotiations for WTO member within five years. In addition, a
number of countries (e.g., Afghanistan, Iran, Iraq, Liberia, Libya, and Syria)
are neither members nor observers of the WTO.
4.5 The GATT conducted eight “rounds” of multilateral trade
negotiations before it was subsumed by the World Trade Organization
(WTO) in 1995: Geneva (concluded in 1947); Annecy (1949); Torquay
(1951); Geneva (1956); Dillon (1961); Kennedy (1967); Tokyo (1979); and
Uruguay (1994). In most of my work I maintain the hypothesis that the effect
of the GATT/WTO on trade does not vary over time, but again I examine the
importance of this assumption below.
4.6 The last coefficient of interest to me concerns the impact of the
Generalized System of Preferences (GSP) on Trade. The UN publishes
Operation and Effects of the Generalized System of Preferences at intervals;
these booklets contain information on which countries extend trade
concessions to which developing country beneficiaries under the GSP. I
have obtained this pamphlet for 1974, 1979, and 1984 and use this
information to construct bilateral time-varying GSP relationships.14
4.7 Descriptive statistics on the variables are available in
Appendix 2. They show that the key GATT/WTO and GDP variables are not
highly correlated with most of the gravity variables. The only exception is the
GSP dummy, which is positively correlated with both real GDP variables, as
one might expect (given that richer countries are those that extend the GSP
concessions).
14 Most countries (e.g., those in the EEC, Austria, Finland, Japan, Norway, Sweden,
and Switzerland) began to extend GSP concessions in 1971, though there were exceptions. The USSR began to extend GSP preferences in 1965; Australia in 1966; Bulgaria, Czechoslovakia, Hungary, and New Zealand in 1972; Canada in 1974; and Poland and the US in 1976. Unfortunately, I do not have information on bilateral GSP concessions on an annual basis, and Stefano Inama at UNCTAD has informed me that no such data set currently exists. I therefore construct the variable by extending 1974 GSP preferences back to the original extension of the GSP, and forward to 1976; I extend 1979 preferences to cover the period from 1977 through 1981; and the 1984 preferences are used to cover the period from 1982 through the end of the sample (adding the entrants into the EC/EU as they joined).
Economic Policy Department, Monetary Authority of Singapore

MAS Occasional Paper No. 24, Sep 2002 11
V A THOUSAND WORDS
5.1 A preliminary look at the data leads one to believe that entry
into the GATT/WTO has a strong positive effect on trade. Figure 1 is a set of
graphical “event studies” which look at bilateral trade around the dates of
GATT/WTO entry. The top left-hand diagram examines the natural logarithm
of real bilateral trade in the five years before, during (marked by the vertical
line), and after entry; it considers trade between a new entrant and non-
members. The middle line (with circles) shows the mean level of trade, while
the two other lines show a confidence interval of plus and minus two
standard deviations. The diagram in the top right-hand corner is the
analogue showing trade between a country joining the GATT/WTO and other
members.
Figure 1 Effect of GATT/WTO Entry on Bilateral Trade
Effect of GATT/WTO entry on Bilateral TradeMean, with +/- 2 standard deviations
Log Real TradePartner non-GATT/WTO
-5 59
9.5
10
10.5
Log Real TradePartner in GATT/WTO
-4 59.5
10
10.5
Gravity ResidualPartner non-GATT/WTO
-5 5-.1
0
.1
.2
.3
Gravity ResidualPartner in GATT/WTO
-4 5
-.1
0
.1
Economic Policy Department, Monetary Authority of Singapore

MAS Occasional Paper No. 24, Sep 2002 12
5.2 The two graphs deliver the same message. While trade is
stagnant or even falling slightly in the five years before entry into the
multilateral trade system, it seems to begin rising coincident with entry and
continue rising for at least five years. This increase in trade is both
economically and statistically significant.
5.3 Nevertheless, it is important to note that the variable portrayed
in the top pair of graphics is the unadjusted log of real trade. The graphics at
the bottom of Figure 1 are analogues that plot the residual from the gravity
equation of trade. That is, I regress the log of real trade on the gravity
variables (with the exception of GATT/WTO and GSP membership) and plot
the residuals, as before, around the time of GATT/WTO accession (more
details on the regressions are provided below). The residuals are always
insignificantly different from zero and do not rise significantly with entry into
the GATT/WTO. That is, countries joining the GATT/WTO neither have
significantly different trade from non-members, nor do they experience
increases in trade, holding other factors constant.
If It’s Worth Saying Once
5.4 Figure 2 is an analogous event study which examines
aggregate openness (that is, exports plus imports divided by GDP) instead
of (the log of) bilateral trade. I use data from the Penn World Table Mark VI,
which covers the years from 1950 through 1998. During this period, 104
countries joined the GATT/WTO. Yet aggregate openness did not vary
significantly from the five years preceding GATT/WTO entry through the five
years after accession, as can be seen from the top left graphic in Figure 2.
The other three diagrams in the figure are analogous event studies which
plot the residuals once openness has been regressed on the natural
logarithms of both real GDP and real GDP per capita. Since the data set is a
panel with data for a number of countries and years, I show the residuals
from: a) a standard regression; b) a regression which includes a
comprehensive set of (49) year-specific fixed effects; and c) a regression
which includes (158) country-specific fixed effects. There is little evidence
Economic Policy Department, Monetary Authority of Singapore

MAS Occasional Paper No. 24, Sep 2002 13
that GATT/WTO entry has a strong significant effect on the ratio of
aggregate trade to GDP.
Figure 2 Effect of GATT/WTO Entry on Aggregate Openness
PWT6 data, 1950-98. Mean, with +/- 2 standard deviations.Regressions include logs of real GDP and real GDP p/c.
Effect of GATT/WEO entry on Aggregate Openness, (X+M)/Y+/- 5 years around entry of 104 countries
Opennesst
-5 560
70
80
90
Residualt
-5 5-10
0
10
20
Residual, Year Effectst
-5 5-5
0
5
10
15
Residual, Country Effectst
-5 5-10
-5
0
5
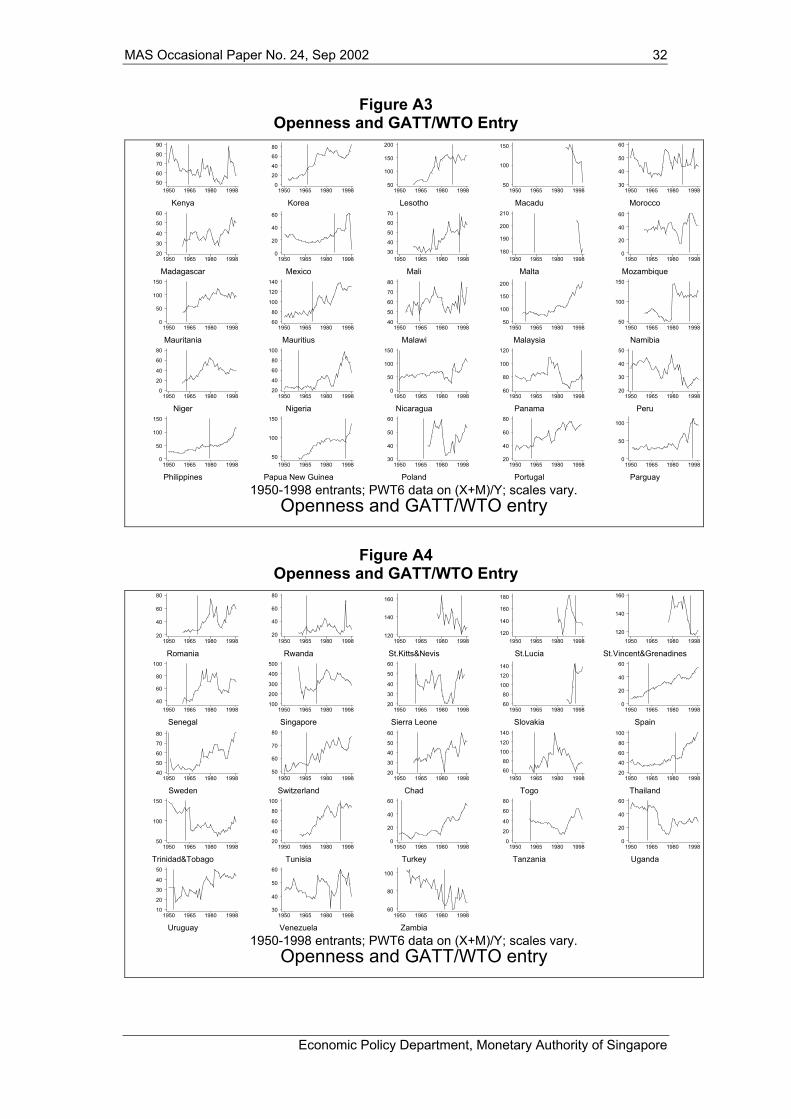
5.5 More evidence of the weak relationship between aggregate
openness and GATT/WTO membership can be found in Figures A1 through
A4. These are simple time-series plots of openness against time, for 98
countries that joined the GATT/WTO between 1950 and 1998 (the span of
the PWT6 data set); entry into the GATT/WTO is marked by a vertical line.15
It is possible to find cases where entry is followed by a gradual rise in
openness (e.g., Argentina and Austria). But it is also possible to find cases
where entry is followed by a fall in openness (e.g., Belize and Botswana), or
15 I omit plots for six countries which lack time-series PWT6 data: Bahrain, Djibouti,
Kuwait, Mongolia, Qatar, and Swaziland.
Economic Policy Department, Monetary Authority of Singapore
MAS Occasional Paper No. 24, Sep 2002 14
where nothing much at all happens (e.g., Denmark and the Dominican
Republic).16
16 In the absence of a better model for aggregate openness, I stick to the bilateral
gravity model for my regression analysis below. Still, a simple regression of aggregate openness on GATT/WTO membership delivers a negative and significant coefficient (I use robust standard errors and year effects); the point estimate remains negative but loses significance once one conditions on GDP and population.
Economic Policy Department, Monetary Authority of Singapore
MAS Occasional Paper No. 24, Sep 2002 15
VI TA-DA
6.1 The event studies of the previous section provide little
persuasive evidence that membership in the GATT/WTO stimulates trade.
But while the evidence is intriguing, it is not completely persuasive.
(Perhaps a ten-year window is not enough?) In this section I use standard
regression analysis to isolate the effects of the multilateral trading system on
trade. It turns out that using this extra econometric firepower delivers the
same (non-)result.
6.2 Table 1 contains benchmark regression results. My default
specification is the augmented gravity model, estimated with ordinary least
squares, year fixed effects, and robust standard errors over the full sample.
This specification (labeled “Default”) appears at the extreme left of Table 1.
6.3 The good news is that the model works well. Countries that
are farther apart trade less, while economically larger and richer countries
trade more.17 These traditional gravity effects are not only large but
economically sensible in size, highly statistically significant, and generally in
line with estimates from the literature. Countries belonging to the same
regional trade association trade more, as do countries sharing a money,
language, or land border. Landlocked countries trade less, as do physically
larger countries. A shared colonial history encourages trade. These effects
are sensible and explain almost two-thirds of the variation in bilateral trade.
Thus, the gravity equation seems to have done a good job in explaining
most of the reasons why international trade varies across almost a quarter-
million observations.
17 It is worth noting that the coefficients for GDP and GDP per capita sum to more than
one, so that an increase in GDP per capita holding population constant will raise trade more than proportionately.
Economic Policy Department, Monetary Authority of Singapore

MAS Occasional Paper No. 24, Sep 2002 16
Table 1 Benchmark Results
Default No Industrial Countries
Post ‘70 With Country Effects
Both in GATT/WTO
-.04 (.05)
-.21 (.07)
-.08 (.07)
.15 (.05)
One in GATT/WTO
-.06 (.05)
-.21 (.06)
-.09 (.07)
.04 (.04)
GSP .86 (.03)
.03 (.10)
.84 (.03)
.70 (.03)
Log Distance
-1.13 (.02)
-1.23 (.03)
-1.23 (.02)
-1.32 (.02)
Log product Real GDP
.92 (.01)
.96 (.02)
.95 (.01)
.16 (.05)
Log product Real GDP p/c
.32 (.01)
.20 (.02)
.32 (.02)
.55 (.05)
Regional FTA
1.03 (.11)
1.51 (.16)
.91 (.13)
.82 (.14)
Currency Union
1.13 (.12)
1.00 (.15)
1.25 (.15)
1.20 (.12)
Common Language
.32 (.04)
.10 (.06)
.36 (.04)
.27 (.04)
Land Border
.52 (.11)
.73 (.12)
.68 (.12)
.27 (.11)
Number Landlocked
-.27 (.03)
-.28 (.05)
-.31 (.03)
-1.00 (.26)
Number Islands
.06 (.04)
-.14 (.06)
.05 (.04)
-.86 (.19)
Log product Land Area
-.10 (.01)
-.17 (.01)
-.10 (.01)
.39 (.03)
Common Colonizer
.58 (.07)
.73 (.07)
.52 (.07)
.60 (.06)
Currently Colonized
1.06 (.23)
1.12 (.40)
.71 (.26)
Ever Colony
1.17 (.12)
-.43 (.57)
1.29 (.12)
1.27 (.11)
Common Country
.00 (1.09)
-.30 (1.05)
.33 (.59)
Observations 234,990 114,621 183,721 234,990 R2 .65 .47 .65 .70
RMSE 1.98 2.36 2.10 1.82
Regressand: log real trade. OLS with year effects (intercepts not reported). Robust standard errors (clustering by country-pairs) in parentheses.
6.4 Above and beyond these gravity effects, does membership in
the GATT/WTO have any substantial effect on trade? No. The dummy
variables for one or both of the countries being GATT/WTO members both
have small negative coefficients. Neither is statistically different from zero at
conventional significance levels. No reasonable person believes that
membership in the GATT or WTO actually reduces trade, so I prefer to
Economic Policy Department, Monetary Authority of Singapore

MAS Occasional Paper No. 24, Sep 2002 17
interpret the negative coefficients as a mystery rather than an indictment.
Still, by way of contrast, extension of the GSP from one country to another
seems to have a large positive effect on trade. Since the regressand is the
natural logarithm of real trade, the GSP is estimated to raise trade over one
hundred percent (since exp(.86) -1 ≈ 1.36)! That is, the data manifestly can
yield positive effects.
6.5 The rest of Table 1 contains a set of robustness checks,
presented in columns to the right of the table. The first perturbation drops all
data from industrial countries.18 The second uses only data after 1970.
Finally, I add country-specific fixed effects to the benchmark equation at the
extreme left of the table. The key result – that membership in the
GATT/WTP is associated with an economically and statistically insignificant
increase in trade – seems robust. Indeed, six of the eight coefficients are
actually negative (though usually insignificantly so). The largest coefficient
in Table 1 indicates that a pair of countries both in the GATT traded only
(exp(.15) -1≈ ) 16% more than a pair of countries outside the GATT.
6.6 To summarize, I have been unable to find evidence that
membership in the GATT/WTO has had a strong positive effect on
international trade. But since the GSP is associated with an approximate
doubling of trade, it seems that the data (rather than the methodology) is
delivering the negative message. Some aspects of the multilateral trading
system seem to matter; but not the obvious ones.
18 I follow the IMF in defining countries as “industrial” if they have an IFS country code
less than 200. No, the GSP coefficient is not a mistake; some (non-industrial) Eastern European countries extended GSP preference.
Economic Policy Department, Monetary Authority of Singapore
MAS Occasional Paper No. 24, Sep 2002 18
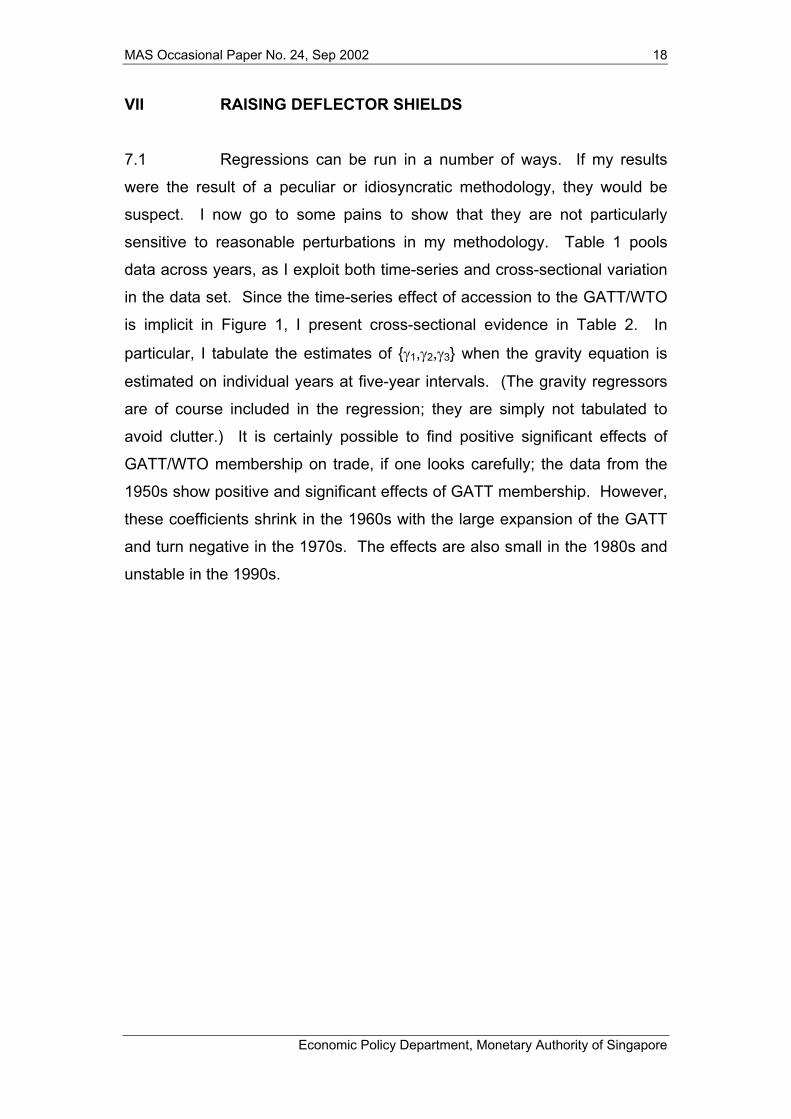
VII RAISING DEFLECTOR SHIELDS
7.1 Regressions can be run in a number of ways. If my results
were the result of a peculiar or idiosyncratic methodology, they would be
suspect. I now go to some pains to show that they are not particularly
sensitive to reasonable perturbations in my methodology. Table 1 pools
data across years, as I exploit both time-series and cross-sectional variation
in the data set. Since the time-series effect of accession to the GATT/WTO
is implicit in Figure 1, I present cross-sectional evidence in Table 2. In
particular, I tabulate the estimates of {γ1,γ2,γ3} when the gravity equation is
estimated on individual years at five-year intervals. (The gravity regressors
are of course included in the regression; they are simply not tabulated to
avoid clutter.) It is certainly possible to find positive significant effects of
GATT/WTO membership on trade, if one looks carefully; the data from the
1950s show positive and significant effects of GATT membership. However,
these coefficients shrink in the 1960s with the large expansion of the GATT
and turn negative in the 1970s. The effects are also small in the 1980s and
unstable in the 1990s.
Economic Policy Department, Monetary Authority of Singapore

MAS Occasional Paper No. 24, Sep 2002 19
Table 2 Cross-Sectional Analysis
Both in GATT/WTO One in GATT/WTO GSP
1950 .59 (.12)
.21 (.09)
1955 .64 (.11)
.30 (.09)
1960 .40 (.10)
.07 (.07)
1965 .23 (.07)
.13 (.07)
1970 -.15 (.10)
-.04 (.10)
.40 (.23)
1975 -.33 (.11)
-.16 (.11)
.92 (.05)
1980 -.09 (.11)
.02 (.11)
.90 (.05)
1985 .17 (.15)
.15 (.16)
.81 (.06)
1990 .58 (.20)
.43 (.21)
.77 (.05)
1995 -.49 (.21)
-.65 (.21)
.59 (.05)
Regressand: log real trade. OLS with intercept not reported. Robust standard errors in parentheses. Regressors included but with unrecorded coefficients: regional FTA; currency union; log distance; log product real GDP; log product real GDP p/c; common language; land border; number landlocked; number islands; log product land area; common colonizer; currently colonized; ever colony; and common country.
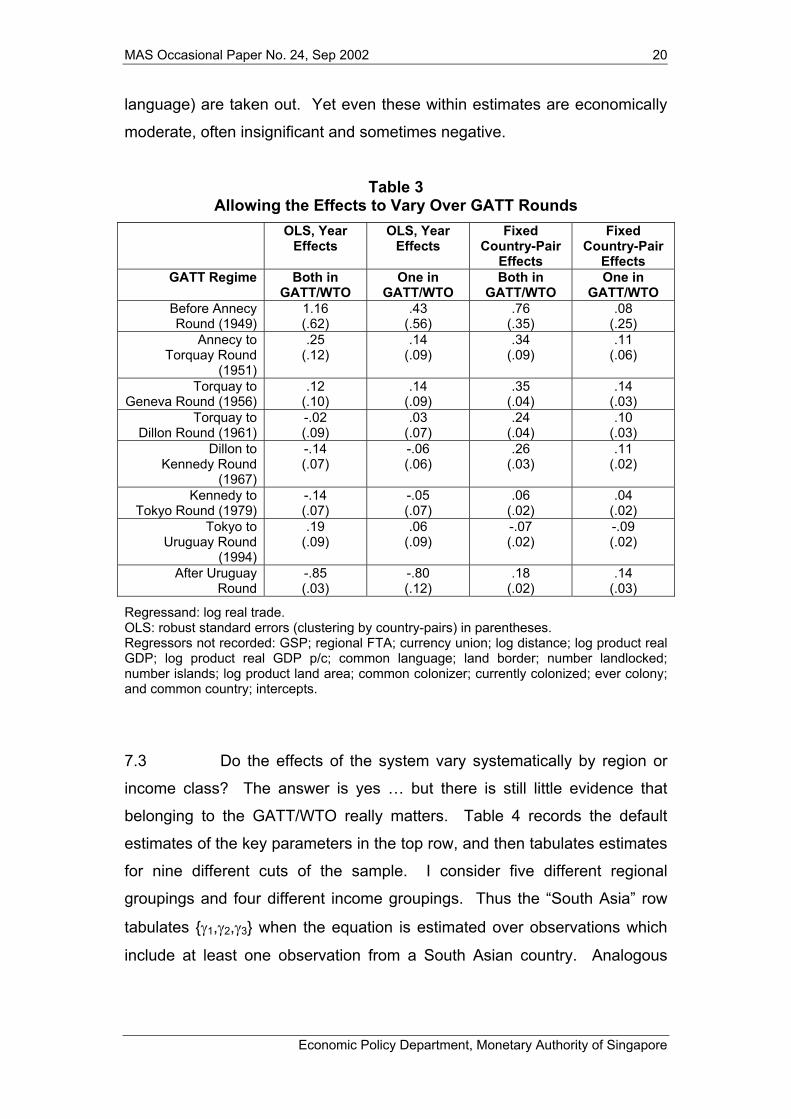
7.2 A different issue is whether the effects of GATT/WTO
membership have varied over time. The GATT conducted eight multilateral
rounds of trade liberalization; the conclusions of the rounds seem obvious
break points. Accordingly, in Table 3, I split both γ1 and γ2 into eight pieces.
Thus the top row of coefficients shows the effect of GATT membership for
1948 (that is, prior to the conclusion of the Annecy round); the second set
shows the effect from the Annecy round through the period prior to the
conclusion of the Torquay round, and so forth. There is clearly (statistically
and economically) significant variation in the coefficients across trade
rounds. Nevertheless, it is striking that the only economically large effects
are estimated for the first one or two rounds, and most of these are
statistically insignificant. The fixed-effects estimation shown at the right of
the table focus even more exclusively on time-series variation, since any
features which are constant over time for a pair of countries (such as
Economic Policy Department, Monetary Authority of Singapore
MAS Occasional Paper No. 24, Sep 2002 20
language) are taken out. Yet even these within estimates are economically
moderate, often insignificant and sometimes negative.
Table 3 Allowing the Effects to Vary Over GATT Rounds
OLS, Year Effects
OLS, Year Effects
Fixed Country-Pair
Effects
Fixed Country-Pair
Effects GATT Regime Both in
GATT/WTO One in
GATT/WTO Both in
GATT/WTO One in
GATT/WTO Before Annecy Round (1949)
1.16 (.62)
.43 (.56)
.76 (.35)
.08 (.25)
Annecy to Torquay Round
(1951)
.25 (.12)
.14 (.09)
.34 (.09)
.11 (.06)
Torquay to Geneva Round (1956)
.12 (.10)
.14 (.09)
.35 (.04)
.14 (.03)
Torquay to Dillon Round (1961)
-.02 (.09)
.03 (.07)
.24 (.04)
.10 (.03)
Dillon to Kennedy Round
(1967)
-.14 (.07)
-.06 (.06)
.26 (.03)
.11 (.02)
Kennedy to Tokyo Round (1979)
-.14 (.07)
-.05 (.07)
.06 (.02)
.04 (.02)
Tokyo to Uruguay Round
(1994)
.19 (.09)
.06 (.09)
-.07 (.02)
-.09 (.02)
After Uruguay Round
-.85 (.03)
-.80 (.12)
.18 (.02)
.14 (.03)
Regressand: log real trade. OLS: robust standard errors (clustering by country-pairs) in parentheses. Regressors not recorded: GSP; regional FTA; currency union; log distance; log product real GDP; log product real GDP p/c; common language; land border; number landlocked; number islands; log product land area; common colonizer; currently colonized; ever colony; and common country; intercepts.
7.3 Do the effects of the system vary systematically by region or
income class? The answer is yes … but there is still little evidence that
belonging to the GATT/WTO really matters. Table 4 records the default
estimates of the key parameters in the top row, and then tabulates estimates
for nine different cuts of the sample. I consider five different regional
groupings and four different income groupings. Thus the “South Asia” row
tabulates {γ1,γ2,γ3} when the equation is estimated over observations which
include at least one observation from a South Asian country. Analogous
Economic Policy Department, Monetary Authority of Singapore

MAS Occasional Paper No. 24, Sep 2002 21
estimates for four other regions and four income groupings follow.19 The
results are easy to summarize. The GSP estimates remain economically
and statistically significant throughout; but GATT/WTO membership seems
to have a negligible (often negative) effect. The only exception is trade for
South Asia, where the GATT/WTO effect is economically large but
statistically marginal.
Table 4 Allowing the Effects to Vary by Region and Income Class
Both in GATT/WTO
One in GATT/WTO
GSP
Default -.04 (.05)
-.06 (.05)
.86 (.03)
South Asia .93 (.40)
.67 (.39)
.86 (.11)
East Asia .04 (.12)
-.11 (.10)
.65 (.10)
Sub-Saharan Africa -.29 (.10)
-.28 (.09)
.98 (.06)
Middle-East or North Africa
-.16 (.12)
-.01 (.08)
1.05 (.09)
Latin America or Caribbean
.10 (.08)
.12 (.07)
.93 (.06)
High Income -.26 (.09)
-.20 (.08)
.47 (.04)
Middle Income -.05 (.06)
-.02 (.05)
.94 (.04)
Low Income -.38 (.08)
-.37 (.08)
1.11 (.05)
Least Developed -.34 (.11)
-.21 (.10)
1.11 (.07)
Regressand: log real trade. OLS with year effects (intercepts not reported). Robust standard errors (clustering by country-pairs) in parentheses. Regressors not recorded: regional FTA; currency union; log distance; log product real GDP; log product real GDP p/c; common language; land border; number landlocked; number islands; log product land area; common colonizer; currently colonized; ever colony; and common country.
7.4 Further sensitivity analysis is presented in Table 5, which
tabulates estimates of {γ1,γ2,γ3} for nineteen perturbations of the benchmark
methodology. The first pair of experiments splits the pooled data set by time
into halves. I next split the sample by country groupings, and include only
data for: a) industrial countries; b) non-Africans; and c) countries outside
19 Dummy variables for regional (e.g., South Asia) and income (e.g., Low Income)
groupings were created using the lists in the World Bank’s World Development Indicators CD-ROM.
Economic Policy Department, Monetary Authority of Singapore

MAS Occasional Paper No. 24, Sep 2002 22
Latin America and the Caribbean.20 I then drop the poorest quarter of the
data set (as gauged by real GDP per capita), and the smallest quarter of the
data set (as gauged by total real GDP).
7.5 Having messed with the sample, I fiddle with the model. First, I
add quadratic gravity terms as nuisance variables, since some authors have
found these terms important. Next I drop the set of year dummies. I also
record the coefficients when each of the ten regional trade agreements is
allowed to have its own separate effect on trade, and separately add a lag of
the dependent variable.21
7.6 The last set of robustness checks concern the estimation
technique. First, I re-estimate everything using five-year averages in place
of annual observations. I then tabulate the results of panel estimators which
treat country-pairs as both random- and fixed-effects (there are two sets of
estimates; one without year effects, and another with year effects). I also
employ the trendy “treatment” estimator developed by Heckman and co-
authors. There are two sets of maximum likelihood estimates presented.
The first compares trade when both countries are GATT/WTO members to
the case where neither is; the second compares trade between non-
members and the case where just one of the countries is a GATT/WTO
member.22 These estimates are of particular interest since small poor
countries are less likely to trade and also less likely to be GATT/WTO
members.23 The treatment methodology attempts to correct for this
20 Industrial countries are again defined as those with IFS country codes of less than
200; some of these countries received GSP preferences. 21 The lagged dependent variable is highly significant and has a coefficient of .81, so the
long-run effects are around five times the tabulated coefficients. It is also worth highlighting the fact that regional trade associations seem typically to have a much larger effect than the multilateral GATT/WTO system; nine of the ten RTAs have point estimates greater than .7 (all are statistically significant), indicating that trade at least doubles with membership. Curiously, the outlier is the EEC/EC/EU, which seems a topic for future investigation.
22 Throughout, I use the full set of gravity variables as both determinants of treatment
assignation and as regressors in the trade equation. 23 Indeed, the first stage shows that countries inside the GATT/WTO have significantly
higher output.
Economic Policy Department, Monetary Authority of Singapore

MAS Occasional Paper No. 24, Sep 2002 23
selection bias, yet it delivers even more negative results. Finally, I tabulate
coefficients estimated from a robust median estimator, and a Tobit
estimator.24
7.7 Only one of these perturbations has any important positive
effect on the key coefficients. In particular, when I restrict the sample of
countries to the industrial countries only, GATT/WTO membership has a
somewhat important effect on trade. My estimate indicates that a pair of
industrial GATT/WTO members trades about 60% (≈ exp(.47) -1) more than
an otherwise-identical pair of non-members. This result is not of
overwhelming statistical significance, and even its economic importance is
less than dramatic.25
24 I do this by replacing the smallest five percent of the sample trade observations by
zero (altering the threshold from 5% has no substantive effect). 25 The moderately positive evidence for industrial countries is a piece in a continuing but
vague pattern. There is also weak evidence that dropping small and poor countries delivers bigger results (Table 4), and that the effects of the GATT were larger at the beginning of the sample (Tables 2 and 3) when the institution was (even) more dominated by the industrial countries. Further, founding members of the GATT have had their trade grow more than later entrants. The last column of Table 5 contains dummy variables for one or both countries being GATT founders (in practice, contracting partners in 1948 or 1949). The coefficients for both variables are positive and significant, though again not overwhelmingly so. By way of contrast, for later entrants, the maximum number of years that the parties had both been in the GATT/WTO has a slight negative effect on trade, while the minimum number of years both countries had been members has essentially no effect on trade. Perhaps the GATT was the hand servant of its (mostly rich) creators? My evidence is weak, but it seems to be an angle worth pursuing.
Economic Policy Department, Monetary Authority of Singapore

MAS Occasional Paper No. 24, Sep 2002 24
Table 5 Sensitivity Analysis
Both in GATT/WTO
One in GATT/WTO
GSP
Data before 1980 .02 (.06)
.01 (.05)
.87 (.04)
Data after 1979 -.04 (.08)
-.08 (.08)
.81 (.04)
Only Industrial Countries
.47 (.22)
.19 (.22)
-.40 (.09)
No African Countries -.06 (.07)
-.07 (.06)
.70 (.04)
No Latin or Caribbean countries
-.10 (.07)
-.16 (.06)
.63 (.04)
Without Poorest Quartile of real GDP p/c
.15 (.07)
.14 (.06)
.74 (.03)
Without Smallest Quartile of real GDP
.21 (.06)
.16 (.06)
.68 (.03)
With Quadratic Gravity terms
-.02 (.05)
-.02 (.05)
.86 (.03)
Without Year Effects -.53 (.06)
-.33 (.05)
.47 (.03)
Dis-aggregated Regional Trade
Agreements
-.03 (.05)
-.06 (.05)
.83 (.03)
With Lagged Dependent Variable
-.03 (.01)
-.01 (.01)
.10 (.01)
5-yr averages .06 (.06)
-.07 (.05)
.87 (.03)
Random Effects (GLS) Estimator
-.07 (.02)
-.06 (.02)
.04 (.01)
Fixed Effects (Within) Estimator
.15 (.02)
.05 (.02)
.11 (.01)
Random Effects (GLS) Estimator with Years
.11 (.02)
.03 (.02)
.31 (.01)
Fixed Effects (Within) Estimator with Years
.13 (.02)
.06 (.02)
.18 (.01)
Treatment MLE: Both members vs. neither
-.20 (.07)
.73 (.04)
Treatment MLE: One member vs. neither
-.26 (.07)
1.21 (.05)
Median Regression Estimator
-.51 (.02)
-.30 (.02)
.26 (.01)
Tobit Estimator
-.63 (.02)
-.41 (.02)
.57 (.01)
Regressand: log real trade. OLS with year effects (intercepts not reported) unless noted. Robust standard errors (clustering by country-pairs) in parentheses. Regressors not recorded: regional FTA; currency union; log distance; log product real GDP; log product real GDP p/c; common language; land border; number landlocked; number islands; log product land area; common colonizer; currently colonized; ever colony; and common country.
Economic Policy Department, Monetary Authority of Singapore

MAS Occasional Paper No. 24, Sep 2002 25
Only for Geeks
7.8 A few technical issues are worth addressing. Reverse
causality is not the problem that it ordinarily is in such exercises. Countries
may join the WTO/GATT in order to increase trade, but that would tend to
bias the key coefficients upwards. Similarly, there is little measurement error
with respect to the date of a country’s accession to the GATT/WTO.
7.9 Missing data is a potentially more serious problem. There are
two distinct issues: 1) missing trade data (since trade cannot be less than
zero); and 2) missing regressor data, primarily GDP. The first issue has
been the subject of more research, and has already been discussed. The
second issue may be more important in practice; small poor countries
typically have their trade recorded but are less likely to have national
accounts data. Without GDP data, these observations are dropped from the
regression analysis, seriously reducing the sample size.26 Econometrics has
developed a number of techniques including various ways of interpolating or
estimating missing data (e.g., Gourieroux and Monfort, 1981; surveys are
provided by Griliches, 1986 and Little 1992). These typically improve the
efficiency of the parameters of interest, while sometimes introducing bias.
Given my interest in the points estimate I do not find these estimators
compelling, but it seems a reasonable topic for future research.
7.10 I conclude that both my key findings are robust. Membership
in the GATT/WTO seems not to have an economically or statistically
significant effect on trade, while the GSP encourages trade.
Alright Already
7.11 Is it possible to understand why economists have assumed that
the GATT has been so important in encouraging trade? It is possible to
26 By a factor of almost two! For instance, in Glick-Rose (2002), we have 426,792 trade
observations but only 219,558 GDP observations.
Economic Policy Department, Monetary Authority of Singapore

MAS Occasional Paper No. 24, Sep 2002 26
shed a little light on the issue by stripping down the regression model. Table
6 contains the benchmark pooled results at the extreme left-hand side, taken
directly from Table 1. I then drop the augmenting regressors in the next
column (i.e., I set β4 - β14 to zero), leaving only a stripped-down gravity
model. This barely alters the key coefficients (or the fit of the model). But if
I drop the essential gravity variables – distance and output – from the model,
I can estimate a highly significant positive effect of GATT/WTO membership
on trade. In particular, the estimates show that a pair of members share
345% (≈ exp(1.24)) the level of trade of a pair of non-members. The
difference between this huge effect and the small (negative) effect of the
benchmark result is analogous to the difference between the substantial
trend visible in the top part of Figure 1 and the negligible effect in the bottom
of the same graphic. Simply taking into account standard gravity effects
essentially eradicates any large effect of the GATT/WTO on bilateral trade.
7.12 This paper reports 63 sets of estimates of the parameters of
interest, including 60 estimates of γ1, the effect of GATT/WTO membership
(by both countries) on trade. The mean estimate across these 60 γ1
estimates is .07; the median is .03; 29 of the estimates are negative, while
only 4 are greater than .69 (implying that GATT/WTO membership doubles
trade). Seventy percent of the associated t-statistics are insignificant at
conventional confidence levels. My interpretation: the regression analysis is
saying (albeit with the whisper associated with negative results) that there is
little evidence that GATT/WTO membership has a substantial positive effect
on trade.27
27 One can also compute “meta-estimates” across the coefficient estimates. The meta
fixed effect estimate of γ1 is -.05, while the random effect meta-estimate is .03 (the latter is insignificantly different from zero). By way of contrast, the meta-fixed and random estimates for γ3 are .36 and .69, both economically and statistically significant.
Economic Policy Department, Monetary Authority of Singapore

MAS Occasional Paper No. 24, Sep 2002 27
Table 6 Perturbations of the Gravity Model
Both in GATT/WTO
-.04 (.05)
.14 (.05)
1.24 (.08)
One in GATT/WTO
-.06 (.05)
-.02 (.05)
.46 (.07)
GSP .86 (.03)
.74 (.03)
2.17 (.07)
.86 (.03)
.88 (.03)
Neither in GATT/WTO
.05 (.05)
1 Founder of GATT
.22 (.04)
2 Founders of GATT
.47 (.10)
Min. Years In GATT/WTO
.001 (.001)
Max. Years In GATT/WTO
-.007 (.002)
Log Distance
-1.13 (.02)
-1.27 (.02)
-1.13 (.02)
-1.14 (.02)
Log product Real GDP
.92 (.01)
.79 (.01)
.92 (.01)
.91 (.01)
Log product Real GDP p/c
.32 (.01)
.45 (.01)
.32 (.01)
.32 (.01)
Regional FTA
1.03 (.11)
1.03 (.11)
1.01 (.12)
Currency Union
1.13 (.12)
1.13 (.12)
1.12 (.12)
Common Language
.32 (.04)
.32 (.04)
.30 (.04)
Land Border
.52 (.11)
.52 (.11)
.52 (.11)
Number Landlocked
-.27 (.03)
-.27 (.03)
-.27 (.03)
Number Islands
.06 (.04)
.06 (.04)
.02 (.04)
Log product Land Area
-.10 (.01)
-.10 (.01)
-.10 (.01)
Common Colonizer
.58 (.07)
.58 (.07)
.57 (.07)
Currently Colonized
1.06 (.23)
1.07 (.23)
.84 (.25)
Ever Colony
1.17 (.12)
1.17 (.12)
1.11 (.12)
Common Country
.00 (1.09)
.00 (1.09)
-.05 (1.11)
Observations 234,990 234,990 235,207 234,990 234,990 R2 .65 .63 .12 .65 .65
RMSE 1.98 2.04 3.13 1.98 1.98
Regressand: log real trade. OLS with year effects (intercepts not reported). Robust standard errors (clustering by country-pairs) in parentheses.
Economic Policy Department, Monetary Authority of Singapore

MAS Occasional Paper No. 24, Sep 2002 28
VIII PARTING SHOTS
8.1 Perhaps the GATT has not had much of an effect on trade …
but the WTO will. Perhaps. After all, the contracting parties to the ad hoc
and provisional GATT signed legal documents about goods trade only to the
extent that they were not inconsistent with pre-existing national legislation.
Members of the WTO use a more wide-reaching permanent framework to
resolve disputes about trade in goods, services, and intellectual property.
Time will tell.
8.2 Why has trade grown faster than income, if not because of the
GATT/WTO? Who knows? But there are plenty of other candidates. Higher
rates of productivity in tradables, falling transport costs, regional trade
associations, converging tastes, growing international liquidity, and changing
endowments are all possibilities. But that’s a different topic altogether.
8.3 My quantitative examination indicates that there is little reason
to believe that the GATT has had a dramatic effect on trade. Once standard
gravity effects have been taken into account, bilateral trade cannot be
dependably linked to membership in the WTO or its predecessor the GATT.
Since the GSP and other gravity effects have economically and statistically
significant influences, this negative finding does not seem to be the result of
my methodology or data set, both of which are common. I conclude that it is
surprisingly hard to demonstrate convincingly that the GATT and the WTO
have stimulated trade. One should not conclude the GATT and WTO have
not stimulated aggregate trade (although one wishes that it was easier to
see this effect more clearly in the data). Rather, since conventional wisdom
accords an important role to the GATT/WTO in creating trade, I prefer to
view this negative result as an interesting mystery.
Economic Policy Department, Monetary Authority of Singapore

MAS Occasional Paper No. 24, Sep 2002 29
Appendix 1 Trading Entities in Sample
Albania Algeria Angola Antigua and Barbuda Argentina Armenia Australia Austria Azerbaijan Bahamas Bahrain Bangladesh Barbados Belarus Belgium Belize Benin Bermuda Bhutan Bolivia Botswana Brazil Bulgaria Burkina Faso Burma(Myanmar) Burundi Cambodia Cameroon Canada Cape Verde Central African Rep. Chad Chile China Colombia Comoros Congo, Dem. Rep. of (Zaire) Congo, Rep. of Costa Rica Cote D'Ivoire (Ivory Coast) Croatia Cyprus Czech Republic Denmark Djibouti Dominica Dominican Rep. Ecuador Egypt El Salvador Equatorial Guinea Estonia Ethiopia Fiji Finland France Gabon Gambia Georgia Germany
Ghana Greece Grenada Guatemala Guinea Guinea-Bissau Guyana Haiti Honduras Hong Kong Hungary Iceland India Indonesia Iran Iraq Ireland Israel Italy Jamaica Japan Jordan Kazakhstan Kenya Kiribati Korea, South (R) Kuwait Kyrgyz Republic Lao People's Dem. Rep. Latvia Lebanon Lesotho Liberia Libya Lithuania Luxembourg Macedonia Madagascar Malawi Malaysia Maldives Mali Malta Mauritania Mauritius Mexico Moldova Mongolia Morocco Mozambique Namibia Nepal Netherlands New Zealand Nicaragua Niger Nigeria Norway Oman Pakistan
Panama Papua N. Guinea Paraguay Peru Philippines Poland Portugal Qatar Reunion Romania Russia Rwanda Samoa Sao Tome & Principe Saudi Arabia Senegal Seychelles Sierra Leone Singapore Slovak Republic Slovenia Solomon Islands Somalia South Africa Spain Sri Lanka St. Kitts & Nevis St. Lucia St. Vincent & Gren. Sudan Suriname Swaziland Sweden Switzerland Syria Tajikistan Tanzania Thailand Togo Tonga Trinidad & Tobago Tunisia Turkey Turkmenistan Uganda Ukraine United Arab Emirates United Kingdom United States Uruguay Uzbekistan Vanuatu Venezuela Vietnam Yemen, Republic of Yugoslavia, Socialist Fed. Rep. of Zambia Zimbabwe
Economic Policy Department, Monetary Authority of Singapore

MAS Occasional Paper No. 24, Sep 2002 30
Appendix 2 Descriptive Statistics
Mean Standard Deviation
Correlation with Both
in GATT/WEO
Correlation with One in GATT/WEO
Correlation with GSP
Log Real Trade 10.07 3.34 .12 -.08 .24
Both in GATT/WTO .49 .50 1. -.84 .16
One in GATT/WTO .42 .49 -.84 1. -.06
GSP .23 .42 .16 -.06 1.
Regional FTA .01 .11 .04 -.05 -.05
Currency Union .01 .12 .04 -.04 -.06
Log Distance 8.16 .81 .04 .02 .14
Log product Real GDP 47.88 2.68 .19 -.10 .27
Log product Real GDP p/c 16.04 1.50 .13 -.05 .35
Common Language .22 .42 .04 -.07 -.06
Land Border .03 .17 -.02 -.02 -.09
Number Landlocked .25 .47 .01 -.01 .03
Number Islands .34 .54 .04 -.01 .00
Log product Land Area 24.21 3.28 -.02 .02 .03
Common Colonizer .10 .30 .02 -.03 -.18
Currently Colonized .002 .04 .04 -.04 -.01
Ever Colony .02 .14 .04 -.03 .08
Common Country .0003 .02 .02 -.01 -.00
234,990 observations.
Economic Policy Department, Monetary Authority of Singapore

MAS Occasional Paper No. 24, Sep 2002 31
Figure A1 Openness and GATT/WTO Entry
Openness and GATT/WTO entry1950-1998 entrants; PWT6 data on (X+M)/Y; scales vary.
Angola
1950 1965 1980 19980
50
100
150
Argentina
1950 1965 1980 19985
10
15
20
25
Antigua&Barbuda
1950 1965 1980 1998100
150
200
250
Austria
1950 1965 1980 199820
40
60
80
100
Burundi
1950 1965 1980 199820
25
30
35
40
Benin
1950 1965 1980 19980
20
40
60
80
Burkina Faso
1950 1965 1980 1998
20
40
60
Bangladesh
1950 1965 1980 199810
20
30
40
Bulgaria
1950 1965 1980 199880
100
120
Belize
1950 1965 1980 1998100
110
120
130
140
Bolivia
1950 1965 1980 19980
20
40
60
80
Barbados
1950 1965 1980 199880
100
120
140
Botswana
1950 1965 1980 199840
60
80
100
120
C.A.R.
1950 1965 1980 199820
40
60
80
Cote d'Ivoire
1950 1965 1980 199850
60
70
80
90
Camerooon
1950 1965 1980 199830
40
50
60
70
Colombia
1950 1965 1980 199820
25
30
35
Rep. Congo
1950 1965 1980 199850
100
150
200
Dem.Rep.Congo
1950 1965 1980 199820
40
60
80
Costa Rica
1950 1965 1980 199840
60
80
100
Cyprus
1950 1965 1980 199840
60
80
100
120
Czech Rep.
1950 1965 1980 199890
100
110
120
Dominica
1950 1965 1980 1998100
120
140
Denmark
1950 1965 1980 1998
55
60
65
70
75
Dominican Rep.
1950 1965 1980 199820
40
60
80
Figure A2 Openness and GATT/WTO Entry
Openness and GATT/WTO entry1950-1998 entrants; PWT6 data on (X+M)/Y; scales vary.
Ecuador
1950 1965 1980 199830
40
50
60
70
Egypt
1950 1965 1980 199820
40
60
80
El Salvador
1950 1965 1980 199840
60
80
Finland
1950 1965 1980 199830
40
50
60
70
Fiji
1950 1965 1980 199860
80
100
120
140
Gabon
1950 1965 1980 199850
100
150
Ghana
1950 1965 1980 19980
20
40
60
Guinea
1950 1965 1980 199820
40
60
80
Gambia
1950 1965 1980 199860
80
100
120
140
Guinea-Bissau
1950 1965 1980 199830
40
50
60
70
Greece
1950 1965 1980 199810
20
30
40
50
Grenada
1950 1965 1980 199880
100
120
140
Guatemala
1950 1965 1980 199820
30
40
50
Guyana
1950 1965 1980 1998
100
200
300
Hong Kong
1950 1965 1980 1998150
200
250
300
Honduras
1950 1965 1980 199840
60
80
100
Haiti
1950 1965 1980 199820
30
40
50
Hungary
1950 1965 1980 199860
80
100
Indonesia
1950 1965 1980 19980
50
100
Ireland
1950 1965 1980 199850
100
150
Iceland
1950 1965 1980 199840
60
80
100
Israel
1950 1965 1980 19980
50
100
150
Italy
1950 1965 1980 199820
30
40
50
Jamaica
1950 1965 1980 199860
80
100
120
140
Japan
1950 1965 1980 199815
20
25
30
Economic Policy Department, Monetary Authority of Singapore
MAS Occasional Paper No. 24, Sep 2002 32
Figure A3 Openness and GATT/WTO Entry
Openness and GATT/WTO entry1950-1998 entrants; PWT6 data on (X+M)/Y; scales vary.
Kenya
1950 1965 1980 199850
60
70
80
90
Korea
1950 1965 1980 19980
20
40
60
80
Lesotho
1950 1965 1980 199850
100
150
200
Macadu
1950 1965 1980 199850
100
150
Morocco
1950 1965 1980 199830
40
50
60
Madagascar
1950 1965 1980 199820
30
40
50
60
Mexico
1950 1965 1980 19980
20
40
60
Mali
1950 1965 1980 199830
40
50
60
70
Malta
1950 1965 1980 1998180
190
200
210
Mozambique
1950 1965 1980 19980
20
40
60
Mauritania
1950 1965 1980 19980
50
100
150
Mauritius
1950 1965 1980 199860
80
100
120
140
Malawi
1950 1965 1980 199840
50
60
70
80
Malaysia
1950 1965 1980 199850
100
150
200
Namibia
1950 1965 1980 199850
100
150
Niger
1950 1965 1980 19980
20
40
60
80
Nigeria
1950 1965 1980 199820
40
60
80
100
Nicaragua
1950 1965 1980 19980
50
100
150
Panama
1950 1965 1980 199860
80
100
120
Peru
1950 1965 1980 199820
30
40
50
Philippines
1950 1965 1980 19980
50
100
150
Papua New Guinea
1950 1965 1980 199850
100
150
Poland
1950 1965 1980 199830
40
50
60
Portugal
1950 1965 1980 1998
20
40
60
80
Parguay
1950 1965 1980 19980
50
100
Figure A4 Openness and GATT/WTO Entry
Openness and GATT/WTO entry1950-1998 entrants; PWT6 data on (X+M)/Y; scales vary.
Romania
1950 1965 1980 199820
40
60
80
Rwanda
1950 1965 1980 199820
40
60
80
St.Kitts&Nevis
1950 1965 1980 1998120
140
160
St.Lucia
1950 1965 1980 1998120
140
160
180
St.Vincent&Grenadines
1950 1965 1980 1998120
140
160
Senegal
1950 1965 1980 199840
60
80
100
Singapore
1950 1965 1980 1998100
200
300
400
500
Sierra Leone
1950 1965 1980 199820
30
40
50
60
Slovakia
1950 1965 1980 199860
80
100
120
140
Spain
1950 1965 1980 19980
20
40
60
Sweden
1950 1965 1980 199840
50
60
70
80
Switzerland
1950 1965 1980 199850
60
70
80
Chad
1950 1965 1980 199820
30
40
50
60
Togo
1950 1965 1980 199860
80
100
120
140
Thailand
1950 1965 1980 199820
40
60
80
100
Trinidad&Tobago
1950 1965 1980 199850
100
150
Tunisia
1950 1965 1980 199820
40
60
80
100
Turkey
1950 1965 1980 19980
20
40
60
Tanzania
1950 1965 1980 19980
20
40
60
80
Uganda
1950 1965 1980 19980
20
40
60
Uruguay
1950 1965 1980 199810
20
30
40
50
Venezuela
1950 1965 1980 199830
40
50
60
Zambia
1950 1965 1980 199860
80
100
Economic Policy Department, Monetary Authority of Singapore

MAS Occasional Paper No. 24, Sep 2002 33
REFERENCES Alston, Richard M., J.R. Kearl, and Michael B. Vaughan (1992) “Is there a Consensus Among Economists in the 1990s?” American Economic Review 82-2, 203-209. Anderson, James and Eric van Wincoop (2002) “Gravity with Gravitas: A Solution to the Border Puzzle” forthcoming American Economic Review. Deardorff, Alan V. (1998) “Determinants of Bilateral Trade: Does Gravity Work in a Neoclassical World?” in The Regionalization of the World Economy (ed.: Jeffrey A. Frankel), Chicago: University Press. Frankel, Jeffrey A. (1997) Regional Trading Blocs in the World Economic System IIE, Washington. Glick, Reuven and Andrew K. Rose (2002) “Does a Currency Union affect Trade? The Time-Series Evidence” European Economic Review. Gourieroux, Christian and Alain Monfort (1981) “On the Problem of Missing Data in Linear Models” Review of Economic Studies XLVIII, 579-586. Griliches, Zvi (1986) “Economic Data Issues” in Handbook of Econometrics (vol. III, edited by Z. Griliches and M.D. Intriligator), Elsevier Science, Amsterdam, pp.1485-1495. Kearl, J.R., Clayne L. Pope, Gordon C. Whiting, and Larry T. Wimmer (1979) “A Confusion of Economists?” American Economic Review 69-2, 28-37. Little, Roderick J.A. (1992) “Regression with Missing X’s: A Review” Journal of the American Statistical Association 87-420, 1227-1237. United Nations, Operation and Effects of the Generalized System of Preferences, various issues.
Economic Policy Department, Monetary Authority of Singapore

MAS OCCASIONAL PAPER SERIES*
Number Title Date
1 Current Account Deficits in the ASEAN-3: Is There Cause for Concern?
May 1997
2 Quality of Employment Growth in Singapore: 1983-96
Oct 1997
3 Whither the Renminbi? Dec 1997
4 Growth in Singapore's Export Markets, 1991-96: A Shift-Share Analysis
Feb 1998
5 Singapore’s Services Sector in Perspective: Trends and Outlook
May 1998
6 What lies behind Singapore’s Real Exchange Rate? An Empirical Analysis of the Purchasing Power Parity Hypothesis
May 1998
7 Singapore’s Trade Linkages, 1992-96: Trends and Implications
Aug 1998
8 Impact of the Asian Crisis on China: An Assessment
Oct 1998
9 Export Competition Among Asian NIEs, 1991-96: An Assessment
Oct 1998
10 Measures of Core Inflation for Singapore Dec 1998
* All MAS Occasional Papers in Adobe Acrobat (PDF) format can be downloaded at the MAS Website at http://www.mas.gov.sg.

Number Title Date
11 Capital Account and Exchange Rate Management in a Surplus Economy: The Case of Singapore
Mar 1999
12 The Term Structure of Interest Rates, Inflationary Expectations and Economic Activity: Some Recent US Evidence
May 1999
13 How Well Did The Forward Market Anticipate The Asian Currency Crisis: The Case of Four ASEAN Currencies
May 1999
14 The Petrochemical Industry in Singapore Jun 1999
15 Money, Interest Rates and Income in the Singapore Economy
Jul 1999
16 Interbank Interest Rate Determination in Singapore and its Linkages to Deposit and Prime Rates
Sep 1999
17 Extracting Market Expectations of Future Interest Rates from the Yield Curve: An Application Using Singapore Interbank and Interest Rate Swap Data
Nov 1999
18 A Survey of Singapore's Monetary History Jan 2000
19 Exchange Rate Policy in East Asia After the Fall: How Much Have Things Changed?
Feb 2000
20 Financial Market Integration in Singapore: The Narrow and the Broad Views
May 2000

Number Title Date
21 Kicking the Habit and Turning Over A New Leaf: Monetary Policy in East Asia After the Currency Crisis
Dec 2000
22 The Effect of Common Currencies on International Trade: Where Do We Stand?
Aug 2002
23 Assessing Singapore’s Export Competitiveness Through Dynamic Shift-Share Analysis
Sep 2002
24 Do We Really Know That The WTO Increases Trade?
Sep 2002