do technical barriers to trade promote or restrict trade
TRANSCRIPT
Do Technical Barriers to Trade Promote or Restrict Trade? Evidence from China
Xiaohua Baoa* and Larry D. Qiub
aUniversity of Finance and EconomicsbUniversity of Hong Kong
Abstract
The use of technical barriers to trade (TBT) is widespread and has increasing impact on international trade. In contrast to most other trade measures, TBT have both trade promotion and trade restriction effects. Due to their theoretical complexity and their scarcity, TBT have been considered as one of the most difficult non-tariff barriers (NTBs) to quantify. In this paper, we construct a TBT database from 1998-2006 to examine the influence of TBT imposed by China on the country’s imports. When using the frequency index, we find that TBT are trade restrictive: a one unit increase in TBT will decrease import value by about 0.8%. However, when the coverage ratio is used, we find that the negative effects of TBT are not statistically significant based on the entire period. However, if the focus is shifted to data from 1998-2001, we find that TBT have trade promotion effects. A one unit increase in TBT will increase import value by about 0.2%. Finally, China’s TBT (measured by both frequency index and coverage ratio) are trade restricting for agriculture goods but trade promoting for manufacturing goods.
JEL Classifications: F13
Keywords: non-tariff barriers, technical barriers to trade, frequency index, coverage ratio, China’s trade
1. Introduction
Technical barriers to trade (TBT) are widely utilized government administrative measures for environmental protection, safety, national security, and consumer interests,
* Corresponding authors: Xiaohua Bao, School of International Business Administration, Shanghai University of Finance and Economics, [email protected]. Larry Qiu, School of Economics and Finance, University of Hong Kong, [email protected].
We would like to thank the referee for the valuable comments and suggestions. We are grateful for the presentations at the Canadian Economic Association Annual Meeting, Asia-Pacific Trade Seminars, the first IEFS China Conference, and especially the 2010 APJAE Symposium on International Trade and China Economy. We wish to acknowledge the financial support from the Hong Kong Government’s Competitive Earmarked Research Grant 2008-2010 (HKU643108H), the Mrs. Li Ka Shing Fund of the University of Hong Kong, National Nature Science Foundation of China (NSFC project No.70703021), Ministry of Education of China (NCET-10-0537) and Shanghai Education Committee (10ZS49).
Xiaohua Bao and Larry D. Qiu Asia-Pacific Journal of Accounting & Economics 17 (2010) 253–280
254
which have increasing impact on international trade. The wide use of TBT is for a variety of reasons. First, TBT are legitimate. World Trade Organisation (WTO) members are authorized by WTO TBT/SPS Agreement to take such measures to protect human health as well as animal and plant health, provided that the enforced measures are not disguised protectionism. Second, the increasing income of an importing country and consumer preference may result in a higher demand for product quality, safety, and environment protection. Third, as trade liberalization becomes more complex, it has become more difficult to use traditional trade protectionist measures to protect domestic industries. Thus, TBT have been used (or misused) to substitute for tariffs and other non-tariff barriers to trade.1
Unlike tariffs and other non-tariff barriers (NTBs), TBT can promote trade or restrict trade. TBT promote trade by providing consumers of importing countries with confidence on the quality, safety, and other health related concerns of the imported products. On the other hand, governments of importing countries can use TBT to restrict imports even if the import products are safe and meet the standard imposed. Facing potential examination harassment under TBT, importers and exporters are discouraged to carry out their trade. Given the proliferation of TBT and their theoretical complexity, the OECD (2001) has suggested more empirical research on TBT with a view that quantitative analysis is an important step in the regulatory reform process and can help inform governments in defining more efficient regulations. However, due to their theoretical complexity and data scarcity, TBT have been considered as one of the most difficult NTBs to quantify (Deardorff and Stern, 1997). Some attempts have been made in this direction, but there is still no preferred quantification strategy and consensus on “whether such restrictions tend to reduce trade by virtue of raising compliance costs or expand trade by increasing consumer confidence in the safety and quality of imported goods” (Maskus and Wilson, 2001). Our paper attempts to make a contribution to this research agenda by examining the trade promotion or restriction aspects of TBT adopted by China.
In this study, we analyze how TBT, along with other trade barriers, affect China’s imports during the period between 1998 and 2006. To this end, we first need to construct a database in which we quantify all NTBs, including TBT, import license, and import quota. We use both frequency index and coverage ratio approaches to measure non-tariff barriers. Although the final measures are obtained for all industries defined at the Harmonized System (HS) two-digit level, data on HS four-digit level and even eight-digit level are required to obtain measures for HS2-digit-level industries. We find that most of the TBT-rocked (i.e., the severely affected) product categories are in the agriculture sector.
We then use the extended gravity model to estimate the degrees of the impacts of NTBs on China’s imports. Upon using the frequency index, we find that tariff, TBT, and quota all have a negative impact on China’s imports, but license had a positive impact. The results are different using coverage ratio. Based on the entire period of 1998–2006,
1 As Baldwin (1970) puts it, “The lowering of tariffs has, in effect, been like draining a swamp. The lower water level has revealed all the snags and stumps of non-tariff barriers that still have to be cleared away.” Wallner (1998) considered this phenomenon a “law of constant protection,” referring to perfect substitutability between tariff and none-tariff barriers in maintaining a degree of desired domestic protection.
Xiaohua Bao and Larry D. Qiu Asia-Pacific Journal of Accounting & Economics 17 (2010) 253–280
255
the negative effects of TBT are not statistically significant. Moreover, focusing on 1998–2001 (the pre-WTO period), we find that TBT have a trade promotion effect: a one unit increase in TBT will increase import value by about 0.2%.
The impact of TBT on agriculture and manufacturing goods imports is different. We find that TBT (measured by both frequency index and coverage ratio) are trade reducing for agriculture goods but trade promoting for manufacturing goods.
Our paper contributes to the current literature in a number of ways. First, in contrast to existing empirical studies that focus almost exclusively on TBT of developed countries, this paper analyzes a developing country, that is, China. Second, this paper has a self-constructed non-tariff measures database that is constructed based on highly disaggregated data to produce HS2-product-level non-tariff measures. It also allows us to explore sectoral differences of the TBT impacts. Third, while most studies in the literature rely on cross-section data,2 our paper covers a nine-year time period that allows us to examine also the different impacts of TBT before and after China’s entry into the WTO.
The rest of the paper is organized as follows. In section 2, we review the related literature and further explain the contributions of our paper. In Section 3, we construct a TBT database from 1998-2006 and use the inventory approach (frequency index and coverage ratio) to quantify the stringency of technical measures in China. In section 4, we present our regression model, discuss all the variables, and describe the data. In section 5, we discuss our findings. We present our concluding remarks in section 6. The main findings are reported in Table 5 and Table 6.
2. Related Literature Review
Beghin and Bureau (2001), Ferrantino (2006) and Korinek, Melatos and Rau (2008), Maskus, Otsuki, and Wilson (2001), and Maskus and Wilson (2001) all provide comprehensive reviews on key economic issues related to TBT modeling and measurement. Quantification techniques can be broadly grouped into two categories: ex post approach and ex ante approach. The ex ante approach includes simulations with the calculation of tariff equivalents and is usually employed to predict unobserved welfare impact. On the other hand, the ex post approach includes gravity-based econometric models used to estimate the observed trade impacts of TBT. Both approaches have their respective advantages and drawbacks depending on the nature of the specific TBT, availability of data, and objective of the measurement, among others (Popper, et al., 2004).
As our paper uses the ex post approach, we focus our discussion on studies that used the ex post approach. Although a unified methodology does not exist for examining the trade effects of TBT, the most commonly used methodology is the gravity model. To employ the gravity model, the TBT should first be measured or quantified. Beghin and
2 There are a few exceptions: Moenius (2004, 2006) tried to determine the impact of standard using a 10-year panel that includes frequency data on standards. Metha and Nambiar (2005) accounted for the changing maximum residue levels for only four years. Cao and Johnson (2006) examined the effect of HACCP (denoted by a dummy variable) implemented in New Zealand for nine years.
Xiaohua Bao and Larry D. Qiu Asia-Pacific Journal of Accounting & Economics 17 (2010) 253–280
256
Bureau (2001) summarize three sources of information that could be used to assess the importance of domestic regulations as trade barriers: data on regulations, such as the number of regulations and number of pages in the regulations; data on frequency of detentions, including the number of restrictions, frequency index, and import coverage ratio; and data on complaints from the industry against discriminatory regulatory practices and notifications to international bodies about such practices.
Swann, Temple, and Shurmer (1996) use counts of voluntary national and international standards recognized by the UK and Germany as indicators of standard over the period of 1985–1991. They find that shared standards influence exports positively but have little influence on imports; unilateral standards have positive influence on imports but have negative influence on exports. Moenius (2004, 2006) examines the trade effects of country-specific and bilaterally shared standards over the period of1985–1995. Both papers used the counts of binding standards in a given industry as a measure of stringency of standards. In particular, Moenius (2004) focuses on 12 OECD countries and finds that at the aggregate level, bilaterally shared and country-specific standards implemented by the importing or exporting countries are both trade promoting on average; at the industry level, however, the importer-specific standards have a negative trade effect on non-manufacturing sectors. Moenius (2006) confirms that bilateral standards in the European Union (EU) have very strong trade promotion effects on the trade between EU and non-EU members, but harmonization decreases the internal trade within EU.
Fontagné, Mimouni, and Pasteels (2005) and Disdier, Fontagné, and Mimouni (2008) use a frequency index based on notification directly extracted from the TRAINS database. Fontagné, Mimouni, and Pasteels (2005) collect data on 61 product groups, including agri-food products, in 2001. Their paper generalized the findings of Moenius (2004) and indicated that non-tariff measures, including standards, have a negative impact on agri-food trade but have an insignificant or even positive impact on the majority of manufactured products. Based on data covering 61 exporting countries and 114 importing countries, they find that over the entire product range, least developed countries (LDCs), developing countries, and OECD countries seem to be similarly affected. However, OECD agri-food exporters tend to benefit from non-tariff measures at the expense of exporters from other developing countries and LDCs.
Disdier, Fontagné, and Mimouni (2008) estimate the trade effect of standards and other non-tariff measures on 690 agri-food products (HS6-digit level). Their data cover the bilateral trade between the OECD as importing countries and 114 others as exporting countries in 2004. When they consider different groups of exporting countries, they show that OECD exporters are not significantly affected by TBT in their exports to other OECD countries, whereas the exports of developing ocuntries and LDCs are negatively and significantly affected.
A number of studies are supportive of the use of maximum residue levels to measure directly the severity of food safety standards within a gravity model. These studies include Otsuki, Wilson, and Sewadeh (2001a and 2001b), Wilson and Otsuki (2004b and 2004c), Wilson, Otsuki, and Majumdsar (2003), Lacovone (2003), and Metha and Nambiar (2005). These studies tend to focus on specific types of standards for specific products and countries. For example, Otsuki, Wilson, and Sewadeh (2001a and 2001b)
Xiaohua Bao and Larry D. Qiu Asia-Pacific Journal of Accounting & Economics 17 (2010) 253–280
257
and Wilson and Otsuki (2004b) examine the trade effect of aflatoxin standards in groundnuts and other agricultural products (e.g., vegetables, fruits, and cereals) adopted by many importing countries. Lacovone (2003) focuses on the effects of European aflatoxin standards on imports from Latin America. Wilson, Otsuki, and Majumdsar (2003) analyze the effects of standards for tetracycline residues on beef trade. Wilson and Otsuki (2004c) study the effects on chlorpyrifos exports. By and large, these studies indicate that imports are reduced when the importing countries impose more stringent standards on foreign products (trade restricting).
The literature review clearly indicates that our study is not only related to those studies but also makes a unique contribution. Our study focuses on a single large developing country (China) for a long period of time, and it distinguishes the development levels of exporting countries. Moreover, our study examines sectoral differences of TBT and considers and compares the pre-WTO and post-WTO period. Some of the above-mentioned studies have some of these features, but our paper is the only one that includes all these aspects into one study.
3. Quantification of TBT and China’s TBT
In this section, we first describe the two methods of quantifying TBT to be used in this study and then apply them to China to obtain our database of China’s TBT and other NTBs, namely, import license and quota.
3.1 Quantification of TBT
Bora, et al. (2002) review various approaches to quantify non-tariff measures. We adopt two of these approaches in our study, namely, coverage ratio and frequency index. The coverage ratio captures the extent of trade covered by TBT. Specifically, the coverage ratio of TBT in China for product category j in a particular year is the percentage of import values by China in product category j that is affected by China’s TBT in that year:
CRj =DiVii∑Vii∑
(1)
where i is a product item contained in product category j. If TBT is applied to product i, the dummy variable Di takes the value of one and zero otherwise. Vi is the value of product i’s imports by China. Thus, the coverage ratio of product category j is higher if more of its products are subject to TBT scrutiny and/or the products under TBT have larger import values.
However, there is a problem associated with the coverage ratio: the endogeneity of the weights in import value. At the extreme, if TBT is so restrictive in product i, it will preclude all imports of product i, and consequently the weight Vi will be zero. Thus, the coverage ratio is downward biased. One way to solve this problem is to use the
Xiaohua Bao and Larry D. Qiu Asia-Pacific Journal of Accounting & Economics 17 (2010) 253–280
258
counterfactual free trade weights, but it is not available to us. Alternatively, we also use another approach in our study, the frequency index, which does not suffer from this problem.
The frequency index considers only the presence or absence of TBT in a product without indicating the value of the imports covered. It shows the percentage of import transactions affected by TBT. Specifically, the frequency index of TBT in China for product category j in a particular year is the percentage of import products by China in product category j affected by China’s TBT in that year:
FIj =Di Mii∑
Mii∑ (2)
where i is a product item contained in product category j. If TBT is applied to product i, the dummy variable Di takes the value of one and zero otherwise. Mi is a dummy variable equal to one if there is import of product i and zero otherwise. Unlike the coverage index, however, the frequency index does not reflect the relative value of the affected products and thus cannot provide any indication of the relative importance of the TBT among all product items in product category j.
The frequency index measures the number of product items subject to TBT as a percentage of the total number of product items in a product category, whereas the coverage ratio measures the value of imports of TBT-affected product items as a percentage of total imports of a product category. In the former case, the occurrence of TBT is not weighted by the import value, whereas in the latter case, it is. As both measures have their respective advantages and disadvantages, we use both in our study below.
Formulas (1) and (2) describe two distinct approaches in quantifying TBT. The same measures can be used to quantify other types of NTBs, such as import license and quota.
3.2 China’s NTB database: Data description and methodology
Based on the inventory approach discussed above, we construct a Chinese NTB database that covers 96 agricultural and manufacturing products at the HS2-digit level from 1998-2006.3 To obtain the import coverage ratio of each HS2 product, we calculate the frequency index at HS4-digit level and aggregate them. Data on Chinese tariffs and NTBs (i.e., TBT, license, and import quota) are mainly from the Administrative Measures Regarding Import & Export Trade of the People’s Republic of China (Ministry of Commerce and Custom General Administration of China), which provides detailed information at the HS8-digit level on tariff and non-tariff measures.
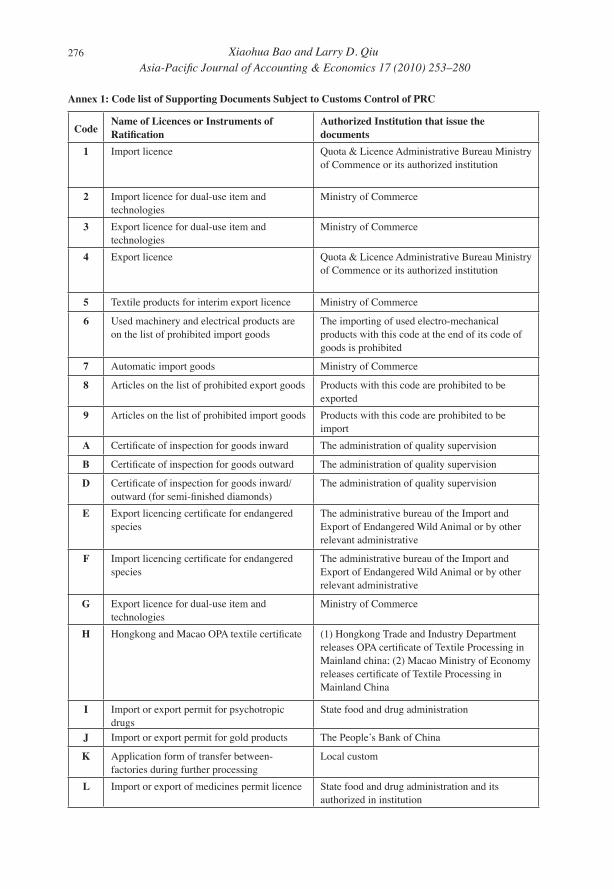
Every year, the Chinese government provides a code list of supporting documents subject to customs control, based on which we identify the tariff line products subject to NTBs. Within those NTBs, the technical measures include government administrative
3 TBT data was first available in China in 1998.
Xiaohua Bao and Larry D. Qiu Asia-Pacific Journal of Accounting & Economics 17 (2010) 253–280
259
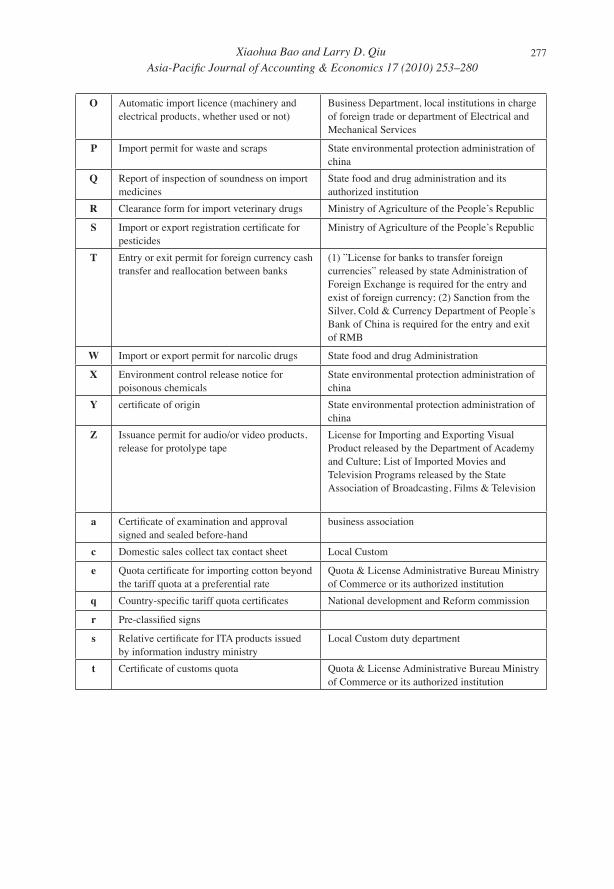
measures for environmental protection, safety, national security, and consumer interests. The codes slightly change over the years, undergoing a major revision in 2002. In Annex 1, we provide a code list for 2002-2006 as an example. The code subject to TBT control remains almost the same during 1998-2001.
Specifically, the frequency index of TBT (FI-TBT) measures the proportion of product items (e.g., HS8) covered by TBT within a product category (e.g., HS4), which varies between 0 (no coverage) and 100% (all product items are covered). First, for every HS4 product category, we count the number of HS8 product items (of the corresponding HS4 product category) covered by TBT and divide it by the total number of product items belonging to the HS4 product category. This gives us the frequency ratios of TBT at the HS4-digit level. For example, regarding HS2402 (i.e., cigars, cheroots, cigarillos, and cigarettes of tobacco or of tobacco substitutes), there are three product items [i.e., HS24021000 (cigars, cheroots, and cigarillos containing tobacco), HS24022000 (cigarettes containing tobacco), and HS24029000 (other)], with only one of them (i.e., HS24022000) covered by TBT. Hence, the corresponding FI-TBT is equal to 33.33% (1/3). We apply the same method to obtain FI-TBT for HS2 products.
On the other hand, the import coverage ratio of TBT (CR-TBT) measures the proportion of TBT-affected import within a product category. Let us take HS17 (i.e., sugars and sugar confectionery) for example. It has four product items, HS1701, HS1702, HS1703, and HS1704, with a total import value of USD182.244 million. Three product items (except for HS1703) are covered by TBT, with a total import value of USD111.216 million. Hence, the CR-TBT of HS17 is equal to 66.46% (=111.216/182.244). However, the FI-TBT of HS17 is equal to 75% (=3/4).
Similarly, we also calculate the frequency index of license (FI-L), import coverage ratio of license (CR-L), frequency index of quota (FI-Q), and import coverage ratio of quota (CR-Q).
3.3. TBT-rocked products in China
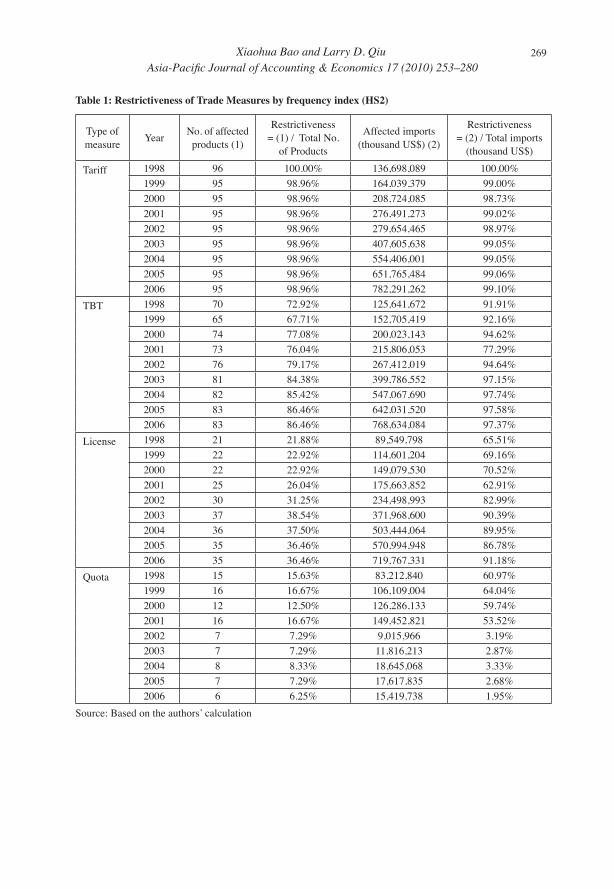
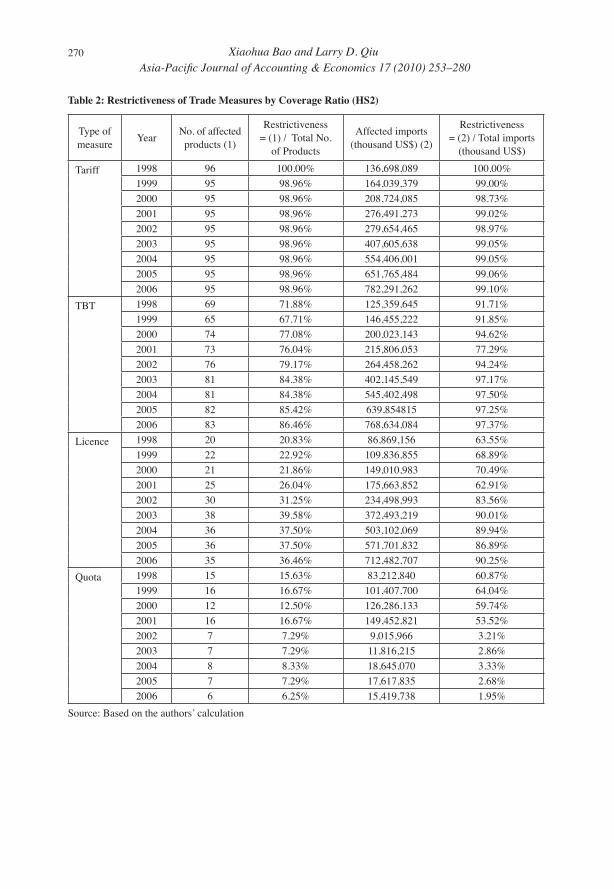
Tables 1 and 2 provide information on all products affected by trade measures (i.e., tariffs and non-tariff measures). Around 80% of imported product lines (FI) and more than 90% of import value (CR), except in 2001 (77.29%), in China are subject to TBT. However, different products are affected differently.
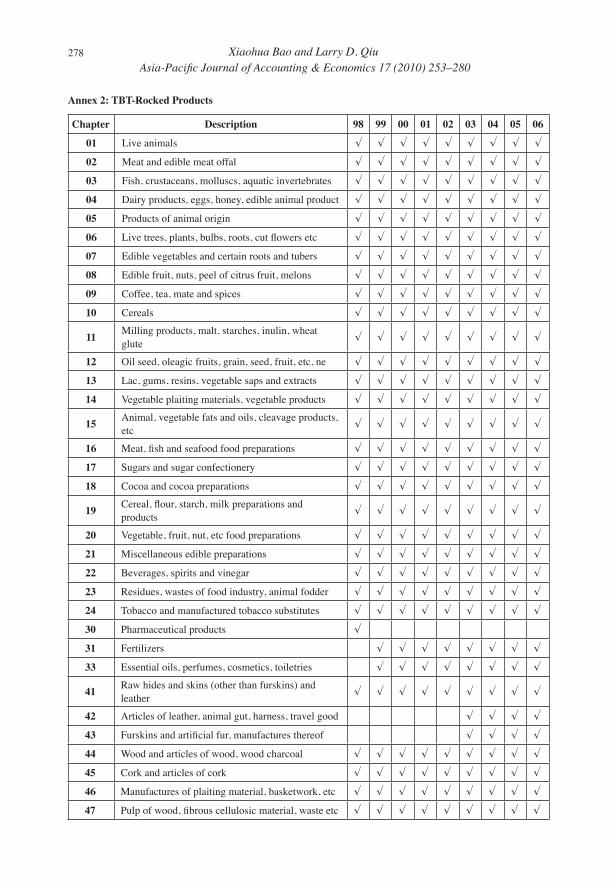
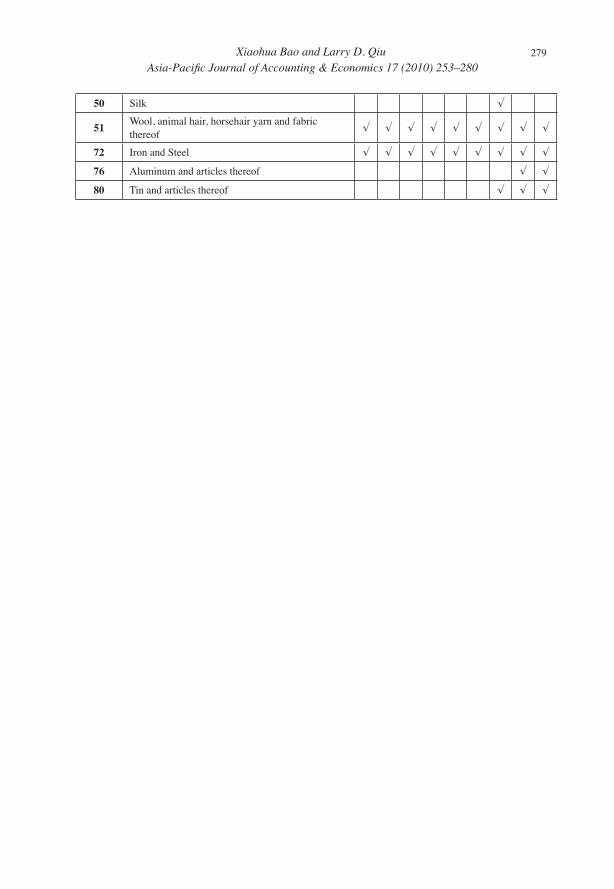
By calculating the frequency index and/or import CR-TBT, we can examine which products are more seriously affected. According to the definition of UNCTAD (1997), those with a frequency and coverage ratio both above 50% are called TBT-rocked products. In Annex 2, we provide a list of TBT-rocked products in China. There are 31 products that are TBT rocked in every single year from 1998-2006, both years inclusive. Eight other products are TBT-rocked in some of the years during the same period. Most of the TBT-rocked products, especially those rocked in the entire period, are agricultural products and processed foods (i.e., HS01 to HS24). Indeed, all HS2-digit level agriculture products and processed foods are TBT rocked.
As there are a total of 96 products at the HS2-digit level, these TBT-rocked products account for about 1/3 (=31/96) of all products. The total import value of these TBT-
Xiaohua Bao and Larry D. Qiu Asia-Pacific Journal of Accounting & Economics 17 (2010) 253–280
260
rocked products as the share of China’s total import value of all products ranges from 10-16%.
4. Model, methodology and data
Following the literature, we use the gravity model to study a country’s trade. In particular, we introduce our constructed TBT variable to examine how TBT in China influences the country’s import. As in most gravity models, we include GDP, distance, and common language as independent variables. GDP captures the effect of the country’s size. We use the real GDP of an exporting country to proxy its supply capacity and the real GDP of an importing country to proxy its demand capacity.4 The bilateral distance between the importing and exporting countries captures the transportation costs. Common language is often conducive to bilateral trade because it results in easy communication and captures culture proximity. Aside from the usual gravity model variables, we also introduce our key variables, tariff and non-tariff trade measures, including our TBT variables.
Our basic regression model takes the following form:
log IMjtk = 0 + 1 logGDPt + 2 logGDPjt + 3 log Distj + 4 Contigj
+ 5Comlangj + 6 logTarifftk + 7 TBTt
k + 8 Ltk + 9 Qt
k + , (3)
where the variables are defined as follows:IM jt
k is the value of China’s import of product k from country j in year t;GDPt and
GDPjt are China’s and country j’s real GDP in year t, respectively;
Distj is the geographical distance between China and country j;Contigj is the dummy variable indicating whether China and country j are contiguous;Comlangj
is the dummy variable indicating whether China and country j share a common language;Tarifft
k is China’s average preferential tariff applied to product k in year t;
TBTtk is the frequency index or import coverage ratio of China’s TBT applied to product
k in year t;Lt
k is the frequency index or import coverage ratio of China’s import license applied to product k in year t; andQt
k is the frequency index or import coverage ratio of China’s import quota applied to product k in year t.
We also include other variables to examine their impacts and check for robustness of
the results from the basic model. These variables include Developing (dummy indicating the exporting country is a developing country) and Agriculture (dummy indicating the
4 Real GDP data are taken directly from the US Department of Agriculture database. We also tried to use nominal GDP, with no change in the qualitative results.
Xiaohua Bao and Larry D. Qiu Asia-Pacific Journal of Accounting & Economics 17 (2010) 253–280
261
product k is a agricultural product). China entered the WTO in 2002. We also want to see if there is any systematic difference between the effects of trade measures before and after China’s entry into the WTO.
In our sample, China is the only importing country, whereas there are 43 exporting countries/economies, including Burma (Myanmar), Hong Kong, India, Indonesia, Iran, Japan, Macau, Malaysia, Pakistan, Philippines, Kazakhstan, Saudi Arabia, Singapore, Korea, Thailand, Turkey, Vietnam, United Arab Emirates, Taiwan, South Africa, Belgium, Denmark, UK, Germany, France, Italy, Netherland, Spain, Austria, Finland, Romania, Sweden, Switzerland, Russian Federation, Ukraine, Argentina, Brazil, Chile, Canada, US, Australia, New Zealand, and the EU. The time span covers 1998-2006. With these 43 exporters and nine years at HS2-digit level products, we have a panel of about 37,000 observations. When running the regression based on (3), we also include the year dummy to control for the time fixed effect.
China’s import values from the 43 individual exporters are gathered from China Custom Statistic Year Book. Each country’s GDP (in billion US dollars in 2005) are obtained from the US Department of Agriculture Economic Research Services International Macroeconomic Data Set. Data for the geographical distance are collected based on the average distance between the capitals of the two countries and the distances as well as the data of Comlang and Contig, which are all extracted from the Centre d’Etudes Prospectives et d’Informations Internationales in France database.
5. Empirical Results
5.1. All products
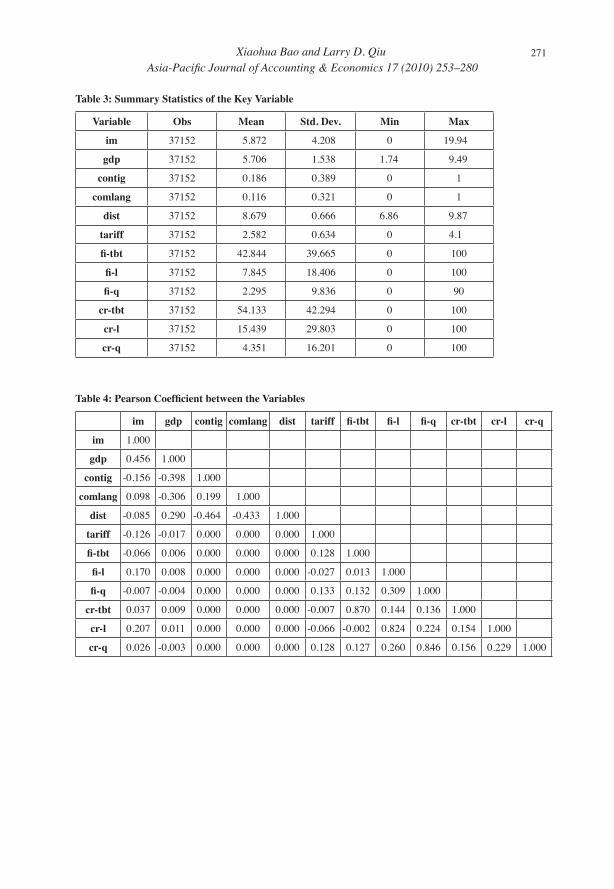
Table 3 shows the summary statistics of the key variables. Table 4 reports the Pearson coefficients of the trade control measure variables and other variables. FI-L, CR-TBT, and CR-L have a negative correlation with tariff. All other import control policies are positively correlated with each other. In general, different kinds of import control measures in China seem to be complementary to each other. Among these measures, import license and import quota have the highest positive coefficient, which is in accordance with fact that these two measures are sometimes combined together in use. Normally, a country will distribute import quotas to import license holders. TBT, import license and quota measured by frequency index and coverage ratio are highly correlated with the Pearson coefficient all above 0.8, which proves that frequency index and coverage ratio are alternative measures to quantify the non-tariff barriers.
China has zero import in many products from many countries. Accordingly, we use Tobit estimation to deal with the censorship problem because of the many zero import observations5. We first run the regressions based on the whole sample period and then on 1998-2001 and 2002-2006 sub-periods respectively to capture the possible structural changes due to China’s accession to the WTO. In all regressions, we control for the year fixed effect.
5 Among the 37,152 observations, 7,529 observations have zero trade and account for about 20% of the whole sample.
Xiaohua Bao and Larry D. Qiu Asia-Pacific Journal of Accounting & Economics 17 (2010) 253–280
262
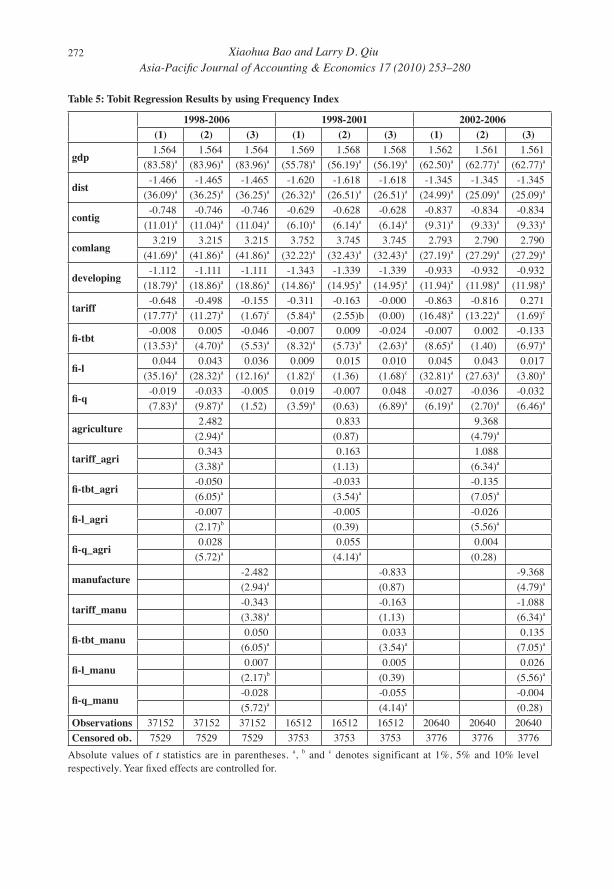
Regression results based on all HS2 products are reported in Table 5 for the frequency ratio and in Table 6 for the coverage ratio. Column 1 of Table 5 for the period 1998-2006 shows the results from the basic model (3). All estimates are statistically significant. Most of the explanatory variables in the standard gravity model have the expected signs. The GDP of an exporting country has a positive effect on China’s import (1% increase in the exporting country’s GDP raises China’s imports from that country by 1.564%). The distance between exporting country and China has negative effects on trade between the two countries (1% increase in distance reduces China’s imports from that country by 1.466%). Countries/economies sharing the same language with China have more exports to China (with a 3.219% difference); however, sharing the same border reduces export to China (by 74.8%). This result can be understood by realizing that the most important exporting countries, such as the US, Japan, and EU members, are not contiguous with the Chinese mainland. And DCs generally have less export to China than developed countries.
Turning to the impacts of trade measures, we note that tariff, TBT, and quota have negative impacts on China’s imports. A 1% increase in the MFN tariff will decrease import value by about 0.648%. A 1 unit increase in TBT will decrease import value by about 0.8%. A 1 unit increase in quota will decrease import value by 1.9%. However, import license has a positive impact. A 1 unit increase in license will increase import value by 4.4%. This surprising result can be explained partly by the positive correlation between license and quota (see Table 4). The trade restriction effects of license have been captured by quota. The key result from this regression is that when measured in frequency index, TBT has net trade reducing effects.6
China entered the WTO in 2002. To determine whether there are any systematic changes in the effects of China’s trade measures on its imports after the WTO accession, we run separate regressions for two time periods, 1998-2001 and 2002-2006. By comparing the results from these two periods in column 1 of Table 5, we observe one important difference: import quota has positive effects on China’s trade in the pre-WTO period but has negative effects in the post-WTO period.7 However, it is worth pointing out that the TBT effects on trade are not different before and after entry to WTO.
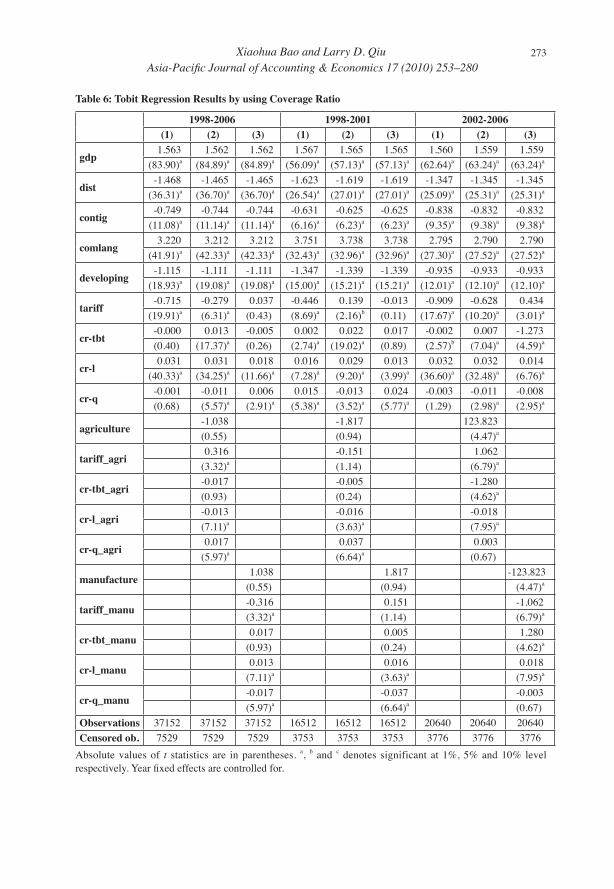
We also run the same regressions using coverage ratios of NTBs. The results are reported in column 1 of Table 6. While most of the estimates have the same sign in Table 6 as their counterparts in Table 5, we observe one important difference in our key variable, TBT. Running the regression on the entire period, we obtain a negative
6 As suggested by Chris Milner, we also try to drop other trade policy variables (i.e., tariff, license, and quota) from the regression to allow TBT to capture all policy impacts on imports. It is not surprising that in this case, the negative impact of TBT becomes stronger: -0.010 (as opposed to -0.008 in Table 5) for the whole sample period, -0.007 (same in Table 5) for the pre-WTO period, and -0.013 (as opposed to -0.007 in Table 5) for the post-WTO period. However, our regression (including tariffs and other NTBs) allows TBT to capture its net effect.
7 This may be due to the fact that quota has stronger negative effects on agriculture goods imports and China had more agriculture products subject to quota after its WTO entry. Note that although the number of quota-affected products declined after the WTO accession (see Table 1), the quota-affected agriculture products increased. Before 2002, there were only one to two agriculture products covered by the quota (i.e., HS 17 and HS24), but after 2002, there were three to four agricultural products covered by the quota (i.e., HS10, HS11, HS15, and HS17).
Xiaohua Bao and Larry D. Qiu Asia-Pacific Journal of Accounting & Economics 17 (2010) 253–280
263
estimate that is statistically insignificant. However, in running the regressions on the two sub-periods, we obtain significant estimates with opposite signs: positive in 1998-2001 and negative in 2002-2006. The CR-TBT has trade promotion effects on China’s imports in 1998-2001 but has trade restriction effects in 2002-2006.
5.2. Agriculture products vs. manufacturing products
Trade barriers, especially TBT, may have different impacts on a country’s imports depending on the nature of the products. To observe this, we interact the individual terms of trade measures with the product classification dummy at the HS2-digit level: agriculture (indicating that product k belongs to the agricultural products: HS01-24) or manufacture (indicating that product k belongs to the manufacturing products: HS25-97). Note that the products in the first product group are all TBT-rocked products, whereas only part of the products in the second group is TBT rocked. Column 2 (column 3) of Table 5 reports the results after adding the agriculture (manufacture) dummy and the dummy’s interaction with each of the trade control measures in terms of frequency index. The estimating results for coverage ratio are reported in columns 2 and 3 of Tables 6.
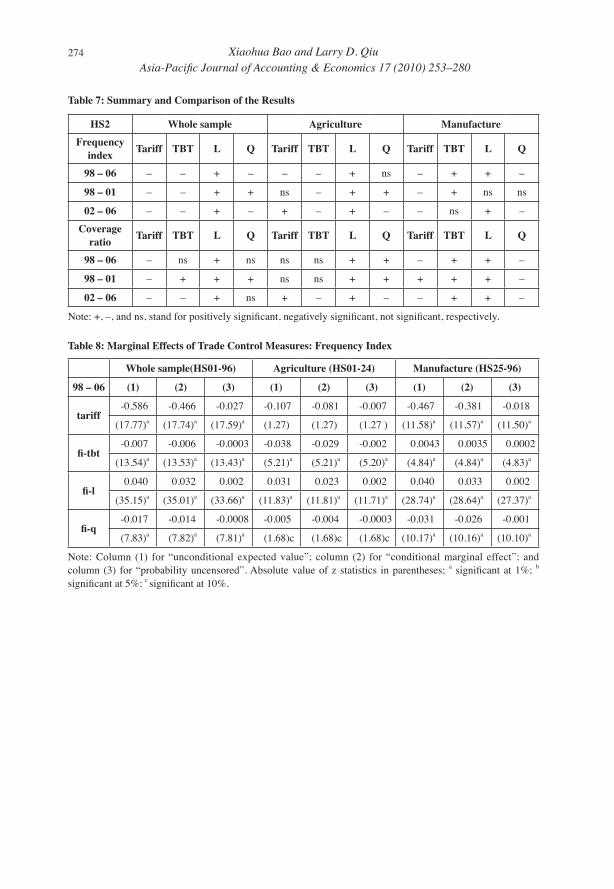
Based on Tables 5 and 6, we summarize the key results in Table 7. Since the standard gravity model variables (GDP, Contig, Dist, Comlang) show the same pattern in Table 5 and 6, we only focus on the trade control measures. Notice that to obtain some general conclusions, there are three-dimensional comparisons to be made with a focus on the impacts of trade measures. Let us take FI-TBT in agriculture products for example. We compare its impacts on China’s import to those obtained from the all products, those obtained from agricultural products but with CR-TBT, and those from manufacturing products with FI-TBT. In all the comparisons, our discussion focuses on their differences rather than similarities.
We first compare columns 1 and 3 of Table 5. We find that tariff has the expected negative and significant impacts on imports in column 1, but the impact is statistically positive in column 3 for the period 2002-2006. This finding indicates that agriculture product imports are more responsive to changes in non-tariff measures than tariffs. Despite these differences, we do not find any qualitative differences between the TBT effects in columns 1 and 3 of Table 5, even for the two sub-periods. Hence, FI-TBT has negative and significant impacts on China’s imports for all products and for agriculture products during the pre-WTO and the post-WTO periods.
Second, we compare the effects of frequency index non-tariff measures and coverage ratio non-tariff measures for agricultural products in column 3 of Tables 5 and 6. Tariff has significant negative impacts for the entire period, but has significant positive impacts in the post-WTO period. This result is unexpected because it does not make economic sense. One explanation is that the large negative impacts on agricultural product imports have been taken up by the CR-TBT. This is shown in the CR-TBT effect in the post-WTO period , which is -1.273 in Table 6, compared with the FI-TBT effect, which is -0.133 in Table 5. Therefore, we tend to think the difference is due to measurement differences. Another possible explanation may be the fact that the positive tariff effect for agricultural products from developed countries in the post-WTO period dominates
Xiaohua Bao and Larry D. Qiu Asia-Pacific Journal of Accounting & Economics 17 (2010) 253–280
264
the tariff effect during the whole sample period. It is not surprising because China cut down on the tariff for agricultural products after accession to the WTO; thus, developed countries can still export despite the tariff if their agriculture products are competitive enough.
Quota has different impacts depending on its measurement type for the whole period. As shown in Table 6, coverage ratio quota has positive and significant impacts on imports, whereas frequency index quota has negative (but insignificant) impacts on imports in Table 5. The two types of measures have qualitatively similar effects: positive in 1998-2001 and negative in 2002-2006. The main reason for the difference during the whole period is the much stronger negative impacts of frequency index quota, which is -0.032 in Table 5, than the coverage ratio quota, which is -0.008 in Table 6.
More importantly, CR-TBT’s negative impacts on imports are insignificant (see column 3 of period 1998-2006 in Table 6). This is affected by the positive (insignificant) impacts of CR-TBT in the period 1998-2001. The same difference between FI-TBT and CR-TBT has been identified from the all-product regression. Thus, agricultural products retain the same pattern, or perhaps the pattern from agricultural products dominates in all products.
Third, the impacts of FI-TBT in agricultural products are compared with those in manufacturing products. Based on the results in columns 2 and 3 in Table 5, it is interesting to find that the FI-TBT has contradictory impacts on agricultural and manufacturing imports. Although TBT has negative and significant impacts on agricultural imports, it has positive and significant impacts on manufacturing imports. Thus, FI-TBT is trade restricting for agriculture goods but is trade promoting for manufacturing goods. This property appears in both the pre-WTO and the post-WTO period. We do not find this difference surprising because TBT is more likely to have a trade promotion effect for products that consumers lack information about the quality of the imports, and manufacturing products suffer from more such informational asymmetry problem than agriculture products.8
Finally, we compare the impacts of coverage ratio non-tariff trade measures on agricultural (column 3 of Table 6) and on manufacturing imports (column 2 of Table 6). The interesting result with regard to TBT obtained for the FI-TBT above also holds: CR-TBT is trade reducing for agriculture goods but is trade promoting for manufacturing goods. This can be observed from the negative (insignificant) estimate for the whole period for agriculture products, which is -0.005 in column 3, and the positive (significant) estimate for the whole period for manufacturing products, which is 0.013 in column 2. This difference is much clearer and stronger for the post-WTO period: -1.273 (significant) for agricultural goods and 0.007 (significant) for manufacturing goods.
8 Our result is consistent with that of Moenius (2004) on standards. He explains his results using the transaction cost argument based on incomplete information: although standards impose high compliance costs, standards lower information costs on trade partners. As agri-food products are relatively homogeneous, information requirements are comparatively low. Hence, lower information costs arising from importer standards are unlikely to be sufficient to compensate producers for compliance costs. Therefore, TBT tends to negatively impact agri-food trade. However, manufacturing industries are more technologically sophisticated. If the costs of adapting products to foreign markets are small relative to information costs, a positive effect might occur.
Xiaohua Bao and Larry D. Qiu Asia-Pacific Journal of Accounting & Economics 17 (2010) 253–280
265
The impacts of tariff and other non-tariff measures on the two groups of imports are also different. For agricultural goods imports, tariff has positive (insignificant) impacts and coverage ratio quota has positive (significant) impacts; in contrast, for manufacturing goods imports, their impacts are both negative and significant. The impacts of coverage ratio license for both agricultural and manufacturing goods are qualitatively the same.
5.3. Marginal effects of trade measures
From a pure economic point of view, the estimated raw coefficients reported in Tables 5 and 6 are simply the effects of the independent variables on the “latent” variable underlying the Tobit model. In particular, we examine how China’s trade measures affect imports of a product from a foreign country given that the product is imported to China from that foreign country. However, analyzing the marginal effects of the trade measures is also important, that is, the effects on the margin. Following Alberto (2006), we calculate three types of marginal effects based on the basic gravity model (3). First, the “unconditional expected value” provides a marginal effect of a one-unit change in a trade measure on the unconditional expected value of trade flow. It estimates the overall impacts of the trade measure, considering that there is zero trade for some products from some exporting countries. Second, the “conditional marginal effect” picks up the marginal effect on the expected value of trade flow conditional on being uncensored. It captures the impact of the trade measure on the positive trade volume, that is, the trade already taking place. Third, the “probability uncensored” measures the marginal effect on the probability of being uncensored. It estimates the impact of trade measure on the probability of observing positive trade.
Table 8 shows the marginal effects of trade measures during the whole sample period using frequency index. Based on the whole product sample results, a 1% increase in tariff will result in about 0.586% decrease in import value. This includes about a 0.466% decrease of the positive trade volume and a 0.12 (= 0.586-0.466) % decrease of potential trade as well. This potential loss is caused by the tariff decreasing the probability of foreign countries in accessing China’s import market by 2.7%. Tariff does not have significant restrictive impacts on agricultural products. As for manufacturing products, a 1% increase in tariff will result in about 0.467% decrease in import value, which includes about 0.381% decrease of the positive trade volume and 0.086 (= 0.467-0.381)% decrease of potential trade as well due to the lower probability of exporting to the Chinese market for some products by some foreign countries.
Turning to the frequency index non-tariff measures, license has positive impacts, whereas quota has negative impacts, all of which are statistically significant. If the FI-L increases by 1%, our imports will increase by 4% due to a 3.2% increase in the trade value from the existing import products and some new products, which become available because of the increased probability of market access (0.2%). Similar changes can be observed for both agricultural and manufacturing goods.
In contrast, if the FI-Q increases by 1%, import will decrease by 1.7% on average, which includes a decrease of the positive trade (1.4%) and a decrease of the potential
Xiaohua Bao and Larry D. Qiu Asia-Pacific Journal of Accounting & Economics 17 (2010) 253–280
266
trade. Similar changes can also be observed for both agricultural and manufacturing goods.
Let us next turn to the TBT effects. For all products, a 1% increase in the FI-TBT will decrease imports by 0.7%, which includes a 0.6% decrease in the imports of existing products and a decrease in the potential imports due to the falling probability of market access. These trade-reducing impacts of FI-TBT are also observed for agricultural imports. However, trade promoting impacts are observed for manufacturing imports. A 1% increase in the FI-TBT will increase imports by 0.43%, which includes a 0.35% increase in the imports of existing products and an increase in the potential imports due to the higher probability of market access.
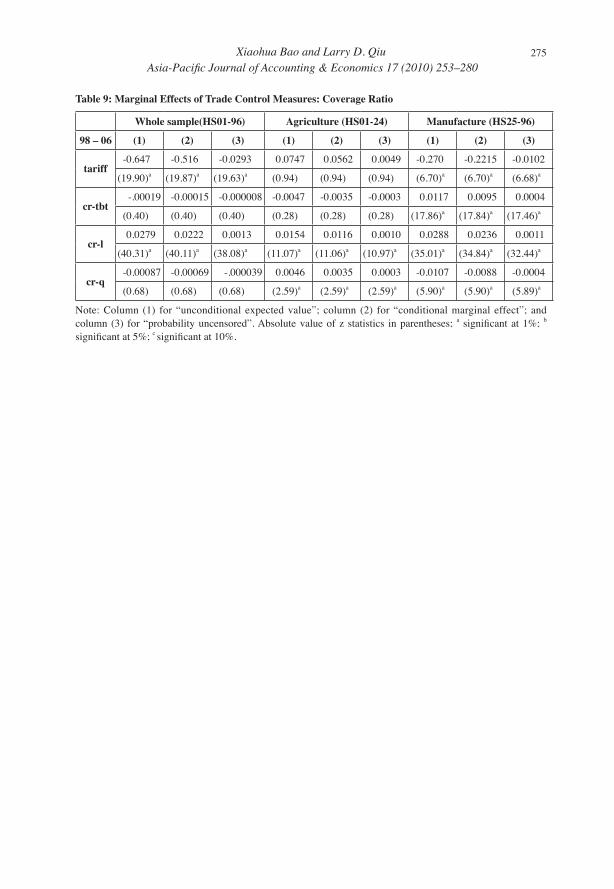
Finally, Table 9 shows the marginal effects of trade measures during the whole sample period using coverage ratio. Focusing on the TBT effects, we observe that TBT has negative effects on agriculture imports, but the effects are not statistically significant. However, TBT has significant trade promoting effects on manufacturing products. A 1% increase in the coverage ratio TBT will increase manufacturing products imports by 1.17%, which includes a 0.95% increase in the imports of existing products and a 0.04% increase in the potential imports due to the increased probability of market access.
6. Conclusion
This paper contributes to the literature of empirical studies on TBT effects on imports. In particular, we analyze how TBT, together with other trade barriers, affect China’s imports during 1998 and 2006. We use both frequency index and coverage ratio approaches to measure TBT. When using the frequency index, we find that TBT has a negative impact on China’s imports. The results are different when coverage ratio is used. Based on the entire period of 1998-2006, the negative effects of TBT are not statistically significant. Focusing on the period 1998-2001 (the pre-WTO period), we find the TBT has trade promotion effect. The impacts of TBT on agricultural and manufacturing goods imports are different. We find that TBT (measured by both frequency index and coverage ratio) are trade reducing for agricultural goods but are trade promoting for manufacturing goods.
TBT become more influential when traditional trade barriers, both tariff and non-tariff, are phased out gradually through multilateral negotiations. However, concluding whether TBT in general promote or restrict trade is still premature. The literature, including the present study, has reached different conclusions depending on the type of country,9 the type of industry, and time periods. Further studies on this area are encouraged to reach general conclusions, which are important and necessary for policy designs.
9 We have also run regressions using China’s import from developing countries and developed countries separately. We find some different effects of China’s TBT on the exports by these two groups of countries to China.
Xiaohua Bao and Larry D. Qiu Asia-Pacific Journal of Accounting & Economics 17 (2010) 253–280
267
References
Abbott, Frederick L., 1997, “The Intersection of Law and Trade in the WTO System:Economics and the Transition to a Hard Law System”, in: David Orden and Donna Roberts, eds., Understanding Technical Barriers to Agricultural Trade (St. Paul: Minnesota).
Baldwin, Richard, 2000, “Regulatory Protectionism, Developing Nations and a Two-Tier World Trade System”, CEPR Discussion Paper No.2574.
Beghin, John C. and Jean-Christophe Bureau., 2001, “Quantification of Sanitary, Phytosanitary, and Technical Barriers to Trade for Trade Policy Analysis”, Center for Agricultural and Rural Development, Working Paper 01-WP 291.
Bora, Bijit Aki Kuwahara and Sam Laird, 2002, “Quantification of Non-tariff Barriers”, United Nations Conference of Trade and Development, Policy Issues in International Trade and Commodities, Study Series No.18.
Cao, K. and R. Johnson, 2006, “Impacts of mandatory meat hygiene regulations on the New Zealand meat trade”, Australasian Agribusiness Review 14, paper 3.
Cipollina, M. and L. Salvatici, 2006, “Measuring protection: mission impossible?” Trade AG, Working Paper No.06/07.
Deardorff, Alan V. and Robert Stern., 1998, “The Measurement of Non-Tariff Barriers”, OECD Economics Department, Working Paper No.179.
Disdier, Anne-Celia., Lionel Fontagne, Mondher Mimouni, 2008, “The Impact of Regulations on Agricultural Trade: Evidence from the SPS and TBT Agreements”, American Journal of Agricultural Economics 90(2), 336-350.
Ferrantino, Michael., 2006, “Quantifying the Trade and Economic Effects of Non-Tariff Measures”, OECD Trade Policy Working Papers, No. 28, Paris: OECD.
Jayasuriya, S., D. MacLaren, and R. Metha., 2006, “Meeting Food Safety Standards in Export Markets: Issues and Challenges facing Firms Exporting from DevelopingCountries”, Paper presented at the IATRC Summer Symposium, Food Regulation and Trade: Institutional Framework, Concepts of Analysis and Empirical Evidence, Bonn, Germany, 28-30 May 2006.
Korinek, Jane, Mark Melatos and Marie-Luise Rau, 2008, “A Review of Methods for Quantifying the Trade Effects of Standards in The Agri-food Sector”, OECD Trade Policy Working Paper No. 79.
Lacovone, L., 2003, “Analysis and Impact of Sanitary and Phytosanitary Measures”, Available at http://www.cid.harvard.edu/cidtrade/Papers/iacovone.pdf.
Maskus, K.E. and John S. Wilson, 2000, “Quantifying the Impact of Technical Barriers to Trade: A Review of Past Attempts and the New Policy Context”, Paper prepared for the World Bank Workshop on “Quantifying the Trade Effects of Standard and Technical Barriers: Is it Possible?” World Bank, 2000.
Metha, R. and R.G. Nambiar, 2005, “International food safety standards and processed food exports: India”, report within project “International food safety standards and processed food exports from developing countries: a comparative study of India and Thailand”, The Australian National University, unpublished.
Moenius, J., 2004, “Information versus product adaptation: The role of standards in trade”, Kellogg School of Management Working Paper, Northwestern University.
Xiaohua Bao and Larry D. Qiu Asia-Pacific Journal of Accounting & Economics 17 (2010) 253–280
268
Moenius, J., 2006, “The Good, the Bad and the Ambiguous: Standards and Trade in Agricultural Products”, IATRC Summer Symposium, May 28-30, Bonn, Germany.
OECD, 2001, Measurement of sanitary, phytosanitary and technical barriers to trade, Paris.
Otsuki, T., Wilson, J.S. and M. Sewadeh, 2001a, “Saving two in a billion: Quantifying the trade effects of European food safety standards on African exports”, Food Policy 26(5), 495-514.
Otsuki, T., Wilson, J.S. and M. Sewadeh, 2001b, “What price precaution? European harmonization of aflatoxin regulations and African groundnuts”, European Review of Agricultural Economics 28(3), 263-283.
Thornsbury, Suzanne, 1998, “Technical Regulations As Barriers to Agriculture Trade”, Phd Dissertation of Virginia Polytechnic Institute and State University.
UNCTAD, 1997, Indicators of Tariff and Non-tariff Barriers on CD-ROM. Wallner, K., 1998, “Mutual Recognition and the Strategic Use of International
Standard”, SSE/EFI Working Paper No.254, Stockholm School of Economics.Wilson, J.S. and T. Otsuki, 2004a, “Standards and Technical Regulations and Firms
in Developing Countries: New Evidence from a World Bank Technical Barrier to Trade Survey”, World Bank, Washington DC.
Wilson, J.S. and T. Otsuki, 2004b, “Global trade and food safety: winner and losers in a non-harmonized world”, Journal of Economic Integration 18(2), 266-287.
Wilson, J.S. and T. Otsuki, 2004c, “To spray or not to spray: pesticides, banana exports and food safety”, Food Policy 29, 131-145.
Wilson, J.S., T. Otsuki, and B. Majumdsar, 2003, “Balancing food safety and risk: do drug residue limits affect international trade?” Journal of International Trade and Development 12(4), 377-402.
Xiaohua Bao and Larry D. Qiu Asia-Pacific Journal of Accounting & Economics 17 (2010) 253–280
269
Table 1: Restrictiveness of Trade Measures by frequency index (HS2)
Type of measure Year No. of affected
products (1)
Restrictiveness = (1) / Total No.
of Products
Affected imports (thousand US$) (2)
Restrictiveness = (2) / Total imports
(thousand US$)
Tariff 1998 96 100.00% 136,698,089 100.00%1999 95 98.96% 164,039,379 99.00%2000 95 98.96% 208,724,085 98.73%2001 95 98.96% 276,491,273 99.02%2002 95 98.96% 279,654,465 98.97%2003 95 98.96% 407,605,638 99.05%2004 95 98.96% 554,406,001 99.05%2005 95 98.96% 651,765,484 99.06%2006 95 98.96% 782,291,262 99.10%
TBT 1998 70 72.92% 125,641,672 91.91%1999 65 67.71% 152,705,419 92.16%2000 74 77.08% 200,023,143 94.62%2001 73 76.04% 215,806,053 77.29%2002 76 79.17% 267,412,019 94.64%2003 81 84.38% 399,786,552 97.15%2004 82 85.42% 547,067,690 97.74%2005 83 86.46% 642,031,520 97.58%2006 83 86.46% 768,634,084 97.37%
License 1998 21 21.88% 89,549,798 65.51%1999 22 22.92% 114,601,204 69.16%2000 22 22.92% 149,079,530 70.52%2001 25 26.04% 175,663,852 62.91%2002 30 31.25% 234,498,993 82.99%2003 37 38.54% 371,968,600 90.39%2004 36 37.50% 503,444,064 89.95%2005 35 36.46% 570,994,948 86.78%2006 35 36.46% 719,767,331 91.18%
Quota 1998 15 15.63% 83,212,840 60.97%1999 16 16.67% 106,109,004 64.04%2000 12 12.50% 126,286,133 59.74%2001 16 16.67% 149,452,821 53.52%2002 7 7.29% 9,015,966 3.19%2003 7 7.29% 11,816,213 2.87%2004 8 8.33% 18,645,068 3.33%2005 7 7.29% 17,617,835 2.68%2006 6 6.25% 15,419,738 1.95%
Source: Based on the authors’ calculation
Xiaohua Bao and Larry D. Qiu Asia-Pacific Journal of Accounting & Economics 17 (2010) 253–280
270
Table 2: Restrictiveness of Trade Measures by Coverage Ratio (HS2)
Type of measure Year No. of affected
products (1)
Restrictiveness = (1) / Total No.
of Products
Affected imports (thousand US$) (2)
Restrictiveness = (2) / Total imports
(thousand US$)
Tariff 1998 96 100.00% 136,698,089 100.00%1999 95 98.96% 164,039,379 99.00%2000 95 98.96% 208,724,085 98.73%2001 95 98.96% 276,491,273 99.02%2002 95 98.96% 279,654,465 98.97%2003 95 98.96% 407,605,638 99.05%2004 95 98.96% 554,406,001 99.05%2005 95 98.96% 651,765,484 99.06%2006 95 98.96% 782,291,262 99.10%
TBT 1998 69 71.88% 125,359,645 91.71%1999 65 67.71% 146,455,222 91.85%2000 74 77.08% 200,023,143 94.62%2001 73 76.04% 215,806,053 77.29%2002 76 79.17% 264,458,262 94.24%2003 81 84.38% 402,145,549 97.17%2004 81 84.38% 545,402,498 97.50%2005 82 85.42% 639,854815 97.25%2006 83 86.46% 768,634,084 97.37%
Licence 1998 20 20.83% 86,869,156 63.55%1999 22 22.92% 109,836,855 68.89%2000 21 21.86% 149,010,983 70.49%2001 25 26.04% 175,663,852 62.91%2002 30 31.25% 234,498,993 83.56%2003 38 39.58% 372,493,219 90.01%2004 36 37.50% 503,102,069 89.94%2005 36 37.50% 571,701,832 86.89%2006 35 36.46% 712,482,707 90.25%
Quota 1998 15 15.63% 83,212,840 60.87%1999 16 16.67% 101,407,700 64.04%2000 12 12.50% 126,286,133 59.74%2001 16 16.67% 149,452,821 53.52%2002 7 7.29% 9,015,966 3.21%2003 7 7.29% 11,816,215 2.86%2004 8 8.33% 18,645,070 3.33%2005 7 7.29% 17,617,835 2.68%2006 6 6.25% 15,419,738 1.95%
Source: Based on the authors’ calculation
Xiaohua Bao and Larry D. Qiu Asia-Pacific Journal of Accounting & Economics 17 (2010) 253–280
271
Table 3: Summary Statistics of the Key Variable
Variable Obs Mean Std. Dev. Min Max
im 37152 5.872 4.208 0 19.94
gdp 37152 5.706 1.538 1.74 9.49
contig 37152 0.186 0.389 0 1
comlang 37152 0.116 0.321 0 1
dist 37152 8.679 0.666 6.86 9.87
tariff 37152 2.582 0.634 0 4.1
fi-tbt 37152 42.844 39.665 0 100
fi-l 37152 7.845 18.406 0 100
fi-q 37152 2.295 9.836 0 90
cr-tbt 37152 54.133 42.294 0 100
cr-l 37152 15.439 29.803 0 100
cr-q 37152 4.351 16.201 0 100
Table 4: Pearson Coefficient between the Variables
im gdp contig comlang dist tariff fi-tbt fi-l fi-q cr-tbt cr-l cr-q
im 1.000
gdp 0.456 1.000
contig -0.156 -0.398 1.000
comlang 0.098 -0.306 0.199 1.000
dist -0.085 0.290 -0.464 -0.433 1.000
tariff -0.126 -0.017 0.000 0.000 0.000 1.000
fi-tbt -0.066 0.006 0.000 0.000 0.000 0.128 1.000
fi-l 0.170 0.008 0.000 0.000 0.000 -0.027 0.013 1.000
fi-q -0.007 -0.004 0.000 0.000 0.000 0.133 0.132 0.309 1.000
cr-tbt 0.037 0.009 0.000 0.000 0.000 -0.007 0.870 0.144 0.136 1.000
cr-l 0.207 0.011 0.000 0.000 0.000 -0.066 -0.002 0.824 0.224 0.154 1.000
cr-q 0.026 -0.003 0.000 0.000 0.000 0.128 0.127 0.260 0.846 0.156 0.229 1.000
Xiaohua Bao and Larry D. Qiu Asia-Pacific Journal of Accounting & Economics 17 (2010) 253–280
272
Table 5: Tobit Regression Results by using Frequency Index
1998-2006 1998-2001 2002-2006(1) (2) (3) (1) (2) (3) (1) (2) (3)
gdp1.564 1.564 1.564 1.569 1.568 1.568 1.562 1.561 1.561
(83.58)a (83.96)a (83.96)a (55.78)a (56.19)a (56.19)a (62.50)a (62.77)a (62.77)a
dist-1.466 -1.465 -1.465 -1.620 -1.618 -1.618 -1.345 -1.345 -1.345
(36.09)a (36.25)a (36.25)a (26.32)a (26.51)a (26.51)a (24.99)a (25.09)a (25.09)a
contig-0.748 -0.746 -0.746 -0.629 -0.628 -0.628 -0.837 -0.834 -0.834
(11.01)a (11.04)a (11.04)a (6.10)a (6.14)a (6.14)a (9.31)a (9.33)a (9.33)a
comlang3.219 3.215 3.215 3.752 3.745 3.745 2.793 2.790 2.790
(41.69)a (41.86)a (41.86)a (32.22)a (32.43)a (32.43)a (27.19)a (27.29)a (27.29)a
developing-1.112 -1.111 -1.111 -1.343 -1.339 -1.339 -0.933 -0.932 -0.932
(18.79)a (18.86)a (18.86)a (14.86)a (14.95)a (14.95)a (11.94)a (11.98)a (11.98)a
tariff-0.648 -0.498 -0.155 -0.311 -0.163 -0.000 -0.863 -0.816 0.271
(17.77)a (11.27)a (1.67)c (5.84)a (2.55)b (0.00) (16.48)a (13.22)a (1.69)c
fi-tbt-0.008 0.005 -0.046 -0.007 0.009 -0.024 -0.007 0.002 -0.133
(13.53)a (4.70)a (5.53)a (8.32)a (5.73)a (2.63)a (8.65)a (1.40) (6.97)a
fi-l0.044 0.043 0.036 0.009 0.015 0.010 0.045 0.043 0.017
(35.16)a (28.32)a (12.16)a (1.82)c (1.36) (1.68)c (32.81)a (27.63)a (3.80)a
fi-q-0.019 -0.033 -0.005 0.019 -0.007 0.048 -0.027 -0.036 -0.032(7.83)a (9.87)a (1.52) (3.59)a (0.63) (6.89)a (6.19)a (2.70)a (6.46)a
agriculture2.482 0.833 9.368
(2.94)a (0.87) (4.79)a
tariff_agri0.343 0.163 1.088
(3.38)a (1.13) (6.34)a
fi-tbt_agri-0.050 -0.033 -0.135(6.05)a (3.54)a (7.05)a
fi-l_agri-0.007 -0.005 -0.026(2.17)b (0.39) (5.56)a
fi-q_agri0.028 0.055 0.004
(5.72)a (4.14)a (0.28)
manufacture-2.482 -0.833 -9.368(2.94)a (0.87) (4.79)a
tariff_manu-0.343 -0.163 -1.088(3.38)a (1.13) (6.34)a
fi-tbt_manu0.050 0.033 0.135
(6.05)a (3.54)a (7.05)a
fi-l_manu0.007 0.005 0.026
(2.17)b (0.39) (5.56)a
fi-q_manu-0.028 -0.055 -0.004(5.72)a (4.14)a (0.28)
Observations 37152 37152 37152 16512 16512 16512 20640 20640 20640Censored ob. 7529 7529 7529 3753 3753 3753 3776 3776 3776
Absolute values of t statistics are in parentheses. a, b and c denotes significant at 1%, 5% and 10% level respectively. Year fixed effects are controlled for.
Xiaohua Bao and Larry D. Qiu Asia-Pacific Journal of Accounting & Economics 17 (2010) 253–280
273
Table 6: Tobit Regression Results by using Coverage Ratio
1998-2006 1998-2001 2002-2006(1) (2) (3) (1) (2) (3) (1) (2) (3)
gdp1.563 1.562 1.562 1.567 1.565 1.565 1.560 1.559 1.559
(83.90)a (84.89)a (84.89)a (56.09)a (57.13)a (57.13)a (62.64)a (63.24)a (63.24)a
dist-1.468 -1.465 -1.465 -1.623 -1.619 -1.619 -1.347 -1.345 -1.345
(36.31)a (36.70)a (36.70)a (26.54)a (27.01)a (27.01)a (25.09)a (25.31)a (25.31)a
contig-0.749 -0.744 -0.744 -0.631 -0.625 -0.625 -0.838 -0.832 -0.832
(11.08)a (11.14)a (11.14)a (6.16)a (6.23)a (6.23)a (9.35)a (9.38)a (9.38)a
comlang3.220 3.212 3.212 3.751 3.738 3.738 2.795 2.790 2.790
(41.91)a (42.33)a (42.33)a (32.43)a (32.96)a (32.96)a (27.30)a (27.52)a (27.52)a
developing-1.115 -1.111 -1.111 -1.347 -1.339 -1.339 -0.935 -0.933 -0.933
(18.93)a (19.08)a (19.08)a (15.00)a (15.21)a (15.21)a (12.01)a (12.10)a (12.10)a
tariff-0.715 -0.279 0.037 -0.446 0.139 -0.013 -0.909 -0.628 0.434
(19.91)a (6.31)a (0.43) (8.69)a (2.16)b (0.11) (17.67)a (10.20)a (3.01)a
cr-tbt-0.000 0.013 -0.005 0.002 0.022 0.017 -0.002 0.007 -1.273(0.40) (17.37)a (0.26) (2.74)a (19.02)a (0.89) (2.57)b (7.04)a (4.59)a
cr-l0.031 0.031 0.018 0.016 0.029 0.013 0.032 0.032 0.014
(40.33)a (34.25)a (11.66)a (7.28)a (9.20)a (3.99)a (36.60)a (32.48)a (6.76)a
cr-q-0.001 -0.011 0.006 0.015 -0.013 0.024 -0.003 -0.011 -0.008(0.68) (5.57)a (2.91)a (5.38)a (3.52)a (5.77)a (1.29) (2.98)a (2.95)a
agriculture-1.038 -1.817 123.823(0.55) (0.94) (4.47)a
tariff_agri0.316 -0.151 1.062
(3.32)a (1.14) (6.79)a
cr-tbt_agri-0.017 -0.005 -1.280(0.93) (0.24) (4.62)a
cr-l_agri-0.013 -0.016 -0.018(7.11)a (3.63)a (7.95)a
cr-q_agri0.017 0.037 0.003
(5.97)a (6.64)a (0.67)
manufacture1.038 1.817 -123.823
(0.55) (0.94) (4.47)a
tariff_manu-0.316 0.151 -1.062(3.32)a (1.14) (6.79)a
cr-tbt_manu0.017 0.005 1.280
(0.93) (0.24) (4.62)a
cr-l_manu0.013 0.016 0.018
(7.11)a (3.63)a (7.95)a
cr-q_manu-0.017 -0.037 -0.003(5.97)a (6.64)a (0.67)
Observations 37152 37152 37152 16512 16512 16512 20640 20640 20640Censored ob. 7529 7529 7529 3753 3753 3753 3776 3776 3776
Absolute values of t statistics are in parentheses. a, b and c denotes significant at 1%, 5% and 10% level respectively. Year fixed effects are controlled for.
Xiaohua Bao and Larry D. Qiu Asia-Pacific Journal of Accounting & Economics 17 (2010) 253–280
274
Table 7: Summary and Comparison of the Results
HS2 Whole sample Agriculture ManufactureFrequency
index Tariff TBT L Q Tariff TBT L Q Tariff TBT L Q
98 – 06 – – + – – – + ns – + + –
98 – 01 – – + + ns – + + – + ns ns
02 – 06 – – + – + – + – – ns + –
Coverage ratio Tariff TBT L Q Tariff TBT L Q Tariff TBT L Q
98 – 06 – ns + ns ns ns + + – + + –
98 – 01 – + + + ns ns + + + + + –
02 – 06 – – + ns + – + – – + + –
Note: +, –, and ns, stand for positively significant, negatively significant, not significant, respectively.
Table 8: Marginal Effects of Trade Control Measures: Frequency Index
Whole sample(HS01-96) Agriculture (HS01-24) Manufacture (HS25-96)
98 – 06 (1) (2) (3) (1) (2) (3) (1) (2) (3)
tariff-0.586 -0.466 -0.027 -0.107 -0.081 -0.007 -0.467 -0.381 -0.018
(17.77)a (17.74)a (17.59)a (1.27) (1.27) (1.27 ) (11.58)a (11.57)a (11.50)a
fi-tbt-0.007 -0.006 -0.0003 -0.038 -0.029 -0.002 0.0043 0.0035 0.0002
(13.54)a (13.53)a (13.43)a (5.21)a (5.21)a (5.20)a (4.84)a (4.84)a (4.83)a
fi-l0.040 0.032 0.002 0.031 0.023 0.002 0.040 0.033 0.002
(35.15)a (35.01)a (33.66)a (11.83)a (11.81)a (11.71)a (28.74)a (28.64)a (27.37)a
fi-q-0.017 -0.014 -0.0008 -0.005 -0.004 -0.0003 -0.031 -0.026 -0.001
(7.83)a (7.82)a (7.81)a (1.68)c (1.68)c (1.68)c (10.17)a (10.16)a (10.10)a
Note: Column (1) for “unconditional expected value”; column (2) for “conditional marginal effect”; and column (3) for “probability uncensored”. Absolute value of z statistics in parentheses; a significant at 1%; b significant at 5%; c significant at 10%.
Xiaohua Bao and Larry D. Qiu Asia-Pacific Journal of Accounting & Economics 17 (2010) 253–280
275
Table 9: Marginal Effects of Trade Control Measures: Coverage Ratio
Whole sample(HS01-96) Agriculture (HS01-24) Manufacture (HS25-96)
98 – 06 (1) (2) (3) (1) (2) (3) (1) (2) (3)
tariff-0.647 -0.516 -0.0293 0.0747 0.0562 0.0049 -0.270 -0.2215 -0.0102
(19.90)a (19.87)a (19.63)a (0.94) (0.94) (0.94) (6.70)a (6.70)a (6.68)a
cr-tbt-.00019 -0.00015 -0.000008 -0.0047 -0.0035 -0.0003 0.0117 0.0095 0.0004
(0.40) (0.40) (0.40) (0.28) (0.28) (0.28) (17.86)a (17.84)a (17.46)a
cr-l0.0279 0.0222 0.0013 0.0154 0.0116 0.0010 0.0288 0.0236 0.0011
(40.31)a (40.11)a (38.08)a (11.07)a (11.06)a (10.97)a (35.01)a (34.84)a (32.44)a
cr-q-0.00087 -0.00069 -.000039 0.0046 0.0035 0.0003 -0.0107 -0.0088 -0.0004
(0.68) (0.68) (0.68) (2.59)a (2.59)a (2.59)a (5.90)a (5.90)a (5.89)a
Note: Column (1) for “unconditional expected value”; column (2) for “conditional marginal effect”; and column (3) for “probability uncensored”. Absolute value of z statistics in parentheses; a significant at 1%; b significant at 5%; c significant at 10%.
Xiaohua Bao and Larry D. Qiu Asia-Pacific Journal of Accounting & Economics 17 (2010) 253–280
276
Annex 1: Code list of Supporting Documents Subject to Customs Control of PRC
CodeName of Licences or Instruments of Ratification
Authorized Institution that issue the documents
1 Import licence Quota & Licence Administrative Bureau Ministry of Commence or its authorized institution
2 Import licence for dual-use item and technologies
Ministry of Commerce
3 Export licence for dual-use item and technologies
Ministry of Commerce
4 Export licence Quota & Licence Administrative Bureau Ministry of Commence or its authorized institution
5 Textile products for interim export licence Ministry of Commerce
6 Used machinery and electrical products are on the list of prohibited import goods
The importing of used electro-mechanical products with this code at the end of its code of goods is prohibited
7 Automatic import goods Ministry of Commerce
8 Articles on the list of prohibited export goods Products with this code are prohibited to be exported
9 Articles on the list of prohibited import goods Products with this code are prohibited to be import
A Certificate of inspection for goods inward The administration of quality supervision
B Certificate of inspection for goods outward The administration of quality supervision
D Certificate of inspection for goods inward/outward (for semi-finished diamonds)
The administration of quality supervision
E Export licencing certificate for endangered species
The administrative bureau of the Import and Export of Endangered Wild Animal or by other relevant administrative
F Import licencing certificate for endangered species
The administrative bureau of the Import and Export of Endangered Wild Animal or by other relevant administrative
G Export licence for dual-use item and technologies
Ministry of Commerce
H Hongkong and Macao OPA textile certificate (1) Hongkong Trade and Industry Department releases OPA certificate of Textile Processing in Mainland china; (2) Macao Ministry of Economy releases certificate of Textile Processing in Mainland China
I Import or export permit for psychotropic drugs
State food and drug administration
J Import or export permit for gold products The People’s Bank of China
K Application form of transfer between-factories during further processing
Local custom
L Import or export of medicines permit licence State food and drug administration and its authorized in institution
Xiaohua Bao and Larry D. Qiu Asia-Pacific Journal of Accounting & Economics 17 (2010) 253–280
277
O Automatic import licence (machinery and electrical products, whether used or not)
Business Department, local institutions in charge of foreign trade or department of Electrical and Mechanical Services
P Import permit for waste and scraps State environmental protection administration of china
Q Report of inspection of soundness on import medicines
State food and drug administration and its authorized institution
R Clearance form for import veterinary drugs Ministry of Agriculture of the People’s Republic
S Import or export registration certificate for pesticides
Ministry of Agriculture of the People’s Republic
T Entry or exit permit for foreign currency cash transfer and reallocation between banks
(1) ”License for banks to transfer foreign currencies” released by state Administration of Foreign Exchange is required for the entry and exist of foreign currency; (2) Sanction from the Silver, Cold & Currency Department of People’s Bank of China is required for the entry and exit of RMB
W Import or export permit for narcolic drugs State food and drug Administration
X Environment control release notice for poisonous chemicals
State environmental protection administration of china
Y certificate of origin State environmental protection administration of china
Z Issuance permit for audio/or video products, release for protolype tape
License for Importing and Exporting Visual Product released by the Department of Academy and Culture; List of Imported Movies and Television Programs released by the State Association of Broadcasting, Films & Television
a Certificate of examination and approval signed and sealed before-hand
business association
c Domestic sales collect tax contact sheet Local Custom
e Quota certificate for importing cotton beyond the tariff quota at a preferential rate
Quota & License Administrative Bureau Ministry of Commerce or its authorized institution
q Country-specific tariff quota certificates National development and Reform commission
r Pre-classified signs
s Relative certificate for ITA products issued by information industry ministry
Local Custom duty department
t Certificate of customs quota Quota & License Administrative Bureau Ministry of Commerce or its authorized institution
Xiaohua Bao and Larry D. Qiu Asia-Pacific Journal of Accounting & Economics 17 (2010) 253–280
278
Annex 2: TBT-Rocked Products
Chapter Description 98 99 00 01 02 03 04 05 06
01 Live animals √ √ √ √ √ √ √ √ √
02 Meat and edible meat offal √ √ √ √ √ √ √ √ √
03 Fish, crustaceans, molluscs, aquatic invertebrates √ √ √ √ √ √ √ √ √
04 Dairy products, eggs, honey, edible animal product √ √ √ √ √ √ √ √ √
05 Products of animal origin √ √ √ √ √ √ √ √ √
06 Live trees, plants, bulbs, roots, cut flowers etc √ √ √ √ √ √ √ √ √
07 Edible vegetables and certain roots and tubers √ √ √ √ √ √ √ √ √
08 Edible fruit, nuts, peel of citrus fruit, melons √ √ √ √ √ √ √ √ √
09 Coffee, tea, mate and spices √ √ √ √ √ √ √ √ √
10 Cereals √ √ √ √ √ √ √ √ √
11 Milling products, malt, starches, inulin, wheat glute √ √ √ √ √ √ √ √ √
12 Oil seed, oleagic fruits, grain, seed, fruit, etc, ne √ √ √ √ √ √ √ √ √
13 Lac, gums, resins, vegetable saps and extracts √ √ √ √ √ √ √ √ √
14 Vegetable plaiting materials, vegetable products √ √ √ √ √ √ √ √ √
15 Animal, vegetable fats and oils, cleavage products, etc √ √ √ √ √ √ √ √ √
16 Meat, fish and seafood food preparations √ √ √ √ √ √ √ √ √
17 Sugars and sugar confectionery √ √ √ √ √ √ √ √ √
18 Cocoa and cocoa preparations √ √ √ √ √ √ √ √ √
19 Cereal, flour, starch, milk preparations and products √ √ √ √ √ √ √ √ √
20 Vegetable, fruit, nut, etc food preparations √ √ √ √ √ √ √ √ √
21 Miscellaneous edible preparations √ √ √ √ √ √ √ √ √
22 Beverages, spirits and vinegar √ √ √ √ √ √ √ √ √
23 Residues, wastes of food industry, animal fodder √ √ √ √ √ √ √ √ √
24 Tobacco and manufactured tobacco substitutes √ √ √ √ √ √ √ √ √
30 Pharmaceutical products √
31 Fertilizers √ √ √ √ √ √ √ √
33 Essential oils, perfumes, cosmetics, toiletries √ √ √ √ √ √ √ √
41 Raw hides and skins (other than furskins) and leather √ √ √ √ √ √ √ √ √
42 Articles of leather, animal gut, harness, travel good √ √ √ √
43 Furskins and artificial fur, manufactures thereof √ √ √ √
44 Wood and articles of wood, wood charcoal √ √ √ √ √ √ √ √ √
45 Cork and articles of cork √ √ √ √ √ √ √ √ √
46 Manufactures of plaiting material, basketwork, etc √ √ √ √ √ √ √ √ √
47 Pulp of wood, fibrous cellulosic material, waste etc √ √ √ √ √ √ √ √ √
Xiaohua Bao and Larry D. Qiu Asia-Pacific Journal of Accounting & Economics 17 (2010) 253–280
279
50 Silk √
51 Wool, animal hair, horsehair yarn and fabric thereof √ √ √ √ √ √ √ √ √
72 Iron and Steel √ √ √ √ √ √ √ √ √
76 Aluminum and articles thereof √ √
80 Tin and articles thereof √ √ √
