division of youth services 2013 annual report
TRANSCRIPT

DIVISION OF YOUTH SERVICES
2013 ANNUAL REPORT

2
Table of Contents
Introduction ........................................................................................................................................................... 3
State Level Statistical Data ............................................................................................................................. 8
Age at Intake ........................................................................................................................................................ 8
Race and Gender ................................................................................................................................................ 8
Characteristics of Youth Courts ................................................................................................................... 9
Intakes per Month .......................................................................................................................................... 11
Referral Agents ................................................................................................................................................ 14
Intake Decisions .............................................................................................................................................. 15
Flow Chart of Court Processing ................................................................................................................ 16
Top Ten Offense Categories ....................................................................................................................... 18
Ranking of Offense Categories by Sex .................................................................................................... 18
Ranking of Offense Categories by Race .................................................................................................. 18
Offense Severity by Sex and Race ............................................................................................................. 19
Programs and Services: Mental Health and AOP ............................................................................... 20
Programs and Services: Electronic Monitoring .................................................................................. 22
Post-Disposition Sanctions ......................................................................................................................... 23
Court Sanctions: Training School ............................................................................................................. 23
State Map .............................................................................................................................................................. 24
County Reports .................................................................................................................................................. 25
Appendix A ....................................................................................................................................................... 108
Appendix B ....................................................................................................................................................... 109

3
Division of Youth Services
The Division of Youth Services (DYS) administers the community services and institutional programs for juveniles who have been adjudicated delinquent in Mississippi Youth Courts or who are at risk of becoming delinquent. DYS provides professional counseling, probation supervision and related services to children in their home communities, as well as education, rehabilitation and treatment services to children committed to institutional care.
MISSION
The mission of DYS is to provide leadership within the Mississippi Juvenile Justice community to pro-mote change for youth, family units and communities. It operates by creating legitimate, alternative pathways to adulthood through equal access to services that are the least intrusive, culturally sensitive and consistent with the highest professional standards.
VISION
The vision of DYS is that every child experience success in caring families and nurturing communities that cherish children and teach them to value family and community. This vision is guided by the fact that decisions and actions which affect children today, determine their quality of life tomorrow.
COMMUNITY SERVICES PROGRAMS
Goals
• To ensure a balanced approach of accountability, competency development and community safety while providing quality services that addresses the needs of children, their families, individual vic-tims and the community.
• To test the effectiveness of community-based programs on reducing commitments to institutional care.
• To establish multi-agency, cooperative partnerships with local communities.
• To establish uniformity in DYS services, case management practices and procedures.
Services
Probation and After-Care Services are provided to juveniles referred to the Youth Courts in all 83 courts in Mississippi. Individual, group and family counseling, intake, pre-court investigations, case management, referral and placement services are provided by Youth Services counselors.
The Interstate Commission for Juveniles [Delinquency and Child in Need of Supervision (CHINS)], along with the DYS, provides for the welfare and protection of juveniles and the public. Its purpose is accomplished through the cooperative supervision of delinquent juveniles on probation or parole, return of runaways, absconders and escapees, return of juveniles charged as delinquent and additional measures that any two or more party states may find desirable.

4
Division of Youth Services
The Tony Gobar Individualized Assessment and Comprehensive Community Intervention Initi-ative (IACCII): Established by statute in Senate Bill 2477, the Tony Gobar IACCII Program pro-vides comprehensive strength-based services for certain youth who would otherwise be committed to institutional care. The IACCII ensures that youth and their families can access necessary services availa-ble in their home communities. DYS currently supervises one IACCII program to better serve youth with special needs. If proven successful, this program may be expanded to other areas of the state to provide appropriate treatment for eligible youth.
Adolescent Opportunity Program
The Adolescent Opportunity Program (AOP) is a community-based partnership with DYS, mental health agencies, community agencies and local multi-agency councils. The AOP provides a mechanism within communities to coordinate services, share resources and reduce the number of young offenders placed in state custody.
Goals
The program, which focuses on the family, seeks to assist local communities in coordinating and providing services to at-risk youth and their families. Its purpose is to decrease criminal activity, im-prove school attendance and performance and inspire adolescents to become positive, goal-oriented in-dividuals. It is designed to provide treatment within a therapeutic setting and a safe controlled environ-ment in which counselors teach adolescents how to develop social and interpersonal relationship skills, self-control and insight.
Services
Each program offers services primarily to non-Medicaid and non-billed Medicaid youth. These services are also available to Medicaid-eligible youth. During CY 2013, 1273 youth were served through the AOPs.
Within the existing programs, DYS provides the Responsible Fatherhood Program, Healthy Marriage Program, Evidence-Based Practices, Fast ForWord Cognitive Development Program and Investment in Excellence for Youth (PX2). According to social learning theory, the closer the treatment provided is to the environment in which the youth normally functions, the more effective treatment will be. To this end, the AOP strives to bring treatments closer to the youth's home environment and family.
Electronic Monitoring
Goals The overarching goal of these services is to offer electronic monitoring and communities based
supervision for youth between the ages of thirteen (13) to seventeen (17) and are on juvenile probation and require electronic monitoring services.

5
Division of Youth Services
Services Electronic monitoring offers assistance with the supervision and rehabilitation of juveniles di-verted from institutional care or released back into the community. Electronic monitoring also offers different levels of monitoring to juveniles on temporary custody orders, as a condition for release from detention, continuing delinquency orders or utilized for sanctions.
INSTITUTIONAL PROGRAMS
Goals
• To provide rehabilitative services to at-risk youth and their families.
• To provide public safety to communities.
• To focus on reducing the risk of re-offending.
• To address the specific criminogenic factors causing delinquent behavior.
Oakley Youth Development Center, located in rural Hinds County, incorporates holistic, therapeutic pro-grams to promote rehabilitation. Oakley serves boys and girls who were adjudicated as delinquent by the Youth Court; courts ordered for commitment and are between the ages of 10 and 17. The psycho-educational program offered is designed to build basic concepts of self-discipline, self-worth, personal responsibility, attention to detail, a sense of urgency and respect for constituted authority.
INTAKE AND ADMISSIONS
Staff works through a diagnostic and evaluation protocol which gathers medical, dental, recrea-tional, educational, vocational and psychological data on each student. Students receive a complete physical and full-scale psychological assessment which includes personality profiling, drug and alcohol abuse risk questionnaire, suicide risk assessment, achievement testing and a trauma risk assessment tool called the Trauma Symptom Checklist for Children.
MENTAL HEALTH AND REHABILITATIVE PROGRAMS
Individual and Group Therapy counseling provide Dialectical Behavior Therapy (DBT), Cognitive Behavior Therapy (CBT), social skills development, character education, anger management, sex educa-tion that includes information on sexually transmitted diseases and abstinence, drug and alcohol aware-ness, character education, sexual offender counseling and psycho-correctional skills.
The Honors Program (HP) is a voluntary program for eligible youth which combines specialized classes with work projects designed to benefit other youth at the facility and the public. The program allows youth to participate in the election process, contribute to the local community and learn to preserve the environment. Youth attend special classes, participate in the student government, which helps direct the program activities, engage in work projects both on the Oakley campus and the in local community and earn additional privileges, both on-campus and off.

6
Division of Youth Services
The Duke of Edinburgh Program is the first in the nation within a secure juvenile facility. The Award concept is one of individual challenge. It presents to young people a balanced, non-competitive program of voluntary activities which encourage personal discovery and growth, self-reliance, perseverance, re-sponsibility to themselves and service to their community.
ACADEMIC AND VOCATIONAL PROGRAMS
Students are placed in academic and vocational classes at Williams School on the Oakley campus ac-cording to their previous school placement and additional educational evaluation. This enables students to continue their educational advancement during their commitment. DYS' non-public school is accredit-ed by the Mississippi Department of Education to provide a curriculum in conformity with the DYS mis-sion and accreditation requirements.
• Students can participate in academic and sports competitions such as Spelling Bees, U.S. History Bowls, Geography Quizzes, basketball, baseball, football, chess and golf.
• Local Area Network (LAN) Computer Labs provide remedial, job interest assessment and cognitive development, facilitated by the Fast ForWord Cognitive Development Program.
• Electronic classrooms allow students to experience "virtual" field trips and view satellite downlinks of various programs.
• Rooms are equipped as part of the STAR School Project through the Mississippi Educational Televi-sion Interactive Video Network (METIVN).
• Williams School has a licensed library/media specialist who provides instructional planning and de-livery assistance to students and teachers.
• GED Preparation and Testing is offered to eligible students. Students tested have an average pass rate in 2013 of 100%.
• ACT® preparation and testing is offered to students who have graduated or earned a GED.
• Vocational Technical Education funds and grants are used to provide programs such as Welding, Car-pentry, Small Engine Repair, Basic Business Computer and Custodial Maintenance.
COOPERATIVE PROGRAMS Wishing to expand services for the youth of Mississippi the Division has undertaken programs with or-ganizations outside the agency. These services reach youth both in the Institution as well as within the Community. OAKLEY YOUTH DEVELOPMENT CENTER GARDEN PROJECT The garden project was funded through a Specialty Crop Block Grant Program from the Mississippi De-partment of Agriculture and Commerce. This project was coordinated through the office of the Attorney General. During the implementation of this project the youth planted, cultivated, harvested, and pre-pared crops for use within the Institution. This project served as a model for other secured juvenile facil-ities within the State.

7
Division of Youth Services
THE RISK AND MENTAL HEALTH SCREENING AND ASSESSMENT OF YOUTH (RAMSAY) DEMONSTRA-TION PROJECT
RAMSAY is a technical assistance demonstration project administered by the University of Massachu-setts Medical School funded through collaboration between the Department of Justice and the John D. and Catherine McArthur Foundation. The goal of the research project is to view evidenced based risk assessment tools and mental health screening instruments to improve decision making skills of youth services counselors involved with the juvenile justice system. Mississippi entered into an agreement with the National Youth Screening Assessment Project (NYSAP) in 2012 to test implementation of the Screening Assessment of Violence Risk in Youth (SAVRY) tool and the Massachusetts Youth Screening Instrument (MAYSI-2) at two test sites. These test sites were: Hinds and Rankin Counties. Control sites where comparison studies were made for common practice in Mississippi were at: Clay, Harrison, Jack-son, and Madison Counties.
JUVENILE JUSTICE - TRANSLATIONAL RESEARCH ON INTERVENTION FOR ADOLESCENTS (JJ-TRIALS)
This research project funded through the National Institute of Drug Abuse (NIDA) part of the National Institute of Health (NIH) is a five year cooperative agreement involving six research sites selected by NI-DA. Mississippi is one of the research centers, specifically Mississippi State University with the primary researcher Dr. Angela Robertson. The Division of Youth Services is the juvenile justice partner on the project. The primary goal is to provide insight into the current state of HIV and substance use preven-tion and treatment services delivery within the juvenile justice system. To help improve the delivery of evidence-based practices addressing prevention and treatment services targeting substance use and HIV behaviors in community based juvenile justice settings, and to advance the implementation science.
COUNCIL OF JUVENILE CORRECTIONAL ADMINISTRATORS (CJCA) RESOURCE NETWORK TECH-NICAL ASSISTANCE GRANT
This grant is funded through CJCA by the John D. and Catherine T. MacArthur Foundation to help the Di-vision in establishing a State wide Evidence-Based Screening and Assessment tool for use in the Youth Court system. This grant will help provide training, practice, and approaches on risk assessment tools to help youth services counselors determine appropriate resources and placement options.

8
State
Frequency %
7 and Under 19 0.2%
8 24 0.2%
9 36 0.3%
10 95 0.8%
11 242 2.1%
12 576 5.0%
13 989 8.6%
14 1672 14.5%
15 2226 19.3%
16 2595 22.5%
17 2694 23.4%
18 151 1.3%
19 and over 13 0.1%
missing/miscoded 199 1.7%
Total 11531 100.0%
Age at Intake1, 2
1 Data Source: MYCIDS
2 If the youth had multiple contacts with
the juvenile court system, the age at the
first contact was used.
0
500
1000
1500
2000
2500
3000
19 24 36 95244
578
992
1673
2234
26012704
15113
199
Age at Intake
Frequency % Frequency % Frequency % Frequency %
White 1140 30.6% 2294 30.3% 5 2.1% 3439 29.8%
Black 2466 66.1% 5071 67.1% 10 4.2% 7547 65.4%
American Indian 5 0.1% 8 0.1% 0 0.0% 13 0.1%
Asian 8 0.2% 19 0.3% 0 0.0% 27 0.2%
Other 30 0.8% 44 0.6% 0 0.0% 74 0.6%
Hispanic 42 1.1% 86 1.1% 1 0.4% 129 1.1%
missing/miscoded 37 1.0% 41 0.5% 224 93.3% 302 2.6%
Total 3728 100.0% 7563 100.0% 240 100.0% 11531 100.0%
Race and Gender
Female Male Missing/Miscoded Total
1 Data Source: MYCIDS
0%
20%
40%
60%
80%
100%
Male Female
30.3% 30.6%
67.1% 66.1%
2.6% 3.3%
Race and Gender
White Black All Other

9
State
Total Youth Total Cases Total Referrals
Adams 308 411 523
Alcorn 95 115 193
Amite 27 42 62
Attala 29 46 59
Benton 14 14 18
Bolivar 223 318 378
Calhoun 25 25 42
Carroll 15 17 25
Chickasaw 46 49 76
Choctaw 13 14 35
Claiborne 47 57 78
Clarke 23 25 37
Clay 69 77 122
Coahoma 177 231 291
Copiah 101 124 150
Covington 51 52 60
Desoto 945 1136 1803
Forrest2 62 62 62
Franklin 48 52 65
George 81 92 100
Greene 22 32 37
Grenada 130 169 228
Hancock 207 231 329
Harrison 885 1370 1881
Hinds 984 1251 1437
Holmes 44 50 112
Humphreys 54 80 82
Issaquena3 5 5 5
Itawamba 49 56 71
Jackson 504 797 989
Jasper 31 40 47
Jefferson 24 25 32
Jefferson Davis 32 37 40
Jones 383 641 1026
Kemper3 2 0 0
Lafayette 111 136 149
Lamar 259 295 456
Lauderdale 369 521 825
Lawrence 42 47 57
Leake 9 12 12
Lee 498 567 917
Leflore 163 221 288
Lincoln 67 84 119
Characteristics of MS Courts1

10
State
Total Youth Total Cases Total Referrals
Lowndes 239 270 366
Madison 312 393 479
Marion 111 188 318
Marshall 118 126 187
Monroe 72 78 86
Montgomery 50 55 65
Neshoba 100 135 202
Newton 55 58 77
Noxubee 8 10 16
Oktibbeha 72 79 93
Panola 191 212 273
Pearl River 174 237 411
Perry 17 27 32
Pike 170 236 320
Pontotoc 58 58 89
Prentiss 33 37 51
Quitman 17 19 22
Rankin 541 715 879
Scott 86 105 132
Sharkey3 25 0 0
Simpson 92 104 109
Smith 44 49 55
Stone 32 37 44
Sunflower 222 439 631
Tallahatchie 26 29 42
Tate 63 65 75
Tippah 32 33 50
Tishomingo 43 50 63
Tunica 191 235 300
Union 29 31 41
Walthall 96 124 145
Warren 328 426 461
Washington 453 756 1003
Wayne 63 78 113
Webster 8 8 10
Wilkinson 39 52 94
Winston 34 44 63
Yalobusha 38 43 60
Yazoo 125 152 166
The Municipality of Pearl 187 247 279
Total 11867 15599 21153
Characteristics of MS Courts (continued)
1Data Source: MYCIDS (unless otherwise noted)
2 Data Source: Sword3 Data Source: DYS hand-counts

11
State
Jan Feb March April May June July Aug Sept Oct Nov Dec Total
Months
Reporting2
Adams 48 42 51 73 43 27 19 21 50 69 53 27 523 12
Alcorn 23 11 6 28 5 5 15 14 18 41 13 14 193 12
Amite 14 4 9 15 2 1 0 4 9 0 3 1 62 10
Attala 4 0 11 2 4 4 4 10 3 14 0 3 59 10
Benton 4 0 3 1 4 4 0 0 0 1 1 0 18 7
Bolivar 28 40 29 56 52 15 25 31 19 47 25 11 378 12
Calhoun 0 3 1 2 3 23 0 4 1 3 0 2 42 9
Carroll 4 4 0 0 3 4 0 4 0 0 6 0 25 6
Chickasaw 2 7 2 6 4 4 4 23 12 2 7 3 76 12
Choctaw 0 2 16 0 3 0 0 2 3 2 7 0 35 7
Claiborne 13 8 5 2 5 4 10 5 7 4 11 4 78 12
Clarke 5 2 2 11 5 2 1 1 0 0 3 5 37 10
Clay 11 4 6 13 11 12 27 3 2 7 18 8 122 12
Coahoma 26 25 14 29 20 31 19 34 19 44 18 12 291 12
Copiah 17 7 31 15 6 13 3 22 6 12 14 4 150 12
Covington 5 8 5 7 2 6 2 11 5 2 0 7 60 11
Desoto 169 122 130 178 150 127 168 115 185 177 146 136 1803 12
Forrest3 500 N/A
Franklin 3 19 10 5 3 1 2 1 3 5 5 8 65 12
George 10 16 10 13 11 1 3 11 9 7 4 5 100 12
Greene 0 4 2 10 4 7 3 3 1 1 0 2 37 10
Grenada 14 16 14 13 15 24 28 18 13 16 30 27 228 12
Hancock 40 24 46 65 11 17 23 22 40 25 14 2 329 12
Harrison 141 149 158 140 228 139 128 171 213 148 160 106 1881 12
Hinds 139 118 111 87 151 115 121 126 164 147 98 60 1437 12
Holmes 13 29 3 15 15 5 6 0 2 17 4 3 112 11
Humphreys 2 4 11 15 4 1 17 5 12 6 1 4 82 12
Issaquena3 5 N/A
Itawamba 10 3 2 14 5 8 1 9 0 11 0 8 71 10
Jackson 89 96 67 80 120 44 106 80 86 83 71 67 989 12
Jasper 2 10 3 9 4 0 0 8 2 4 0 5 47 9
Jefferson 1 0 3 4 9 0 0 7 7 0 0 1 32 7
Jefferson
Davis 10 0 5 0 10 0 1 4 1 0 3 6 40 8
Jones 85 94 112 226 54 69 47 76 62 112 52 37 1026 12
Kemper3 2 N/A
Lafayette 26 22 6 16 13 10 3 4 12 15 10 12 149 12
Lamar 37 43 40 44 59 27 30 29 50 37 39 21 456 12
Lauderdale 71 92 88 85 85 60 76 59 67 64 31 47 825 12
Lawrence 7 0 5 6 6 0 0 4 4 7 16 2 57 9
Leake 0 0 2 0 1 1 2 0 3 1 0 2 12 7
Lee 110 61 53 95 77 79 72 91 88 50 83 58 917 12
Leflore 28 11 16 25 22 21 19 36 39 29 22 20 288 12
Lincoln 9 10 14 7 8 2 19 26 0 14 1 9 119 11
Lowndes 26 33 22 33 55 20 35 27 27 35 42 11 366 12
Intakes Entered Per Month

12
State
Jan Feb March April May June July Aug Sept Oct Nov Dec Total
Months
Reporting2
Madison 60 43 61 50 51 42 27 45 32 18 23 27 479 12
Marion 30 27 7 13 18 26 10 13 95 27 25 27 318 12
Marshall 2 31 26 19 14 25 14 8 16 13 8 11 187 12
Monroe 21 15 11 9 5 1 10 3 5 1 1 4 86 12
Montgomery 3 7 11 6 4 4 11 12 4 2 1 0 65 11
Neshoba 33 18 16 23 22 13 14 3 20 14 14 12 202 12
Newton 6 12 2 8 17 1 2 0 5 13 9 2 77 11
Noxubee 2 5 0 1 6 0 0 0 0 0 2 0 16 5
Oktibbeha 19 8 5 0 16 8 12 4 8 6 2 5 93 11
Panola 24 37 4 29 13 27 18 24 30 25 24 18 273 12
Pearl River 19 33 34 28 65 21 32 36 24 33 27 59 411 12
Perry 1 1 2 0 1 2 7 5 4 5 4 0 32 10
Pike 50 35 27 27 22 12 22 31 36 16 17 25 320 12
Pontotoc 18 3 7 3 7 1 12 13 24 0 1 0 89 10
Prentiss 9 4 1 4 3 11 2 4 5 4 3 1 51 12
Quitman 3 1 0 3 0 0 4 2 0 4 5 0 22 7
Rankin 121 61 71 97 89 65 76 56 58 78 65 42 879 12
Scott 7 26 8 16 14 4 1 13 11 17 10 5 132 12
Sharkey3 25 N/A
Simpson 4 10 11 7 18 8 12 0 13 10 13 3 109 11
Smith 6 2 13 4 13 0 0 0 4 1 7 5 55 9
Stone 7 1 9 10 0 4 0 1 9 2 1 0 44 9
Sunflower 53 59 43 87 47 43 60 47 46 67 43 36 631 12
Tallahatchie 10 1 2 11 3 3 0 2 0 5 3 2 42 10
Tate 6 2 7 8 0 15 6 10 9 8 0 4 75 10
Tippah 14 8 2 2 2 7 0 2 6 2 2 3 50 11
Tishomingo 0 2 7 2 7 0 6 7 6 8 9 9 63 10
Tunica 10 25 21 28 20 29 61 27 25 43 7 4 300 12
Union 2 5 5 8 5 1 3 0 8 0 0 4 41 9
Walthall 19 27 19 9 20 3 3 7 11 11 12 4 145 12
Warren 37 39 56 49 46 16 25 46 57 38 33 19 461 12
Washington 112 69 79 99 97 59 72 51 134 89 58 84 1003 12
Wayne 7 15 6 15 11 6 2 4 21 12 7 7 113 12
Webster 0 3 1 0 0 0 0 0 0 1 5 0 10 4
Wilkinson 13 14 3 1 1 2 11 4 6 10 23 6 94 12
Winston 5 14 1 9 2 3 7 8 7 6 1 0 63 11
Yalobusha 1 5 3 2 16 18 6 0 5 1 0 3 60 10
Yazoo 12 13 20 21 13 15 11 10 12 19 17 3 166 12
Municipality
of Pearl 29 35 13 32 41 35 28 22 23 2 0 19 279 12
Total 2021 1859 1738 2185 2021 1463 1626 1641 2023 1870 1493 1213 216851 Data Source: MYCIDS 2 Months reporting at least one intake. 3 Intake dates unavailable because data were gathered from sources other than MYCIDS.
Intakes Entered Per Month (continued)

13
State
2021
1859
1738
2185
2021
1463
1626 1641
2023
1870
1493
1213
0
500
1000
1500
2000
2500
Jan Feb March April May June July Aug Sept Oct Nov Dec
Intakes Entered Per Month

14
State
* The categories social services; medical, mental, or other professional, and other were combined into a single "other" category for the pie
chart.
Frequency %
Law Enforcement 11398 53.9%
Family 1737 8.2%
School 1553 7.3%
Social Services 73 0.3%
Victim 1552 7.3%
Medical, Mental, or Other Professional 32 0.2%
Other 251 1.2%
DYS and Court Personnel 991 4.7%
None Entered 3566 16.9%
Total 21153 100.0%
Referral Agent1, 2
1 Data Source: MYCIDS
2 See Appendix A for more information about the categorization of
referring agents.
Law Enforcement, 53.9%
Family, 8.2%
School, 7.3%
Victim, 7.3%
Other*, 1.7%
DYS and Court Personnel, 4.7%
None Entered, 16.9%
Referral Agent
Law Enforcement
Family
School
Victim
Other*
DYS and Court Personnel
None Entered

15
State
Formally Petitioned, 59.4%
Diverted*, 33.9%
Referred to Drug Court, 0.2%
No Order Issued, 6.5%
Intake Decisions
Formally Petitioned Diverted* Referred to Drug Court No Order Issued
Frequency %
Formally Petitioned 12574 59.4%
Diverted2 7166 33.9%
Referred to Drug Court 38 0.2%
No Order Issued 1375 6.5%
Total 21153 100.0%
Intake Decisions1
1 Data Source: MYCIDS2 Diverted: informal adjustment ordered, take no
action ordered, child warned or counseled informally,
MDHS monitor child or family informally, parents
warned or counseled

16
Total Referrals in 20131
(N=21,153)
Formally Petitioned2
(N=12,574)
Adjudication Hearing5
(N=10,945)
Dismissed, Informal Adjustment, or Held
Open at Adjudication9
(N=2,766)
No Hearing Action Entered10
(N=1,984)
Certified at Transfer Hearing11
(N=110)
Adjudicated12
(N=6,085)
Dismissed at Disposition13
(N=6)
Referrals Awaiting Disposition Hearing14
(N=459)
No Hearing Action Entered15
(N=123)
Disposed16
(N=5,497)
Certified17
(N=16)
Training School18
(N=493)
Formal Probation19
(N=3,662)
Referrals Awaiting Adjudication6
(N=1,564)
Certified at Transfer Hearing7
(N=65)
Diverted3
(N=7,166)
Certified at Transfer Hearing8
(N=2)
Referred to Drug Court4
(N=38)
No Order Entered
(N=1,375)
State

17
State
4 Referred to Drug Court: order of the court is to refer youth to drug court
3 Diverted: order of the court is informal adjustment, take no action, child warned or counseled
informally, MDHS monitor child or family informally, and parents warned or counseled
2 Formally Petitioned: order of the court is to formally petition
10 No Hearing Action: formally petitioned referrals that had a scheduled adjudication hearing but no
action was entered into MYCIDS
9 Dismissed, Informal Adjustment, or Held Open at Adjudication: formally petitioned referrals that
are diverted during the adjudication hearing
8 Certified at Transfer Hearing: a transfer hearing was held following a court order diverting the
referral
7 Certified at Transfer Hearing: a transfer hearing was held prior to adjudication to certify the
referral
6 Referrals Awaiting Adjudication: referrals that were formally petitioned but an adjudication
5 Adjudication Hearing: referrals that were formally petitioned and an adjudication hearing was held
1 Total Referrals in 2013, Data Source: MYCIDS
19 Formal Probation: court action of formal probation at disposition hearing
18 Training School: court action of training school at disposition hearing
17 Certified: court action to certify at disposition hearing
16 Disposed: formally petitioned and adjudicated referrals that were given a disposition
15 No Hearing Action Entered: formally petitioned and adjudicated referrals that had a disposition
hearing but no action was entered into MYCIDS
14 Referrals Awaiting Disposition Hearing: formally petitioned and adjudicated referrals that are
waiting to be disposed
13 Dismissed at Disposition: formally petitioned and adjudicated referrals that were dismissed during
12 Adjudicated: formally petitioned referrals that were adjudicated delinquent
11 Certified at Transfer Hearing: a transfer hearing was held following the adjudication hearing to
certify the referral

18
State
Frequency %
disorderly conduct 3212 15.1%
simple assault 2804 13.2%
contempt of court 2322 10.9%
CHINS/run away 1939 9.1%
burglary 1734 8.1%
domestic violence 1595 7.5%
drug offenses 1498 7.0%
malicious mischief 1410 6.6%
shoplifting 1335 6.3%
petit larceny 569 2.7%
All other categories 2861 13.4%
Total 21279 100.0%
Top 10 Offense Categories1
1 Hand counts from Issaquena, Sharkey and Kemper
Counties and SWORD data from Forrest County are
included in tally along with data from MYCIDS.
alcohol offenses 118 10th 13th
burglary 12th 1543 4th
CHINS/run away 855 3rd 1009 7th
contempt of court 579 6th 1716 3rd
disorderly conduct 1141 1st 1972 1st
domestic violence 664 4th 897 8th
drug offenses 223 8th 1236 5th
harassment 132 9th 15th
malicious mischief 242 7th 1126 6th
petit larceny 11th 437 10th
simple assault 928 2nd 1752 2nd
shoplifting 590 5th 705 9th
Female Male
Ranking of Offense Categories by Sex1
1 Data Source: MYCIDS
alcohol offenses 238 10th 17th 11th
burglary 392 8th 1116 5th 87 1st
CHINS/run away 618 3rd 1182 4th 57 2nd
contempt of court 625 2nd 1627 3rd 42 4th
disorderly conduct 505 4th 2546 1st 42 5th
domestic violence 462 6th 1066 6th 25 7th
drug offenses 685 1st 732 9th 39 6th
malicious mischief 480 5th 853 8th 22 9th
petit larceny 12th 383 10th 17 10th
simple assault 458 7th 2162 2nd 48 3rd
shoplifting 343 9th 924 7th 24 8th1
Data Source: MYCIDS
All Other RacesWhite Black
Ranking of Offense Categories by Race1

19
State
0%
20%
40%
60%
80%
100%
Status Minor Moderate Serious Very Serious
45.9%28.2% 32.0%
15.4% 17.3%
54.1%71.8% 68.0%
84.6% 82.7%
Offense Severity by Sex
Female Male
0%
20%
40%
60%
80%
100%
Status Minor Moderate Serious Very Serious
33.3% 34.2%25.1% 26.3%
17.3%
63.7% 63.6%73.2% 70.4% 82.0%
3.1% 2.2% 1.7% 3.3% 0.7%
Offense Severity by Race
White Black All Other Races
Female 855 45.9% 1083 28.2% 3261 32.0% 668 15.4% 47 17.3% 5914 28.9%
Male 1009 54.1% 2755 71.8% 6919 68.0% 3657 84.6% 225 82.7% 14565 71.1%
Total 1864 100.0% 3838 100.0% 10180 100.0% 4325 100.0% 272 100.0% 20479 100.0%
White 618 33.3% 1304 34.2% 2546 25.1% 1136 26.3% 47 17.3% 5651 27.7%
Black 1182 63.7% 2429 63.6% 7419 73.2% 3037 70.4% 223 82.0% 14290 70.1%
All Other Races 57 3.1% 84 2.2% 172 1.7% 142 3.3% 2 0.7% 457 2.2%
Total 1857 100.0% 3817 100.0% 10137 100.0% 4315 100.0% 272 100.0% 20398 100.0%
2 See Appendix B for more information about the categorization of offense severity.
1 Data Source: MYCIDS
Offense Severity by Sex and Race1, 2
Very SeriousModerateStatus TotalSeriousMinor

20
State
Organization County Total
YMCA of Metropolitan Alcorn 9
Amite 8
Copiah 9
Desoto 9
Franklin 7
Lee 10
Lincoln 8
Panola 6
Prentiss 8
Tishomingo 8
Total 82
Recruitment and Training Attala 4
Chickasaw 24
Grenada 15
Hinds 6
Neshoba 32
Tate 5
Total 86
Adams County Board of Adams 11
Wilkinson 6
Total 17
Bolivar County Commmunity Action Agency, Inc. Bolivar 18
Total 18
Region VII Mental Health/Mental Retardation Clay 14
Oktibbeha 14
Total 28
South Central Community Claiborne 7
Rankin 15
Walthall 30
Total 52
Coahoma Community College Coahoma 18
Total 18
Phoenix Project Pearl River 25
Total 25
Pine Belt Mental Healthcare Forrest 13
Jones 19
Lamar 14
Total 46
Weems Commnity Mental Lauderdale 16
Total 16
Region VI Mental Health Holmes 8
Leflore 16
Total 24
Madison County BOS Madison 22
Total 22
Exchange Club Family Center Marshall 12
Total 12
New Client Served Report
Mental Health Intensive, Adolescent Opportunity Program, and AOP

21
State
Mississippi Gulf Coast YMCA George 8
Hancock 8
Harrison 24
Jackson 21
Total 61
McComb School District Pike 29
Total 29
Sunflower/Humphreys Sunflower 11
Total 11
Tunica County Board of Supervisors Tunica 31
Total 31
Warren-Yazoo Mental Health Services Warren 28
Yazoo 7
Total 35
WWISCAA Issaquenna 2
Sharkey 12
Washington 11
Total 25
18 Subgrantees 42 Counties 638
Data provided by the Mississippi Department of Human Services (MDHS), Division of Youth
Services (DYS).
New Client Served Report
Mental Health Intensive, Adolescent Opportunity Program, and AOP (continued)

22
State
Total
468
479
963
298
167
14923
34
194
14
0
0
27
1
Coahoma
5
9
14
4
2
287
0
6
0
0
0
3
0
Desoto
96
89
201
62
30
2166
0
21
0
0
0
0
0
Grenada
25
36
61
10
9
1121
0
23
2
0
0
1
0
Harrison
55
41
96
38
6
927
0
11
0
0
0
1
0
Hinds
23
21
44
12
4
757
0
5
0
0
0
1
0
Jackson
83
77
160
58
23
1925
0
31
0
0
0
3
0
Jasper
2
2
4
1
1
29
34
0
1
0
0
0
0
Lafayette
6
6
12
2
3
265
0
3
0
0
0
0
0
Pearl River
105
138
243
77
61
5225
0
51
8
0
0
8
1
Washington
68
60
128
34
28
2221
0
43
3
0
0
10
0
Total New Clients
Total Cases Brought Forward
Total Active Cases
Successfully Completed EMS Services
Clients Discharged
Number of Inclusion and Exclusion Zone
Violations
Number of Youth to Tamper with
Equipment
Shutdown Due to Note Charging
Number of Equipment Malfunctions
Clients to Test Positive for A&D
Clients to Test Negative for A&D
Clients Held in Detention for Violation
Number of Training School Commitments
Data provided by the Mississippi Department of Human Services (MDHS), Division of Youth Services (DYS).
Adapts Electronic Monitoring (AEMS)

23
State
Adams 6 Itawamba 0 Pike 6
Alcorn 0 Jackson 13 Pontotoc 1
Amite 0 Jasper 0 Prentiss 1
Attala 2 Jefferson 0 Quitman 2
Benton 0 Jefferson Davis 0 Rankin 1
Bolivar 8 Jones 13 Scott 2
Calhoun 0 Kemper 1 Sharkey 2
Carroll 1 Lafayette 0 Simpson 1
Chickasaw 0 Lamar 13 Smith 0
Choctaw 1 Lauderdale 9 Stone 1
Claiborne 3 Lawrence 0 Sunflower 6
Clarke 0 Leake 2 Tallahatchie 3
Clay 2 Lee 0 Tate 0
Coahoma 2 Leflore 5 Tippah 0
Copiah 2 Lincoln 2 Tishomingo 0
Covington 0 Lowndes 0 Tunica 2
Desoto 11 Madison 16 Union 0
Forrest 14 Marion 0 Walthall 0
Franklin 2 Marshall 1 Warren 7
George 0 Monroe 0 Washington 2
Greene 0 Montgomery 0 Wayne 1
Grenada 5 Neshoba 6 Webster 0
Hancock 3 Newton 2 Wilkinson 2
Harrison 15 Noxubee 0 Winston 2
Hinds 0 Oktibbeha 0 Yalobusha 1
Holmes 5 Panola 1 Yazoo 2
Humphreys 0 Pearl River 14 The Municipality of Pearl 0
Issaquena 0 Perry 1 Total 226
Data provided by the Mississippi Department of Human Services (MDHS), Division of Youth Services (DYS).
Training School Admissions
Frequencies
Court Sanctions
Detention 562
Training School2 266
Certification 12
Supervision
Formal Probation 2779
Informal Probation 158
Fine 650
Restitution 351
Community Service 257
Post-Disposition Sanctions,
Programs, and Services by Case1
1 Hand counts from Issaquena, Sharkey
and Kemper Counties and SWORD data
from Forrest County are included in tally
along with data from MYCIDS.2
Data provided by the Mississippi
Department of Human Services (MDHS),
Division of Youth Services (DYS).

24
State

25
Adams County (1)
Frequency %
Formally Petitioned 302 57.7%
Diverted* 186 35.6%
Referred to Drug Court 0 0.0%
No Order Issued 35 6.7%
Total 523 100.0%
Intake Decisions
* Diverted: informal adjustment ordered, take no
action ordered, child warned or counseled
informally, MDHS monitor child or family
informally, parens warned or counseled
Total Youth Total Cases Total Referrals
308 411 523
Frequency %
disorderly conduct 196 37.5%
contempt of court 88 16.8%
simple assault 54 10.3%
CHINS/run away 40 7.6%
shoplifting 38 7.3%
harassment 27 5.2%
malicious mischief 18 3.4%
domestic violence 12 2.3%
burglary 11 2.1%
drug offenses 9 1.7%
All other categories 30 5.7%
Total 523 100.0%
Top 10 Offense Categories
Frequency % Frequency % Frequency % Frequency %
White 13 9.8% 15 9.0% 0 0.0% 28 9.1%
Black 114 85.7% 146 88.0% 1 11.1% 261 84.7%
American Indian 0 0.0% 0 0.0% 0 0.0% 0 0.0%
Asian 0 0.0% 0 0.0% 0 0.0% 0 0.0%
Other 1 0.8% 2 1.2% 0 0.0% 3 1.0%
Hispanic 0 0.0% 2 1.2% 1 11.1% 3 1.0%
missing/miscoded 5 3.8% 1 0.6% 7 77.8% 13 4.2%
Total 133 100.0% 166 100.0% 9 100.0% 308 100.0%
Female Male Total
Race and Gender
Missing/Miscoded
Frequency %
7 and Under 1 0.3%
8 4 1.3%
9 3 1.0%
10 6 1.9%
11 9 2.9%
12 11 3.6%
13 17 5.5%
14 45 14.6%
15 73 23.7%
16 60 19.5%
17 59 19.2%
18 14 4.5%
19 and over 1 0.3%
missing/miscoded 5 1.6%
Total 308 100.0%
Age at Intake
Frequencies
Court Sanctions
Detention 8
Training School1
6
Certification 0
Supervision
Formal Probation 101
Informal Probation 1
Fine 0
Restitution 0
Community Service 12
Post-Disposition Sanctions, Programs,
and Services by Case1
2 Data provided by the Mississippi
Department of Human Services (MDHS),
Division of Youth Services (DYS).
1 Data Source: MYCIDS.
26
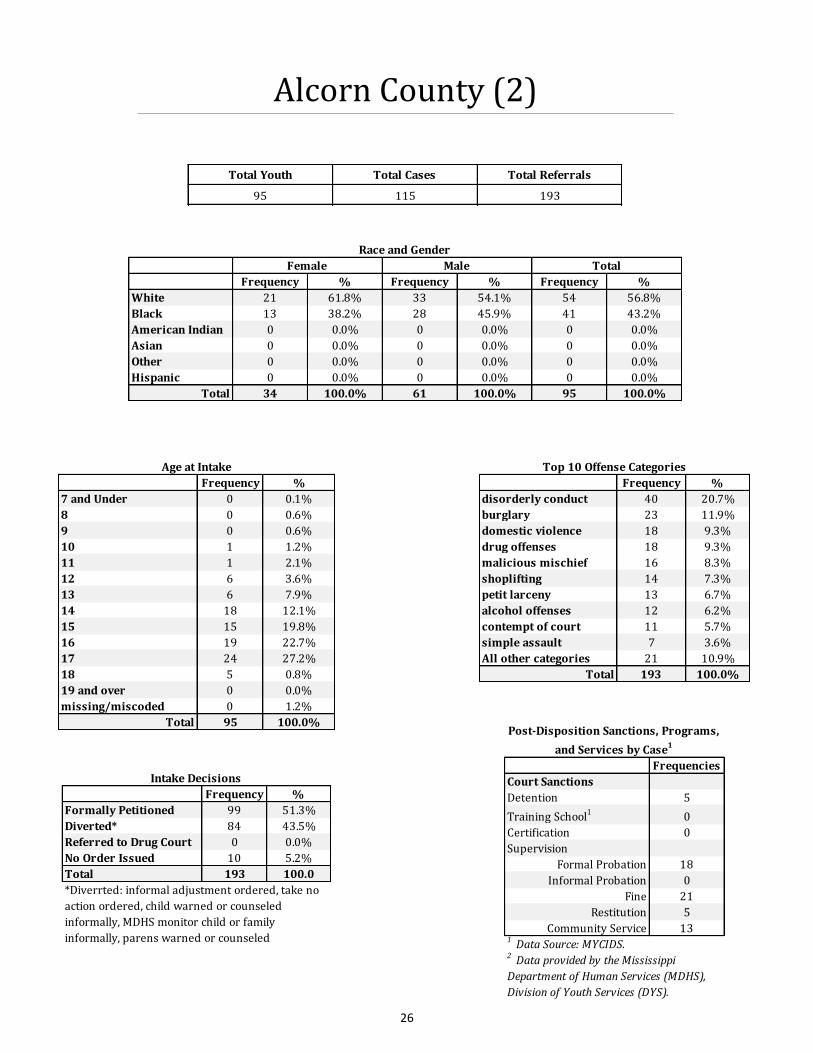
Alcorn County (2)
Frequency % Frequency % Frequency %
White 21 61.8% 33 54.1% 54 56.8%
Black 13 38.2% 28 45.9% 41 43.2%
American Indian 0 0.0% 0 0.0% 0 0.0%
Asian 0 0.0% 0 0.0% 0 0.0%
Other 0 0.0% 0 0.0% 0 0.0%
Hispanic 0 0.0% 0 0.0% 0 0.0%
Total 34 100.0% 61 100.0% 95 100.0%
Female Male Total
Race and Gender
Frequency %
7 and Under 0 0.1%
8 0 0.6%
9 0 0.6%
10 1 1.2%
11 1 2.1%
12 6 3.6%
13 6 7.9%
14 18 12.1%
15 15 19.8%
16 19 22.7%
17 24 27.2%
18 5 0.8%
19 and over 0 0.0%
missing/miscoded 0 1.2%
Total 95 100.0%
Age at Intake
Frequency %
disorderly conduct 40 20.7%
burglary 23 11.9%
domestic violence 18 9.3%
drug offenses 18 9.3%
malicious mischief 16 8.3%
shoplifting 14 7.3%
petit larceny 13 6.7%
alcohol offenses 12 6.2%
contempt of court 11 5.7%
simple assault 7 3.6%
All other categories 21 10.9%
Total 193 100.0%
Top 10 Offense Categories
Frequency %
Formally Petitioned 99 51.3%
Diverted* 84 43.5%
Referred to Drug Court 0 0.0%
No Order Issued 10 5.2%
Total 193 100.0
Intake Decisions
*Diverrted: informal adjustment ordered, take no
action ordered, child warned or counseled
informally, MDHS monitor child or family
informally, parens warned or counseled
Total Youth Total Cases Total Referrals
95 115 193
Frequencies
Court Sanctions
Detention 5
Training School1
0
Certification 0
Supervision
Formal Probation 18
Informal Probation 0
Fine 21
Restitution 5
Community Service 13
Post-Disposition Sanctions, Programs,
and Services by Case1
1 Data Source: MYCIDS.2 Data provided by the Mississippi
Department of Human Services (MDHS),
Division of Youth Services (DYS).

27
Amite County (3)
Frequency % Frequency % Frequency %
White 2 22.2% 3 16.7% 5 18.5%
Black 7 77.8% 15 83.3% 22 81.5%
American Indian 0 0.0% 0 0.0% 0 0.0%
Asian 0 0.0% 0 0.0% 0 0.0%
Other 0 0.0% 0 0.0% 0 0.0%
Hispanic 0 0.0% 0 0.0% 0 0.0%
Total 9 100.0% 18 100.0% 27 100.0%
Female Male Total
Race and Gender
Frequency %
7 and Under 0 0.0%
8 0 0.0%
9 2 7.4%
10 1 3.7%
11 3 11.1%
12 8 29.6%
13 3 11.1%
14 3 11.1%
15 6 22.2%
16 0 0.0%
17 1 3.7%
18 0 0.0%
19 and over 0 0.0%
missing/miscoded 0 0.0%
Total 27 100.0%
Age at Intake
Frequency %
Formally Petitioned 26 41.9%
Diverted* 33 53.2%
Referred to Drug Court 0 0.0%
No Order Issued 3 4.8%
Total 62 100.0%
Intake Decisions
* Diverted: informal adjustment ordered, take no
action ordered, child warned or counseled
informally, MDHS monitor child or family
informally, parens warned or counseled
Total Youth Total Cases Total Referrals
27 42 62
Frequency %
disorderly conduct 47 75.8%
malicious mischief 4 6.5%
sexual offenses 3 4.8%
contempt of court 3 4.8%
domestic violence 2 3.2%
burglary 1 1.6%
CHINS/run away 1 1.6%
vandalism 1 1.6%
Total 62 100.0%
Offense Categories
Frequencies
Court Sanctions
Detention 3
Training School1
0
Certification 0
Supervision
Formal Probation 8
Informal Probation 0
Fine 0
Restitution 1
Community Service 21 Data Source: MYCIDS.2 Data provided by the Mississippi
Department of Human Services (MDHS),
Division of Youth Services (DYS).
Post-Disposition Sanctions, Programs,
and Services by Case1

28
Attala County (4)
Frequency % Frequency % Frequency %
White 2 40.0% 5 20.8% 7 24.1%
Black 3 60.0% 19 79.2% 22 75.9%
American Indian 0 0.0% 0 0.0% 0 0.0%
Asian 0 0.0% 0 0.0% 0 0.0%
Other 0 0.0% 0 0.0% 0 0.0%
Hispanic 0 0.0% 0 0.0% 0 0.0%
Total 5 100.0% 24 100.0% 29 100.0%
Female Male Total
Race and Gender
Frequency %
7 and Under 0 0.0%
8 0 0.0%
9 0 0.0%
10 0 0.0%
11 0 0.0%
12 0 0.0%
13 1 3.4%
14 5 17.2%
15 10 34.5%
16 8 27.6%
17 5 17.2%
18 0 0.0%
19 and over 0 0.0%
missing/miscoded 0 0.0%
Total 29 100.0%
Age at Intake
Frequency %
Formally Petitioned 59 100.0%
Diverted* 0 0.0%
Referred to Drug Court 0 0.0%
No Order Issued 0 0.0%
Total 59 100.0%
Intake Decisions
* Diverted: informal adjustment ordered, take no
action ordered, child warned or counseled
informally, MDHS monitor child or family
informally, parens warned or counseled
Total Youth Total Cases Total Referrals
29 46 59
Frequency %
contempt of court 25 42.4%
malicious mischief 7 11.9%
simple assault 6 10.2%
petit larceny 4 6.8%
domestic violence 4 6.8%
shoplifting 3 5.1%
burglary 3 5.1%
disorderly conduct 3 5.1%
aggravated assault 1 1.7%
CHINS/run away 1 1.7%
All other categories 2 3.4%
Total 59 100.0%
Top 10 Offense Categories
Frequencies
Court Sanctions
Detention 0
Training School1
2
Certification 0
Supervision
Formal Probation 18
Informal Probation 0
Fine 0
Restitution 0
Community Service 0
Post-Disposition Sanctions, Programs,
and Services by Case1
1 Data Source: MYCIDS.2 Data provided by the Mississippi
Department of Human Services (MDHS),
Division of Youth Services (DYS).

29
Benton County (5)
Frequency % Frequency % Frequency %
White 1 33.3% 7 63.6% 8 57.1%
Black 1 33.3% 4 36.4% 5 35.7%
American Indian 0 0.0% 0 0.0% 0 0.0%
Asian 0 0.0% 0 0.0% 0 0.0%
Other 0 0.0% 0 0.0% 0 0.0%
Hispanic 1 33.3% 0 0.0% 1 7.1%
Total 3 100.0% 11 100.0% 14 100.0%
Female Male Total
Race and Gender
Frequency %
7 and Under 0 0.0%
8 0 0.0%
9 0 0.0%
10 0 0.0%
11 1 7.1%
12 1 7.1%
13 0 0.0%
14 1 7.1%
15 0 0.0%
16 5 35.7%
17 5 35.7%
18 1 7.1%
19 and over 0 0.0%
missing/miscoded 0 0.0%
Total 14 100.0%
Age at Intake
Frequency %
Formally Petitioned 17 94.4%
Diverted* 1 5.6%
Referred to Drug Court 0 0.0%
No Order Issued 0 0.0%
Total 18 100.0%
Intake Decisions
* Diverted: informal adjustment ordered, take no
action ordered, child warned or counseled
informally, MDHS monitor child or family
informally, parens warned or counseled
Total Youth Total Cases Total Referrals
14 14 18
Frequency %
grand larceny 3 16.7%
petit larceny 2 11.1%
shoplifting 2 11.1%
alcohol offenses 2 11.1%
disorderly conduct 2 11.1%
drug offenses 2 11.1%
other 2 11.1%
domestic violence 1 5.6%
burglary 1 5.6%
simple assault 1 5.6%
Total 18 100.0%
Top 10 Offense Categories
Frequencies
Court Sanctions
Detention 0
Training School1
0
Certification 0
Supervision
Formal Probation 2
Informal Probation 2
Fine 3
Restitution 0
Community Service 0
Post-Disposition Sanctions, Programs,
and Services by Case1
1 Data Source: MYCIDS.2 Data provided by the Mississippi
Department of Human Services (MDHS),
Division of Youth Services (DYS).

30
Bolivar County (6)
Frequency % Frequency % Frequency %
White 8 9.2% 15 11.0% 23 10.3%
Black 79 90.8% 121 89.0% 200 89.7%
American Indian 0 0.0% 0 0.0% 0 0.0%
Asian 0 0.0% 0 0.0% 0 0.0%
Other 0 0.0% 0 0.0% 0 0.0%
Hispanic 0 0.0% 0 0.0% 0 0.0%
Total 87 100.0% 136 100.0% 223 100.0%
Female Male Total
Race and Gender
Frequency %
7 and Under 0 0.0%
8 0 0.0%
9 0 0.0%
10 1 0.4%
11 2 0.9%
12 7 3.1%
13 28 12.6%
14 39 17.5%
15 34 15.2%
16 53 23.8%
17 57 25.6%
18 2 0.9%
19 and over 0 0.0%
missing/miscoded 0 0.0%
Total 223 100%
Age at Intake
Frequency %
Formally Petitioned 114 30.2%
Diverted* 259 68.5%
Referred to Drug Court 0 0.0%
No Order Issued 5 1.3%
Total 378 100.0%
Intake Decisions
* Diverted: informal adjustment ordered, take no
action ordered, child warned or counseled
informally, MDHS monitor child or family
informally, parens warned or counseled
Total Youth Total Cases Total Referrals
223 318 378
Frequency %
disorderly conduct 118 31.2%
simple assault 56 14.8%
malicious mischief 30 7.9%
domestic violence 28 7.4%
burglary 26 6.9%
contempt of court 18 4.8%
shoplifting 16 4.2%
drug offenses 16 4.2%
CHINS/run away 12 3.2%
other 10 2.6%
All other categories 48 12.7%
Total 378 100.0%
Top 10 Offense Categories
Frequencies
Court Sanctions
Detention 0
Training School1
8
Certification 0
Supervision
Formal Probation 38
Informal Probation 1
Fine 0
Restitution 0
Community Service 0
2 Data provided by the Mississippi
Department of Human Services (MDHS),
Division of Youth Services (DYS).
Post-Disposition Sanctions, Programs,
and Services by Case1
1 Data Source: MYCIDS.

31
Calhoun County (7)
Frequency %
7 and Under 0 0.1%
8 0 0.6%
9 0 0.6%
10 0 1.2%
11 3 2.1%
12 0 3.6%
13 1 7.9%
14 3 12.1%
15 1 19.8%
16 6 22.7%
17 9 27.2%
18 1 0.8%
19 and over 0 0.0%
missing/miscoded 1 1.2%
Total 25 100%
Age at Intake
Frequency %
Formally Petitioned 30 71.4%
Diverted* 9 21.4%
Referred to Drug Court 0 0.0%
No Order Issued 3 7.1%
Total 42 100.0%
Intake Decisions
* Diverted: informal adjustment ordered, take no
action ordered, child warned or counseled
informally, MDHS monitor child or family
informally, parens warned or counseled
Total Youth Total Cases Total Referrals
25 25 42
Frequency %
fraud 10 23.8%
drug offenses 7 16.7%
burglary 6 14.3%
simple assault 5 11.9%
robbery 2 4.8%
shoplifting 2 4.8%
alcohol offenses 2 4.8%
contempt of court 2 4.8%
petit larceny 1 2.4%
sexual offenses 1 2.4%
All other categories 4 9.5%
Total 42 100.0%
Top 10 Offense Categories
Frequency % Frequency % Frequency % Frequency %
White 2 40.0% 7 36.8% 0 0.0% 9 36.0%
Black 3 60.0% 10 52.6% 0 0.0% 13 52.0%
American Indian 0 0.0% 0 0.0% 0 0.0% 0 0.0%
Asian 0 0.0% 0 0.0% 0 0.0% 0 0.0%
Other 0 0.0% 0 0.0% 0 0.0% 0 0.0%
Hispanic 0 0.0% 2 10.5% 0 0.0% 2 8.0%
missing/miscoded 0 0.0% 0 0.0% 1 100.0% 1 4.0%
Total 5 100.0% 19 100.0% 1 100.0% 25 100.0%
Race and Gender
Female Male Missing/Miscoded Total
Frequencies
Court Sanctions
Detention 0
Training School1
0
Certification 0
Supervision
Formal Probation 6
Informal Probation 0
Fine 0
Restitution 0
Community Service 0
Post-Disposition Sanctions, Programs,
and Services by Case1
1 Data Source: MYCIDS.2 Data provided by the Mississippi
Department of Human Services (MDHS),
Division of Youth Services (DYS).

32
Carroll County (8)
Frequency %
7 and Under 0 0.0%
8 0 0.0%
9 0 0.0%
10 0 0.0%
11 1 6.7%
12 0 0.0%
13 0 0.0%
14 3 20.0%
15 4 26.7%
16 5 33.3%
17 2 13.3%
18 0 0.0%
19 and over 0 0.0%
missing/miscoded 0 0.0%
Total 15 100%
Age at Intake
Frequency %
Formally Petitioned 18 72.0%
Diverted* 7 28.0%
Referred to Drug Court 0 0.0%
No Order Issued 0 0.0%
Total 25 100.0%
Intake Decisions
* Diverted: informal adjustment ordered, take no
action ordered, child warned or counseled
informally, MDHS monitor child or family
informally, parens warned or counseled
Total Youth Total Cases Total Referrals
15 17 25
Frequency %
burglary 5 20.0%
disorderly conduct 4 16.0%
CHINS/run away 3 12.0%
domestic violence 2 8.0%
grand larceny 2 8.0%
simple assault 2 8.0%
petit larceny 1 4.0%
sexual offenses 1 4.0%
shoplifting 1 4.0%
aggravated assault 1 4.0%
All other categories 3 12.0%
Total 25 100.0%
Top 10 Offense Categories
Frequency % Frequency % Frequency %
White 3 50.0% 4 44.4% 7 46.7%
Black 3 50.0% 5 55.6% 8 53.3%
American Indian 0 0.0% 0 0.0% 0 0.0%
Asian 0 0.0% 0 0.0% 0 0.0%
Other 0 0.0% 0 0.0% 0 0.0%
Hispanic 0 0.0% 0 0.0% 0 0.0%
Total 6 100.0% 9 100.0% 15 100.0%
Female Male Total
Race and Gender
Frequencies
Court Sanctions
Detention 0
Training School1
1
Certification 0
Supervision
Formal Probation 1
Informal Probation 0
Fine 0
Restitution 0
Community Service 01 Data Source: MYCIDS.2 Data provided by the Mississippi
Department of Human Services (MDHS),
Division of Youth Services (DYS).
Post-Disposition Sanctions, Programs,
and Services by Case1
33
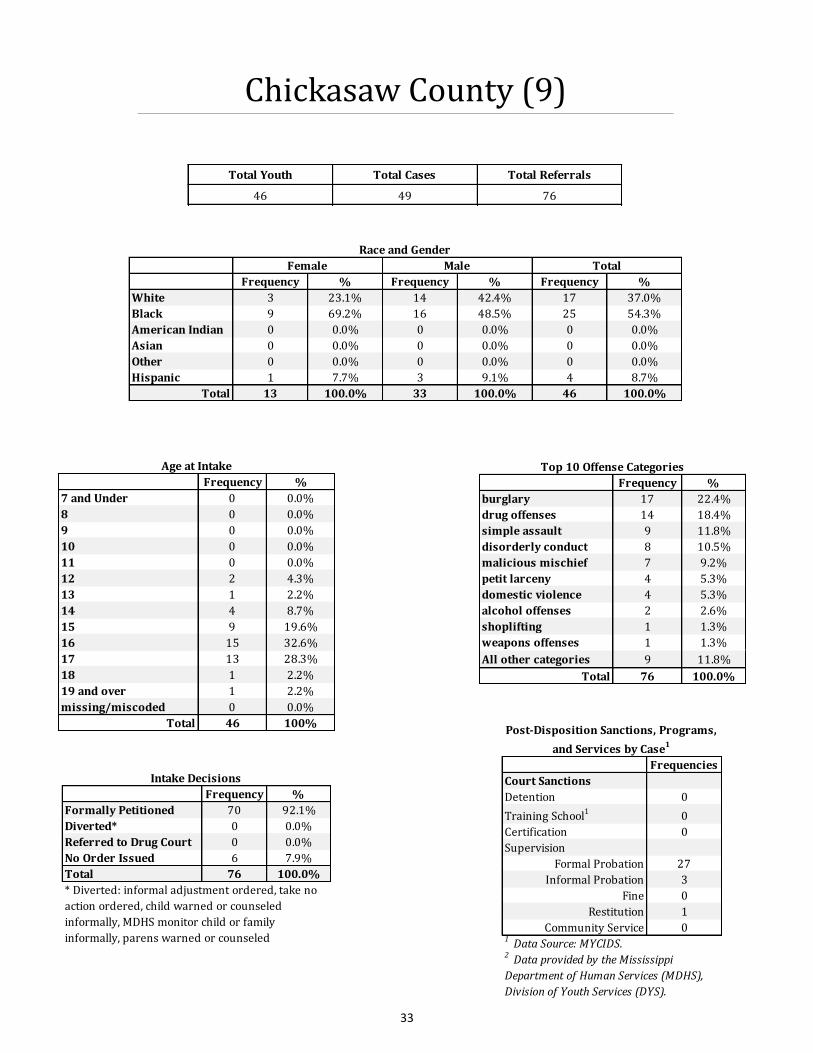
Chickasaw County (9)
Frequency %
7 and Under 0 0.0%
8 0 0.0%
9 0 0.0%
10 0 0.0%
11 0 0.0%
12 2 4.3%
13 1 2.2%
14 4 8.7%
15 9 19.6%
16 15 32.6%
17 13 28.3%
18 1 2.2%
19 and over 1 2.2%
missing/miscoded 0 0.0%
Total 46 100%
Age at Intake
Frequency %
Formally Petitioned 70 92.1%
Diverted* 0 0.0%
Referred to Drug Court 0 0.0%
No Order Issued 6 7.9%
Total 76 100.0%
Intake Decisions
* Diverted: informal adjustment ordered, take no
action ordered, child warned or counseled
informally, MDHS monitor child or family
informally, parens warned or counseled
Total Youth Total Cases Total Referrals
46 49 76
Frequency %
burglary 17 22.4%
drug offenses 14 18.4%
simple assault 9 11.8%
disorderly conduct 8 10.5%
malicious mischief 7 9.2%
petit larceny 4 5.3%
domestic violence 4 5.3%
alcohol offenses 2 2.6%
shoplifting 1 1.3%
weapons offenses 1 1.3%
All other categories 9 11.8%
Total 76 100.0%
Top 10 Offense Categories
Frequency % Frequency % Frequency %
White 3 23.1% 14 42.4% 17 37.0%
Black 9 69.2% 16 48.5% 25 54.3%
American Indian 0 0.0% 0 0.0% 0 0.0%
Asian 0 0.0% 0 0.0% 0 0.0%
Other 0 0.0% 0 0.0% 0 0.0%
Hispanic 1 7.7% 3 9.1% 4 8.7%
Total 13 100.0% 33 100.0% 46 100.0%
Female Male Total
Race and Gender
Frequencies
Court Sanctions
Detention 0
Training School1
0
Certification 0
Supervision
Formal Probation 27
Informal Probation 3
Fine 0
Restitution 1
Community Service 01 Data Source: MYCIDS.2 Data provided by the Mississippi
Department of Human Services (MDHS),
Division of Youth Services (DYS).
Post-Disposition Sanctions, Programs,
and Services by Case1

34
Choctaw County (10)
Frequency %
7 and Under 0 0.0%
8 0 0.0%
9 0 0.0%
10 0 0.0%
11 0 0.0%
12 1 7.7%
13 0 0.0%
14 1 7.7%
15 6 46.2%
16 2 15.4%
17 3 23.1%
18 0 0.0%
19 and over 0 0.0%
missing/miscoded 0 0.0%
Total 13 100%
Age at Intake
Frequency %
Formally Petitioned 29 82.9%
Diverted* 5 14.3%
Referred to Drug Court 0 0.0%
No Order Issued 1 2.9%
Total 35 100.0%
Intake Decisions
* Diverted: informal adjustment ordered, take no
action ordered, child warned or counseled
informally, MDHS monitor child or family
informally, parens warned or counseled
Total Youth Total Cases Total Referrals
13 14 35
Frequency % Frequency % Frequency %
White 2 66.7% 8 80.0% 10 76.9%
Black 1 33.3% 2 20.0% 3 23.1%
American Indian 0 0.0% 0 0.0% 0 0.0%
Asian 0 0.0% 0 0.0% 0 0.0%
Other 0 0.0% 0 0.0% 0 0.0%
Hispanic 0 0.0% 0 0.0% 0 0.0%
Total 3 100.0% 10 100.0% 13 100.0%
Female Male Total
Race and Gender
Frequency %
burglary 14 40.0%
petit larceny 7 20.0%
simple assault 5 14.3%
malicious mischief 3 8.6%
shoplifting 2 5.7%
grand larceny 2 5.7%
disorderly conduct 1 2.9%
missing/miscoded 1
Total 35 97.1%
Offense Categories
Frequencies
Court Sanctions
Detention 0
Training School1
1
Certification 0
Supervision
Formal Probation 2
Informal Probation 2
Fine 0
Restitution 3
Community Service 01 Data Source: MYCIDS.2 Data provided by the Mississippi
Department of Human Services (MDHS),
Division of Youth Services (DYS).
Post-Disposition Sanctions, Programs,
and Services by Case1

35
Claiborne County (11)
Frequency %
7 and Under 0 0.0%
8 0 0.0%
9 0 0.0%
10 0 0.0%
11 2 4.3%
12 2 4.3%
13 4 8.5%
14 6 12.8%
15 8 17.0%
16 11 23.4%
17 14 29.8%
18 0 0.0%
19 and over 0 0.0%
missing/miscoded 0 0.0%
Total 47 100%
Age at Intake
Frequency %
Formally Petitioned 52 66.7%
Diverted* 25 32.1%
Referred to Drug Court 0 0.0%
No Order Issued 1 1.3%
Total 78 100.0%
Intake Decisions
* Diverted: informal adjustment ordered, take no
action ordered, child warned or counseled
informally, MDHS monitor child or family
informally, parens warned or counseled
Total Youth Total Cases Total Referrals
47 57 78
Frequency % Frequency % Frequency %
White 0 0.0% 2 5.9% 2 4.3%
Black 13 100.0% 31 91.2% 44 93.6%
American Indian 0 0.0% 0 0.0% 0 0.0%
Asian 0 0.0% 0 0.0% 0 0.0%
Other 0 0.0% 1 2.9% 1 2.1%
Hispanic 0 0.0% 0 0.0% 0 0.0%
Total 13 100.0% 34 100.0% 47 100.0%
Female Male Total
Race and Gender
Frequency %
simple assault 23 29.5%
disorderly conduct 15 19.2%
domestic violence 6 7.7%
contempt of court 6 7.7%
burglary 5 6.4%
drug offenses 4 5.1%
grand larceny 4 5.1%
sexual offenses 3 3.8%
CHINS/run away 3 3.8%
other 3 3.8%
All other categories 6 7.7%
Total 78 100.0%
Top 10 Offense Categories
Frequencies
Court Sanctions
Detention 0
Training School1
3
Certification 0
Supervision
Formal Probation 3
Informal Probation 0
Fine 0
Restitution 0
Community Service 01 Data Source: MYCIDS.2 Data provided by the Mississippi
Department of Human Services (MDHS),
Division of Youth Services (DYS).
Post-Disposition Sanctions, Programs,
and Services by Case1

36
Clarke County (12)
Frequency %
7 and Under 0 0.0%
8 0 0.0%
9 0 0.0%
10 0 0.0%
11 1 4.3%
12 0 0.0%
13 0 0.0%
14 1 4.3%
15 5 21.7%
16 9 39.1%
17 5 21.7%
18 1 4.3%
19 and over 0 0.0%
missing/miscoded 1 4.3%
Total 23 100%
Age at Intake
Frequency %
Formally Petitioned 23 62.2%
Diverted* 12 32.4%
Referred to Drug Court 0 0.0%
No Order Issued 2 5.4%
Total 37 100.0%
Intake Decisions
* Diverted: informal adjustment ordered, take no
action ordered, child warned or counseled
informally, MDHS monitor child or family
informally, parens warned or counseled
Total Youth Total Cases Total Referrals
23 25 37
Frequency %
burglary 8 21.6%
simple assault 8 21.6%
contempt of court 5 13.5%
malicious mischief 5 13.5%
disorderly conduct 4 10.8%
domestic violence 2 5.4%
harassment 2 5.4%
grand larceny 1 2.7%
missing/miscoded 2 5.4%
Total 37 100.0%
Offense Categories
Frequency % Frequency % Frequency % Frequency %
White 0 0.0% 8 47.1% 0 0.0% 8 34.8%
Black 4 100.0% 8 47.1% 0 0.0% 12 52.2%
American Indian 0 0.0% 0 0.0% 0 0.0% 0 0.0%
Asian 0 0.0% 0 0.0% 0 0.0% 0 0.0%
Other 0 0.0% 0 0.0% 0 0.0% 0 0.0%
Hispanic 0 0.0% 0 0.0% 0 0.0% 0 0.0%
missing/miscoded 0 0.0% 1 5.9% 2 100.0% 3 13.0%
Total 4 100.0% 17 100.0% 2 100.0% 23 100.0%
Race and Gender
Female Male Missing/Miscoded Total
Frequencies
Court Sanctions
Detention 1
Training School1
0
Certification 0
Supervision
Formal Probation 4
Informal Probation 0
Fine 0
Restitution 2
Community Service 01 Data Source: MYCIDS.2 Data provided by the Mississippi
Department of Human Services (MDHS),
Division of Youth Services (DYS).
Post-Disposition Sanctions, Programs,
and Services by Case1

37
Clay County (13)
Frequency %
7 and Under 0 0.0%
8 0 0.0%
9 1 1.4%
10 1 1.4%
11 1 1.4%
12 6 8.7%
13 9 13.0%
14 11 15.9%
15 11 15.9%
16 14 20.3%
17 13 18.8%
18 0 0.0%
19 and over 0 0.0%
missing/miscoded 2 2.9%
Total 69 100%
Age at Intake
Frequency %
Formally Petitioned 59 48.4%
Diverted* 34 27.9%
Referred to Drug Court 0 0.0%
No Order Issued 29 23.8%
Total 122 100.0%
Intake Decisions
* Diverted: informal adjustment ordered, take no
action ordered, child warned or counseled
informally, MDHS monitor child or family
informally, parens warned or counseled
Total Youth Total Cases Total Referrals
69 77 122
Frequency % Frequency % Frequency %
White 8 29.6% 4 9.5% 12 17.4%
Black 19 70.4% 38 90.5% 57 82.6%
American Indian 0 0.0% 0 0.0% 0 0.0%
Asian 0 0.0% 0 0.0% 0 0.0%
Other 0 0.0% 0 0.0% 0 0.0%
Hispanic 0 0.0% 0 0.0% 0 0.0%
Total 27 100.0% 42 100.0% 69 100.0%
Female Male Total
Race and Gender
Frequency %
simple assault 28 23.0%
malicious mischief 23 18.9%
domestic violence 12 9.8%
disorderly conduct 11 9.0%
shoplifting 9 7.4%
contempt of court 8 6.6%
burglary 7 5.7%
weapons offenses 5 4.1%
drug offenses 4 3.3%
grand larceny 4 3.3%
All other categories 11 9.0%
Total 122 100.0%
Top 10 Offense Categories
Frequencies
Court Sanctions
Detention 0
Training School1
2
Certification 0
Supervision
Formal Probation 14
Informal Probation 0
Fine 0
Restitution 2
Community Service 0
2 Data provided by the Mississippi
Department of Human Services (MDHS),
Division of Youth Services (DYS).
1 Data Source: MYCIDS.
Post-Disposition Sanctions, Programs,
and Services by Case1

38
Coahoma County (14)
Frequency %
7 and Under 0 0.0%
8 0 0.0%
9 1 0.6%
10 1 0.6%
11 4 2.3%
12 8 4.5%
13 12 6.8%
14 27 15.3%
15 32 18.1%
16 33 18.6%
17 47 26.6%
18 2 1.1%
19 and over 0 0.0%
missing/miscoded 10 5.6%
Total 177 100%
Age at Intake
Frequency %
Formally Petitioned 130 44.7%
Diverted* 161 55.3%
Referred to Drug Court 0 0.0%
No Order Issued 0 0.0%
Total 291 100.0%
Intake Decisions
* Diverted: informal adjustment ordered, take no
action ordered, child warned or counseled
informally, MDHS monitor child or family
informally, parens warned or counseled
Total Youth Total Cases Total Referrals
177 231 291
Frequency %
simple assault 68 23.4%
disorderly conduct 57 19.6%
burglary 36 12.4%
malicious mischief 19 6.5%
shoplifting 17 5.8%
weapons offenses 15 5.2%
drug offenses 14 4.8%
petit larceny 9 3.1%
domestic violence 9 3.1%
contempt of court 9 3.1%
All other categories 38 13.1%
Total 291 100.0%
Top 10 Offense Categories
Frequency % Frequency % Frequency % Frequency %
White 0 0.0% 4 3.1% 0 0.0% 4 2.3%
Black 40 100.0% 123 96.9% 0 0.0% 163 92.1%
American Indian 0 0.0% 0 0.0% 0 0.0% 0 0.0%
Asian 0 0.0% 0 0.0% 0 0.0% 0 0.0%
Other 0 0.0% 0 0.0% 0 0.0% 0 0.0%
Hispanic 0 0.0% 0 0.0% 0 0.0% 0 0.0%
missing/miscoded 0 0.0% 0 0.0% 10 100.0% 10 5.6%
Total 40 100.0% 127 100.0% 10 100.0% 177 100.0%
Race and Gender
Female Male Missing/Miscoded Total
Frequencies
Court Sanctions
Detention 5
Training School1
2
Certification 0
Supervision
Formal Probation 32
Informal Probation 0
Fine 0
Restitution 0
Community Service 0
2 Data provided by the Mississippi
Department of Human Services (MDHS),
Division of Youth Services (DYS).
1 Data Source: MYCIDS.
Post-Disposition Sanctions, Programs,
and Services by Case1

39
Copiah County (15)
Frequency %
7 and Under 0 0.0%
8 0 0.0%
9 0 0.0%
10 2 2.0%
11 2 2.0%
12 3 3.0%
13 10 9.9%
14 20 19.8%
15 19 18.8%
16 24 23.8%
17 14 13.9%
18 4 4.0%
19 and over 0 0.0%
missing/miscoded 3 3.0%
Total 101 100%
Age at Intake
Frequency %
Formally Petitioned 150 100.0%
Diverted* 0 0.0%
Referred to Drug Court 0 0.0%
No Order Issued 0 0.0%
Total 150 100.0%
Intake Decisions
* Diverted: informal adjustment ordered, take no
action ordered, child warned or counseled
informally, MDHS monitor child or family
informally, parens warned or counseled
Total Youth Total Cases Total Referrals
101 124 150
Frequency %
simple assault 29 19.3%
burglary 22 14.7%
drug offenses 21 14.0%
disorderly conduct 15 10.0%
grand larceny 12 8.0%
contempt of court 11 7.3%
CHINS/run away 9 6.0%
petit larceny 6 4.0%
domestic violence 6 4.0%
sexual offenses 5 3.3%
All other categories 14 9.3%
Total 150 100.0%
Top 10 Offense Categories
Frequency % Frequency % Frequency % Frequency %
White 1 3.8% 11 15.5% 0 0.0% 12 11.9%
Black 25 96.2% 60 84.5% 1 25.0% 86 85.1%
American Indian 0 0.0% 0 0.0% 0 0.0% 0 0.0%
Asian 0 0.0% 0 0.0% 0 0.0% 0 0.0%
Other 0 0.0% 0 0.0% 0 0.0% 0 0.0%
Hispanic 0 0.0% 0 0.0% 0 0.0% 0 0.0%
missing/miscoded 0 0.0% 0 0.0% 3 75.0% 3 3.0%
Total 26 100.0% 71 100.0% 4 100.0% 101 100.0%
Race and Gender
Female Male Missing/Miscoded Total
Frequencies
Court Sanctions
Detention 1
Training School1
2
Certification 0
Supervision
Formal Probation 22
Informal Probation 21
Fine 14
Restitution 7
Community Service 2
2 Data provided by the Mississippi
Department of Human Services (MDHS),
Division of Youth Services (DYS).
1 Data Source: MYCIDS.
Post-Disposition Sanctions, Programs,
and Services by Case1

40
Covington County (16)
Frequency %
7 and Under 0 0.0%
8 0 0.0%
9 0 0.0%
10 0 0.0%
11 0 0.0%
12 2 3.9%
13 7 13.7%
14 6 11.8%
15 9 17.6%
16 12 23.5%
17 11 21.6%
18 0 0.0%
19 and over 0 0.0%
missing/miscoded 4 7.8%
Total 51 100%
Age at Intake
Frequency %
Formally Petitioned 40 66.7%
Diverted* 16 26.7%
Referred to Drug Court 0 0.0%
No Order Issued 4 6.7%
Total 60 100.0%
Intake Decisions
* Diverted: informal adjustment ordered, take no
action ordered, child warned or counseled
informally, MDHS monitor child or family
informally, parens warned or counseled
Total Youth Total Cases Total Referrals
51 52 60
Frequency %
simple assault 13 21.7%
disorderly conduct 9 15.0%
weapons offenses 8 13.3%
petit larceny 6 10.0%
malicious mischief 6 10.0%
contempt of court 5 8.3%
other 4 6.7%
domestic violence 2 3.3%
harassment 2 3.3%
robbery 1 1.7%
All other categories 4 6.7%
Total 60 100.0%
Top 10 Offense Categories
Frequency % Frequency % Frequency % Frequency %
White 4 40.0% 9 24.3% 0 0.0% 13 26.5%
Black 6 60.0% 30 75.7% 0 0.0% 34 69.4%
American Indian 0 0.0% 0 0.0% 0 0.0% 0 0.0%
Asian 0 0.0% 0 0.0% 0 0.0% 0 0.0%
Other 0 0.0% 0 0.0% 0 0.0% 0 0.0%
Hispanic 0 0.0% 0 0.0% 0 0.0% 0 0.0%
missing/miscoded 0 0.0% 0 0.0% 2 100.0% 2 4.1%
Total 10 100.0% 39 100.0% 2 100.0% 51 100.0%
Race and Gender
Female Male Missing/Miscoded Total
Frequencies
Court Sanctions
Detention 0
Training School1
0
Certification 0
Supervision
Formal Probation 7
Informal Probation 2
Fine 1
Restitution 0
Community Service 0
2 Data provided by the Mississippi
Department of Human Services (MDHS),
Division of Youth Services (DYS).
1 Data Source: MYCIDS.
Post-Disposition Sanctions, Programs,
and Services by Case1

41
Desoto County (17)
Frequency %
7 and Under 0 0.0%
8 0 0.0%
9 1 0.1%
10 7 0.7%
11 17 1.8%
12 44 4.7%
13 77 8.1%
14 120 12.7%
15 180 19.0%
16 221 23.4%
17 251 26.6%
18 24 2.5%
19 and over 0 0.0%
missing/miscoded 3 0.3%
Total 945 100%
Age at Intake
Frequency %
Formally Petitioned 1192 66.1%
Diverted* 402 22.3%
Referred to Drug Court 0 0.0%
No Order Issued 209 11.6%
Total 1803 100.0%
Intake Decisions
* Diverted: informal adjustment ordered, take no
action ordered, child warned or counseled
informally, MDHS monitor child or family
informally, parens warned or counseled
Total Youth Total Cases Total Referrals
945 1136 1803
Frequency %
contempt of court 270 15.0%
CHINS/run away 265 14.7%
simple assault 215 11.9%
disorderly conduct 185 10.3%
shoplifting 161 8.9%
malicious mischief 158 8.8%
domestic violence 131 7.3%
drug offenses 126 7.0%
alcohol offenses 47 2.6%
burglary 43 2.4%
All other categories 202 11.2%
Total 1803 100.0%
Top 10 Offense Categories
Frequency % Frequency % Frequency %
White 159 44.8% 245 42.3% 1 9.1% 405 42.9%
Black 180 50.7% 307 53.0% 2 18.2% 489 51.7%
American Indian 0 0.0% 0 0.0% 0 0.0% 0 0.0%
Asian 1 0.3% 3 0.5% 0 0.0% 4 0.4%
Other 5 1.4% 9 1.6% 0 0.0% 14 1.5%
Hispanic 7 2.0% 13 2.2% 0 0.0% 20 2.1%
missing/miscoded 3 0.8% 2 0.3% 8 72.7% 13 1.4%
Total 355 100.0% 579 100.0% 11 100.0% 945 100.0%
Race and Gender
Female Male Missing/Miscoded Total
Frequencies
Court Sanctions
Detention 207
Training School1
11
Certification 4
Supervision
Formal Probation 281
Informal Probation 0
Fine 242
Restitution 14
Community Service 37
2 Data provided by the Mississippi
Department of Human Services (MDHS),
Division of Youth Services (DYS).
1 Data Source: MYCIDS.
Post-Disposition Sanctions, Programs,
and Services by Case1

42
Forrest County (18)
Frequency %
7 and Under 0 0.0%
8 0 0.0%
9 1 0.2%
10 0 0.0%
11 5 1.0%
12 13 2.6%
13 25 5.0%
14 70 14.0%
15 105 21.0%
16 146 29.1%
17 118 23.6%
18 0 0.0%
19 and over 0 0.0%
missing/miscoded 18 3.6%
Total 501 100%
Age at Intake (by referral)
Total Youth Total Cases Total Referrals
62 N/A 501
Frequency %
burglary 85 17.0%
simple assault 82 16.4%
disorderly conduct 56 11.2%
other 51 10.2%
CHINS/run away 45 9.0%
petit larceny 28 5.6%
malicious mischief 27 5.4%
shoplifting 24 4.8%
drug offenses 21 4.2%
alcohol offenses 15 3.0%
All other categories 67 13.4%
Total 501 100.0%
Top 10 Offense Categories
Frequency % Frequency % Frequency % Frequency %
White 4 28.6% 8 18.2% 0 0.0% 12 19.4%
Black 10 71.4% 36 81.8% 0 0.0% 46 74.2%
American Indian 0 0.0% 0 0.0% 0 0.0% 0 0.0%
Asian 0 0.0% 0 0.0% 0 0.0% 0 0.0%
Other 0 0.0% 0 0.0% 0 0.0% 0 0.0%
Hispanic 0 0.0% 0 0.0% 0 0.0% 0 0.0%
missing/miscoded 0 0.0% 0 0.0% 4 100.0% 4 6.5%
Total 14 100.0% 44 100.0% 4 100.0% 62 100.0%
Race and Gender
Female Male Missing/Miscoded Total
Frequencies
Court Sanctions
Detention 0
Training School1
14
Certification 4
Supervision
Formal Probation 0
Informal Probation 0
Fine 0
Restitution 0
Community Service 0
2 Data provided by the Mississippi
Department of Human Services (MDHS),
Division of Youth Services (DYS).
1 Data Source: MYCIDS.
Post-Disposition Sanctions, Programs,
and Services by Case1

43
Franklin County (19)
Frequency %
7 and Under 0 0.0%
8 1 2.1%
9 2 4.2%
10 0 0.0%
11 4 8.3%
12 5 10.4%
13 6 12.5%
14 9 18.8%
15 5 10.4%
16 9 18.8%
17 5 10.4%
18 0 0.0%
19 and over 2 4.2%
missing/miscoded 0 0.0%
Total 48 100%
Age at Intake
Frequency %
Formally Petitioned 24 36.9%
Diverted* 35 53.8%
Referred to Drug Court 0 0.0%
No Order Issued 6 9.2%
Total 65 100.0%
Intake Decisions
* Diverted: informal adjustment ordered, take no
action ordered, child warned or counseled
informally, MDHS monitor child or family
informally, parens warned or counseled
Total Youth Total Cases Total Referrals
48 52 65
Frequency %
disorderly conduct 20 30.8%
simple assault 9 13.8%
drug offenses 6 9.2%
weapons offenses 5 7.7%
malicious mischief 5 7.7%
burglary 4 6.2%
contempt of court 4 6.2%
hunting violation 3 4.6%
domestic violence 2 3.1%
aggravated assault 1 1.5%
All other categories 6 9.2%
Total 65 100.0%
Top 10 Offense Categories
Frequency % Frequency % Frequency %
White 4 26.7% 17 51.5% 21 43.8%
Black 11 73.3% 16 48.5% 27 56.3%
American Indian 0 0.0% 0 0.0% 0 0.0%
Asian 0 0.0% 0 0.0% 0 0.0%
Other 0 0.0% 0 0.0% 0 0.0%
Hispanic 0 0.0% 0 0.0% 0 0.0%
Total 15 100.0% 33 100.0% 48 100.0%
Female Male Total
Race and Gender
Frequencies
Court Sanctions
Detention 3
Training School1
2
Certification 0
Supervision
Formal Probation 8
Informal Probation 0
Fine 0
Restitution 0
Community Service 1
2 Data provided by the Mississippi
Department of Human Services (MDHS),
Division of Youth Services (DYS).
1 Data Source: MYCIDS.
Post-Disposition Sanctions, Programs,
and Services by Case1
44
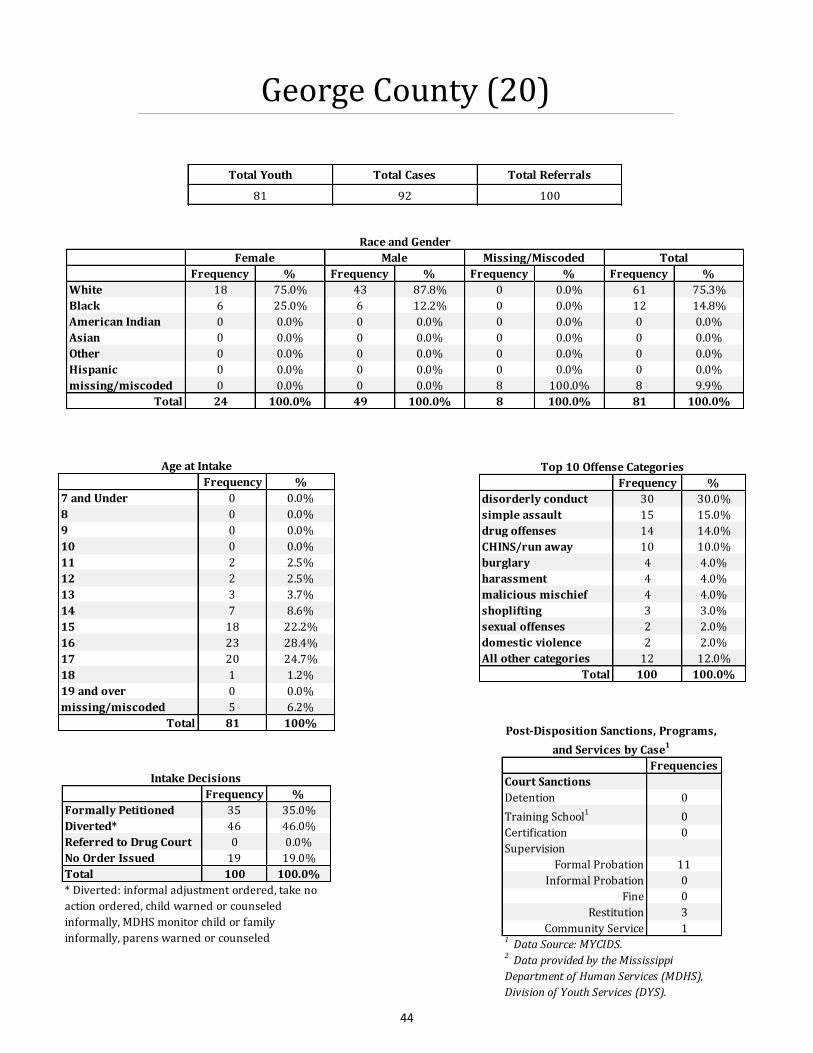
George County (20)
Frequency %
7 and Under 0 0.0%
8 0 0.0%
9 0 0.0%
10 0 0.0%
11 2 2.5%
12 2 2.5%
13 3 3.7%
14 7 8.6%
15 18 22.2%
16 23 28.4%
17 20 24.7%
18 1 1.2%
19 and over 0 0.0%
missing/miscoded 5 6.2%
Total 81 100%
Age at Intake
Frequency %
Formally Petitioned 35 35.0%
Diverted* 46 46.0%
Referred to Drug Court 0 0.0%
No Order Issued 19 19.0%
Total 100 100.0%
Intake Decisions
* Diverted: informal adjustment ordered, take no
action ordered, child warned or counseled
informally, MDHS monitor child or family
informally, parens warned or counseled
Total Youth Total Cases Total Referrals
81 92 100
Frequency %
disorderly conduct 30 30.0%
simple assault 15 15.0%
drug offenses 14 14.0%
CHINS/run away 10 10.0%
burglary 4 4.0%
harassment 4 4.0%
malicious mischief 4 4.0%
shoplifting 3 3.0%
sexual offenses 2 2.0%
domestic violence 2 2.0%
All other categories 12 12.0%
Total 100 100.0%
Top 10 Offense Categories
Frequency % Frequency % Frequency % Frequency %
White 18 75.0% 43 87.8% 0 0.0% 61 75.3%
Black 6 25.0% 6 12.2% 0 0.0% 12 14.8%
American Indian 0 0.0% 0 0.0% 0 0.0% 0 0.0%
Asian 0 0.0% 0 0.0% 0 0.0% 0 0.0%
Other 0 0.0% 0 0.0% 0 0.0% 0 0.0%
Hispanic 0 0.0% 0 0.0% 0 0.0% 0 0.0%
missing/miscoded 0 0.0% 0 0.0% 8 100.0% 8 9.9%
Total 24 100.0% 49 100.0% 8 100.0% 81 100.0%
Race and Gender
Female Male Missing/Miscoded Total
Frequencies
Court Sanctions
Detention 0
Training School1
0
Certification 0
Supervision
Formal Probation 11
Informal Probation 0
Fine 0
Restitution 3
Community Service 1
2 Data provided by the Mississippi
Department of Human Services (MDHS),
Division of Youth Services (DYS).
1 Data Source: MYCIDS.
Post-Disposition Sanctions, Programs,
and Services by Case1

45
Greene County (21)
Frequency %
7 and Under 0 0.0%
8 0 0.0%
9 0 0.0%
10 0 0.0%
11 1 4.5%
12 1 4.5%
13 1 4.5%
14 4 18.2%
15 3 13.6%
16 4 18.2%
17 4 18.2%
18 1 4.5%
19 and over 0 0.0%
missing/miscoded 3 13.6%
Total 22 100%
Age at Intake
Frequency %
Formally Petitioned 28 75.7%
Diverted* 3 8.1%
Referred to Drug Court 0 0.0%
No Order Issued 6 16.2%
Total 37 100.0%
Intake Decisions
* Diverted: informal adjustment ordered, take no
action ordered, child warned or counseled
informally, MDHS monitor child or family
informally, parens warned or counseled
Total Youth Total Cases Total Referrals
22 32 37
Frequency %
simple assault 8 21.6%
drug offenses 6 16.2%
malicious mischief 6 16.2%
disorderly conduct 4 10.8%
grand larceny 4 10.8%
burglary 3 8.1%
sexual offenses 1 2.7%
aggravated assault 1 2.7%
contempt of court 1 2.7%
fraud 1 2.7%
All other categories 2 5.4%
Total 37 100.0%
Top 10 Offense Categories
Frequency % Frequency % Frequency % Frequency %
White 2 66.7% 9 50.0% 0 0.0% 11 50.0%
Black 1 33.3% 9 50.0% 0 0.0% 10 45.5%
American Indian 0 0.0% 0 0.0% 0 0.0% 0 0.0%
Asian 0 0.0% 0 0.0% 0 0.0% 0 0.0%
Other 0 0.0% 0 0.0% 0 0.0% 0 0.0%
Hispanic 0 0.0% 0 0.0% 0 0.0% 0 0.0%
missing/miscoded 0 0.0% 0 0.0% 1 100.0% 1 4.5%
Total 3 100.0% 18 100.0% 1 100.0% 22 100.0%
Race and Gender
Female Male Missing/Miscoded Total
Frequencies
Court Sanctions
Detention 0
Training School1
0
Certification 0
Supervision
Formal Probation 6
Informal Probation 0
Fine 0
Restitution 0
Community Service 1
2 Data provided by the Mississippi
Department of Human Services (MDHS),
Division of Youth Services (DYS).
1 Data Source: MYCIDS.
Post-Disposition Sanctions, Programs,
and Services by Case1

46
Grenada County (22)
Frequency %
7 and Under 0 0.0%
8 0 0.0%
9 0 0.0%
10 0 0.0%
11 1 0.8%
12 7 5.4%
13 14 10.8%
14 15 11.5%
15 18 13.8%
16 37 28.5%
17 34 26.2%
18 1 0.8%
19 and over 0 0.0%
missing/miscoded 3 2.3%
Total 130 100%
Age at Intake
Frequency %
Formally Petitioned 115 50.4%
Diverted* 101 44.3%
Referred to Drug Court 0 0.0%
No Order Issued 12 5.3%
Total 228 100.0%
Intake Decisions
* Diverted: informal adjustment ordered, take no
action ordered, child warned or counseled
informally, MDHS monitor child or family
informally, parens warned or counseled
Total Youth Total Cases Total Referrals
130 169 228
Frequency %
simple assault 39 17.1%
CHINS/run away 29 12.7%
disorderly conduct 27 11.8%
burglary 26 11.4%
malicious mischief 21 9.2%
domestic violence 15 6.6%
shoplifting 14 6.1%
drug offenses 14 6.1%
grand larceny 9 3.9%
harassment 8 3.5%
All other categories 26 11.4%
Total 228 100.0%
Top 10 Offense Categories
Frequency % Frequency % Frequency % Frequency %
White 11 36.7% 17 17.3% 0 0.0% 28 21.5%
Black 18 60.0% 79 80.6% 0 0.0% 97 74.6%
American Indian 0 0.0% 0 0.0% 0 0.0% 0 0.0%
Asian 0 0.0% 0 0.0% 0 0.0% 0 0.0%
Other 0 0.0% 2 2.0% 0 0.0% 2 1.5%
Hispanic 1 3.3% 0 0.0% 0 0.0% 1 0.8%
missing/miscoded 0 0.0% 0 0.0% 2 100.0% 2 1.5%
Total 30 100.0% 98 100.0% 2 100.0% 130 100.0%
Race and Gender
Female Male Missing/Miscoded Total
Frequencies
Court Sanctions
Detention 0
Training School1
5
Certification 0
Supervision
Formal Probation 32
Informal Probation 0
Fine 0
Restitution 14
Community Service 0
2 Data provided by the Mississippi
Department of Human Services (MDHS),
Division of Youth Services (DYS).
1 Data Source: MYCIDS.
Post-Disposition Sanctions, Programs,
and Services by Case1

47
Hancock County (23)
Frequency %
7 and Under 1 0.5%
8 1 0.5%
9 1 0.5%
10 8 3.9%
11 2 1.0%
12 16 7.7%
13 18 8.7%
14 31 15.0%
15 40 19.3%
16 42 20.3%
17 40 19.3%
18 6 2.9%
19 and over 0 0.0%
missing/miscoded 1 0.5%
Total 207 100%
Age at Intake
Frequency %
Formally Petitioned 177 53.8%
Diverted* 127 38.6%
Referred to Drug Court 0 0.0%
No Order Issued 25 7.6%
Total 329 100.0%
Intake Decisions
* Diverted: informal adjustment ordered, take no
action ordered, child warned or counseled
informally, MDHS monitor child or family
informally, parens warned or counseled
Total Youth Total Cases Total Referrals
207 231 329
Frequency %
drug offenses 49 14.9%
disorderly conduct 45 13.7%
CHINS/run away 39 11.9%
burglary 36 10.9%
contempt of court 28 8.5%
domestic violence 23 7.0%
simple assault 22 6.7%
shoplifting 14 4.3%
malicious mischief 11 3.3%
alcohol offenses 10 3.0%
All other categories 52 15.8%
Total 329 100.0%
Top 10 Offense Categories
Frequency % Frequency % Frequency % Frequency %
White 41 78.8% 119 77.3% 0 0.0% 160 77.3%
Black 8 15.4% 26 16.9% 0 0.0% 34 16.4%
American Indian 0 0.0% 1 0.6% 0 0.0% 1 0.5%
Asian 0 0.0% 2 1.3% 0 0.0% 2 1.0%
Other 2 3.8% 2 1.3% 0 0.0% 4 1.9%
Hispanic 1 1.9% 3 1.9% 0 0.0% 4 1.9%
missing/miscoded 0 0.0% 1 0.6% 1 100.0% 2 1.0%
Total 52 100.0% 154 100.0% 1 100.0% 207 100.0%
Race and Gender
Female Male Missing/Miscoded Total
Frequencies
Court Sanctions
Detention 0
Training School1
3
Certification 0
Supervision
Formal Probation 28
Informal Probation 0
Fine 0
Restitution 0
Community Service 0
2 Data provided by the Mississippi
Department of Human Services (MDHS),
Division of Youth Services (DYS).
1 Data Source: MYCIDS.
Post-Disposition Sanctions, Programs,
and Services by Case1

48
Harrison County (24)
Frequency %
7 and Under 1 0.1%
8 5 0.6%
9 5 0.6%
10 11 1.2%
11 19 2.1%
12 32 3.6%
13 70 7.9%
14 107 12.1%
15 175 19.8%
16 201 22.7%
17 241 27.2%
18 7 0.8%
19 and over 0 0.0%
missing/miscoded 11 1.2%
Total 885 100%
Age at Intake
Frequency %
Formally Petitioned 805 42.8%
Diverted* 1028 54.7%
Referred to Drug Court 1 0.1%
No Order Issued 47 2.5%
Total 1881 100.0%
Intake Decisions
* Diverted: informal adjustment ordered, take no
action ordered, child warned or counseled
informally, MDHS monitor child or family
informally, parens warned or counseled
Total Youth Total Cases Total Referrals
885 1370 1881
Frequency %
CHINS/run away 369 19.6%
simple assault 237 12.6%
drug offenses 172 9.1%
contempt of court 161 8.6%
malicious mischief 144 7.7%
disorderly conduct 143 7.6%
shoplifting 137 7.3%
domestic violence 126 6.7%
burglary 103 5.5%
petit larceny 48 2.6%
All other categories 241 12.8%
Total 1881 100.0%
Top 10 Offense Categories
Frequencies
Court Sanctions
Detention 6
Training School1
15
Certification 0
Supervision
Formal Probation 150
Informal Probation 0
Fine 1
Restitution 35
Community Service 13
2 Data provided by the Mississippi
Department of Human Services (MDHS),
Division of Youth Services (DYS).
1 Data Source: MYCIDS.
Post-Disposition Sanctions, Programs,
and Services by Case1
Frequency % Frequency % Frequency % Frequency %
White 131 43.2% 215 37.2% 0 0.0% 346 39.1%
Black 159 52.5% 340 58.8% 0 0.0% 499 56.4%
American Indian 0 0.0% 0 0.0% 0 0.0% 0 0.0%
Asian 2 0.7% 6 1.0% 0 0.0% 8 0.9%
Other 6 2.0% 2 0.3% 0 0.0% 8 0.9%
Hispanic 3 1.0% 9 1.6% 0 0.0% 12 1.4%
missing/miscoded 2 0.7% 6 1.0% 4 100.0% 12 1.4%
Total 303 100.0% 578 100.0% 4 100.0% 885 100.0%
Race and Gender
Female Male Missing/Miscoded Total

49
Hinds County (25)
Frequency %
7 and Under 1 0.1%
8 0 0.0%
9 0 0.0%
10 5 0.5%
11 19 1.9%
12 53 5.4%
13 64 6.5%
14 167 17.0%
15 201 20.4%
16 226 23.0%
17 242 24.6%
18 4 0.4%
19 and over 1 0.1%
missing/miscoded 1 0.1%
Total 984 100.0%
Age at Intake
Frequency %
Formally Petitioned 1022 71.1%
Diverted* 369 25.7%
Referred to Drug Court 0 0.0%
No Order Issued 46 3.2%
Total 1437 100.0%
Intake Decisions
* Diverted: informal adjustment ordered, take no
action ordered, child warned or counseled
informally, MDHS monitor child or family
informally, parens warned or counseled
Total Youth Total Cases Total Referrals
984 1251 1437
Frequency %
domestic violence 330 23.0%
burglary 201 14.0%
disorderly conduct 194 13.5%
simple assault 155 10.8%
drug offenses 105 7.3%
shoplifting 91 6.3%
CHINS/run away 61 4.2%
malicious mischief 60 4.2%
weapons offenses 50 3.5%
grand larceny 35 2.4%
All other categories 155 10.8%
Total 1437 100.0%
Top 10 Offense Categories
Frequencies
Court Sanctions
Detention 0
Training School1
0
Certification 0
Supervision
Formal Probation 109
Informal Probation 3
Fine 9
Restitution 30
Community Service 0
2 Data provided by the Mississippi
Department of Human Services (MDHS),
Division of Youth Services (DYS).
1 Data Source: MYCIDS.
Post-Disposition Sanctions, Programs,
and Services by Case1
Frequency % Frequency % Frequency % Frequency %
White 14 4.9% 30 4.6% 0 0.0% 44 4.5%
Black 268 94.7% 619 94.6% 0 0.0% 887 90.1%
American Indian 0 0.0% 0 0.0% 0 0.0% 0 0.0%
Asian 0 0.0% 2 0.3% 0 0.0% 2 0.2%
Other 1 0.4% 1 0.2% 0 0.0% 2 0.2%
Hispanic 0 0.0% 2 0.3% 0 0.0% 2 0.2%
missing/miscoded 0 0.0% 0 0.0% 47 100.0% 47 4.8%
Total 283 100.0% 654 100.0% 47 100.0% 984 100.0%
Race and Gender
Female Male Missing/Miscoded Total

50
Holmes County (26)
Frequency %
7 and Under 0 0.0%
8 0 0.0%
9 0 0.0%
10 0 0.0%
11 1 1.9%
12 0 0.0%
13 1 3.8%
14 3 11.5%
15 9 11.5%
16 15 15.4%
17 10 7.7%
18 1 0.0%
19 and over 0 0.0%
missing/miscoded 4 42.3%
Total 44 100.0%
Age at Intake
Frequency %
Formally Petitioned 97 86.6%
Diverted* 4 3.6%
Referred to Drug Court 0 0.0%
No Order Issued 11 9.8%
Total 112 100.0%
Intake Decisions
* Diverted: informal adjustment ordered, take no
action ordered, child warned or counseled
informally, MDHS monitor child or family
informally, parens warned or counseled
Total Youth Total Cases Total Referrals
44 50 112
Frequency % Frequency % Frequency % Frequency %
White 0 0.0% 0 0.0% 0 0.0% 0 0.0%
Black 14 100.0% 28 100.0% 0 0.0% 42 95.5%
American Indian 0 0.0% 0 0.0% 0 0.0% 0 0.0%
Asian 0 0.0% 0 0.0% 0 0.0% 0 0.0%
Other 0 0.0% 0 0.0% 0 0.0% 0 0.0%
Hispanic 0 0.0% 0 0.0% 0 0.0% 0 0.0%
missing/miscoded 0 0.0% 0 0.0% 2 100.0% 2 4.5%
Total 14 100.0% 28 100.0% 2 100.0% 44 100.0%
Female Male Missing/Miscoded Total
Race and Gender
Frequency %
malicious mischief 28 25.0%
burglary 11 9.8%
simple assault 11 9.8%
CHINS/run away 10 8.9%
contempt of court 10 8.9%
disorderly conduct 9 8.0%
petit<$500 or
grand>$5004 3.6%
domestic violence 3 2.7%
aggravated assault 3 2.7%
drug offenses 3 2.7%
All other categories 20 17.9%
Total 112 100.0%
Top 10 Offense Categories
Frequencies
Court Sanctions
Detention 0
Training School1
5
Certification 0
Supervision
Formal Probation 10
Informal Probation 0
Fine 0
Restitution 8
Community Service 0
2 Data provided by the Mississippi
Department of Human Services (MDHS),
Division of Youth Services (DYS).
1 Data Source: MYCIDS.
Post-Disposition Sanctions, Programs,
and Services by Case1
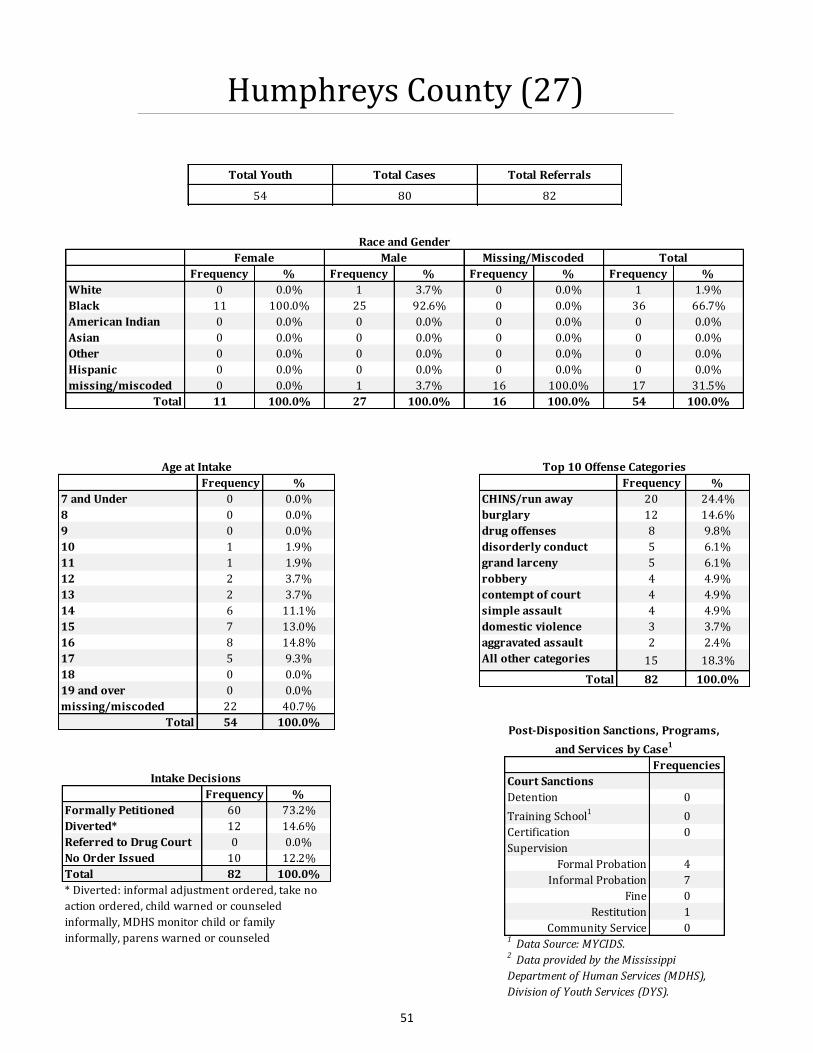
51
Humphreys County (27)
Frequency %
7 and Under 0 0.0%
8 0 0.0%
9 0 0.0%
10 1 1.9%
11 1 1.9%
12 2 3.7%
13 2 3.7%
14 6 11.1%
15 7 13.0%
16 8 14.8%
17 5 9.3%
18 0 0.0%
19 and over 0 0.0%
missing/miscoded 22 40.7%
Total 54 100.0%
Age at Intake
Frequency %
Formally Petitioned 60 73.2%
Diverted* 12 14.6%
Referred to Drug Court 0 0.0%
No Order Issued 10 12.2%
Total 82 100.0%
Intake Decisions
* Diverted: informal adjustment ordered, take no
action ordered, child warned or counseled
informally, MDHS monitor child or family
informally, parens warned or counseled
Total Youth Total Cases Total Referrals
54 80 82
Frequency % Frequency % Frequency % Frequency %
White 0 0.0% 1 3.7% 0 0.0% 1 1.9%
Black 11 100.0% 25 92.6% 0 0.0% 36 66.7%
American Indian 0 0.0% 0 0.0% 0 0.0% 0 0.0%
Asian 0 0.0% 0 0.0% 0 0.0% 0 0.0%
Other 0 0.0% 0 0.0% 0 0.0% 0 0.0%
Hispanic 0 0.0% 0 0.0% 0 0.0% 0 0.0%
missing/miscoded 0 0.0% 1 3.7% 16 100.0% 17 31.5%
Total 11 100.0% 27 100.0% 16 100.0% 54 100.0%
Race and Gender
Female Male Missing/Miscoded Total
Frequency %
CHINS/run away 20 24.4%
burglary 12 14.6%
drug offenses 8 9.8%
disorderly conduct 5 6.1%
grand larceny 5 6.1%
robbery 4 4.9%
contempt of court 4 4.9%
simple assault 4 4.9%
domestic violence 3 3.7%
aggravated assault 2 2.4%
All other categories 15 18.3%
Total 82 100.0%
Top 10 Offense Categories
Frequencies
Court Sanctions
Detention 0
Training School1
0
Certification 0
Supervision
Formal Probation 4
Informal Probation 7
Fine 0
Restitution 1
Community Service 0
2 Data provided by the Mississippi
Department of Human Services (MDHS),
Division of Youth Services (DYS).
1 Data Source: MYCIDS.
Post-Disposition Sanctions, Programs,
and Services by Case1

52
Issaquena County (28)
Frequency %
7 and Under 0 0.0%
8 0 0.0%
9 0 0.0%
10 0 0.0%
11 0 0.0%
12 0 0.0%
13 0 0.0%
14 1 20.0%
15 0 0.0%
16 2 40.0%
17 2 40.0%
18 0 0.0%
19 and over 0 0.0%
missing/miscoded 0 0.0%
Total 5 100.0%
Age at Intake
Total Youth Total Cases Total Referrals
5 5 5
Frequency % Frequency % Frequency %
White 0 0.0% 0 0.0% 0 0.0%
Black 1 0.0% 4 100.0% 5 100.0%
American Indian 0 0.0% 0 0.0% 0 0.0%
Asian 0 0.0% 0 0.0% 0 0.0%
Other 0 0.0% 0 0.0% 0 0.0%
Hispanic 0 0.0% 0 0.0% 0 0.0%
Total 1 0.0% 4 100.0% 5 100.0%
Female Male Total
Race and Gender
Frequency %
contempt of court 2 40.0%
simple assault 2 40.0%
malicious mischief 1 20.0%
Total 5 100.0%
Offense Categories
Frequencies
Court Sanctions
Detention 0
Training School1
0
Certification 0
Supervision
Formal Probation 2
Informal Probation 0
Fine 0
Restitution 1
Community Service 0
2 Data provided by the Mississippi
Department of Human Services (MDHS),
Division of Youth Services (DYS).
1 Data Source: MYCIDS.
Post-Disposition Sanctions, Programs,
and Services by Case1

53
Itawamba County (29)
Frequency %
7 and Under 0 0.0%
8 0 0.0%
9 0 0.0%
10 0 0.0%
11 0 0.0%
12 6 12.2%
13 6 12.2%
14 3 6.1%
15 11 22.4%
16 10 20.4%
17 11 22.4%
18 1 2.0%
19 and over 0 0.0%
missing/miscoded 1 2.0%
Total 49 100.0%
Age at Intake
Frequency %
Formally Petitioned 51 71.8%
Diverted* 12 16.9%
Referred to Drug Court 0 0.0%
No Order Issued 8 11.3%
Total 71 100.0%
Intake Decisions
* Diverted: informal adjustment ordered, take no
action ordered, child warned or counseled
informally, MDHS monitor child or family
informally, parens warned or counseled
Total Youth Total Cases Total Referrals
49 56 71
Frequency % Frequency % Frequency % Frequency %
White 11 78.6% 29 85.3% 0 0.0% 40 81.6%
Black 3 21.4% 4 11.8% 0 0.0% 7 14.3%
American Indian 0 0.0% 0 0.0% 0 0.0% 0 0.0%
Asian 0 0.0% 0 0.0% 0 0.0% 0 0.0%
Other 0 0.0% 0 0.0% 0 0.0% 0 0.0%
Hispanic 0 0.0% 1 2.9% 0 0.0% 1 2.0%
missing/miscoded 0 0.0% 0 0.0% 1 100.0% 1 2.0%
Total 14 100.0% 34 100.0% 1 100.0% 49 100.0%
Race and Gender
Female Male Missing/Miscoded Total
Frequency %
malicious mischief 15 21.1%
domestic violence 12 16.9%
simple assault 9 12.7%
contempt of court 5 7.0%
grand larceny 5 7.0%
disorderly conduct 4 5.6%
drug offenses 4 5.6%
burglary 3 4.2%
petit larceny 2 2.8%
shoplifting 2 2.8%
All other categories 10 14.1%
Total 71 100.0%
Top 10 Offense Categories
Frequencies
Court Sanctions
Detention 0
Training School1
0
Certification 0
Supervision
Formal Probation 15
Informal Probation 0
Fine 0
Restitution 5
Community Service 9
2 Data provided by the Mississippi
Department of Human Services (MDHS),
Division of Youth Services (DYS).
1 Data Source: MYCIDS.
Post-Disposition Sanctions, Programs,
and Services by Case1

54
Jackson County (30)
Frequency %
7 and Under 0 0.0%
8 0 0.0%
9 0 0.0%
10 4 0.8%
11 8 1.6%
12 32 6.3%
13 43 8.5%
14 62 12.3%
15 95 18.8%
16 122 24.2%
17 129 25.6%
18 6 1.2%
19 and over 0 0.0%
missing/miscoded 3 0.6%
Total 504 100.0%
Age at Intake
Frequency %
Formally Petitioned 418 42.3%
Diverted* 514 52.0%
Referred to Drug Court 35 3.5%
No Order Issued 22 2.2%
Total 989 100.0%
Intake Decisions
* Diverted: informal adjustment ordered, take no
action ordered, child warned or counseled
informally, MDHS monitor child or family
informally, parens warned or counseled
Total Youth Total Cases Total Referrals
504 797 989
Frequency % Frequency % Frequency % Frequency %
White 71 47.0% 160 46.2% 1 14.3% 232 46.0%
Black 70 46.4% 171 49.4% 4 57.1% 245 48.6%
American Indian 1 0.7% 1 0.3% 0 0.0% 2 0.4%
Asian 2 1.3% 4 1.2% 0 0.0% 6 1.2%
Other 2 1.3% 2 0.6% 0 0.0% 4 0.8%
Hispanic 5 3.3% 8 2.3% 0 0.0% 13 2.6%
missing/miscoded 0 0.0% 0 0.0% 2 28.6% 2 0.4%
Total 151 100.0% 346 100.0% 7 100.0% 504 100.0%
Race and Gender
Female Male Missing/Miscoded Total
Frequency %
disorderly conduct 161 16.3%
burglary 147 14.9%
contempt of court 88 8.9%
malicious mischief 85 8.6%
simple assault 83 8.4%
drug offenses 77 7.8%
CHINS/run away 72 7.3%
domestic violence 45 4.6%
shoplifting 42 4.2%
petit larceny 41 4.1%
All other categories 148 15.0%
Total 989 100.0%
Top 10 Offense Categories
Frequencies
Court Sanctions
Detention 9
Training School1
13
Certification 0
Supervision
Formal Probation 57
Informal Probation 0
Fine 0
Restitution 8
Community Service 0
2 Data provided by the Mississippi
Department of Human Services (MDHS),
Division of Youth Services (DYS).
1 Data Source: MYCIDS.
Post-Disposition Sanctions, Programs,
and Services by Case1

55
Jasper County (31)
Frequency %
7 and Under 0 0.0%
8 1 3.2%
9 0 0.0%
10 0 0.0%
11 0 0.0%
12 2 6.5%
13 0 0.0%
14 6 19.4%
15 7 22.6%
16 7 22.6%
17 7 22.6%
18 0 0.0%
19 and over 0 0.0%
missing/miscoded 1 3.2%
Total 31 100.0%
Age at Intake
Frequency %
Formally Petitioned 32 68.1%
Diverted* 15 31.9%
Referred to Drug Court 0 0.0%
No Order Issued 0 0.0%
Total 47 100.0%
Intake Decisions
* Diverted: informal adjustment ordered, take no
action ordered, child warned or counseled
informally, MDHS monitor child or family
informally, parens warned or counseled
Total Youth Total Cases Total Referrals
31 40 47
Frequency % Frequency % Frequency % Frequency %
White 3 37.5% 2 9.5% 0 0.0% 5 16.1%
Black 5 62.5% 18 85.7% 0 0.0% 23 74.2%
American Indian 0 0.0% 0 0.0% 0 0.0% 0 0.0%
Asian 0 0.0% 0 0.0% 0 0.0% 0 0.0%
Other 0 0.0% 0 0.0% 0 0.0% 0 0.0%
Hispanic 0 0.0% 1 4.8% 0 0.0% 1 3.2%
missing/miscoded 0 0.0% 0 0.0% 2 100.0% 2 6.5%
Total 8 100.0% 21 100.0% 2 100.0% 31 100.0%
Race and Gender
Female Male Missing/Miscoded Total
Frequency %
drug offenses 9 19.1%
CHINS/run away 6 12.8%
disorderly conduct 6 12.8%
simple assault 6 12.8%
contempt of court 5 10.6%
burglary 4 8.5%
weapons offenses 2 4.3%
petit larceny 1 2.1%
sexual offenses 1 2.1%
shoplifting 1 2.1%
All other categories 6 12.8%
Total 47 100.0%
Top 10 Offense Categories
Frequencies
Court Sanctions
Detention 0
Training School1
0
Certification 0
Supervision
Formal Probation 2
Informal Probation 0
Fine 0
Restitution 1
Community Service 0
2 Data provided by the Mississippi
Department of Human Services (MDHS),
Division of Youth Services (DYS).
1 Data Source: MYCIDS.
Post-Disposition Sanctions, Programs,
and Services by Case1

56
Jefferson County (32)
Frequency %
7 and Under 0 0.0%
8 0 0.0%
9 0 0.0%
10 0 0.0%
11 2 8.3%
12 5 20.8%
13 0 0.0%
14 4 16.7%
15 5 20.8%
16 4 16.7%
17 3 12.5%
18 1 4.2%
19 and over 0 0.0%
missing/miscoded 0 0.0%
Total 24 100.0%
Age at Intake
Frequency %
Formally Petitioned 15 46.9%
Diverted* 15 46.9%
Referred to Drug Court 0 0.0%
No Order Issued 2 6.3%
Total 32 100.0%
Intake Decisions
* Diverted: informal adjustment ordered, take no
action ordered, child warned or counseled
informally, MDHS monitor child or family
informally, parens warned or counseled
Total Youth Total Cases Total Referrals
24 25 32
Frequency % Frequency % Frequency %
White 0 0.0% 0 0.0% 0 0.0%
Black 12 100.0% 12 100.0% 24 100.0%
American Indian 0 0.0% 0 0.0% 0 0.0%
Asian 0 0.0% 0 0.0% 0 0.0%
Other 0 0.0% 0 0.0% 0 0.0%
Hispanic 0 0.0% 0 0.0% 0 0.0%
Total 12 100.0% 12 100.0% 24 100.0%
Female Male Total
Race and Gender
Frequency %
disorderly conduct 10 31.3%
domestic violence 4 12.5%
CHINS/run away 4 12.5%
drug offenses 3 9.4%
harassment 3 9.4%
simple assault 3 9.4%
petit larceny 1 3.1%
malicious mischief 1 3.1%
petit<$500 or
grand>$5001 3.1%
missing/miscoded 2 6.3%
Total 32 100.0%
Offense Categories
Frequencies
Court Sanctions
Detention 0
Training School1
0
Certification 0
Supervision
Formal Probation 1
Informal Probation 0
Fine 0
Restitution 0
Community Service 0
2 Data provided by the Mississippi
Department of Human Services (MDHS),
Division of Youth Services (DYS).
1 Data Source: MYCIDS.
Post-Disposition Sanctions, Programs,
and Services by Case1

57
Jefferson Davis County (33)
Frequency %
7 and Under 1 3.1%
8 1 3.1%
9 0 0.0%
10 0 0.0%
11 0 0.0%
12 1 3.1%
13 2 6.3%
14 1 3.1%
15 7 21.9%
16 11 34.4%
17 7 21.9%
18 1 3.1%
19 and over 0 0.0%
missing/miscoded 0 0.0%
Total 32 100.0%
Age at Intake
Frequency %
Formally Petitioned 39 97.5%
Diverted* 1 2.5%
Referred to Drug Court 0 0.0%
No Order Issued 0 0.0%
Total 40 100.0%
Intake Decisions
* Diverted: informal adjustment ordered, take no
action ordered, child warned or counseled
informally, MDHS monitor child or family
informally, parens warned or counseled
Total Youth Total Cases Total Referrals
32 37 40
Frequency % Frequency % Frequency %
White 1 8.3% 3 15.0% 4 12.5%
Black 11 91.7% 17 85.0% 28 87.5%
American Indian 0 0.0% 0 0.0% 0 0.0%
Asian 0 0.0% 0 0.0% 0 0.0%
Other 0 0.0% 0 0.0% 0 0.0%
Hispanic 0 0.0% 0 0.0% 0 0.0%
Total 12 100.0% 20 100.0% 32 100.0%
Female Male Total
Race and Gender
Frequency %
contempt of court 16 40.0%
disorderly conduct 8 20.0%
harassment 4 10.0%
simple assault 4 10.0%
drug offenses 2 5.0%
sexual offenses 1 2.5%
weapons offenses 1 2.5%
CHINS/run away 1 2.5%
fraud 1 2.5%
malicious mischief 1 2.5%
All other categories 1 2.5%
Total 40 100.0%
Top 10 Offense Categories
Frequencies
Court Sanctions
Detention 1
Training School1
0
Certification 0
Supervision
Formal Probation 16
Informal Probation 0
Fine 2
Restitution 0
Community Service 0
2 Data provided by the Mississippi
Department of Human Services (MDHS),
Division of Youth Services (DYS).
1 Data Source: MYCIDS.
Post-Disposition Sanctions, Programs,
and Services by Case1

58
Jones County (34)
Frequency %
7 and Under 1 0.3%
8 0 0.0%
9 3 0.8%
10 3 0.8%
11 8 2.1%
12 18 4.7%
13 47 12.3%
14 65 17.0%
15 63 16.4%
16 86 22.5%
17 81 21.1%
18 1 0.3%
19 and over 0 0.0%
missing/miscoded 7 1.8%
Total 383 100.0%
Age at Intake
Frequency %
Formally Petitioned 842 82.1%
Diverted* 177 17.3%
Referred to Drug Court 0 0.0%
No Order Issued 7 0.7%
Total 1026 100.0%
Intake Decisions
* Diverted: informal adjustment ordered, take no
action ordered, child warned or counseled
informally, MDHS monitor child or family
informally, parens warned or counseled
Total Youth Total Cases Total Referrals
383 641 1026
Frequency %
contempt of court 455 44.3%
simple assault 116 11.3%
CHINS/run away 86 8.4%
disorderly conduct 80 7.8%
domestic violence 52 5.1%
malicious mischief 41 4.0%
shoplifting 39 3.8%
harassment 34 3.3%
drug offenses 22 2.1%
petit larceny 18 1.8%
All other categories 83 8.1%
Total 1026 100.0%
Top 10 Offense Categories
Frequency % Frequency % Frequency % Frequency %
White 44 31.7% 82 34.9% 0 0.0% 126 32.9%
Black 92 66.2% 145 61.7% 0 0.0% 237 61.9%
American Indian 0 0.0% 0 0.0% 0 0.0% 0 0.0%
Asian 0 0.0% 0 0.0% 0 0.0% 0 0.0%
Other 0 0.0% 1 0.4% 0 0.0% 1 0.3%
Hispanic 3 2.2% 7 3.0% 0 0.0% 10 2.6%
missing/miscoded 0 0.0% 0 0.0% 9 100.0% 9 2.3%
Total 139 100.0% 235 100.0% 9 100.0% 383 100.0%
Race and Gender
Female Male Missing/Miscoded Total
Frequencies
Court Sanctions
Detention 19
Training School1
13
Certification 2
Supervision
Formal Probation 291
Informal Probation 1
Fine 47
Restitution 6
Community Service 26
2 Data provided by the Mississippi
Department of Human Services (MDHS),
Division of Youth Services (DYS).
1 Data Source: MYCIDS.
Post-Disposition Sanctions, Programs,
and Services by Case1
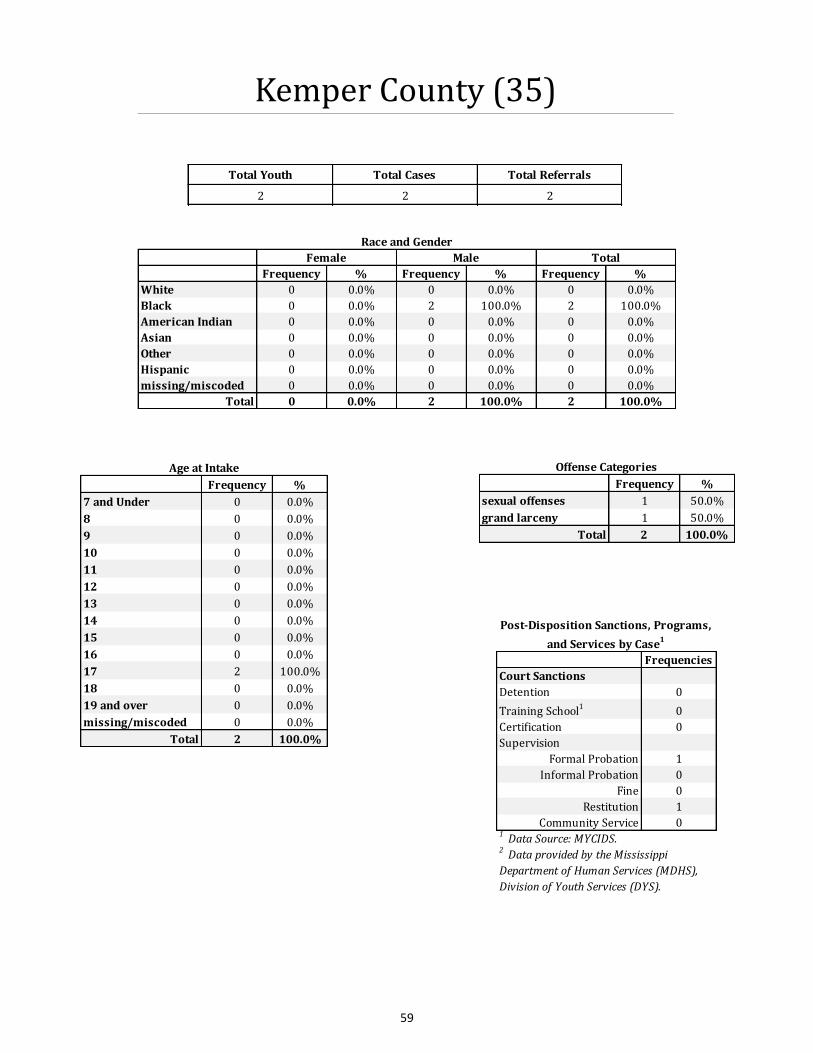
59
Kemper County (35)
Total Youth Total Cases Total Referrals
2 2 2
Frequency % Frequency % Frequency %
White 0 0.0% 0 0.0% 0 0.0%
Black 0 0.0% 2 100.0% 2 100.0%
American Indian 0 0.0% 0 0.0% 0 0.0%
Asian 0 0.0% 0 0.0% 0 0.0%
Other 0 0.0% 0 0.0% 0 0.0%
Hispanic 0 0.0% 0 0.0% 0 0.0%
missing/miscoded 0 0.0% 0 0.0% 0 0.0%
Total 0 0.0% 2 100.0% 2 100.0%
Female Male Total
Race and Gender
Frequency %
7 and Under 0 0.0%
8 0 0.0%
9 0 0.0%
10 0 0.0%
11 0 0.0%
12 0 0.0%
13 0 0.0%
14 0 0.0%
15 0 0.0%
16 0 0.0%
17 2 100.0%
18 0 0.0%
19 and over 0 0.0%
missing/miscoded 0 0.0%
Total 2 100.0%
Age at Intake
Frequency %
sexual offenses 1 50.0%
grand larceny 1 50.0%
Total 2 100.0%
Offense Categories
Frequencies
Court Sanctions
Detention 0
Training School1
0
Certification 0
Supervision
Formal Probation 1
Informal Probation 0
Fine 0
Restitution 1
Community Service 0
2 Data provided by the Mississippi
Department of Human Services (MDHS),
Division of Youth Services (DYS).
1 Data Source: MYCIDS.
Post-Disposition Sanctions, Programs,
and Services by Case1

60
Lafayette County (36)
Frequency %
7 and Under 0 0.0%
8 1 0.9%
9 0 0.0%
10 0 0.0%
11 4 3.6%
12 1 0.9%
13 8 7.2%
14 20 18.0%
15 25 22.5%
16 25 22.5%
17 26 23.4%
18 0 0.0%
19 and over 0 0.0%
missing/miscoded 1 0.9%
Total 111 100.0%
Age at Intake
Frequency %
Formally Petitioned 64 43.0%
Diverted* 73 49.0%
Referred to Drug Court 0 0.0%
No Order Issued 12 8.1%
Total 149 100.0%
Intake Decisions
* Diverted: informal adjustment ordered, take no
action ordered, child warned or counseled
informally, MDHS monitor child or family
informally, parens warned or counseled
Total Youth Total Cases Total Referrals
111 136 149
Frequency %
disorderly conduct 59 39.6%
shoplifting 15 10.1%
drug offenses 12 8.1%
malicious mischief 10 6.7%
simple assault 10 6.7%
CHINS/run away 8 5.4%
burglary 6 4.0%
weapons offenses 5 3.4%
contempt of court 4 2.7%
grand larceny 4 2.7%
All other categories 16 10.7%
Total 149 100.0%
Top 10 Offense Categories
Frequency % Frequency % Frequency %
White 10 33.3% 27 33.3% 37 33.3%
Black 20 66.7% 54 66.7% 74 66.7%
American Indian 0 0.0% 0 0.0% 0 0.0%
Asian 0 0.0% 0 0.0% 0 0.0%
Other 0 0.0% 0 0.0% 0 0.0%
Hispanic 0 0.0% 0 0.0% 0 0.0%
Total 30 100.0% 81 100.0% 111 100.0%
Female Male Total
Race and Gender
Frequencies
Court Sanctions
Detention 0
Training School1
0
Certification 0
Supervision
Formal Probation 1
Informal Probation 6
Fine 1
Restitution 2
Community Service 0
2 Data provided by the Mississippi
Department of Human Services (MDHS),
Division of Youth Services (DYS).
1 Data Source: MYCIDS.
Post-Disposition Sanctions, Programs,
and Services by Case1

61
Lamar County (37)
Frequency %
Formally Petitioned 258 56.6%
Diverted* 177 38.8%
Referred to Drug Court 0 0.0%
No Order Issued 21 4.6%
Total 456 100.0%
Intake Decisions
* Diverted: informal adjustment ordered, take no
action ordered, child warned or counseled
informally, MDHS monitor child or family
informally, parens warned or counseled
Total Youth Total Cases Total Referrals
259 295 456
Frequency %
simple assault 101 22.1%
shoplifting 82 18.0%
disorderly conduct 46 10.1%
contempt of court 34 7.5%
burglary 31 6.8%
CHINS/run away 29 6.4%
drug offenses 28 6.1%
malicious mischief 25 5.5%
alcohol offenses 23 5.0%
domestic violence 13 2.9%
All other categories 44 9.6%
Total 456 100.0%
Top 10 Offense Categories
Frequency % Frequency % Frequency % Frequency %
White 23 30.3% 64 35.2% 0 0.0% 87 33.6%
Black 52 68.4% 116 63.7% 0 0.0% 168 64.9%
American Indian 0 0.0% 0 0.0% 0 0.0% 0 0.0%
Asian 0 0.0% 0 0.0% 0 0.0% 0 0.0%
Other 0 0.0% 1 0.5% 0 0.0% 1 0.4%
Hispanic 1 1.3% 1 0.5% 0 0.0% 2 0.8%
missing/miscoded 0 0.0% 0 0.0% 1 100.0% 1 0.4%
Total 76 100.0% 182 100.0% 1 100.0% 259 100.0%
Race and Gender
Female Male Missing/Miscoded Total
Frequency %
7 and Under 0 0.0%
8 1 0.4%
9 0 0.0%
10 2 0.8%
11 9 3.5%
12 21 8.1%
13 25 9.7%
14 39 15.1%
15 48 18.5%
16 48 18.5%
17 64 24.7%
18 2 0.8%
19 and over 0 0.0%
missing/miscoded 0 0.0%
Total 259 100.0%
Age at Intake
Frequencies
Court Sanctions
Detention 4
Training School1
13
Certification 1
Supervision
Formal Probation 85
Informal Probation 3
Fine 1
Restitution 20
Community Service 4
2 Data provided by the Mississippi
Department of Human Services (MDHS),
Division of Youth Services (DYS).
1 Data Source: MYCIDS.
Post-Disposition Sanctions, Programs,
and Services by Case1

62
Lauderdale County (38)
Frequency %
Formally Petitioned 587 71.2%
Diverted* 234 28.4%
Referred to Drug Court 0 0.0%
No Order Issued 4 0.5%
Total 825 100.0%
Intake Decisions
* Diverted: informal adjustment ordered, take no
action ordered, child warned or counseled
informally, MDHS monitor child or family
informally, parens warned or counseled
Total Youth Total Cases Total Referrals
369 521 825
Frequency %
contempt of court 147 17.8%
disorderly conduct 108 13.1%
simple assault 107 13.0%
CHINS/run away 86 10.4%
burglary 71 8.6%
malicious mischief 64 7.8%
shoplifting 47 5.7%
domestic violence 41 5.0%
drug offenses 31 3.8%
petit larceny 22 2.7%
All other categories 101 12.2%
Total 825 100.0%
Top 10 Offense Categories
Frequency % Frequency % Frequency % Frequency %
White 36 30.3% 59 23.7% 0 0.0% 95 25.7%
Black 79 66.4% 185 74.3% 0 0.0% 264 71.5%
American Indian 0 0.0% 1 0.4% 0 0.0% 1 0.3%
Asian 1 0.8% 0 0.0% 0 0.0% 1 0.3%
Other 2 1.7% 3 1.2% 0 0.0% 5 1.4%
Hispanic 1 0.8% 1 0.4% 0 0.0% 2 0.5%
missing/miscoded 0 0.0% 0 0.0% 1 100.0% 1 0.3%
Total 119 100.0% 249 100.0% 1 100.0% 369 100.0%
Race and Gender
Female Male Missing/Miscoded Total
Frequency %
7 and Under 0 0.0%
8 0 0.0%
9 0 0.0%
10 1 0.3%
11 5 1.4%
12 15 4.1%
13 27 7.3%
14 48 13.0%
15 67 18.2%
16 84 22.8%
17 107 29.0%
18 12 3.3%
19 and over 3 0.8%
missing/miscoded 0 0.0%
Total 369 100.0%
Age at Intake
Frequencies
Court Sanctions
Detention 9
Training School1
9
Certification 0
Supervision
Formal Probation 144
Informal Probation 1
Fine 1
Restitution 48
Community Service 13
2 Data provided by the Mississippi
Department of Human Services (MDHS),
Division of Youth Services (DYS).
1 Data Source: MYCIDS.
Post-Disposition Sanctions, Programs,
and Services by Case1

63
Lawrence County (39)
Frequency %
Formally Petitioned 49 86.0%
Diverted* 8 14.0%
Referred to Drug Court 0 0.0%
No Order Issued 0 0.0%
Total 57 100.0%
Intake Decisions
* Diverted: informal adjustment ordered, take no
action ordered, child warned or counseled
informally, MDHS monitor child or family
informally, parens warned or counseled
Total Youth Total Cases Total Referrals
42 47 57
Frequency %
contempt of court 11 19.3%
disorderly conduct 11 19.3%
burglary 7 12.3%
drug offenses 5 8.8%
CHINS/run away 3 5.3%
weapons offenses 2 3.5%
grand larceny 2 3.5%
other 2 3.5%
malicious mischief 2 3.5%
harassment 1 1.8%
All other categories 11 19.3%
Total 57 100.0%
Top 10 Offense Categories
Frequency % Frequency % Frequency % Frequency %
White 13 72.2% 7 30.4% 0 0.0% 20 47.6%
Black 5 27.8% 16 69.6% 0 0.0% 21 50.0%
American Indian 0 0.0% 0 0.0% 0 0.0% 0 0.0%
Asian 0 0.0% 0 0.0% 0 0.0% 0 0.0%
Other 0 0.0% 0 0.0% 0 0.0% 0 0.0%
Hispanic 0 0.0% 0 0.0% 0 0.0% 0 0.0%
missing/miscoded 0 0.0% 0 0.0% 1 100.0% 1 2.4%
Total 18 100.0% 23 100.0% 1 100.0% 42 100.0%
Race and Gender
Female Male Missing/Miscoded Total
Frequency %
7 and Under 1 2.4%
8 0 0.0%
9 0 0.0%
10 0 0.0%
11 0 0.0%
12 0 0.0%
13 3 7.1%
14 5 11.9%
15 9 21.4%
16 12 28.6%
17 12 28.6%
18 0 0.0%
19 and over 0 0.0%
missing/miscoded 0 0.0%
Total 42 100.0%
Age at Intake
Frequencies
Court Sanctions
Detention 0
Training School1
0
Certification 0
Supervision
Formal Probation 12
Informal Probation 1
Fine 2
Restitution 0
Community Service 0
2 Data provided by the Mississippi
Department of Human Services (MDHS),
Division of Youth Services (DYS).
1 Data Source: MYCIDS.
Post-Disposition Sanctions, Programs,
and Services by Case1

64
Leake County (40)
Frequency %
Formally Petitioned 0 0.0%
Diverted* 0 0.0%
Referred to Drug Court 0 0.0%
No Order Issued 12 100.0%
Total 12 100.0%
Intake Decisions
* Diverted: informal adjustment ordered, take no
action ordered, child warned or counseled
informally, MDHS monitor child or family
informally, parens warned or counseled
Total Youth Total Cases Total Referrals
9 12 12
Frequency % Frequency % Frequency % Frequency %
White 0 0.0% 0 0.0% 0 0.0% 0 0.0%
Black 1 100.0% 6 85.7% 0 0.0% 7 77.8%
American Indian 0 0.0% 1 14.3% 0 0.0% 1 11.1%
Asian 0 0.0% 0 0.0% 0 0.0% 0 0.0%
Other 0 0.0% 0 0.0% 0 0.0% 0 0.0%
Hispanic 0 0.0% 0 0.0% 0 0.0% 0 0.0%
missing/miscoded 0 0.0% 0 0.0% 1 100.0% 1 11.1%
Total 1 100.0% 7 100.0% 1 100.0% 9 100.0%
Race and Gender
Female Male Missing/Miscoded Total
Frequency %
7 and Under 0 0.0%
8 0 0.0%
9 0 0.0%
10 0 0.0%
11 0 0.0%
12 0 0.0%
13 1 11.1%
14 1 11.1%
15 0 0.0%
16 2 22.2%
17 4 44.4%
18 0 0.0%
19 and over 0 0.0%
missing/miscoded 1 11.1%
Total 9 100.0%
Age at Intake
Frequency %
missing/miscoded 12 100.0%
Total 12 0.0%
Offense Categories
Frequencies
Court Sanctions
Detention 0
Training School1
2
Certification 0
Supervision
Formal Probation 0
Informal Probation 0
Fine 0
Restitution 0
Community Service 0
2 Data provided by the Mississippi
Department of Human Services (MDHS),
Division of Youth Services (DYS).
1 Data Source: MYCIDS.
Post-Disposition Sanctions, Programs,
and Services by Case1

65
Lee County (41)
Frequency %
Formally Petitioned 218 23.8%
Diverted* 399 43.5%
Referred to Drug Court 0 0.0%
No Order Issued 300 32.7%
Total 917 100.0%
Intake Decisions
* Diverted: informal adjustment ordered, take no
action ordered, child warned or counseled
informally, MDHS monitor child or family
informally, parens warned or counseled
Total Youth Total Cases Total Referrals
498 567 917
Frequency %
disorderly conduct 153 16.7%
contempt of court 135 14.7%
shoplifting 93 10.1%
simple assault 85 9.3%
drug offenses 67 7.3%
CHINS/run away 59 6.4%
burglary 54 5.9%
malicious mischief 45 4.9%
alcohol offenses 43 4.7%
domestic violence 39 4.3%
All other categories 144 15.7%
Total 917 100.0%
Top 10 Offense Categories
Frequency % Frequency % Frequency % Frequency %
White 69 35.9% 108 35.4% 0 0.0% 177 35.5%
Black 119 62.0% 193 63.3% 0 0.0% 312 62.7%
American Indian 0 0.0% 0 0.0% 0 0.0% 0 0.0%
Asian 0 0.0% 0 0.0% 0 0.0% 0 0.0%
Other 2 1.0% 1 0.3% 0 0.0% 3 0.6%
Hispanic 2 1.0% 3 1.0% 0 0.0% 5 1.0%
missing/miscoded 0 0.0% 0 0.0% 1 100.0% 1 0.2%
Total 192 100.0% 305 100.0% 1 100.0% 498 100.0%
Race and Gender
Female Male Missing/Miscoded Total
Frequency %
7 and Under 2 0.4%
8 0 0.0%
9 0 0.0%
10 3 0.6%
11 5 1.0%
12 32 6.4%
13 46 9.2%
14 73 14.7%
15 99 19.9%
16 117 23.5%
17 121 24.3%
18 0 0.0%
19 and over 0 0.0%
missing/miscoded 0 0.0%
Total 498 100.0%
Age at Intake
Frequencies
Court Sanctions
Detention 50
Training School1
0
Certification 0
Supervision
Formal Probation 9
Informal Probation 0
Fine 1
Restitution 1
Community Service 0
2 Data provided by the Mississippi
Department of Human Services (MDHS),
Division of Youth Services (DYS).
1 Data Source: MYCIDS.
Post-Disposition Sanctions, Programs,
and Services by Case1

66
Leflore County (42)
Frequency %
Formally Petitioned 162 56.3%
Diverted* 116 40.3%
Referred to Drug Court 0 0.0%
No Order Issued 10 3.5%
Total 288 100.0%
Intake Decisions
* Diverted: informal adjustment ordered, take no
action ordered, child warned or counseled
informally, MDHS monitor child or family
informally, parens warned or counseled
Total Youth Total Cases Total Referrals
163 221 288
Frequency %
simple assault 50 17.4%
disorderly conduct 42 14.6%
contempt of court 40 13.9%
domestic violence 38 13.2%
CHINS/run away 23 8.0%
burglary 11 3.8%
drug offenses 11 3.8%
malicious mischief 10 3.5%
weapons offenses 9 3.1%
shoplifting 7 2.4%
All other categories 47 16.3%
Total 288 100.0%
Top 10 Offense Categories
Frequency % Frequency % Frequency % Frequency %
White 7 13.5% 13 12.5% 1 14.3% 21 12.9%
Black 45 86.5% 90 86.5% 1 14.3% 136 83.4%
American Indian 0 0.0% 0 0.0% 0 0.0% 0 0.0%
Asian 0 0.0% 1 1.0% 0 0.0% 1 0.6%
Other 0 0.0% 0 0.0% 0 0.0% 0 0.0%
Hispanic 0 0.0% 0 0.0% 0 0.0% 0 0.0%
missing/miscoded 0 0.0% 0 0.0% 5 71.4% 5 3.1%
Total 52 100.0% 104 100.0% 7 100.0% 163 100.0%
Race and Gender
Female Male Missing/Miscoded Total
Frequency %
7 and Under 1 0.6%
8 0 0.0%
9 0 0.0%
10 2 1.2%
11 3 1.8%
12 8 4.9%
13 13 8.0%
14 24 14.7%
15 31 19.0%
16 33 20.2%
17 42 25.8%
18 1 0.6%
19 and over 0 0.0%
missing/miscoded 5 3.1%
Total 163 100.0%
Age at Intake
Frequencies
Court Sanctions
Detention 10
Training School1
5
Certification 0
Supervision
Formal Probation 48
Informal Probation 0
Fine 1
Restitution 0
Community Service 0
2 Data provided by the Mississippi
Department of Human Services (MDHS),
Division of Youth Services (DYS).
1 Data Source: MYCIDS.
Post-Disposition Sanctions, Programs,
and Services by Case1

67
Lincoln County (43)
Frequency %
Formally Petitioned 112 94.1%
Diverted* 7 5.9%
Referred to Drug Court 0 0.0%
No Order Issued 0 0.0%
Total 119 100.0%
Intake Decisions
* Diverted: informal adjustment ordered, take no
action ordered, child warned or counseled
informally, MDHS monitor child or family
informally, parens warned or counseled
Total Youth Total Cases Total Referrals
67 84 119
Frequency %
burglary 20 16.8%
petit larceny 17 14.3%
simple assault 14 11.8%
drug offenses 11 9.2%
disorderly conduct 9 7.6%
CHINS/run away 9 7.6%
contempt of court 8 6.7%
grand larceny 7 5.9%
weapons offenses 5 4.2%
malicious mischief 5 4.2%
All other categories 14 11.8%
Total 119 100.0%
Top 10 Offense Categories
Frequency % Frequency % Frequency % Frequency %
White 11 78.6% 13 25.5% 0 0.0% 24 35.8%
Black 3 21.4% 36 70.6% 0 0.0% 39 58.2%
American Indian 0 0.0% 0 0.0% 0 0.0% 0 0.0%
Asian 0 0.0% 0 0.0% 0 0.0% 0 0.0%
Other 0 0.0% 2 3.9% 0 0.0% 2 3.0%
Hispanic 0 0.0% 0 0.0% 0 0.0% 0 0.0%
missing/miscoded 0 0.0% 0 0.0% 2 100.0% 2 3.0%
Total 14 100.0% 51 100.0% 2 100.0% 67 100.0%
Race and Gender
Female Male Missing/Miscoded Total
Frequency %
7 and Under 0 0.0%
8 0 0.0%
9 0 0.0%
10 3 4.5%
11 2 3.0%
12 4 6.0%
13 3 4.5%
14 8 11.9%
15 12 17.9%
16 22 32.8%
17 10 14.9%
18 1 1.5%
19 and over 0 0.0%
missing/miscoded 2 3.0%
Total 67 100.0%
Age at Intake
Frequencies
Court Sanctions
Detention 0
Training School1
2
Certification 0
Supervision
Formal Probation 3
Informal Probation 11
Fine 2
Restitution 2
Community Service 1
2 Data provided by the Mississippi
Department of Human Services (MDHS),
Division of Youth Services (DYS).
1 Data Source: MYCIDS.
Post-Disposition Sanctions, Programs,
and Services by Case1

68
Lowndes County (44)
Frequency %
Formally Petitioned 161 44.0%
Diverted* 196 53.6%
Referred to Drug Court 0 0.0%
No Order Issued 9 2.5%
Total 366 100.0%
Intake Decisions
* Diverted: informal adjustment ordered, take no
action ordered, child warned or counseled
informally, MDHS monitor child or family
informally, parens warned or counseled
Total Youth Total Cases Total Referrals
239 270 366
Frequency %
disorderly conduct 117 32.0%
burglary 43 11.7%
shoplifting 38 10.4%
simple assault 30 8.2%
drug offenses 25 6.8%
domestic violence 19 5.2%
malicious mischief 19 5.2%
alcohol offenses 14 3.8%
contempt of court 12 3.3%
fraud 8 2.2%
All other categories 41 11.2%
Total 366 100.0%
Top 10 Offense Categories
Frequency % Frequency % Frequency % Frequency %
White 13 16.7% 37 23.6% 0 0.0% 50 20.9%
Black 64 82.1% 120 76.4% 0 0.0% 184 77.0%
American Indian 0 0.0% 0 0.0% 0 0.0% 0 0.0%
Asian 0 0.0% 0 0.0% 0 0.0% 0 0.0%
Other 0 0.0% 0 0.0% 0 0.0% 0 0.0%
Hispanic 0 0.0% 0 0.0% 0 0.0% 0 0.0%
missing/miscoded 1 1.3% 0 0.0% 4 100.0% 5 2.1%
Total 78 100.0% 157 100.0% 4 100.0% 239 100.0%
Race and Gender
Female Male Missing/Miscoded Total
Frequency %
7 and Under 0 0.0%
8 0 0.0%
9 0 0.0%
10 1 0.4%
11 0 0.0%
12 3 1.3%
13 21 8.8%
14 33 13.8%
15 51 21.3%
16 65 27.2%
17 58 24.3%
18 3 1.3%
19 and over 0 0.0%
missing/miscoded 4 1.7%
Total 239 100.0%
Age at Intake
Frequencies
Court Sanctions
Detention 8
Training School1
0
Certification 0
Supervision
Formal Probation 0
Informal Probation 0
Fine 0
Restitution 0
Community Service 0
2 Data provided by the Mississippi
Department of Human Services (MDHS),
Division of Youth Services (DYS).
1 Data Source: MYCIDS.
Post-Disposition Sanctions, Programs,
and Services by Case1

69
Madison County (45)
Frequency %
Formally Petitioned 409 85.4%
Diverted* 43 9.0%
Referred to Drug Court 0 0.0%
No Order Issued 27 5.6%
Total 479 100.0%
Intake Decisions
* Diverted: informal adjustment ordered, take no
action ordered, child warned or counseled
informally, MDHS monitor child or family
informally, parens warned or counseled
Total Youth Total Cases Total Referrals
312 393 479
Frequency % Frequency % Frequency % Frequency %
White 17 29.3% 41 16.5% 0 0.0% 58 18.6%
Black 37 63.8% 198 79.5% 1 20.0% 236 75.6%
American Indian 0 0.0% 0 0.0% 0 0.0% 0 0.0%
Asian 0 0.0% 0 0.0% 0 0.0% 0 0.0%
Other 2 3.4% 1 0.4% 0 0.0% 3 1.0%
Hispanic 2 3.4% 8 3.2% 0 0.0% 10 3.2%
missing/miscoded 0 0.0% 1 0.4% 4 80.0% 5 1.6%
Total 58 100.0% 249 100.0% 5 100.0% 312 100.0%
Race and Gender
Female Male Missing/Miscoded Total
Frequency %
7 and Under 0 0.0%
8 0 0.0%
9 0 0.0%
10 0 0.0%
11 1 0.3%
12 2 0.6%
13 18 5.8%
14 29 9.3%
15 54 17.3%
16 89 28.5%
17 115 36.9%
18 3 1.0%
19 and over 0 0.0%
missing/miscoded 1 0.3%
Total 312 100.0%
Age at Intake
Frequency %
shoplifting 97 20.3%
drug offenses 56 11.7%
disorderly conduct 52 10.9%
contempt of court 36 7.5%
domestic violence 35 7.3%
malicious mischief 30 6.3%
simple assault 28 5.8%
burglary 27 5.6%
weapons offenses 24 5.0%
CHINS/run away 19 4.0%
All other categories 75 15.7%
Total 479 100.0%
Top 10 Offense Categories
Frequencies
Court Sanctions
Detention 48
Training School1
16
Certification 0
Supervision
Formal Probation 208
Informal Probation 3
Fine 128
Restitution 11
Community Service 11
2 Data provided by the Mississippi
Department of Human Services (MDHS),
Division of Youth Services (DYS).
1 Data Source: MYCIDS.
Post-Disposition Sanctions, Programs,
and Services by Case1

70
Marion County (46)
Frequency %
Formally Petitioned 218 68.6%
Diverted* 68 21.4%
Referred to Drug Court 0 0.0%
No Order Issued 32 10.1%
Total 318 100.0%
Intake Decisions
* Diverted: informal adjustment ordered, take no
action ordered, child warned or counseled
informally, MDHS monitor child or family
informally, parens warned or counseled
Total Youth Total Cases Total Referrals
111 188 318
Frequency % Frequency % Frequency % Frequency %
White 18 43.9% 27 44.3% 0 0.0% 45 40.5%
Black 21 51.2% 32 52.5% 0 0.0% 53 47.7%
American Indian 0 0.0% 0 0.0% 0 0.0% 0 0.0%
Asian 0 0.0% 0 0.0% 0 0.0% 0 0.0%
Other 0 0.0% 0 0.0% 0 0.0% 0 0.0%
Hispanic 1 2.4% 1 1.6% 0 0.0% 2 1.8%
missing/miscoded 1 2.4% 1 1.6% 9 100.0% 11 9.9%
Total 41 100.0% 61 100.0% 9 100.0% 111 100.0%
Race and Gender
Female Male Missing/Miscoded Total
Frequency %
7 and Under 1 0.9%
8 0 0.0%
9 0 0.0%
10 1 0.9%
11 2 1.8%
12 3 2.7%
13 3 2.7%
14 12 10.8%
15 20 18.0%
16 27 24.3%
17 33 29.7%
18 3 2.7%
19 and over 0 0.0%
missing/miscoded 6 5.4%
Total 111 100.0%
Age at Intake
Frequency %
burglary 93 29.2%
simple assault 52 16.4%
contempt of court 42 13.2%
disorderly conduct 22 6.9%
alcohol offenses 15 4.7%
CHINS/run away 14 4.4%
malicious mischief 14 4.4%
drug offenses 13 4.1%
petit larceny 7 2.2%
other 7 2.2%
All other categories 39 12.3%
Total 318 100.0%
Top 10 Offense Categories
Frequencies
Court Sanctions
Detention 0
Training School1
0
Certification 0
Supervision
Formal Probation 30
Informal Probation 0
Fine 1
Restitution 5
Community Service 0
2 Data provided by the Mississippi
Department of Human Services (MDHS),
Division of Youth Services (DYS).
1 Data Source: MYCIDS.
Post-Disposition Sanctions, Programs,
and Services by Case1

71
Marshall County (47)
Frequency %
Formally Petitioned 121 64.7%
Diverted* 36 19.3%
Referred to Drug Court 0 0.0%
No Order Issued 30 16.0%
Total 187 100.0%
Intake Decisions
* Diverted: informal adjustment ordered, take no
action ordered, child warned or counseled
informally, MDHS monitor child or family
informally, parens warned or counseled
Total Youth Total Cases Total Referrals
118 126 187
Frequency %
7 and Under 0 0.0%
8 1 0.8%
9 2 1.7%
10 1 0.8%
11 2 1.7%
12 5 4.2%
13 12 10.2%
14 14 11.9%
15 14 11.9%
16 32 27.1%
17 35 29.7%
18 0 0.0%
19 and over 0 0.0%
missing/miscoded 0 0.0%
Total 118 100.0%
Age at Intake
Frequency %
simple assault 40 21.4%
burglary 26 13.9%
disorderly conduct 22 11.8%
drug offenses 16 8.6%
petit larceny 10 5.3%
shoplifting 10 5.3%
alcohol offenses 8 4.3%
contempt of court 7 3.7%
other 6 3.2%
domestic violence 5 2.7%
All other categories 37 19.8%
Total 187 100.0%
Top 10 Offense Categories
Frequency % Frequency % Frequency %
White 7 26.9% 21 22.8% 28 23.7%
Black 19 73.1% 68 73.9% 87 73.7%
American Indian 0 0.0% 0 0.0% 0 0.0%
Asian 0 0.0% 0 0.0% 0 0.0%
Other 0 0.0% 1 1.1% 1 0.8%
Hispanic 0 0.0% 2 2.2% 2 1.7%
Total 26 100.0% 92 100.0% 118 100.0%
Female Male Total
Race and Gender
Frequencies
Court Sanctions
Detention 0
Training School1
1
Certification 0
Supervision
Formal Probation 13
Informal Probation 1
Fine 0
Restitution 7
Community Service 0
2 Data provided by the Mississippi
Department of Human Services (MDHS),
Division of Youth Services (DYS).
1 Data Source: MYCIDS.
Post-Disposition Sanctions, Programs,
and Services by Case1

72
Monroe County (48)
Frequency %
Formally Petitioned 43 50.0%
Diverted* 43 50.0%
Referred to Drug Court 0 0.0%
No Order Issued 0 0.0%
Total 86 100.0%
Intake Decisions
* Diverted: informal adjustment ordered, take no
action ordered, child warned or counseled
informally, MDHS monitor child or family
informally, parens warned or counseled
Total Youth Total Cases Total Referrals
72 78 86
Frequency %
7 and Under 0 0.0%
8 0 0.0%
9 0 0.0%
10 0 0.0%
11 0 0.0%
12 5 6.9%
13 11 15.3%
14 14 19.4%
15 7 9.7%
16 13 18.1%
17 18 25.0%
18 2 2.8%
19 and over 0 0.0%
missing/miscoded 2 2.8%
Total 72 100.0%
Age at Intake
Frequency %
simple assault 14 16.3%
petit larceny 10 11.6%
alcohol offenses 10 11.6%
disorderly conduct 10 11.6%
drug offenses 8 9.3%
malicious mischief 8 9.3%
burglary 7 8.1%
grand larceny 4 4.7%
sexual offenses 3 3.5%
domestic violence 3 3.5%
All other categories 9 10.5%
Total 86 100.0%
Top 10 Offense Categories
Frequency % Frequency % Frequency % Frequency %
White 9 45.0% 13 25.5% 0 0.0% 22 30.6%
Black 11 55.0% 37 72.5% 0 0.0% 48 66.7%
American Indian 0 0.0% 0 0.0% 0 0.0% 0 0.0%
Asian 0 0.0% 0 0.0% 0 0.0% 0 0.0%
Other 0 0.0% 0 0.0% 0 0.0% 0 0.0%
Hispanic 0 0.0% 1 2.0% 0 0.0% 1 1.4%
missing/miscoded 0 0.0% 0 0.0% 1 100.0% 1 1.4%
Total 20 100.0% 51 100.0% 1 100.0% 72 100.0%
Race and Gender
Female Male Missing/Miscoded Total
Frequencies
Court Sanctions
Detention 0
Training School1
0
Certification 0
Supervision
Formal Probation 14
Informal Probation 0
Fine 1
Restitution 3
Community Service 7
2 Data provided by the Mississippi
Department of Human Services (MDHS),
Division of Youth Services (DYS).
1 Data Source: MYCIDS.
Post-Disposition Sanctions, Programs,
and Services by Case1

73
Montgomery County (49)
Frequency %
Formally Petitioned 30 46.2%
Diverted* 34 52.3%
Referred to Drug Court 0 0.0%
No Order Issued 1 1.5%
Total 65 100.0%
Intake Decisions
* Diverted: informal adjustment ordered, take no
action ordered, child warned or counseled
informally, MDHS monitor child or family
informally, parens warned or counseled
Total Youth Total Cases Total Referrals
50 55 65
Frequency %
7 and Under 0 0.0%
8 0 0.0%
9 0 0.0%
10 0 0.0%
11 1 2.0%
12 2 4.0%
13 5 10.0%
14 9 18.0%
15 7 14.0%
16 8 16.0%
17 15 30.0%
18 0 0.0%
19 and over 1 2.0%
missing/miscoded 2 4.0%
Total 50 100.0%
Age at Intake
Frequency %
disorderly conduct 20 30.8%
simple assault 12 18.5%
malicious mischief 9 13.8%
shoplifting 5 7.7%
domestic violence 3 4.6%
drug offenses 3 4.6%
petit larceny 2 3.1%
aggravated assault 2 3.1%
CHINS/run away 2 3.1%
ordinance violation 2 3.1%
All other categories 5 7.7%
Total 65 100.0%
Top 10 Offense Categories
Frequency % Frequency % Frequency %
White 1 5.0% 4 13.3% 5 10.0%
Black 19 95.0% 26 86.7% 45 90.0%
American Indian 0 0.0% 0 0.0% 0 0.0%
Asian 0 0.0% 0 0.0% 0 0.0%
Other 0 0.0% 0 0.0% 0 0.0%
Hispanic 0 0.0% 0 0.0% 0 0.0%
Total 20 100.0% 30 100.0% 50 100.0%
Female Male Total
Race and Gender
Frequencies
Court Sanctions
Detention 0
Training School1
0
Certification 0
Supervision
Formal Probation 12
Informal Probation 1
Fine 0
Restitution 6
Community Service 1
2 Data provided by the Mississippi
Department of Human Services (MDHS),
Division of Youth Services (DYS).
1 Data Source: MYCIDS.
Post-Disposition Sanctions, Programs,
and Services by Case1

74
Neshoba County (50)
Frequency %
Formally Petitioned 175 86.6%
Diverted* 22 10.9%
Referred to Drug Court 0 0.0%
No Order Issued 5 2.5%
Total 202 100.0%
Intake Decisions
* Diverted: informal adjustment ordered, take no
action ordered, child warned or counseled
informally, MDHS monitor child or family
informally, parens warned or counseled
Total Youth Total Cases Total Referrals
100 135 202
Frequency %
7 and Under 0 0.0%
8 0 0.0%
9 0 0.0%
10 0 0.0%
11 0 0.0%
12 2 2.0%
13 13 13.0%
14 13 13.0%
15 19 19.0%
16 22 22.0%
17 25 25.0%
18 0 0.0%
19 and over 0 0.0%
missing/miscoded 6 6.0%
Total 100 100.0%
Age at Intake
Frequency %
contempt of court 31 15.3%
simple assault 24 11.9%
drug offenses 21 10.4%
CHINS/run away 20 9.9%
burglary 19 9.4%
domestic violence 16 7.9%
disorderly conduct 16 7.9%
malicious mischief 14 6.9%
petit larceny 9 4.5%
alcohol offenses 6 3.0%
All other categories 26 12.9%
Total 202 100.0%
Top 10 Offense Categories
Frequency % Frequency % Frequency % Frequency %
White 10 33.3% 25 36.2% 0 0.0% 35 35.0%
Black 17 56.7% 42 60.9% 0 0.0% 59 59.0%
American Indian 3 10.0% 2 2.9% 0 0.0% 5 5.0%
Asian 0 0.0% 0 0.0% 0 0.0% 0 0.0%
Other 0 0.0% 0 0.0% 0 0.0% 0 0.0%
Hispanic 0 0.0% 0 0.0% 0 0.0% 0 0.0%
missing/miscoded 0 0.0% 0 0.0% 1 100.0% 1 1.0%
Total 30 100.0% 69 100.0% 1 100.0% 100 100.0%
Race and Gender
Female Male Missing/Miscoded Total
Frequencies
Court Sanctions
Detention 14
Training School1
6
Certification 0
Supervision
Formal Probation 49
Informal Probation 0
Fine 0
Restitution 2
Community Service 0
2 Data provided by the Mississippi
Department of Human Services (MDHS),
Division of Youth Services (DYS).
1 Data Source: MYCIDS.
Post-Disposition Sanctions, Programs,
and Services by Case1

75
Newton County (51)
Frequency %
Formally Petitioned 57 74.0%
Diverted* 20 26.0%
Referred to Drug Court 0 0.0%
No Order Issued 0 0.0%
Total 77 100.0%
Intake Decisions
* Diverted: informal adjustment ordered, take no
action ordered, child warned or counseled
informally, MDHS monitor child or family
informally, parens warned or counseled
Total Youth Total Cases Total Referrals
55 58 77
Frequency %
7 and Under 0 0.0%
8 0 0.0%
9 0 0.0%
10 0 0.0%
11 0 0.0%
12 2 3.6%
13 5 9.1%
14 8 14.5%
15 12 21.8%
16 9 16.4%
17 17 30.9%
18 0 0.0%
19 and over 0 0.0%
missing/miscoded 2 3.6%
Total 55 100.0%
Age at Intake
Frequency %
domestic violence 15 19.5%
simple assault 11 14.3%
disorderly conduct 10 13.0%
burglary 9 11.7%
petit larceny 7 9.1%
drug offenses 6 7.8%
contempt of court 5 6.5%
malicious mischief 5 6.5%
harassment 4 5.2%
weapons offenses 1 1.3%
All other categories 4 5.2%
Total 77 100.0%
Top 10 Offense Categories
Frequency % Frequency % Frequency % Frequency %
White 7 41.2% 20 54.1% 0 0.0% 27 49.1%
Black 9 52.9% 17 45.9% 0 0.0% 26 47.3%
American Indian 0 0.0% 0 0.0% 0 0.0% 0 0.0%
Asian 0 0.0% 0 0.0% 0 0.0% 0 0.0%
Other 0 0.0% 0 0.0% 0 0.0% 0 0.0%
Hispanic 1 5.9% 0 0.0% 0 0.0% 1 1.8%
missing/miscoded 0 0.0% 0 0.0% 1 100.0% 1 1.8%
Total 17 100.0% 37 100.0% 1 100.0% 55 100.0%
Female Male Missing/Miscoded Total
Race and Gender
Frequencies
Court Sanctions
Detention 0
Training School1
2
Certification 0
Supervision
Formal Probation 10
Informal Probation 7
Fine 8
Restitution 2
Community Service 0
2 Data provided by the Mississippi
Department of Human Services (MDHS),
Division of Youth Services (DYS).
1 Data Source: MYCIDS.
Post-Disposition Sanctions, Programs,
and Services by Case1

76
Noxubee County (52)
Frequency %
Formally Petitioned 16 100.0%
Diverted* 0 0.0%
Referred to Drug Court 0 0.0%
No Order Issued 0 0.0%
Total 16 100.0%
Intake Decisions
* Diverted: informal adjustment ordered, take no
action ordered, child warned or counseled
informally, MDHS monitor child or family
informally, parens warned or counseled
Total Youth Total Cases Total Referrals
8 10 16
Frequency %
7 and Under 0 0.0%
8 0 0.0%
9 0 0.0%
10 0 0.0%
11 0 0.0%
12 0 0.0%
13 0 0.0%
14 1 12.5%
15 4 50.0%
16 1 12.5%
17 1 12.5%
18 0 0.0%
19 and over 1 12.5%
missing/miscoded 0 0.0%
Total 8 100.0%
Age at Intake
Frequency % Frequency % Frequency %
White 0 0.0% 0 0.0% 0 0.0%
Black 3 100.0% 5 100.0% 8 100.0%
American Indian 0 0.0% 0 0.0% 0 0.0%
Asian 0 0.0% 0 0.0% 0 0.0%
Other 0 0.0% 0 0.0% 0 0.0%
Hispanic 0 0.0% 0 0.0% 0 0.0%
Total 3 100.0% 5 100.0% 8 100.0%
Female Male Total
Race and Gender
Frequency %
burglary 7 43.8%
simple assault 4 25.0%
petit larceny 2 12.5%
aggravated assault 1 6.3%
arson 1 6.3%
disorderly conduct 1 6.3%
Total 16 100.0%
Offense Categories
Frequencies
Court Sanctions
Detention 0
Training School1
0
Certification 0
Supervision
Formal Probation 5
Informal Probation 0
Fine 0
Restitution 0
Community Service 0
2 Data provided by the Mississippi
Department of Human Services (MDHS),
Division of Youth Services (DYS).
1 Data Source: MYCIDS.
Post-Disposition Sanctions, Programs,
and Services by Case1

77
Oktibbeha County (53)
Frequency %
Formally Petitioned 36 38.7%
Diverted* 54 58.1%
Referred to Drug Court 0 0.0%
No Order Issued 3 3.2%
Total 93 100.0%
Intake Decisions
* Diverted: informal adjustment ordered, take no
action ordered, child warned or counseled
informally, MDHS monitor child or family
informally, parens warned or counseled
Total Youth Total Cases Total Referrals
72 79 93
Frequency %
7 and Under 0 0.0%
8 0 0.0%
9 0 0.0%
10 0 0.0%
11 1 1.4%
12 1 1.4%
13 5 6.9%
14 3 4.2%
15 14 19.4%
16 21 29.2%
17 24 33.3%
18 3 4.2%
19 and over 0 0.0%
missing/miscoded 0 0.0%
Total 72 100.0%
Age at Intake
Frequency % Frequency % Frequency %
White 4 18.2% 18 36.0% 22 30.6%
Black 18 81.8% 32 64.0% 50 69.4%
American Indian 0 0.0% 0 0.0% 0 0.0%
Asian 0 0.0% 0 0.0% 0 0.0%
Other 0 0.0% 0 0.0% 0 0.0%
Hispanic 0 0.0% 0 0.0% 0 0.0%
Total 22 100.0% 50 100.0% 72 100.0%
Female Male Total
Race and Gender
Frequency %
disorderly conduct 18 19.4%
drug offenses 11 11.8%
malicious mischief 11 11.8%
simple assault 11 11.8%
shoplifting 6 6.5%
alcohol offenses 6 6.5%
contempt of court 5 5.4%
petit larceny 4 4.3%
domestic violence 3 3.2%
grand larceny 3 3.2%
All other categories 15 16.1%
Total 93 100.0%
Top 10 Offense Categories
Frequencies
Court Sanctions
Detention 0
Training School1
0
Certification
Supervision
Formal Probation 2
Informal Probation 6
Fine 0
Restitution 0
Community Service 0
2 Data provided by the Mississippi
Department of Human Services (MDHS),
Division of Youth Services (DYS).
1 Data Source: MYCIDS.
Post-Disposition Sanctions, Programs,
and Services by Case1

78
Panola County (54)
Frequency %
Formally Petitioned 111 40.7%
Diverted* 143 52.4%
Referred to Drug Court 0 0.0%
No Order Issued 19 7.0%
Total 273 100.0%
Intake Decisions
* Diverted: informal adjustment ordered, take no
action ordered, child warned or counseled
informally, MDHS monitor child or family
informally, parens warned or counseled
Total Youth Total Cases Total Referrals
191 212 273
Frequency %
7 and Under 0 0.0%
8 0 0.0%
9 2 1.0%
10 0 0.0%
11 10 5.2%
12 16 8.4%
13 13 6.8%
14 32 16.8%
15 33 17.3%
16 41 21.5%
17 34 17.8%
18 3 1.6%
19 and over 0 0.0%
missing/miscoded 7 3.7%
Total 191 100.0%
Age at Intake
Frequency %
disorderly conduct 111 40.7%
simple assault 29 10.6%
drug offenses 20 7.3%
burglary 14 5.1%
malicious mischief 12 4.4%
weapons offenses 10 3.7%
CHINS/run away 9 3.3%
grand larceny 9 3.3%
petit larceny 7 2.6%
shoplifting 7 2.6%
All other categories 45 16.5%
Total 273 100.0%
Top 10 Offense Categories
Frequency % Frequency % Frequency % Frequency %
White 19 27.1% 31 27.4% 0 0.0% 50 26.2%
Black 47 67.1% 80 70.8% 0 0.0% 127 66.5%
American Indian 0 0.0% 0 0.0% 0 0.0% 0 0.0%
Asian 0 0.0% 0 0.0% 0 0.0% 0 0.0%
Other 0 0.0% 1 0.9% 0 0.0% 1 0.5%
Hispanic 0 0.0% 1 0.9% 0 0.0% 1 0.5%
missing/miscoded 4 5.7% 0 0.0% 8 100.0% 12 6.3%
Total 70 100.0% 113 100.0% 8 100.0% 191 100.0%
Race and Gender
Female Male Missing/Miscoded Total
Frequencies
Court Sanctions
Detention 2
Training School1
1
Certification 0
Supervision
Formal Probation 28
Informal Probation 1
Fine 0
Restitution 2
Community Service 0
2 Data provided by the Mississippi
Department of Human Services (MDHS),
Division of Youth Services (DYS).
1 Data Source: MYCIDS.
Post-Disposition Sanctions, Programs,
and Services by Case1

79
Pearl River County (55)
Frequency %
Formally Petitioned 288 70.1%
Diverted* 115 28.0%
Referred to Drug Court 0 0.0%
No Order Issued 8 1.9%
Total 411 100.0%
Intake Decisions
* Diverted: informal adjustment ordered, take no
action ordered, child warned or counseled
informally, MDHS monitor child or family
informally, parens warned or counseled
Total Youth Total Cases Total Referrals
174 237 411
Frequency %
7 and Under 0 0.0%
8 0 0.0%
9 0 0.0%
10 0 0.0%
11 1 0.6%
12 5 2.9%
13 16 9.2%
14 26 14.9%
15 47 27.0%
16 32 18.4%
17 40 23.0%
18 7 4.0%
19 and over 0 0.0%
missing/miscoded 0 0.0%
Total 174 100.0%
Age at Intake
Frequency %
burglary 87 21.2%
CHINS/run away 80 19.5%
simple assault 54 13.1%
drug offenses 39 9.5%
disorderly conduct 30 7.3%
malicious mischief 24 5.8%
escape from custody 13 3.2%
domestic violence 12 2.9%
alcohol offenses 12 2.9%
shoplifting 11 2.7%
All other categories 49 11.9%
Total 411 100.0%
Top 10 Offense Categories
Frequency % Frequency % Frequency %
White 31 51.7% 69 60.5% 100 57.5%
Black 29 48.3% 38 33.3% 67 38.5%
American Indian 0 0.0% 1 0.9% 1 0.6%
Asian 0 0.0% 0 0.0% 0 0.0%
Other 0 0.0% 0 0.0% 0 0.0%
Hispanic 0 0.0% 6 5.3% 6 3.4%
Total 60 100.0% 114 100.0% 174 100.0%
Female Male Total
Race and Gender
Frequencies
Court Sanctions
Detention 4
Training School1
14
Certification 0
Supervision
Formal Probation 37
Informal Probation 0
Fine 13
Restitution 16
Community Service 25
2 Data provided by the Mississippi
Department of Human Services (MDHS),
Division of Youth Services (DYS).
1 Data Source: MYCIDS.
Post-Disposition Sanctions, Programs,
and Services by Case1
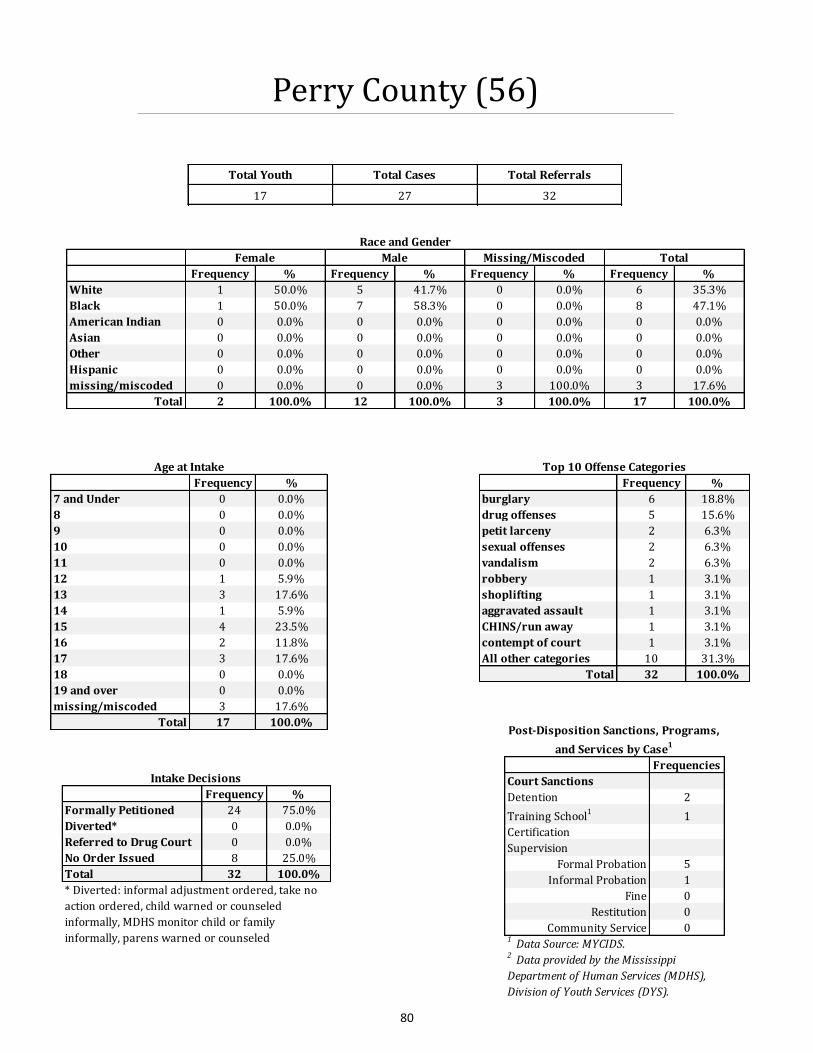
80
Perry County (56)
Frequency %
Formally Petitioned 24 75.0%
Diverted* 0 0.0%
Referred to Drug Court 0 0.0%
No Order Issued 8 25.0%
Total 32 100.0%
Intake Decisions
* Diverted: informal adjustment ordered, take no
action ordered, child warned or counseled
informally, MDHS monitor child or family
informally, parens warned or counseled
Total Youth Total Cases Total Referrals
17 27 32
Frequency %
7 and Under 0 0.0%
8 0 0.0%
9 0 0.0%
10 0 0.0%
11 0 0.0%
12 1 5.9%
13 3 17.6%
14 1 5.9%
15 4 23.5%
16 2 11.8%
17 3 17.6%
18 0 0.0%
19 and over 0 0.0%
missing/miscoded 3 17.6%
Total 17 100.0%
Age at Intake
Frequency %
burglary 6 18.8%
drug offenses 5 15.6%
petit larceny 2 6.3%
sexual offenses 2 6.3%
vandalism 2 6.3%
robbery 1 3.1%
shoplifting 1 3.1%
aggravated assault 1 3.1%
CHINS/run away 1 3.1%
contempt of court 1 3.1%
All other categories 10 31.3%
Total 32 100.0%
Top 10 Offense Categories
Frequency % Frequency % Frequency % Frequency %
White 1 50.0% 5 41.7% 0 0.0% 6 35.3%
Black 1 50.0% 7 58.3% 0 0.0% 8 47.1%
American Indian 0 0.0% 0 0.0% 0 0.0% 0 0.0%
Asian 0 0.0% 0 0.0% 0 0.0% 0 0.0%
Other 0 0.0% 0 0.0% 0 0.0% 0 0.0%
Hispanic 0 0.0% 0 0.0% 0 0.0% 0 0.0%
missing/miscoded 0 0.0% 0 0.0% 3 100.0% 3 17.6%
Total 2 100.0% 12 100.0% 3 100.0% 17 100.0%
Race and Gender
Female Male Missing/Miscoded Total
Frequencies
Court Sanctions
Detention 2
Training School1
1
Certification
Supervision
Formal Probation 5
Informal Probation 1
Fine 0
Restitution 0
Community Service 0
2 Data provided by the Mississippi
Department of Human Services (MDHS),
Division of Youth Services (DYS).
1 Data Source: MYCIDS.
Post-Disposition Sanctions, Programs,
and Services by Case1

81
Pike County (57)
Frequency %
Formally Petitioned 214 66.9%
Diverted* 82 25.6%
Referred to Drug Court 0 0.0%
No Order Issued 24 7.5%
Total 320 100.0%
Intake Decisions
* Diverted: informal adjustment ordered, take no
action ordered, child warned or counseled
informally, MDHS monitor child or family
informally, parens warned or counseled
Total Youth Total Cases Total Referrals
170 236 320
Frequency %
7 and Under 0 0.0%
8 0 0.0%
9 0 0.0%
10 1 0.6%
11 1 0.6%
12 6 3.5%
13 15 8.8%
14 25 14.7%
15 36 21.2%
16 41 24.1%
17 36 21.2%
18 4 2.4%
19 and over 0 0.0%
missing/miscoded 5 2.9%
Total 170 100.0%
Age at Intake
Frequency %
disorderly conduct 75 23.4%
shoplifting 38 11.9%
drug offenses 32 10.0%
simple assault 29 9.1%
domestic violence 21 6.6%
malicious mischief 19 5.9%
CHINS/run away 17 5.3%
burglary 11 3.4%
alcohol offenses 8 2.5%
other 8 2.5%
All other categories 62 19.4%
Total 320 100.0%
Top 10 Offense Categories
Frequency % Frequency % Frequency % Frequency %
White 15 24.6% 26 24.5% 0 0.0% 41 24.1%
Black 45 73.8% 77 72.6% 0 0.0% 122 71.8%
American Indian 0 0.0% 0 0.0% 0 0.0% 0 0.0%
Asian 0 0.0% 0 0.0% 0 0.0% 0 0.0%
Other 0 0.0% 1 0.9% 0 0.0% 1 0.6%
Hispanic 0 0.0% 1 0.9% 0 0.0% 1 0.6%
missing/miscoded 1 1.6% 1 0.9% 3 100.0% 5 2.9%
Total 61 100.0% 106 100.0% 3 100.0% 170 100.0%
Race and Gender
Female Male Missing/Miscoded Total
Frequencies
Court Sanctions
Detention 18
Training School1
6
Certification 0
Supervision
Formal Probation 60
Informal Probation 0
Fine 6
Restitution 3
Community Service 1
2 Data provided by the Mississippi
Department of Human Services (MDHS),
Division of Youth Services (DYS).
1 Data Source: MYCIDS.
Post-Disposition Sanctions, Programs,
and Services by Case1

82
Pontotoc County (58)
Frequency %
Formally Petitioned 73 82.0%
Diverted* 14 15.7%
Referred to Drug Court 0 0.0%
No Order Issued 2 2.2%
Total 89 100.0%
Intake Decisions
* Diverted: informal adjustment ordered, take no
action ordered, child warned or counseled
informally, MDHS monitor child or family
informally, parens warned or counseled
Total Youth Total Cases Total Referrals
58 58 89
Frequency %
7 and Under 0 0.0%
8 0 0.0%
9 0 0.0%
10 0 0.0%
11 1 1.7%
12 1 1.7%
13 1 1.7%
14 8 13.8%
15 9 15.5%
16 20 34.5%
17 16 27.6%
18 2 3.4%
19 and over 0 0.0%
missing/miscoded 0 0.0%
Total 58 100.0%
Age at Intake
Frequency %
burglary 20 22.5%
drug offenses 12 13.5%
disorderly conduct 8 9.0%
grand larceny 8 9.0%
shoplifting 7 7.9%
alcohol offenses 6 6.7%
malicious mischief 6 6.7%
petit larceny 5 5.6%
domestic violence 5 5.6%
CHINS/run away 3 3.4%
All other categories 9 10.1%
Total 89 100.0%
Top 10 Offense Categories
Frequency % Frequency % Frequency %
White 8 0.0% 25 59.5% 33 56.9%
Black 6 0.0% 16 38.1% 22 37.9%
American Indian 0 0.0% 0 0.0% 0 0.0%
Asian 0 0.0% 0 0.0% 0 0.0%
Other 0 0.0% 1 2.4% 1 1.7%
Hispanic 2 0.0% 0 0.0% 2 3.4%
Total 16 0.0% 42 100.0% 58 100.0%
Female Male Total
Race and Gender
Frequencies
Court Sanctions
Detention 0
Training School1
1
Certification 0
Supervision
Formal Probation 16
Informal Probation 0
Fine 0
Restitution 4
Community Service 15
2 Data provided by the Mississippi
Department of Human Services (MDHS),
Division of Youth Services (DYS).
1 Data Source: MYCIDS.
Post-Disposition Sanctions, Programs,
and Services by Case1

83
Prentiss County (59)
Frequency %
Formally Petitioned 23 45.1%
Diverted* 26 51.0%
Referred to Drug Court 0 0.0%
No Order Issued 2 3.9%
Total 51 100.0%
Intake Decisions
* Diverted: informal adjustment ordered, take no
action ordered, child warned or counseled
informally, MDHS monitor child or family
informally, parens warned or counseled
Total Youth Total Cases Total Referrals
33 37 51
Frequency %
7 and Under 0 0.0%
8 0 0.0%
9 0 0.0%
10 0 0.0%
11 2 6.1%
12 3 9.1%
13 0 0.0%
14 4 12.1%
15 7 21.2%
16 4 12.1%
17 12 36.4%
18 1 3.0%
19 and over 0 0.0%
missing/miscoded 0 0.0%
Total 33 100.0%
Age at Intake
Frequency %
disorderly conduct 8 15.7%
simple assault 7 13.7%
malicious mischief 5 9.8%
domestic violence 4 7.8%
burglary 4 7.8%
contempt of court 4 7.8%
drug offenses 4 7.8%
harassment 3 5.9%
grand larceny 2 3.9%
other 2 3.9%
All other categories 8 15.7%
Total 51 100.0%
Top 10 Offense Categories
Frequency % Frequency % Frequency %
White 7 0.0% 14 60.9% 21 63.6%
Black 3 0.0% 9 39.1% 12 36.4%
American Indian 0 0.0% 0 0.0% 0 0.0%
Asian 0 0.0% 0 0.0% 0 0.0%
Other 0 0.0% 0 0.0% 0 0.0%
Hispanic 0 0.0% 0 0.0% 0 0.0%
Total 10 0.0% 23 100.0% 33 100.0%
Female Male Total
Race and Gender
Frequencies
Court Sanctions
Detention 1
Training School1
1
Certification 0
Supervision
Formal Probation 6
Informal Probation 1
Fine 7
Restitution 3
Community Service 4
2 Data provided by the Mississippi
Department of Human Services (MDHS),
Division of Youth Services (DYS).
1 Data Source: MYCIDS.
Post-Disposition Sanctions, Programs,
and Services by Case1

84
Quitman County (60)
Frequency %
Formally Petitioned 18 81.8%
Diverted* 2 9.1%
Referred to Drug Court 0 0.0%
No Order Issued 2 9.1%
Total 22 100.0%
Intake Decisions
* Diverted: informal adjustment ordered, take no
action ordered, child warned or counseled
informally, MDHS monitor child or family
informally, parens warned or counseled
Total Youth Total Cases Total Referrals
17 19 22
Frequency %
7 and Under 0 0.0%
8 0 0.0%
9 0 0.0%
10 0 0.0%
11 0 0.0%
12 0 0.0%
13 0 0.0%
14 1 5.9%
15 5 29.4%
16 5 29.4%
17 4 23.5%
18 1 5.9%
19 and over 0 0.0%
missing/miscoded 1 5.9%
Total 17 100.0%
Age at Intake
Frequency % Frequency % Frequency % Frequency %
White 0 0.0% 15 93.8% 0 0.0% 15 88.2%
Black 0 0.0% 0 0.0% 0 0.0% 0 0.0%
American Indian 0 0.0% 0 0.0% 0 0.0% 0 0.0%
Asian 0 0.0% 0 0.0% 0 0.0% 0 0.0%
Other 0 0.0% 0 0.0% 0 0.0% 0 0.0%
Hispanic 0 0.0% 0 0.0% 0 0.0% 0 0.0%
missing/miscoded 0 0.0% 1 6.3% 1 100.0% 2 11.8%
Total 0 0.0% 16 100.0% 1 100.0% 17 100.0%
Female Male Missing/Miscoded Total
Race and Gender
Frequency %
simple assault 7 31.8%
burglary 4 18.2%
weapons offenses 3 13.6%
domestic violence 2 9.1%
malicious mischief 2 9.1%
contempt of court 1 4.5%
disorderly conduct 1 4.5%
petit<$500 or
grand>$5001 4.5%
missing/miscoded 1 4.5%
Total 22 100.0%
Offense Categories
Frequencies
Court Sanctions
Detention 0
Training School1
2
Certification 0
Supervision
Formal Probation 3
Informal Probation 1
Fine 0
Restitution 0
Community Service 0
2 Data provided by the Mississippi
Department of Human Services (MDHS),
Division of Youth Services (DYS).
1 Data Source: MYCIDS.
Post-Disposition Sanctions, Programs,
and Services by Case1

85
Rankin County (61)
Frequency %
Formally Petitioned 376 42.8%
Diverted* 440 50.1%
Referred to Drug Court 0 0.0%
No Order Issued 63 7.2%
Total 879 100.0%
Intake Decisions
* Diverted: informal adjustment ordered, take no
action ordered, child warned or counseled
informally, MDHS monitor child or family
informally, parens warned or counseled
Total Youth Total Cases Total Referrals
541 715 879
Frequency %
7 and Under 0 0.0%
8 1 0.2%
9 3 0.6%
10 1 0.2%
11 8 1.5%
12 25 4.6%
13 44 8.1%
14 84 15.5%
15 88 16.3%
16 105 19.4%
17 163 30.1%
18 13 2.4%
19 and over 1 0.2%
missing/miscoded 5 0.9%
Total 541 100.0%
Age at Intake
Frequency % Frequency % Frequency % Frequency %
White 118 69.0% 220 60.4% 1 16.7% 339 62.7%
Black 47 27.5% 130 35.7% 0 0.0% 177 32.7%
American Indian 0 0.0% 0 0.0% 0 0.0% 0 0.0%
Asian 1 0.6% 1 0.3% 0 0.0% 2 0.4%
Other 0 0.0% 4 1.1% 0 0.0% 4 0.7%
Hispanic 0 0.0% 0 0.0% 0 0.0% 0 0.0%
missing/miscoded 5 2.9% 9 2.5% 5 83.3% 19 3.5%
Total 171 100.0% 364 100.0% 6 100.0% 541 100.0%
Race and Gender
Female Male Missing/Miscoded Total
Frequency %
domestic violence 138 15.7%
contempt of court 114 13.0%
disorderly conduct 103 11.7%
drug offenses 88 10.0%
simple assault 87 9.9%
malicious mischief 71 8.1%
shoplifting 49 5.6%
burglary 48 5.5%
alcohol offenses 30 3.4%
harassment 22 2.5%
All other categories 129 14.7%
Total 879 100.0%
Top 10 Offense Categories
Frequencies
Court Sanctions
Detention 20
Training School1
1
Certification 0
Supervision
Formal Probation 78
Informal Probation 7
Fine 1
Restitution 0
Community Service 3
2 Data provided by the Mississippi
Department of Human Services (MDHS),
Division of Youth Services (DYS).
1 Data Source: MYCIDS.
Post-Disposition Sanctions, Programs,
and Services by Case1

86
Scott County (62)
Frequency %
Formally Petitioned 88 66.7%
Diverted* 44 33.3%
Referred to Drug Court 0 0.0%
No Order Issued 0 0.0%
Total 132 100.0%
Intake Decisions
* Diverted: informal adjustment ordered, take no
action ordered, child warned or counseled
informally, MDHS monitor child or family
informally, parens warned or counseled
Total Youth Total Cases Total Referrals
86 105 132
Frequency %
7 and Under 2 2.3%
8 0 0.0%
9 0 0.0%
10 0 0.0%
11 3 3.5%
12 3 3.5%
13 5 5.8%
14 9 10.5%
15 22 25.6%
16 18 20.9%
17 18 20.9%
18 6 7.0%
19 and over 0 0.0%
missing/miscoded 0 0.0%
Total 86 100.0%
Age at Intake
Frequency % Frequency % Frequency % Frequency %
White 0 0.0% 10 18.5% 0 0.0% 10 11.6%
Black 26 81.3% 42 77.8% 0 0.0% 68 79.1%
American Indian 1 3.1% 0 0.0% 0 0.0% 1 1.2%
Asian 0 0.0% 0 0.0% 0 0.0% 0 0.0%
Other 0 0.0% 0 0.0% 0 0.0% 0 0.0%
Hispanic 4 12.5% 2 3.7% 0 0.0% 6 7.0%
missing/miscoded 1 3.1% 0 0.0% 0 0.0% 1 1.2%
Total 32 100.0% 54 100.0% 0 0.0% 86 100.0%
Race and Gender
Female Male Missing/Miscoded Total
Frequency %
simple assault 37 28.0%
disorderly conduct 18 13.6%
burglary 14 10.6%
malicious mischief 11 8.3%
petit larceny 10 7.6%
shoplifting 9 6.8%
domestic violence 8 6.1%
drug offenses 6 4.5%
CHINS/run away 5 3.8%
grand larceny 3 2.3%
All other categories 11 8.3%
Total 132 100.0%
Top 10 Offense Categories
Frequencies
Court Sanctions
Detention 1
Training School1
2
Certification 0
Supervision
Formal Probation 10
Informal Probation 0
Fine 8
Restitution 6
Community Service 0
2 Data provided by the Mississippi
Department of Human Services (MDHS),
Division of Youth Services (DYS).
1 Data Source: MYCIDS.
Post-Disposition Sanctions, Programs,
and Services by Case1

87
Sharkey County (63)
Total Youth Total Cases Total Referrals
25 25 25
Frequency %
7 and Under 0 0.0%
8 0 0.0%
9 0 0.0%
10 0 0.0%
11 2 8.0%
12 2 8.0%
13 3 12.0%
14 1 4.0%
15 8 32.0%
16 4 16.0%
17 5 20.0%
18 0 0.0%
19 and over 0 0.0%
missing/miscoded 0 0.0%
Total 25 100.0%
Age at Intake
Frequency % Frequency % Frequency %
White 0 0.0% 5 26.3% 5 20.0%
Black 6 100.0% 14 73.7% 20 80.0%
American Indian 0 0.0% 0 0.0% 0 0.0%
Asian 0 0.0% 0 0.0% 0 0.0%
Other 0 0.0% 0 0.0% 0 0.0%
Hispanic 0 0.0% 0 0.0% 0 0.0%
Total 6 100.0% 19 100.0% 25 100.0%
Female Male Total
Race and Gender
Frequency %
contempt of court 10 40.0%
simple assault 7 28.0%
burglary 3 12.0%
CHINS/run away 2 8.0%
disorderly conduct 2 8.0%
petit larceny 1 4.0%
Total 25 100.0%
Offense Categories
Frequencies
Court Sanctions
Detention 5
Training School1
2
Certification 0
Supervision
Formal Probation 2
Informal Probation 0
Fine 0
Restitution 1
Community Service 0
2 Data provided by the Mississippi
Department of Human Services (MDHS),
Division of Youth Services (DYS).
1 Data Source: MYCIDS.
Post-Disposition Sanctions, Programs,
and Services by Case1

88
Simpson County (64)
Frequency %
Formally Petitioned 107 98.2%
Diverted* 0 0.0%
Referred to Drug Court 0 0.0%
No Order Issued 2 1.8%
Total 109 100.0%
Intake Decisions
* Diverted: informal adjustment ordered, take no
action ordered, child warned or counseled
informally, MDHS monitor child or family
informally, parens warned or counseled
Total Youth Total Cases Total Referrals
92 104 109
Frequency %
7 and Under 1 1.1%
8 1 1.1%
9 0 0.0%
10 0 0.0%
11 2 2.2%
12 6 6.5%
13 5 5.4%
14 6 6.5%
15 20 21.7%
16 22 23.9%
17 21 22.8%
18 1 1.1%
19 and over 0 0.0%
missing/miscoded 7 7.6%
Total 92 100.0%
Age at Intake
Frequency % Frequency % Frequency % Frequency %
White 6 21.4% 24 48.0% 0 0.0% 30 32.6%
Black 22 78.6% 26 52.0% 0 0.0% 48 52.2%
American Indian 0 0.0% 0 0.0% 0 0.0% 0 0.0%
Asian 0 0.0% 0 0.0% 0 0.0% 0 0.0%
Other 0 0.0% 0 0.0% 0 0.0% 0 0.0%
Hispanic 0 0.0% 0 0.0% 0 0.0% 0 0.0%
missing/miscoded 0 0.0% 0 0.0% 14 100.0% 14 15.2%
Total 28 100.0% 50 100.0% 14 100.0% 92 100.0%
Race and Gender
Female Male Missing/Miscoded Total
Frequency %
simple assault 35 32.1%
CHINS/run away 11 10.1%
burglary 9 8.3%
disorderly conduct 8 7.3%
contempt of court 7 6.4%
sexual offenses 6 5.5%
malicious mischief 6 5.5%
petit<$500 or
grand>$5006 5.5%
domestic violence 3 2.8%
weapons offenses 3 2.8%
All other categories 15 13.8%
Total 109 100.0%
Top 10 Offense Categories
Frequencies
Court Sanctions
Detention 2
Training School1
1
Certification 0
Supervision
Formal Probation 5
Informal Probation 0
Fine 9
Restitution 3
Community Service 1
2 Data provided by the Mississippi
Department of Human Services (MDHS),
Division of Youth Services (DYS).
1 Data Source: MYCIDS.
Post-Disposition Sanctions, Programs,
and Services by Case1
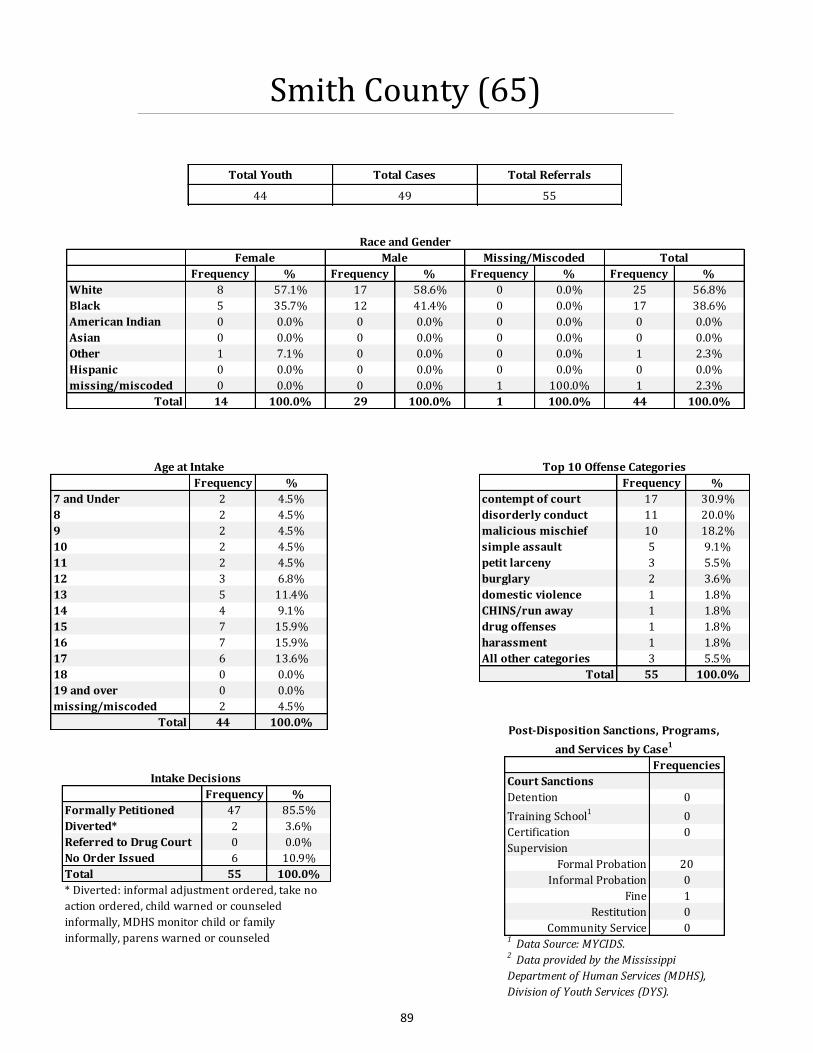
89
Smith County (65)
Frequency %
Formally Petitioned 47 85.5%
Diverted* 2 3.6%
Referred to Drug Court 0 0.0%
No Order Issued 6 10.9%
Total 55 100.0%
Intake Decisions
* Diverted: informal adjustment ordered, take no
action ordered, child warned or counseled
informally, MDHS monitor child or family
informally, parens warned or counseled
Total Youth Total Cases Total Referrals
44 49 55
Frequency %
7 and Under 2 4.5%
8 2 4.5%
9 2 4.5%
10 2 4.5%
11 2 4.5%
12 3 6.8%
13 5 11.4%
14 4 9.1%
15 7 15.9%
16 7 15.9%
17 6 13.6%
18 0 0.0%
19 and over 0 0.0%
missing/miscoded 2 4.5%
Total 44 100.0%
Age at Intake
Frequency % Frequency % Frequency % Frequency %
White 8 57.1% 17 58.6% 0 0.0% 25 56.8%
Black 5 35.7% 12 41.4% 0 0.0% 17 38.6%
American Indian 0 0.0% 0 0.0% 0 0.0% 0 0.0%
Asian 0 0.0% 0 0.0% 0 0.0% 0 0.0%
Other 1 7.1% 0 0.0% 0 0.0% 1 2.3%
Hispanic 0 0.0% 0 0.0% 0 0.0% 0 0.0%
missing/miscoded 0 0.0% 0 0.0% 1 100.0% 1 2.3%
Total 14 100.0% 29 100.0% 1 100.0% 44 100.0%
Race and Gender
Female Male Missing/Miscoded Total
Frequency %
contempt of court 17 30.9%
disorderly conduct 11 20.0%
malicious mischief 10 18.2%
simple assault 5 9.1%
petit larceny 3 5.5%
burglary 2 3.6%
domestic violence 1 1.8%
CHINS/run away 1 1.8%
drug offenses 1 1.8%
harassment 1 1.8%
All other categories 3 5.5%
Total 55 100.0%
Top 10 Offense Categories
Frequencies
Court Sanctions
Detention 0
Training School1
0
Certification 0
Supervision
Formal Probation 20
Informal Probation 0
Fine 1
Restitution 0
Community Service 0
2 Data provided by the Mississippi
Department of Human Services (MDHS),
Division of Youth Services (DYS).
1 Data Source: MYCIDS.
Post-Disposition Sanctions, Programs,
and Services by Case1

90
Stone County (66)
Frequency %
Formally Petitioned 35 79.5%
Diverted* 5 11.4%
Referred to Drug Court 0 0.0%
No Order Issued 4 9.1%
Total 44 100.0%
Intake Decisions
* Diverted: informal adjustment ordered, take no
action ordered, child warned or counseled
informally, MDHS monitor child or family
informally, parens warned or counseled
Total Youth Total Cases Total Referrals
32 37 44
Frequency %
7 and Under 0 0.0%
8 0 0.0%
9 1 3.1%
10 0 0.0%
11 2 6.3%
12 1 3.1%
13 1 3.1%
14 4 12.5%
15 2 6.3%
16 8 25.0%
17 9 28.1%
18 0 0.0%
19 and over 0 0.0%
missing/miscoded 4 12.5%
Total 32 100.0%
Age at Intake
Frequency % Frequency % Frequency % Frequency %
White 1 16.7% 11 47.8% 0 0.0% 12 37.5%
Black 5 83.3% 7 30.4% 0 0.0% 12 37.5%
American Indian 0 0.0% 0 0.0% 0 0.0% 0 0.0%
Asian 0 0.0% 0 0.0% 0 0.0% 0 0.0%
Other 0 0.0% 0 0.0% 0 0.0% 0 0.0%
Hispanic 0 0.0% 0 0.0% 0 0.0% 0 0.0%
missing/miscoded 0 0.0% 5 21.7% 3 100.0% 8 25.0%
Total 6 100.0% 23 100.0% 3 100.0% 32 100.0%
Race and Gender
Female Male Missing/Miscoded Total
Frequency %
burglary 7 15.9%
petit<$500 or
grand>$5006
13.6%
grand larceny 4 9.1%
simple assault 4 9.1%
domestic violence 3 6.8%
CHINS/run away 3 6.8%
drug offenses 3 6.8%
malicious mischief 3 6.8%
petit larceny 2 4.5%
shoplifting 2 4.5%
All other categories 7 15.9%
Total 44 100.0%
Top 10 Offense Categories
Frequencies
Court Sanctions
Detention 0
Training School1
1
Certification 0
Supervision
Formal Probation 3
Informal Probation 0
Fine 0
Restitution 0
Community Service 0
2 Data provided by the Mississippi
Department of Human Services (MDHS),
Division of Youth Services (DYS).
1 Data Source: MYCIDS.
Post-Disposition Sanctions, Programs,
and Services by Case1

91
Sunflower County (67)
Frequency %
Formally Petitioned 562 89.1%
Diverted* 64 10.1%
Referred to Drug Court 0 0.0%
No Order Issued 5 0.8%
Total 631 100.0%
Intake Decisions
* Diverted: informal adjustment ordered, take no
action ordered, child warned or counseled
informally, MDHS monitor child or family
informally, parens warned or counseled
Total Youth Total Cases Total Referrals
222 439 631
Frequency %
7 and Under 0 0.0%
8 0 0.0%
9 3 1.4%
10 2 0.9%
11 10 4.5%
12 13 5.9%
13 12 5.4%
14 28 12.6%
15 33 14.9%
16 55 24.8%
17 56 25.2%
18 3 1.4%
19 and over 0 0.0%
missing/miscoded 7 3.2%
Total 222 100.0%
Age at Intake
Frequency % Frequency % Frequency % Frequency %
White 2 2.9% 3 2.0% 0 0.0% 5 2.3%
Black 68 97.1% 145 97.3% 0 0.0% 213 95.9%
American Indian 0 0.0% 0 0.0% 0 0.0% 0 0.0%
Asian 0 0.0% 0 0.0% 0 0.0% 0 0.0%
Other 0 0.0% 0 0.0% 0 0.0% 0 0.0%
Hispanic 0 0.0% 1 0.7% 0 0.0% 1 0.5%
missing/miscoded 0 0.0% 0 0.0% 3 100.0% 3 1.4%
Total 70 100.0% 149 100.0% 3 100.0% 222 100.0%
Race and Gender
Female Male Missing/Miscoded Total
Frequency %
contempt of court 152 24.1%
simple assault 92 14.6%
CHINS/run away 91 14.4%
disorderly conduct 75 11.9%
malicious mischief 44 7.0%
shoplifting 36 5.7%
burglary 32 5.1%
drug offenses 30 4.8%
petit larceny 12 1.9%
domestic violence 9 1.4%
All other categories 58 9.2%
Total 631 100.0%
Top 10 Offense Categories
Frequencies
Court Sanctions
Detention 2
Training School1
6
Certification 0
Supervision
Formal Probation 104
Informal Probation 29
Fine 0
Restitution 8
Community Service 0
2 Data provided by the Mississippi
Department of Human Services (MDHS),
Division of Youth Services (DYS).
1 Data Source: MYCIDS.
Post-Disposition Sanctions, Programs,
and Services by Case1

92
Tallahatchie County (68)
Frequency %
Formally Petitioned 33 78.6%
Diverted* 7 16.7%
Referred to Drug Court 0 0.0%
No Order Issued 2 4.8%
Total 42 100.0%
Intake Decisions
* Diverted: informal adjustment ordered, take no
action ordered, child warned or counseled
informally, MDHS monitor child or family
informally, parens warned or counseled
Total Youth Total Cases Total Referrals
26 29 42
Frequency %
7 and Under 0 0.0%
8 0 0.0%
9 0 0.0%
10 1 3.8%
11 0 0.0%
12 2 7.7%
13 1 3.8%
14 6 23.1%
15 4 15.4%
16 6 23.1%
17 4 15.4%
18 0 0.0%
19 and over 0 0.0%
missing/miscoded 2 7.7%
Total 26 100.0%
Age at Intake
Frequency %
burglary 9 21.4%
grand larceny 6 14.3%
disorderly conduct 5 11.9%
drug offenses 5 11.9%
domestic violence 3 7.1%
weapons offenses 2 4.8%
CHINS/run away 2 4.8%
malicious mischief 2 4.8%
shoplifting 1 2.4%
aggravated assault 1 2.4%
All other categories 6 14.3%
Total 42 100.0%
Top 10 Offense Categories
Frequency % Frequency % Frequency %
White 1 20.0% 2 9.5% 3 11.5%
Black 4 80.0% 19 90.5% 23 88.5%
American Indian 0 0.0% 0 0.0% 0 0.0%
Asian 0 0.0% 0 0.0% 0 0.0%
Other 0 0.0% 0 0.0% 0 0.0%
Hispanic 0 0.0% 0 0.0% 0 0.0%
Total 5 100.0% 21 100.0% 26 100.0%
Female Male Total
Race and Gender
Frequencies
Court Sanctions
Detention 0
Training School1
3
Certification 0
Supervision
Formal Probation 7
Informal Probation 0
Fine 0
Restitution 0
Community Service 0
2 Data provided by the Mississippi
Department of Human Services (MDHS),
Division of Youth Services (DYS).
1 Data Source: MYCIDS.
Post-Disposition Sanctions, Programs,
and Services by Case1

93
Tate County (69)
Frequency %
Formally Petitioned 50 66.7%
Diverted* 20 26.7%
Referred to Drug Court 0 0.0%
No Order Issued 5 6.7%
Total 75 100.0%
Intake Decisions
* Diverted: informal adjustment ordered, take no
action ordered, child warned or counseled
informally, MDHS monitor child or family
informally, parens warned or counseled
Total Youth Total Cases Total Referrals
63 65 75
Frequency %
7 and Under 0 0.0%
8 0 0.0%
9 0 0.0%
10 0 0.0%
11 0 0.0%
12 1 1.6%
13 3 4.8%
14 7 11.1%
15 13 20.6%
16 17 27.0%
17 14 22.2%
18 4 6.3%
19 and over 0 0.0%
missing/miscoded 4 6.3%
Total 63 100.0%
Age at Intake
Frequency %
simple assault 20 26.7%
drug offenses 11 14.7%
CHINS/run away 6 8.0%
disorderly conduct 5 6.7%
shoplifting 4 5.3%
contempt of court 4 5.3%
grand larceny 4 5.3%
malicious mischief 4 5.3%
petit larceny 2 2.7%
sexual offenses 2 2.7%
All other categories 13 17.3%
Total 75 100.0%
Top 10 Offense Categories
Frequency % Frequency % Frequency % Frequency %
White 5 25.0% 23 54.8% 0 0.0% 28 44.4%
Black 12 60.0% 18 42.9% 0 0.0% 30 47.6%
American Indian 0 0.0% 0 0.0% 0 0.0% 0 0.0%
Asian 0 0.0% 0 0.0% 0 0.0% 0 0.0%
Other 1 5.0% 1 2.4% 0 0.0% 2 3.2%
Hispanic 1 5.0% 0 0.0% 0 0.0% 1 1.6%
missing/miscoded 1 5.0% 0 0.0% 1 100.0% 2 3.2%
Total 20 100.0% 42 100.0% 1 100.0% 63 100.0%
Race and Gender
Female Male Missing/Miscoded Total
Frequencies
Court Sanctions
Detention 0
Training School1
0
Certification 0
Supervision
Formal Probation 5
Informal Probation 4
Fine 0
Restitution 2
Community Service 0
2 Data provided by the Mississippi
Department of Human Services (MDHS),
Division of Youth Services (DYS).
1 Data Source: MYCIDS.
Post-Disposition Sanctions, Programs,
and Services by Case1

94
Tippah County (70)
Frequency %
Formally Petitioned 40 80.0%
Diverted* 7 14.0%
Referred to Drug Court 0 0.0%
No Order Issued 3 6.0%
Total 50 100.0%
Intake Decisions
* Diverted: informal adjustment ordered, take no
action ordered, child warned or counseled
informally, MDHS monitor child or family
informally, parens warned or counseled
Total Youth Total Cases Total Referrals
32 33 50
Frequency %
7 and Under 0 0.0%
8 0 0.0%
9 0 0.0%
10 0 0.0%
11 0 0.0%
12 1 3.1%
13 3 9.4%
14 6 18.8%
15 9 28.1%
16 6 18.8%
17 7 21.9%
18 0 0.0%
19 and over 0 0.0%
missing/miscoded 0 0.0%
Total 32 100.0%
Age at Intake
Frequency %
simple assault 13 26.0%
ordinance violation 9 18.0%
drug offenses 7 14.0%
alcohol offenses 3 6.0%
disorderly conduct 3 6.0%
malicious mischief 3 6.0%
domestic violence 2 4.0%
burglary 2 4.0%
CHINS/run away 2 4.0%
contempt of court 2 4.0%
All other categories 4 8.0%
Total 50 100.0%
Top 10 Offense Categories
Frequency % Frequency % Frequency %
White 3 75.0% 13 46.4% 16 50.0%
Black 1 25.0% 14 50.0% 15 46.9%
American Indian 0 0.0% 0 0.0% 0 0.0%
Asian 0 0.0% 0 0.0% 0 0.0%
Other 0 0.0% 0 0.0% 0 0.0%
Hispanic 0 0.0% 1 3.6% 1 3.1%
Total 4 100.0% 28 100.0% 32 100.0%
Female Male Total
Race and Gender
Frequencies
Court Sanctions
Detention 0
Training School1
0
Certification 0
Supervision
Formal Probation 2
Informal Probation 1
Fine 4
Restitution 1
Community Service 0
2 Data provided by the Mississippi
Department of Human Services (MDHS),
Division of Youth Services (DYS).
1 Data Source: MYCIDS.
Post-Disposition Sanctions, Programs,
and Services by Case1

95
Tishomingo County (71)
Frequency %
Formally Petitioned 44 69.8%
Diverted* 11 17.5%
Referred to Drug Court 0 0.0%
No Order Issued 8 12.7%
Total 63 100.0%
Intake Decisions
* Diverted: informal adjustment ordered, take no
action ordered, child warned or counseled
informally, MDHS monitor child or family
informally, parens warned or counseled
Total Youth Total Cases Total Referrals
43 50 63
Frequency %
7 and Under 0 0.0%
8 0 0.0%
9 0 0.0%
10 0 0.0%
11 2 4.7%
12 0 0.0%
13 4 9.3%
14 4 9.3%
15 7 16.3%
16 13 30.2%
17 9 20.9%
18 2 4.7%
19 and over 0 0.0%
missing/miscoded 2 4.7%
Total 43 100.0%
Age at Intake
Frequency %
malicious mischief 16 25.4%
drug offenses 10 15.9%
domestic violence 9 14.3%
burglary 5 7.9%
petit larceny 4 6.3%
disorderly conduct 4 6.3%
contempt of court 3 4.8%
harassment 3 4.8%
weapons offenses 2 3.2%
alcohol offenses 2 3.2%
All other categories 5 7.9%
Total 63 100.0%
Top 10 Offense Categories
Frequency % Frequency % Frequency % Frequency %
White 11 100.0% 26 86.7% 0 0.0% 37 86.0%
Black 0 0.0% 1 3.3% 0 0.0% 1 2.3%
American Indian 0 0.0% 0 0.0% 0 0.0% 0 0.0%
Asian 0 0.0% 0 0.0% 0 0.0% 0 0.0%
Other 0 0.0% 0 0.0% 0 0.0% 0 0.0%
Hispanic 0 0.0% 2 6.7% 0 0.0% 2 4.7%
missing/miscoded 0 0.0% 1 3.3% 2 100.0% 3 7.0%
Total 11 100.0% 30 100.0% 2 100.0% 43 100.0%
Race and Gender
Female Male Missing/Miscoded Total
Frequencies
Court Sanctions
Detention 0
Training School1
0
Certification 0
Supervision
Formal Probation 2
Informal Probation 0
Fine 0
Restitution 0
Community Service 0
2 Data provided by the Mississippi
Department of Human Services (MDHS),
Division of Youth Services (DYS).
1 Data Source: MYCIDS.
Post-Disposition Sanctions, Programs,
and Services by Case1

96
Tunica County (72)
Frequency %
Formally Petitioned 129 43.0%
Diverted* 166 55.3%
Referred to Drug Court 0 0.0%
No Order Issued 5 1.7%
Total 300 100.0%
Intake Decisions
* Diverted: informal adjustment ordered, take no
action ordered, child warned or counseled
informally, MDHS monitor child or family
informally, parens warned or counseled
Total Youth Total Cases Total Referrals
191 235 300
Frequency %
7 and Under 2 1.0%
8 1 0.5%
9 3 1.6%
10 6 3.1%
11 6 3.1%
12 4 2.1%
13 22 11.5%
14 23 12.0%
15 38 19.9%
16 37 19.4%
17 39 20.4%
18 2 1.0%
19 and over 1 0.5%
missing/miscoded 7 3.7%
Total 191 100.0%
Age at Intake
Frequency %
simple assault 83 27.7%
disorderly conduct 44 14.7%
domestic violence 39 13.0%
drug offenses 22 7.3%
malicious mischief 22 7.3%
other 20 6.7%
petit larceny 16 5.3%
contempt of court 11 3.7%
weapons offenses 7 2.3%
burglary 7 2.3%
All other categories 29 9.7%
Total 300 100.0%
Top 10 Offense Categories
Frequency % Frequency % Frequency % Frequency %
White 2 2.6% 6 5.6% 0 0.0% 8 4.2%
Black 75 96.2% 102 94.4% 0 0.0% 177 92.7%
American Indian 0 0.0% 0 0.0% 0 0.0% 0 0.0%
Asian 1 1.3% 0 0.0% 0 0.0% 1 0.5%
Other 0 0.0% 0 0.0% 0 0.0% 0 0.0%
Hispanic 0 0.0% 0 0.0% 0 0.0% 0 0.0%
missing/miscoded 0 0.0% 0 0.0% 5 100.0% 5 2.6%
Total 78 100.0% 108 100.0% 5 100.0% 191 100.0%
Race and Gender
Female Male Missing/Miscoded Total
Frequencies
Court Sanctions
Detention 0
Training School1
2
Certification 1
Supervision
Formal Probation 17
Informal Probation 2
Fine 0
Restitution 8
Community Service 2
2 Data provided by the Mississippi
Department of Human Services (MDHS),
Division of Youth Services (DYS).
1 Data Source: MYCIDS.
Post-Disposition Sanctions, Programs,
and Services by Case1

97
Union County (73)
Frequency %
Formally Petitioned 33 80.5%
Diverted* 7 17.1%
Referred to Drug Court 0 0.0%
No Order Issued 1 2.4%
Total 41 100.0%
Intake Decisions
* Diverted: informal adjustment ordered, take no
action ordered, child warned or counseled
informally, MDHS monitor child or family
informally, parens warned or counseled
Total Youth Total Cases Total Referrals
29 31 41
Frequency %
7 and Under 0 0.0%
8 0 0.0%
9 0 0.0%
10 0 0.0%
11 1 3.4%
12 3 10.3%
13 2 6.9%
14 4 13.8%
15 6 20.7%
16 10 34.5%
17 2 6.9%
18 1 3.4%
19 and over 0 0.0%
missing/miscoded 0 0.0%
Total 29 100.0%
Age at Intake
Frequency %
domestic violence 6 14.6%
shoplifting 5 12.2%
drug offenses 4 9.8%
disorderly conduct 3 7.3%
harassment 3 7.3%
simple assault 3 7.3%
petit larceny 2 4.9%
robbery 2 4.9%
alcohol offenses 2 4.9%
contempt of court 2 4.9%
All other categories 9 22.0%
Total 41 100.0%
Top 10 Offense Categories
Frequency % Frequency % Frequency % Frequency %
White 4 40.0% 6 33.3% 0 0.0% 10 34.5%
Black 3 30.0% 10 55.6% 0 0.0% 13 44.8%
American Indian 0 0.0% 0 0.0% 0 0.0% 0 0.0%
Asian 0 0.0% 0 0.0% 0 0.0% 0 0.0%
Other 1 10.0% 0 0.0% 0 0.0% 1 3.4%
Hispanic 2 20.0% 2 11.1% 0 0.0% 4 13.8%
missing/miscoded 0 0.0% 0 0.0% 1 100.0% 1 3.4%
Total 10 100.0% 18 100.0% 1 100.0% 29 100.0%
Race and Gender
Female Male Missing/Miscoded Total
Frequencies
Court Sanctions
Detention 0
Training School1
0
Certification 0
Supervision
Formal Probation 5
Informal Probation 1
Fine 1
Restitution 0
Community Service 4
2 Data provided by the Mississippi
Department of Human Services (MDHS),
Division of Youth Services (DYS).
1 Data Source: MYCIDS.
Post-Disposition Sanctions, Programs,
and Services by Case1

98
Walthall County (74)
Frequency %
Formally Petitioned 77 53.1%
Diverted* 65 44.8%
Referred to Drug Court 0 0.0%
No Order Issued 3 2.1%
Total 145 100.0%
Intake Decisions
* Diverted: informal adjustment ordered, take no
action ordered, child warned or counseled
informally, MDHS monitor child or family
informally, parens warned or counseled
Total Youth Total Cases Total Referrals
96 124 145
Frequency %
7 and Under 0 0.0%
8 0 0.0%
9 1 1.0%
10 3 3.1%
11 2 2.1%
12 6 6.3%
13 9 9.4%
14 20 20.8%
15 18 18.8%
16 21 21.9%
17 12 12.5%
18 4 4.2%
19 and over 0 0.0%
missing/miscoded 0 0.0%
Total 96 100.0%
Age at Intake
Frequency %
disorderly conduct 60 41.4%
simple assault 29 20.0%
domestic violence 11 7.6%
contempt of court 7 4.8%
drug offenses 7 4.8%
hunting violation 6 4.1%
sexual offenses 5 3.4%
weapons offenses 5 3.4%
CHINS/run away 4 2.8%
harassment 4 2.8%
All other categories 7 4.8%
Total 145 100.0%
Top 10 Offense Categories
Frequency % Frequency % Frequency %
White 5 20.8% 26 36.1% 31 32.3%
Black 19 79.2% 46 63.9% 65 67.7%
American Indian 0 0.0% 0 0.0% 0 0.0%
Asian 0 0.0% 0 0.0% 0 0.0%
Other 0 0.0% 0 0.0% 0 0.0%
Hispanic 0 0.0% 0 0.0% 0 0.0%
Total 24 100.0% 72 100.0% 96 100.0%
Female Male Total
Race and Gender
Frequencies
Court Sanctions
Detention 0
Training School1
0
Certification 1
Supervision
Formal Probation 31
Informal Probation 2
Fine 15
Restitution 0
Community Service 28
2 Data provided by the Mississippi
Department of Human Services (MDHS),
Division of Youth Services (DYS).
1 Data Source: MYCIDS.
Post-Disposition Sanctions, Programs,
and Services by Case1

99
Warren County (75)
Frequency %
Formally Petitioned 435 94.4%
Diverted* 22 4.8%
Referred to Drug Court 0 0.0%
No Order Issued 4 0.9%
Total 461 100.0%
Intake Decisions
* Diverted: informal adjustment ordered, take no
action ordered, child warned or counseled
informally, MDHS monitor child or family
informally, parens warned or counseled
Total Youth Total Cases Total Referrals
328 426 461
Frequency %
7 and Under 0 0.0%
8 1 0.3%
9 0 0.0%
10 2 0.6%
11 11 3.4%
12 23 7.0%
13 32 9.8%
14 59 18.0%
15 62 18.9%
16 64 19.5%
17 64 19.5%
18 2 0.6%
19 and over 0 0.0%
missing/miscoded 8 2.4%
Total 328 100.0%
Age at Intake
Frequency %
disorderly conduct 127 27.5%
domestic violence 97 21.0%
simple assault 66 14.3%
contempt of court 38 8.2%
drug offenses 35 7.6%
weapons offenses 17 3.7%
shoplifting 16 3.5%
burglary 13 2.8%
malicious mischief 8 1.7%
CHINS/run away 7 1.5%
All other categories 37 8.0%
Total 461 100.0%
Top 10 Offense Categories
Frequency % Frequency % Frequency % Frequency %
White 26 21.3% 50 25.1% 1 14.3% 77 23.5%
Black 93 76.2% 147 73.9% 0 0.0% 240 73.2%
American Indian 0 0.0% 0 0.0% 0 0.0% 0 0.0%
Asian 0 0.0% 0 0.0% 0 0.0% 0 0.0%
Other 0 0.0% 1 0.5% 0 0.0% 1 0.3%
Hispanic 0 0.0% 1 0.5% 0 0.0% 1 0.3%
missing/miscoded 3 2.5% 0 0.0% 6 85.7% 9 2.7%
Total 122 100.0% 199 100.0% 7 100.0% 328 100.0%
Race and Gender
Female Male Missing/Miscoded Total
Frequencies
Court Sanctions
Detention 0
Training School1
7
Certification 0
Supervision
Formal Probation 111
Informal Probation 22
Fine 0
Restitution 3
Community Service 0
2 Data provided by the Mississippi
Department of Human Services (MDHS),
Division of Youth Services (DYS).
1 Data Source: MYCIDS.
Post-Disposition Sanctions, Programs,
and Services by Case1

100
Washington County (76)
Frequency %
Formally Petitioned 485 48.4%
Diverted* 463 46.2%
Referred to Drug Court 0 0.0%
No Order Issued 55 5.5%
Total 1003 100.0%
Intake Decisions
* Diverted: informal adjustment ordered, take no
action ordered, child warned or counseled
informally, MDHS monitor child or family
informally, parens warned or counseled
Total Youth Total Cases Total Referrals
453 756 1003
Frequency %
7 and Under 1 0.2%
8 0 0.0%
9 0 0.0%
10 5 1.1%
11 12 2.6%
12 28 6.2%
13 55 12.1%
14 57 12.6%
15 97 21.4%
16 94 20.8%
17 95 21.0%
18 7 1.5%
19 and over 1 0.2%
missing/miscoded 1 0.2%
Total 453 100.0%
Age at Intake
Frequency %
CHINS/run away 249 24.8%
simple assault 171 17.0%
disorderly conduct 127 12.7%
contempt of court 69 6.9%
burglary 64 6.4%
malicious mischief 61 6.1%
domestic violence 51 5.1%
shoplifting 38 3.8%
weapons offenses 33 3.3%
drug offenses 28 2.8%
All other categories 112 11.2%
Total 1003 100.0%
Top 10 Offense Categories
Frequency % Frequency % Frequency % Frequency %
White 6 4.1% 13 4.2% 0 0.0% 19 4.2%
Black 139 94.6% 291 95.1% 0 0.0% 430 94.9%
American Indian 0 0.0% 0 0.0% 0 0.0% 0 0.0%
Asian 0 0.0% 0 0.0% 0 0.0% 0 0.0%
Other 1 0.7% 1 0.3% 0 0.0% 2 0.4%
Hispanic 0 0.0% 1 0.3% 0 0.0% 1 0.2%
missing/miscoded 1 0.7% 0 0.0% 0 0.0% 1 0.2%
Total 147 100.0% 306 100.0% 0 0.0% 453 100.0%
Race and Gender
Female Male Missing/Miscoded Total
Frequencies
Court Sanctions
Detention 51
Training School1
2
Certification 0
Supervision
Formal Probation 114
Informal Probation 0
Fine 90
Restitution 21
Community Service 0
2 Data provided by the Mississippi
Department of Human Services (MDHS),
Division of Youth Services (DYS).
1 Data Source: MYCIDS.
Post-Disposition Sanctions, Programs,
and Services by Case1

101
Wayne County (77)
Frequency %
Formally Petitioned 74 65.5%
Diverted* 38 33.6%
Referred to Drug Court 0 0.0%
No Order Issued 1 0.9%
Total 113 100.0%
Intake Decisions
* Diverted: informal adjustment ordered, take no
action ordered, child warned or counseled
informally, MDHS monitor child or family
informally, parens warned or counseled
Total Youth Total Cases Total Referrals
63 78 113
Frequency %
7 and Under 0 0.0%
8 0 0.0%
9 0 0.0%
10 0 0.0%
11 2 3.2%
12 0 0.0%
13 5 7.9%
14 12 19.0%
15 9 14.3%
16 17 27.0%
17 16 25.4%
18 0 0.0%
19 and over 0 0.0%
missing/miscoded 2 3.2%
Total 63 100.0%
Age at Intake
Frequency %
disorderly conduct 26 23.0%
simple assault 22 19.5%
contempt of court 19 16.8%
domestic violence 12 10.6%
drug offenses 9 8.0%
weapons offenses 5 4.4%
CHINS/run away 5 4.4%
malicious mischief 5 4.4%
burglary 3 2.7%
petit larceny 2 1.8%
All other categories 5 4.4%
Total 113 100.0%
Top 10 Offense Categories
Frequency % Frequency % Frequency % Frequency %
White 6 23.1% 10 29.4% 0 0.0% 16 25.4%
Black 15 57.7% 21 61.8% 0 0.0% 36 57.1%
American Indian 0 0.0% 0 0.0% 0 0.0% 0 0.0%
Asian 0 0.0% 0 0.0% 0 0.0% 0 0.0%
Other 0 0.0% 0 0.0% 0 0.0% 0 0.0%
Hispanic 0 0.0% 0 0.0% 0 0.0% 0 0.0%
missing/miscoded 5 19.2% 3 8.8% 3 100.0% 11 17.5%
Total 26 100.0% 34 100.0% 3 100.0% 63 100.0%
Race and Gender
Female Male Missing/Miscoded Total
Frequencies
Court Sanctions
Detention 12
Training School1
2
Certification 1
Supervision
Formal Probation 35
Informal Probation 0
Fine 0
Restitution 1
Community Service 15
2 Data provided by the Mississippi
Department of Human Services (MDHS),
Division of Youth Services (DYS).
1 Data Source: MYCIDS.
Post-Disposition Sanctions, Programs,
and Services by Case1

102
Webster County (78)
Frequency %
Formally Petitioned 5 50.0%
Diverted* 0 0.0%
Referred to Drug Court 0 0.0%
No Order Issued 5 50.0%
Total 10 100.0%
Intake Decisions
* Diverted: informal adjustment ordered, take no
action ordered, child warned or counseled
informally, MDHS monitor child or family
informally, parens warned or counseled
Total Youth Total Cases Total Referrals
8 8 10
Frequency %
7 and Under 0 0.0%
8 0 0.0%
9 0 0.0%
10 0 0.0%
11 0 0.0%
12 1 12.5%
13 0 0.0%
14 0 0.0%
15 3 37.5%
16 2 25.0%
17 2 25.0%
18 0 0.0%
19 and over 0 0.0%
missing/miscoded 0 0.0%
Total 8 100.0%
Age at Intake
Frequency % Frequency % Frequency %
White 0 0.0% 3 50.0% 3 37.5%
Black 1 50.0% 2 33.3% 3 37.5%
American Indian 0 0.0% 0 0.0% 0 0.0%
Asian 0 0.0% 0 0.0% 0 0.0%
Other 1 50.0% 1 16.7% 2 25.0%
Hispanic 0 0.0% 0 0.0% 0 0.0%
Total 2 100.0% 6 100.0% 8 100.0%
Female Male Total
Race and Gender
Frequency %
simple assault 3 30.0%
drug offenses 2 20.0%
CHINS/run away 1 10.0%
disorderly conduct 1 10.0%
hunting violation 1 10.0%
missing/miscoded 2 20.0%
Total 10 100.0%
Offense Categories
Frequencies
Court Sanctions
Detention 0
Training School1
0
Certification 0
Supervision
Formal Probation 0
Informal Probation 0
Fine 0
Restitution 0
Community Service 0
2 Data provided by the Mississippi
Department of Human Services (MDHS),
Division of Youth Services (DYS).
1 Data Source: MYCIDS.
Post-Disposition Sanctions, Programs,
and Services by Case1

103
Wilkinson County (79)
Frequency %
Formally Petitioned 66 70.2%
Diverted* 25 26.6%
Referred to Drug Court 0 0.0%
No Order Issued 3 3.2%
Total 94 100.0%
Intake Decisions
* Diverted: informal adjustment ordered, take no
action ordered, child warned or counseled
informally, MDHS monitor child or family
informally, parens warned or counseled
Total Youth Total Cases Total Referrals
39 52 94
Frequency %
7 and Under 0 0.0%
8 0 0.0%
9 0 0.0%
10 1 2.6%
11 1 2.6%
12 2 5.1%
13 5 12.8%
14 4 10.3%
15 7 17.9%
16 5 12.8%
17 12 30.8%
18 0 0.0%
19 and over 0 0.0%
missing/miscoded 2 5.1%
Total 39 100.0%
Age at Intake
Frequency % Frequency % Frequency % Frequency %
White 2 10.5% 1 5.3% 0 0.0% 3 7.7%
Black 17 89.5% 18 94.7% 0 0.0% 35 89.7%
American Indian 0 0.0% 0 0.0% 0 0.0% 0 0.0%
Asian 0 0.0% 0 0.0% 0 0.0% 0 0.0%
Other 0 0.0% 0 0.0% 0 0.0% 0 0.0%
Hispanic 0 0.0% 0 0.0% 0 0.0% 0 0.0%
missing/miscoded 0 0.0% 0 0.0% 1 100.0% 1 2.6%
Total 19 100.0% 19 100.0% 1 100.0% 39 100.0%
Race and Gender
Female Male Missing/Miscoded Total
Frequency %
simple assault 24 25.5%
disorderly conduct 21 22.3%
contempt of court 13 13.8%
malicious mischief 7 7.4%
burglary 6 6.4%
CHINS/run away 6 6.4%
grand larceny 5 5.3%
harassment 4 4.3%
petit larceny 2 2.1%
weapons offenses 2 2.1%
All other categories 4 4.3%
Total 94 100.0%
Top 10 Offense Categories
Frequencies
Court Sanctions
Detention 0
Training School1
2
Certification 0
Supervision
Formal Probation 11
Informal Probation 0
Fine 0
Restitution 0
Community Service 0
2 Data provided by the Mississippi
Department of Human Services (MDHS),
Division of Youth Services (DYS).
1 Data Source: MYCIDS.
Post-Disposition Sanctions, Programs,
and Services by Case1

104
Winston County (80)
Frequency %
Formally Petitioned 30 47.6%
Diverted* 31 49.2%
Referred to Drug Court 0 0.0%
No Order Issued 2 3.2%
Total 63 100.0%
Intake Decisions
* Diverted: informal adjustment ordered, take no
action ordered, child warned or counseled
informally, MDHS monitor child or family
informally, parens warned or counseled
Total Youth Total Cases Total Referrals
34 44 63
Frequency %
7 and Under 0 0.0%
8 1 2.9%
9 0 0.0%
10 0 0.0%
11 2 5.9%
12 3 8.8%
13 1 2.9%
14 3 8.8%
15 6 17.6%
16 6 17.6%
17 10 29.4%
18 0 0.0%
19 and over 0 0.0%
missing/miscoded 2 5.9%
Total 34 100.0%
Age at Intake
Frequency % Frequency % Frequency % Frequency %
White 0 0.0% 3 9.7% 0 0.0% 3 8.8%
Black 1 100.0% 26 83.9% 0 0.0% 27 79.4%
American Indian 0 0.0% 1 3.2% 0 0.0% 1 2.9%
Asian 0 0.0% 0 0.0% 0 0.0% 0 0.0%
Other 0 0.0% 0 0.0% 0 0.0% 0 0.0%
Hispanic 0 0.0% 1 3.2% 0 0.0% 1 2.9%
missing/miscoded 0 0.0% 0 0.0% 2 100.0% 2 5.9%
Total 1 100.0% 31 100.0% 2 100.0% 34 100.0%
Race and Gender
Female Male Missing/Miscoded Total
Frequency %
burglary 12 19.0%
malicious mischief 11 17.5%
simple assault 8 12.7%
disorderly conduct 6 9.5%
petit larceny 5 7.9%
drug offenses 5 7.9%
contempt of court 4 6.3%
ordinance violation 4 6.3%
other 3 4.8%
domestic violence 1 1.6%
All other categories 4 6.3%
Total 63 100.0%
Top 10 Offense Categories
Frequencies
Court Sanctions
Detention 5
Training School1
2
Certification 0
Supervision
Formal Probation 9
Informal Probation 0
Fine 0
Restitution 2
Community Service 0
2 Data provided by the Mississippi
Department of Human Services (MDHS),
Division of Youth Services (DYS).
1 Data Source: MYCIDS.
Post-Disposition Sanctions, Programs,
and Services by Case1

105
Yalobusha County (81)
Frequency %
Formally Petitioned 31 51.7%
Diverted* 25 41.7%
Referred to Drug Court 1 1.7%
No Order Issued 3 5.0%
Total 60 100.0%
Intake Decisions
* Diverted: informal adjustment ordered, take no
action ordered, child warned or counseled
informally, MDHS monitor child or family
informally, parens warned or counseled
Total Youth Total Cases Total Referrals
38 43 60
Frequency %
7 and Under 0 0.0%
8 0 0.0%
9 0 0.0%
10 0 0.0%
11 0 0.0%
12 3 7.9%
13 4 10.5%
14 5 13.2%
15 5 13.2%
16 6 15.8%
17 12 31.6%
18 0 0.0%
19 and over 0 0.0%
missing/miscoded 3 7.9%
Total 38 100.0%
Age at Intake
Frequency %
burglary 10 16.7%
disorderly conduct 9 15.0%
domestic violence 6 10.0%
drug offenses 6 10.0%
grand larceny 5 8.3%
simple assault 5 8.3%
CHINS/run away 4 6.7%
malicious mischief 4 6.7%
petit larceny 3 5.0%
shoplifting 3 5.0%
All other categories 5 8.3%
Total 60 100.0%
Top 10 Offense Categories
Frequency % Frequency % Frequency % Frequency %
White 4 28.6% 13 59.1% 0 0.0% 17 44.7%
Black 8 57.1% 9 40.9% 0 0.0% 17 44.7%
American Indian 0 0.0% 0 0.0% 0 0.0% 0 0.0%
Asian 0 0.0% 0 0.0% 0 0.0% 0 0.0%
Other 1 7.1% 0 0.0% 0 0.0% 1 2.6%
Hispanic 0 0.0% 0 0.0% 0 0.0% 0 0.0%
missing/miscoded 1 7.1% 0 0.0% 2 100.0% 3 7.9%
Total 14 100.0% 22 100.0% 2 100.0% 38 100.0%
Race and Gender
Female Male Missing/Miscoded Total
Frequencies
Court Sanctions
Detention 0
Training School1
1
Certification 0
Supervision
Formal Probation 8
Informal Probation 0
Fine 0
Restitution 3
Community Service 0
2 Data provided by the Mississippi
Department of Human Services (MDHS),
Division of Youth Services (DYS).
1 Data Source: MYCIDS.
Post-Disposition Sanctions, Programs,
and Services by Case1

106
Yazoo County (82)
Frequency %
Formally Petitioned 39 23.5%
Diverted* 124 74.7%
Referred to Drug Court 0 0.0%
No Order Issued 3 1.8%
Total 166 100.0%
Intake Decisions
* Diverted: informal adjustment ordered, take no
action ordered, child warned or counseled
informally, MDHS monitor child or family
informally, parens warned or counseled
Total Youth Total Cases Total Referrals
125 152 166
Frequency %
7 and Under 0 0.0%
8 0 0.0%
9 0 0.0%
10 2 1.6%
11 4 3.2%
12 1 0.8%
13 10 8.0%
14 19 15.2%
15 24 19.2%
16 28 22.4%
17 37 29.6%
18 0 0.0%
19 and over 0 0.0%
missing/miscoded 0 0.0%
Total 125 100%
Age at Intake
Frequency %
disorderly conduct 37 22.3%
domestic violence 20 12.0%
simple assault 20 12.0%
CHINS/run away 18 10.8%
drug offenses 16 9.6%
burglary 13 7.8%
contempt of court 13 7.8%
malicious mischief 11 6.6%
petit larceny 4 2.4%
other 3 1.8%
All other categories 11 6.6%
Total 166 100.0%
Top 10 Offense Categories
Frequency % Frequency % Frequency %
White 5 11.6% 11 13.4% 16 12.8%
Black 38 88.4% 70 85.4% 108 86.4%
American Indian 0 0.0% 0 0.0% 0 0.0%
Asian 0 0.0% 0 0.0% 0 0.0%
Other 0 0.0% 1 1.2% 1 0.8%
Hispanic 0 0.0% 0 0.0% 0 0.0%
Total 43 100.0% 82 100.0% 125 100.0%
Female Male Total
Race and Gender
Frequencies
Court Sanctions
Detention 19
Training School1
2
Certification 0
Supervision
Formal Probation 17
Informal Probation 0
Fine 0
Restitution 5
Community Service 0
2 Data provided by the Mississippi
Department of Human Services (MDHS),
Division of Youth Services (DYS).
1 Data Source: MYCIDS.
Post-Disposition Sanctions, Programs,
and Services by Case1

107
Municipality of Pearl (83)
Frequency %
Formally Petitioned 151 54.1%
Diverted* 11 3.9%
Referred to Drug Court 0 0.0%
No Order Issued 117 41.9%
Total 279 100.0%
Intake Decisions
* Diverted: informal adjustment ordered, take no
action ordered, child warned or counseled
informally, MDHS monitor child or family
informally, parens warned or counseled
Total Youth Total Cases Total Referrals
187 247 279
Frequency %
7 and Under 0 0.0%
8 1 0.5%
9 0 0.0%
10 0 0.0%
11 5 2.7%
12 5 2.7%
13 19 10.2%
14 25 13.4%
15 34 18.2%
16 34 18.2%
17 58 31.0%
18 4 2.1%
19 and over 0 0.0%
missing/miscoded 2 1.1%
Total 187 100.0%
Age at Intake
Frequency %
shoplifting 54 19.4%
contempt of court 50 17.9%
disorderly conduct 49 17.6%
domestic violence 29 10.4%
alcohol offenses 17 6.1%
drug offenses 15 5.4%
simple assault 11 3.9%
petit larceny 10 3.6%
arson 7 2.5%
burglary 7 2.5%
All other categories 30 10.8%
Total 279 100.0%
Top 10 Offense Categories
Frequency % Frequency % Frequency % Frequency %
White 37 50.7% 56 50.0% 0 0.0% 93 49.7%
Black 27 37.0% 46 41.1% 0 0.0% 73 39.0%
American Indian 0 0.0% 0 0.0% 0 0.0% 0 0.0%
Asian 0 0.0% 1 0.9% 0 0.0% 1 0.5%
Other 2 2.7% 2 1.8% 0 0.0% 4 2.1%
Hispanic 3 4.1% 0 0.0% 0 0.0% 3 1.6%
missing/miscoded 4 5.5% 7 6.3% 2 100.0% 13 7.0%
Total 73 100.0% 112 100.0% 2 100.0% 187 100.0%
Race and Gender
Female Male Missing/Miscoded Total
Frequencies
Court Sanctions
Detention 12
Training School1
0
Certification 2
Supervision
Formal Probation 61
Informal Probation 3
Fine 16
Restitution 5
Community Service 5
2 Data provided by the Mississippi
Department of Human Services (MDHS),
Division of Youth Services (DYS).
1 Data Source: MYCIDS.
Post-Disposition Sanctions, Programs,
and Services by Case1

108
Appendix A
Referral Agent 1. Law Enforcement: law enforcement, loss prevention officer, security officer 2. Family: relative, responsible caretaker, foster parent, parent, other family member 3. School 4. Social Services: DHS – family & children services, social service 5. Victim 6. Medical, Mental, or Other Professional: medical personnel, mental health, other non-professional, residential
facility staff 7. Other: other, alleged perpetrator, self, friend 8. DYS and Court Personnel: DHS – youth services, court personnel
Disposition Categories
1. AOP: Adolescent offender program ordered (2), Adolescent opportunity program ordered (164) 2. Dismissed: Dismissed (8), Release child without further action (34), No action taken (60), Insufficient evidence
(63), Passed to files (89), Not a delinquent (91), Adjudication withheld (108), Dismissed, no response entered (146), Withhold disposition (150)
3. Fine: Fine (9), Pay fine (160) 4. Held open without action (11) 5. Formal Probation: Intensive supervision program (13), Youth counselor to supervise (53), Probation (71),
Probation extended (110), Parole (114), Parole extended (115), Supervision agreement (118), Probation handled under existing (120), Parole handled under existing (121), Indefinite supervision (141), Probation, supervised (165)
6. Informal probation: Informal adjustment (109), Probation, unsupervised (166) 7. Other: Other (23), Other action (24), Suspended license (41), Transfer custody to other private correctional
program (46), Transfer custody to other public correctional program (47), Wilderness program (52), Curfew (77), Order to attend school faithfully (78), Drug court (84), Curfew extended (99), Successful completion of GED program, Random drug screens (129), Counseling (140), Refer to drug court (144), Pay fee (157), Pay drug test cost (158), Pay court costs (156)
8. Restitution: Restitution (35), Restitution extended (111), Pay restitution (159) 9. Training School Suspended: Suspended transportation (42), Suspended training school (124) 10. Training School: Transfer custody to training school (48), Commit custody to Oakley training school (81),
Commit custody to Columbia training school (82) 11. Certified/waived/transferred to adult system: Waived to justice or circuit court (50), Motion to transfer (117) 12. WAC: Warned, adjusted, or counseled (51) 13. Community service: Community service (76), Community service extended (112) 14. Detention: Detention (80), Imprisonment (92), Weekend detention (116) 15. Detention suspended: Detention suspended (122), Imprisonment suspended (155) 16. Treatment: Commit to inpatient treatment (98), Commit to a mental health facility (128), Commit to mental
health facility, mental health (152), Commit to mental health facility, drug and alcohol (153) 17. House arrest/electronic monitoring: House arrest (123), Electronic monitoring (143)

109
Appendix B
Offense Crime Severity Crime Type
Assault: aggravated no weapon specified very serious Aggravated Assault
Assault: aggravated use of deadly weapon very serious Aggravated Assault
Accessory after the fact moderate Other
Accessory before the fact moderate Other
Alteration, fraudulent use/procurement of license moderate Fraud
Animals: dog, causing malicious injury moderate Malicious Mischief
Animals: livestock, causing malicious injury serious Malicious Mischief
Arrest: resisting or obstructing moderate Disorderly Conduct
Arson: attempt, aid, or induce to burn serious Arson
Arson: dwelling or outbuilding serious Arson
Arson: insured property serious Arson
Arson: other buildings or structures serious Arson
Arson: personal property serious Arson
Arson: school building serious Arson
Arson: school building serious Arson
Arson: timber, woods, meadow, marsh moderate Arson
Assault: aggravated very serious Aggravated Assault
Assault: aggravated domestic violence very serious Aggravated Assault
Assault: aggravated upon firefighter by arson very serious Aggravated Assault
Assault: aggravated: police officer, teacher, etc. very serious Aggravated Assault
Assault: simple moderate Simple Assault
Assault: simple domestic violence serious Disorderly Conduct
Assault: simple, police officer, teacher, etc. serious Simple Assault
Attempt to commit a crime serious Other
Attempted crime moderate Other
Automobile: unauthorized use serious Motor Vehicle Theft
Bad checks moderate Fraud
Body piercing: unlawful minor Other
Bombs: false reporting moderate Bomb Threats
Bullying or harassing behavior in public schools moderate Harassment
Burglary: business, commercial property serious Burglary
Burglary: church, place of worship serious Burglary
Burglary: dwelling serious Burglary
Burglary: Non-dwelling, motor vehicle, boat serious Burglary
Burglary: Possession of burglary tools serious Burglary
Carjacking very serious Motor Vehicle Theft
Cemetary desecration minor Malicious Mischief
Child in need of special care status CHINS/Run Away

110
Appendix B
Offense Crime Severity Crime Type
Child in need of supervision status CHINS/Run Away
City ordinance violation minor Ordinance violation
Computer, post message via electronic media to cause injury moderate Harassment
Conspiracy minor Other
Cont. Sub: Marijuana intent to distribute serious Drug Offenses
Cont. Sub: Marijuana, manufacture of serious Drug Offenses
Cont. Sub: Marijuana, possession of moderate Drug Offenses
Cont. Sub: Marijuana, sale of serious Drug Offenses
Cont. Sub: possession of cocaine serious Drug Offenses
Cont. Sub: possession of paraphernalia minor Drug Offenses
Cont. Sub: possession of precursor chemicals serious Drug Offenses
Cont. Sub: sale of counterfeit, prescription or legal serious Drug Offenses
Cont. Sub: sale or manufacture of paraphernalia moderate Drug Offenses
Cont. Sub: Schedule I-V drug, intent to distribute serious Drug Offenses
Cont. Sub: Schedule I-V drug, manufacture of serious Drug Offenses
Cont. Sub: Schedule I-V drug, possession of moderate Drug Offenses
Cont. Sub: Schedule I-V drug, sale of serious Drug Offenses
Contempt of court serious Contempt of Court
Contributing to neglect or delinquency of child minor Other
County ordinance violation minor Ordinance violation
Credit cards: acquisition by theft or artifice moderate Fraud
Credit cards: fraudulent use moderate Fraud
Crime: falsely reporting moderate Fraud
Curfew violation status CHINS/Run Away
Cyber stalking moderate Harassment
Deadly weapons: exhibit in threatening manner serious Weapons Offense
Delivery of threatening note moderate Harassment
Dependent child status CHINS/Run Away
Destroying/Defacing: church moderate Vandalism
Destroying/Defacing: public building moderate Vandalism
Destroying/Defacing: school building moderate Vandalism
Destruction of state property moderate Vandalism
Disorderly conduct: breach of peace moderate Disorderly Conduct
Disorderly conduct: failure to comply moderate Disorderly Conduct
Disorderly conduct: incite riot moderate Disorderly Conduct
Disorderly conduct: interference moderate Disorderly Conduct
Dissemination-sexually orient. Materials-under 18 moderate Sexual Offenses
Distribution of obscene materials or performances moderate Sexual Offenses
Disturbance in public place moderate Disorderly Conduct
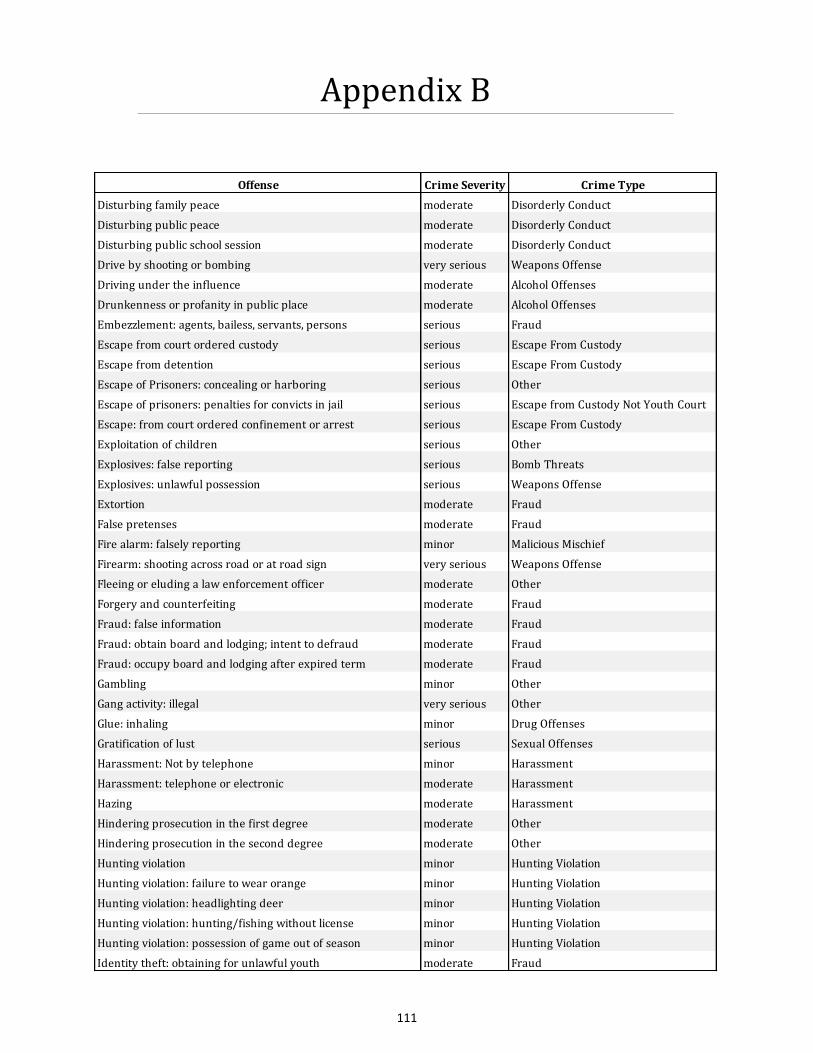
111
Appendix B
Offense Crime Severity Crime Type
Disturbing family peace moderate Disorderly Conduct
Disturbing public peace moderate Disorderly Conduct
Disturbing public school session moderate Disorderly Conduct
Drive by shooting or bombing very serious Weapons Offense
Driving under the influence moderate Alcohol Offenses
Drunkenness or profanity in public place moderate Alcohol Offenses
Embezzlement: agents, bailess, servants, persons serious Fraud
Escape from court ordered custody serious Escape From Custody
Escape from detention serious Escape From Custody
Escape of Prisoners: concealing or harboring serious Other
Escape of prisoners: penalties for convicts in jail serious Escape from Custody Not Youth Court
Escape: from court ordered confinement or arrest serious Escape From Custody
Exploitation of children serious Other
Explosives: false reporting serious Bomb Threats
Explosives: unlawful possession serious Weapons Offense
Extortion moderate Fraud
False pretenses moderate Fraud
Fire alarm: falsely reporting minor Malicious Mischief
Firearm: shooting across road or at road sign very serious Weapons Offense
Fleeing or eluding a law enforcement officer moderate Other
Forgery and counterfeiting moderate Fraud
Fraud: false information moderate Fraud
Fraud: obtain board and lodging; intent to defraud moderate Fraud
Fraud: occupy board and lodging after expired term moderate Fraud
Gambling minor Other
Gang activity: illegal very serious Other
Glue: inhaling minor Drug Offenses
Gratification of lust serious Sexual Offenses
Harassment: Not by telephone minor Harassment
Harassment: telephone or electronic moderate Harassment
Hazing moderate Harassment
Hindering prosecution in the first degree moderate Other
Hindering prosecution in the second degree moderate Other
Hunting violation minor Hunting Violation
Hunting violation: failure to wear orange minor Hunting Violation
Hunting violation: headlighting deer minor Hunting Violation
Hunting violation: hunting/fishing without license minor Hunting Violation
Hunting violation: possession of game out of season minor Hunting Violation
Identity theft: obtaining for unlawful youth moderate Fraud

112
Appendix B
Offense Crime Severity Crime Type
Indecent exposure minor Sexual Offenses
Interference with operation of school bus moderate Disorderly Conduct
Intimidating: judge, juror, witness, attorney serious Harassment
Intimidation: threatening or coercion interfering moderate Harassment
Intoxicating beverages, sale, and possession minor Alcohol Offenses
Kidnapping very serious Kidnapping
larceny stealign timber moderate Petit<$500 or Grand>$500
Larceny: coin-operated device minor Petit Larceny
Larceny: grand serious Grand Larceny
Larceny: livestock moderate Petit<$500 or Grand>$500
Larceny: petit minor Petit Larceny
Larceny: petit, place of worship minor Petit Larceny
Larceny: shoplifting minor Shoplifting
Larceny: stealing dog minor Petit Larceny
Larceny: stealing motor vehicle serious Grand Larceny
Littering: highways & private property minor Ordinance violation
Looting serious Burglary
Malicious mischief minor Malicious Mischief
Manslaughter: culpable neglegence very serious Manslaughter
Manslaughter: without malic in heat of passion very serious Manslaughter
Mayhem serious Aggravated Assault
Mayhemm moderate Simple Assault
Misdemeanor; false information minor Perjury
Modification of disp. Orders, probation or parole moderate Other
Motor vehicle theft: all except unauthorized use serious Grand Larceny
Motor vehicle violation: reckless driving minor Traffic Violations
Motor vehicle: unauthorized use moderate Joyriding
Obstructing Public Streets: by impeding traffic moderate Disorderly Conduct
Obstructing public streets: intentional obstruction moderate Disorderly Conduct
Obstructing public streets: willful obstruction moderate Disorderly Conduct
Obtaining signature with intent to defraud moderate Fraud
Other minor Other
Other delinquent moderate Other
Parole violation serious Contempt of Court
Perjury moderate Perjury
Perjury: bribery to procure moderate Perjury
Perjury: subordination of moderate Perjury
Possessing or drinking alcoholic beverages minor Alcohol Offenses
Possession of prohibited items other than offender moderate Other

113
Appendix B
Offense Crime Severity Crime Type
Prescription: false representation of serious Drug Offenses
Prescriptionss: acquiring by misrepresentation or fraud serious Drug Offenses
Probation violation moderate Contempt of Court
Profane language: via telephone minor Disorderly Conduct
Prostitution moderate Sexual Offenses
Railroads: jumping on and off moving cars moderate Other
Railroads: obstructing moderate Other
Rape: Intent to ravish very serious Sexual Offenses
Rape: statutory very serious Sexual Offenses
Receiving stolen property moderate Petit<$500 or Grand>$500
Resisting lawful arrest moderate Disorderly Conduct
Robbery very serious Robbery
Robbery: armed use of deadly weapon very serious Robbery
Robbery: threat to injure at another time serious Robbery
Running away status CHINS/Run Away
Sex offense: all except force rape and prostitution serious Sexual Offenses
Sexual battery serious Sexual Offenses
Sexual battery of child at least 14 but under 16 serious Sexual Offenses
Sexual battery of child under 14 years of age very serious Sexual Offenses
Shoot or throw at vehicle, train, or trans facil moderate Weapons Offense
Shooting into dwelling or house very serious Weapons Offense
Simple to put in fear by physical menace moderate Simple Assault
Stalking serious Harassment
Status offender status CHINS/Run Away
Statutory rape of child at least 14 but under 16 very serious Sexual Offenses
Stolen firearms: possession, receipt, acquisition serious Weapons Offense
Stolen property: buying, receiving, possessing moderate Petit<$500 or Grand>$500
Suicide: aiding very serious Other
Telephone calls: abuse of emergency system (911) minor Malicious Mischief
Telephone calls: harassing moderate Harassment
Tobacco: misrepresentation of age to purchase status CHINS/Run Away
Tobacco: possession on school property status CHINS/Run Away
Trespass minor Malicious Mischief
Trespass: taking of animals or vehicles minor Malicious Mischief
Unauthorized dumping of solid waste minor Ordinance violation
Ungovernable behavior/incourrigible status CHINS/Run Away
Unlawful possession contraband youth detention center moderate Other
Unnatural intercourse serious Sexual Offenses
Unsuccessful informal adjustment status CHINS/Run Away

114
Appendix B
Offense Crime Severity Crime Type
Uttering counterfeit instrument or coin serious Fraud
Vandalism/malicious mischief minor Malicious Mischief
Violation of county ordinance minor Ordinance violation
Violation of drug laws: all except narcotic serious Drug Offenses
Violation of drug laws: narcotic serious Drug Offenses
Violation of municipal ordinance minor Ordinance violation
Voyeurism: trespass by peeping Tom minor Sexual Offenses
Vulnerable person: gratification of lust very serious Sexual Offenses
Weapons: carrying concealed serious Weapons Offense
Weapons: Carrying, possessing, etc. serious Weapons Offense
Weapons: possession of a handgun serious Weapons Offense
Weapons: possession on school property serious Weapons Offense