division of applied social sciences community survey research class 2013 contact: professor david...
TRANSCRIPT

Ashland Area Survey
Division of Applied Social Sciences Community Survey Research Class
2013Contact: Professor David O’Brien –

Sampling Strategy
Presented by:Jessi Gordon, Nancy Holloway
Greg Morrow and See Yang
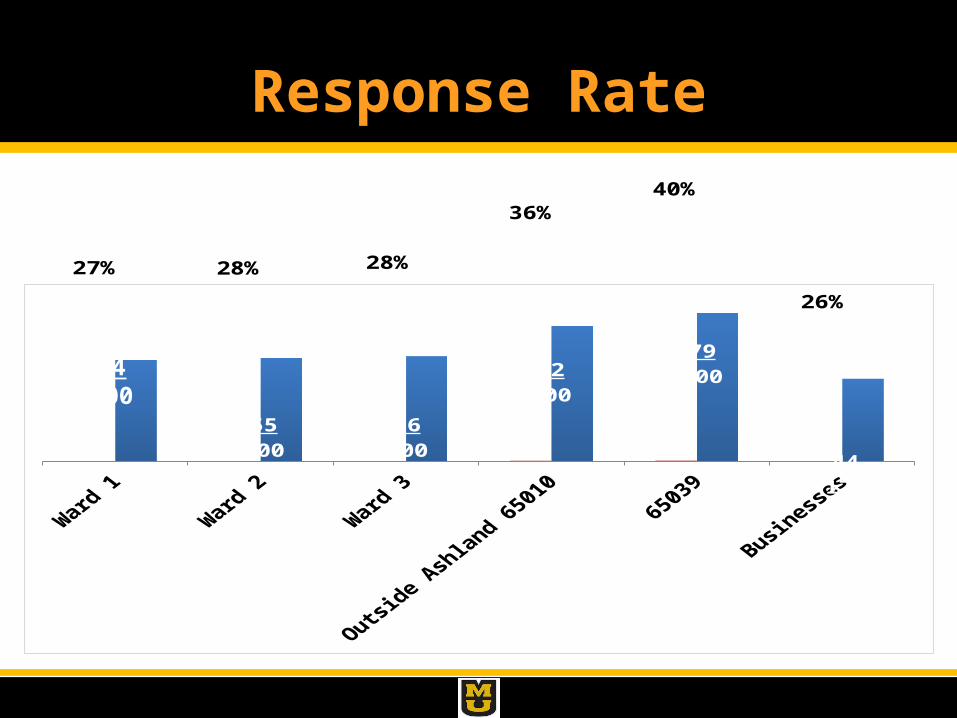
Response Rate
27% 28% 28%
36%40%
26%
55200
56200
72200
79200
44171
54200

Overview
Does the survey sample accurately represent the population?
• American Community Survey (OSEDA)—5 year average—2007 to 2011
• Compared gender, age, education, and income

Gender Comparison
Census MO City of Ashland Outside Ashland 65010 and 65039
49%
43% 43%
51%
57% 57%
MaleFemale

Age Comparison
18 to 24 25 to 34 35 to 44 45 to 64 65+
18% 16% 16%
33%
17%
8%
16%19%
41%
16%
1%
11%
16%
50%
22%
Census MO Census 65010 and 65039 Survey Data

Education Comparison 65010
Less than high school
High school Associate degree Bachelor degree Graduate degree
4%
48%
11%
27%
10%
1%
33%
16%
25% 25%
Census 65010 Survey Data 65010

Education Comparison 65039
Less than high school
High school Associate degree
Bachelor degree Graduate degree
13%
57%
5%
14%10%
4%
34%
12%
29%22%
Census 65039 Survey Data 65039

Income Comparison
Census MO Census 65010
Survey Data 65010
Census 65039
Survey Data 65039
Median family
income$47,202 $58,176
$60,000 to $89,999 $67,103 $60,000 to
$89,999
Mean family
income$62,979 $65,206 $76,269 $74,691 $77,159

In Conclusion
• Trends between survey respondents and the surrounding population:– Gender: slightly higher percentage females– Income: higher mean income– Age: skewed to older individuals– Education: higher percentage with graduate
degrees

Community Identity Findings
Presented byStephanie Link, Fridah Mubichi,
Lisa Newton, Susan Webb

Community Identity Defined
• A group and/or location with shared values,
goals and/or habits among its members.
• Community identity is therefore subject to:— Social organizations & institutions
— Economic organizations & institutions
— Political institutions, affiliations & law

Respondent Overview
• Average residency duration is 17 years
• 69% are married
• 26% are retired
• 57% are female
• 51% have a bachelors degree or higher
• 88% own their home
• 38% have children under the age of 18

Q. 6 - Where do you live?
City of Ashland17851%
So. Boone County16146%
Other123%

Q. 7 - Where do you feel the greatest sense of belonging?
City of Ash-land12445%
Jefferson City155%
City of Columbia27
10%
So. Boone County
8732%
Other238%

Q. 23 & 24 - In what location do you and other members of your
household work?
Ashland Columbia Jefferson City So. Boone county
Other
46
168
53
2114
55
125
38
177
RespondentOther

Q. 8 - What connects you to Ashland?
Friends
Family
School
Long T
erm Resid
ence
Neighbours
Employment
Business
Place of B
irth
Farm
No Ties
Other
196170
144129
9667 61
43 31 31 27

Q. 9 - Are you or a family member active in local
organizations?
Church
Sports
Team
PTA/School B
oard/Sc
hool
Fratern
al/Se
rvice
Group
Business
Organiza
tionOth
er
Youth Gro
up
Community Deve
lopment
Veteran's G
roup
Labour U
nion
Women's G
roup
Agricu
ltural
Associa
tion
105
6354
3929 27 24
14 13 8 8 6

Q. 10 - On a scale of 1-4, how important are the following?
Community Sa
fety
Quality
of Educa
tion
Cost of L
iving
Loca
tion
Friendsh
ip & Neigh
bours
Sense
of Community
Comm & Rec F
aciliti
es
Health Se
rvice
s
Population Si
ze
Church
Community Eve
nts
3.83.6 3.6 3.5
3.43.3
3.0 2.9 2.92.7 2.7

Q. 11 - Rank your agreement with the following on a scale of 1-5.
4.1
3.9
3.6 3.6 3.6 3.63.5
2.7
2.1

In Conclusion
• Respondents identified family, friends & school as their strongest social connections
• Community safety was ranked most important aspect of community
• Shared community activities – church and community events - were ranked least important

Consumption Findings
Presented by: Allie Grotts, Mandy Sims, Marilynn
King and Mark Porth

Frequency of Purchasing
Two Part question:
Please Select
Never, Once in a while, Most of the time or Always – to best
describes how often you use the following Ashland services.
And
If you select “Never” or “Once in a while”, for any item please
indicate where you usually go for service.

Auto Repair
Columbia Jeff City elsewhere
70%
22%
8%
Where else?
33%
32%
24 %
11%
Never Once in a while Most of the time
Always

Banking
19%
15%
22%
44%
Never Once in a WhileMost of the Time Always
Columbia
Jeff City
Elsewhere
Online
72%
19%
8%1%
Where else?

Restaurants
Columbia Jeff City Elsewhere
86%
12%2%
Where else?
11%
66%
20%
3%
Never Once in a while Most of the time
Always

Pharmacy
54%28%
12%
7%
Never Once in a while AlwaysMost of the time
Columbia Jeff City Elsewhere Online
82%
11%5% 2%
Where else?

Quality, Service, Price
Please Select
Quality of Product/Service, Convenience, Price – to best describe
what is most important when making purchasing decisions.

64%
22%
15%
Quality of Service Convenience Price
Auto Repair
Quality Matters
55%35%
10%Restaurants

40%
55%
5%
Quality of Service Convenience Price
Banking
Convenience Matters
22%
42%
36%
Grocery

Hair Cut/Salon/Manicure
18-24 25-34 35-44 45-64 65+
2
13
22
47
15
04
9
54
32
1
19 19
48
11
Quality of Service Convenience Price

18-24 25-34 35-44 45-64 65+0
12 14
53
19
1
811
46
33
2
13
22
49
11
Quality of Service Convenience Price
Hardware and Building Materials

Male Female
40
61
47
5356
44
Quality of Service Convenience Price
Banking
QUALITY PRICE

Where do people purchase food?
Category Frequency Percent Community Garden 10 2.8CSA 5 1.4Convenience Store 44 12.1FM: Ashland 126 34.7FM: Columbia 48 13.2FM: Jeff City 13 3.6Food Pantry 6 2.3Grocery store 351 96.7Local producer 41 11.3Church 16 4.4Restaurants 218 60.1Roadside 34 9.4U-pick 16 4.4

Grocery Store

Restaurants

How do you think your shopping choices impact your community?

Shopping Choices
10%18%
72%
My shopping choices can change things in this com-
munity disagreeundecidedagree
8%
19%
73%
Voting with my shopping dol-lar makes a difference
disagreeundecidedagree
16%
18%66%
I shop locally to support exist-ing Ashland businesses.
disagreeundecidedagree
76%
11%13%
My shopping choices have NO effect on the Ashland Com-
munity.disagreeundecidedagree

Willingness to Participate in Curbside Recycling

In Conclusion
• Residents are largely seeking services in Columbia
• Convenience is a large factor determining consumption choices– But what is convenient? Ashland? Columbia?
• Residents believe they can make a difference in their community with their purchasing dollars
• City Limit Residents would participate in curbside recycling

Economic Development Findings
Presented by: Gary Glass, Lucas Lopez, Lindsey Saunders, Maria Rodriguez-
Alcala and Andrew Vanengelenhoven

Economic Development Issues that Matterto Ashland City Residents
87%82%
75%70%
65%
40%
68%
52%55%
52%
22%
3%
*Two variables with same percentages were bundled
Community
FamilyEducation
Gender
Income
EconInactive

Economic Development Issues that Matter to Ashland City Residents (cont’d)
• Attached to Ashland as a community.
• Family matters.• Are highly educated.• Slightly more females responded.• High HH earnings (>$60k)• Economically active population.

Respondents’ views of Ashland Services
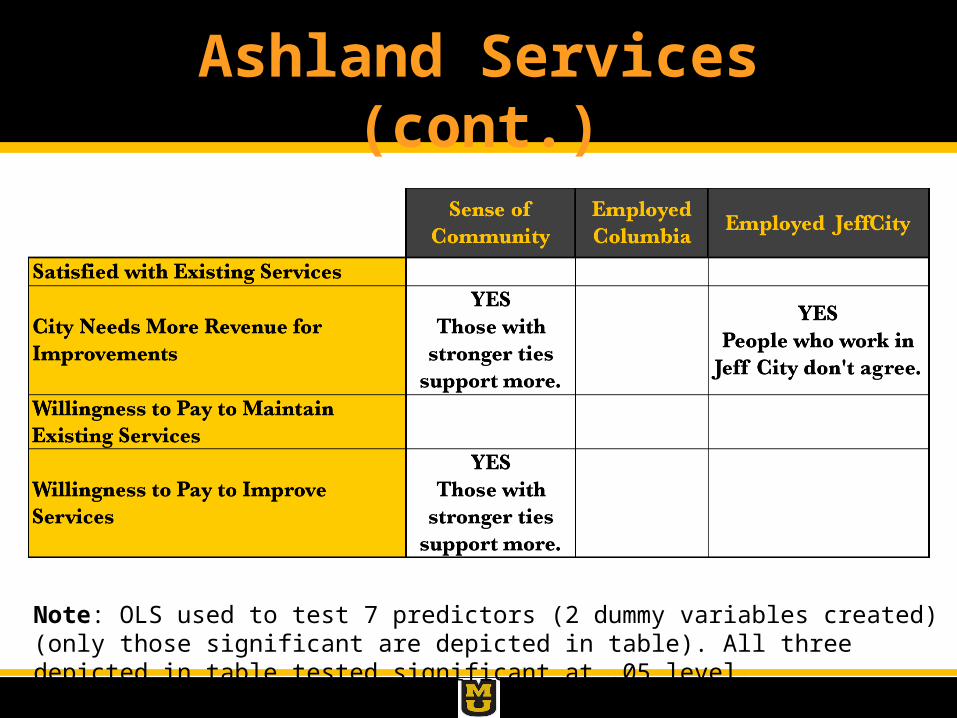
Ashland Services (cont.)
Note: OLS used to test 7 predictors (2 dummy variables created) (only those significant are depicted in table). All three depicted in table tested significant at .05 level.

Tax Support for Maintaining Current Service Levels
People support specific services.

Support Predictors for Specific Services
Note: Regressions were run for 7 predictors (only those tested significant depicted).1. People with children’s mean = 2.88; People with no children’s mean = 3.44; N=155 at .038 level.2. Women’s mean = 3.70 ; Men’s mean = 2.82; N=140 at .041 level.3. People >65’s mean = 3.59; People 35-44 yrs’ mean = 2.86; N=140 at .002 level.4. Income <$29k’s mean = 4.48; Income >$90k’s mean = 3.23; N=142 at .021 level.5. People >65’s mean = 3.80; People 18-34 yrs’ mean = 3.31; N=142 at .063 level.6. Income <$29k’s mean = 4.05; Income >$90k’s mean = 3.06; N=140 at .076 level.7. People >65’s mean = 3.66; People 34-44 yrs’ mean = 3.06; N=140 at .089 level.8. Income <$29k’s mean = 4.05; Income >$90k’s mean = 3.13; N=143 at .060 level.9. Income <$29k’s mean = 4.05; Income >$90k’s mean = 2.66; N=141 at .002 level.
10.Income <$29k’s mean = 4.48; Income >$90k’s mean = 3.23; N=142 at .021 level.

Support for a Commercial Development Tax
Note: Percentages are rounded so may not add to exact total.*Includes those that "somewhat support" and "strongly support.” **Includes those that "strongly oppose" and "oppose."
Overall, respondents DO SUPPORT, with the exception of the area near the
airport.

Support Predictorsfor Commercial Development
Note: Pearson correlation used for all except #2 for which two independent samples t-test was used; 10 predictors were tested (only significant ones are depicted)1. Two variables tested significant: Sense of community is important (p<.01) and Shopping choices can change my community
(p<.05). For both N=195.2. Females mean = 3.54 and Males mean = 3.07 for values 1 through 5. N=196 and p<.05.3. Only one variable tested significant: Sense of community is important (p<.01;with N=195).4. N=179; p<.01.5. Two variables tested significant: Sense of community is important and Shopping choices can change my community. For both
N=196 and p<.05.6. Two variables tested significant: Sense of community is important (p<.05) and Shopping choices can change my community
(p<.01). For both N=195.
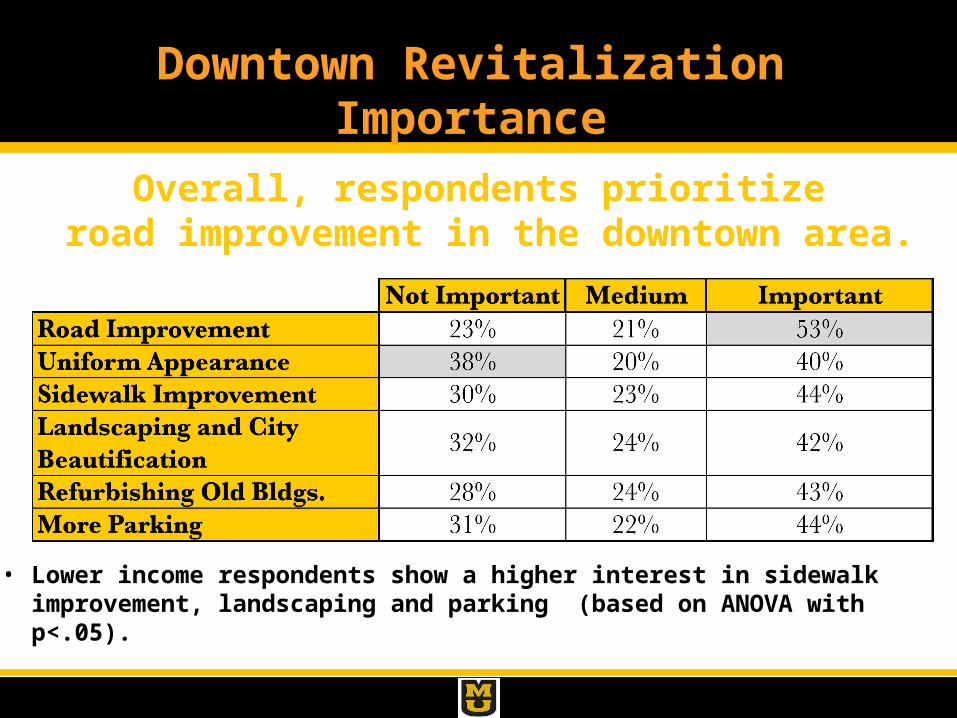
Downtown Revitalization Importance
• Lower income respondents show a higher interest in sidewalk improvement, landscaping and parking (based on ANOVA with p<.05).
Overall, respondents prioritize road improvement in the downtown area.

In Conclusion
• We analyzed respondents from within the city limits.
• Respondents generally agree the city needs more revenue to maintain or improve services, but are unwilling to pay for it.
• However, when asked about specific services, there is support for paying taxes for street maintenance, parks & rec, storm water, and police, particularly among women, lower-income groups and older people.
• Respondents in general support funding commercial development. They are particularly interested in downtown development, but don’t want to invest around the airport. – Downtown focus is on: improve roads, sidewalks & parking.