dividend vs growth
TRANSCRIPT

8/3/2019 Dividend vs Growth
http://slidepdf.com/reader/full/dividend-vs-growth 1/27
1
Financial Decisions
11 Dividends v. Growth
Instructor: A. Ashta
References: Higgins Ch. 4

8/3/2019 Dividend vs Growth
http://slidepdf.com/reader/full/dividend-vs-growth 2/27
2
Dividend Policy
• What should be payout ratio?
• Alternative uses of cash• Capital expenditure• Reducing Debt

8/3/2019 Dividend vs Growth
http://slidepdf.com/reader/full/dividend-vs-growth 3/27
3
Financing Growth
1. GROWTH & MANAGEMENT• Product Life Cycle• Management Objectives
2. SUSTAINABLE GROWTH• Growth requires assets and financing• Sustainable Growth equation
3. TOO MUCH GROWTH• Management Strategies
4. TOO LITTLE GROWTHManagement Strategies
5. GROWTH AND INFLATION
8/3/2019 Dividend vs Growth
http://slidepdf.com/reader/full/dividend-vs-growth 4/27
4
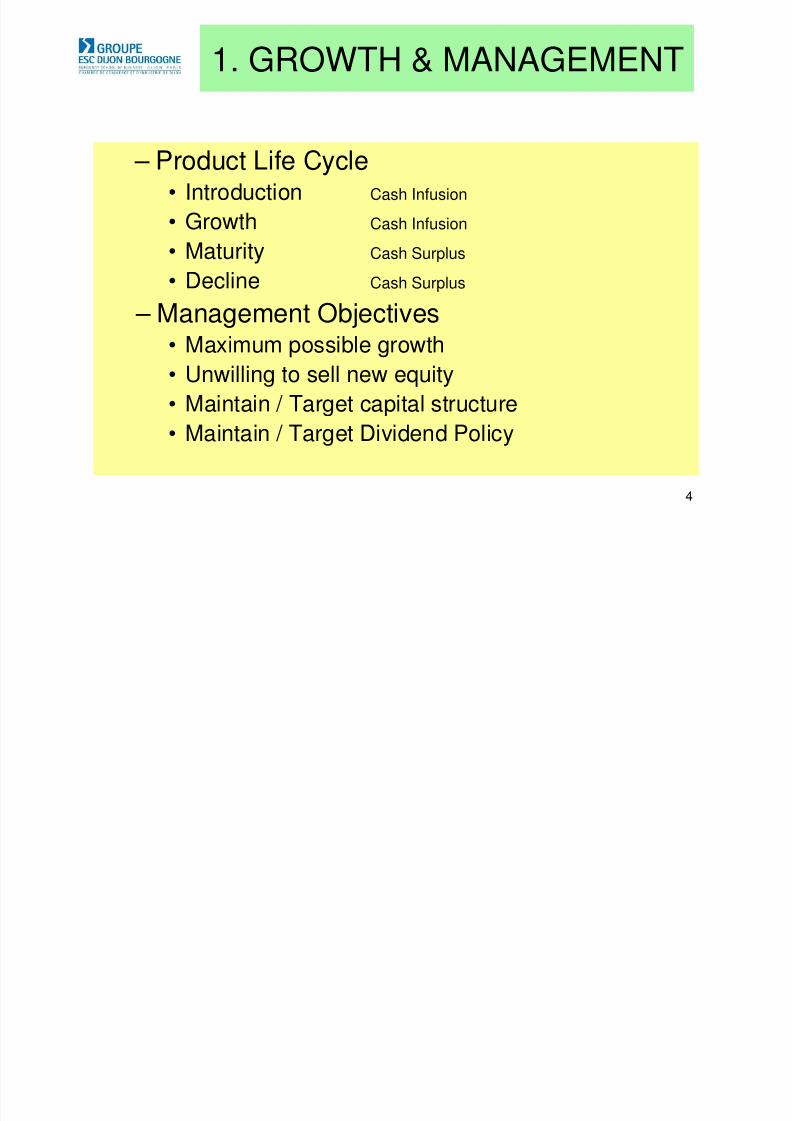
1. GROWTH & MANAGEMENT
– Product Life Cycle
• Introduction Cash Infusion• Growth Cash Infusion
• Maturity Cash Surplus
• DeclineCash Surplus
– Management Objectives• Maximum possible growth• Unwilling to sell new equity• Maintain / Target capital structure• Maintain / Target Dividend Policy
8/3/2019 Dividend vs Growth
http://slidepdf.com/reader/full/dividend-vs-growth 5/27
5
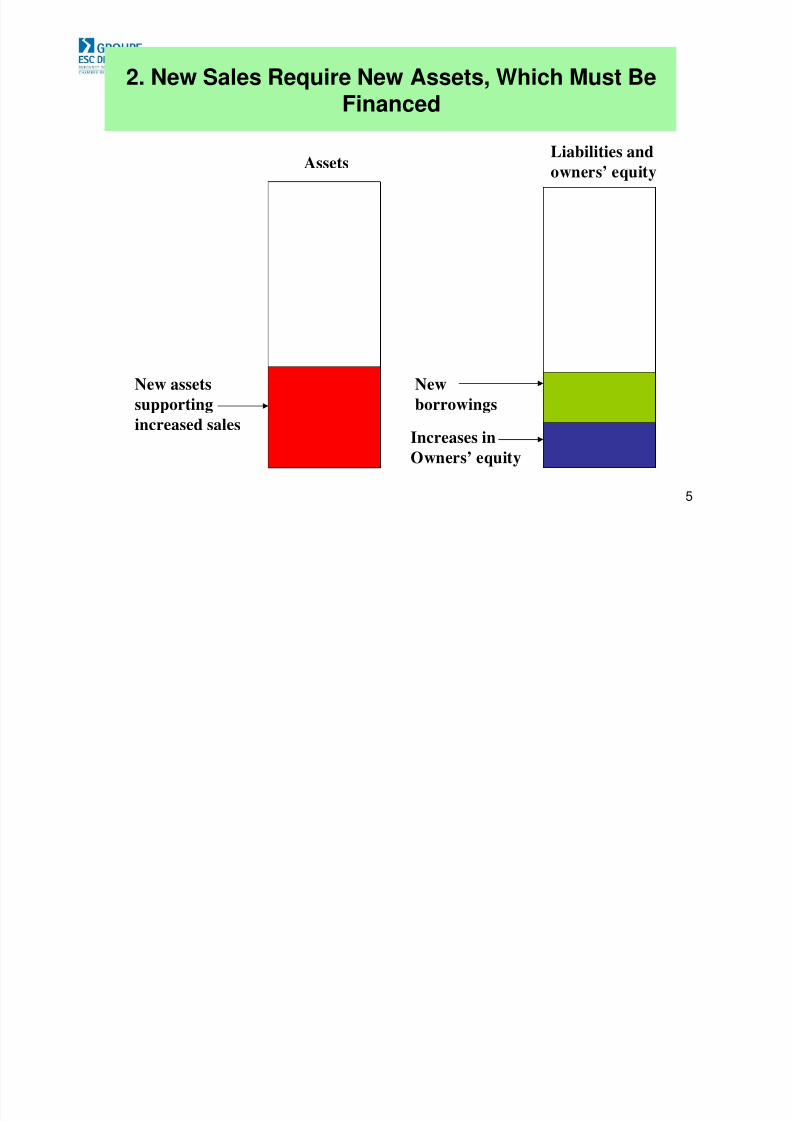
2. New Sales Require New Assets, Which Must Be
Financed
Newborrowings
Increases in
Owners’ equity
New assetssupporting
increased sales
AssetsLiabilities and
owners’ equity

8/3/2019 Dividend vs Growth
http://slidepdf.com/reader/full/dividend-vs-growth 6/27
6
SUSTAINABLE GROWTH
• New Assets required for Sales Growth• Working Capital Needs• Fixed Asset Needs
• Financing required for Asset Growth• Financing limits Growth
• Own funds limited to Retained Earnings• Debt limited in proportion to RE
• So, total funding is limited• This limits assets growth• This limits sustainable Growth
• The Sustainable Growth Equation• g = PART* = R x ROE – P = Profit Margin, A = Asset Turnover, – R = Retention Rate, T* = Equity Multiplier (Financial Leverage)
based on Opening Equity

8/3/2019 Dividend vs Growth
http://slidepdf.com/reader/full/dividend-vs-growth 7/27
7
Sustainable Growth Equation
EquityOpening
Assetsx
Assets
Salesx
Sales
EATx
EAT
RE
ROÊxR ROÊxb)-(1g
=
=
=
g = growth rate
b = dividend distribution rate
R = retention rate
RE = Retained Earnings
EAT = Earnings after tax
Ê = Opening Equity

8/3/2019 Dividend vs Growth
http://slidepdf.com/reader/full/dividend-vs-growth 8/27
8
An example of Sustainable Growthrate with no debt
Year 0 1 0 1 0 1
Capital = Equity 100 180 100 100 100 300Assets 100 180 100 100 100 300
Sales 1000 1800 1000 1000 1000 3000
Cost 800 1440 800 800 800 2400EAT 200 360 200 200 200 600
Dividend 120 200 0
Retained Earnings 80 0 200
Growth 80,00% 0% 200%Dividend payout ratio 0,6 1 0
Retention Ratio 0,4 0 1
ROE 200% 200% 200%
Case 1 Case 2 Case 3
8/3/2019 Dividend vs Growth
http://slidepdf.com/reader/full/dividend-vs-growth 9/27
9
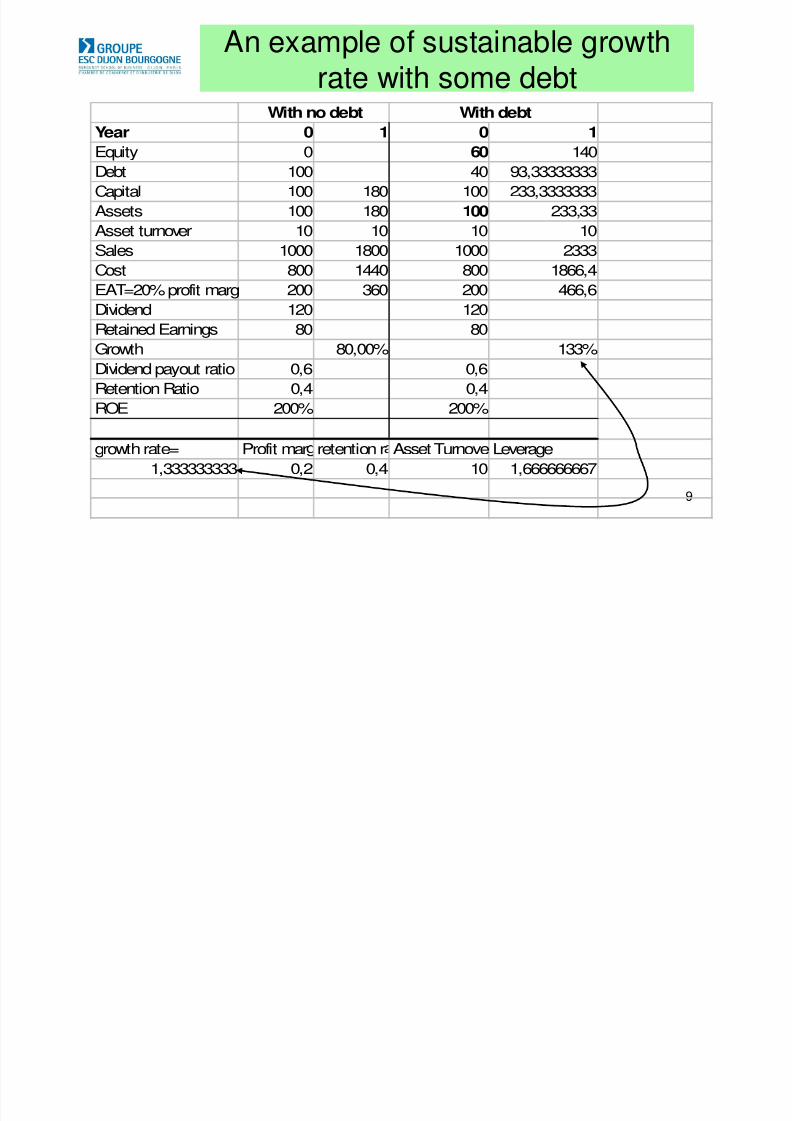
An example of sustainable growthrate with some debt
Year 0 1 0 1
Equity 0 60 140
Debt 100 40 93,33333333
Capital 100 180 100 233,3333333Assets 100 180 100 233,33
Asset turnover 10 10 10 10
Sales 1000 1800 1000 2333
Cost 800 1440 800 1866,4
EAT=20% profit marg 200 360 200 466,6Dividend 120 120
Retained Earnings 80 80
Growth 80,00% 133%
Dividend payout ratio 0,6 0,6
Retention Ratio 0,4 0,4ROE 200% 200%
growth rate= Profit mar retention r Asset Turnove Leverage
1,333333333 0,2 0,4 10 1,666666667
With no debt With debt
8/3/2019 Dividend vs Growth
http://slidepdf.com/reader/full/dividend-vs-growth 10/27
10
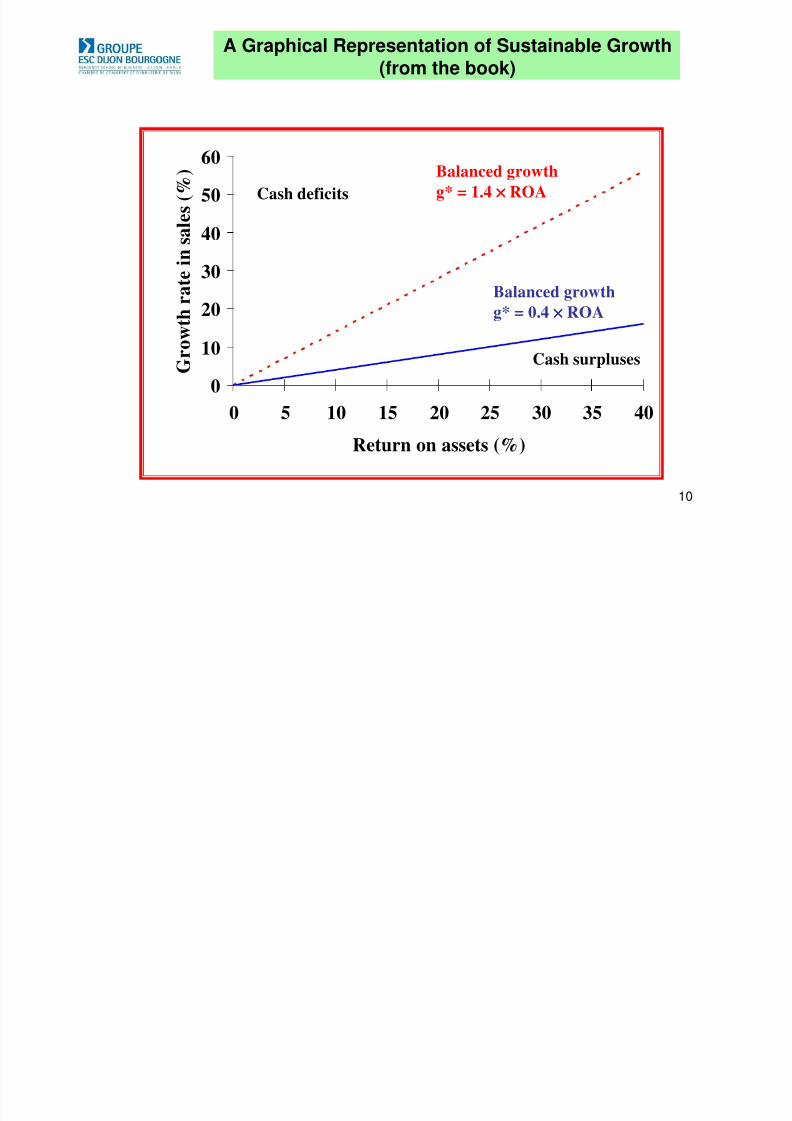
A Graphical Representation of Sustainable Growth(from the book)
0
10
20
30
40
50
60
0 5 10 15 20 25 30 35 40
Return on assets (%)
G r o w t h r a
t e i n s a l e s ( % )
Cash deficits
Balanced growth
g* = 1.4 ×××× ROA
Balanced growthg* = 0.4 ×××× ROA
Cash surpluses

8/3/2019 Dividend vs Growth
http://slidepdf.com/reader/full/dividend-vs-growth 11/27
11
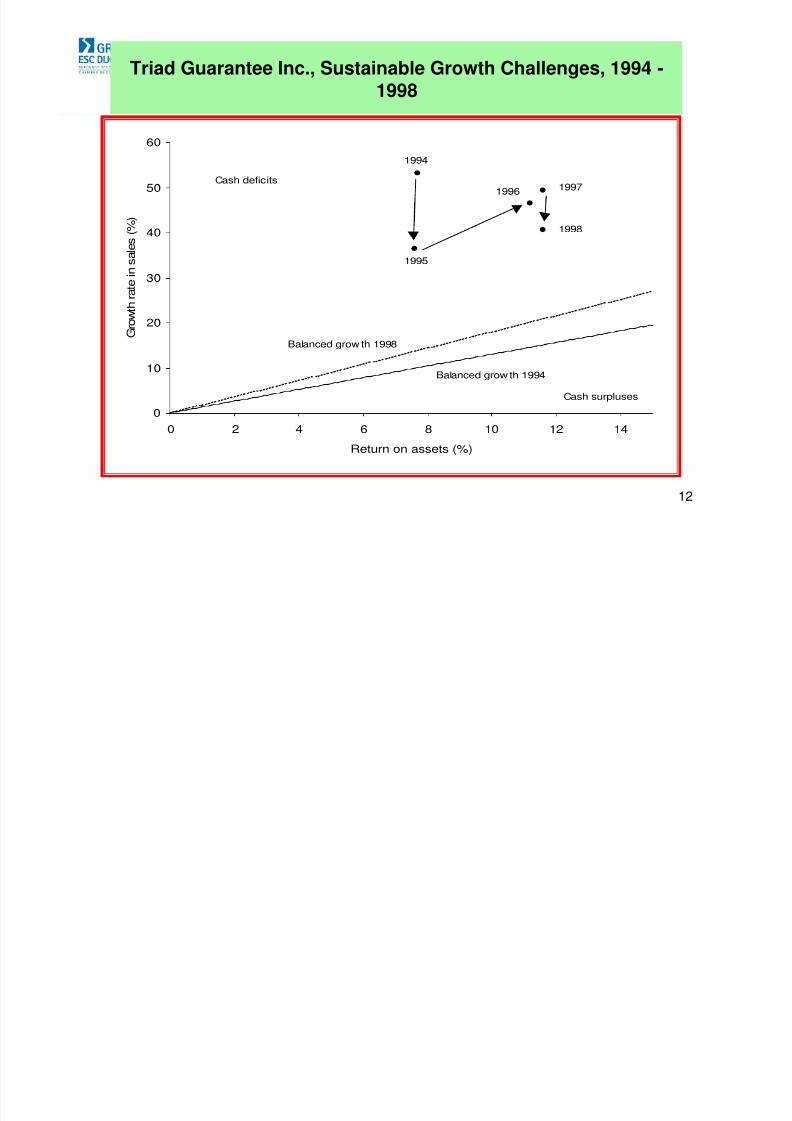
A Sustainable Growth Analysis of TriadGuarantee Inc., 1994 - 1998
1994 1995 1996 1997 1998
Required ratios:Profit margin, P 0,39 0,38 0,37 0,39 0,39Retention ratio, R 1,00 1,00 1,00 1,00 1,00Asset turnover, A (times) 0,20 0,21 0,27 0,32 0,31Financial leverage T^ (times) 1,30 1,41 1,40 1,52 1,84
Triad's sustainable growth rate, g* (%) 10,01 11,25 13,99 18,97 22,25
Triad's actual growth rate, g (%) 53,2 36,4 46,5 49,3 40,6
Asset
Turnover Both
0.4 Times Occur
Triad's sustainable growth rate in 1998 (%) 28,70 34,3
What If?
26,6
Financial
Leverage
2.2 Times
8/3/2019 Dividend vs Growth
http://slidepdf.com/reader/full/dividend-vs-growth 12/27
12
Triad Guarantee Inc., Sustainable Growth Challenges, 1994 -
1998
0
10
20
30
40
50
60
0 2 4 6 8 10 12 14
Return on assets (%)
G r o w t h r a
t e i n s a l e s ( % )
1994
1995
1996 1997
1998
Cash deficits
Cash surpluses
Balanced grow th 1994
Balanced grow th 1998

8/3/2019 Dividend vs Growth
http://slidepdf.com/reader/full/dividend-vs-growth 13/27
13
3. Financing Growth: TOO MUCHGROWTH
– Sell new Equity – Rarely used: – Not required, expensive, reduces EPS, market price undervalued,
uncertainty of issue success
– Increase Leverage – After a limit, increases cost of financing, risk
– Reduce Payout – Limited to zero dividends
– Profitable Pruning
– Sell Disconcentric Diversifications» Limits managment focus, Shareholders can achieve it by buying
shares» Reduces total growth and cash needs
– Sell slow-moving stock and debtors
– Sourcing – Releases assets, Increases Asset turnover – Retain unique or core competencies
– Price increase – Reduces demand and growth – Increases Profit margin and financing
– Mer ers
8/3/2019 Dividend vs Growth
http://slidepdf.com/reader/full/dividend-vs-growth 14/27
14
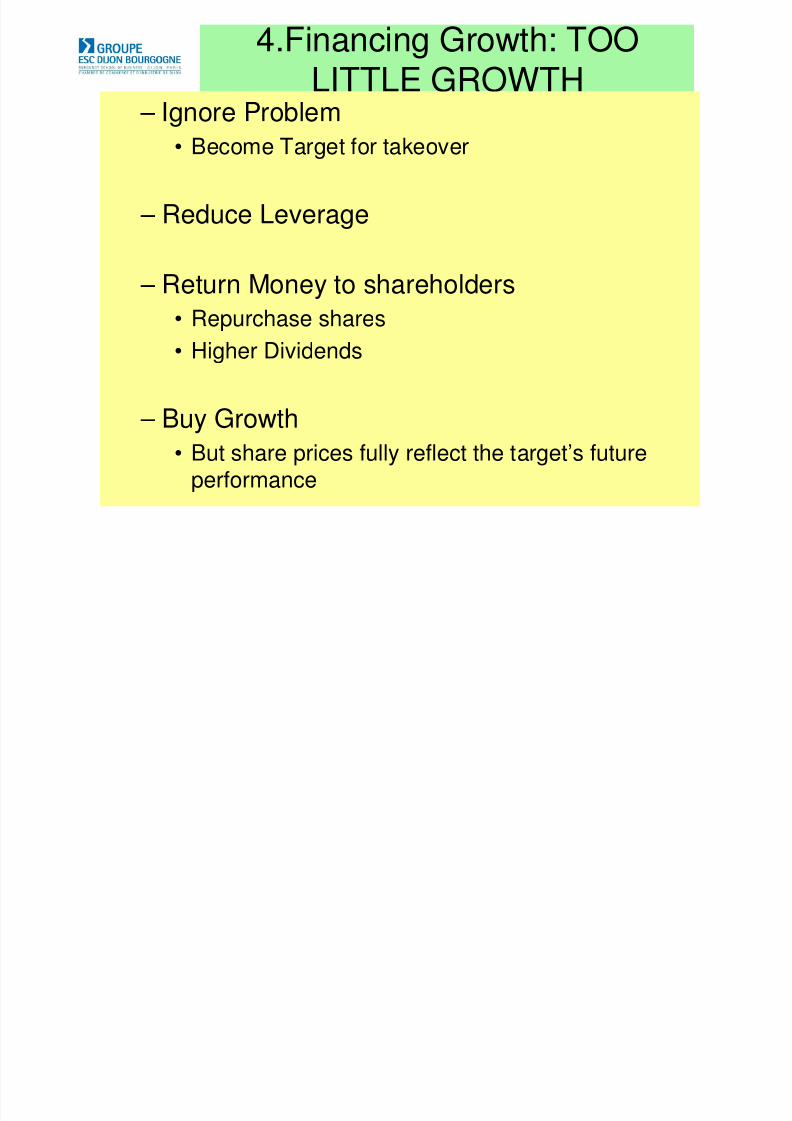
4.Financing Growth: TOOLITTLE GROWTH
– Ignore Problem• Become Target for takeover
– Reduce Leverage
– Return Money to shareholders• Repurchase shares• Higher Dividends
– Buy Growth• But share prices fully reflect the target’s future
performance

8/3/2019 Dividend vs Growth
http://slidepdf.com/reader/full/dividend-vs-growth 15/27
15
Financing Growth: Growth andInflation
• Both Real Growth and inflation create similarfinancing needs
• Working capital repsonds immediately• Fixed assets respond after a lag
• Inflation and growth signify compounded
problem
• Inflation reduces value of debt• Inflation reduces value of future repayments, and so market
value of debt.• This should result in increased capacity.
• But bankers still use historical costs and limit financing.

8/3/2019 Dividend vs Growth
http://slidepdf.com/reader/full/dividend-vs-growth 16/27
16
Sources of Capital to U.S. NonfinancialCorporations, 1965 - 1998
Internal
Retained profits 15.1%
Depreciation 50.5%
Subtotal 65.6%
ExternalIncreased liabilities 41.5%
New equity issues -7.1%
Subtotal 34.4%
Total 100.0%
Sources: Federal Reserve System, Flow of Funds Accounts, 1949-78, and Flow of Funds
Accounts, various issues. Available at http://www.bog.frb.fed.us/releases/z1/htm.

8/3/2019 Dividend vs Growth
http://slidepdf.com/reader/full/dividend-vs-growth 17/27
17
Net New Equity Issues, 1965 - 1998
-300
-250
-200
-150
-100
-50
0
50
100
Year 1969 1974 1979 1984 1989 1994
D o l l a r s i n b i l l i o n s
U.S.
Japan
Germany
U.K.
Sources: Federal Reserve System, Flow of Funds Accounts, 1949-78 and various issues;
OECD, Financial Statistics, Part 2, Financial Accounts of OECD Countries, various issues.

8/3/2019 Dividend vs Growth
http://slidepdf.com/reader/full/dividend-vs-growth 18/27
18
Gross New Equity Issues and Initial Public Offerings, 1970 -1998
0
20
40
60
80
100
120
140
1970 1975 1980 1985 1990 1995 2000
D o l l a
r s i n b i l l i o n s
Gross new equity
IPOs
Continued

8/3/2019 Dividend vs Growth
http://slidepdf.com/reader/full/dividend-vs-growth 19/27
19
The Timberland Company, Sustainable GrowthCalculations, 1995 - 1998
1995 1996 1997 1998
Required ratios:Profit margin, P (%) (1,8) 3,0 5,9 6,9 Retention ratio, R (%) 100 100 100 100 Asset turnover, A (times) 1,6 1,5 1,9 1,8 Financial leverage, T^ (times) 2,8 3,2 2,5 2,2
Timberland's sustainable growth rate, g* (%) (7,8) 14,3 28,6 27,5
Timberland's actual growth rate, g (%) 2,8 5,3 15,4 8,2

8/3/2019 Dividend vs Growth
http://slidepdf.com/reader/full/dividend-vs-growth 20/27
20
Timberland Company’s Sustainable Growth Problems, 1995 -1998
(10)
(5)
-
5
10
15
20
25
30
35
40
-3 -2 -1 0 1 2 3 4 5 6 7 8 9 10 11 12 13
Return on assets (%)
G r o w t h r a t e i n s a l e s ( % )
Balanced Grow th 1995
Balanced Grow th 1998
1995
1996
1997
1998
Cash deficits
Cash surpluses

8/3/2019 Dividend vs Growth
http://slidepdf.com/reader/full/dividend-vs-growth 21/27
21
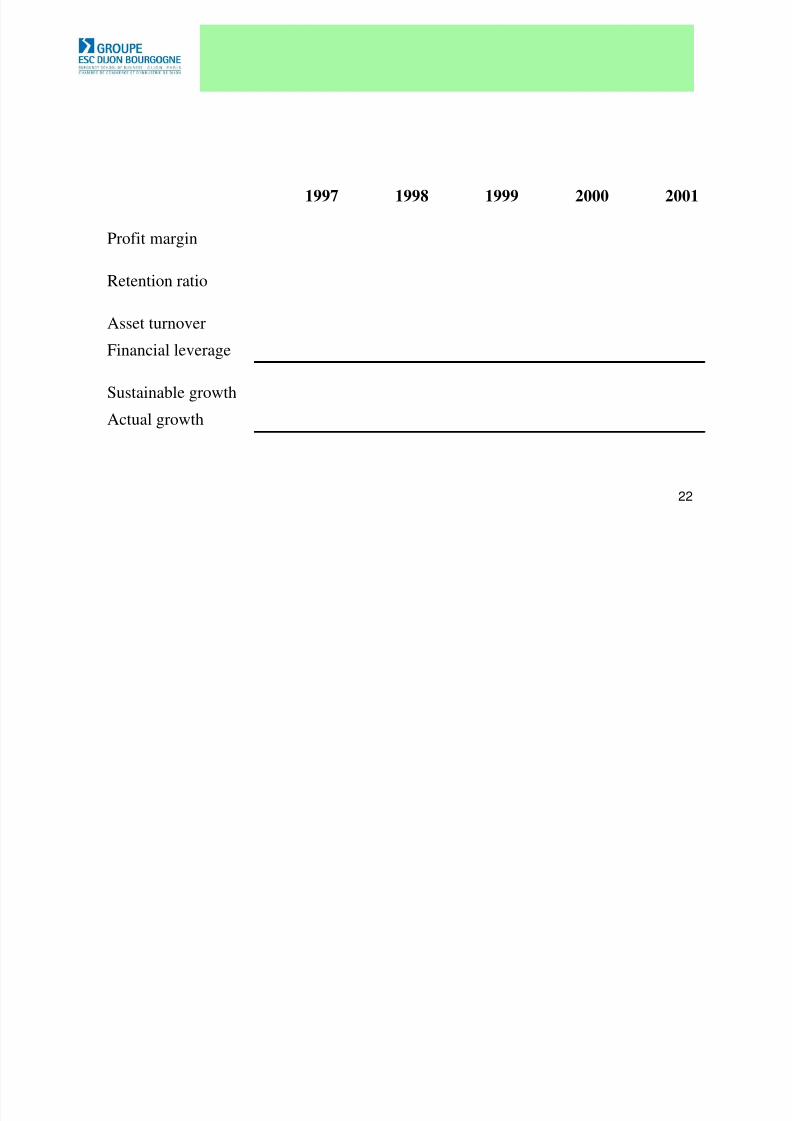
Calculate for the years 1997-2001
Profit MarginRetention ratioAsset turnoverFinancial Leverage (Hint: Use opening equity)Sustainable Growth rateActual growth rate
32100Dividends
220210190180170145Equity
450320275270220Total assets1220171120Net income
450410340290240190Sales
200120001999199819971996Friedmans Inc. ($ in millions)
8/3/2019 Dividend vs Growth
http://slidepdf.com/reader/full/dividend-vs-growth 22/27
22
Actual growthSustainable growth
Financial leverage
Asset turnover
Retention ratio
Profit margin
20012000199919981997
8/3/2019 Dividend vs Growth
http://slidepdf.com/reader/full/dividend-vs-growth 23/27
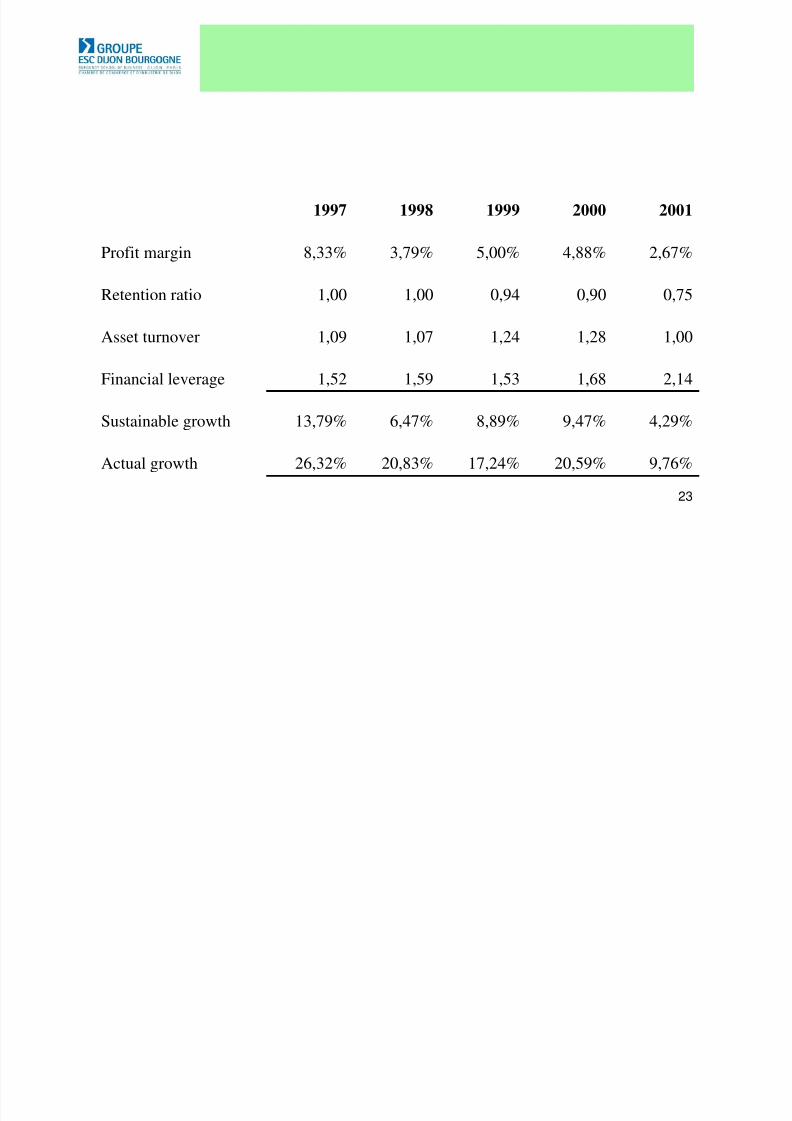
23
9,76%20,59%17,24%20,83%26,32%Actual growth
4,29%9,47%8,89%6,47%13,79%Sustainable growth
2,141,681,531,591,52Financial leverage
1,001,281,241,071,09Asset turnover
0,750,900,941,001,00Retention ratio
2,67%4,88%5,00%3,79%8,33%Profit margin
20012000199919981997
8/3/2019 Dividend vs Growth
http://slidepdf.com/reader/full/dividend-vs-growth 24/27
24
Questions?
Q. Do you think Friedmans Inc. is having a
problem financing its growth?
Q. Is the increase in dividends a good ideafor Friedmans?
8/3/2019 Dividend vs Growth
http://slidepdf.com/reader/full/dividend-vs-growth 25/27
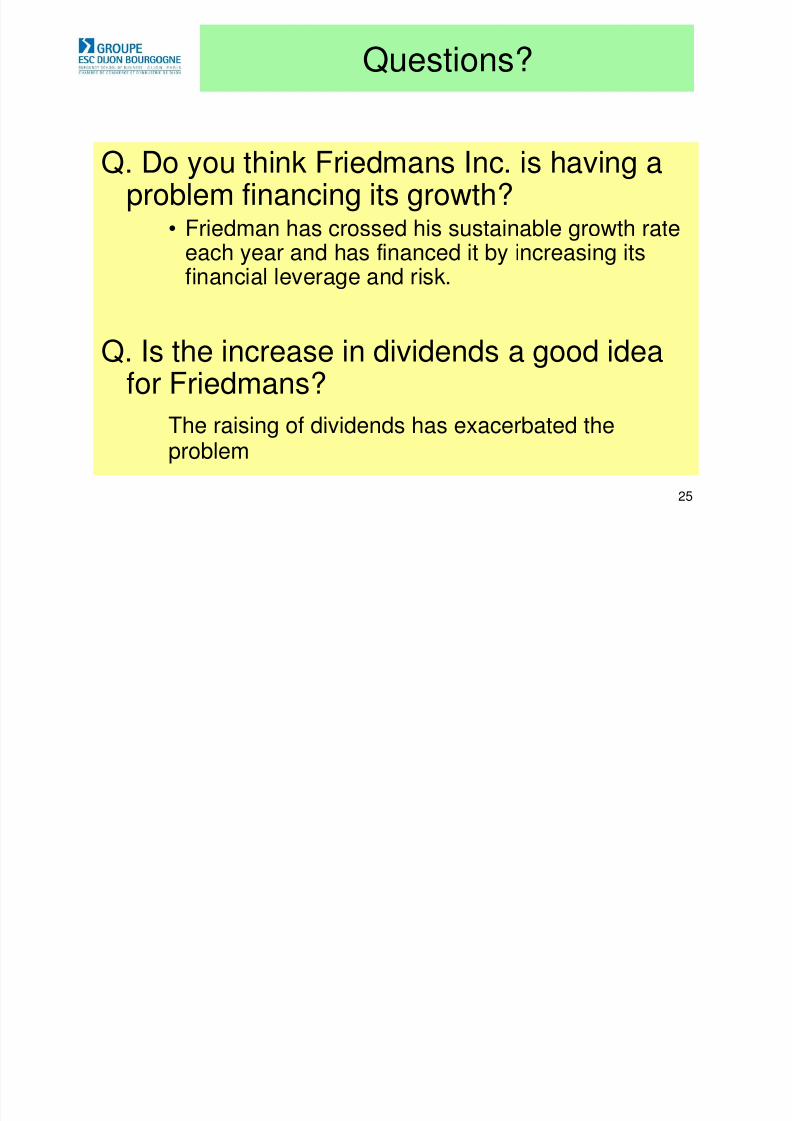
25
Questions?
Q. Do you think Friedmans Inc. is having a
problem financing its growth?• Friedman has crossed his sustainable growth rateeach year and has financed it by increasing itsfinancial leverage and risk.
Q. Is the increase in dividends a good idea
for Friedmans?The raising of dividends has exacerbated theproblem
8/3/2019 Dividend vs Growth
http://slidepdf.com/reader/full/dividend-vs-growth 26/27
26
Setting Dividend Policy
Firms should ask the following questionswhen establishing dividend policy:
– What are our investment opportunities?
– What kind of business risk do we face?
– Who are our stockholders?
– What is our liquidity position?
– Is legal listing important to us?
– Is control an issue?

8/3/2019 Dividend vs Growth
http://slidepdf.com/reader/full/dividend-vs-growth 27/27
27
Readings
• Campbell, Andrew & Park, Robert: »Stop kissingfrogs » in HBR,July-Aug 2004
– Recommend patience – Careful assessment of growth opportunities – Giving back cash otherwise